 Jessie Louisor
 Olivier Brivois1
 Aurelie Maspataud
- 1Risks and Prevention Department, Bureau de Recherches Géologiques et Minières (BRGM), Orléans, France
- 2Conservatoire du Littoral, Corderie Royale, Rochefort, France
- 3BRGM, Parc technologique Europarc, Pessac, France
In a Climate Change (CC) context, low-lying areas like marshes are more vulnerable to Sea Level Rise (SLR) or extreme climate events leading to coastal flooding. The main objective of this study is to help local stakeholders determine the best coastal management strategy for the Moëze marsh (France) that can contribute to adapt to SLR in this zone. To do so, we used the MARS hydrodynamic model to simulate coastal overflowing in the zone for different scenarios. We first calibrated the model based on data from the Xynthia storm which occurred on February 28th 2010. Our focus is on modeling the high astronomical tide-induced flooding, taking into account regional SLR projections by 2030 and 2050 under the pessimistic RCP 8.5 CC scenario. Several Coastal management configurations proposed by local decision-makers, as well as different land-use projections were considered. The results highlight that the implementation of closed defenses around human and economic stakes do not lead to significant reductions in flooding (surface extent and maximum water height) compared to the case where the sea-dikes are no longer maintained and the coastline is unconstrained. This can be explained by the fact that these stake zones were historically built on higher points of the marsh. We have also shown that land-use changes have an influence on flooding in the Moëze marsh, especially an increase greater than 0.25 m in the maximum simulated height when considering a new land-use by 2030. The increase is less pronounced (under 0.25 m) when considering a new land-use by 2050. These results do not take into account the possible future evolution of the topography due, for example, to the presence of new habitats that would trap the sediments.
Introduction
It is well known that extreme events such as storms or tropical cyclones can lead to coastal flooding (Haigh et al., 2016; IPCC, 2021). One of the most well known storms in France, having led to the last permanent actions of the state services, is storm Xynthia (French Ministry of Environment, 2017). This storm occurred the 27-28th February 2010 and affected the entire Vendée and Charente-Maritime on the Atlantic coast of mainland France, and also impacted other countries in Europe (Belgium, Swiss, Spain, Portugal, Germany, Luxembourg). The flooding led to dramatic consequences, 59 human casualties over Europe (Vu et al., 2019). The combination of high spring tide and low pressure (977 hPa) led to an important storm surge along the coast of the Bay of Biscay for example (Vu et al., 2019). The La Rochelle-La Pallice tide gauge recorded the largest storm surge (1.53 m) ever recorded in France in the last 150 years (Pineau-Guillou et al., 2012). In addition, according to Bulteau et al. (2015), storm Xynthia had a ~200-year return period.
Moreover, many studies have highlighted that Sea Level Rise (SLR), could significantly alter coastal flooding in the future (Hallegatte et al., 2013; Arns et al., 2015; Haigh et al., 2016; Idier et al., 2020; Rocha et al., 2020). As sea level is rising, it becomes possible that in low-lying areas, flooding occurs for high spring tides, without any stormy conditions leading to storm surges or wave setup (Ezer and Atkinson, 2014; Moftakhari et al., 2015; Ray and Foster, 2016). Kirezci et al. (2020) assessed that by 2100, at global scale, 63% of the coastal area flooded will be caused by tide and storm surges, 5% by wave setup and 32% due to projected regional SLR. Indeed, as SLR is not uniform at spatial scale, regionalized SLR projections are needed (Kopp et al., 2014; Melo et al., 2020). As a comparison, considering the pessimistic Representative Concentration Pathways RCP 8.5 by 2100, the SLR likely-range is assessed to [0.61–1.10 m] at global scale (IPCC, 2019), whereas these values could potentially be doubled along the France coastline for a high-end scenario (Thiéblemont et al., 2019).
In addition, it is interesting to note that according to Vousdoukas et al. (2016), projected storm surge level changes along the Bay of Biscay show a small decrease, under the RCP 8.5 scenario by 2040 and 2100. The same trend is observed when considering not only storm surges, but the Extreme Sea Level (ESL) composed by Mean Sea Level + Tide + Waves + Storm Surges (Imani et al., 2021).
With storms and SLR, flooding may become chronic, and could change former inland habitats to new ecosystems. Indeed, coastal flooding may cause direct or indirect changes to habitats established in the marshes, over the short and the long term. For example, Yu Mo et al. (2020) have shown that in some conditions, long-term nutrient enrichment (by seawater penetration) may impair the resilience of marshes. Martinez et al. (2014) also showed that the combination of SLR and human coastal infrastructures might cause a coastal squeeze that exposes the ecosystems and species to local extinction. More generally, the vulnerability of coastal ecosystems to SLR depends on their ability to adapt through enhanced sediment trapping to grow upward with SLR (Timmerman et al., 2021).
At local scales, decision-makers have to deal with the legislation, their knowledge of the field and studies conducted by researchers or design offices in order to adapt or to become more resilient to SLR and extreme events leading to coastal flooding. The options proposed are mainly sea-front dikes (Rosenzweig et al., 2011; Ezer and Atkinson, 2014), or nature-based actions such as dune revegetation or habitat restoration (Fernández-Montblanc et al., 2020; Grothues and Able, 2020), and dike retreat (Bongarts Lebbe et al., 2021). In order to help local stakeholders in their strategy to protect human activities and improve the resilience, an adaptive coastal management project named Adapto has been initiated by the Conservatoire du Littoral (coastal conservatory), hereinafter CDL. Note that one of the main missions of this public institution is to purchase coastal threatened or degraded lands, in order to restore and develop the ecosystems. The Adapto project is supported by the European Union through the LIFE program and explores solutions in order to reduce the impacts of climate change on the coasts. Thus, 10 pilot sites with various coastal issues are studied in mainland France, Corsica and French Guiana (See Supplementary Material for more information). The implementation of these solutions is at different phases depending on the sites. For example, study sites such as Ile Nouvelle and the Mortagne-sur-Gironde polders (Gironde estuary, France), which have both been depoldered since 1999 and 2010 respectively, provide feedback and lessons that can be transferred to other sites. For other sites, a multidisciplinary support is proposed in order to develop a strategy taking into account the identified issues. The originality of this approach is that it cross-references key findings of studies on coastal flood risk, biodiversity, economic activities and social perception in order to identify their impact on local issues and help decision-makers to define an integrated coastal management strategy. For this reason, many stakeholders are involved in the project, such as oyster farmers, local decision-makers, coastal engineers, landscape designers, biologists, etc. In this paper, we focus on the Moëze Brouage marsh, hereinafter Moëze marsh. In this region, local stakeholder expectations are high because this area was impacted by extreme storms in the past, e.g storm Xynthia, (Breilh et al., 2013; Bertin et al., 2014; Breilh et al., 2014b), and the marsh is affected by chronic flooding due to high spring tides. The protection against coastal flooding has been breached, and according to the local stakeholders, its maintenance is becoming more and more difficult. The main focus is whether to rebuild and maintain the existing dikes, add new defenses, or adopt an ecosystem-based process and let the marsh reconnect to the sea. In order to try to determine the best strategy for coastal management in this area, we used flood modeling under regional SLR projections by 2030 and 2050, taking into account several coastline management scenarios.
In this paper, we first describe the site studied, the data used and the methods applied in Section 2. In section 3, we present our results considering SLR and land-use projections by 2030 and 2050. Finally, we conclude and give some perspectives to our work in the last section.
Study Site, and Data Used
The Moëze Marsh
The Moëze marsh is located in Charente-Maritime (France), facing the Marennes-Oléron Bay (Figure 1A). The area is a tidal dominant area connected to the Atlantic Ocean (Chaumillon et al., 2003). This macrotidal zone is affected by semi-diurnal tides with a theoretical range between -3.3 m for the lowest astronomical tide (LAT) and 3.37 m for the highest astronomical tide (HAT) at the La Rochelle-La Pallice reference tide gauge (Shom, 2017). Note that in this paper, all data are presented in NGF/IGN69, the official French leveling reference.
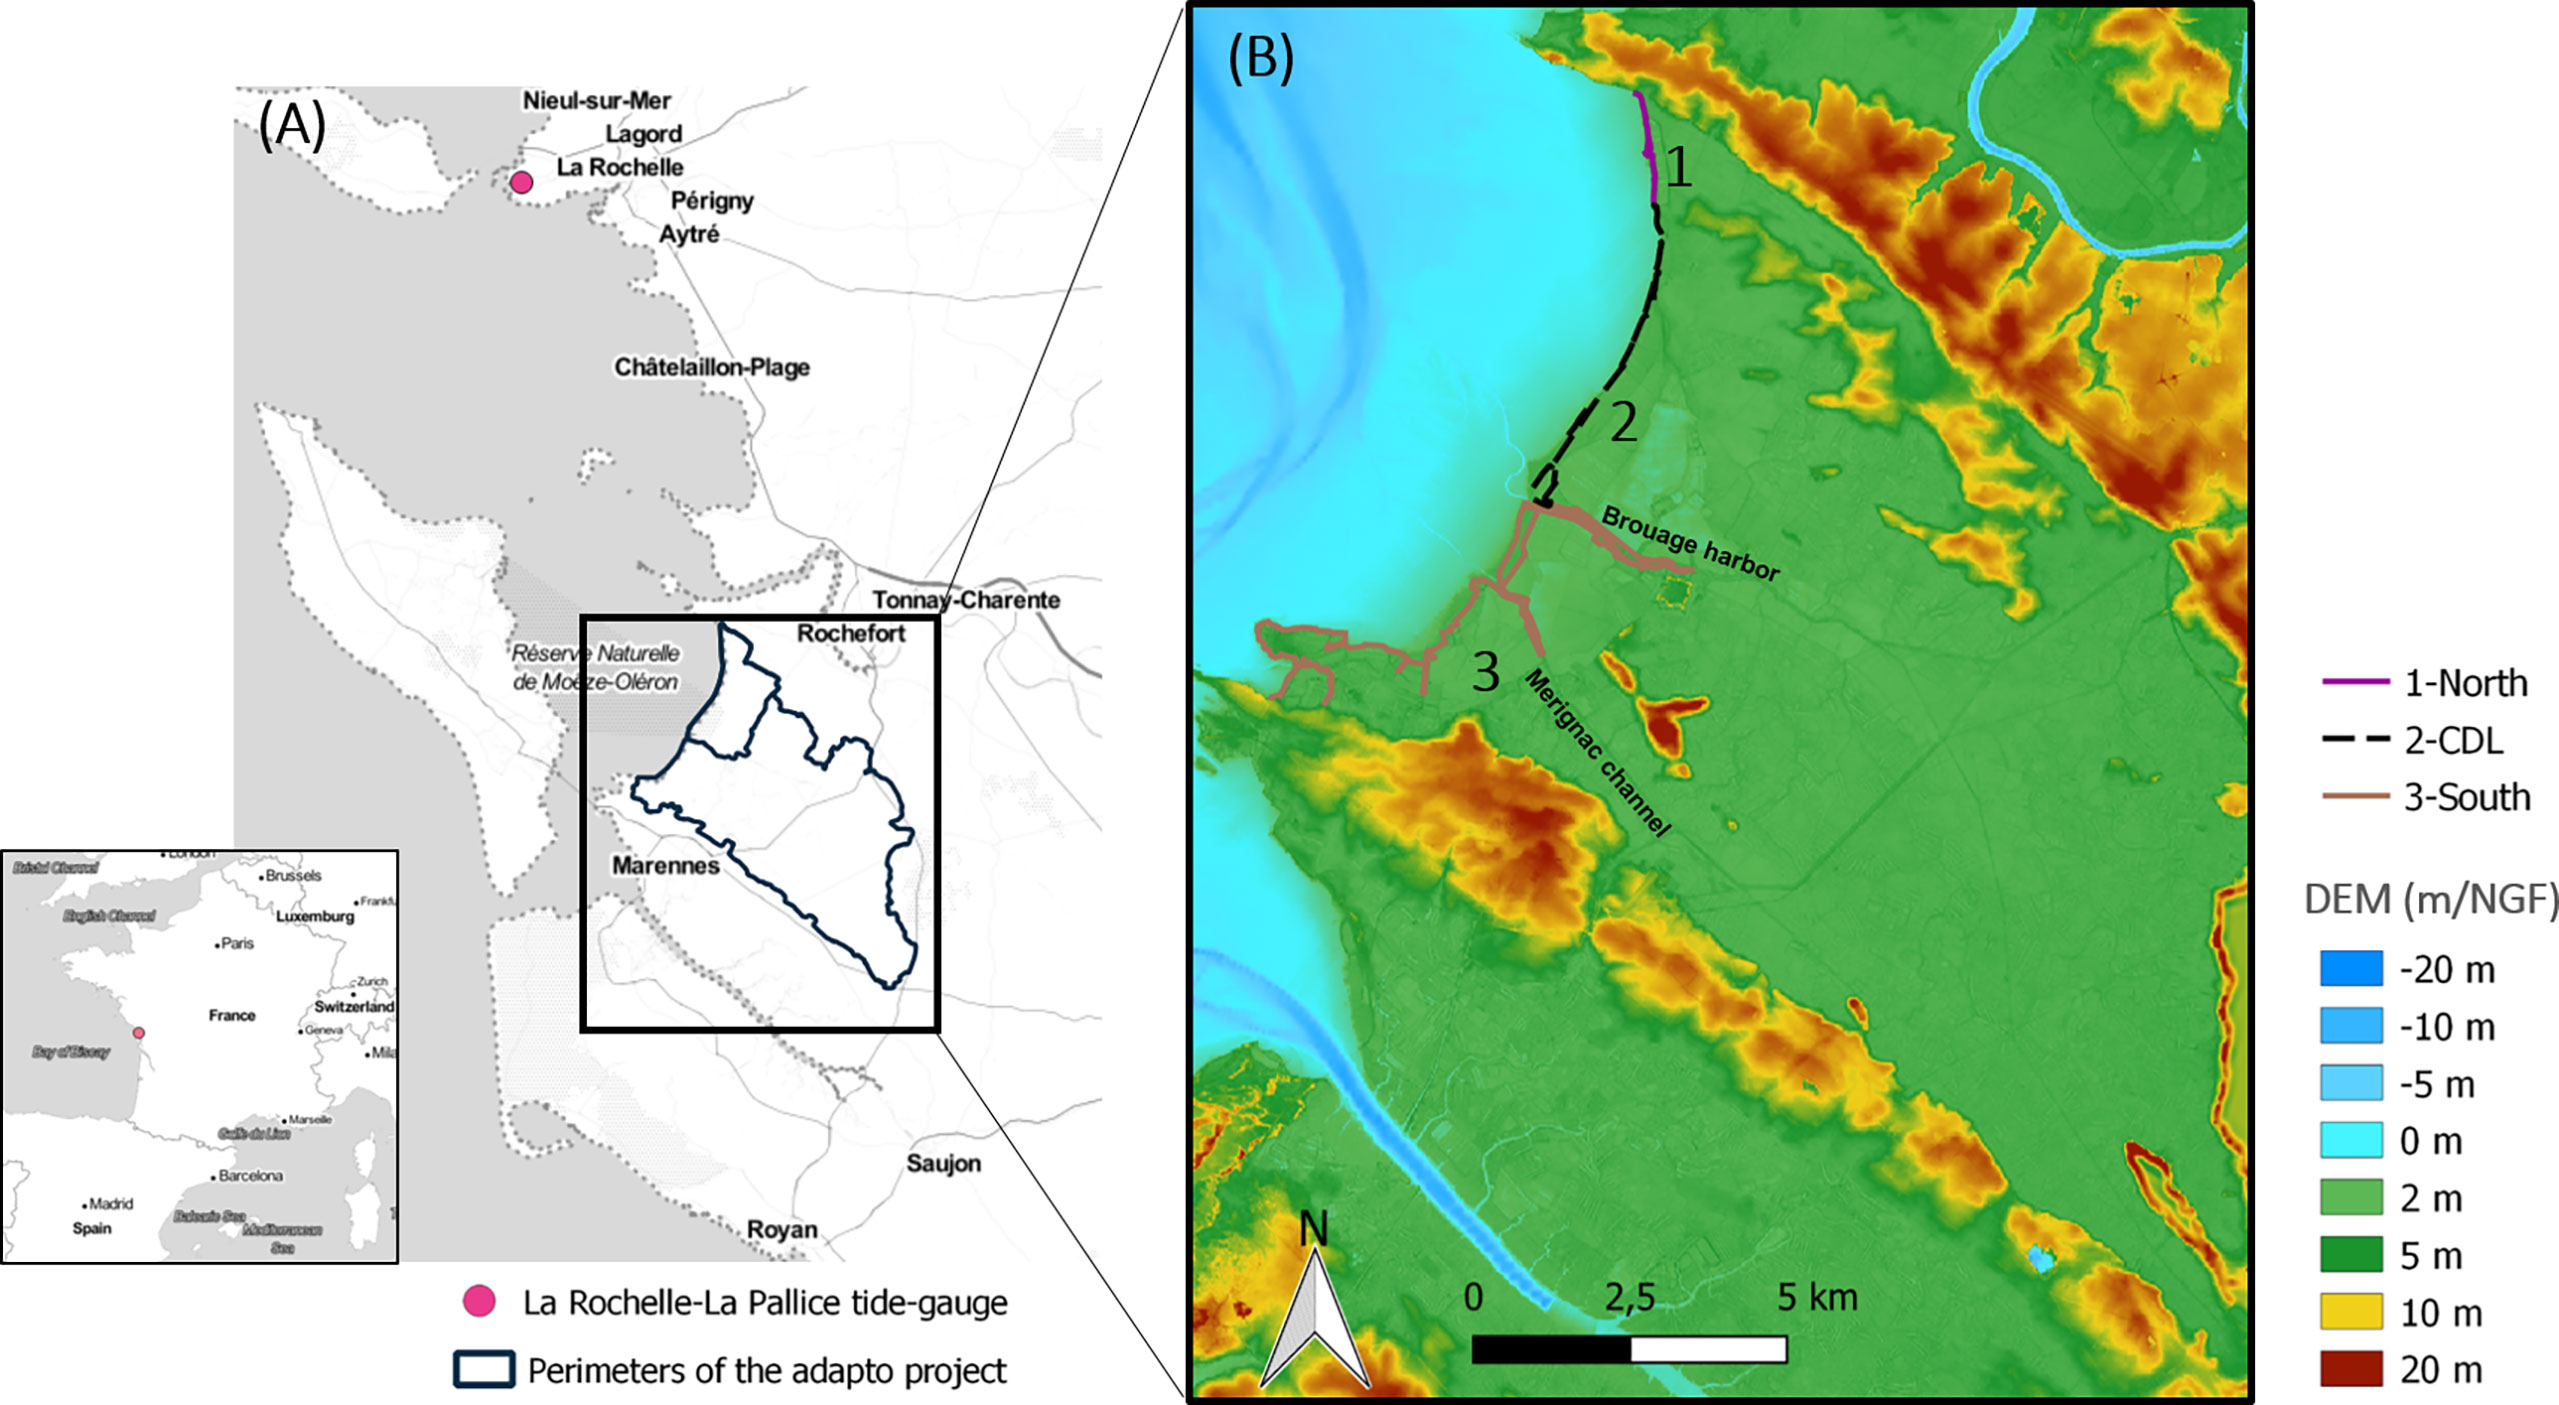
Figure 1 2(A) Study site location. The black perimeter represents the immediate study area and the extended study area in the Adapto project; (B) Topo-bathymetric data used with a 20 m × 20 m resolution. The coastal defenses are represented in purple (1), black (2), and brown (3).
The Moëze marsh is also a low-lying area polderized over the centuries (Bento and Blanc, 2017), and exposed to extreme events leading to large coastal flooding events. Severe storms like Martin (December 27th 1999) and Xynthia (February 27-28th 2010) in the last decade, have impacted the whole area. Several coastal defenses have been raised since the 1970s against the assaults of flooding. Indeed, the site presents a coastal protection composed by three embankment dikes belonging to different property owners (Figure 1B). The central dike (2-CDL on Figure 1B) is a patchwork of heterogeneous materials, sometimes set against the dune, (Bento and Blanc, 2017). This coastal protection presents breaches in several points due to successive storms (DDTM-17, 2011).
Forcing Conditions
In our study, several tidal conditions are taken into account: high spring tide close to HAT, and stormy conditions leading to high water levels. Under stormy conditions, the water level that includes the storm surge, is derived from the nearest reference tide gauge, located at La Rochelle - La Pallice (Figure 1A), and applied to the model as a boundary condition. In the present case, we used the time series from 02/26/10 22:00 UTC to 03/01/10 08:00 UTC during storm Xynthia, with a 10-minute temporal resolution. Other tide gauges exist close to the Moëze marsh but their measurements were not available (not yet in operation or experienced power failures) for the storm tested. Note that most of the tide gauges in the zone belong to the RONIM network operated by the Shom. Moreover, in the rest of the study, we also used the tidal signal coming from the La Rochelle – La Pallice tide gauge because: i) it is the reference tide gauge, with the longest time series in the zone; ii) the regional SLR projections used in the next sections have been computed with the sea levels coming from this tide gauge.
In a prospective approach, we looked at high spring tide, especially in conditions close to the HAT that is 3.37 m at La Rochelle - La Pallice. The analysis of tidal predictions provided by the Shom over the period 1996-2015 shows that conditions close to the HAT occur about twice a year (see Supplementary Material). Table 1 summarizes the different offshore conditions used as boundary conditions in the paper. We also analyzed the time series of the Ile d’Aix tide gauge closer to our zone of interest. A comparison between the tide predictions at La Rochelle– La Pallice and Ile d’Aix between 2012 and 2016 shows a good agreement between the 2 tide gauges (see Supplementary Material). However, the storm surges are greater at La Rochelle than at Ile d’Aix when exceeding 1 m (this point cannot be verified for Xynthia because there is a lack of data at Ile d’Aix).
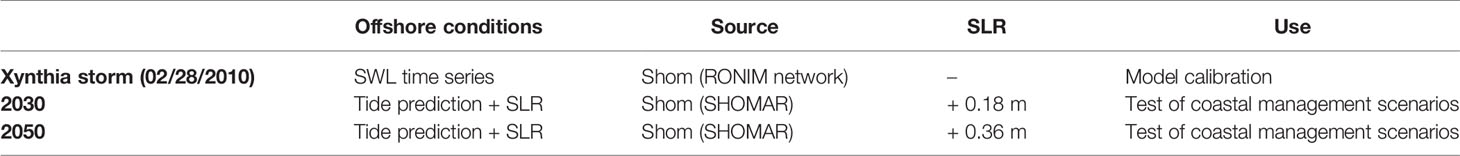
Table 1 Summary of offshore conditions presented in the paper.
Topo-Bathymetric Data, DEM Building and Surface Roughness
In order to build a Digital Elevation Model (DEM) representing the nearshore domain, the land areas and the sea-land continuum without any discontinuities, we gathered several topo-bathymetry datasets. This led to the building of a so-called composite DEM.
The bathymetric data are derived from the HOMONIM dataset, provided by the French Hydrographic Office (Shom, 2015). This full DEM extends over a large area (not shown here) from the coast to about 60 m depth with a 0.0002° (~ 22 m at this latitude) resolution. The topographic data used, including the intertidal zone, come from both RGE ALTI® 1 m and RGE ALTI® 5 m products made available by IGN. Note that the RGE ALTI® product is initially composed of data issued from the BD ALTI® at 25 m, resampled at 1 m (or 5 m depending on the product), and is updated with more accurate data when they are available. Once the different datasets were homogenized, and set to the same vertical reference, we performed an interpolation in order to fill gaps and get a continuous and regular surface. We used a spline function adapted to topo-bathymetric data, as suggested by Amante and Eakins (2016). We performed visual controls in order to ensure consistency and gradual topographic/bathymetric transitioning along limits of the datasets composing the DEM (slope, cross-section and 3D views). This highlighted the presence of local artifacts (vertical discontinuities of tens of centimeters in the intertidal zone), corrected by interpolation (see Supplementary Material). The final DEM covers the entire marsh, and nearshore domain with a 20 m×20 m resolution (Figure 1B). Since the original datasets used have broadly a 20 m resolution, we decided to keep this resolution as it combines a reasonable computational time and resources model, with an accurate DEM on coastal defenses (i.e using the features of the high-resolution RGE ALTI® for the coastal defenses). Indeed, we performed some treatment on the DEM, in order to take accurately into account infrastructures, such as road dikes, or to erase them depending on the scenario considered (see Supplementary Material).
To ensure that flows are properly represented, it is necessary to consider the land-use in the hydrodynamic model. Indeed, the impact of land-use on flows is usually represented using a bottom-friction parameter characterizing the roughness of each type of soil (concrete, grass, sand, etc.). The surface roughness is usually parameterized in terms of Manning or Strickler coefficients, as presented in Table 2. A spatialized representation of roughness can be obtained from a synthetic land cover classification. As a first approximation, we used the Corine Land Cover (European Environment Agency, 2012) database. This classification was then interpreted in terms of Strickler coefficient values as exposed in Papaioannou et al. (2018). Table 2 gives a simplified classification, adapted from Papaioannou et al. (2018), based on Corinne land cover data and Strickler coefficients associated. The values taken for the Strickler coefficients in the different simulations vary from 10 m1/3s-1 in high friction areas (small and non-dense urbanized areas) to 50 m1/3s-1 for low friction areas (water area). The values used are those recommended by different sources and are applicable for studies in coastal domains (Brown et al., 2007; Bunya et al., 2010; Papaioannou et al., 2018).
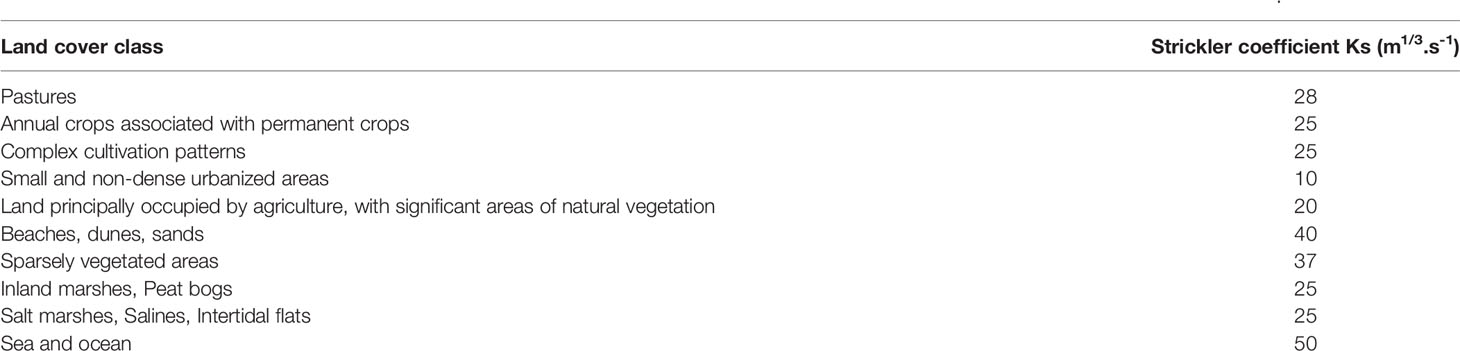
Table 2 Simplified classification based on Corinne land cover data and Strickler coefficients associated. Adapted from Papaioannou et al. (2018).
Finally, we checked if the land cover and roughness coefficient associated was consistent with recent orthophographs (taken after February 2010) and with the BD TOPO® Hydrographie product (providing the hydrographic network), made available by IGN. This qualitative step highlighted a good agreement between the information provided by the land use and hydrographic databases and the recent orthophotographs. Table 3 gives a summary of topo-bathymetric and land-use products used in this study.
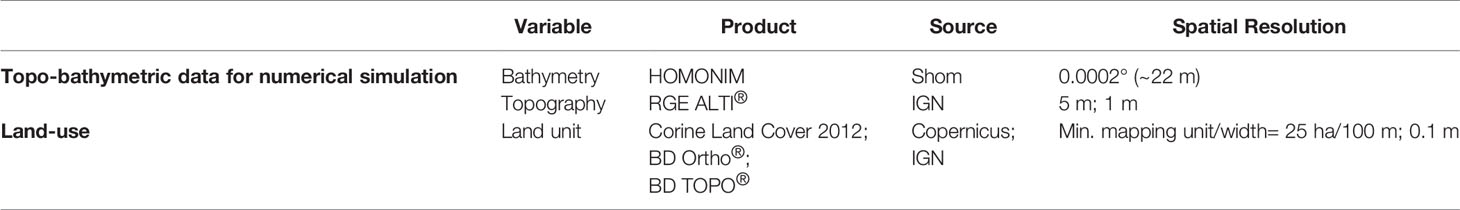
Table 3 Summary of topo-bathymetric and land-use datasets used in the study.
Methods
Modeling Method
In this study, we used the hydrodynamic model MARS (Model for Applications at Regional Scale) developed by IFREMER (Lazure and Dumas, 2008). This model is particularly well suited to simulating flows in coastal regions, from the regional scale to the estuary (Bruneau et al., 2014; Nicolae-Lerma et al., 2018; Lemoine and Le Hir, 2021). The MARS code is a free-surface hydrodynamic model, solving the classical equations of fluid mechanics (Navier-Stokes equations) under the Boussinesq approximation, the quasi-hydrostatic approximation as well as the dispersion-diffusion equation of a transported element, in the horizontal plane. The momentum conservation and mass conservation of the system are described by the shallow-water equations. These equations are solved by a finite difference method. In its MARS-FLOOD version, the code can take into account the dike breaches and rupture of structures, treatment of singularities such as culverts, weirs, and other incoming flows from rivers. The model also manages part-time dry areas (tidal flats, flood-plains). It allows the spatialization of bottom-friction (see section 2.3) and effects of meteorological phenomena. Here, the model covers the whole Moëze marsh and includes a single structured computational grid with a spatial resolution of 20 m × 20 m over the domain (1419 × 1213 elements).
Figure 2 summarizes the modeling method. The first step of our model set up has consisted in a calibration/validation. To do so, we have tried to reproduce the flooding extension of storm Xynthia over the marsh, by forcing the MARS-FLOOD model with a Still Water Level (SWL) time series (Figure 2A).
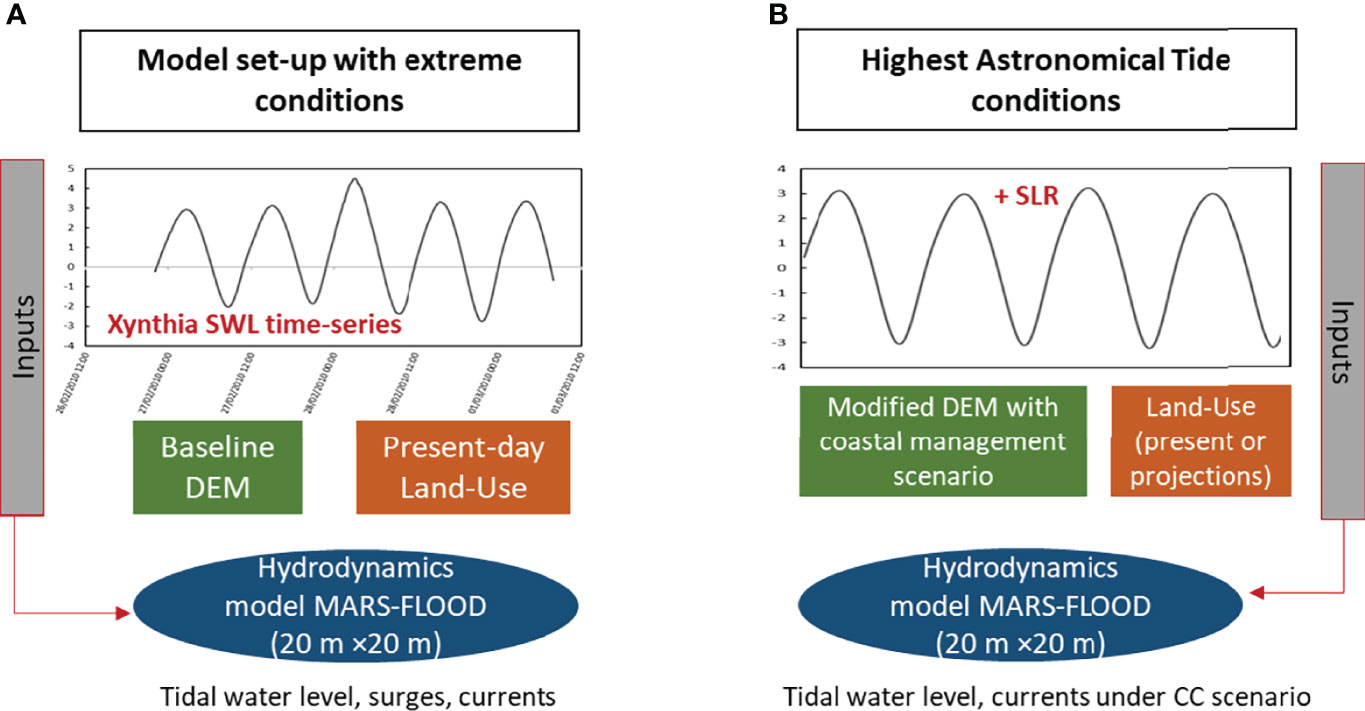
Figure 2 Model set-up: (A) under stormy conditions, using storm Xynthia Still Water Level time series and the baseline DEM; (B) for highest astronomical tide conditions, using the modified DEM.
Figure 3 shows the flooded area observed a few days following the storm Xynthia (delimited by the black line) and the maximum heights (colors) obtained by simulating the event from 26th February to 1st March 2010. The observed extension has been derived from aerial pictures a few days after the storm, and provided by DDTM 17 (local state services). Based on a criterion of elevation, we identify some additional elements that would have an influence on the hydraulic behavior of the flood. Namely, the main rivers and the channels, the second row dikes, and other embankments that constrain the flow. A sensitivity test phase allowed the implementation of the DEM taking into account structural elements such as dikes, embankments, roads (see Supplementary Material). It also permits testing the influence of the formation of breaches in the sea-dikes. The sensitivity test phase has highlighted a flooded area of 30.09 km² against 28.75 km² observed (i.e. a relative error of 4.7%) for the best configuration. In comparison, Breilh (2014a) found a flooded area of 41.16 km² applying a static GIS-based approach. Bertin et al. (2014) also showed an overestimation of the flooded area of this marsh after the implementation of a hydrodynamic modeling chain built with unstructured nested grids. The difference between the observed and simulated areas can be explained by the fact that the DEM used refers to post-Xynthia data (possible backfilling of some areas after the storm), or by the fact that some hydraulic connections and the rain that are not integrated in the model have obviously played a role on the flooding. Many uncertainties remain: the breach dynamics, the rainfall infiltration, the exact elevation of dikes in 2010, the lack of measurements or quantitative information regarding the water heights observed during the flooding. Furthermore, the modeled flooded area, very close to the observation without breaches integration in the dikes (not shown), tends to confirm that it would rather be a flood by overflow. Breilh et al. (2013), also suggest this.
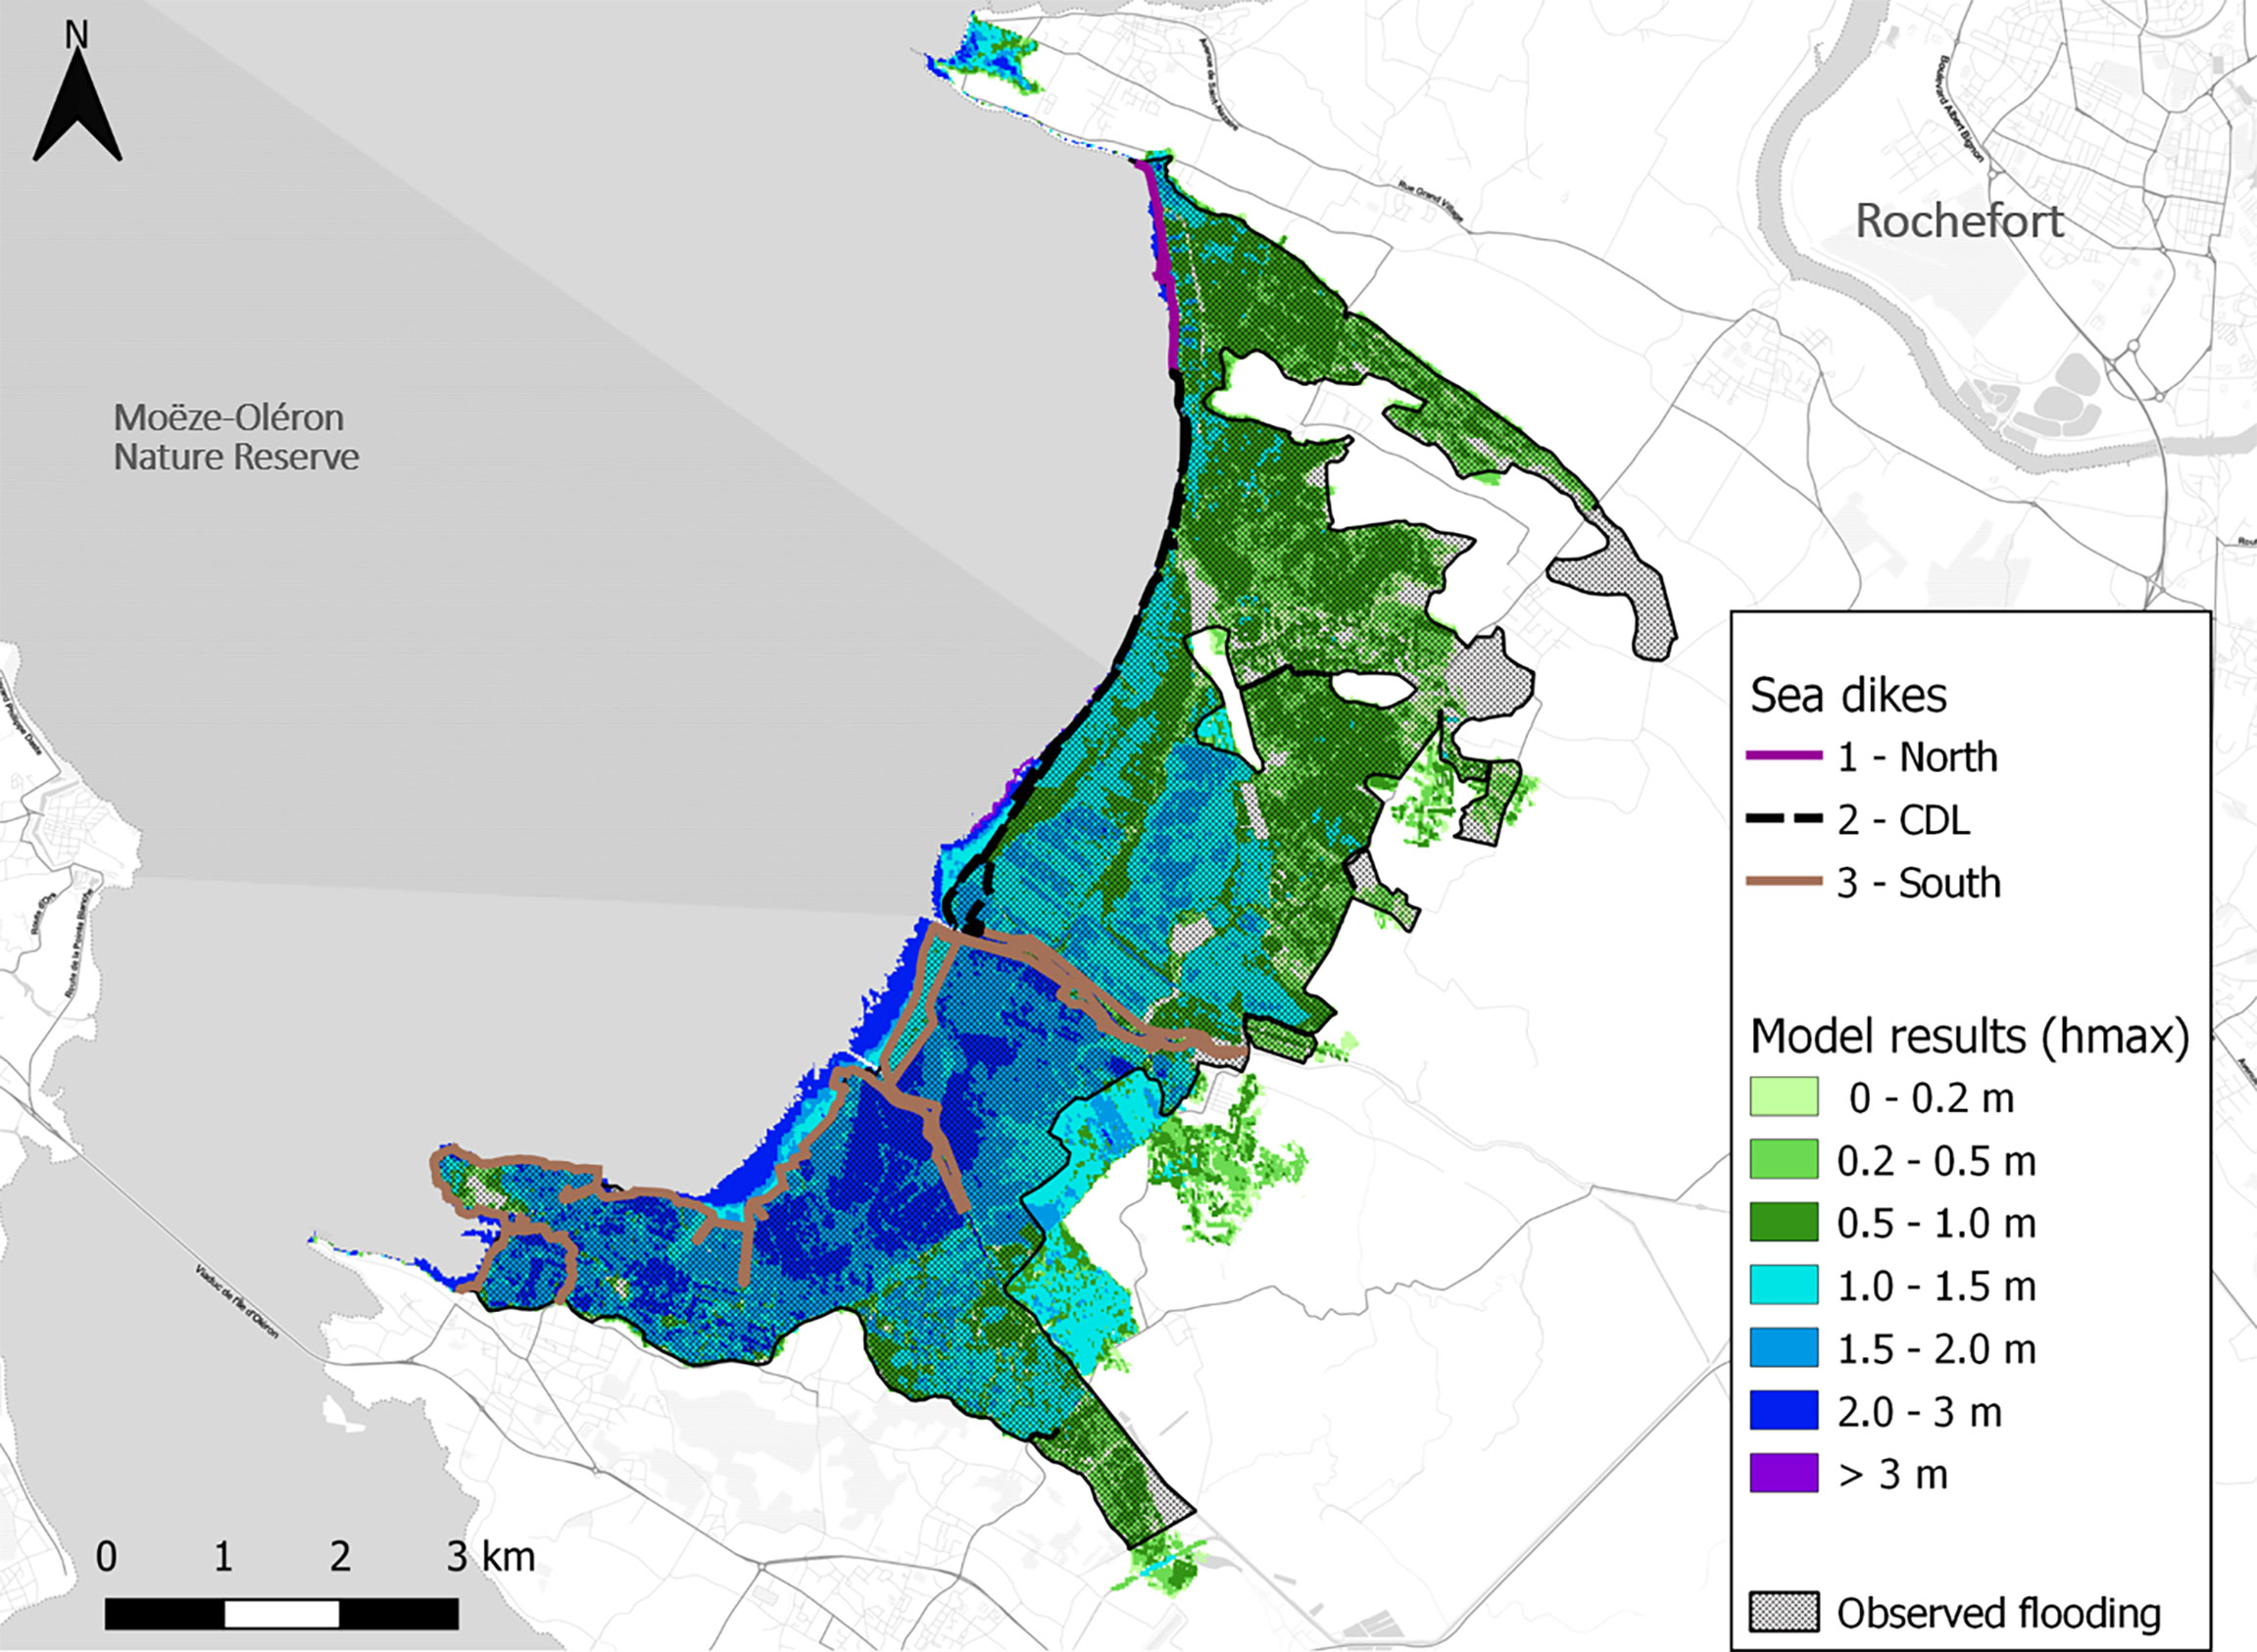
Figure 3 Flooding extension area observed during storm Xynthia (2010) delimited in black and maximum heights simulated for storm Xynthia conditions.
Breilh et al. (2014b) also showed that several past storms in this region had a significant wave setup, i.e wave-induced increase of the mean water level due to breaking waves. As an example, a storm in 1924 had generated a setup estimated at 0.5 m in our area of interest. Breilh et al. (2014b) identified three types of storm conditions that can lead to marine submersion in the central Bay of Biscay: moderate storm surge and extreme tidal range; moderate tidal range and large storm surge, (confirmed by Dodet et al., 2019); extreme waves which induce very large setup that can propagate in sheltered zones. In order to explore all these conditions, a dynamical approach that includes overflowing, potential overtopping, and river flows (e.g a modeling chain as proposed by Bertin et al. (2014) or Filippini et al., 2018) could be set up. However, this approach can limit the number of coastal management scenarios and land-use tested, as it is more expensive in computer time and resources compared to our strategy. Hence, such a type of modeling chain is not included in the study, as the next parts we focused on high spring tides and SLR-induced overflowing without stormy conditions (Figure 2B).
Propositions From Local Stakeholders
One of the strengths of this study is the consultation of local decision-makers about coastal management scenarios such as coastal dikes location, new land-use by the establishment of a flood expansion area, or other defenses they thought useful in order to adapt to SLR. Indeed, this first collaborative phase was crucial because it builds i) credibility; ii) legitimacy; and iii) decision-makers’ involvement in the study. These three components are, according to Leitch et al. (2019), indicators of an effective transition between the technique (here flooding risk assessment by numerical modeling) and the pragmatic decision. We have presented preliminary simulation results during a local mayors’ workshop. The participants were able to propose adaptation actions for their municipalities. During the workshop, small groups tried to identify the human, the economic, and the immaterial issues based on their knowledge of the field and the documents provided. They were helped by a map of the marsh (similar to Figure 1A); a map presenting the topo-bathymetry (similar to Figure 1B); a map with the flooding extension caused by storm Xynthia and some simulation results shown in the Supplementary Material. With these elements, they were asked to answer the following questions: Q1/According to you, what are the important issues to preserve/protect in this area, now and in the future? Identify them on the map and explain them. Q2/What kind of development(s) would you consider to protect/preserve them? Draw them and explain them.
Their propositions are summarized on Figure 4. The Figure 4 highlights that they consider several possibilities:
i. The first proposition P1 consists of the total embankment of the marsh (Figure 4A), with two hydraulic connections represented by a red star. According to the workshop participants, the hydraulic connections are set up in order to reduce flooding coming from the rivers. These solutions can be locks, nozzles, culverts, etc., and have to be assessed by a civil engineering office if such a coastal management scenario is retained.
ii. The proposition P2: An unconstrained coastline with the reinforcement of two road-dikes backwards, close to three villages (Figure 4B).
iii. The third proposition (Figure 4C), hereinafter P3, leaves an unconstrained coastline and implements coastal defenses around identified stakes. These locations, composed of villages or isolated houses, are vulnerable according to the workshop participants.
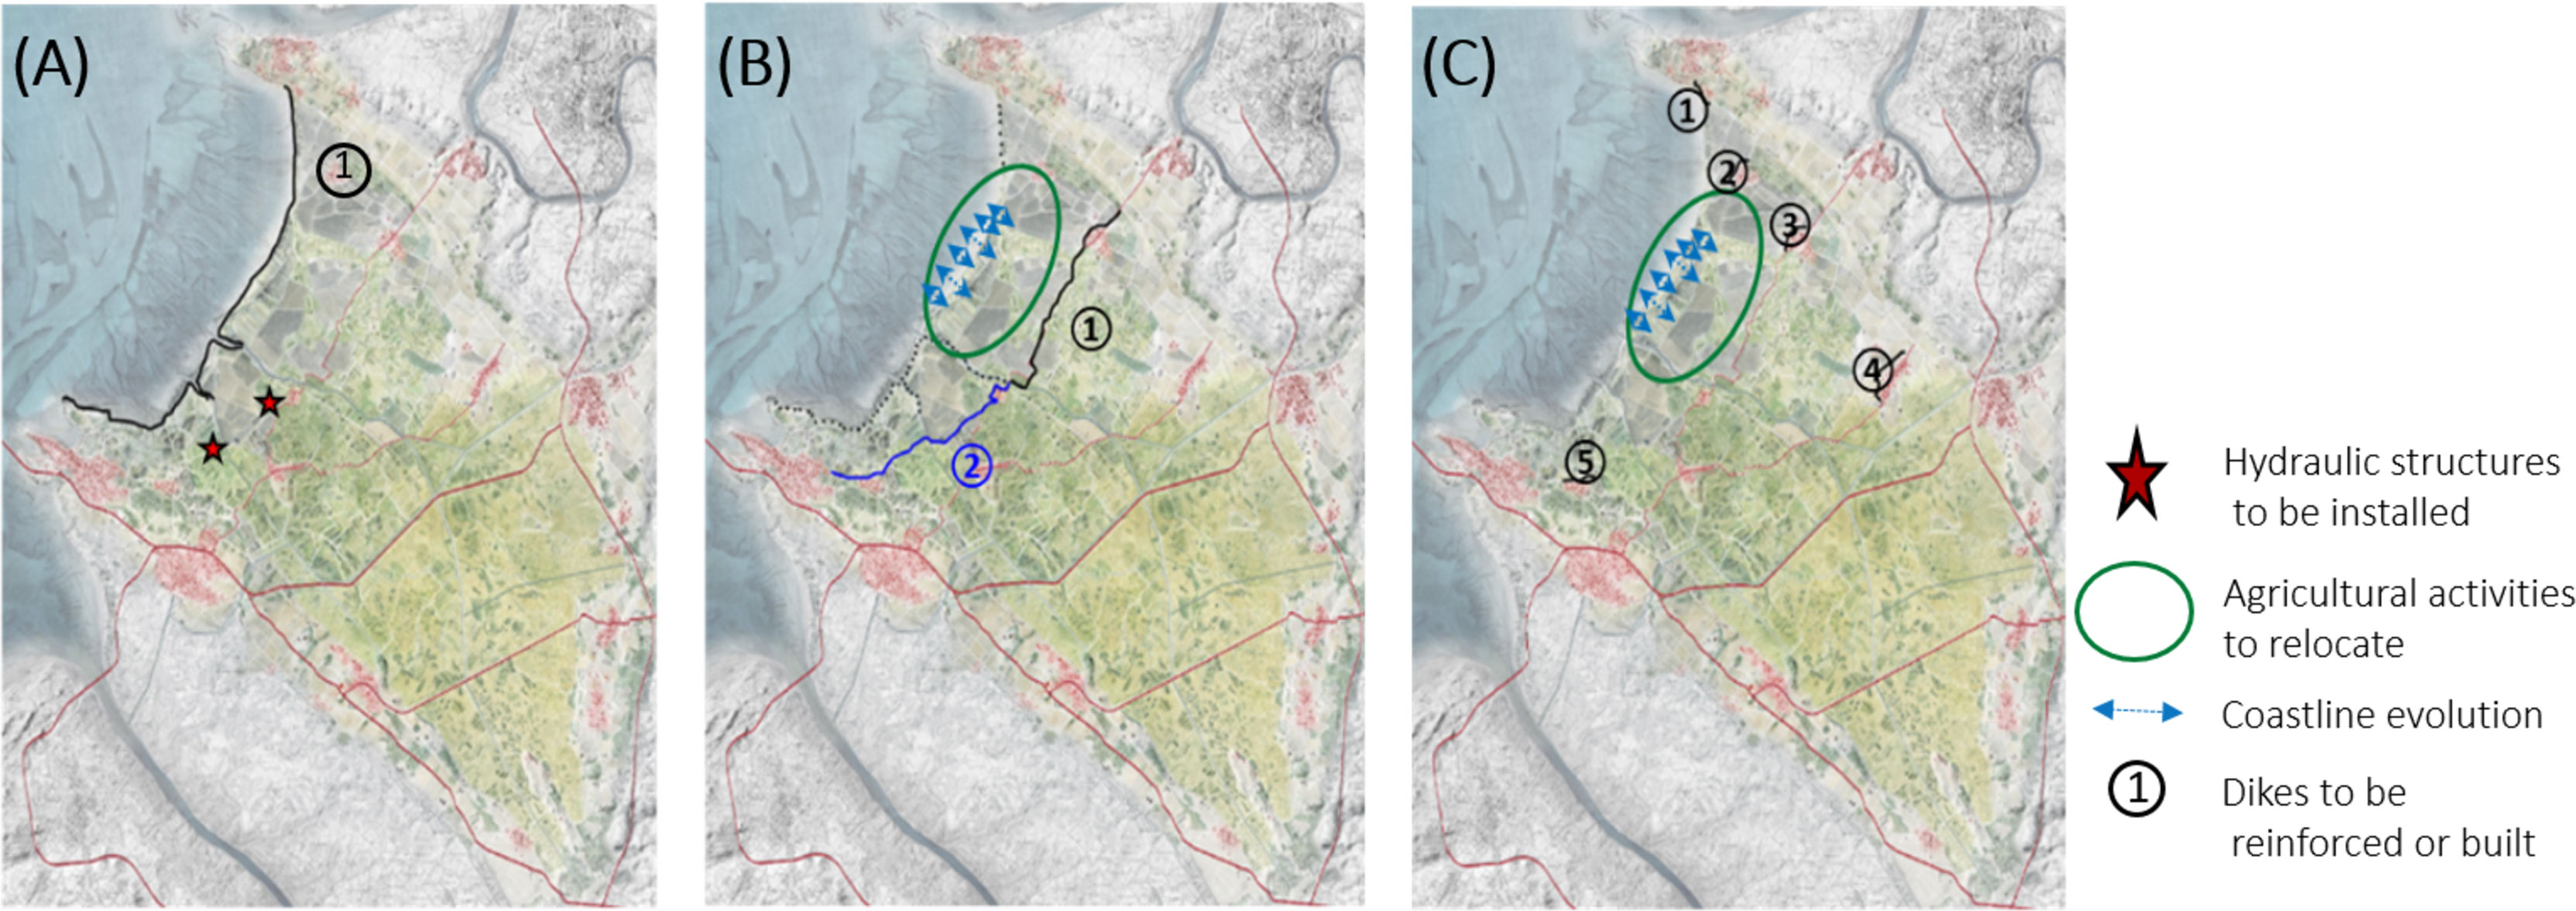
Figure 4 Adapted from the local stakeholders workshop. (A) Proposition P1: reinforcement of the sea-dike and hydraulic infrastructures identified by red stars; (B) P2: Reinforcement of a road-dike (represented by the black and blue lines n°1 and n°2), without maintenance or reinforcement of the existing sea-dikes; (C) P3: Proposition of coastal defenses located around identified issues, without maintenance or reinforcement of the existing sea-dikes. Agricultural activities to relocate are identified by a green circle and blue arrows represent the coastline evolution.
Moreover, they considered that economic activities (shellfish farming, cereal crop) have to be relocated in configurations B and C (Figure 4). They also have represented a moving coastline (blue arrows) that may be advancing or retreating in their perception of the evolution of this area.
As the Adapto project explores adaptive coastal management, we here focus on the scenario P3 that proposes a hybrid solution with reduced embankment, and managed retreat. In addition to the P3 provided by the local decision-makers, we also proposed a scenario without any coastal defenses, hereinafter P4 proposition. The P4 is a scenario with an assumption of generalized ruin of all defenses. In this scenario, coastal structures are not maintained over the long term, and the coastline is not constrained, as suggested by the Coastal risks and prevention plan guideline (DGPR, 2014). Moreover, note that the propositions P1 and P2 were also proposed by the local decision-makers in order to assess the cost of such dikes (height, materials and culverts or other required hydraulic connections, maintenance), and in order to know if this solution would protect the population and the activities in the long term. These propositions were simulated and discussed with stakeholders but are not presented in this research paper.
Taking Into Account the Sea Level Rise and Future Land Use
With SLR, a tidal condition close to the HAT could maybe have a similar impact to coastal flooding caused by severe storms. As a comparison, the sea level should rise by about 1.20 m to reach the conditions observed during Xynthia at La Rochelle. For example, Thiéblemont et al. (2019) presented such value along the French coasts by 2100, for the high-end prediction under the RCP 8.5 scenario. In order to consider tidal conditions close to the HAT, we tried to assess the coastal flooding under future change conditions. To do so, we have considered two SLR projections: i) corresponding to a regional SLR projection by 2030; ii) corresponding to a regional SLR projection by 2050. These regional projections were computed by Le Cozannet et al. (2019), using the stable La Rochelle-La Pallice tide gauge. Basically, these authors used projections provided by Kopp et al. (2014) to which they apply a subsidence correction. They assumed that the probabilistic SLR projections at La Rochelle were consistent for the Aquitaine coast, once corrected from the local vertical ground motions (we invited the reader to report to Le Cozannet et al. (2019) for more details on their methods). Thus, we used the following values to integrate SLR within the hydrodynamical model: +0.18 m by 2030 and +0.36 m by 2050. These values correspond to the upper bound of the “likely-range”, built for the pessimistic RCP 8.5 (Church et al., 2013). During the study, we assumed that the values proposed by Le Cozannet et al. (2019) could be more consistent with those that would be derived from the SROCC (IPCC, 2019) and lastly by the 6th IPCC report (IPCC, 2021), compared to those provided by the 5th IPCC report (Church et al., 2013). Based on the recent literature, our assumption is in accordance with the regional projections derived from the SROCC (Thiéblemont et al., 2019). Indeed, considering the SROCC projections, the likely-range is assessed between [0.15-0.17 m] by 2030 for the scenario RCP 8.5 in the Bay of Biscay, whereas the values are between [0.12-0.13 m] when derived from the AR5-IPCC report. In the same way, the values are assessed between [0.31-0.34 m] by 2050 in the Bay of Biscay for the scenario RCP 8.5, whereas there are between [0.24-0.26 m] when derived from the AR5-IPCC report. In accordance with the stakeholders, we applied the most conservative approach using the regional values proposed by Le Cozannet et al. (2019). However, it is important to note that these regional values are greater than global projections of SLR. Indeed, Global Mean Sea Level (GMSL) rises between [0.15-0.26 m] for 2031–2050 under RCP 8.5 (SROCC, 2019). When considering the pessimistic scenario Shared Socioeconomic Pathway SSP5 8.5, the GMSL rises between [0.2-0.29 m] by 2050 (IPCC, 2021).
The hydrodynamic simulations and field observations can provide frequency and duration of flooding, height and speed flow, as many elements that can allow the assessment of possible evolutions or establishment of some habitats. Based on our preliminary results (see Supplementary Material), Fouin et al. (2020) have assessed land-use projections by 2030 and 2050 for a scenario where the CDL-dike (black dike in Figure 1) was no longer maintained. Their method for assigning new habitats and land-use is shown in Figure 5A. Such type of land-use changes has a consequence in terms of Strickler coefficients governing the bottom-friction in the model. For example, a land principally occupied by agriculture (Strickler coeff. Ks = 20 m1/3.s-1) becoming a salted meadow (Ks = 29 m1/3.s-1) will experience a decrease in surface roughness. Therefore, we used their land-use projections to assign new Strickler coefficients to the bottom-friction parameter in the model as presented at Figures 5B, C.
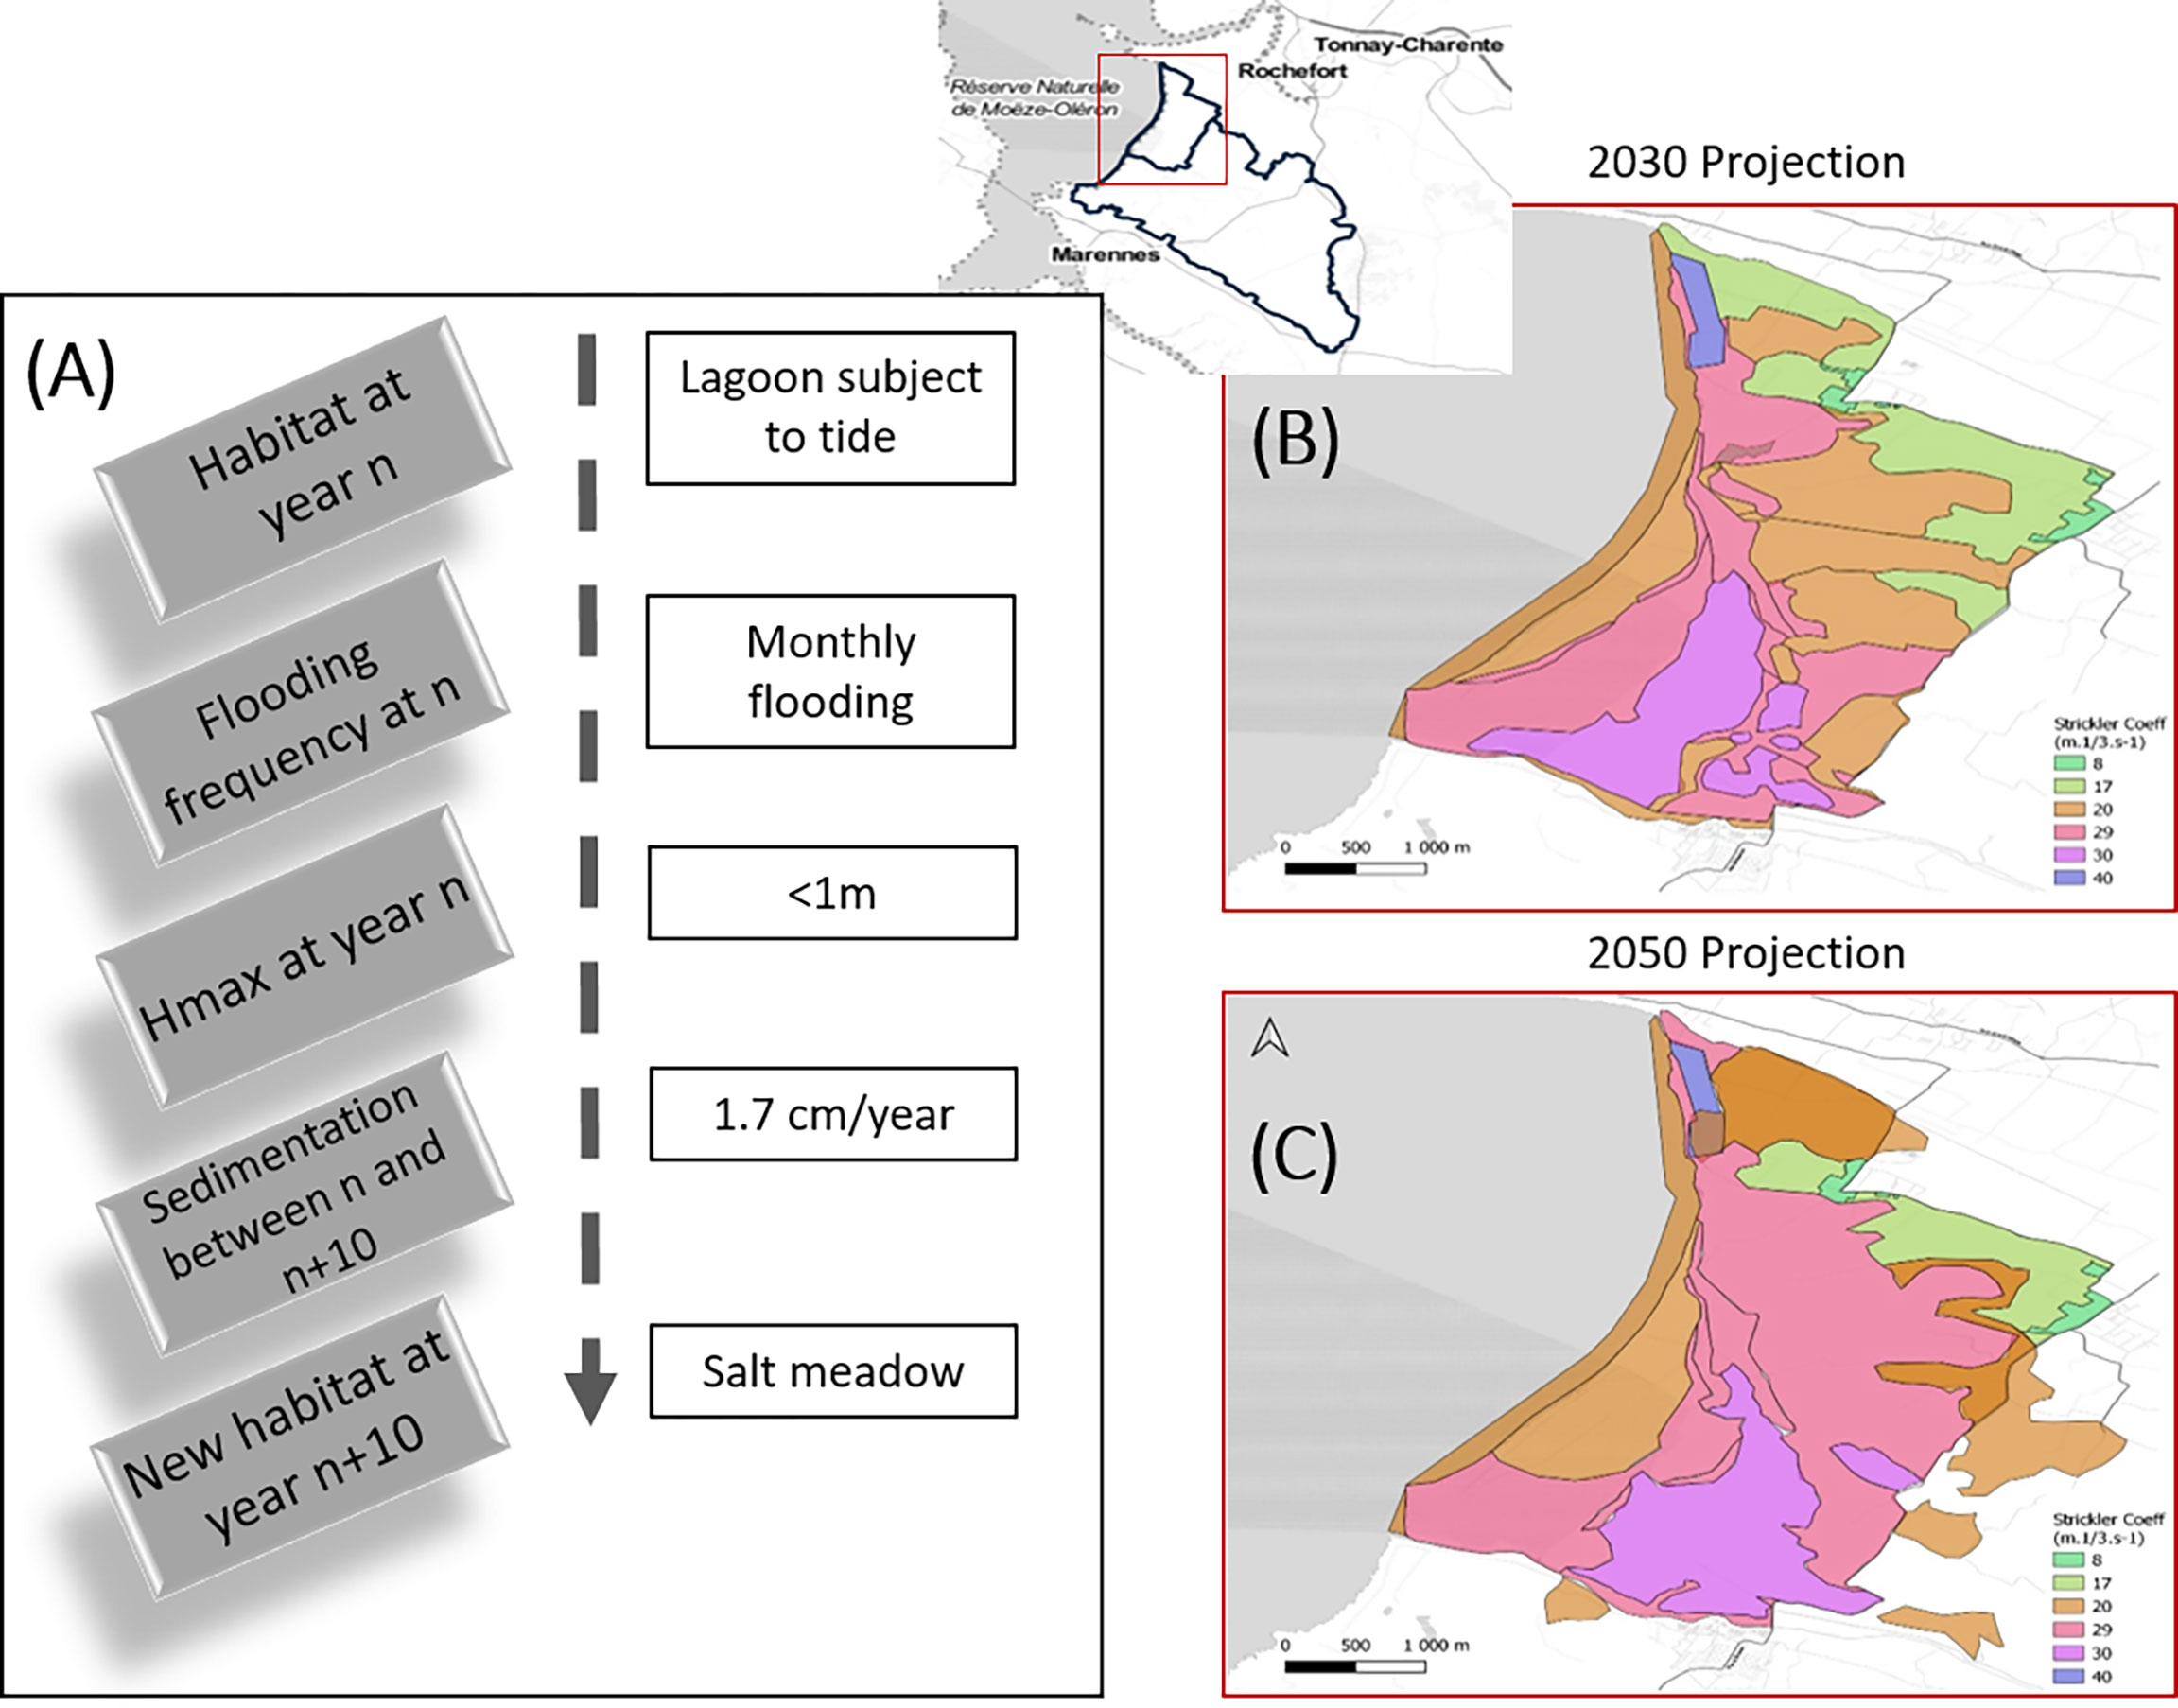
Figure 5 Land-use projections: (A) method for assigning new habitats (grey boxes), and example (white boxes), adapted from Fouin et al. (2020); (B) translated into Strickler coefficients by 2030; (C) translated into Strickler coefficients by 2050.
Results and Discussion
Results for Different Coastal Defenses and Sea Level Rise Scenarios
Here we present the results obtained by simulating the local decision-makers proposition to build defenses around some villages (see Figure 4C). Based on their proposal, we have taken into account coastal defenses of lengths between 300 m and 2500 m with a height preventing the overflow (>10 m). We simulated the P3 scenario, taking into account the regional SLR projections by 2030 and 2050. Table 4 summarizes the different scenarios presented in this section.
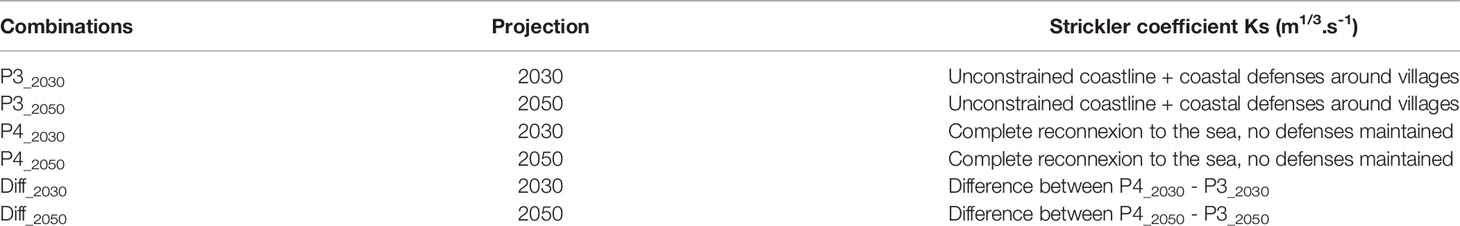
Table 4 Summary of coastal management scenarios presented.
Figure 6 presents the maximum heights simulated taking into account: (A) P3_2030 scenario; (B) P3_2050 scenario; (C) P4_2030 scenario; (D) P4_2050 scenario; (E) Difference P4_2030 – P3_2030 by 2030; and (F) Difference P4_2030 – P3_2030 by 2050. The results highlight that the maximum heights are greater when considering 2050 SLR projection (Figures 6B, D) compared to 2030 (Figures 6A, C). The areas most affected by flooding in terms of maximum heights (about 1.5 m by 2030 and 2 m by 2050) also correspond to those identified by local decision-makers as agricultural activities to relocate (see Figures 4B, C). In addition, the flooding extension is larger by 2050 than by 2030. Especially, the extension is closer to Saint-Frou, Moëze and Hiers villages by 2050 than by 2030. There are the expected results, but we can see that adding 0.18 m of sea level between 2030 and 2050 projections can induce higher maximum water heights, around 0.5 m in some zones close to the Brouage harbour and its channels.
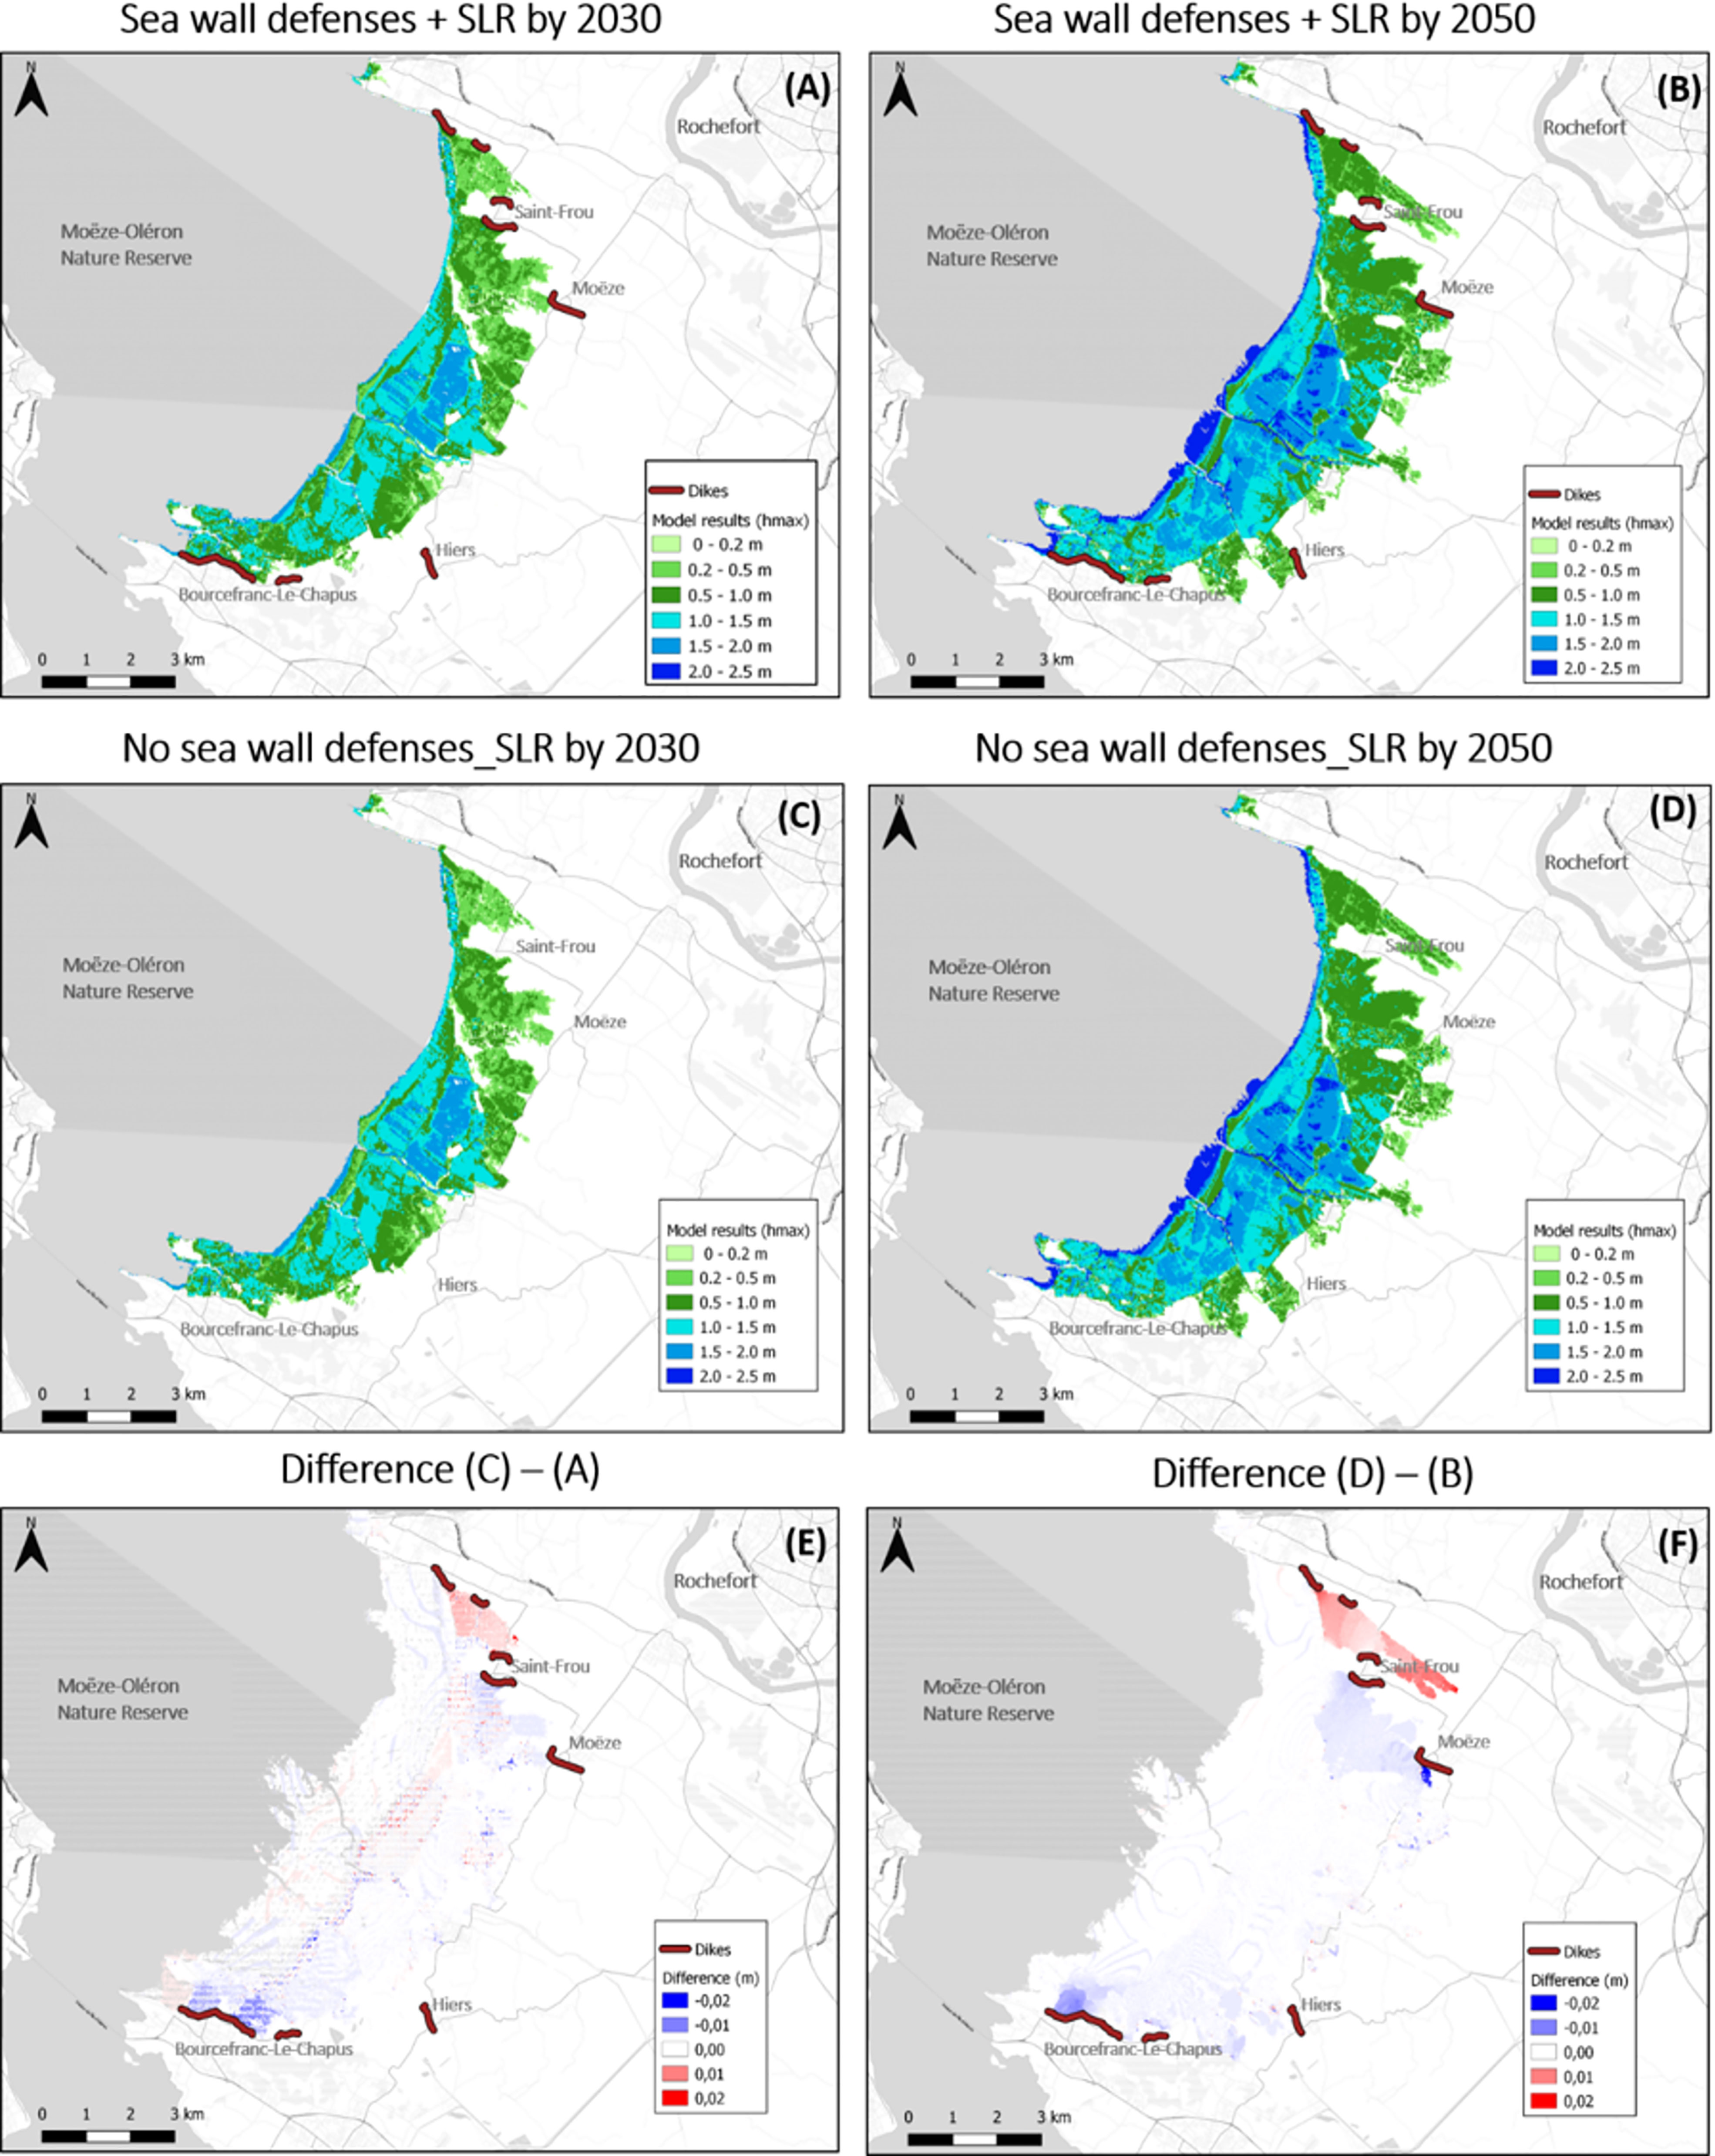
Figure 6 Maximum heights simulated taking into account: (A) P3_2030 scenario; (B) P3_2050 scenario; (C) P4_2030 scenario; (D) P4_2050 scenario; (E) Difference P4_2030 – P3_2030; (F) Same as (E) by 2050.
It further appears that the villages embanked by the defenses proposed by local decision-makers in the P3 scenario are not affected by flooding when there are no defenses (P4 scenario). Figures 6E, F confirm that the difference between P4 and P3 is very limited (< 0.02 m). This can be explained by the fact that the potentially vulnerable areas were historically built on higher points of the marsh (Bento and Blanc, 2017).
Finally, comparing our results to a “bathtub approach”, i.e based on land elevation relative to the selected shoreline water level and GMSL rising, the entire area demarcated as the large Adapto project perimeter (Figure 1A) is projected to be below annual flood level in 2050 according the sea-level rise tool by Kulp and Strauss (2019) called Climate Central. This approach may be more conservative, but it does not take into account physical processes as we do, such as tides or surface roughness.
In-Situ Effect of Land-Use Changes on Flooding
Figure 7 presents the maximum heights simulated taking into account: (A) the regional SLR projection by 2030 + P3 + land-use projection by 2030; (B) regional SLR projection by 2030 + P3 + land-use projection by 2050. Figure 7 also presents: (C) the difference between the results on panel (A) and simulations using current land-use by 2030; the difference between the results on panel (A) and simulations using current land-use by 2050. It highlights no significant changes by 2030 in the zone identified by the local decision-makers as agricultural activities to be relocated (see Figures 4B, C). Figure 5C also shows an increase of more than 0.25 m in the maximum height when considering a new land-use by 2030. We can see that in the north of Bourcefranc-Le-Chapus and Hiers villages, the increase is particularly apparent. This could be explained by the fact that the new habitats in this area are less “rough”. Therefore, water flows more easily in the 2030 projection compared to the 2012 land use. Moreover, even if the land-use projections are limited to the small perimeter of the Adapto project (see Figure 1A and Figure 5B), the change seems to have an effect on the Bourcefranc/Hiers area. The increase is less pronounced (less than 0.25 m) when considering a new land use by 2050, as the habitats are rougher, in sea front compared to 2030. Finally, we bring to your attention to the fact that the Strickler coefficients classification does not have the same level of details in its typology, as the new land-use classification proposed. As an example, Salicornia, obione, or other halophilous species are classified as the same type in the Strickler coefficient classification, whereas in the land-use projection each species has its feature on the habitat evolution.
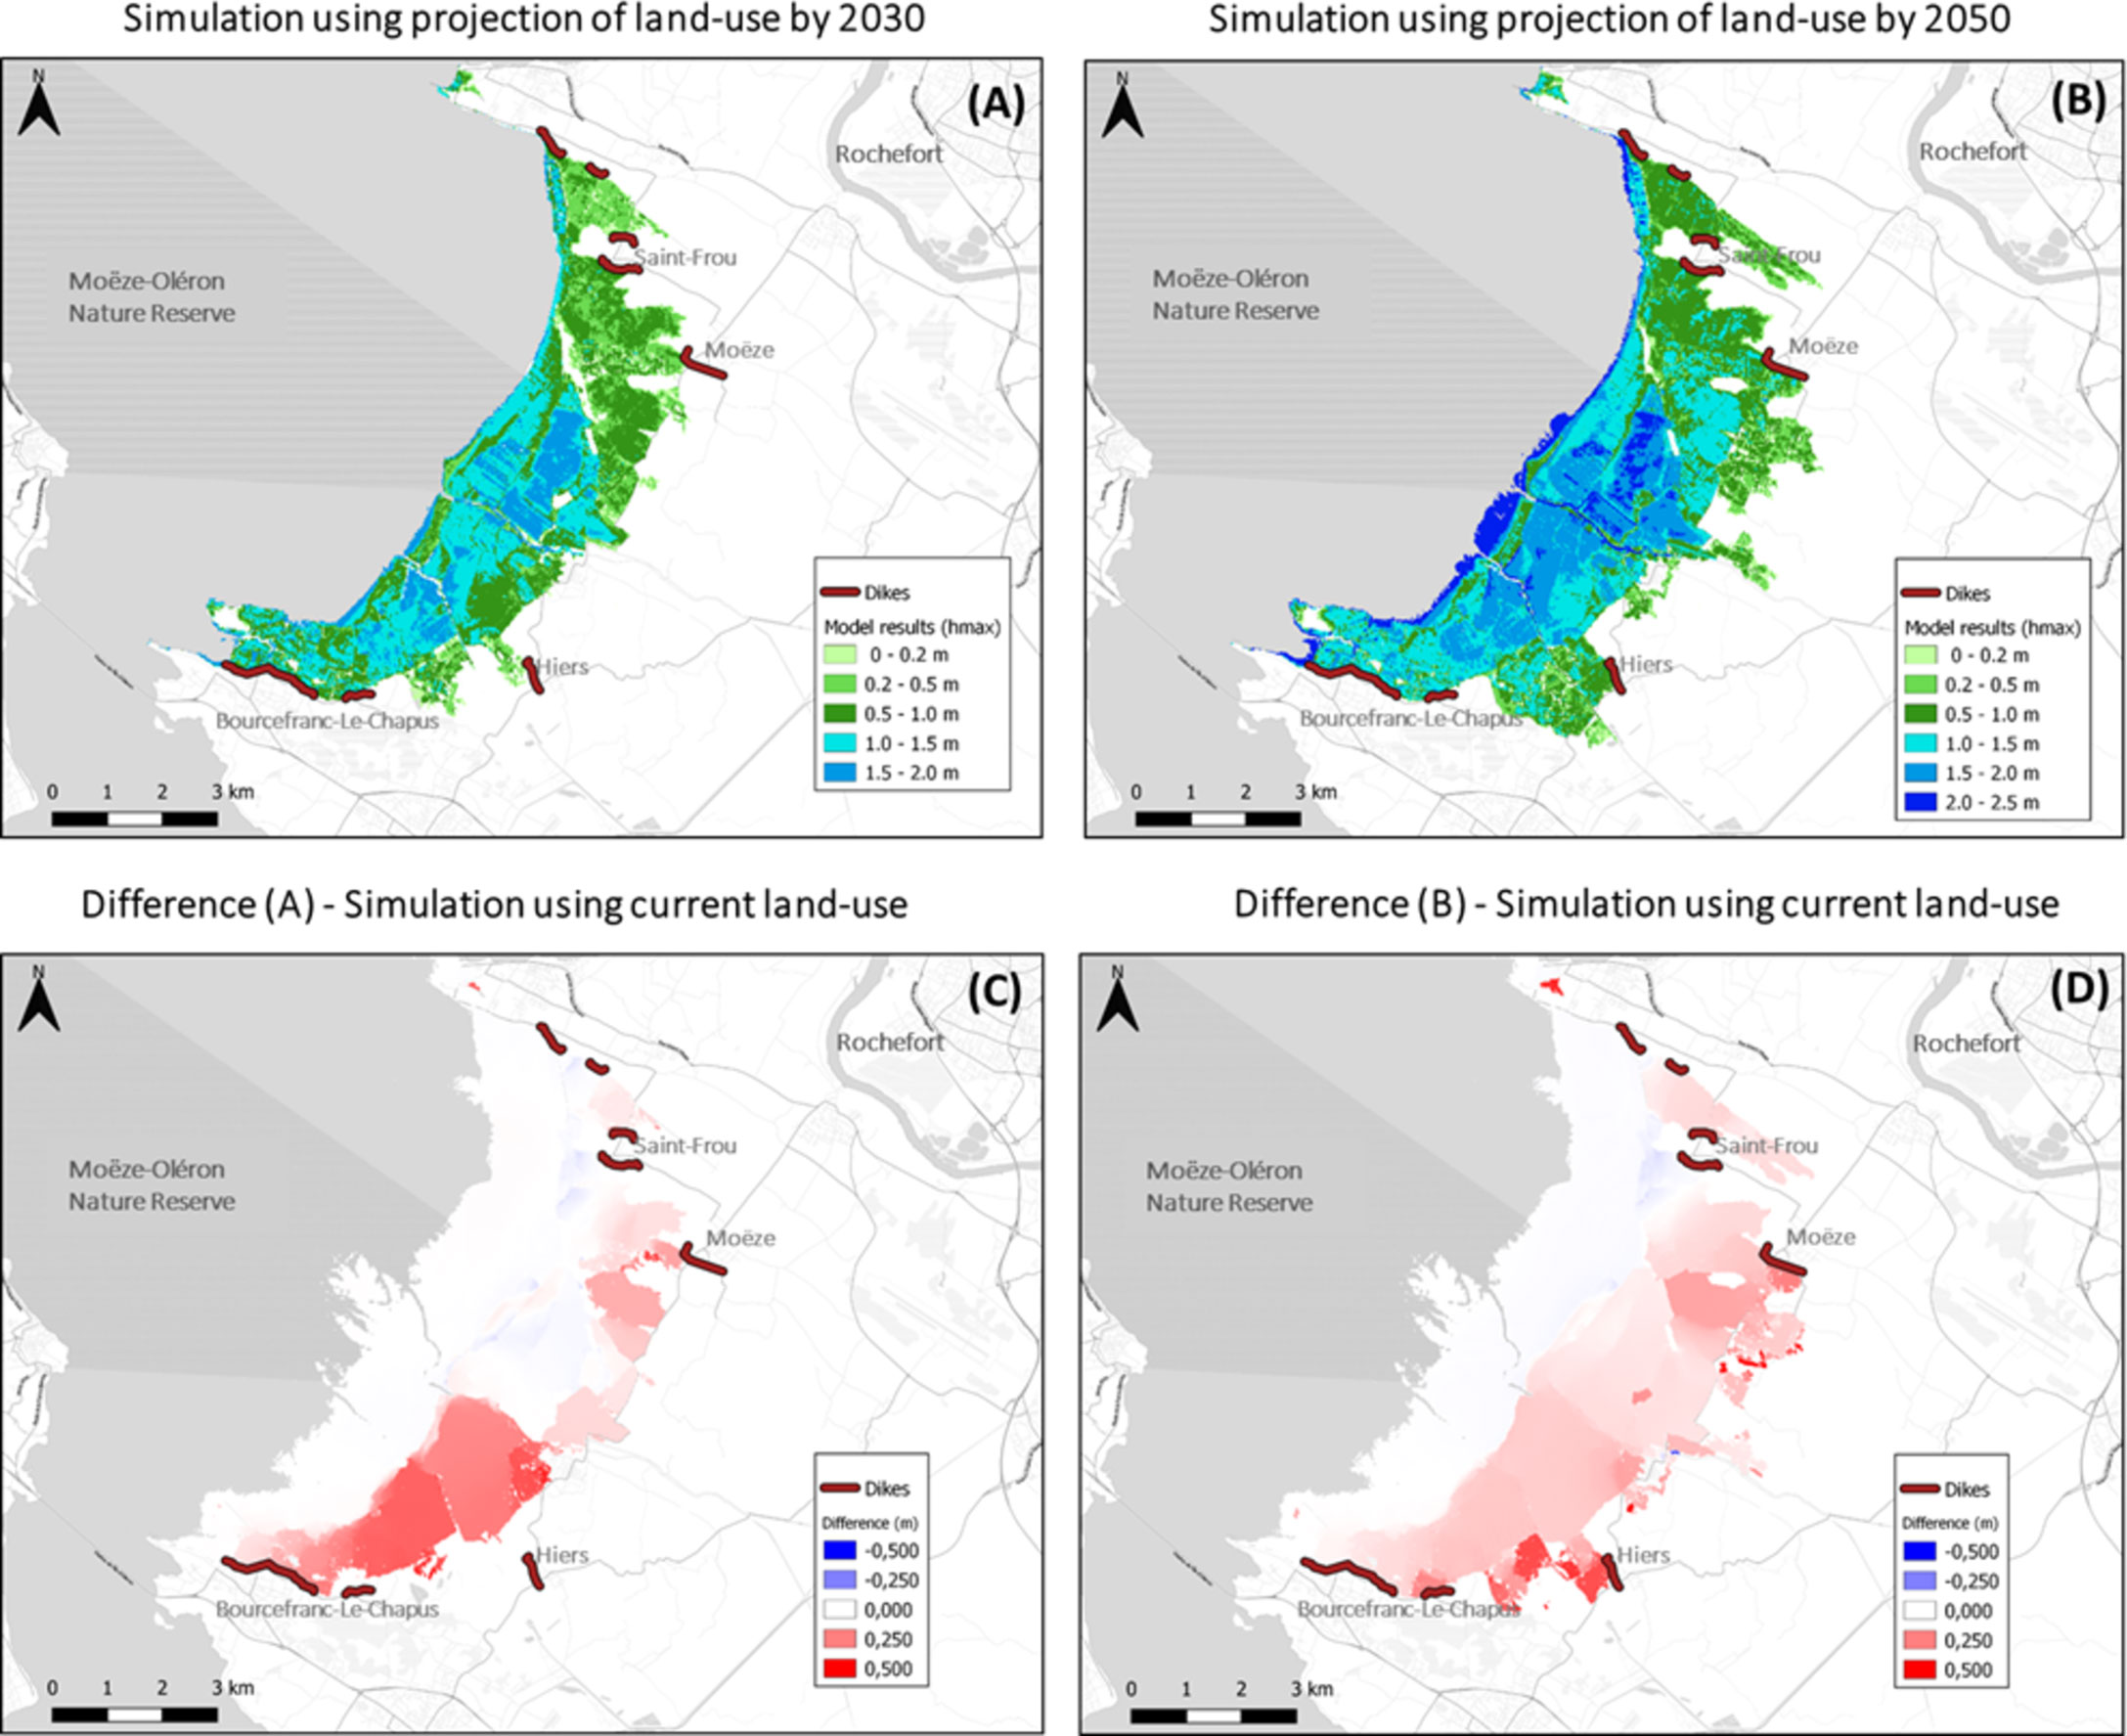
Figure 7 Maximum heights simulated taking into account: (A) regional SLR projection by 2030, the P3 proposition and land-use projection by 2030; (B) same as (A) by 2050; (C) difference between (A) and simulations using current land-use by 2030; (D) same as (C) by 2050.
Here, we did not take into account the possible change of elevation in the topography with new habitats that would trap the sediments. However, Bertin and Chaumillon (2006) have shown that at a regional scale, the accretion of tons of sediments under the oyster beds constitute 30% of the sediments accreted in Marennes-Oléron Bay since 1824. They have also shown that the tons of sediments accreted since that time have reduced by 20% the water volume infilling the bay. As many oyster farms are located inside the Réserve Naturelle of Moëze-Oléron (Figure 1A), it would be interesting to simulate their impact on flooding not only in terms of surface roughness (i.e by changing the Strickler coefficients), but also in terms of sediment sources.
More generally, in case of complete depolderization of the area, it seems crucial to take into account morphologic changes induced by marine sources (sediments, waves, SLR, currents, tide), using numerical modeling and in-situ monitoring (topo-bathymetric survey, suspended matter measurements, site monitoring after storms, etc.).
Conclusion
The main objective of this study was to help local stakeholders determine the best coastal management strategy for the Moëze marsh (France) that can contribute to the adaptation to SLR in this zone. For this purpose different coastal management scenarios were studied using numerical modelling, in order to assess: i) the areas submitted to coastal flooding for future sea level conditions; ii) the potential effects of land-use changes on flooding. We have first calibrated and validated the model allowing a good assessment of the extension of the observed flooding during a reference event: storm Xynthia, occuring on February 28th 2010. We then focused on the high astronomical tide-induced flooding, taking into account regional SLR projections by 2030 and 2050 for different coastal management scenarios, and different land-use projections. Some major conclusions can be drawn:
1) The implementation of close defenses around potentially vulnerable areas (P3 proposition) does not lead to significant changes in flooding (surface extent or maximum water height) compared to the case where the dikes are no longer maintained (P4 proposition).
2) Land-use changes have a non-negligible influence on flooding in the Moëze marsh. Especiallywith an increase of more than 0.25 m in the maximum height when considering a new land-use by 2030, and an increase less pronounced (under 0.25 m) when considering a new land-use by 2050. This result is nuanced because the possible change of elevation in the topography due to new habitats that would trap the sediments is not taken into account.
To go further in the adaptive coastal management strategy, historical extreme sea level events are additional components to take into account (Vousdoukas et al., 2016). Indeed, recent studies (including ours), mainly consider recent extreme storms in the zone. This is due to the fact that these are still very present in the collective memory, and also by the French regulation that has resulted. However, Breilh et al. (2014b) showed that since 1900, 46 severe storms had affected this region. Among these storms, several had a significant wave setup that increased the total water level close to the coast due to wave breaking. A perspective to this work is to simulate extreme conditions using such historical data combined to contemporary topo-bathymetric data (or projections), SLR and future land-use projections Future extreme sea levels could also be considered in our further work. (Vousdoukas et al, 2017).
Although we have not addressed this topic in the present paper, the potential cost of the facilities (construction and/or maintenance) required to protect to SLR is a key element in the coastline management strategy and choices made by the decision-makers. At this point, no coastal management scenario has been decided yet for the Moëze marsh, but local stakeholders now have more knowledge, based on land-use projections in a context of SLR. It is interesting to note that the decision-makers and technicians of the Moëze marsh were able to meet stakeholders from other pilot sites and discover their territories (Lancieux Bay and Orne estuary). They were able to share their experience and learn about regulations, financial levers, public perception, difficulties and possible solutions, as well as get feedback from other stakeholders who have started a managed retreat or ecosystem-based adaptation to SLR. Through these different actions, the multidisciplinary approach used in the Moëze marsh, and broadly in the Adapto project, removes several barriers identified by authors in terms of habitat restoration and adaptation (Lorie et al., 2020; Bongarts Lebbe et al., 2021; Cortina-Segarra et al., 2021). In our case, we can mention the motivation in decision‐makers to incorporate innovation, the integrated land-use planning, and the collaboration between different stakeholders, and different expertise domains as barriers removed. Finally, the approach presented can be adapted to other coastal sites exposed to SLR.
Data Availability Statement
The raw data supporting the conclusions of this article may be made available by the authors made available by the authors, without reservation.
Author Contributions
Conceptualization, JL, OB, PM, PB, and J-ML. Methodology, JL, OB, PM, AM, PB, and J-ML. Software, JL and AM. Validation, JL. Investigation, JL, OB, PM, AM, PB, and J-ML. Data curation, JL and AM. Writing-original draft preparation, JL. Writing-review and editing, JL, OB, PM, AM, PB, and J-ML. All authors have read and agreed to the published version of the manuscript.
Funding
This research was funded by the EU LIFE (Climate Change Adaptation) Adapto project (LIFE16 CCA/FR/000131). http://www.lifeAdapto.eu/.
Conflict of Interest
The authors declare that the research was conducted in the absence of any commercial or financial relationships that could be construed as a potential conflict of interest.
Publisher’s Note
All claims expressed in this article are solely those of the authors and do not necessarily represent those of their affiliated organizations, or those of the publisher, the editors and the reviewers. Any product that may be evaluated in this article, or claim that may be made by its manufacturer, is not guaranteed or endorsed by the publisher.
Acknowledgments
The authors are grateful to the local mayors’ comity, all local stakeholders involved in the project, the RNNMO-LPO. We thank A. Martinet for project administration. The following data providers are acknowledged: Shom, IGN, and Copernicus. We also thank G. Le Cozannet for making available regionalized SLR projections. We thank F. Paris for his support and recommendations on the preliminary phase of this study, and C. Capderrey, X. Philippenko, L. Guan and A. Loil for fruitful discussions. We thank J. Challis for his careful proofreading. The authors are very grateful to the reviewers for their comments and expert advice.
Supplementary Material
The Supplementary Material for this article can be found online at: https://www.frontiersin.org/articles/10.3389/fmars.2022.710086/full#supplementary-material
References
Amante C. J., Eakins B. W. (2016). “Accuracy of Interpolated Bathymetry in Digital Elevation Models,” in Brock, J.C.; Gesch, D.B.; Parrish, C.E.; Rogers, J.N., and Wright, C.W. (Eds.), Advances in Topo-Bathymetric Mapping, Models, and Applications. Journal of Coastal Research, Special Issue, No. 76, vol. pp. (Florida: Coconut Creek), 123–133. doi: 10.2112/SI76-011
Arns A., Wahl T., Dangendorf S., Jensen J. (2015). The Impact of Sea Level Rise on Storm Surge Water Levels in the Northern Part of the German Bight. Coastal Eng. 96, 118–131. doi: 10.1016/j.coastaleng.2014.12.002
Bento C., Blanc M. (2017). Les Paysages Du Marais De Brouage, Technical Report (ENSP Versailles). Available at: https://issuu.com/cb935/docs/apr_marais_de_brouage_all_g_.
Bertin X., Chaumillon E. (2006). The Implication of Oyster Farming in Increasing Sedimentation Rates in a Macrotidal Bay: The Marennes-Oléron Bay, France. Cah. Biol. Mar. 47, 19–22. doi: 10.21411/CBM.A.6E675E7B
Bertin X., Li K., Roland A., Breilh J. F., Zhang Y. L., Chaumillon E. (2014). A Modeling-Based Analysis of the Flooding Associated With Xynthia, Central Bay of Biscay. Coastal Eng. 94, 80–89. doi: 10.1016/j.coastaleng.2014.08.013
Bongarts Lebbe T., Rey-Valette H., Chaumillon É, Camus G., Almar R., Cazenave A., et al. (2021). Designing Coastal Adaptation Strategies to Tackle Sea Level Rise. Front. Mar. Sci. 8. doi: 10.3389/fmars.2021.740602
Breilh J.-F. (2014a). Les Surcotes Et Les Submersions Marines Dans La Partie Centrale Du Golfe De Gascogne : Les Enseignements De La Tempête Xynthia. (PhD Thesis) (La Rochelle, France: Université de la Rochelle). Available at: https://tel.archives-ouvertes.fr/tel-01174997.
Breilh J.-F., Bertin X., Chaumillon E., Giloy N., Sauzeau T. (2014b). How Frequent is Storm-Induced Flooding in the Central Part of the Bay of Biscay? Global Planetary Change 122, 161–175. doi: 10.1016/j.gloplacha.2014.08.013
Breilh J.-F., Chaumillon E., Bertin X., Gravelle M. (2013). Assessment of Static Flood Modeling Techniques: Application to Contrasting Marshes Flooded During Xynthia (Western France). Natural Hazards Earth System Sci. 13, 1595–1612. doi: 10.5194/nhess-13-1595-2013
Brown J. D., Spencer T., Moeller I. (2007). Modelling Storm Surge Flooding of an Urban Area With Particular Reference to Modelling Uncertainties: A Case Study of Canvey Island, United Kingdom. Water Resour. Res. 43, W06402. doi: 10.1029/2005WR004597
Bruneau N., Bertin X., Castelle B., Bonneton P. (2014). Tide-Induced Flow Signature in Rip Currents on a Meso-Macrotidal Beach. Ocean Modelling 74, 53–59. doi: 10.1016/j.ocemod.2013.12.002
Bulteau T., Idier D., Lambert J., Garcin M. (2015). How Historical Information can Improve Estimation and Prediction of Extreme Coastal Water Levels: Application to the Xynthia Event at La Rochelle (France). Nat. Hazards Earth Syst. Sci. 15, 1135–1147. doi: 10.5194/nhess-15-1135-2015
Bunya S., Deitrich J. C., Westerink J. J., Ebersole B. A., Smith J. M., Atkinson J. H., et al. (2010). A High-Resolution Coupled Riverine Flow, Tide, Wind, Wind Wave, and Storm Surge Model for Southern Louisiana and Mississippi. Part I: Model Development and Validation. Monthly Weather Rev. 18, 345–377. doi: 10.1175/2009MWR2906.1
Chaumillon E., Bertin X., Weber N., Tesson M. (2003). “Internal Architecture and Sedimentary Facies of a Macrotidal Bay: Implication in Terms of Morphodynamics (The Marenne-Oléron Bay, Atlantic Coast of France),” in Proceedings of the 3rd IAHRD Symposium on River, Coastal and Estuarine Morphodynamics (RCEM 2003). Eds. Sanchez-Arcilla A., Bateman A. (Madrid, Spain: IAHRD publication), 423–432.
Church J. A., Clark P. U., Cazenave A., Gregory J. M., Jevrejeva S., Levermann A., et al. (2013). “Sea Level Change,” in Climate Change 2013: The Physical Science Basis. Contribution of Working Group I to the Fifth Assessment Report of the Intergovernmental Panel on Climate Change. Eds. Qin T. F.,. D., Plattner G.-K., Tignor M., Allen S. K., Boschung J., Nauels A., Xia Y., Bex V., Midgley P. M. (Cambridge, United Kingdom and New York, NY, USA: Cambridge University Press), 1137–1216. doi: 10.1017/CBO9781107415324.026
Cortina-Segarra J., García-Sánchez I., Grace M., Andrés P., Baker S., Bullock C., et al. (2021). Barriers to Ecological Restoration in Europe: Expert Perspectives. Restor. Ecol. 29, e13346. doi: 10.1111/rec.13346
Kulp S. A., Strauss B. H. (2019). New Elevation Data Triple Estimates of Global Vulnerability to Sea-Level Rise and Coastal Flooding. Nat. Commun 10, 5752. doi: 10.1038/s41467-019-13552-0
DDTM-17. (2011). Éléments De Mémoire Sur La Tempête Xynthia Du 27 Et 28 Février 2010 En Charente-Maritime. Available at: http://www.charente-maritime.gouv.fr/layout/set/print/Politiques-publiques/Environnement-risques-naturels-et-technologiques/Risques-naturels-et-technologiques/Generalites-sur-la-prevention-des-risques-naturels/Elements-de-memoire-Xynthia/Elements-de-memoire-sur-la-tempete-Xynthia-du-27-et-28-fevrier-2010.
DGPR. (2014). Guide Méthodologique : Plan De Prévention Des Risques Littoraux. Available at: https://www.ecologie.gouv.fr/sites/default/files/Guide%20PPRL%20-%20version%20finale%20mai%202014.pdf.
European Environment Agency. (2012). CORINE Land Cover Project. Commission of the European Communities. Available at: http://land.copernicus.eu/pan-european/corine-land-cover/clc-2012/view.
Ezer T., Atkinson L. P. (2014). Accelerated Flooding Along the U.S. East Coast: On the Impact of Sea-Level Rise, Tides, Storms, the Gulf Stream, and the North Atlantic Oscillations. Earth’s Future 2, 362– 382. doi: 10.1002/2014EF000252
Fernández-Montblanc T., Duo E., Ciavola P. (2020). Dune Reconstruction and Revegetation as a Potential Measure to Decrease Coastal Erosion and Flooding Under Extreme Storm Conditions. Ocean Coastal Manage. 188, 105075. doi: 10.1016/j.ocecoaman.2019.105075
Filippini A., De Brye S., Perrier P., Marche F., Ricchiuto M., Lannes D., et al. (2018). UHAINA: A Parallel High Performance Unstructured Near-Shore Wave Model. Journées Nationales Génie Côtier - Génie Civil (France) 15, 47–56. doi: 10.5150/jngcgc.2018.006
Fouin M., Travichon S., Mouillon P. (2020) Quelles Evolutions De La Biodiversité En Fonction De La Gestion Du Trait De Côte Dans Un Contexte D’élévation Du Niveau Marin? Analyse Sur Le Site De Moëze-Brouage: Prévisions a 2050. Available at: https://www.lifeAdapto.eu/media/5772/Brouage_2021_Rapport%20LPO.pdf.
French Ministry of Environment (2017) Actions Menées Par L’État a La Suite De La Tempête Xynthia. Available at: https://www.ecologie.gouv.fr/sites/default/files/20170203_Bilan_Xynthia-v4.pdf.
Grothues T. M., Able K. W. (2020). Shoreline Infrastructure Degradation and Increasing Littoral Naturalization Accommodates Juvenile Fish and Crab Assemblages in Heavily Urbanized Upper New York Harbor. Restor. Ecol. 28, 947–959. doi: 10.1111/rec.13163
Dodet G., Bertin X., Bouchette F., Gravelle M., Testut L., Woppelmann G. (2019). Characterization of Sea-Level Variations Along the Metropolitan Coasts of France: Waves, Tides, Storm Surges and Long-Term Changes. J. Coastal Res. 88 (sp1), 10–24. doi: 10.2112/SI88-003.1
Haigh I., Wadey M. P., Wahl T., Ozsoy O., Nicholls R. J., Brown J. M., et al. (2016). Spatial and Temporal Analysis of Extreme Sea Level and Storm Surge Events Around the Coastline of the UK. Sci. Data 3, 160107. doi: 10.1038/sdata.2016.107
Hallegatte S., Green C., Nicholls R. J., Corfee-Morlot J. (2013). Future Flood Losses in Major Coastal Cities. Nat. Climate Change 3 (9), 802. doi: 10.1038/nclimate1979
Idier D., Rohmer J., Pedreros R., Le Roy S., Lambert J., Louisor J., et al. (2020). Coastal Flood: A Composite Method for Past Events Characterisation Providing Insights in Past, Present and Future Hazards—Joining Historical, Statistical and Modelling Approaches. Nat. Hazards 101, 465–501. doi: 10.1007/s11069-020-03882-4
Imani M., Kuo C.-Y., Chen P.-C., Tseng K.-H., Kao H.-C., Lee C.-M., et al. (2021). Risk Assessment of Coastal Flooding Under Different Inundation Situations in Southwest of Taiwan (Tainan City). Water 13, 880. doi: 10.3390/w13060880
IPCC. (2019). IPCC Special Report on the Ocean and Cryosphere in a Changing Climate. Eds. Pörtner H.-O., Roberts D. C., Masson-Delmotte V., Zhai P., Tignor M., Poloczanska E., Mintenbeck K., Alegría A., Nicolai M., Okem A., Petzold J., Rama B., Weyer N. M. (In press). (Cambridge, UK: Cambridge University Press).
IPCC. (2021). Climate Change 2021: The Physical Science Basis. Contribution of Working Group I to the Sixth Assessment Report of the Inter-Governmental Panel on Climate Change. Eds. Masson-Delmotte V., Zhai P., Pirani A., Connors S. L., Péan C., Berger S., Caud N., Chen Y., Goldfarb L., Gomis M. I., et al. (Cambridge, UK: Cambridge University Press).
Kirezci E., Young I. R., Ranasinghe R., Muis S., Nicholls R. J., Lincke D., et al. (2020). Projections of Global-Scale Extreme Sea Levels and Resulting Episodic Coastal Flooding Over the 21st Century. Sci. Rep. 10, 11629. doi: 10.1038/s41598-020-67736-6
Kopp R. E., Horton R. M., Little C. M., Mitrovica J. X., Oppenheimer M., Rasmussen D. J., et al. (2014). Probabilistic 21st and 22nd Century Sea-Level Projections at a Global Network of Tide-Gauge Sites. Earths Future 2, 383–406. doi: 10.1002/2014EF000239
Lazure P., Dumas F. (2008). An External-Internal Mode Coupling for a 3D Hydrodynamical Model for Applications at Regional Scale (MARS). Adv. In Water Resour. 31 (2), 233–250. doi: 10.1016/j.advwatres.2007.06.010
Le Cozannet G., Bulteau T., Castelle B., Ranasinghe R., Wöppelmann G., Roher J., et al. (2019). Quantifying Uncertainties of Sandy Shoreline Change Projections as Sea Level Rises. Sci. Rep. 9, 42. doi: 10.1038/s41598-018-37017-4
Leitch A. M., Palutikof J. P., Rissik D., Boulter S. L., Tonmoy F. N. (2019). Co-Development of a Climate Change Decision Support Framework Through Engagement With Stakeholders. Climatic Change. 153, 587–605 doi: 10.1007/s10584-019-02401-0
Lemoine J. P., Le Hir P. (2021). Maintenance Dredging in a Macrotidal Estuary: Modelling and Assessment of its Variability With Hydro-Meteorological Forcing. Estuarine Coastal Shelf Sci. 258, 107366 doi: 10.1016/j.ecss.2021.107366
Lorie M., Neumann J. E., Sarofim M. C., Jones R., Horton R. M., Kopp R. E., et al. (2020). Modeling Coastal Flood Risk and Adaptation Response Under Future Climate Condition. Climate Risk Manage. 29, 100233. doi: 10.1016/j.crm.2020.100233
Martínez M. L., Mendoza-González G., Silva-Casarín R., Mendoza-Baldwin E.(2014). Land Use Changes and Sea Level Rise May Induce a “Coastal Squeeze” on the Coasts of Veracruz, Mexico. Global Environ. Change 29, 180–188. doi: 10.1016/j.gloenvcha.2014.09.009
Melo W., Pinho J., Iglesias I., Bio A., Avilez-Valente P., Vieira J., et al. (2020). Hydro- and Morphodynamic Impacts of Sea Level Rise: The Minho Estuary Case Study. J. Mar. Sci. Eng. 8, 441. doi: 10.3390/jmse8060441
Moftakhari H. R., AghaKouchak A., Sanders B. F., Feldman D. L., Sweet W., Matthew R. A., et al. (2015). Increased Nuisance Flooding Along the Coasts of the United States Due to Sea Level Rise: Past and Future. Geophys. Res. Lett. 42, 9846– 9852. doi: 10.1002/2015GL066072
Mo Y., Kearney M., Turner R. (2020). The Resilience of Coastal Marshes to Hurricanes: The Potential Impact of Excess Nutrient. Environ. Int. 138. doi: 10.1016/j.envint.2019.105409
Nicolae Lerma A., Bulteau T., Elineau S., Paris F., Durand P., Anselme B., et al (2018). High-Resolution Marine Flood Modelling Coupling Overflow and Overtopping Processes: Framing the Hazard Based on Historical and Statistical Approaches. Nat. Haz. Earth Syst. Sci. 18, 207–229. doi: 10.5194/nhess-18-207-2018
Papaioannou G., Efstratiadis A., Vasiliades L., Loukas A., Papalexiou S. M., Koukouvinos A., et al. (2018). An Operational Method for Flood Directive Implementation in Ungauged Urban Areas. Hydrology 5 (2), 24. doi: 10.3390/hydrology5020024
Pestana Almeida Pinto R. (2014) Floodplain Inundation Models and SAR Imagery Analysis. (Master’s Thesis). Available at: https://fenix.tecnico.ulisboa.pt/cursos/meft/dissertacao/846778572210435.
Pineau-Guillou L., Lathuiliere C., Magne R., Louazel S., Corman D., Perherin C. (2012). Sea Levels Analysis and Surge Modelling During Storm Xynthia. Eur. J. Environ. Civ Eng. 16, 943–952. doi: 10.1080/19648189.2012.676424
Ray R. D., Foster G. (2016). Future Nuisance Flooding at Boston Caused by Astronomical Tides Alone. Earth’s Futur. 4, 578–587. doi: 10.1002/2016EF000423
Rocha C., Antunes C., Catita C. (2020). Coastal Vulnerability Assessment Due to Sea Level Rise: The Case Study of the Atlantic Coast of Mainland Portugal. Water 12, 360. doi: 10.3390/w12020360
Rosenzweig C., Solecki W. D., Blake R., Bowman M., Faris C., Gornitz V., et al. (2011). Developing Coastal Adaptation to Climate Change in the New York City Infrastructure-Shed: Process, Approach, Tools, and Strategies. Climatic Change 106, 93– 127. doi: 10.1007/s10584-010-0002-8
Shom. (2015). MNT Topo-Bathymétrique Côtier Des Pertuis Charentais (Projet Homonim). (diffusion Shom). doi: 10.17183/MNT_COTIER_PERTUIS_HOMONIM_20m_WGS84
Shom. (2017) Ouvrage De Marée. References Altimétriques Maritimes Ports De France Métropolitaine Et D’outre-Mer. Cotes Du Zéro Hydrographique Et Niveaux Caractéristiques De La Marée. Available at: https://www.data.gouv.fr/fr/datasets/references-altimetriques-maritimes.
Thiéblemont R., Le Cozannet G., Toimil A., Meyssignac B., Losada I. J. (2019). Likely and High-End Impacts of Regional Sea-Level Rise on the Shoreline Change of European Sandy Coasts Under a High Greenhouse Gas Emissions Scenario. Water 11 (12), 2607. doi: 10.3390/w11122607
Timmerman A., Haasnoot M., Middelkoop H., Bouma T., McEvoy S. (2021). Ecological Consequences of Sea Level Rise and Flood Protection Strategies in Shallow Coastal Systems: A Quick-Scan Barcoding Approach. In Ocean Coastal Manage. 210, 105674). doi: 10.1016/j.ocecoaman.2021.105674
Vousdoukas M. I., Mentaschi L., Feyen L., Voukouvalas E. (2017). Earth’s Future Extreme Sea Levels on the Rise Along Europe’s Coasts. Earth’s Futur. 5, 304–323. doi: 10.1002/2016EF000505
Vousdoukas M. I., Voukouvalas E., Annunziato A., Giardino A., Feyen L. (2016). Projections of Extreme Storm Surge Levels Along Europe. Climate Dynamics 47 (9–10), 3171. doi: 10.1007/s00382-016-3019-5
Keywords: coastal flooding, numerical modeling, sea level rise (SLR), adaptation, Moëze marsh, land-use changes
Citation: Louisor J, Brivois O, Mouillon P, Maspataud A, Belz P and Laloue J-M (2022) Coastal Flood Modeling to Explore Adaptive Coastal Management Scenarios and Land-Use Changes Under Sea Level Rise. Front. Mar. Sci. 9:710086. doi: 10.3389/fmars.2022.710086
Received: 15 May 2021; Accepted: 11 April 2022;
Published: 11 May 2022.
Edited by:
Roderik Van De Wal, Utrecht University, NetherlandsReviewed by:
Charlotte Lyddon, Bangor University, United KingdomLiqin Zuo, Nanjing Hydraulic Research Institute, China
Copyright © 2022 Louisor, Brivois, Mouillon, Maspataud, Belz and Laloue. This is an open-access article distributed under the terms of the Creative Commons Attribution License (CC BY). The use, distribution or reproduction in other forums is permitted, provided the original author(s) and the copyright owner(s) are credited and that the original publication in this journal is cited, in accordance with accepted academic practice. No use, distribution or reproduction is permitted which does not comply with these terms.
*Correspondence: Jessie Louisor, ai5sb3Vpc29yQGJyZ20uZnI=