 Wei Gao
 Jun Du1
 Bing Li
- 1Key Laboratory of Marine Geology and Metallogeny, First Institute of Oceanography, Ministry of Natural Resources (MNR), Qingdao, China
- 2Laboratory for Marine Geology, Pilot National Laboratory for Marine Science and Technology (Qingdao), Qingdao, China
- 3Island Research Center, Ministry of Natural Resources (MNR), Pingtan, China
- 4College of Marine Geosciences, Ocean University of China, Qingdao, China
In this study, how shoreline change responses to global climate change and human activity at the Shandong Peninsula was quantified by analyzing shoreline locations, inshore erosion/accretion rates, and sandy beach profiles for 2007–2020. During the study period, the total shoreline length decreased from 3345.55 km to 3310.18 km, whereas the natural shoreline decreased by 25.41%. As a dominant shore type, the artificial shoreline increased by 827.89 km. Human activities, such as land reclamation and harbor construction, have caused continuous shoreline advance, resulting in a net land increase of 672.40 km2. However, natural shores (e.g., sandy shore) receded at an average annual rate of −1.0 m due to ongoing erosion. The inshore waters of the Shandong Peninsula were largely sedimentary as erosion occurred only at a few hotspots. Therefore, seaward sediment deposition dominated the erosion/accretion trends of the inshore areas of the peninsula. However, global climate change and human activities have exacerbated the erosion caused by sea level rise. Specifically, the climate change caused absolute sea level rise and increasing frequency of extreme weather events, whereas the human activity dominated the transport and supply of sediment in the coastal zone. In the short term, the shoreline of the Shandong Peninsula continues to advance toward the sea due to the growing artificial shoreline. However, this disrupts the balance between sediment supply and marine energies in the coastal zone, and the system then rebalance itself by eroding unprotected natural shores. In the long term, main shoreline evolution trends depend on global climate change and sea level rise which plays a decisive role in shoreline retreat in the Shandong Peninsula.
1 Introduction
The coastal zone is the interface where spatiotemporally complex and dynamic exchanges of matter and energy most intensely occur among the hydrosphere, lithosphere, biosphere, and atmosphere (Fraser et al., 2017)Therefore, the coastal zone has long been the focus of studies on land–sea interactions (Temmerman et al., 2013; Williams et al., 2018). Coastal zones also experience the greatest degree of overlap among urbanization, industry, wind, and solar power generation, and various exploration of national resources (Nicholls, 2004; Davenport and Davenport, 2006). For these reasons, they are one of the hotspots in the world for socioeconomic development (Barbier et al., 2011). Overall, the multiple governing factors of the coastal zone (e.g., sediment supply, the hydrodynamic environment, and the interaction zone) mutually interact constraining or facilitating each other via various mechanisms (Yates et al., 2009). If the equilibrium between sediment supply and the hydrodynamic environment is disrupted, the interaction zone either retreats or advances to establish a new equilibrium (Ranasinghe and Stive, 2009 and Ranasinghe, 2016). The consequent changes in the land-side boundary of the interaction zone then manifest as shoreline change. Some of these processes have been in action over millennia but slow, whereas others have been recent but fast (Fred and Andrew, 1996). Thus, shoreline change depends on both natural and anthropogenic factors. The former includes sea level, wave action, tidal currents, storm surges, and changes in the supply of terrigenous sediment (Esteves et al., 2002; Cai et al., 2009; Nerem et al., 2018; Flor-Blanco et al., 2021). The latter includes human-induced disturbances, such as land reclamation, harbor construction, the damming of rivers that drain into the sea, sand mining, and beach maintenance projects (Anthony et al., 2015; Warrick et al., 2019; Grottoli et al., 2020; Pan et al., 2022). Due to global climate change (especially sea level rise) and the increasing intensity and scale of human-induced disturbances in the coastal zone (Nicholls and Cazenave, 2010), coastal zone systems are now experiencing large and rapid changes in their governing factors or overall patterns (Meinshausen et al., 2011). The rapid increase in artificial shorelines and shoreline control projects has caused anthropogenic factors to dominate shoreline change (Chu et al., 2020), with its severe consequences for coastal geo-environments and ecosystems (McGranahan et al., 2007; Mentaschi et al., 2018).
The warming of oceans across the globe has reduced the decadal average Arctic sea-ice extent to its lowest level since 1850. Furthermore, virtually all glaciers around the world are in retreat, and the rate of ice cap melting during 2010–2019 was four times than that during 1992–1999. Sea level rise since 1900 due to warming-driven ocean thermal expansion (Ehlert and Zickfeld, 2018; Widlansky et al., 2020) and glacier/ice cap melting (Alley et al., 2005) are already greater than that in any century over the past 3,000 years. In addition, it may be unlikely that this trend will reverse in the next century or millennium. This rapid increase in global sea level threatens to “sandwich” coastal regions (Zhang et al., 2004).
China has a long shoreline and large swathes of coast, which have had a long history of development and exploitation. As the shoreline of China had been stable or advancing toward the sea until the end of the 1950s, in the past, most coastal geomorphologists focused on the mitigation of siltation-induced problems. This changed during the end of the 1950s and the beginning of the 1960s. First, sandy beaches and shorelines began to erode; the sedimentary regime of major river deltas (e.g., the Yellow River and Yangtze River deltas) then experienced gradual transitions from rapid accretion to widespread erosion (Hou et al., 2016). Since then, erosion-induced shoreline retreat has become the main trend in the coastal regions of China (Luo et al., 2015).
The Shandong Peninsula is surrounded by the Bohai sea and the Yellow sea, its northern side faces the Liaodong Peninsula across the Bohai Strait, whereas its eastern side faces Korea across the Yellow Sea. The shoreline of Shandong is connected to Hebei in the north by the Dakou River estuary and Suzhou Province in the south through the Xiuzhen River estuary. From north to south, this shoreline passes through seven prefecture-level coastal cities, Binzhou, Dongying, Weifang, Yantai, Weihai, Qingdao, and Rizhao. With a length of 3,345 km, it is the 3rd longest shoreline in China and accounts for 18% of total shoreline length of China. The shoreline of the Shandong Peninsula is quite diverse as it includes rocky, sandy, silty, estuary, and artificial shores (Xu et al., 2009). Due to their geographic location and topography, coastal regions of Shandong are frequently affected by typhoons and cold front storms. In particular, Laizhou Bay and Bohai Bay are infamous for the severity and frequency of their storm surges. Although there are hundreds of rivers that flow into the sea from the Zhangweixin River that borders Hubei in the north and the Xiuzhen River bordering Suzhou in the south, most of these rivers are seasonal mountain streams. Therefore, runoff and sediment load from the Yellow River account for the vast majority of runoff and sediment load to Shandong. As Shandong has the third longest shoreline in China and diverse shore types, the intensification of coastal development and exploitation has resulted in drastic shoreline change (Gracia et al., 2018) and major changes in shore type (Yin et al., 2018) (Figure 1). As Shandong is a major marine economy, rapid development of its marine economy combined with natural factors have led to intense changes in its coastal environment (Xue et al., 2009), which also accelerate shoreline change. Thus, Shandong Peninsula is an ideal site for studies about the patterns and mechanisms of shoreline change (Li G. et al., 2013; Hegde and Akshaya, 2015). In this study, we analyzed the shoreline data of the Shandong Peninsula from 2007 to 2020, to characterize and quantify the behaviors and mechanisms of shoreline change in the face of global climate change and human disturbances.
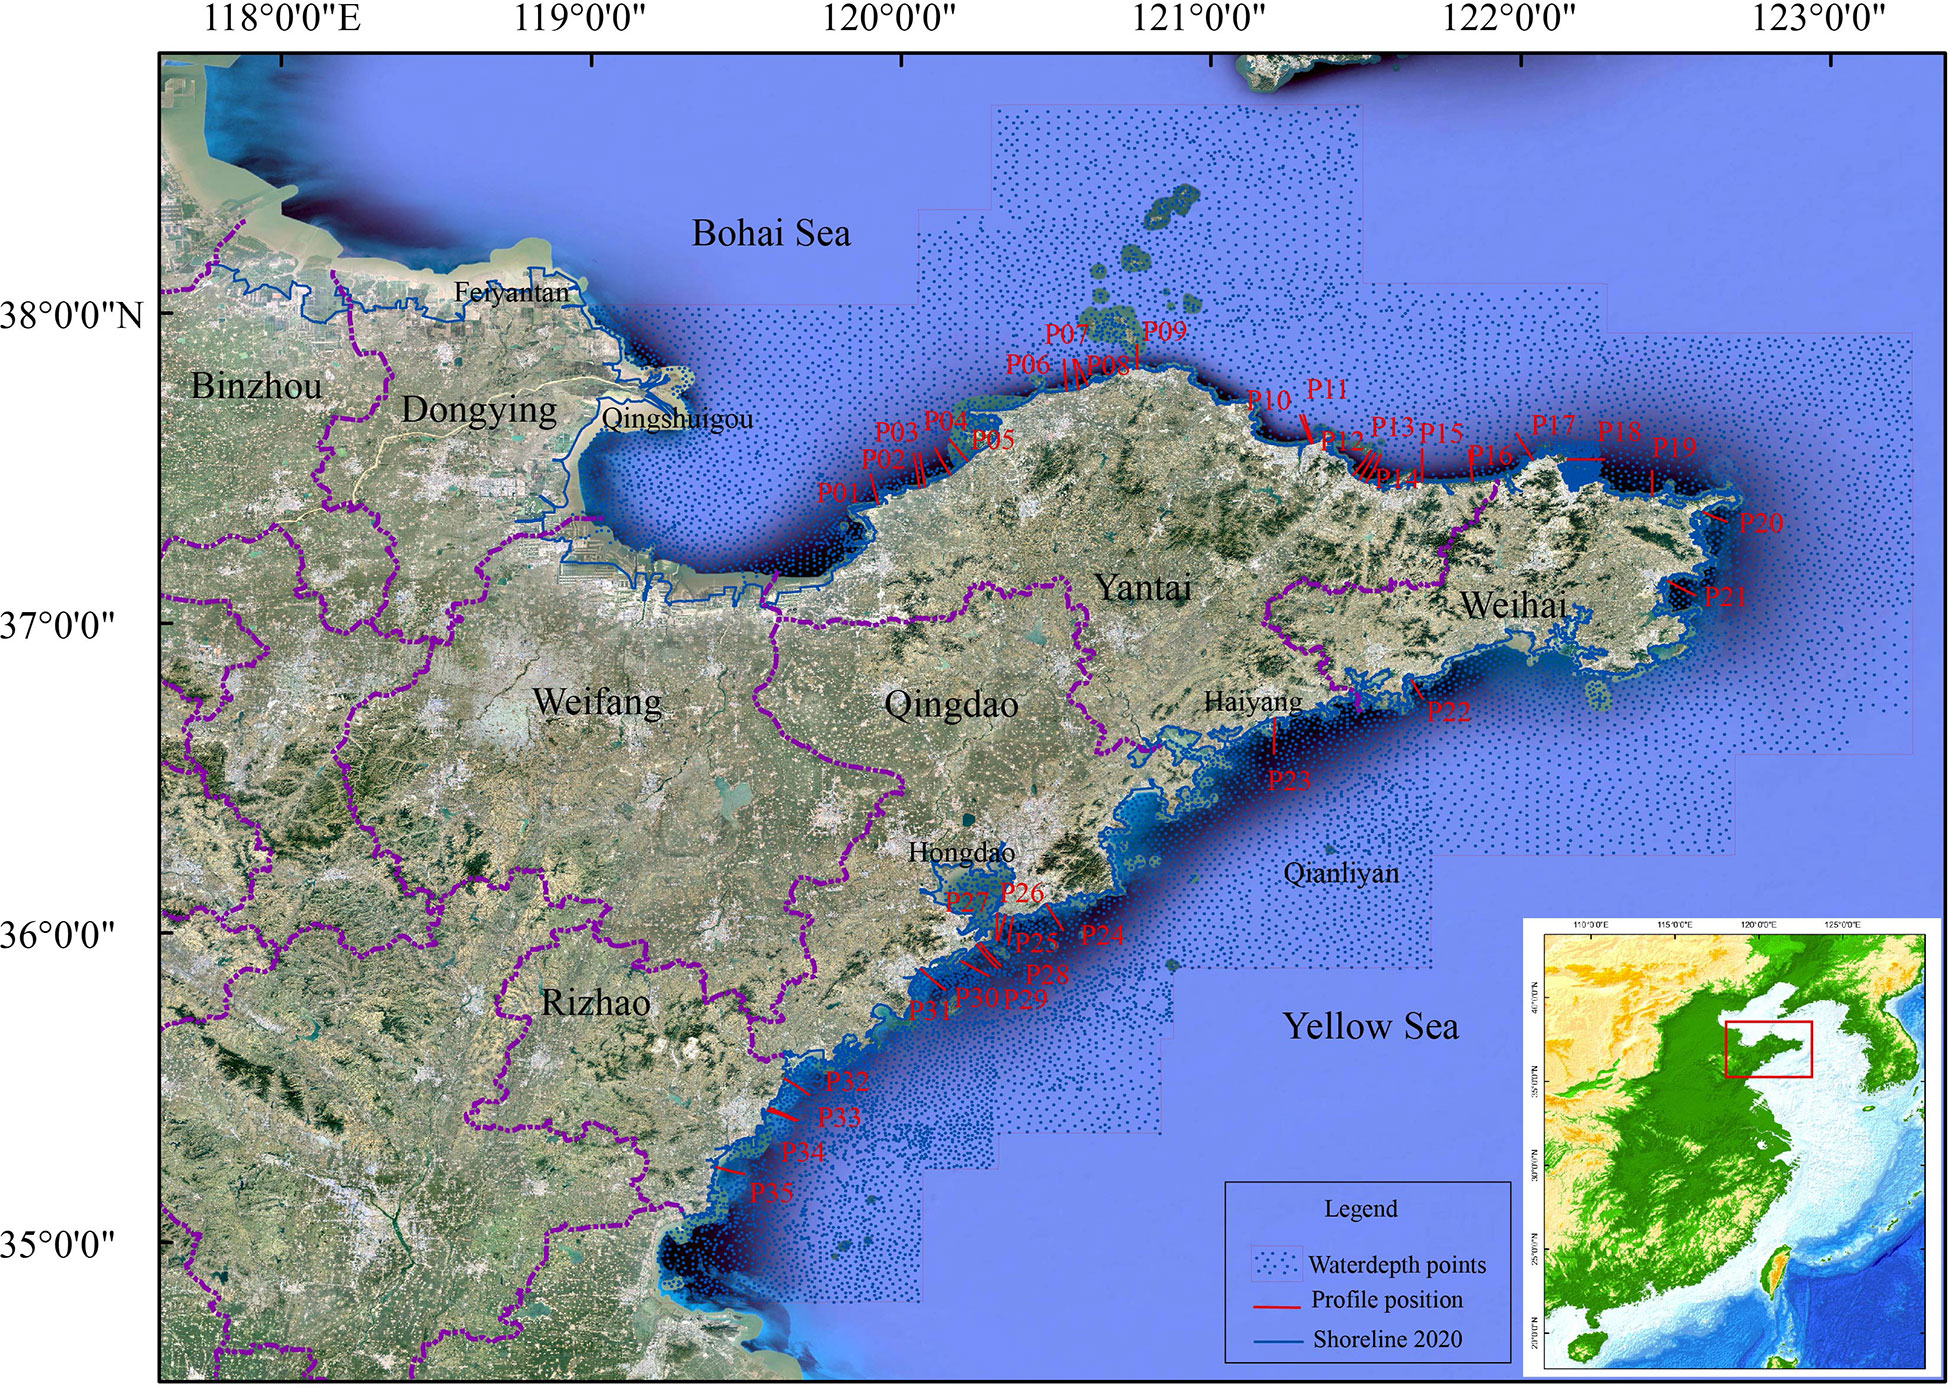
Figure 1 Location and satellite image of the Shandong Peninsula.
2 Data sources and methodology
2.1 Shoreline data and extraction
Satellite remote sensing is the most efficient way to quantify shoreline changes over large spaces and long timescales. In this study, images taken by the Ziyuan-3 Earth observation satellite were preprocessed and then fed into ArcGIS to extract and classify shoreline data. The multispectral data includes 4 bands of blue, green, red and near-infrared, with spatial resolution of 5.8m, the spatial resolution of panchromatic data and multispectral data is 2.1m (Dong et al., 2019). To classify and locate the various shore types (e.g., rocky, sandy, silty, estuary, or artificial), remote sensing indices based on color, texture, and feature adjacency were created based on the features of the coastal zone in satellite images and field surveys. These indices were then used for shore classification in synthesized false-color images constructed by combining the near infrared, red, and green bands (Zhang et al., 2021). The average high-water line was defined as the shoreline which the artificial and rocky shoreline were easy to identify. The sandy and silty shoreline were significantly affected by the tide, and the result of shoreline was generally the instantaneous waterline at the time of the remote sensing image acquisition, so it was necessary to determine the location of shoreline according to the correction of tide level at the time of satellite imaging (Yin et al., 2022). The shoreline in 2007 was the historical data, and part of the shoreline in 2020 was identified by remote sensing images taken from January to May of 2020, these remote sensing images were all calibrated by field measurement, and the error was limited to about 5m after the comparison between interpretation and actual measurement. In addition, an aerial drone (DJI Matrice 600 Pro hexacopter) was used to capture aerial images. Preliminary field surveys were conducted in advance to determine the range for drone observation. The drone was flown during the day according to predetermined routes at an altitude of 150 m, during the neap tide. Ground control points (five per km) were set up to facilitate calibration during the post-processing stage. Comparison of the control points with the datum points showed that the post-processed drone images had a horizontal precision >0.05 m and an elevation precision of 0.10 m. Finally, manual surveys were conducted at complex and typical shore sections, to determine and calibrate the interpreted shoreline location, in orders to ensure that the current state and historical changes in the shoreline were calculated accurately.
2.2 Analysis of land area change
In this study, land area change is identified as the change in coastal land area caused by changes in shoreline position. If the shoreline moves toward the sea (shoreline advancement), land area increases; if the shoreline moves toward the land (shoreline retreatment), land area decreases. Therefore, if the net change in coastal land area is positive, the shoreline is advancing toward the sea as a whole; otherwise, the shoreline is receding due to erosion. Land area changes were calculated by superimposing the shoreline from two different periods in ArcGIS and then performing a topology analysis to obtain polygons that represent the differences between these shorelines and their land areas. The nature of each polygon was then ascertained (i.e., whether it represents an increase or decrease in land area). Finally, the increases and decreases in land area were tallied to ascertain the net change in land area.
2.3 Analysis of shoreline change: the baseline method
Shoreline change was quantified using the Digital Shoreline Analysis System (DSAS) (Thieler et al., 2009; Himmelstoss et al, 2018). First, the buffer method was used to create a baseline that was roughly parallel to the shoreline. The shorelines from different periods were made to lie on the same side of the baseline. Equally separated perpendicular transects (transect (i)) were then drawn on the baseline so that the distance between two shorelines on a transect represented the shoreline change between their corresponding time points. The rate of shoreline change for a given period can be calculated by using a variety of models. In this study, the end point rate (EPR) method of Crowell et al. (1993) was used for this purpose (Figure 2), where the rate of shoreline change was defined as the perpendicular distance between two shorelines divided by their time difference. The sampling interval was 200 m, and a total of 10 819 transects were generated after multiple rounds of smoothing, fitting, and adjustment. EPR was estimated as follows:

Figure 2 Schema of the analysis of shoreline change by baseline method.
ere EPRm(i,j) are the rates of change in shorelines with i and j on the m-th transect; Dmi and Dmj are the distances between the baseline and the intersections of shorelines with i and j on the m-th transect, respectively; T is the time difference between i and j. The change rate (m/a) may be negative or positive values, which represent erosion and accretion respectively. A value of 0 indicates that the position of the shoreline remains unchanged. The thresholds for erosive, stable, and accreting shorelines are EPR ≤ −0.5 m/a, −0.5 m/a > EPR< 0.5 m/a, and EPR ≥ 0.5 m/a, respectively.
2.4 Erosion and accretion in inshore waters
Water depth data for 2007–2020 were standardized to the WGS84 coordinate frame, using ArcGIS, and the digital elevation model (DEM) was constructed using kriging and the TIN-to-raster method. Cross-validation was performed to ensure consistency between DEM and actual terrain. To characterize accretion/erosion in the inshore waters of the Shandong Peninsula, the differences between the 2007 and 2020 DEMs were extracted, and the cut-fill tool was used to obtain the accretion and erosion parameters (e.g., the areas of erosion/accretion, and net accreted/eroded volumes).
2.5 Sandy beach profile changes
In 2020, how beach changes in the profile view were evaluated in 25 typical sandy beaches at Shandong Peninsula by comparing the 2010–2020 profiles to the baseline profile in 2010 so as to quantify the erosion of sandy shorelines over the past 10 years. At shore segments where the changes in the sandy shoreline or a part of the shoreline were small, 35 beach elevation monitoring profiles were set up along the shoreline transect. The geodetic coordinates and elevation data of these sections were sampled at specific periods, using a high precision real-time differential positioning technique based on the Continuously Operating Reference Station (CORS) system. A map of beach profile changes was constructed, and the beach elevation changes were used to identify the trends of beach profile and shoreline change in the Shandong Peninsula.
3 Results
3.1 Shore-type changes
The total shoreline length of Shandong in 2007 was 3345.55 km, with artificial, rocky, sandy, silty, and estuarine shores accounting for 1292.23 km (38.62%), 888.55 km (26.56%), 759.08 km (22.69%), 401.57 km (12.00%), and 4.13 km (0.12%), respectively. In total, natural shoreline retention was 61.37%. The total shoreline length of Shandong in 2020 was 3310.18 km, with artificial, rocky, sandy, silty, and estuarine shores accounting for 2120.12 km (64.05%), 513.43 km (15.51%), 342.59 km (10.35%), 323.47 km (9.77%), and 10.56 km (0.32%), respectively. Natural shoreline retention was only 35.96%.
During 2007–2020, the total shoreline of Shandong decreased by 35.37 km to 3310.18 km, which corresponded to an annual change rate of −2.72 km/a. The decreases in rocky, sandy, and silty shorelines were 565.08 km, 245.65 km, and 58.98 km, equivalent to annual change rates of −43.47 km/a, −18.90 km/a, and −4.54 km/a, respectively. Artificial and estuary shorelines increased by 827.89 km and 6.43 km (change rates of 63.68 km/a and 0.49 km/a, respectively). During 2007–2020, not only did artificial shore account for the largest proportion of Shandong’s shoreline, but also it was the fastest growing shore type (Figure 3). Natural shoreline retention decreased by 25.41%.
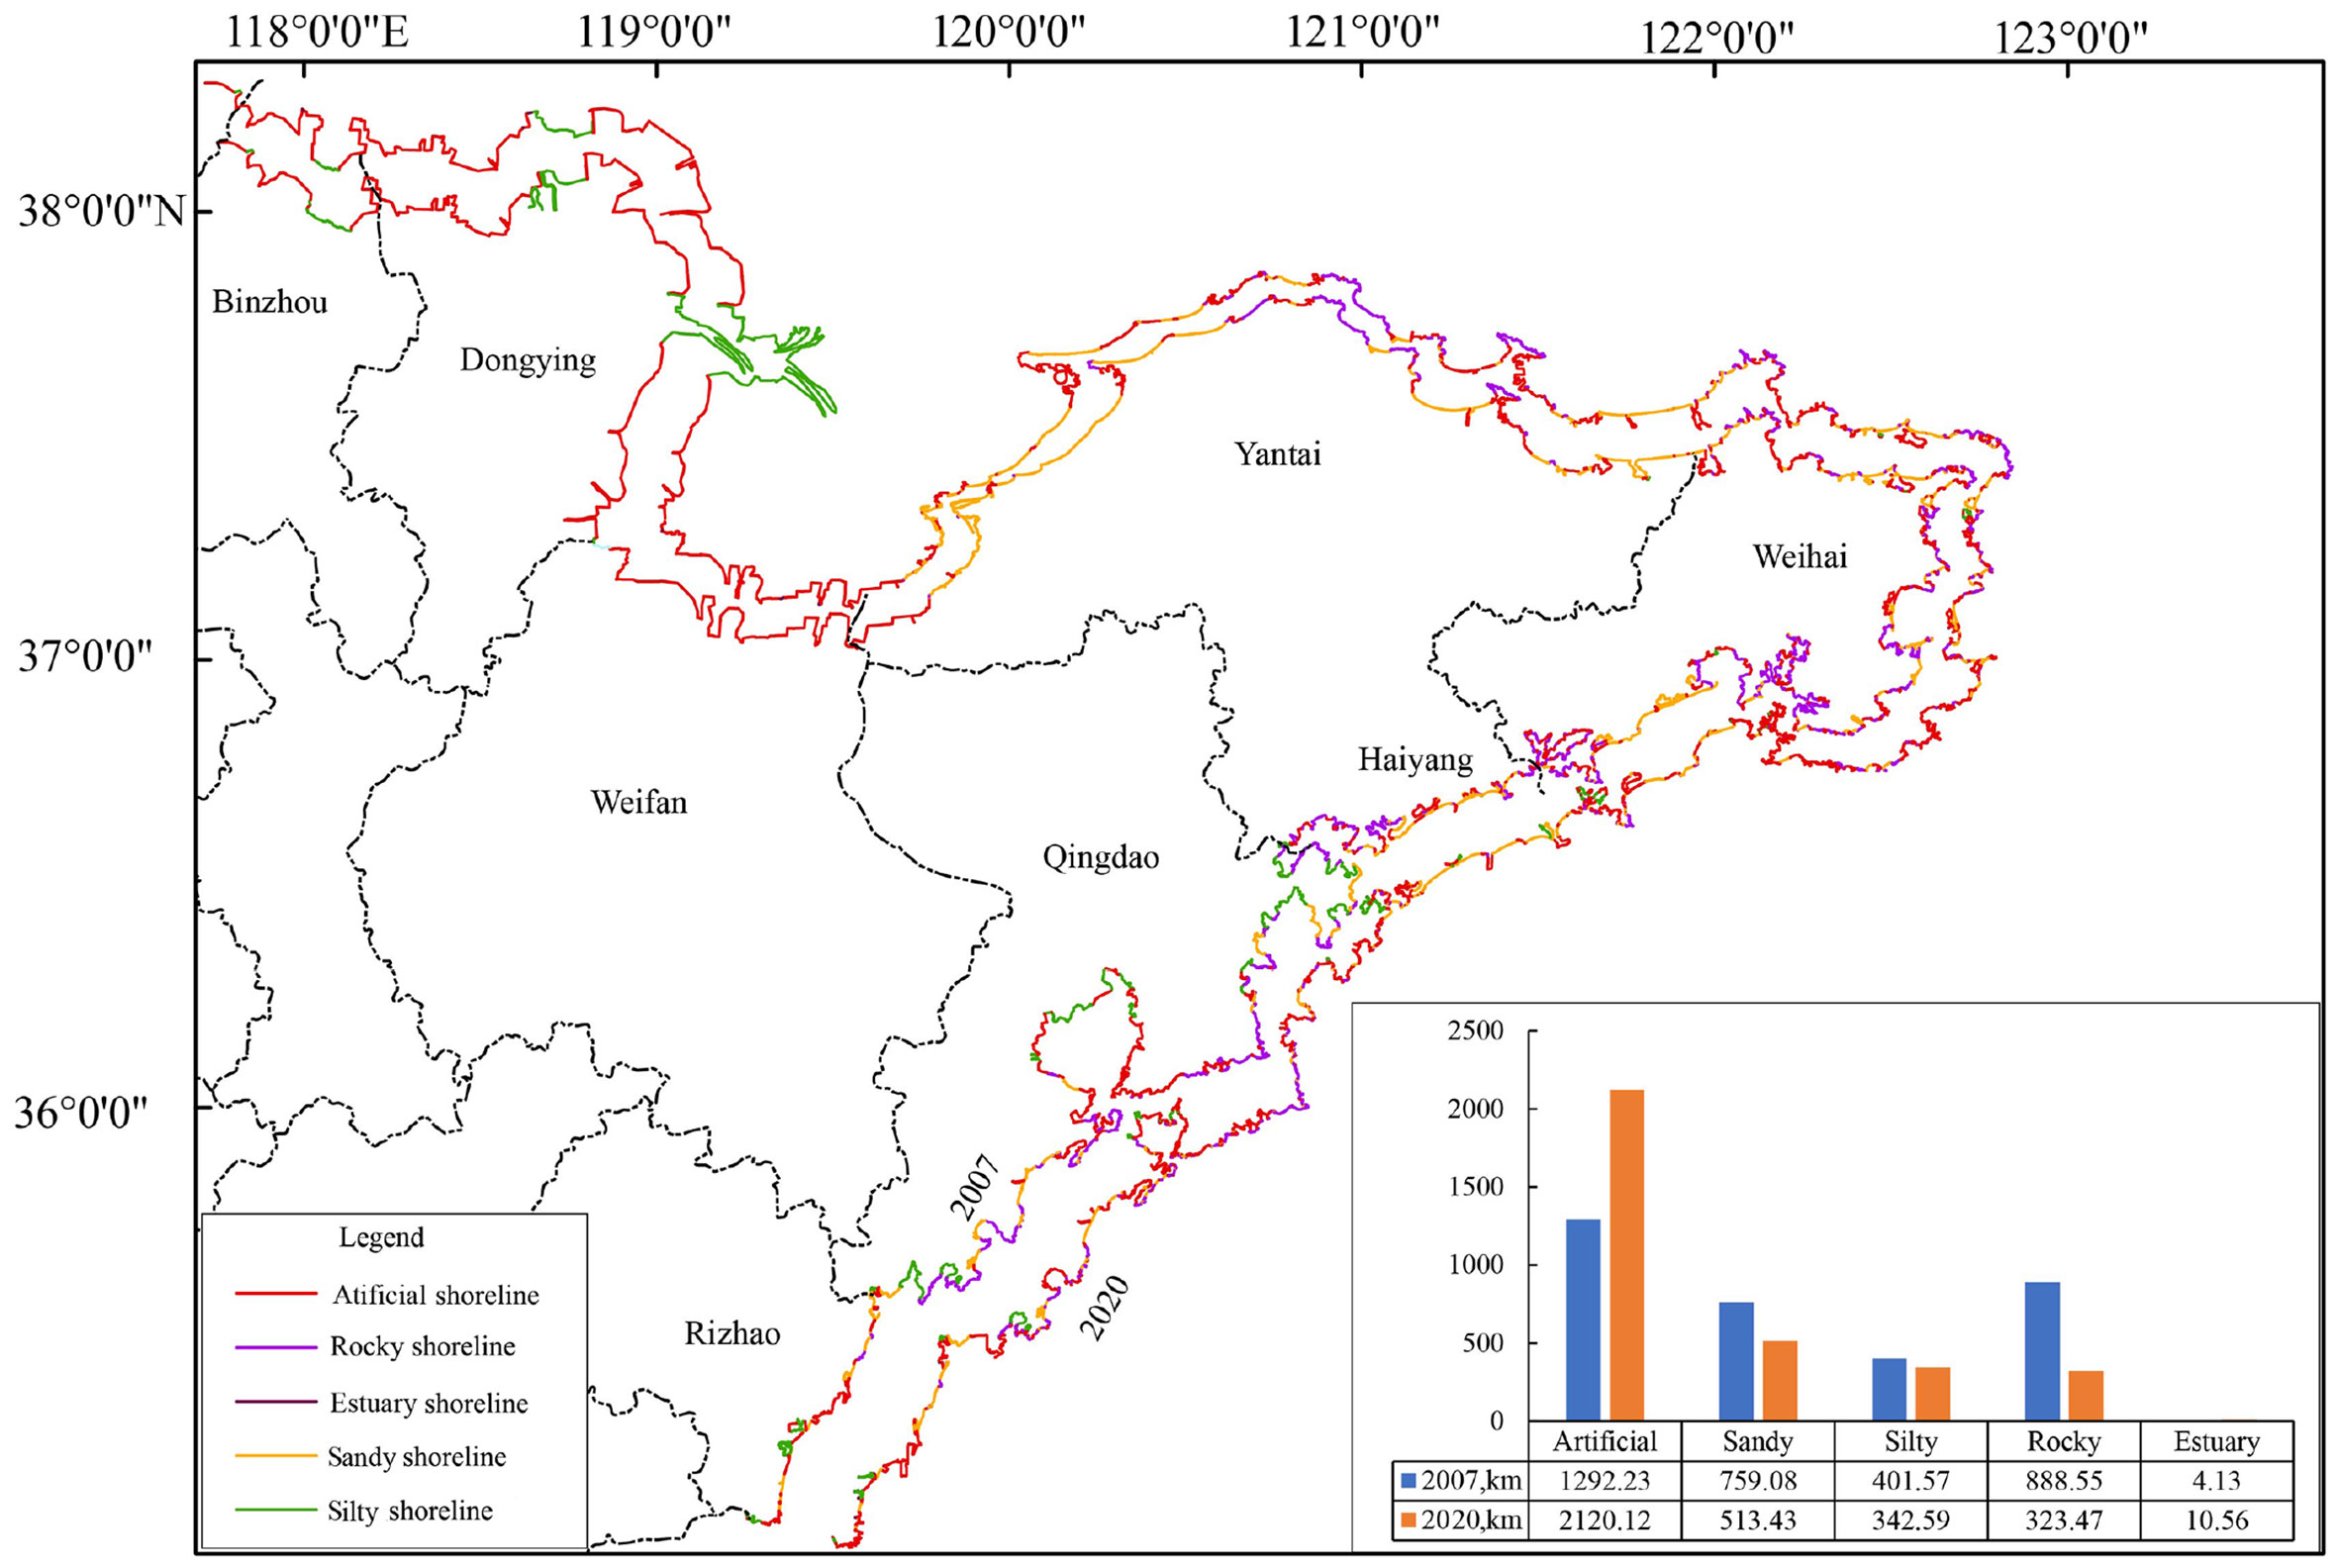
Figure 3 Type-classified shoreline lengths of Shandong in 2007 and 2020.
3.2 Rates of shoreline and land area changes
Analysis of shoreline change at the 10 819 transects revealed that the average rate of shoreline change in Shandong during 2008–2020 was 13.86 m/a, indicating an overall shoreline advancement (Figure 4). The 1,047 transects (9.68%) showed shoreline retreatment, with an average rate of −11.71 m/a. These transects were mainly located at sandy and silty shores. The largest retreat occurred near the Diaokou River mouth (northern part of the modern Yellow River delta), where the rate of shoreline retreatment was −142.32 m/a (2). The 3,033 transects (28.03%) showed shoreline advancement, with an average rate of 46.68 m/a. These transects were mainly located at newly constructed artificial shores and silty shores at large estuaries (1, 3–9) (Figure 5), such as the shores of Hongdao Island in Jiaozhou Bay (7) and the Qingshuigou channel of Yellow River (3). The 6,739 transects (62.29%) were stable, and the majority of these transects were located at artificial and rocky shores, such as the rocky shores of Laoshan District in Qingdao City and some artificial shores.
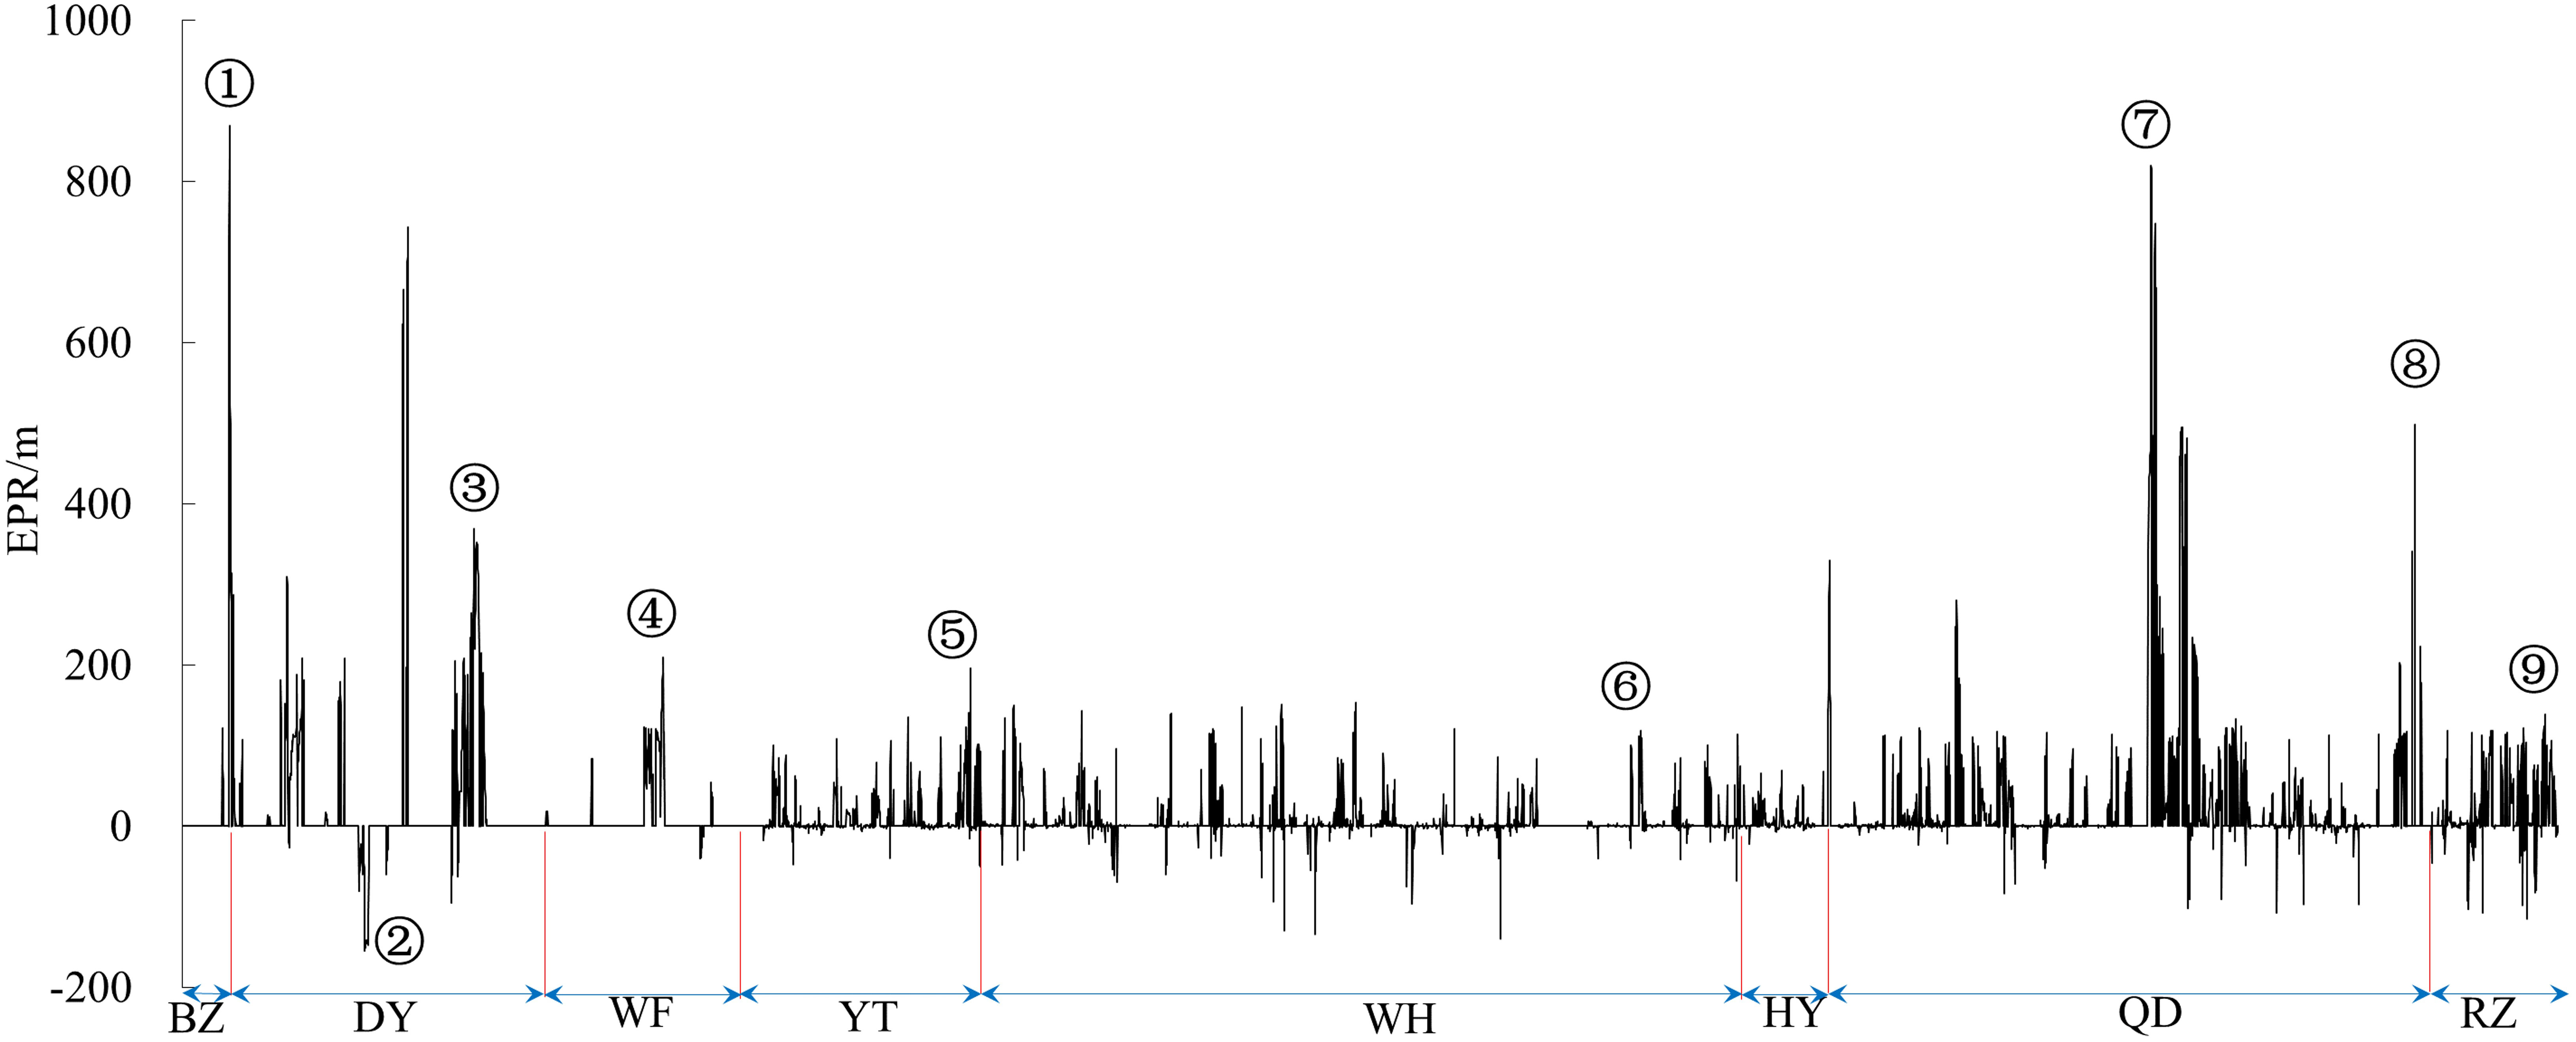
Figure 4 Shoreline changes in the Shandong Peninsula from 2007 to 2020.
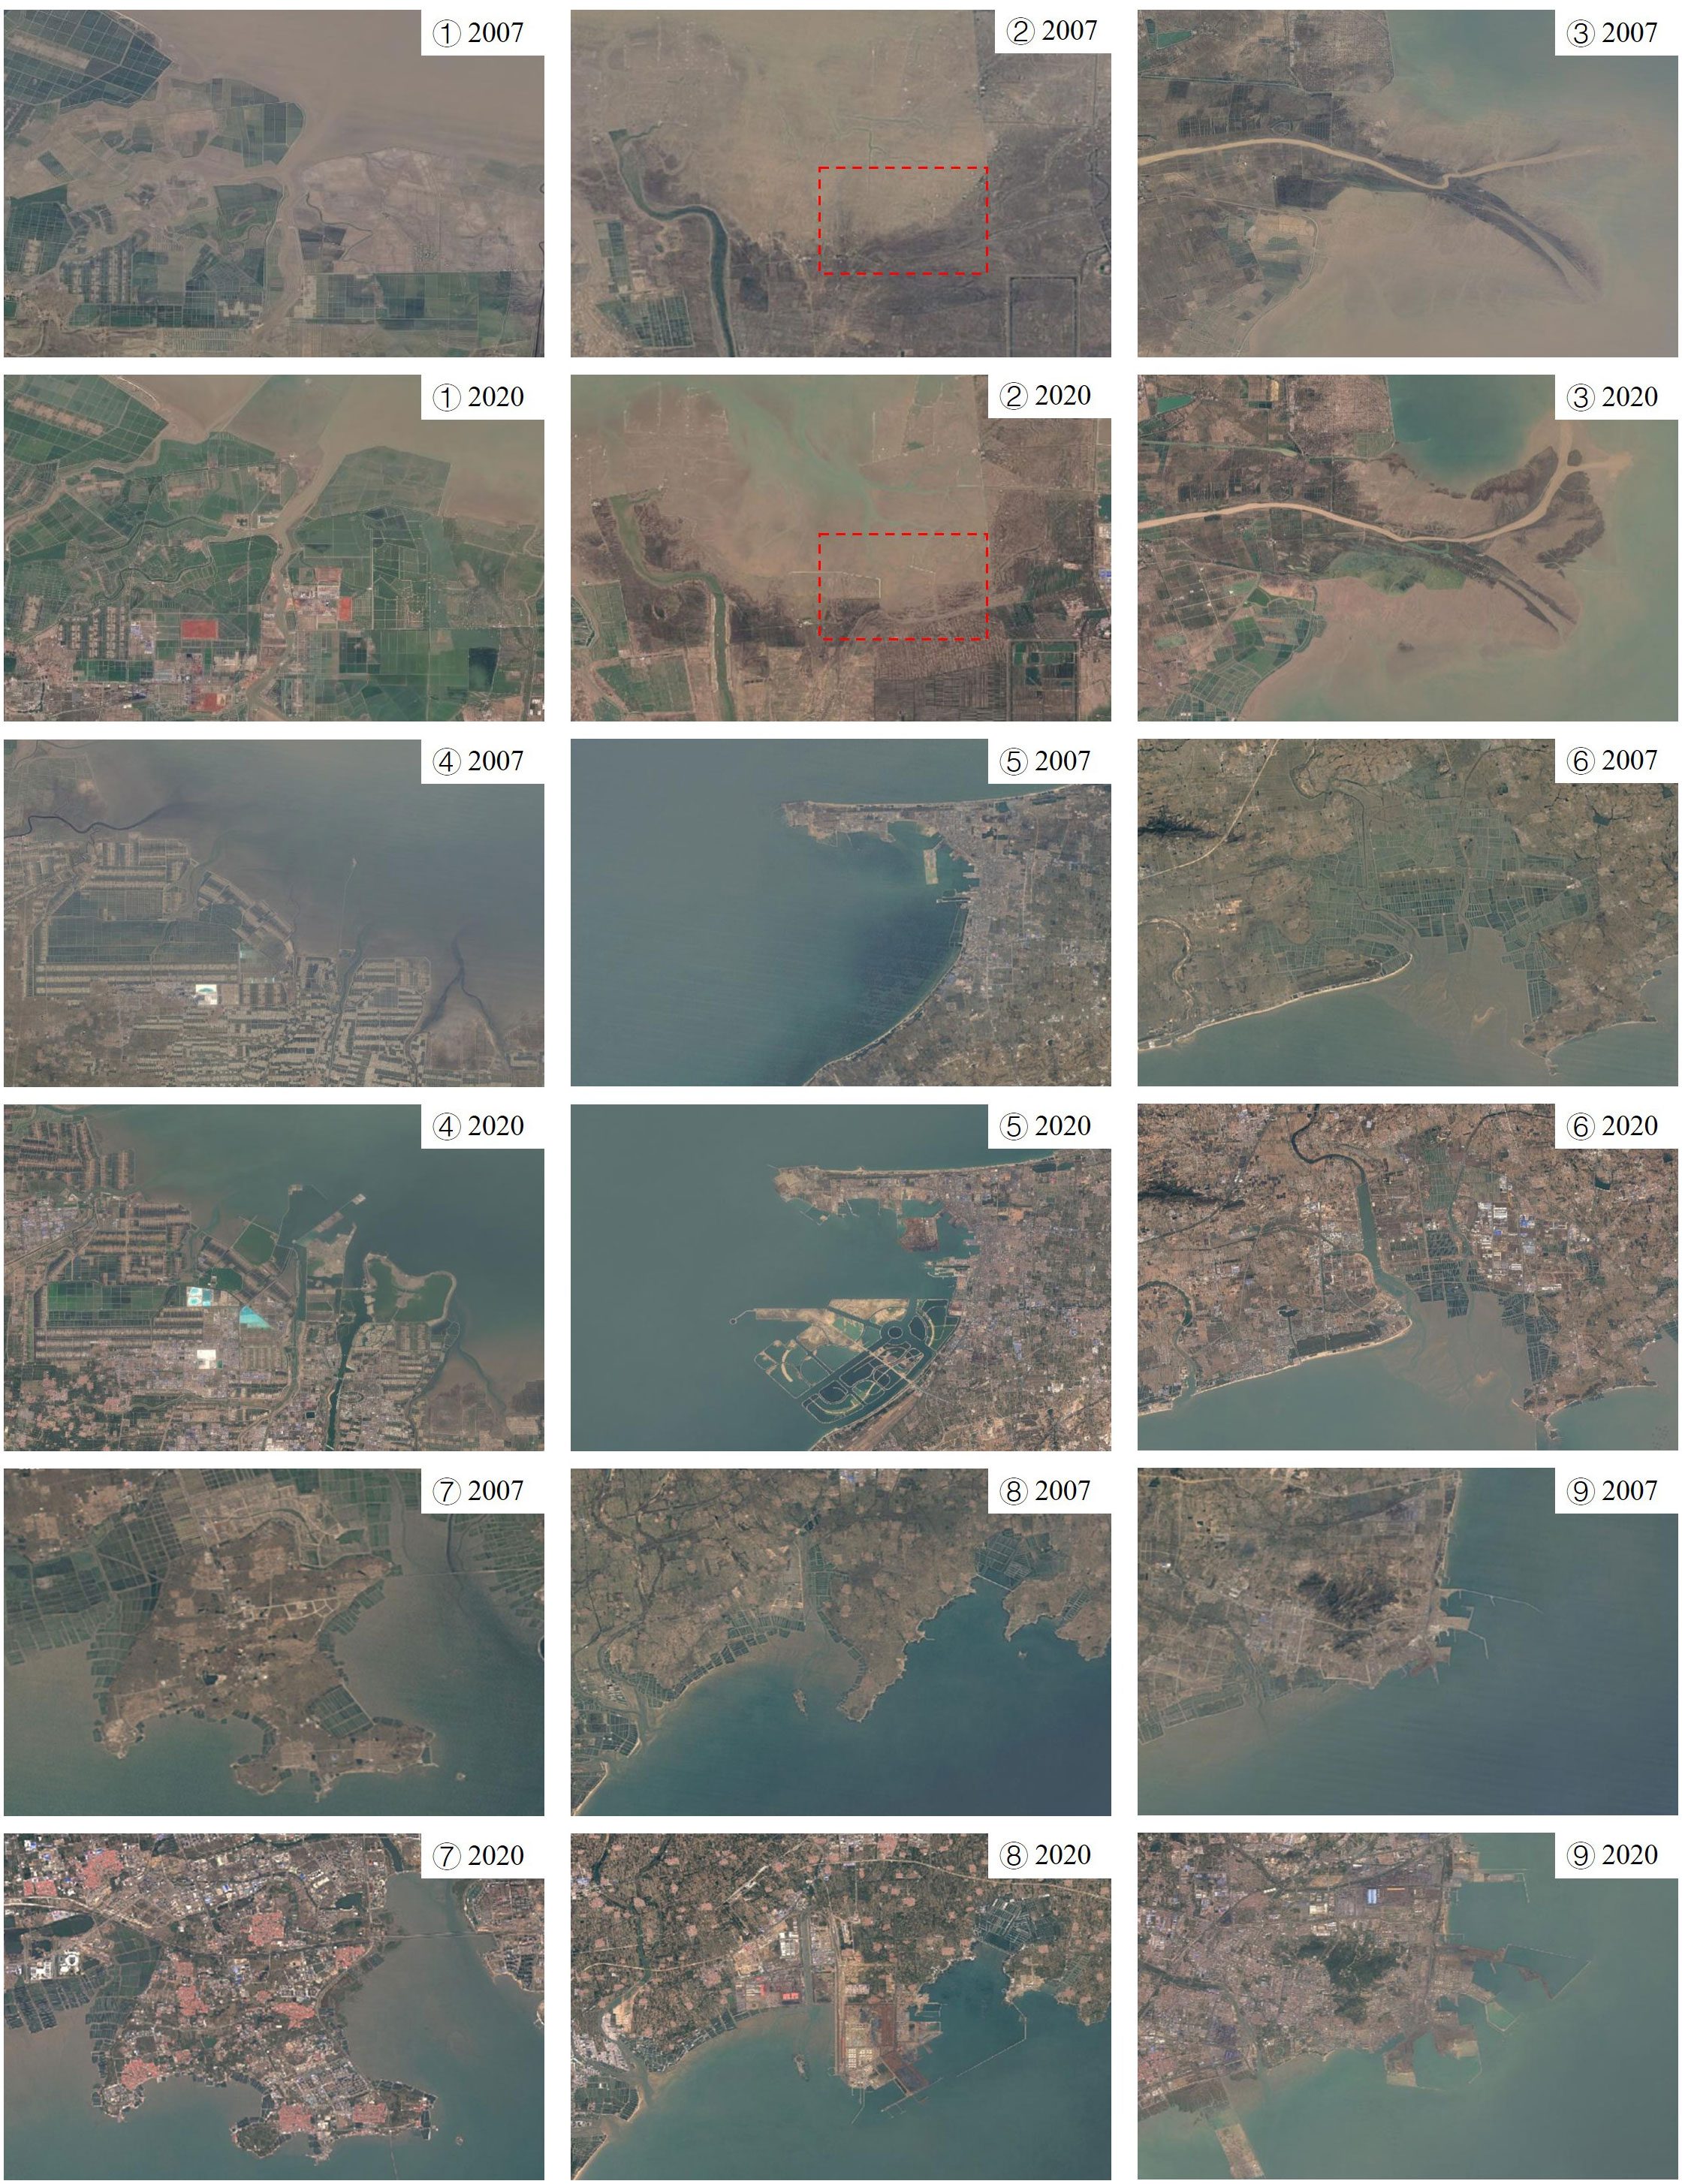
Figure 5 Remote sensing images showing typical examples of shoreline change for the period of 2007–2020.
The land area changes that corresponded to advancement and recession were 694.67 km2 and 22.27 km2, respectively, which amounted to a net increase of 672.40 km2 and a rate of land area change of 51.72 km2/a. The largest increase in land area occurred at the northern part of Jiaozhou Bay in Qingdao City, mainly due to land reclamation to join Hongdao Island to the mainland (7) (in Figure 6). Shoreline retreatment mainly occurred near the Feiyan Beach, at the northern part of the Yellow River delta (2) in (Figure 6); this was caused by the diversion of the Yellow River away from the Diaokou course, which led to continuous erosion in this area.
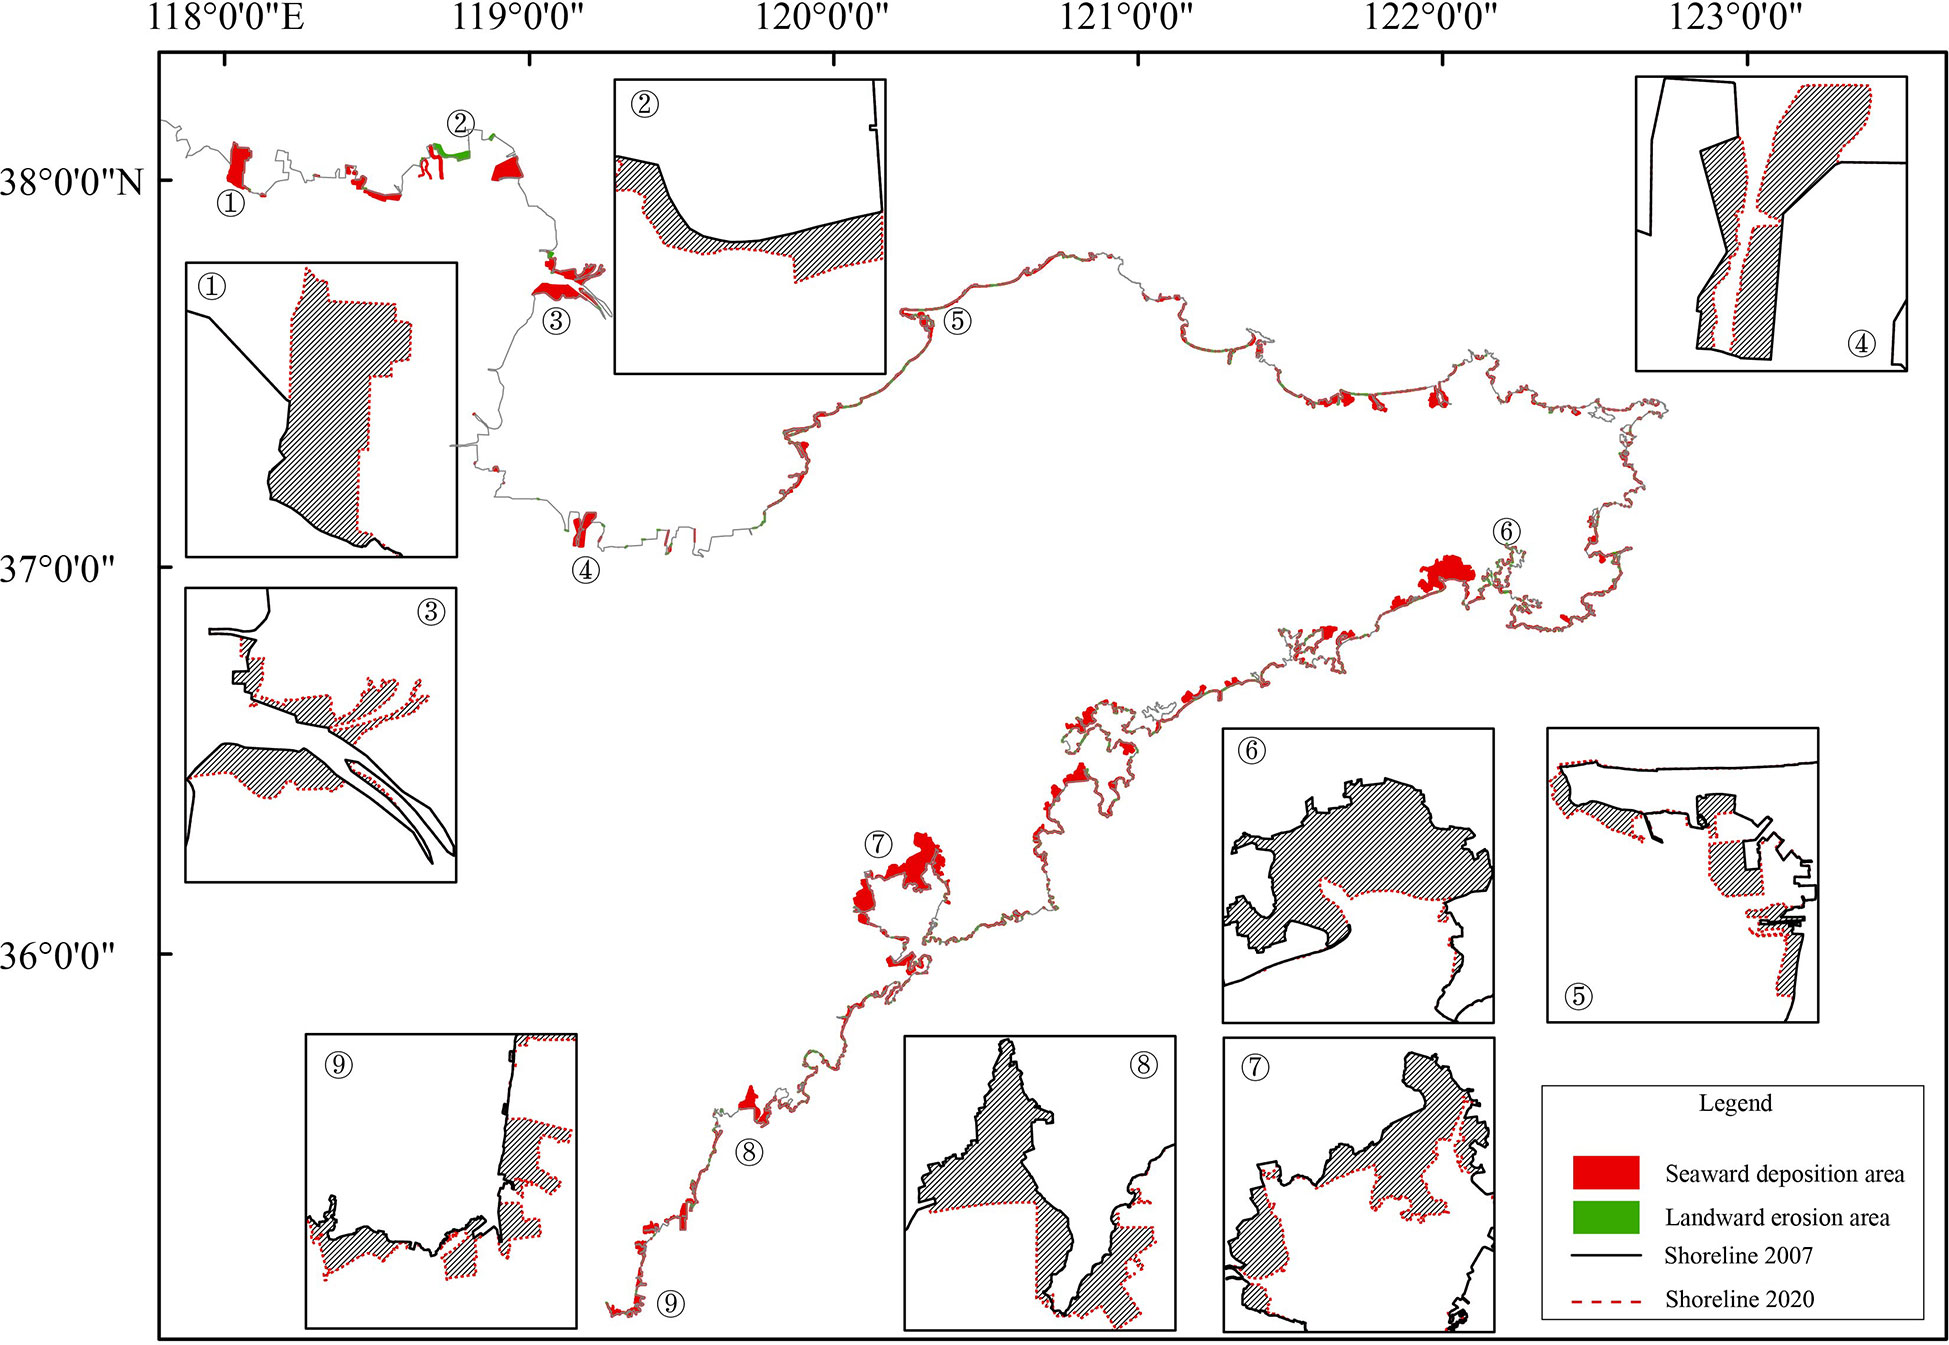
Figure 6 Land area changes in the Shandong Peninsula from 2007 to 2020.
3.3 Inshore erosion and accretion
The inshore area of the Shandong Peninsula was accretionary overall, and the isobaths of the accretionary zones also exhibited a significant seaward advancement (Figure 7). Accretion was most intense in the north but somewhat less pronounced in the east and south as there were many areas that were in equilibrium in those regions. The areas that were in equilibrium did not exhibit considerable changes in their underwater terrain. The inshore area with the widest area of accretion and with the largest amount of accretion was the western side of Laizhou Bay, which showed an area of accretion of 6.59 × 10⁸ m2, a volume of accretion of 3.8 × 10⁸ m3, and a net volume of accretion of 2.13 × 10⁸ m3. The area with the highest accretion values was the inshore area of Chengshantou, with a maximum accretion value of 17.9 m. Inshore erosion only occurred in hotspots. These hotspots were mainly located near artificial coastal structures, such as harbors, or areas with strong hydrodynamics where they occur alongside accretion zones. The largest area of erosion was located between Taozi Bay and Yangma Island, where the volume of erosion was 0.10 × 10⁸ m3 (Table 1).
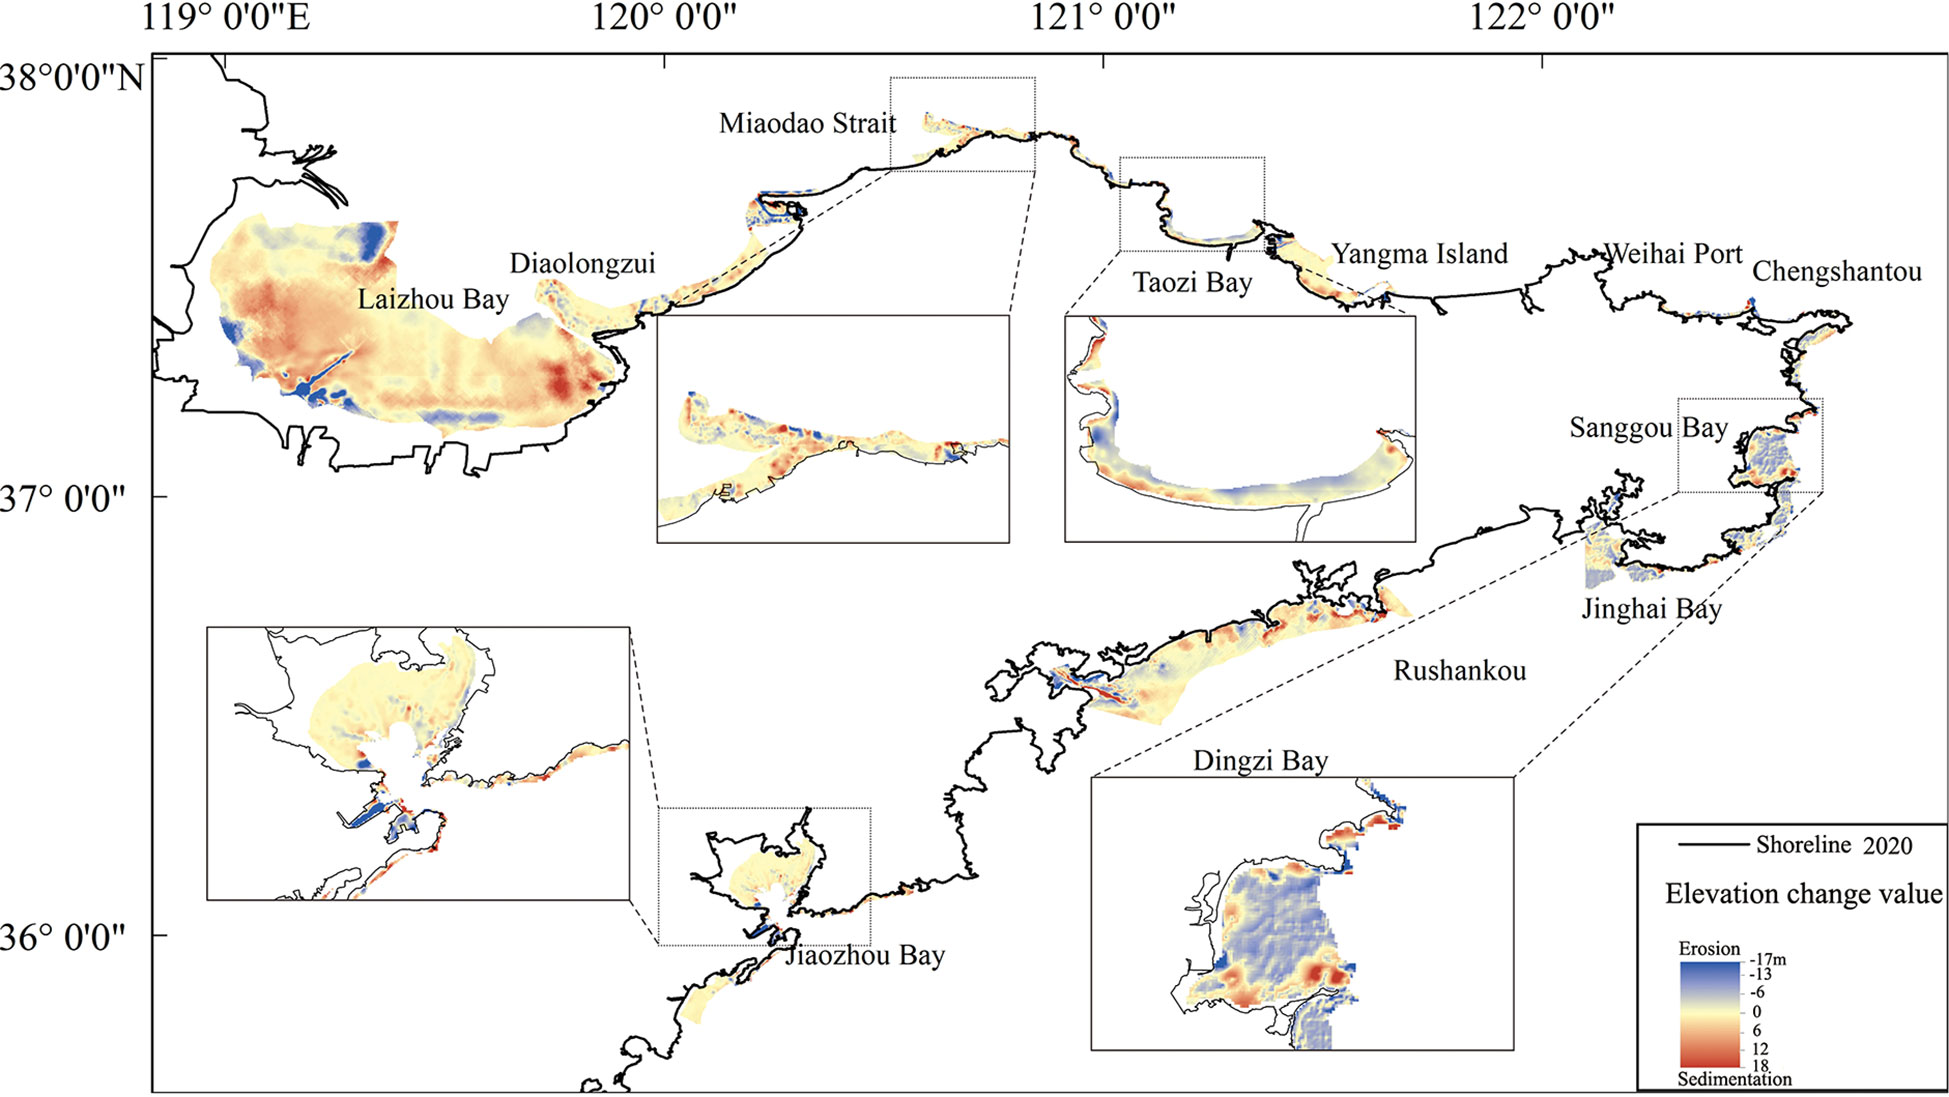
Figure 7 Map of erosion and accretion in the inshore waters of Shandong for the period of 2007–2020.
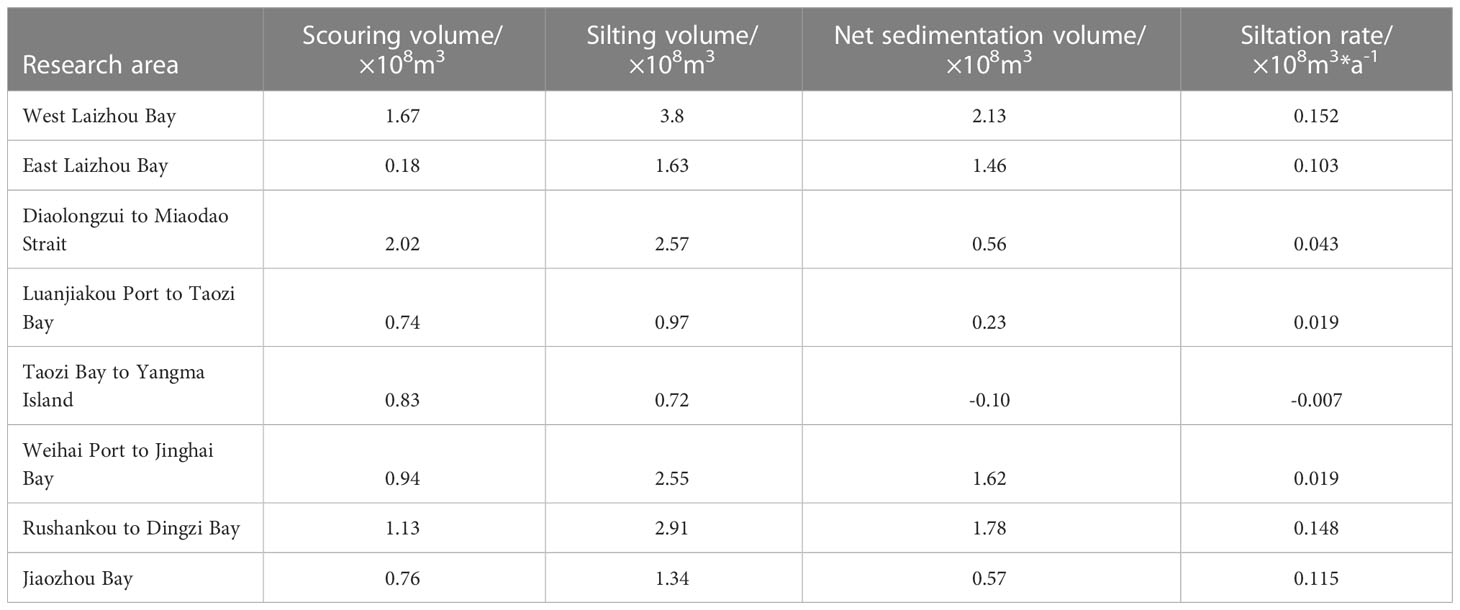
Table 1 State of erosion/accretion in typical inshore areas.
3.4 Changes in sandy shorelines
Although Shandong has many beaches that have been accretionary since the Holocene, they are eroded to date. According to a survey in 2010, the shoreline of the Shandong Peninsula had 123 beaches with a cumulative length of 366 km (approximately accounting for 1/9 of the total shoreline of the peninsula). Among the 25 typical sandy beaches, 19 beaches were eroded between 2010 and 2020. Only 5 beaches were accretionary, and 1 beach was stable. Their rates of retreat were approximately −1.0 m/a, and the rate of vertical erosion varied between −0.06 m/a and −0.10 m/a. 76% of the sandy beaches in Shandong were eroded, indicating that they were predominantly erosive (Table 2).
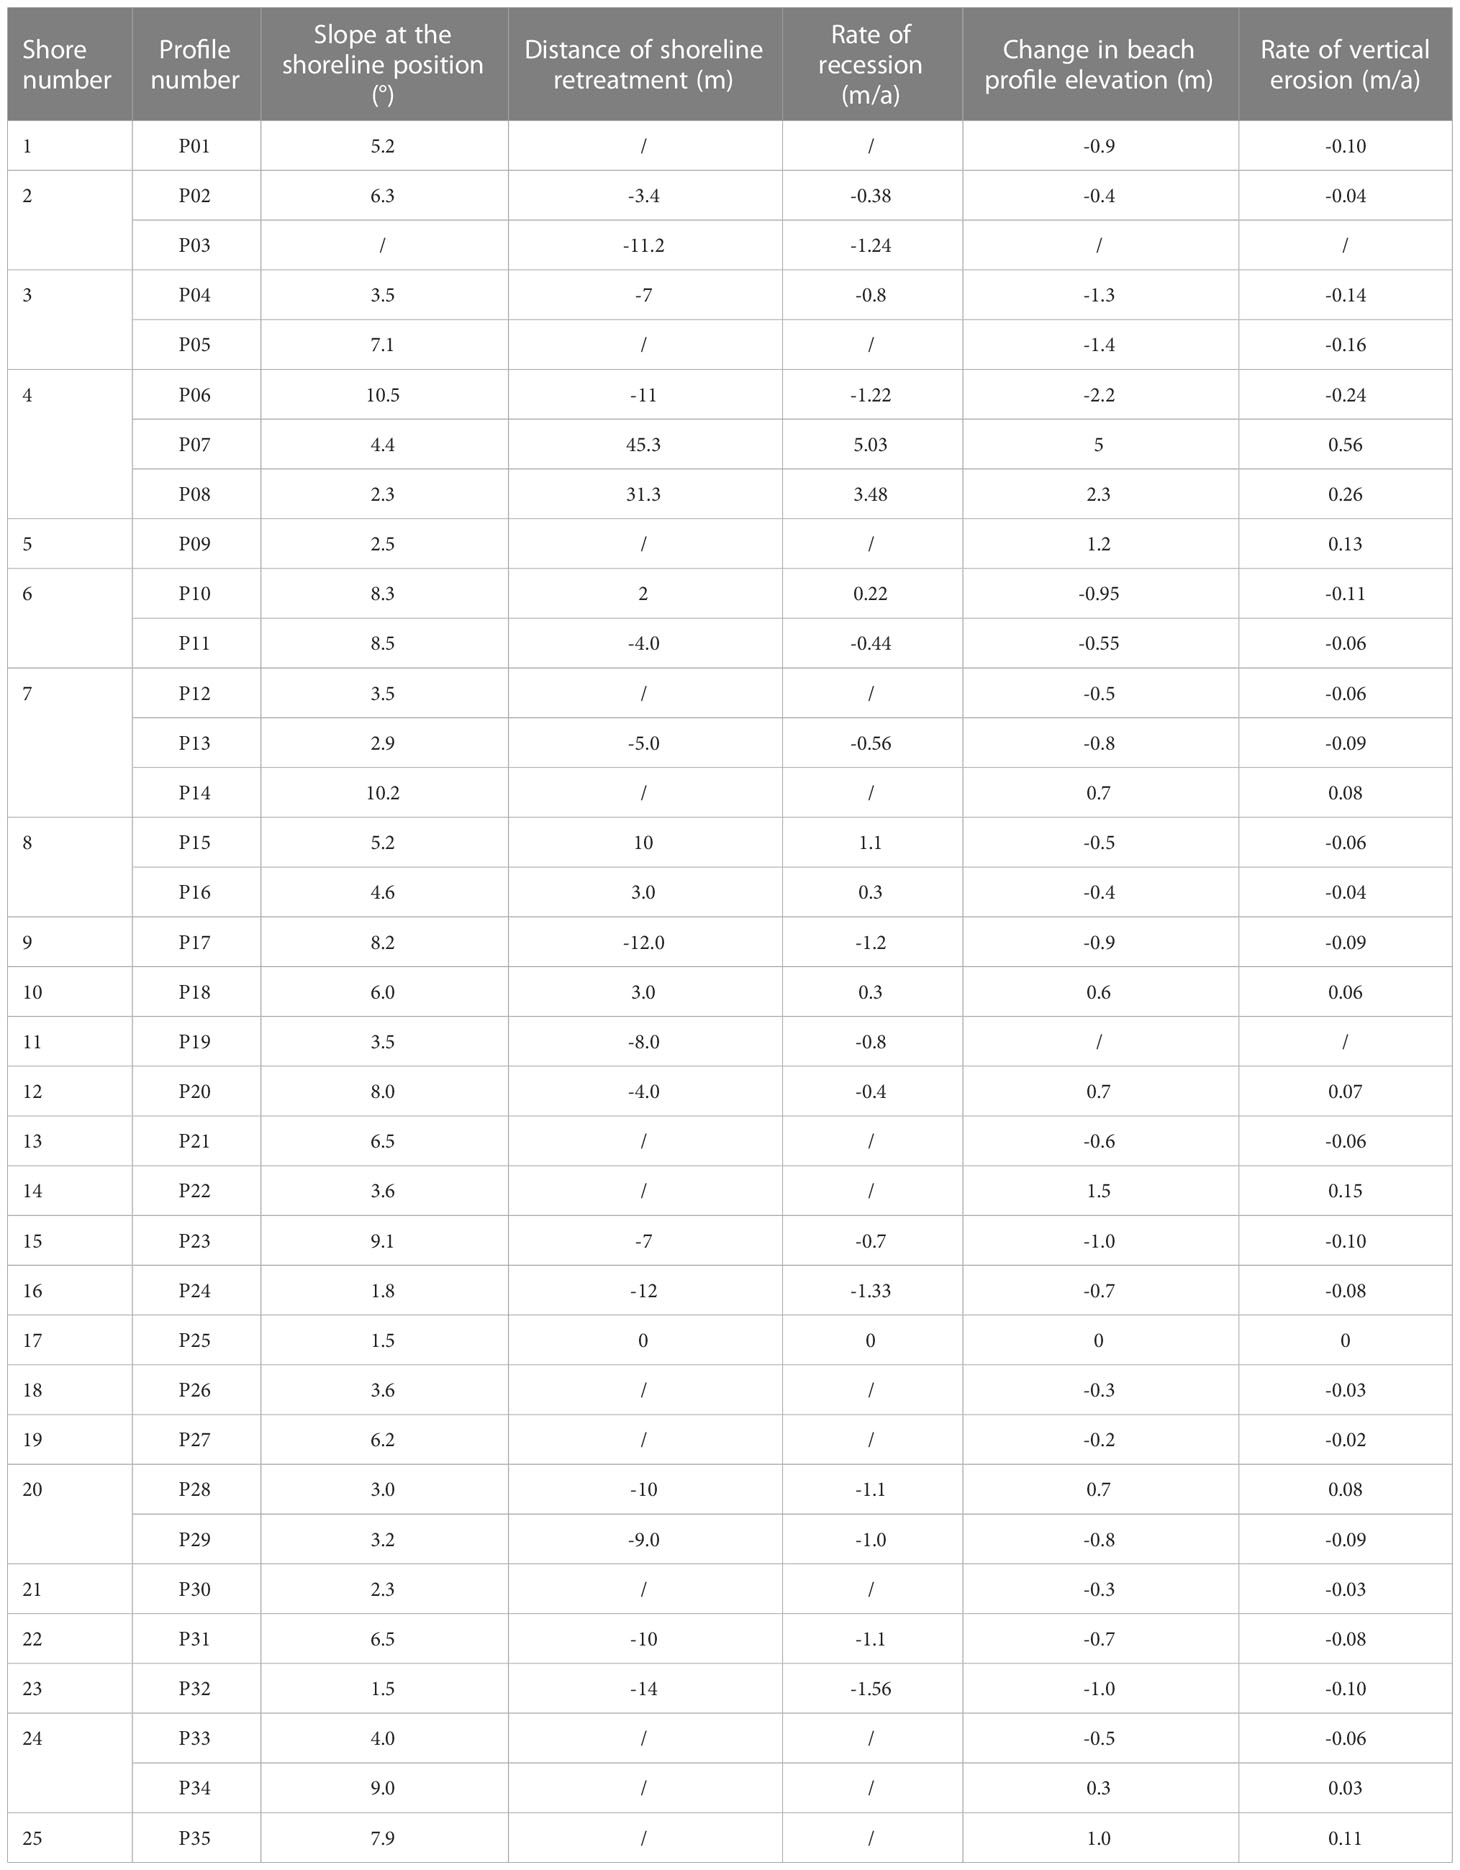
Table 2 Erosion of sandy shores on the Shandong Peninsula.
4 Discussion
4.1 Shoreline change in association with global climate change
4.1.1 Effects of sea level rise
Based on the extensive spatiotemporal observations of the global climate system and numerous indicators, there is little ambiguity that global warming is ongoing. Sea level rise has accelerated over the past 25 years in response to the global warming. Coastal sea levels around China also rise with accelerated rates over the last four decades, and the risk posed by sea level rise to coastal regions in China is amplified by the rapid urbanization. The coastal sea levels of China rise at a rate of 3.4 mm/a, higher than the global average. Furthermore, the average coastal sea level of China over the past decade is at its highest level in the last 40 years. Although shoreline change is driven by many factors, there is a direct relation between shoreline change and sea level change (Athanasiou et al., 2020). On the shoreline of the Shandong Peninsula, stabilized artificial shores, rocky shores, and estuaries (whose topography is mainly determined by riverine sediment) are generally insensitive to sea level change. However, sandy shores are the most fragile type of shore as their topography and morphology are extremely prone to sea level change (Castelle et al., 2018). Therefore, the behaviors of the sandy shoreline can serve as an accurate indicator of ecosystem responses to sea level rise. Bruun’s rule can be used to detect the shoreline retreatment due to sea level rise (Bruun, 1988). However, Bruun’s rule does not account for a variety of factors, including longshore transport and other sources of sediment (Cooper and Pilkey, 2004; Mariotti and Hein, 2022). Nonetheless, it still remains an adequate “rule of thumb” for the analysis of the effects of sea level rise on shoreline change. Bruun’s rule is expressed as follows:
where R is the distance of shoreline retreatment due to sea level rise; h is the depth of closure; L is the horizontal distance between the shoreline and h; B is the dune height above sea level; and S is the sea level rise. Note that tan θ = (B + h)/L, where θ is the slope of the beach.
According to the field measurements, the slope of the shoreline position varied between 3° and 10° in the Shandong Peninsula. Therefore, tan θ = 0.05 – 0.18. Since S = 3.4 mm/a, Bruun’s law gave R values of 0.02–0.07 m. Given that the sandy shoreline had an average recession rate of 1.0 m/a, it may be estimated that the recession caused by sea level rise was relatively small. Hence, sea level rise has only played a very small role in the shoreline changes in the Shandong Peninsula.
4.1.2 Effects of extreme weather
In addition to sea level rises, global warming also increased the frequency and intensity of extreme weather events (e.g., tropical typhoons and storms). Global warming increased the latitudinal temperature gradient between the Western Pacific and Central and Eastern Pacific, which has amplified the vertical shear and relative turbulence of Pacific Northwest windstorms. This, in turn, has affected the spatiotemporal patterns of tropical cyclone activity in the Northwest pacific and brought the entirety of the cyclone lifecycle closer to East Asia. In this regard, the frequency and intensity of tropical cyclones likely further increase in the future (Gu et al., 2016). As the Shandong Peninsula is surrounded on three sides by the sea and has a long and winding shoreline, its shoreline is highly susceptible to hydrological and climatic extremes. Furthermore, an average of 1.1 typhoons made landfall in Shandong each year. Cyclone-induced waves are among the most significant drivers of beach morphology changes (Qi et al., 2010). Storm surges, which can overlap with tidal processes, also play a significant role in shoreline change. Therefore, we studied the beach profile of Wanmi Beach in Haiyang City after Typhoon Lekima passed over Shandong in August 2019, to analyze the effects of extreme weather events on the shoreline (Robinet et al., 2018).
According to tidal data from Qianli Yan station, situated near Haiyang, the average and maximum surge heights when Typhoon Lekima passed through were > 50 cm and 75 cm, respectively. Based on the path of Typhoon Lekima, it was deduced that the typhoon’s counter clockwise rotation intensified the impact of southeasterly winds on Wanmi Beach and caused onshore winds to dominate during the typhoon. The typhoon created waves directly struck the beach and caused severe erosion. During the typhoon incident, the storm surge combined with the high tide induced rapid rise in water level, which severely eroded the upper part and foreshore of the beach face. The increase in water level also lifted the underwater surface of the beach, which reduced beach seepage and caused large amounts of beach sediment to be washed into inshore waters. Therefore, typhoons often cause severe beach erosion in a very short time. In the monitored beach area, the shoreline retreated greatly after the typhoon, up to distances greater than 10 m. It was estimated that the passage of Typhoon Lekima caused 2.43 × 10⁴ m3 of erosion (Gao et al., 2020), this is almost equal to the cumulative erosion that occurred over an entire year under normal hydrodynamic conditions as the erosion at Wanmi Beach between 2018 and 2019 was 2.48 × 10⁴ m3. Although the beach recovered after the typhoon, the damage caused to the foreshore and coastal dunes could be permanent or take a long time to be mitigated; this is one of the major causes of sandy shoreline retreatment in this region. Therefore, even against a backdrop of widespread erosion in sandy shorelines, extreme weather events, such as typhoons, are gradually becoming the important cause of shoreline retreatment in natural shores (e.g., unstable sandy shores).
4.2 Shoreline change in association with human activities
Evolution of the coastal zone in history has proven to be jointly controlled by marine, terrestrial, and atmospheric factors. More recently, however, human activities have also begun to affect the coastal zone. Since the industrial revolution, human-induced influences on the coastal zone have exceeded natural ones in terms of intensity, extent, and rate. Thus, human activities can be considered as “a third driving force” that is inferior only to the Sun and the Earth’s internal energy (Xu et al., 2014). Due to the rapid development of coastal economies on the Shandong Peninsula, the degree of shoreline exploitation, which can be represented by the length of artificial shoreline, has increased. The proportion of artificial shoreline increased from 38.63% in 2007 to 64.04% in 2020.
Due to the seaward sediment load of the Yellow River, the shores on the northwestern part of the Shandong Peninsula (Binzhou, Dongying, and Weifang) are dominated by silty shores. The remainder of the shoreline (Yantai, Weihai, Qingdao, and Rizhao) alternates between rocky and sandy shores. Silty shores have shallow inshore waters and flat tidelands, and their dominant human activities are land reclamations, such as farming (Binzhou and Dongying) and salt evaporation ponds (Weifang). As these activities cause the shoreline to advance toward the sea in parallel with the original shoreline, they only cause small changes in shoreline length even when the land area is expanded greatly. Rocky shores have deep inshore waters and are relatively stable (Swirad et al., 2020). As these shores are an important part of the Binhai Scenic Area, the rocky shores in and around this area are generally well-preserved. These deep inshore waters are also conducive to the development of harbors, which are intensifying at an accelerating pace. Particularly, in various places such as Qingdao and Rizhao, rocky shores were converted to harbors and factories (i.e., artificial shore), which in turn cause the shoreline to advance toward the sea (Figure 8). As sandy shores are valued for their scenic characteristics, they are mainly used as tourist attractions. Therefore, the sandy shoreline mainly consists of preserved natural shoreline and artificially stabilized shoreline. However, the equilibrium between sediment sources and the hydrodynamic environment in the coastal zone has been disrupted by the continuous advancement of other shore types, which causes shoreline retreatment and vertical erosion at sandy shores. The artificial diversion of the Yellow River from the Diaokou course to the Qingshuigou course in 1976 caused sediment accretion around the river mouth, as well as advancement of nearby shorelines toward the sea. Shoreline retreatment is extremely severe at the Feiyan Beach (northern part of the Yellow River Delta) due to the loss of sediment supply from the Yellow River and the intense hydrodynamic actions of the Bohai Sea (Zhang et al., 2016; Zhang et al., 2019).
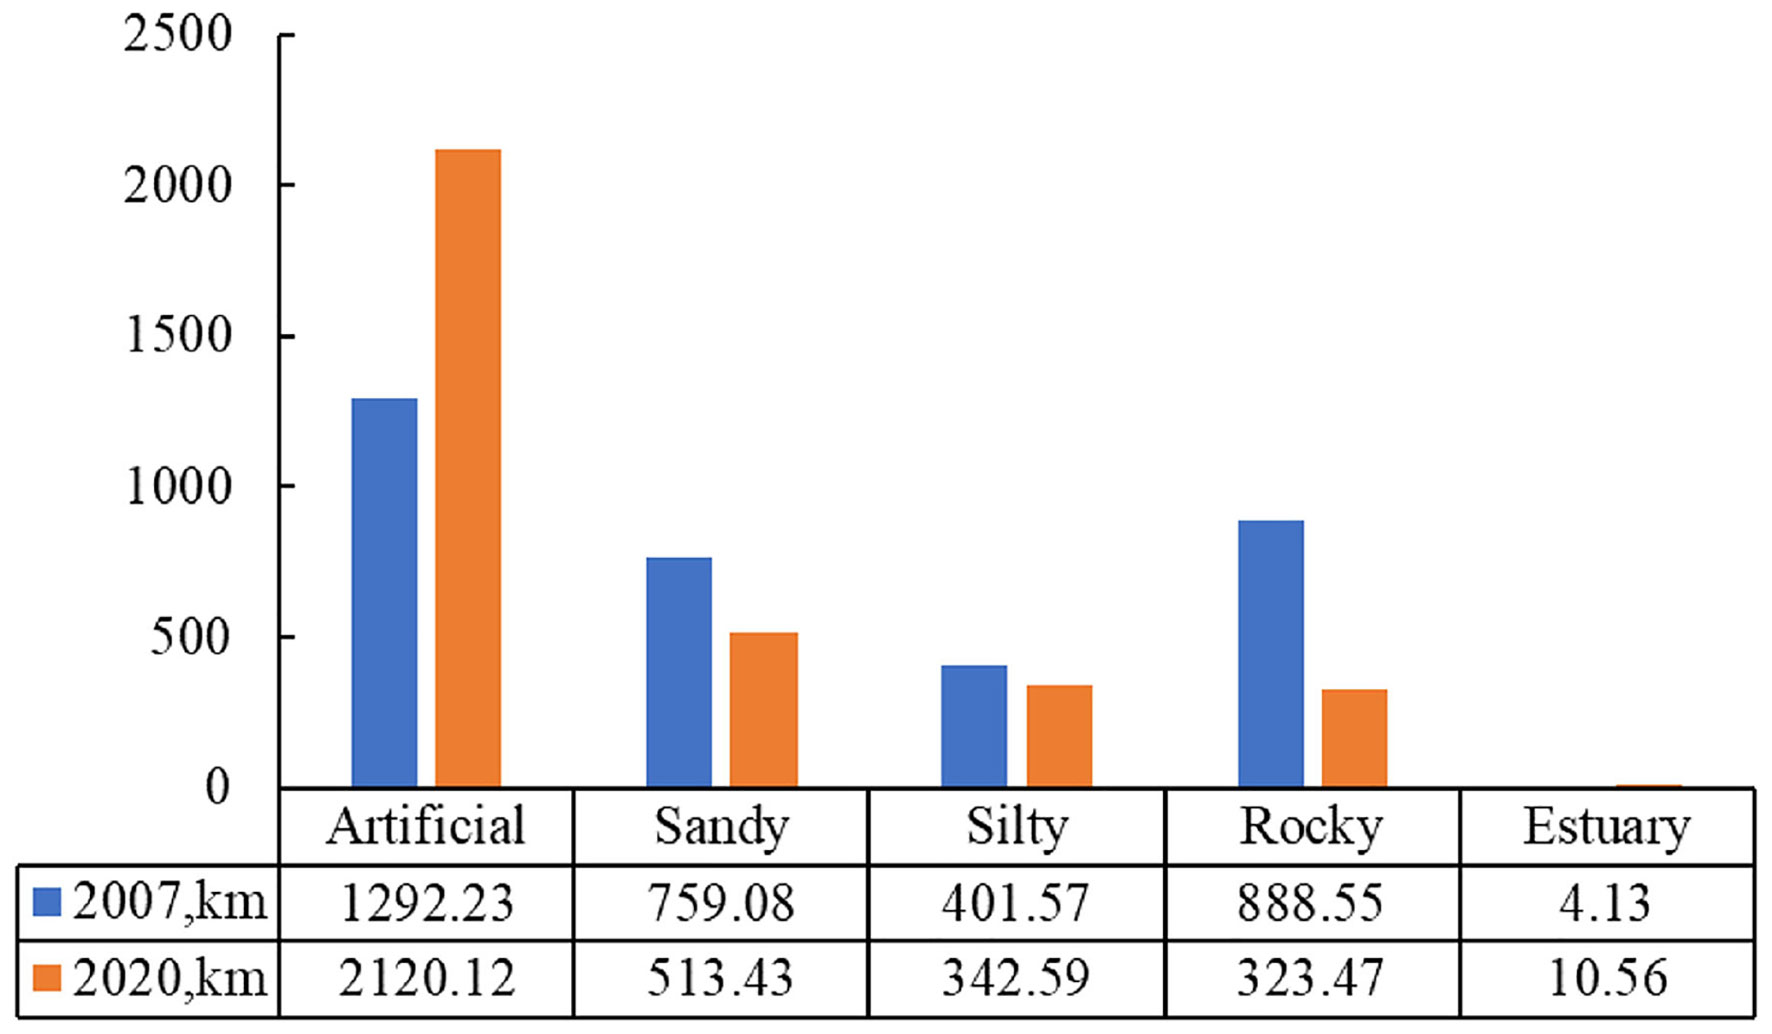
Figure 8 Shoreline changes at the coastal cities of Shandong. BZ, Binzhou; DY, Dongying; WF, Weifang; YT, Yantai; WH, Weihai; QD, Qingdao; and RZ, Rizhao. See the locations of the shorelines in Figure 1.
Shore type is a major constraint for developments in the coastal zone as it may either facilitate or restrict the development of the local marine economy. This works both ways as the development of the coastal zone and marine economy are also important factors for the rate of shoreline change. Up to the date of this study, at Binzhou, Dongying, and Weifang, the shoreline advanced toward the sea at rates of 182.28 m/a, 143.45 m/a, and 99.22 m/a, respectively. At Yantai, Weihai, Qingdao, and Rizhao, the rates of shoreline advancement were 24.58 m/a, 20.88 m/a, 63.99 m/a, and 41.06 m/a, respectively. The rates of shoreline advancement and land area increase were significantly higher at silty shores than other shore types (Figure 9). This may be attributed to two causes: (1) The economies of Yantai, Weihai, Qingdao, and Rizhao are well-developed, and their shorelines were developed and stabilized before the beginning of the study period. However, shoreline advancement still occurred at a few sections of the shoreline (e.g., Hongdao Island and Longkou) due to urban expansion. (2) The shorelines of Binzhou, Dongying, and Weifang are dominated by tidelands and with small populations, and they were formed by intense land reclamations in recent years. As the artificial shoreline continues to expand, meandering natural shorelines are gradually replaced by straight and regular artificial shorelines, which may, over time, shorten the shoreline of the Shandong Peninsula. However, the development trends in this region indicated that further greater expanses of coastal ecosystems are required for human activities, thus indicating shoreline advancement as the most dominant trend in the near future.
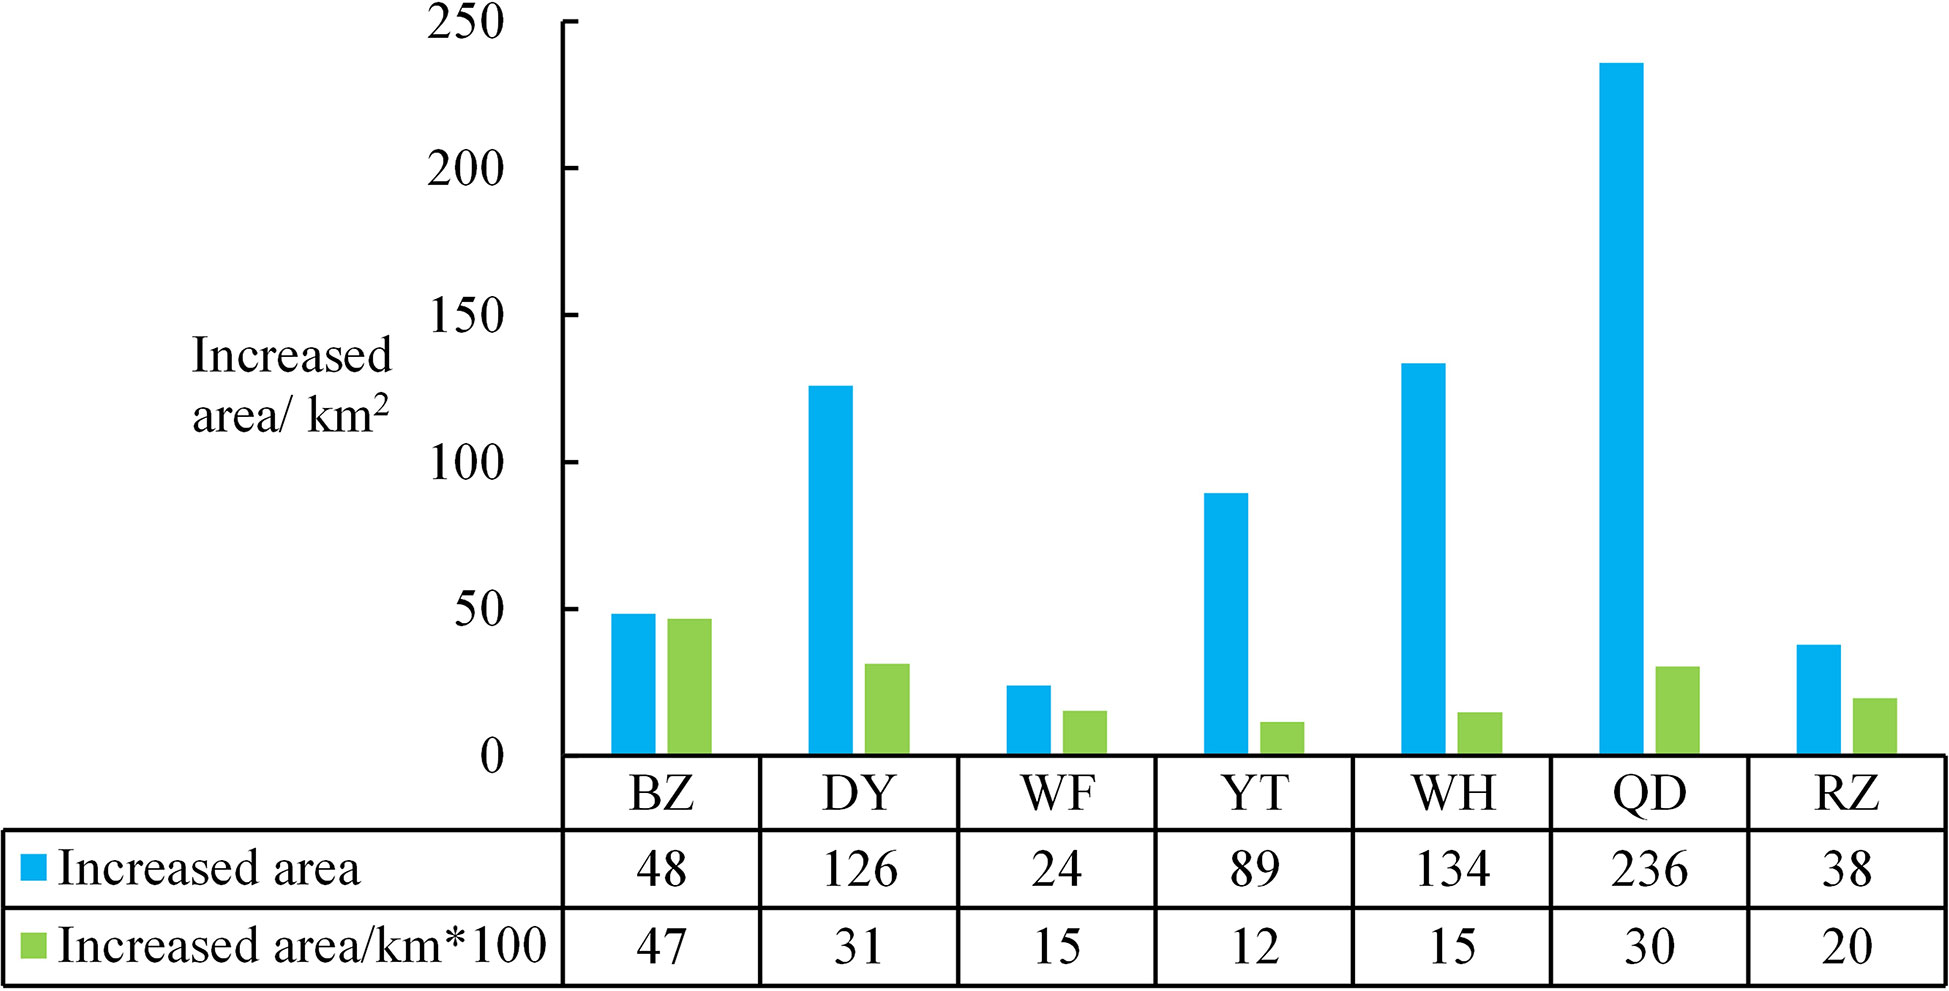
Figure 9 Coastal land area changes at the coastal cities of Shandong. BZ, Binzhou; DY, Dongying; WF, Weifang; YT, Yantai; WH, Weihai; QD, Qingdao; and RZ, Rizhao. See the locations of the shorelines in Figure 1.
4.3 Future trends of shoreline change
Globally, due to sea level rise and the intensified artificial impact on coastal and watershed areas, pertinent risks of coastal geohazards significantly increased. Of the three elements that govern the coastal zone (supply of sediment, hydrodynamic environment, and interaction zone), it is the balance between sediment supply and marine energies that determines the stability of the shore. However, global climate change is driving absolute sea level rises and an increasing frequency and severity of climatic and hydrological extremes (Oddo et al., 2020). This in turn increases the potency of coastal hydrodynamics, thus exacerbating coastal erosion (Harley et al., 2017). Human activities have altered the transport and supply of sediment to the coastal zone, which amplified erosion caused by sea level rise. The synchronous relationship between coastal sediment accumulation and hydrodynamic changes is the key to understanding how the supply of sediment and marine energies constrain each other (Figure 10) as well as the trends of shoreline change. From 2007 to 2020, the inshore area of the Shandong Peninsula was dominated by sedimentation due to the deposition of riverine input and erosion only occurred in hotspots. As the riverine input decreased, eroded coastal materials became a larger part of the seaward sediment load. At shores with aeolian dunes or soft soil cliffs, a high rate of sediment supply ensues, thus slowing down relative rises in sea level (Cooper et al., 2020). Conversely, the low rate of sediment supply at rocky and artificial shores exacerbates relative sea level rises. At shores stabilized by artificial structures, vertical beach erosion dominates if there is no space for shoreline retreat.
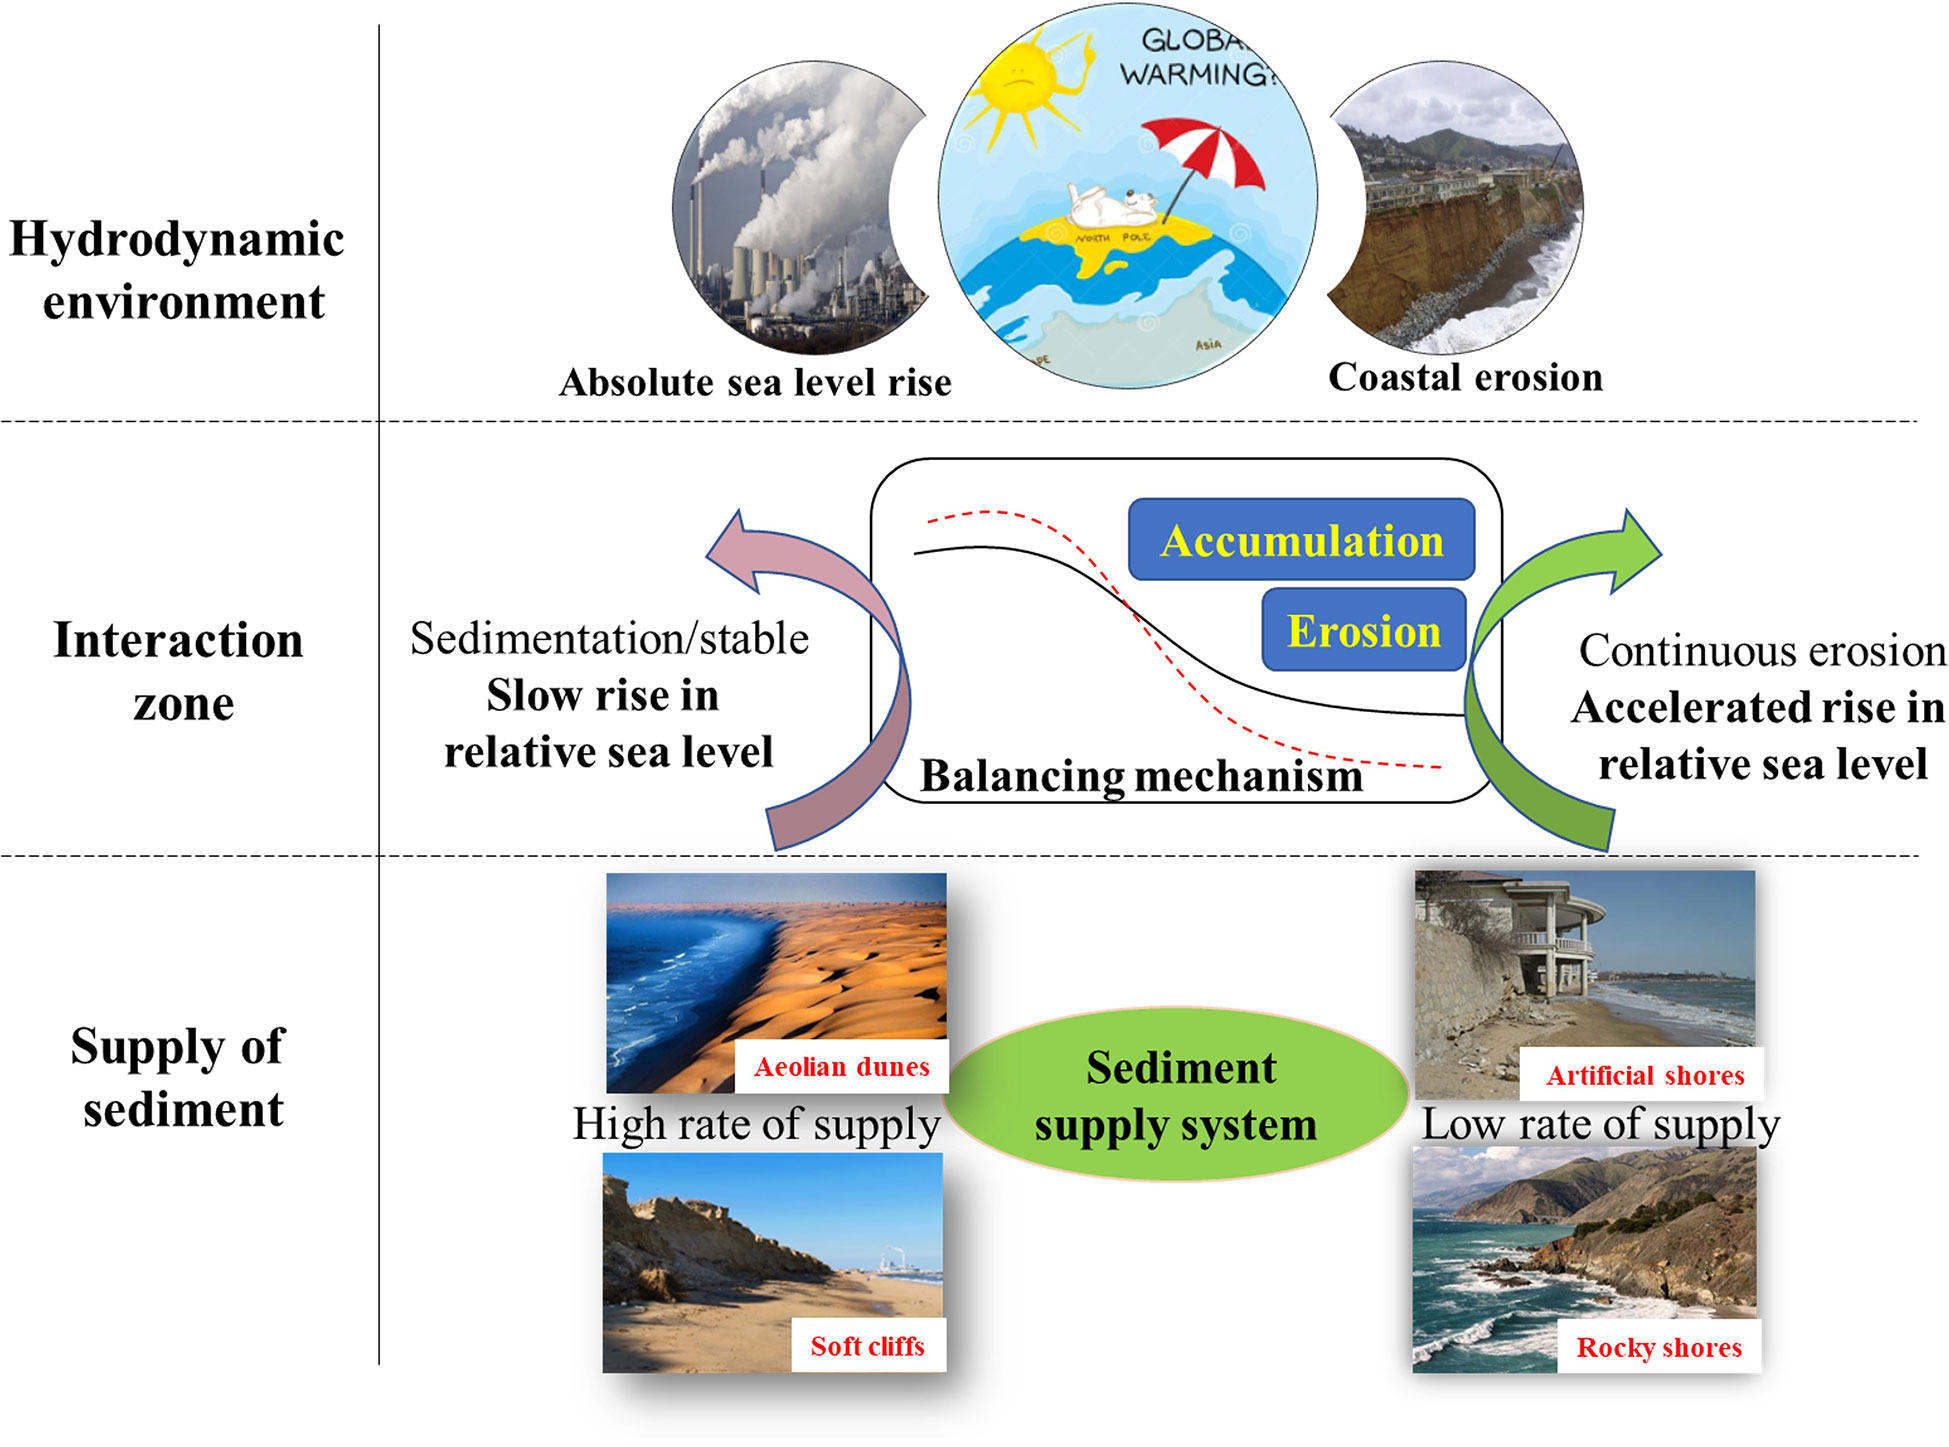
Figure 10 Balancing between the supply of sediment and hydrodynamic environment in the coastal zone.
In the short term, human activities exert fast-acting and intense effects on the shoreline. For example, land reclamation, harbor construction, sand mining from coastal zone (Wang et al., 2021), and shoreline stabilization quickly and directly (or indirectly) alter the modality of sediment transport and seaward sediment loads and then disrupt the balance between the supply of sediment and hydrodynamic environment. Although it is not possible for hydrodynamic forces to break through fortified artificial shores, other shores in their vicinity are eroded, in particular, shores made of soft and loose materials, such as sandy and silty shores. This results in shoreline retreat and vertical beach erosion at those shores. In addition, sand mining activities have decreased significantly, but the coastal erosion caused by it lasts for a long time (Jonah et al., 2017). Unlike sea level rise, coastal erosion responses to human activity are temporally rapid and spatially localized (Nourdi et al., 2021). For example, the construction of a groin at Foshou Bay in Rizhao City in 1970 impeded the NNE-to-SSW transport of sediment. This led to rapid sedimentation on the northern side of the jetty and erosion on the southern beach, which disappeared after 4 years. Guancaowang Village, downstream from Foshou Bay, also suffered from severe erosion (Figure 11). The construction of Port Gangluan in the northern suburbs of Longkou impeded longshore transport in the SW direction, with severe shore erosion and retreat in the downstream. Between 2003 and 2020, the maximum erosion-induced shoreline retreat was 56 m (Figure 11) (Li B. et al., 2013). After the environmental changes caused by human activity have stabilized, coastal erosion equilibrates after a long period of time. The Feiyan Beach took 40 years to reach stabilization status after the Yellow River was diverted away from the Diaokou course, following successive periods of gradually weakening erosion (Chen et al., 2005). Between 2007 and 2020, the coastal land area of the Shandong Peninsula increased by 672.40 km2, mainly from artificial land reclamations and some land forming in the Yellow River delta. The rate of natural shoreline retreat was only 22.27 km2. Owing to the large difference between shoreline advancement and recession in the Shandong Peninsula, its coastal zone is experiencing a severe imbalance between sediment supply and the hydrodynamic environment. Therefore, the unprotected shorelines of this region are at disproportionate risk of severe erosion since a long time.
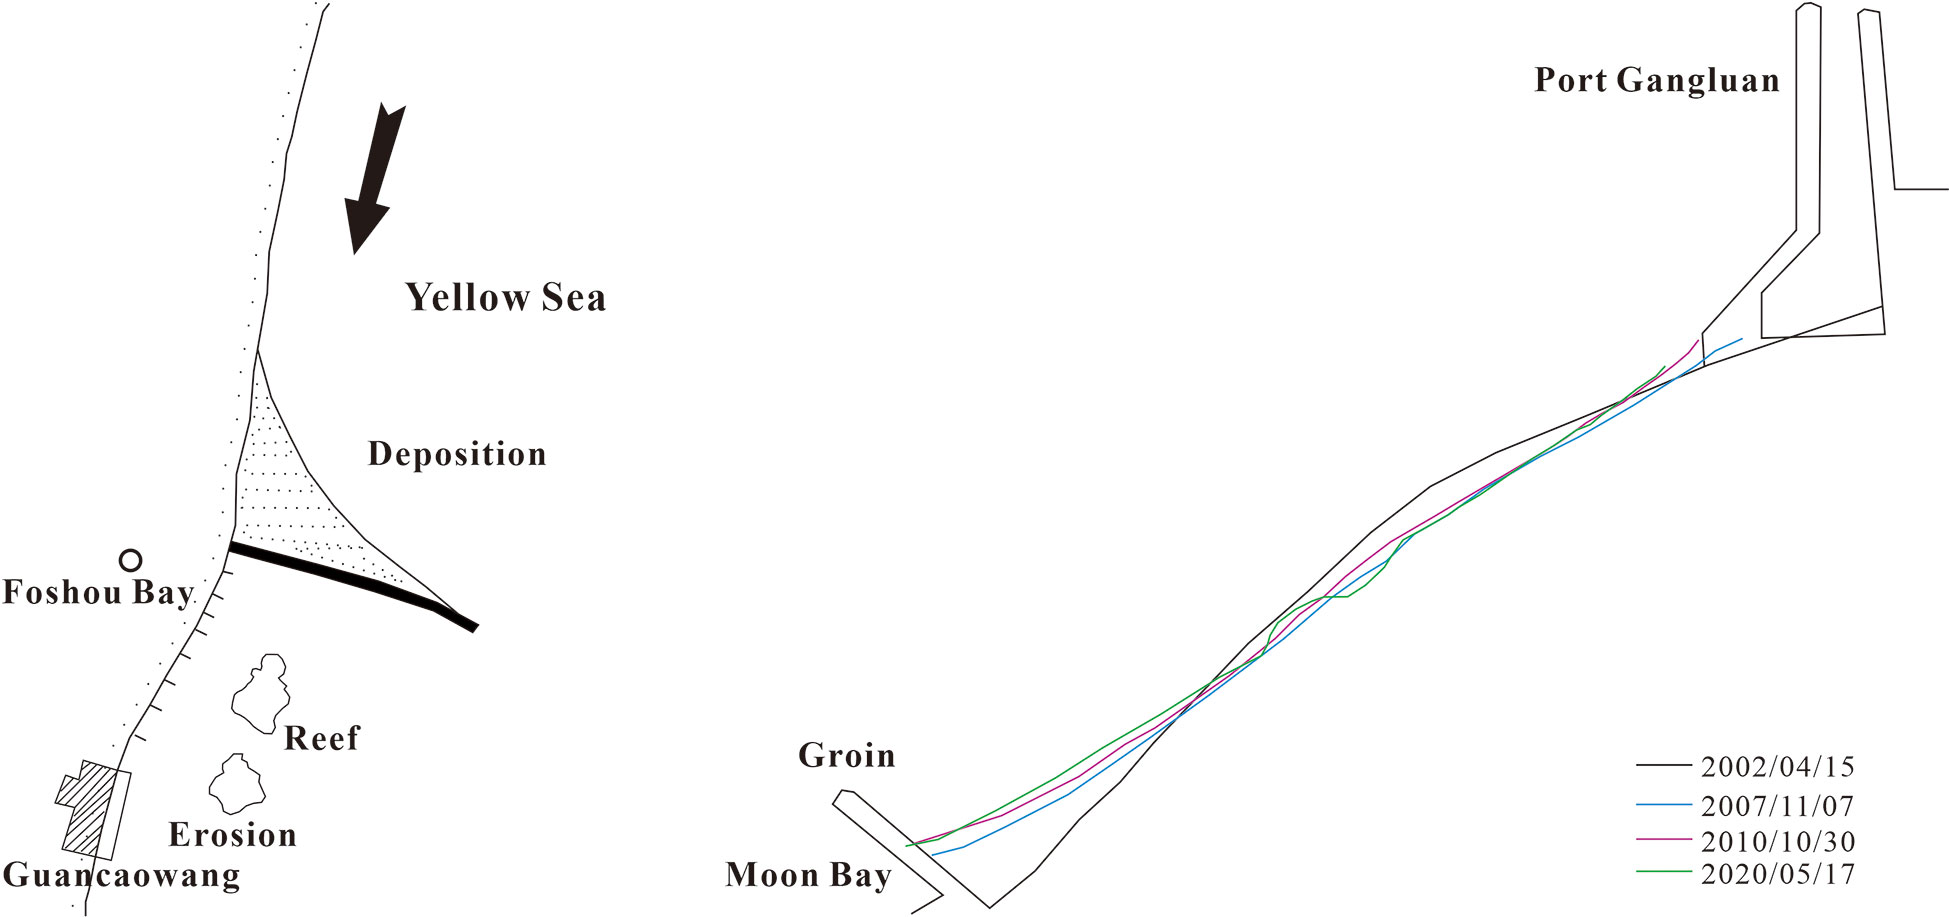
Figure 11 Effects of human activities on shoreline change.
In the long term, sea level rise caused by global climate change is most likely to define the trends of shoreline evolution. Temperature rise drives the thermal expansion of the sea and accelerates ice cap and glacier melting, thus boosting the rise in global average sea level. As this trend is irreversible on the century-to-millennium scale, the peril of coastal erosion continues to loom over coastal regions across the globe. The coastal sea level of China is predicted to rise by 68–170 mm in 2050 (China Sea Level Bulletin, 2021). Given the uncertainty in the effects of ice cap melting, several scenarios were predicted; in the high scenario, global sea level rise may reach 2 m by 2100 and 5 m by 2150. The corresponding retreat of sandy shorelines (in the extreme scenario) may reach 3.4 m (Figure 12), 40 m (Figure 12), and 100 m (Figure 12) by 2050, 2100, and 2150, respectively (Vousdoukas et al., 2020). Shoreline retreatment further increases at silty shores. On the decadal scale, the shoreline retreatment caused by sea level rise is small relative to that caused by human activities. On the century scale or greater, however, sea level rise exerts disastrous effects on the shoreline. After the ice caps have fully melted, the northern plains of the Shandong Peninsula will be submerged, and the continuous erosion of sandy shores on the southern and eastern sides of the peninsula will ultimately conjoin the Yellow and Bohai seas. The Shandong Peninsula will thus be transformed into an island (Figure 12).
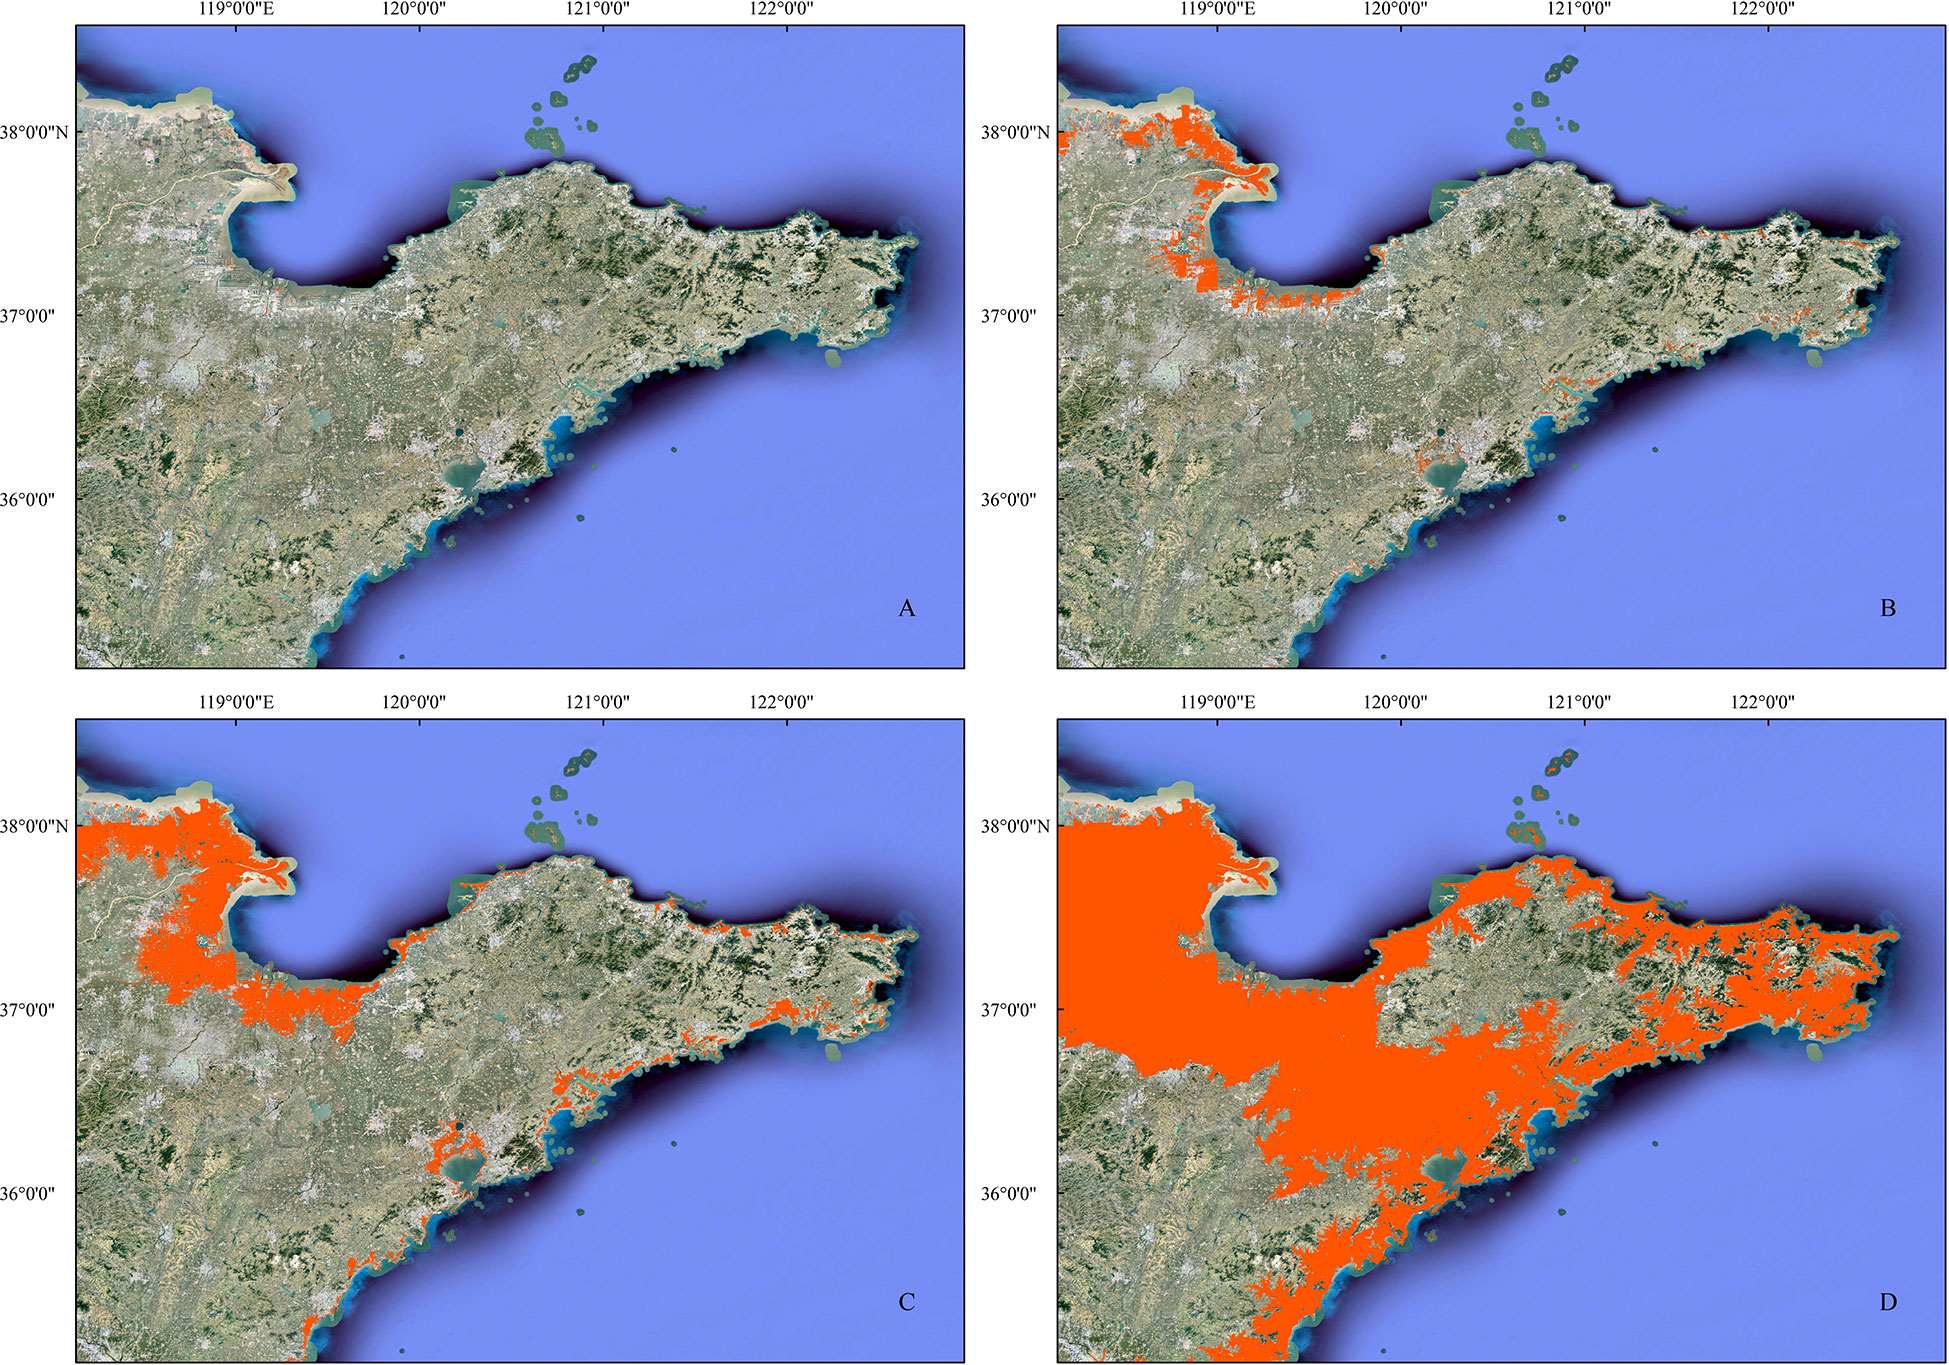
Figure 12 The areas of the Shandong Peninsula that will be submerged due to sea level rise (A): 2050; (B): 2100; (C): 2150; and (D): after all ice caps were melted.
5 Conclusion
Between 2007 and 2020, the shoreline of the Shandong Peninsula decreased by 35.37 km, but the length of artificial shoreline increased by 827.89 km, which is continuously increasing at an accelerated pace. Within the same period, natural shoreline retention decreased by 25.41%. The net increase in land area was 672.40 km2; in addition to natural accretion in the estuaries of large rivers, this was mainly caused by human-induced disturbances, such as land reclamation and harbor construction. Shoreline shortening was mainly caused by the replacement of meandering natural shores with straight and regularly shaped artificial shorelines. Currently, shoreline evolution in the study area was dominated by shoreline advancement due to the development of the coastal zone.
Among the three governing factors of the coastal zone (i.e., the supply of sediment, hydrodynamic environment, and interaction zone), shore stability mainly depends on the balance between sediment supplies and marine energies. In the short term, shoreline evolution is dominated by human activities, and the effects of sea level rise over the last decade have been relatively small. In the long term, however, shoreline evolution will be dominated by global climate change; on time scales in the centuries or greater, sea level rise will be the dominant effect in shoreline evolution. Human-driven shoreline advancement is causing shoreline retreat and beach erosion at the unprotected natural shores of the Shandong Peninsula. Unless preventive and mitigative measures are implemented at the required rate, the Shandong Peninsula will eventually become an island after its low-lying areas have been submerged by sea level rise.
Data availability statement
The original contributions presented in the study are included in the article/supplementary material. Further inquiries can be directed to the corresponding authors.
Author contributions
WG, PL, JD, and JL contributed to conception and design of the study. ZZ, XW, and BL organized the database. WG, SG, ZZ, XW, and BL performed the statistical analysis. WG wrote the first draft of the manuscript. PL and JL wrote sections of the manuscript. All authors contributed to the article and approved the submitted version.
Funding
This study is supported by the National Key Research and Development Program of China (Grant No. 2022YFC3106104), the Shandong Provincial Natural Science Foundation, China (Grant No. ZR2021MD098), the Marine S&T Fund of Shandong Province for Pilot National Laboratory for Marine Science and Technology (Qingdao) (Grant No.2018SDKJ0503-3), the NSFC-Shandong Joint Fund for Marine Science Research Centers (Grant No. U1606401), and the Ocean Public Welfare Scientific Research Project (Grant No.201005010).
Conflict of interest
The authors declare that the research was conducted in the absence of any commercial or financial relationships that could be construed as a potential conflict of interest.
Publisher’s note
All claims expressed in this article are solely those of the authors and do not necessarily represent those of their affiliated organizations, or those of the publisher, the editors and the reviewers. Any product that may be evaluated in this article, or claim that may be made by its manufacturer, is not guaranteed or endorsed by the publisher.
References
Alley R. B., Clark P. U., Huybrechts P., Joughin I. (2005). Ice-sheet and sea-level changes. Science. 5747, 456–460. doi: 10.1126/science.111461
Anthony E. J., Brunier G., Besset M., Goichot M., Dussouillez P., Nguyen V. L. (2015). Linking rapid erosion of the Mekong river delta to human activities. Sci. Rep. 5, 1–12. doi: 10.1038/srep14745
Athanasiou P., van Dongeren A., Giardino A., Vousdoukas M. I., Ranasinghe R., Kwadijk J. (2020). Uncertainties in projections of sandy beach erosion due to sea level rise: An analysis at the European scale. Sci. Rep. 10, 1–14. doi: 10.1038/s41598-020-68576-0
Barbier E. B., Hacker S. D., Kennedy C., Koch E. W., Stier A. C., Silliman B. R. (2011). The value of estuarine and coastal ecosystem services. Ecol. Monogr. 2, 169–193. doi: 10.1890/10-1510.1
Bruun P. (1988). The bruun rule of erosion by sea-level rise: a discussion on large-scale two-and three-dimensional usages. J. Coastal. Res. 4, 627–648.
Cai F., Su X., Liu J., Li B., Lei G. (2009). Coastal erosion in China under the condition of global climate change and measures for its prevention. Prog. Nat. Sci. 4, 415–426. doi: 10.1016/j.pnsc.2008.05.034
Castelle B., Guillot B., Marieu V., Chaumillon E., Hanquiez V., Bujan S., et al. (2018). Spatial and temporal patterns of shoreline change of a 280-km high-energy disrupted sandy coast from 1950 to 2014: SW France. Estuar. Coast. Shelf. S. 200, 212–223. doi: 10.1016/j.ecss.2017.11.005
Chen S., Zhang G., Chen X., Zhang J., Xu C. (2005). Coastal erosion feature and mechanism at feiyantan in the yellow river delta. Mar. Geology Quaternary Geology. 3, 9–14. doi: 10.16562/j.cnki.0256-1492.2005.03.002
Chu L., Oloo F., Sudmanns M., Tiede D., Hölbling D., Blaschke T., et al. (2020). Monitoring long-term shoreline dynamics and human activities in the hangzhou bay, China, combining daytime and nighttime EO data. Big Earth Data. 3, 242–264. doi: 10.1080/20964471.2020.1740491
Cooper J. A. G., Masselink G., Coco G., Short A. D., Castelle B., Rogers K., et al. (2020). Sandy beaches can survive sea-level rise. Nat. Clim. Change. 11, 993–995. doi: 10.1038/s41558-020-00934-2
Cooper J. A. G., Pilkey O. H. (2004). Sea-Level rise and shoreline retreat: time to abandon the bruun rule. Global. Planet. Change. 3-4, 157–171. doi: 10.1016/j.gloplacha.2004.07.001
Crowell M., Leatherman S. P., Buckley M. K. (1993). Shoreline change rate analysis: long term versus short term data. Shore Beach. 2, 13–20.
Davenport J., Davenport J. L. (2006). The impact of tourism and personal leisure transport on coastal environments: a review. Estuar. Coast. Shelf. S. 1-2, 280–292. doi: 10.1016/j.ecss.2005.11.026
Dong Z., Fu D., Liu D., Yu G., Zhang X. (2019). Study on the extraction of waterline with different landforms based on ZY-3 remote sensing images. Hydrographic surveying charting. 2, 34–39. doi: 10.3969/j.issn.1671-3044.2019.02.008
Ehlert D., Zickfeld K. (2018). Irreversible ocean thermal expansion under carbon dioxide removal. Earth. Syst. Dynam. 1, 197–210. doi: 10.5194/esd-9-197-2018
Esteves L. S., Toldo E. E., Dillenburg S. R., Tomazelli L. J. (2002). Long-and short-term coastal erosion in southern Brazil. J. Coastal. Res. 36, 273–282. doi: 10.2112/1551-5036-36.sp1.273
Flor-Blanco G., Alcántara-Carrió J., Jackson D. W. T., Flor G., Flores-Soriano C. (2021). Coastal erosion in NW Spain: Recent patterns under extreme storm wave events. Geomorphology. 387, 107767. doi: 10.1016/j.geomorph.2021.107767
Fraser C., Bernatchez P., Dugas S. (2017). Development of a GIS coastal land-use planning tool for coastal erosion adaptation based on the exposure of buildings and infrastructure to coastal erosion, québec, Canada. Geomat. Nat. Haz. Risk. 2, 1103–1125. doi: 10.1080/19475705.2017.1294114
Fred E. C., Andrew M. (1996). Defining and interpreting shoreline change. Ocean. Coast. Manage. 3, 129–151. doi: 10.1016/S0964-5691(96)00059-2
Gao W., Li P., Gao S., Tian Z., Li B., Liu J. (2020). Response process of the haiyang beach evolution to typhoon lekima in Shandong province. HaiyangXuebao 11, 88–99. doi: 10.3969/j.issn.0253–4193.2020.11.009
Gracia A., Rangel-Buitrago N., Oakley J. A., Williams A. T. (2018). Use of ecosystems in coastal erosion management. Ocean. Coast. Manage. 156, 277–289. doi: 10.1016/j.ocecoaman.2017.07.009
Grottoli E., Cilli S., Ciavola P., Armaroli C. (2020). Sedimentation at river mouths bounded by coastal structures: A case study along the Emilia-romagna coastline, Italy. J. Coastal. Res. 95 (SI), 505–510. doi: 10.2112/SI95-098.1
Gu C., Kang J., Yan G., Chen Z. (2016). Spatial and temporal variability of Northwest Pacific tropical cyclone activity in a global warming scenario. J. Trop. Meteorol. S1, 15–23. doi: 10.16555/j.1006-8775.2016.S1.002
Harley M. D., Turner I. L., Kinsela M. A., Middleton J. H., Mumford P. J., Splinter K. D., et al. (2017). Extreme coastal erosion enhanced by anomalous extratropical storm wave direction. Sci. Rep. 7, 1–9. doi: 10.1038/s41598-017-05792-1
Hegde A. V., Akshaya B. J. (2015). Shoreline transformation study of karnataka coast: geospatial approach. Aquat. Procedia. 4, 151–156. doi: 10.1016/j.aqpro.2015.02.021
Himmelstoss E. A., Henderson R. E., Kratzmann M. G., Farris A. S. (2018). Digital shoreline analysis system (DSAS) version 5.0 user guide: U.S. Geological Survey Open-File Rep. 2018–1179, 110 p. doi: 10.3133/ofr20181179
Hou X., Wu T., Hou W., Chen Q., Wang Y., Yu L. (2016). Characteristics of coastline changes in mainland China since the early 1940s. Sci. China. Earth. Sci. 9, 1791–1802. doi: 10.1007/s11430-016-5317-5
Jonah F. E., Adams O., Aheto D. W., Jonah R. E., Mensah E. A. (2017). Coastal zone management challenges in Ghana: issues associated with coastal sediment mining. J. Coast. Conserv. 21, 343–353. doi: 10.1007/s11852-017-0511-y
Li G., Gong L., Yang J., Ding D., Li B., Cao L., et al. (2013). Beach erosion along the coast of Shandong province and protection countermeasures. Mar. Geology Quaternary Geology. 5, 35–45. doi: 10.3724/SP.J.1140.2013.05035
Li B., Zhuang Z., Cao L., Du F. (2013). Countermeasures against coastal erosion for protection of the sandy coast in Shandong province. Mar. Geology Frontiers. 5, 47–54. doi: 10.16028/j.1009-2722.2013.05.006
Luo S., Cai F., Liu H., Lei G., Qi H., Su X. (2015). Adaptive measures adopted for risk reduction of coastal erosion in the people's republic of China. Ocean. Coast. Manage. 103, 134–145. doi: 10.1016/j.ocecoaman.2014.08.008
Mariotti G., Hein C. J. (2022). Lag in response of coastal barrier-island retreat to sea-level rise. Nat. Geosci. 15, 633–638. doi: 10.1038/s41561-022-00980-9
McGranahan G., Balk D., Anderson B. (2007). The rising tide: assessing the risks of climate change and human settlements in low elevation coastal zones. Environ. Urban. 1, 17–37. doi: 10.1177/0956247807076960
Meinshausen M., Smith S. J., Calvin K., Daniel J. S., Kainuma M. L., Lamarque J. F., et al. (2011). The RCP greenhouse gas concentrations and their extensions from 1765 to 2300. Climatic Change. 1, 213–241. doi: 10.1007/s10584-011-0156-z
Mentaschi L., Vousdoukas M. I., Pekel J. F., Voukouvalas E., Feyen L. (2018). Global long-term observations of coastal erosion and accretion. Sci. Rep. 8, 1–11. doi: 10.1038/s41598-018-30904-w
Nerem R. S., Beckley B. D., Fasullo J. T., Hamlington B. D., Masters D., Mitchum G. T. (2018). Climate-change–driven accelerated sea-level rise detected in the altimeter era. Proc. Natl. Acad. Sci. 9, 2022–2025. doi: 10.1073/pnas.1717312115
Nicholls R. J. (2004). Coastal flooding and wetland loss in the 21st century: changes under the SRES climate and socio-economic scenarios. Global. Environ. Chang. 1, 69–86. doi: 10.1016/j.gloenvcha.2003.10.007
Nicholls R. J., Cazenave A. (2010). Sea-Level rise and its impact on coastal zones. Science. 5985, 1517–1520. doi: 10.1126/science.1185782
Nourdi N. F., Raphael O., Grégoire A. O., Rudant J. P., Minette T. E. (2021). Seasonal to decadal scale shoreline changes along the cameroonian coastline, bay of bonn To 2020). Reg. Stud. Mar. Sci. 81, 101798. doi: 10.1016/j.rsma.2021.101798
Oddo P. C., Lee B. S., Garner G. G., Srikrishnan V., Reed P. M., Forest C. E., et al. (2020). Deep uncertainties in sea-level rise and storm surge projections: Implications for coastal flood risk management. Risk. Anal. 1, 153–168. doi: 10.1111/risa.12888
Pan Y., Yin S., Chen Y. P., Yang Y. B., Xu C. Y., Xu Z. S. (2022). An experimental study on the evolution of a submerged berm under the effects of regular waves in low-energy conditions. Coast. Eng. 176, 104169. doi: 10.1016/j.coastaleng.2022.104169
Qi H., Cai F., Lei G., Cao H., Shi F. (2010). The response of three main beach types to tropical storms in south China. Mar. Geol. 1-4, 244–254. doi: 10.1016/j.margeo.2010.06.005
Ranasinghe R. (2016). Assessing climate change impacts on open sandy coasts: A review. Earth-Sci. Rev. 160, 320–332. doi: 10.1016/j.earscirev.2016.07.011
Ranasinghe R., Stive M. J. (2009). Rising seas and retreating coastlines. Climatic Change. 3, 465–468. doi: 10.1007/s10584-009-9593-3
Robinet A., Idier D., Castelle B., Marieu V. (2018). A reduced-complexity shoreline change model combining longshore and cross-shore processes: The LX-shore model. Environ. Modell. Software 109, 1–16. doi: 10.1016/j.envsoft.2018.08.010
Swirad Z. M., Rosser N. J., Brain M. J., Rood D. H., Hurst M. D., Wilcken K. M., et al. (2020). Cosmogenic exposure dating reveals limited long-term variability in erosion of a rocky coastline. Nat. Commun. 1, 1–9. doi: 10.1038/s41467-020-17611-9
Temmerman S., Meire P., Bouma T. J., Herman P. M., Ysebaert T., De Vriend H. J. (2013). Ecosystem-based coastal defence in the face of global change. Nature. 7478, 79–83. doi: 10.1038/nature12859
Thieler E. R., Himmelstoss E. A., Zichichi J. L., Ergul A. (2009). The Digital Shoreline Analysis System (DSAS) version 4.0-an ArcGIS extension for calculating shoreline change. US Geological Survey. 2008-1278. doi: 10.3133/ofr20081278
Vousdoukas M. I., Ranasinghe R., Mentaschi L., Plomaritis T. A., Athanasiou P., Luijendijk A., et al. (2020). Sandy coastlines under threat of erosion. Nat. Clim. Change. 3, 260–263. doi: 10.1038/s41558-020-0697-0
Wang Y., Tian Z., Li X., Sun H. (2021). Coastal erosion mechanism and its prevention in haiyang. Mar. Sci. 12, 18–30. doi: 10.11759/hykx20210202001
Warrick J. A., Stevens A. W., Miller I. M., Harrison S. R., Ritchie A. C., Gelfenbaum G. (2019). World’s largest dam removal reverses coastal erosion. Sci. Rep. 9, 1–12. doi: 10.1038/s41598-019-50387-7
Widlansky M. J., Long X., Schloesser F. (2020). Increase in sea level variability with ocean warming associated with the nonlinear thermal expansion of seawater. Commun. Earth Environment. 1, 1–12. doi: 10.1038/s43247-020-0008-8
Williams A. T., Rangel-Buitrago N., Pranzini E., Anfuso G. (2018). The management of coastal erosion. Ocean. Coast. Manage. 156, 4–20. doi: 10.1016/j.ocecoaman.2017.03.022
Xue Z., Feng A., Yin P., Xia D. (2009). Coastal erosion induced by human activities: A northwest bohai Sea case study. J. Coastal. Res. 3, 723–733. doi: 10.2112/07-0959.1
Xu L., Li J., Li W., Zhao S., Yuan Q., Wang M., et al. (2014). Progress in impact of human activities on coastal resource and environment. J. Nanjing Normal Univ. (Natural Sci. Edition) 3, 124–131. doi: 10.3969/j.issn.1001-4616.2014.03.023
Xu X., Peng H., Xu Q., Xiao H., Benoit G. (2009). Land changes and conflicts coordination in coastal urbanization: a case study of the Shandong peninsula in China. Coast. Manage. 1, 54–69. doi: 10.1080/08920750802612788
Yates M. L., Guza R. T., O'reilly W. C. (2009). Equilibrium shoreline response: Observations and modeling. J. Geophys. Res-Oceans. 114 (C09014), 1–16. doi: 10.1029/2009JC005359
Yin P., Duan X. Y., Gao F., Li M. N., Lü S. H., Qiu J. D., et al. (2018). Coastal erosion in Shandong of China: status and protection challenges. China. Geol. 4, 512–521. doi: 10.31035/cg2018073
Yin H., Qi H., Cai F., Zhang C. H., Liu G., Zhao S. H., et al. (2022). Sandy coastline fine extraction and correction method based on high resolution image. HaiyangXuebao. 4, 143–152. doi: 10.12284/hyxb2022084
Zhang K., Douglas B. C., Leatherman S. P. (2004). Global warming and coastal erosion. Climatic Change. 1, 41–58. doi: 10.1023/B:CLIM.0000024690.32682.48
Zhang X., Lu K., Yin P., Zhu L. (2019). Current and future mudflat losses in the southern huanghe delta due to coastal hard structures and shoreline retreat. Coast. Eng. 152, 103530. doi: 10.1016/j.coastaleng.2019.103530
Zhang X., Tan X., Hu R., Zhu L., Wu C., Yang Z. (2021). Using a transect-focused approach to interpret satellite images and analyze shoreline evolution in haiyang beach, China. Mar. Geol. 438, 1–16. doi: 10.1016/j.margeo.2021.106526
Keywords: global climate change, human activity, shoreline change, coastal erosion, sea level rise
Citation: Gao W, Du J, Gao S, Xu Y, Li B, Wei X, Zhang Z, Liu J and Li P (2023) Shoreline change due to global climate change and human activity at the Shandong Peninsula from 2007 to 2020. Front. Mar. Sci. 9:1123067. doi: 10.3389/fmars.2022.1123067
Received: 13 December 2022; Accepted: 27 December 2022;
Published: 12 January 2023.
Edited by:
Yi Pan, Hohai University, ChinaReviewed by:
Hongshuai Qi, State Oceanic Administration, ChinaShihao Liu, East China Normal University, China
Copyright © 2023 Gao, Du, Gao, Xu, Li, Wei, Zhang, Liu and Li. This is an open-access article distributed under the terms of the Creative Commons Attribution License (CC BY). The use, distribution or reproduction in other forums is permitted, provided the original author(s) and the copyright owner(s) are credited and that the original publication in this journal is cited, in accordance with accepted academic practice. No use, distribution or reproduction is permitted which does not comply with these terms.
*Correspondence: Jie Liu, bGl1amllQGZpby5vcmcuY24=; Ping Li, bGlwaW5nQGZpby5vcmcuY24=