 Lei Lin
 Dongyan Liu
 Yueqi Wang
 Ting Lv
 Yue Zhao1
- 1College of Ocean Science and Engineering, Shandong University of Science and Technology, Qingdao, China
- 2State Key Laboratory of Estuarine and Coastal Research, East China Normal University, Shanghai, China
- 3Key Laboratory of Coastal Zone Environmental Processes and Ecological Remediation, Yantai Institute of Coastal Zone Research, Chinese Academy of Sciences, Yantai, Shandong, China
Winds potentially affect primary production in shelf seas during the stratified season by enhancing upwelling and mixing. However, the exact extent and modalities of this effect in the Yellow Sea remain unclear. Here, based on the satellite and in situ observation data, statistical method, and wind-driven upwelling theory, we examined the wind effect on the chlorophyll-a (Chl-a) variability in the summer of 2002-2020 and the effect mechanism. The satellite data revealed a significantly positive correlation between anomalies of the monthly mean of the summer sea surface Chl-a and wind speed at the continental slope region (water depth of 20-60 m) in the southwestern Yellow Sea where strong wind-driven upwelling has been indicated by previous studies. The wind-driven upwelling along the continental slope was further verified using two summer in-situ observations. After a fortnight of southeasterly wind, the upwelling patterns of high salinity and rich nutrients from the Yellow Sea cold water mass were observed, and consequently, high Chl-a concentrations occurred in the upper layer of the slope region. The wind-driven upwelling occurred in the region at water depth of ~20-60 m, which is consistent with the result of the wind-driven coastal upwelling theory (0.5D < water depth < 1.25D, where D is the thickness of the Ekman layer). The dissolved inorganic nitrogen, phosphorus, and silicate fluxes contributed by wind-driven upwelling were estimated as 1345 ± 674 μmol/m2/d, 81 ± 45 μmol/m2/d and 1460 ± 899 μmol/m2/d, respectively, accounting for 30%-40% of total nutrient supply, and were several times larger than that contributed by the turbulent mixing, which can explain why the strong wind-Chl-a correlation only occurred at the upwelling region rather than the entire sea. In addition, in this region, the interannual variability of the summer mean Chl-a was negatively correlated to both the Pacific Decadal Oscillation (PDO) and El Niño-Southern Oscillation (ENSO) indexes, due to the opposite phase of the summer wind anomaly and the PDO/ENSO. This study revealed the wind effect on the shelf phytoplankton is regional and highlighted that wind could be a pivotal factor driving the climate variability of shelf primary production in the stratified season.
1. Introduction
Shelf seas support more than a third of the oceanic primary productivity and significantly influence global biogeochemical cycles (e.g., Wollast, 1998; Bauer et al., 2013). Understanding the forcing factors which regulate phytoplankton biomass in shelf seas is highly important. In summer, stratification in shelf seas can reduce the vertical transport of nutrients from deep water to the surface, and consequently limit the growth of phytoplankton (e.g., Tian et al., 2005; Xu et al., 2011; Liu and Wang, 2013; Wihsgott et al., 2019). Summer wind is one of the key dynamic factors which can pump nutrients from deep water to the surface by forming wind-driven upwelling and enhancing vertical mixing. Thus, it can regulate phytoplankton production during the stratified season (e.g., Jacox and Edwards, 2011; Daneri et al., 2012; Williams et al., 2013; Li et al., 2018; Zhabin et al., 2019). However, the correlation between wind and phytoplankton biomass is of region difference which relies on latitudes, water depth, and other environmental factors (e.g., Kahru et al., 2010; Shen et al., 2018). Therefore, more studies are needed to fully understand the role of wind on phytoplankton, especially for the coastal oceans with complex environments.
The Yellow Sea is a part of the western Pacific marginal sea surrounded by China and the Korean Peninsula (Figure 1), with an average water depth of about 40 meters. It is a typical mid-latitude shelf sea with distinct seasonal characteristics. In winter, its seawater is well-mixed and features high turbidity and rich nutrients (Lin et al., 2019a; Guo et al., 2020). Deep mixing and high turbidity limit the light availability for phytoplankton growth, and the vertical average irradiance dominates the spatial pattern of chlorophyll-a (Chl-a) concentration (Lin et al., 2019a). After winter, stratification gradually forms with the sea surface heat flux increase. Consequently, cold water is retained at the bottom of the central Yellow Sea, forming the Yellow Sea Cold Water Mass (YSCWM) in summer (Zhang et al., 2008). The YSCWM occupies ~1/4–1/3 of the total volume of the Yellow Sea and contains rich nutrients (Su and Weng, 1994). The nutrients stored in the YSCWM account for approximately half of the total nutrients in the Yellow Sea (Chen et al., 2012). Nevertheless, summer stratification limits the vertical transport of nutrients in the YSCWM to the upper layers, resulting in low Chl-a concentrations (<1.0 mg/m3), especially in the central Yellow Sea (Fu et al., 2009; Yamaguchi et al., 2012; Liu et al., 2015). Understanding the YSCWM nutrient release process and the dynamic mechanism is therefore of significance for understanding the variability of primary productivity in the Yellow Sea. Previous studies reported that the turbulence entrainment and the upwelling of the tidal mixing fronts could induce the upward transport of nutrients in the YSCWM, compensate for the nutrient supply of the upper layer, and finally promote the phytoplankton growth at the regions of the front and subsurface (e.g., Wei et al., 2002; Liu et al., 2003; Su et al., 2013; Wei et al., 2016; Choi et al., 2017; Fu et al., 2018; Wei et al., 2020).
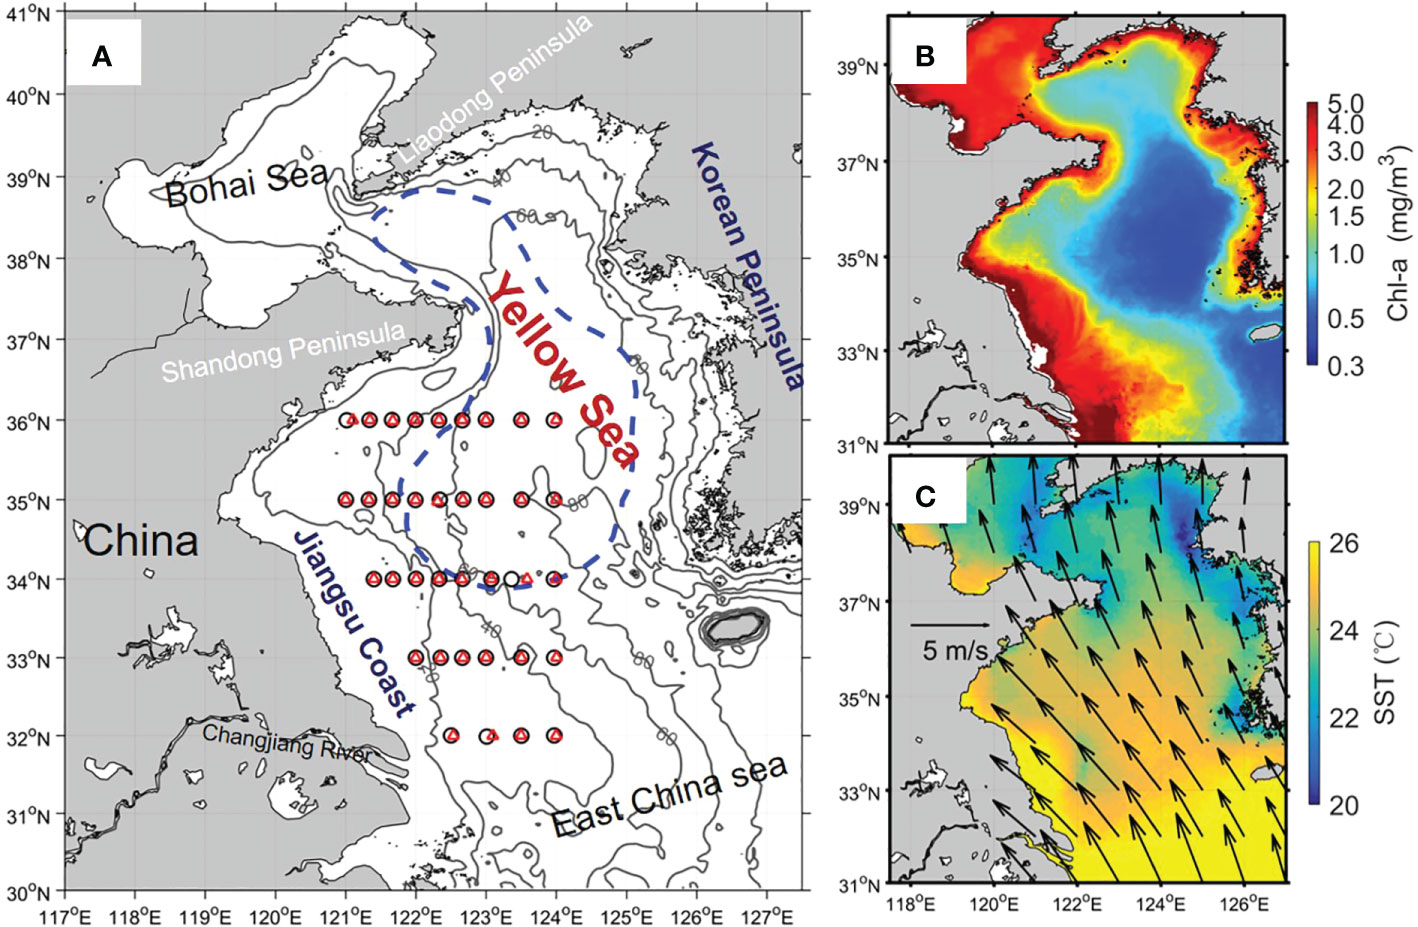
Figure 1 (A) A map of the Yellow Sea with isobaths and sampling stations (Black circles: July 2018; red triangles: August 2015). The Yellow Sea Cold Water Mass (YSCWM) scaled by the blue dash-line is defined as the 10 °C isotherms in the bottom layer in summer, (Zhang et al., 2008). (B) The climatological mean of sea surface chlorophyll-a (Chl-a) in summer. (C) The climatological mean SST (color) and wind (arrows) in summer.
The Yellow Sea is significantly influenced by the East Asian monsoon. In summer, the average speed of southeasterly monsoon wind is 4–5 m/s (Su and Yuan, 2005), which is favorable for the formation of coastal upwelling in the southwestern Yellow Sea (Yuan et al., 2017). By numerical modeling and observation, Wang et al. (2021) revealed the critical role of the summer monsoon in the upwelling in the southwestern Yellow Sea, and their numerical experiments showed that the contribution of summer wind to the coastal upwelling system was almost equal to that of tides. The numerical study by Meng et al. (2020) found strong wind could effectively enhance vertical mixing by triggering near-inertial internal waves and near-inertial oscillations in the Yellow Sea in summer, which is especially important for vertical exchange in the central Yellow Sea. These studies have suggested the important effect of wind on the water vertical transport by enhancing upwelling and mixing during summer. Thus, the summer wind could be another potential factor driving the nutrient release from the bottom YSCWM and rising the phytoplankton biomass in the upper layer. Nevertheless, the effect of wind on the phytoplankton and nutrient in summer has not been carefully examined, and especially the exact extent and modalities of the effect remain unclear. In this study, based on the satellite data from 2002-2020 and two sets of observational data from summer field surveys during weak and strong winds, we analyzed the correlation between summer Chl-a and wind speed and the response of the nutrient distribution on the wind to further understand the effect of wind on the phytoplankton variability and its mechanism.
The remainder of this paper is organized as follows: Section 2 describes the data source and analysis methods; Section 3 shows the correlation analysis results between wind and Chl-a using the satellite data and the observed results of the two summer field surveys; Section 4 discusses the roles of wind on phytoplankton variability and the wind contribution on the nutrient flux in summer, and Section 5 summarizes the main findings of this study.
2. Data and methods
2.1. Data sources
2.1.1. Satellite and reanalysis data
Satellite and reanalysis data were used to analyze the correlation between Chl-a and wind in the Yellow Sea during summer. For comparison, the correlation between Chl-a and other two factors, i.e., sea surface temperature (SST) and Changjiang River discharge (CRD), were also analyzed. The monthly mean satellite Chl-a data for the Yellow Seas over the past 19 years (2002-2020) was acquired from Wang et al. (2017); and the summer Chl-a data (from June to August) were used to analyze the correlations between environmental factors in this study. To enhance the accuracy, the data were calibrated using the GAM (generalized additive model) algorithm developed by Wang et al. (2017). The regional GAM algorithm was developed to alleviate the effect of suspended sediments and colored dissolved organic matter on the Chl-a concentrations. Details of the GAM algorithm and Chl-a validation in the Yellow Sea are available in Wang et al. (2017). The satellite-derived Chl-a data have been used in several studies on Chl-a variability in the Yellow Sea (e.g., Lin et al., 2019a; Wang and Gao, 2020), which confirmed their agreement with in situ data in the Yellow Sea even during winter with high water turbidity (Lin et al., 2019a).
Monthly SST data in the Yellow Sea were obtained from the Advanced Very High Resolution Radiometer (AVHRR) (downloaded from https://coastwatch.noaa.gov). The reanalysis monthly wind data from the ERA-Interim dataset were derived from the European Center for Medium-Range Weather Forecasts (ECMWF, downloaded from https://www.ecmwf.int/). The freshwater discharge data of the Changjiang River were obtained from the Datong hydrological station (http://www.cjh.com.cn/). In addition, the PDO (Pacific Decadal Oscillation) and Niño 3.4 indexes were used to characterize the climate variability of the Pacific and obtained from the World Meteorological Organization (http://climexp.knmi.nl/selectindex.cgi?id=someone@somewh).
2.1.2. Field observations and sample analysis
Two summer field surveys were conducted in the Yellow Sea during August 17–21, 2015 (C15) and July 24–27, 2018 (C18), respectively. The wind over the Yellow Sea in July 2018 was significantly stronger than that in August 2015 (Figure 2). The average wind speeds in the Yellow Sea a week before the C18 and C15 field surveys were ~6.0 m/s and ~2.7 m/s, respectively. The physical, chemical, and biological parameters of triplicate water samples collected from 36 sites (Figure 1A) were measured. A conductivity–temperature–depth instrument (CTD, SeaBird 911 plus) was used to measure seawater temperature, salinity, and water depth. The observation sites during the two field surveys overlapped basically along 34°N, 35°N and 36°N transects, which cross the region of stratification and the YSCWM (Figure 1A). The buoyancy frequency (N2) is used to quantify the intensity of stratification of the seawater, which is calculated as follows:
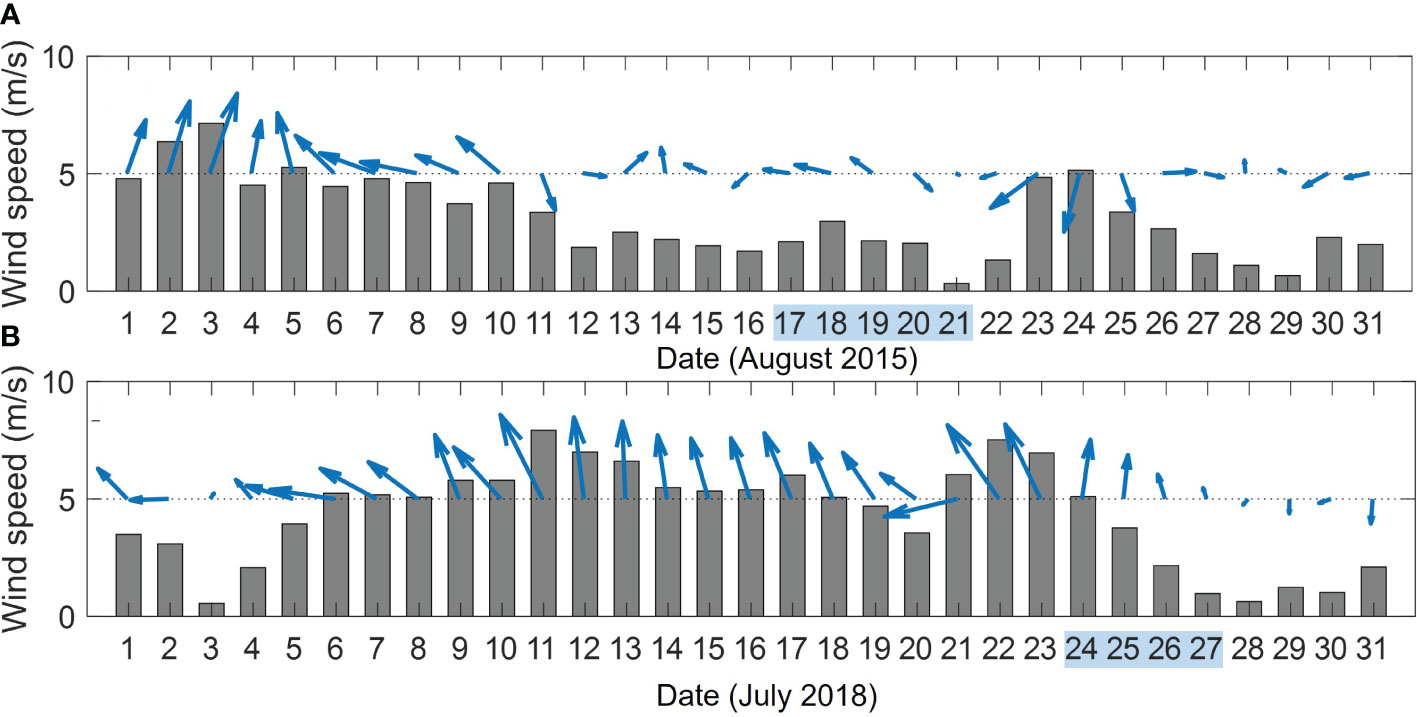
Figure 2 Daily mean winds in the southwestern Yellow Sea during the two field surveys (A: August 2015; B: July 2018). The gray bars and the blue arrows denote the wind speed and wind direction, respectively. The blue shadings in the horizontal axis denote the date of the observation.
where, ρ is the seawater density, ρ0 is a reference density, and g is the gravitational acceleration. We compared the data at the three transects during the two field surveys to evaluate the effect of the summer winds on the southwestern Yellow Sea.
Seawater samples were collected at different water depths (3–5 layers) at each site using a Go-Flo bottle (5 L). Water samples (1 L) at each layer were initially filtered in situ through cellulose acetate membranes (Whatman, 0.45 μm) for nutrient analysis. Next, the filtered water samples were added with HgCl2 (0.05% final concentration) to prevent microbial alteration and then frozen at -20°C for the subsequent laboratory analysis. Dissolved inorganic nitrogen (DIN), dissolved inorganic phosphorus (DIP), and dissolved silicate (DSi) were analyzed in the laboratory using flow injection analysis (AA3, Bran + Luebbe, Germany). In this study, DIN denotes the total concentrations of NO3−, NO2−, and NH4+. NO3−, NO2−, and NH4+ concentrations were measured using the diazo-azo, cadmium-copper reduction, and salicylate methods, respectively. DIP and DSi were measured using the phosphomolybdenum blue method and the silicomolybdic complex method, respectively. For Chl-a measurements, we filtered 1 L water samples through GF/F filters (Whatman, 0.45 μm) under a low vacuum, and the filters were frozen at -20°C before laboratory analyses. Chl-a was extracted using 15 mL of 90% acetone in the dark for 24 hours in a refrigerator, and the concentrations were determined using the Chl-a fluorescence method (Turner Design Trilogy).
2.2. Data analysis
The coefficient of variation (CV) of the satellite Chl-a data was used to evaluate the Chl-a variability in summer, which is calculated as the ratio of the standard deviation of the monthly mean Chl-a in summer to the summer mean Chl-a. According to the definition, a larger CV means a high variability of Chl-a. To examine the effect of wind, SST, and Changjiang River discharge (CRD) on summer phytoplankton biomass in the Yellow Sea, we performed correlation analyses on the monthly mean surface Chl-a concentrations, wind, SST, and CRD in summer (June, July and August). As the monthly mean wind direction basically remains the same in summer (e.g., Lin et al., 2019b), we used the monthly mean wind speed to quantify the wind intensity. Distributions of Chl-a in June, July, and August all show similar patterns and weak monthly variability during summer (see Figure S1 in the supplementary material), indicating the basically identical environmental background for the three summer months in the Yellow Sea. To further avoid the potential effect of the intrinsic monthly variation in one summer on the correlation, the anomalies of monthly mean values were used in the correlation analysis, which was calculated by subtracting the corresponding climatological monthly mean from the monthly mean values. Using the least squares method, we analyzed the correlations between the anomalies of wind, SST, CRD, and Chl-a concentration in June, July, and August of 2002-2020. Moreover, to understand the effect of the climate variability on the interannual variability of the summer Chl-a, i.e., PDO and El Niño-Southern Oscillation (ENSO), the correlation between the summer mean Chl-a concentration and the PDO and Niño 3.4 Indexes. As the strong signal of ENSO occurs in winter and there are usually several month lags between the variabilities of the climate and coastal environment (e.g., Zhai et al., 2021), the mean Niño 3.4 Index in winter (January to March) was used in the correlation analysis. The correlation coefficient (R value) was used to quantify the degree of correlation, and the positive and negative R values denote positive and inverse correlations, respectively. The statistical significance (P value) was assessed using an F-test.
2.3. Wind-driven upwelling theory
In this study, the wind-driven upwelling theory was adopted in our analysis to understand the response of the western Yellow Sea to summer winds. The 2D analytical solution derived by Estrade et al. (2008) suggests that a wind-induced upwelling cell should be concentrated in the region of
where h is the water depth and is the thickness of the Ekman layer ( Aυ is the vertical viscosity coefficient and f is the Coriolis parameter).
According to the wind-driven Ekman transport, the magnitude of wind-driven coastal upwelling can be estimated as (e.g., Estrade et al., 2008):
where L is the cross-shore width of the upwelling region (~140 km on average according to the observation in the western Yellow Sea), ρ0 is the reference density (1025 kg/m3) and τ is the sea surface alongshore wind stress. The wind stress related to wind speed is formulated as:
where ρa is the air density (~1.22 kg/m3), Cd is the drag coefficient (0.0013) and is the alongshore wind speed. As the summer wind direction is basically parallel to the coastline of the western Yellow Sea (Figure 1C), the summer mean wind speed was directly used here to estimate the upwelling intensity in the western Yellow Sea. Based on Equations (3) and (4), the average magnitude of wind-induced upwelling in the western Yellow Sea can be estimated using:
Based on the upwelling velocity and nutrient concentrations of the YSCWM, the average nutrient fluxes to the upper layer induced by wind-driven upwelling can be estimated using:
where F is the upwelling nutrient flux, C is the average nutrient concentration in the YSCWM and w is the upwelling velocity.
3. Results
3.1. Correlation between summer winds and Chl-a concentrations
The satellite data showed that the relatively high variability (high CV) of summer Chl-a occurred in the continental slope region where the water depth ranged between 20 m and 60 m (Figure 3A). Meanwhile, there was a significant positive correlation between summer winds and satellite Chl-a concentrations at the water depth of 20-60 m in the western Yellow Sea (Figure 3B). Whereas, in the eastern Yellow Sea, the wind-Chl-a correlation was negative (Figure 3B). In contrast, the spatial correlations between SST (Figure 3C), CRD (Figure 3D) and Chl-a were much weaker than the wind-Chl-a correlation. The location overlaps of the high Chl-a variability and the strong wind-Chl-a correlation (Figures 3A, B) suggest the effect of the summer wind on the variability of summer Chl-a in the southwestern Yellow Sea.
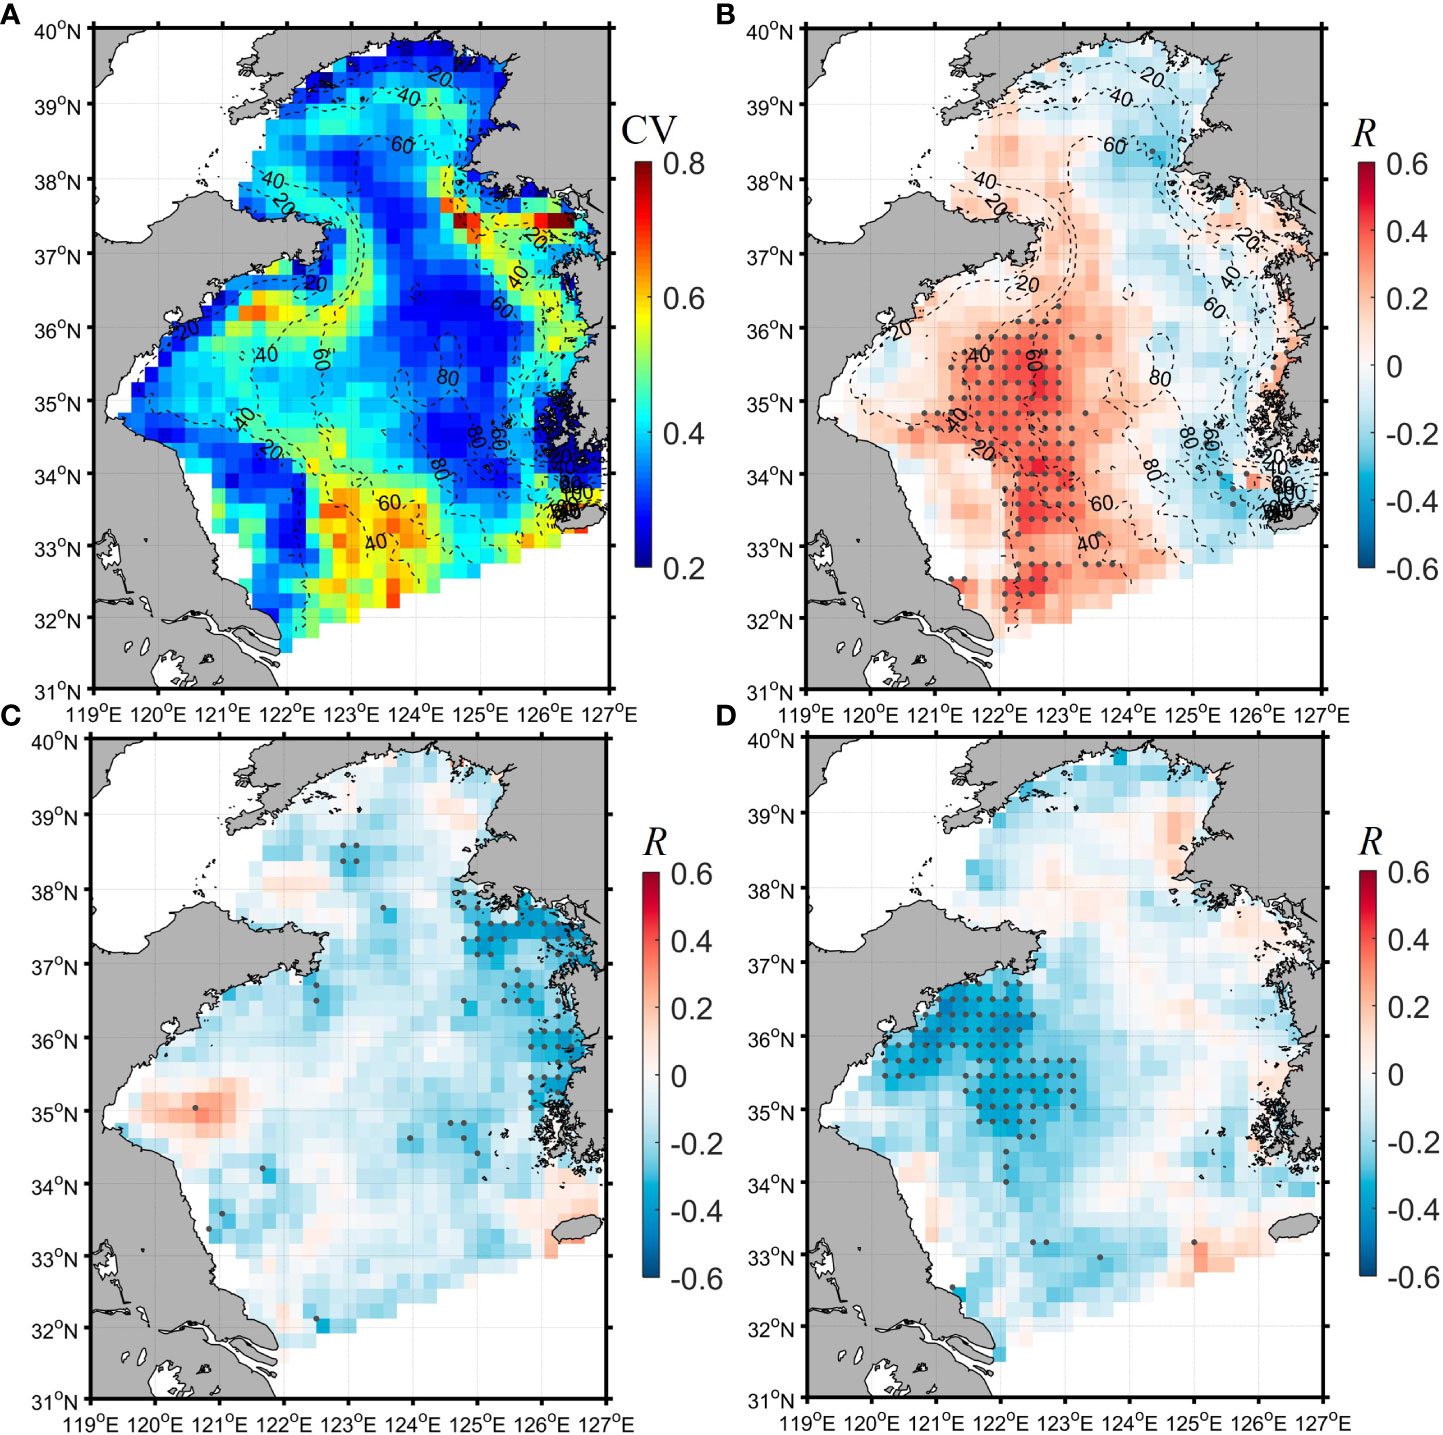
Figure 3 (A) The coefficient of variation (CV) for the monthly mean Chl-a in summer. (B–D) The correlation coefficient R for the monthly wind-Chl-a (B), SST-Chl-a (C), and CRD-Chl-a (D) correlation analyses, respectively. The gray dots in (B–D) denote the location of significant correlation (P<0.05). The black dash lines in (A, B) are the isobaths.
As the Pacific climate variabilities (especially PDO and ENSO) have important effects on the East Asian Monsoon system (e.g., Chen et al., 2013; Kim et al., 2014), they could indirectly influence the Chl-a in the Yellow Sea, which is demonstrated by the negative correlation between the summer mean Chl-a and both PDO and ENSO in the western Yellow Sea (Figures 4A, B). As shown in Figure 4, the region with the strong negative correlation between the summer Chl-a and the climate variabilities concentrated in the western Yellow Sea and basically corresponds to the region with the strong positive wind-Chl-a correlation (Figure 3B). Although the effect of ENSO and PDO on the East Asian monsoon could be complex and not be a simple linear correlation (e.g., Kim et al., 2014), the PDO/ENSO positive (negative) phase over the past nineteen years basically corresponded to the negative (positive) anomaly of the summer wind speed of the Yellow Sea (Figure 4C). Thus, the negative PDO/ENSO-wind and positive wind-Chl-a correlations in the western Yellow Sea could result in the inverse correlation between the PDO/ENSO and Chl-a, implying that the wind variability could be the pivotal factor driving the climatic variability of the summer Chl-a in the western Yellow Sea. In addition, PDO/ENSO could also influence SST and CRD besides wind. However, as shown in the correlation analysis (Figures 3C, D), the effects of SST and CRD on the summer Chl-a were much weaker than that of wind in summer (the potential cause will be discussed in Section 4.3). Thus, it is more likely that the PDO/ENSO influences the summer Chl-a variability by modulating the summer wind.
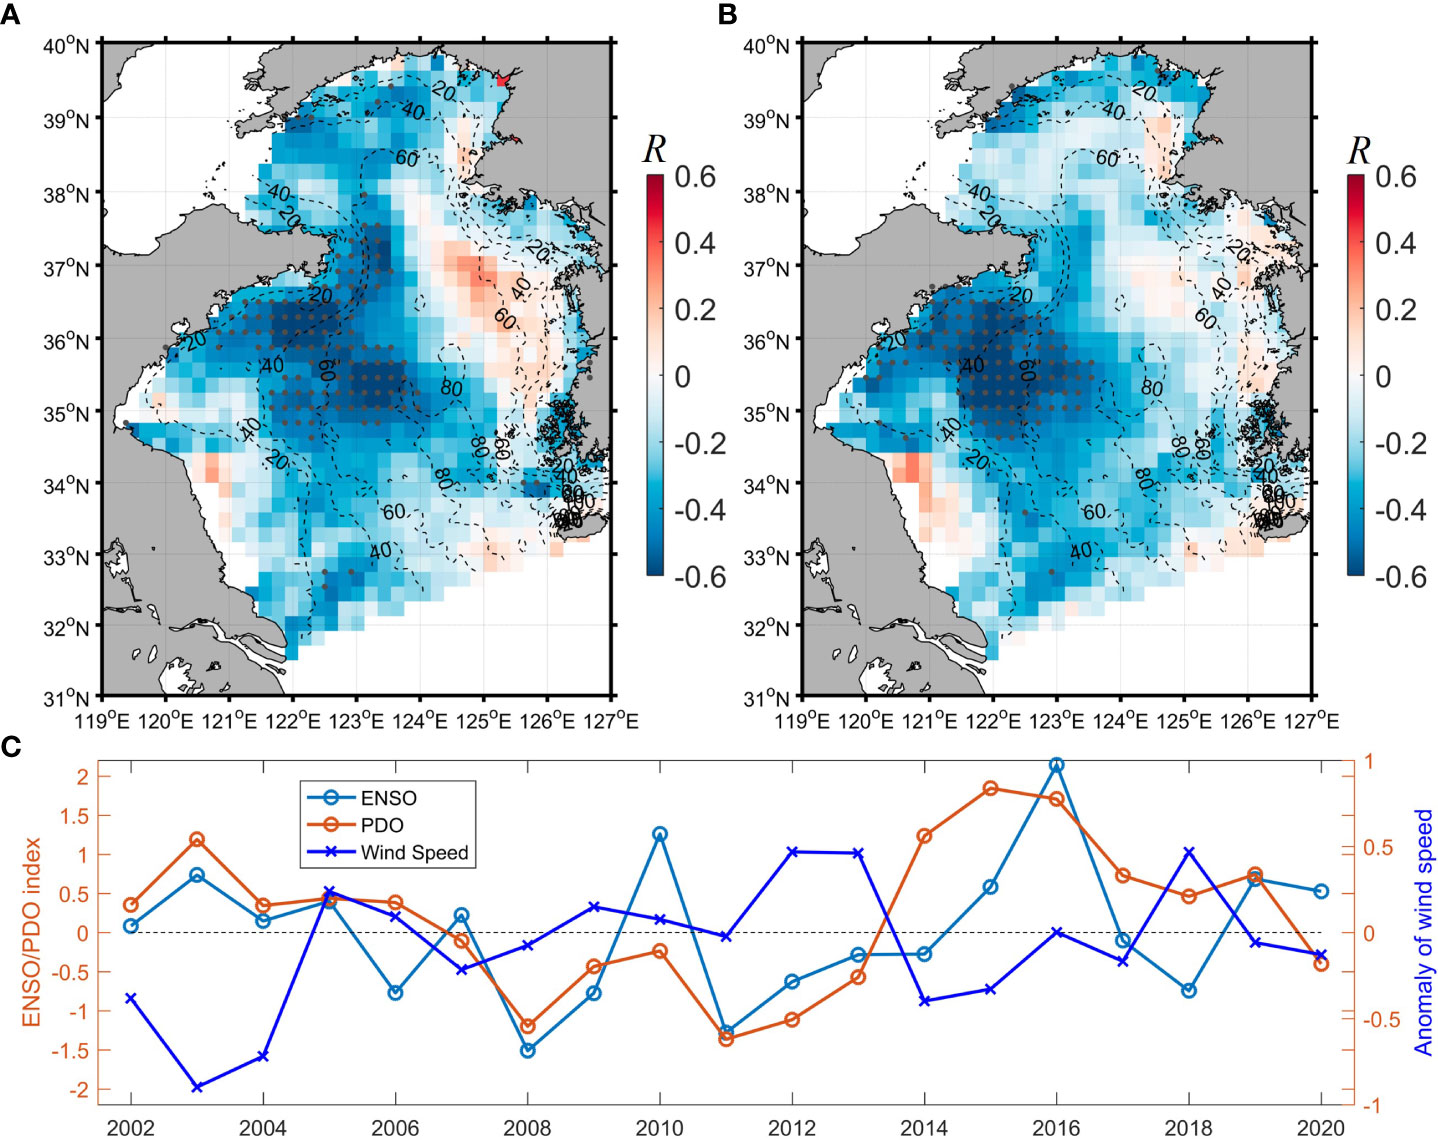
Figure 4 The correlation coefficient R for the interannual PDO-Chl-a (A) and ENSO-Chl-a (B) correlation analyses, respectively. The gray dots in (A, B) denote the location of significant correlation (P<0.05). (C) The interannual variability of the summer mean wind speed (m/s) over the Yellow Sea and the ENSO/PDO indexes from 2002 to 2020.
3.2. In-situ observations under different wind conditions
Based on two summer field surveys in C15 (weak wind time) and C18 (strong wind time), we analyzed the variations of sea temperature, salinity, nutrients along the three transects (Figure 1A: 34°N, 35°N and 36°N) to understand the effect of wind on the southwestern Yellow Sea. As shown in Figure 5, significant thermoclines and stratification occurred during the C15 and C18, with water depth > 20 m, high salinity (> 32), and low temperature (<12°C) occurring below the thermoclines, showing the edge position of the YSCWM. Compared with the T-S characteristics during weak wind observation (C15), high salinity water tongue (~32–33) during strong wind observation (C18) expanded more toward the coastal side and tilted upward to the surface waters (Figures 5A, and 6), indicating the occurrence of upwelling along the continental slope of the southwestern Yellow Sea under a strong wind condition.
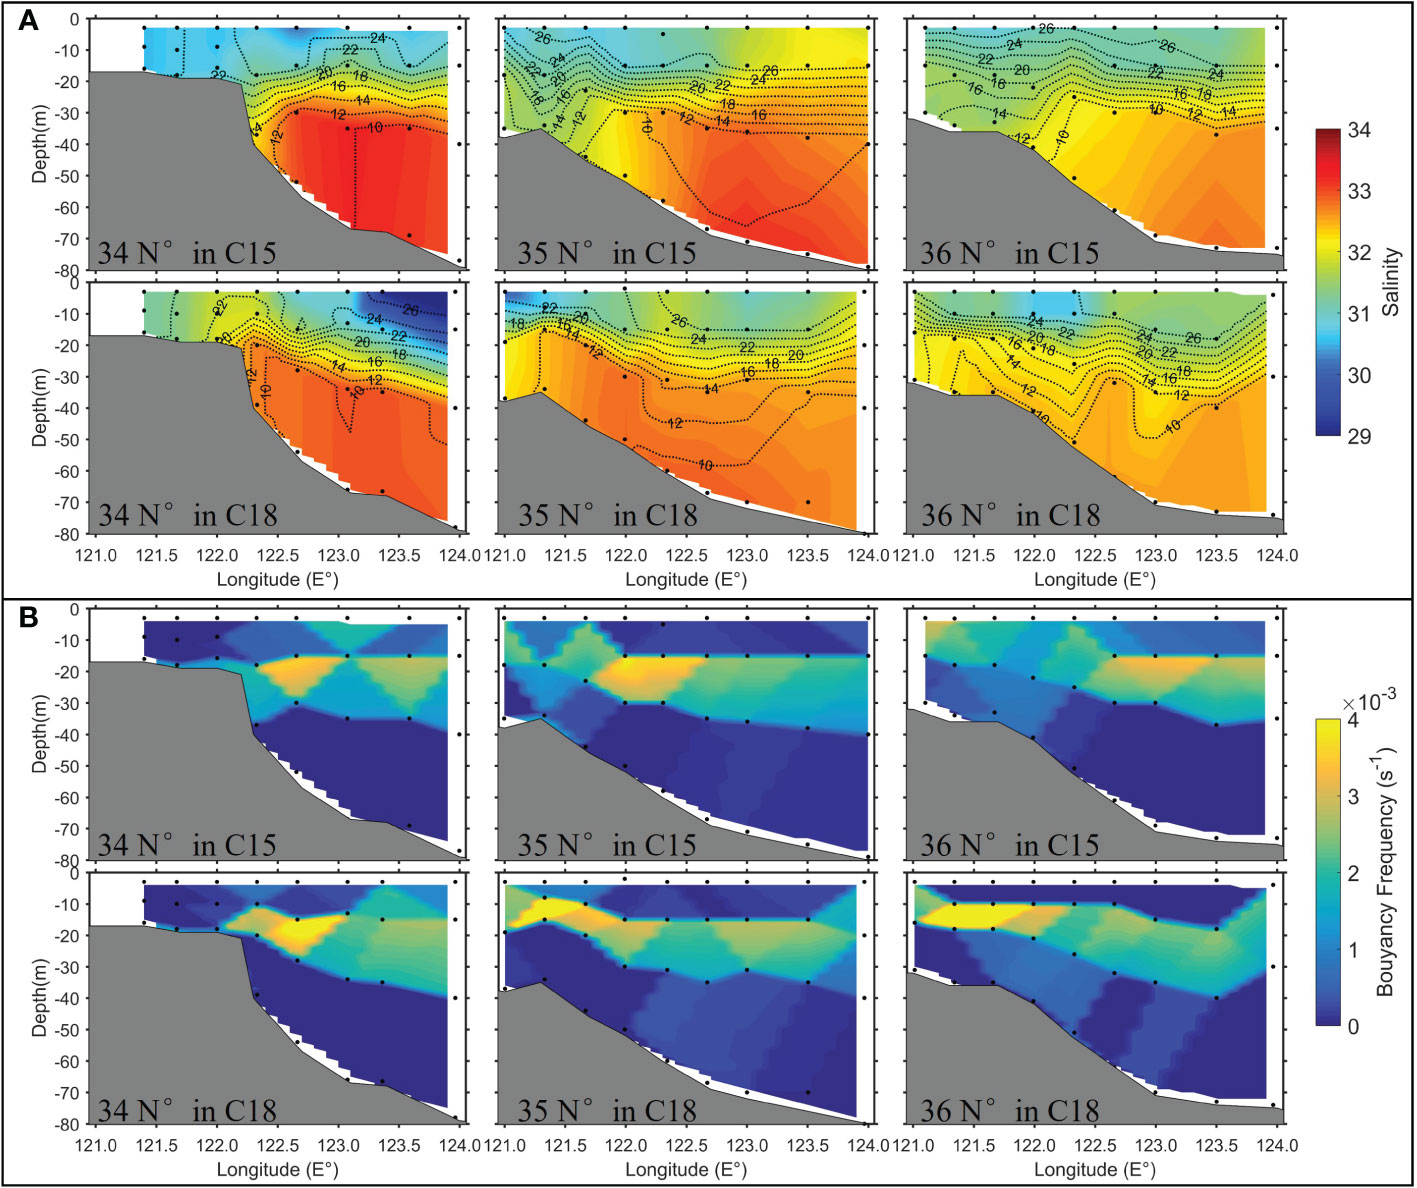
Figure 5 (A) The patterns of sea temperature (black lines, °C) and salinity (colors) along the three transects (34°N, 35°N, and 36°N) during C15 (upper panels) and C18 (lower panels). (B) The same as (A), except with the pattern of the buoyancy frequency.
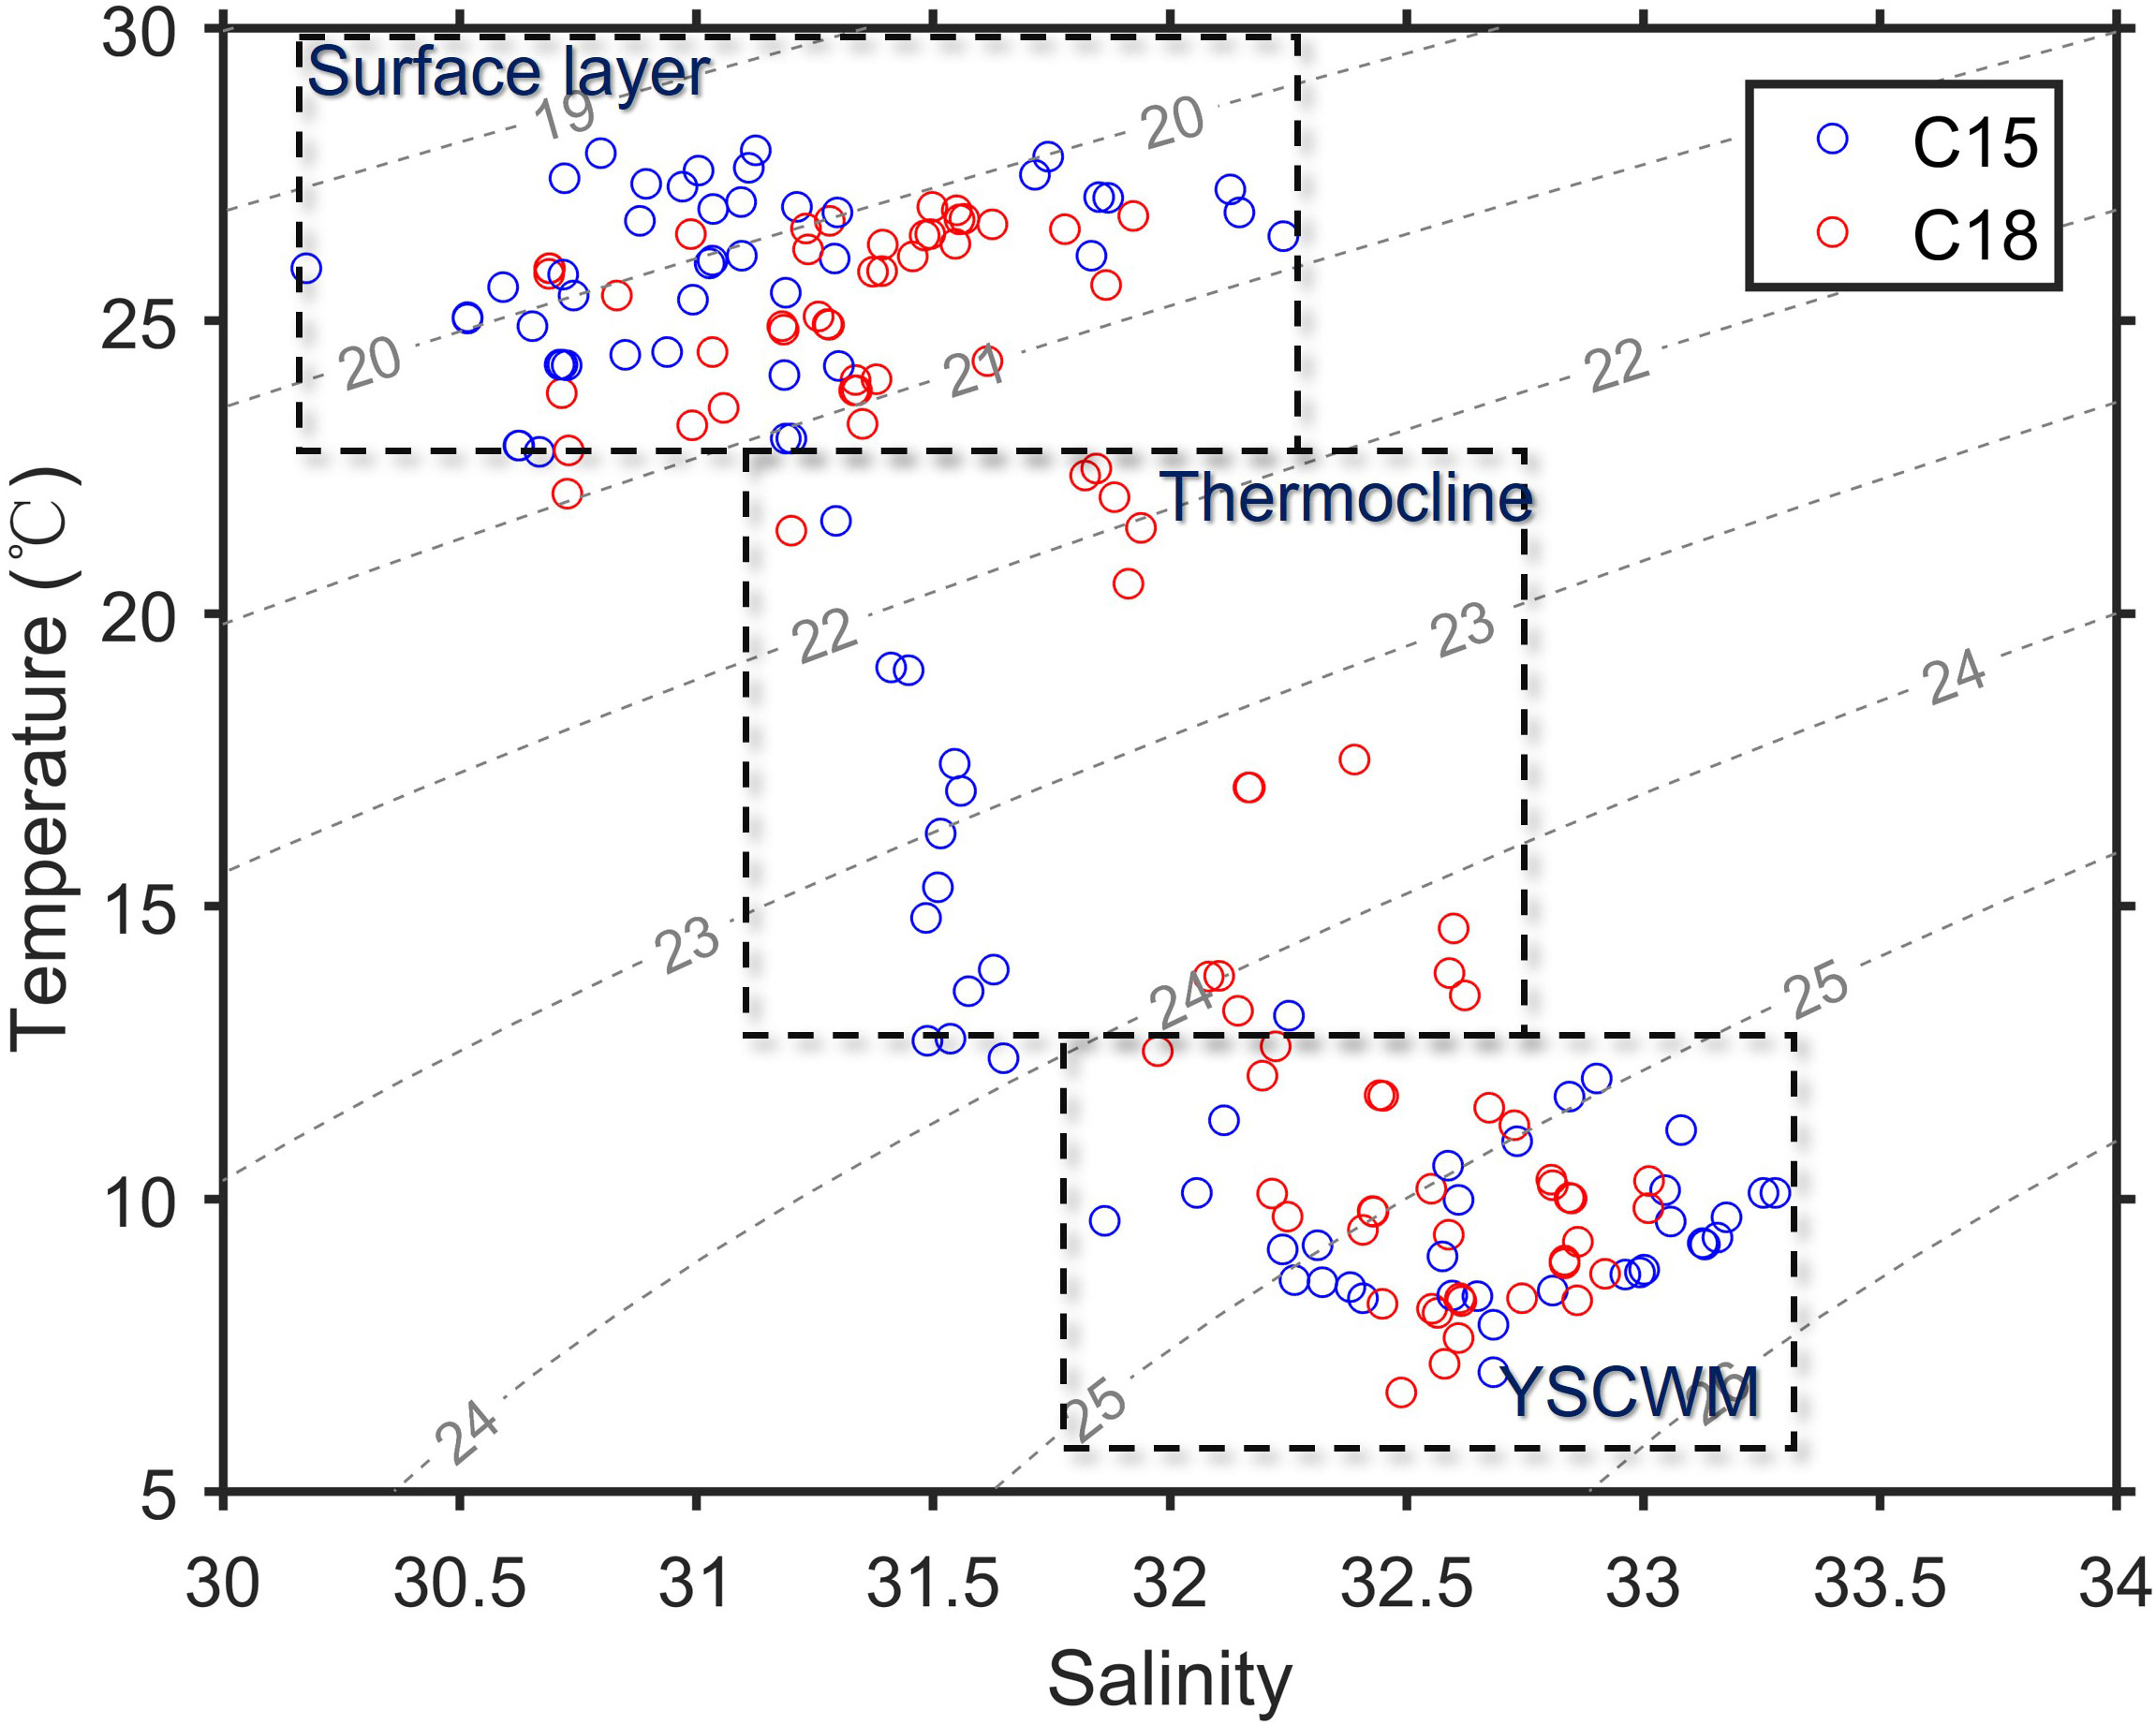
Figure 6 Temperature-Salinity (T-S) diagram during the two cruises (C15 and C18). The gray dash lines denote isopycnals (-1000 kg/m3). The dash boxes mark the different water masses (surface, thermocline, and bottom layers).
The spatial patterns of DIN, DIP, and DSi (Figure 7) along the three transects matched well with the patterns of water temperature and salinity (Figure 5A). The average DIN, DIP, and DSi concentrations in the YSCWM were similar during the observations in the C15 and C18 and larger than 6.0 μM, 0.32 μM, and 6.5 μM, respectively, which were 2-3 times higher than those in the upper waters (Table 1). Similar to the water temperature and salinity pattern, during the C18, high nutrient water expanded more to the coastal side along the seabed slope and tilted upward to the upper waters compared with their characteristics during the C15. The results reflect that the upwelling can transport nutrients from the YSCWM to the upper waters.
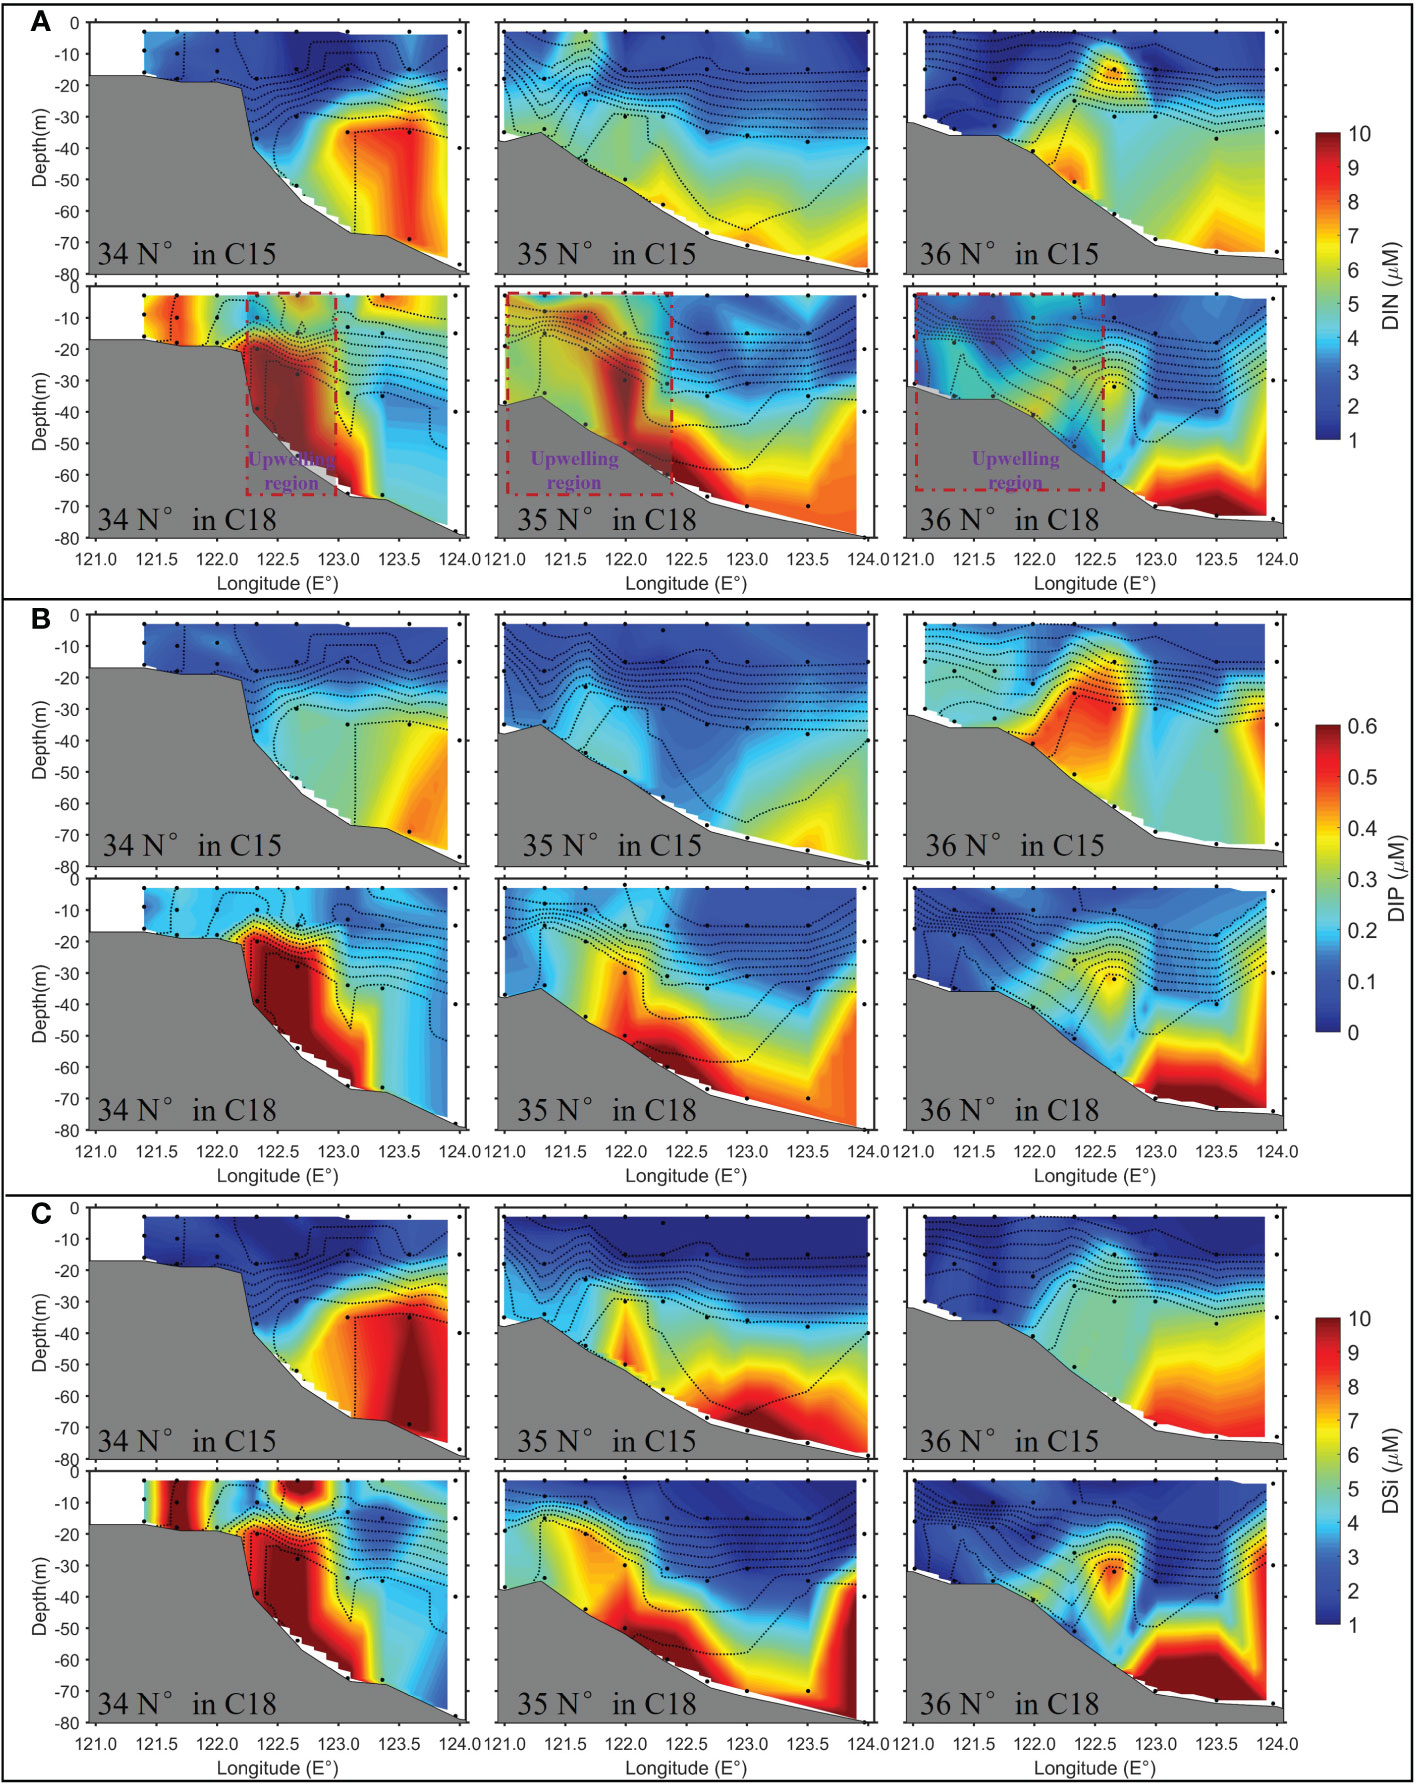
Figure 7 The patterns of DIN (A), DIP (B), and DSi (C) concentrations along the three transects (34°N, 35°N and 36°N) during C15 (upper panels) and C18 (lower panels). The black dash lines are isotherms (the interval of the isotherms is 2 °C). The red dashed boxes in (A) denote the upwelling region at water depths between 25 m and 62.5 m, which were derived from the analytical solution of wind-driven upwelling.
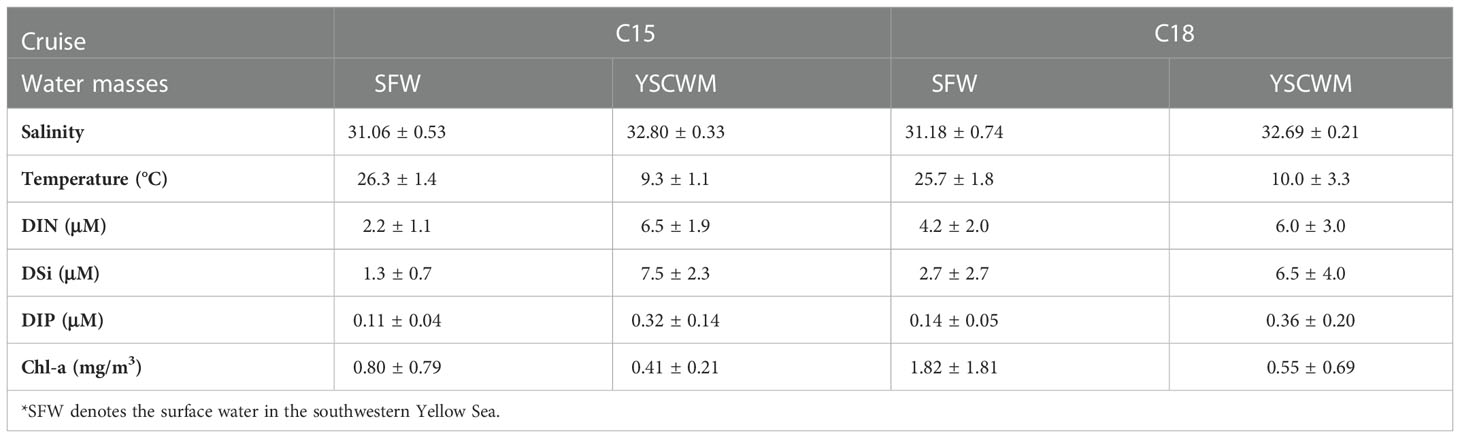
Table 1 Nutrient conditions and Chl-a concentrations of the three water masses during the two summer field surveys in the Yellow Sea.
The relatively high Chl-a concentrations responded to the upwelling during the C18 (Figure 8). In comparison, the Chl-a concentrations along the three transects in C18 were about twice of that in C15 (Table 1). In addition, relative to Chl-a in C15, the spatial scale of high Chl-a in C18 was denser and covered a wider range, including the edge of the YSCWM (Figure 8).
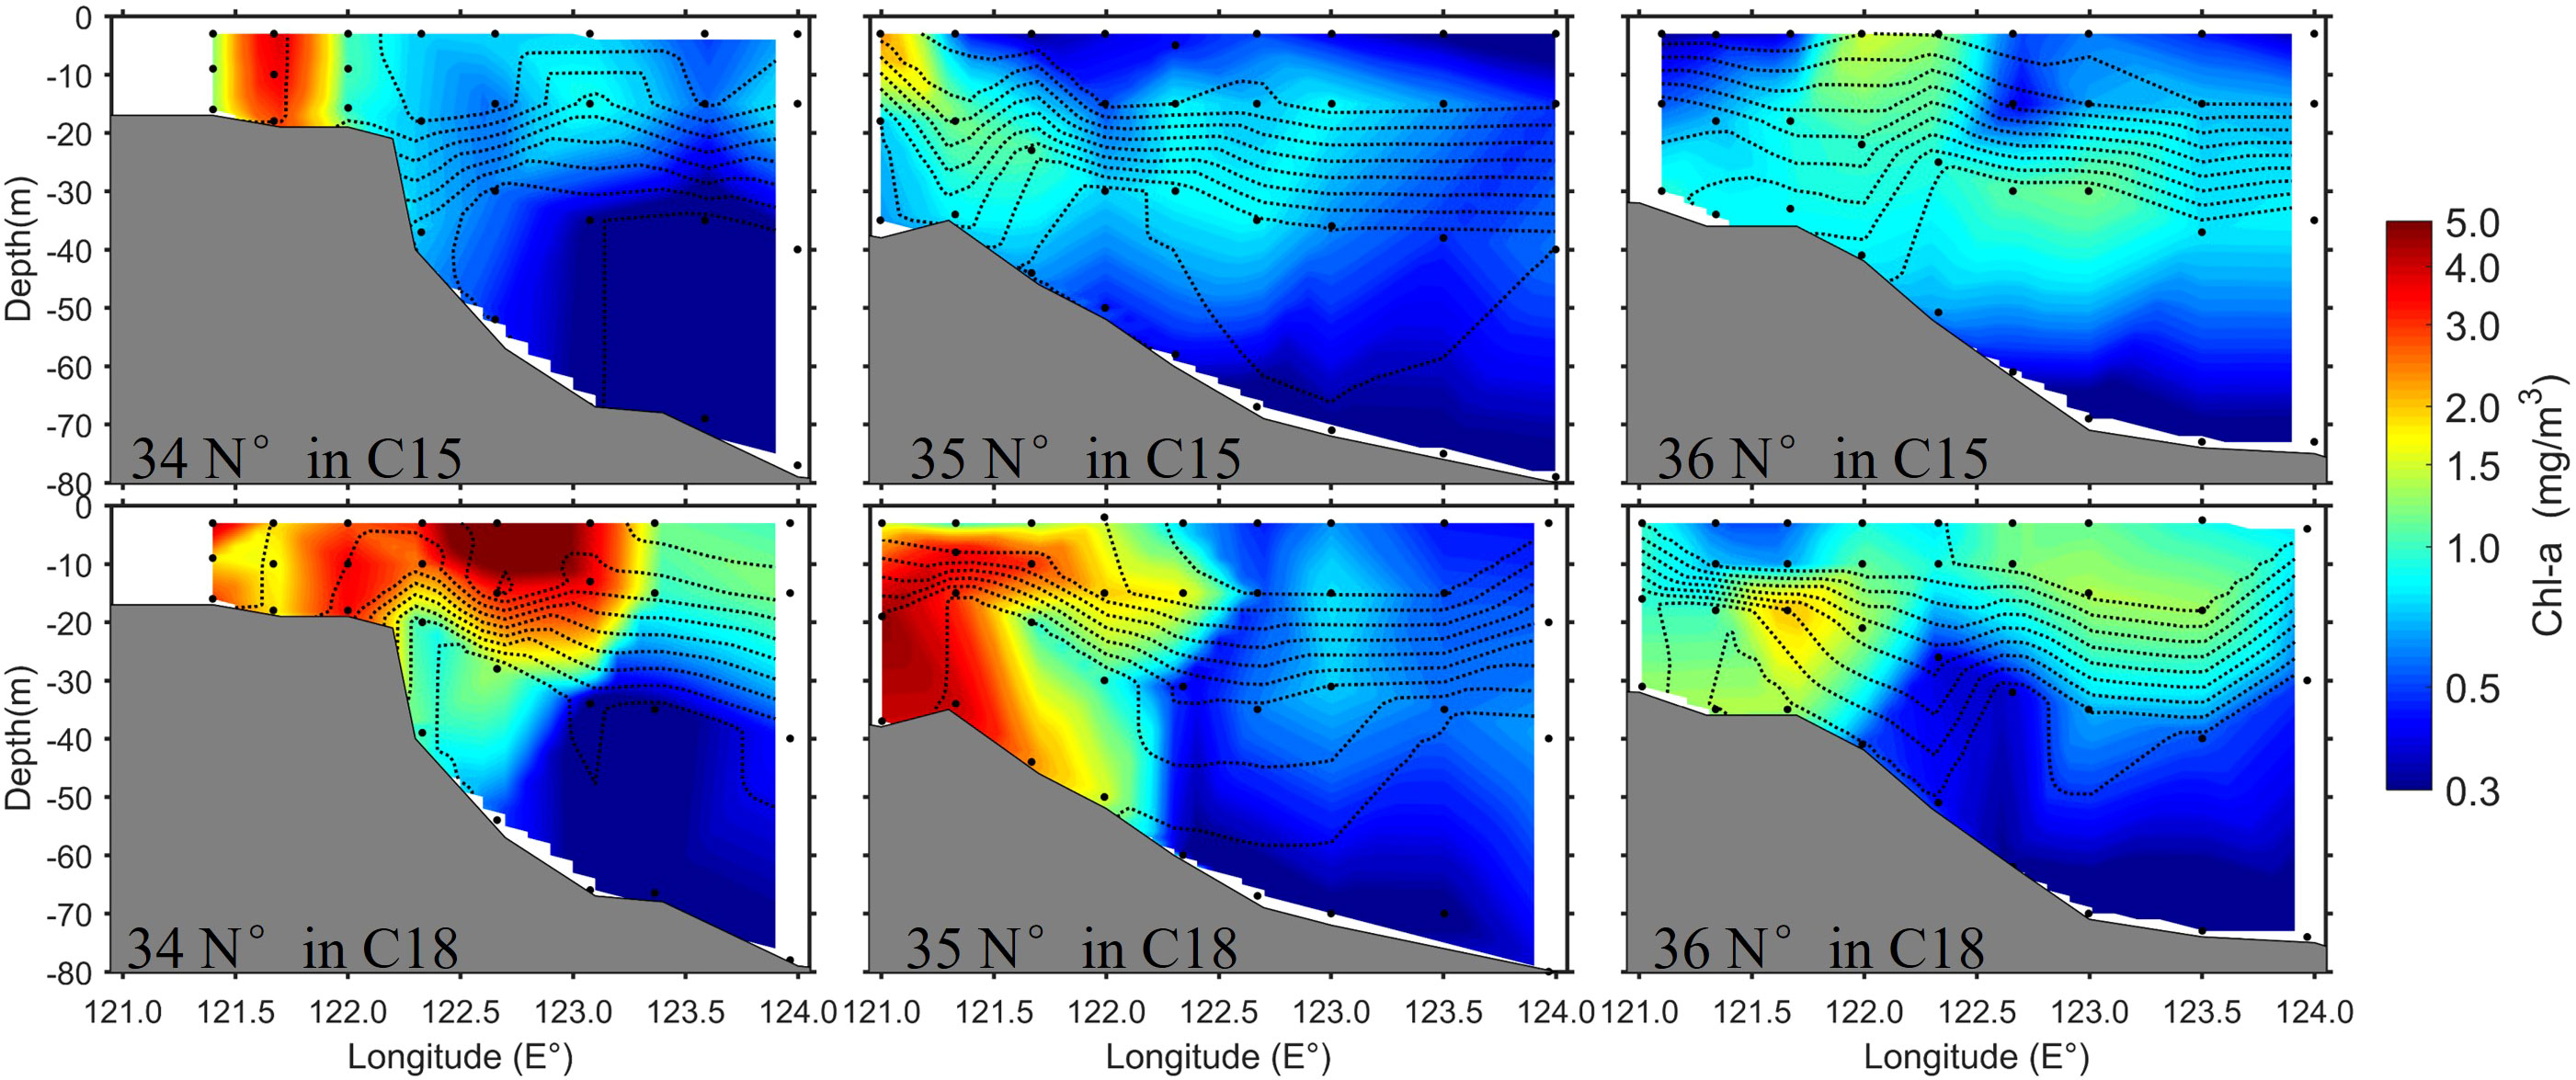
Figure 8 Chl-a concentrations along the three transects (34°N, 35°N, and 36°N) during C15 and C18. The black lines are isotherms.
In summary, the observation results of the two cruises show that the stronger upwelling along the slope in the southwestern Yellow Sea occurred during the cruise with the stronger wind, which pumped up more nutrient from the bottom water and resulted in a higher Chl-a in the upper layer. Although other factors (e.g., tide and stratification) could contribute to the different results of the two cruises, the wind is considered as the main factor inducing the strong upwelling and the higher Chl-a in the C18, which is further discussed in Section 4.
4. Discussion
4.1. Verification of the wind effect on the upwelling during the C18
The observation results showed a stronger upwelling along the slope in the southwestern Yellow Sea during the C18. However, the two summer cruises C15 and C18 were carried out in August and July, respectively, and have about 20 days interval. Beyond wind, other environmental factors, such as tides and stratification, could also be different and influence the coastal upwelling. The upwelling induced by tidal mixing fronts and its contribution to the nutrient fluxes in this region has been reported by Lü et al. (2010) and Wei et al. (2016). The numerical studies by Huang et al. (2018) and Liang et al. (2018) suggested the existence of a relation between the upwelling intensity induced by the tidal mixing fronts and the tidal phase. Their study indicated that the spring tide phase (larger tidal range) corresponds to a stronger upwelling in the southwestern Yellow Sea than the neap tide phase (smaller tidal range). Our analysis showed that the tidal range during C15 was slightly larger than that during C18 (see Figure S2 in the Supplementary Material), but the observations demonstrated a stronger upwelling during C18, implying that the stronger upwelling observed in C18 than C15 should not be induced by the difference in the tidal phase. Meanwhile, the intensity of stratification could also affect the intensity of the coastal upwelling to some extent (e.g., Jacox and Edwards, 2011). However, the temperature sections showed no significant difference in the stratification intensity between the two cruises (Figure 5). Hence, we suspected that the stronger upwelling observed during C18 could be mainly caused by wind since the upwelling-favorable wind during C18 was much stronger than that during C15 (Figure 2). Our speculation was further confirmed using the wind-driven upwelling theory (Method section: Equation 2) as the following analysis.
According to Estrade et al. (2008), wind-driven upwelling in coastal waters should occur in the region of 0.5D < h < 1.25D. According to the model results of Lin et al. (2020), the order of Aυ in the Yellow Sea in summer was ~10-2 m2/s, and f was ~10-4 1/s. Thus, the thickness of the Ekman layer D can be calculated as ~50 m for the southern Yellow Sea during summer. Finally, the wind-driven upwelling in the Yellow Sea should occur at 25 m < h < 62.5 m according to the wind-driven upwelling theory, which is highly consistent with the upwelling location inferred from the observed nutrient distribution in C18 (see the box region in Figure 7A). Meanwhile, the satellite-derived high wind-Chl-a correlation also was found exactly in this region (Figure 3B), indicating the important role of the wind-driven upwelling on the variability of summer Chl-a.
Moreover, the analytic analysis by Estrade et al. (2008) suggests that a steep sea-bottom slope can induce more intense upwelling than a gentle slope under the same wind conditions. In this study, the slope of the seafloor at the 34°N transect was steeper than that of the other two transects (Figure 5). Higher nutrient concentrations in the upper layer of the upwelling region in the 34°N transect indicate more intensified upwelling at 34°N than at 35°N and 36°N (Figure 7), which agrees with the wind-driven theory. The average wind speeds during the week before C18 and C15 were 6.0 m/s and 2.7 m/s, respectively. The two field survey months generally showed southerly wind direction, which is upwelling-favorable for the western Yellow Sea (Figure 2). According to Equation (5), the upwelling velocities for 6 m/s and 2.7 m/s winds were estimated as ~0.47 × 10⁻⁵ m/s and <0.1 × 10⁻⁵ m/s, respectively. The significant difference in the upwelling intensity estimated by the wind-driven upwelling theory could well explain the observed difference between the two cruises.
4.2. Estimating the contribution of wind-driven upwelling on the nutrient supply
The wind-driven upwelling could increase the nutrient release from the YSCWM and thus rise Chl-a concentrations in the upper layer. Compared with the C15, the surface nutrient concentration in the C18 significantly increased (Table 1), indicating the significant contribution of wind-driven upwelling to nutrient upward transport. Thus, both satellite and observation data showed the positive effects of summer winds on phytoplankton biomass at the continental slope region in the southwestern Yellow Sea. In general, cold water masses with rich nutrients appear in shelf seas (also referred to as the “cold pool”) in summer because of ocean stratification, e.g., Middle Atlantic Bight, North Sea, and Irish Sea (Houghton et al., 1982; Brown et al., 1999; Holt and Proctor, 2003). Some earlier studies have reported the significant impact of nutrients released from the cold pool on primary production on shelves (Dickey-Collas et al., 1997; Stabeno et al., 2007; Na et al., 2010). The turbulence entrainment and upwellings induced by tidal-mixing fronts are also important physical processes for transporting nutrients from the bottom to the upper water during summer (e.g., Wei et al., 2016). However, the tidal-mixing front is relatively stable with negligible monthly variability during summer (Pisoni et al., 2015; Lin et al., 2019b). Thus, wind with relatively strong variability becomes an important factor to drive the monthly and interannual variability of the summer chl-a (Figure 3).
Based on Equations (5) and (6), the contribution of the wind-driven upwelling to the nutrient upward flux can be estimated. The climatological mean wind in the Yellow Sea during summer is ~4.5 m/s, and thus the mean wind-induced upwelling in summer was estimated at ~0.26 × 10⁻⁵ m/s. According to Equation (6), the estimated mean nutrient fluxes DIN, DIP, and DSi (see Table 2) induced by wind-driven upwelling were 1345 ± 674 μmol/m2/d, 81 ± 45 μmol/m2/d, and 1460 ± 899 μmol/m2/d, respectively, accounting for ~30% of the total DIN and DSi supply and ~40% of the total DIP supply. These numbers are comparable to the upwelling fluxes induced by the tidal mixing front (Table 2), which is supported by the finding in the numerical study by Wang et al. (2021) that the summer wind and tide contribute almost equally to the coastal upwelling system in the southwestern Yellow Sea.
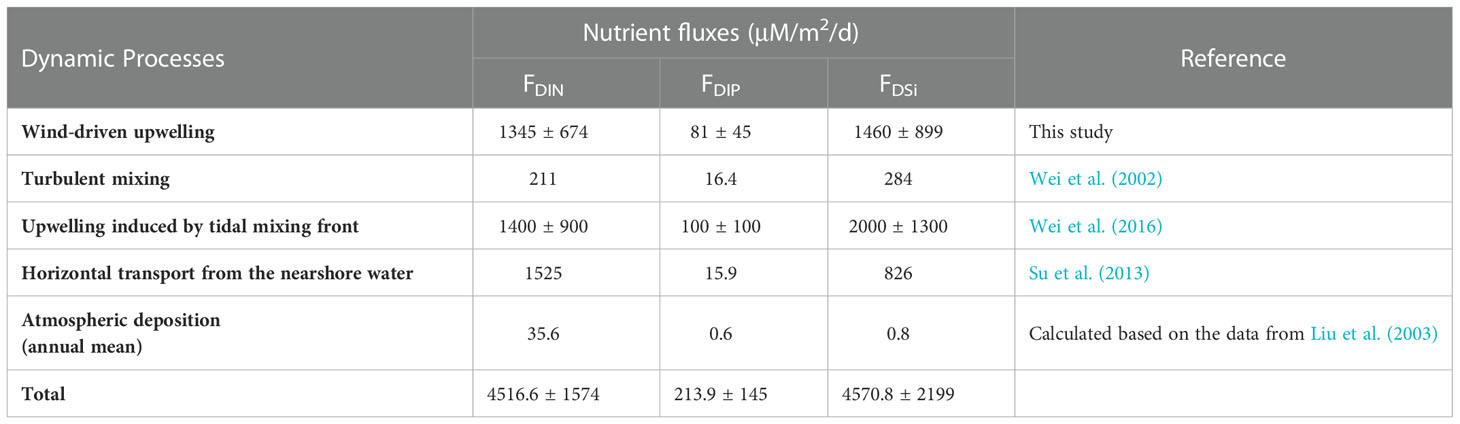
Table 2 Nutrient fluxes to the upper layer by different dynamic processes in the Yellow Sea during summer.
As shown in Table 2, the DIN fluxes contributed by the wind-driven upwelling are also comparable to the horizontal transport fluxes from nearshore water, but the contribution of the former to the DIP and DSi fluxes is much larger than that of the latter. Especially, the DIP nutrient flux by wind-driven upwelling was several times higher than the horizontal DIP transport flux from nearshore waters, which can sufficiently compensate for the phosphorus deficiency of the upper layer (Wang et al., 2003). Moreover, the long residence time of the nearshore water in summer (average ~91 days according to Lin et al., 2022) could also limit the effect of the nearshore nutrient on the phytoplankton in the central Yellow Sea. Thus, for the southwestern Yellow Sea, the nutrient supply from the bottom water could be more important than that from the supply from the nearshore water.
Wind can enhance not only upwelling but also vertical turbulent mixing, both of which can facilitate the upward transport of the bottom water (e.g., Williams et al., 2013). Based on observed data and a turbulent model in summer, Wei et al. (2002) calculated the average upward fluxes of DIN, DIP, and DSi driven by turbulent mixing in the Yellow Sea, which were 211 μmol/m2/d, 16.4 μmol/m2/d, and 284 μmol/m2/d, respectively. These numbers are approximately one order of magnitude smaller than those caused by wind-driven upwelling (Table 2), implying that the importance of wind-induced mixing in pumping bottom nutrients is much weaker than that of the wind-driven upwelling, especially for the continental slope region, which can well explain why the strong correlation between Chl-a and wind only occurred at the upwelling region rather than the entire sea. This conclusion is also supported by the numerical study by Meng et al. (2020). Meng et al. (2020) analyzed the effect of wind on the variability of the water temperature in the Yellow Sea in summer and pointed out that the mixing played a more important role in the variability in the central Yellow Sea while the advection dominated the variability in the slope region. In addition, our results also showed a negative correlation between winds and Chl-a in the eastern Yellow Sea (Figure 3B), indicating the dominance of wind-driven downwelling on phytoplankton variability over wind-induced mixing, because the latter can enhance Chl-a concentrations and should lead to a positive wind-Chl-a correlation. Therefore, the effect of wind on the summer Chl-a variability in the southwestern Yellow Sea should be mainly related to the wind-driven upwelling process, and the wind-induced mixing could play a secondary role. In addition, we further analyzed the correlation between the southeasterly wind (the alongshore component of the wind which is the major contributor to coastal wind-driven upwelling) and Chl-a in summer. The correlation pattern of the southeasterly wind with Chl-a was very similar to that of the wind speed (Figure S3 in the Supplementary Material), further suggesting the dominant role of the wind-driven upwelling in the wind effect on the Chl-a variability.
4.3. Effect of CRD and SST on the summer Chl-a
The effect of nutrient input from CRD was considered here because of the high Chl-a variability near the northern CRD (Figure 3D). The Changjiang River is the third largest river in the world and delivers abundant nutrients into the sea. However, Yamaguchi et al. (2012) and Wang et al. (2014) indicated that the influence of the Changjiang River diluted water mainly concentrated in the region from the central East China Sea to the Jeju Island. Under the forcing of the southeasterly summer wind, the Changjiang River diluted water extended northeasterly to the Jeju Island due to the Ekman transport (Lie and Cho, 2016), which could explain its influence on the regions from offshore of the Changjiang River mouth to the east of Jeju Island. However, the correlation between CRD and Chl-a was relatively weak in the southwestern Yellow Sea and even negative in some places, suggesting the limited effect of CRD on the southwestern Yellow Sea. This might be related to the influence of tides and the southwards of tidal residual currents in the Jiangsu offshore water during summer (Xuan et al., 2016). Thus, from the perspective of the ocean current, the Changjiang River’s diluted water might have a relatively small effect on the phytoplankton in the southwestern Yellow Sea during summer. In addition, the correlation between CRD and Chl-a was not significant in the Changjiang estuary offshore region (Figure 3D), which was also found in Yamaguchi et al. (2012). The insignificant correlation between Chl-a and CRD could be due to the large nutrient stocks in the offshore region of the Changjiang estuary, which is sufficient for the phytoplankton. However, there was a strong light limitation for the phytoplankton in this region due to the high water turbidity (e.g., Li et al., 2021), and thus the light was more important for the phytoplankton growth in this region, which can explain the weak correlation between CRD and Chl-a in the Changjiang estuary offshore region.
This study also presented a weak correlation between Chl-a and SST in the Yellow Sea during summer. SST can influence phytoplankton by affecting the density stratification between the surface layer and the nutrient-rich bottom waters, which can modulate vertical turbulent mixing and supply the upper layer with bottom nutrients for phytoplankton utilization (Boyce et al., 2011). However, the cold YSCWM and the strong surface heating induced a significant vertical temperature difference of >14°C within a water layer thickness of just 20 m (Figure 5A). This produced a highly stable thermocline in the Yellow Sea during summer, which could not be easily affected by the SST variability (monthly ±1.1°C). Earlier biophysiological studies also mentioned the poor effect of the SST variability of ±1.1°C on the growth rate of phytoplankton (e.g., Eppley, 1972; Berges et al., 2002). This should explain why the change in SST has a limited impact on phytoplankton biomass in the Yellow Sea in summer. Some studies reported significantly inverse correlations between interannual SST and Chl-a in the Yellow Sea (Liu and Wang, 2013; Liu et al., 2019; Zhai et al., 2021). Lin et al. (2019a) suggested the importance of water turbidity and vertical average irradiance in influencing Chl-a variability during winter. Thus, the inverse interannual SST-Chl-a correlation might be related to the impact of SST on phytoplankton biomass in spring and autumn during the occurrence of phytoplankton blooms. Both spring and autumn phytoplankton blooms are related to water stability (e.g., Song et al., 2010; Shi et al., 2017; Lv et al., 2022). Due to the relatively weak thermocline in spring and autumn, the SST variability might have a more significant effect on water stability and thus influence phytoplankton biomass in spring and autumn. Nevertheless, the detailed mechanism of the SST effect on interannual Chl-a variability is beyond the scope of the present study and will be investigated in the following study.
5. Conclusions
Using satellite data and in-situ observations, this study examined the effects of wind on the variability of phytoplankton biomass in the Yellow Sea during summer. Wind and Chl-a satellite data showed a significant positive correlation in the southwestern Yellow Sea during summer, suggesting a positive contribution of summer wind to the phytoplankton biomass. Compared with the effect of wind, the effect of SST and CRD on the phytoplankton variability was much weaker during summer. By comparing data from two summer field observations in the southwestern Yellow Sea, we found that wind-driven upwelling of the nutrient-rich YSCWM increased the nutrient and Chl-a concentrations in the upper layer of the southwestern Yellow Sea. The estimated mean nutrient fluxes DIN, DIP, and DSi caused by wind-driven upwelling in summer were 1345 ± 674 μmol/m2/d, 81 ± 45 μmol/m2/d, and 1460 ± 899 μmol/m2/d, respectively, which accounted for more than 30% of the total nutrient supply to the upper layer of the southwestern Yellow Sea during summer. This study highlights the pivotal role of summer wind on Chl-a variability in the shelf sea.
Data availability statement
The raw data supporting the conclusions of this article will be made available by the authors, without undue reservation.
Author contributions
LL designed the study, organized all the data, analyzed the results, and wrote the manuscript. DL supervised the fieldwork and experiments and edited the manuscript. YW provided and processed the satellite data. TL participated in the cruises and analyzed some samples. YZ and WT did some data analysis. All authors contributed to the article and approved the submitted version.
Funding
This study was supported by the National Natural Science Foundation of China (Grant No. 42030402, 41876127, and 41706011), the National Key Fundamental Research and Development Plan of China (Grant No. 2016YFC1402106-06), the National Natural Science Foundation of China (NSFC) Open Research Cruise (Cruise No. NORC2015-01 and NORC2018-01), the Natural Science Foundation of Shandong Province (Grant No. ZR2022MD011) and the Open Research Fund of State Key Laboratory of Estuarine and Coastal Research (Grant No. SKLEC-KF202105 and SKLEC-KF202205).
Acknowledgments
The authors thank the ECMWF and NASA for providing access to wind and SST data. The data acquisition and sample collection were supported by the National Natural Science Foundation of China (NSFC) Open Research Cruise (Cruise No. NORC2015-01 and NORC2018-01), funded by the Shiptime Sharing Project of NSFC. The field surveys were conducted onboard R/V “DONGFANGHONG 2” by Ocean University of China.
Conflict of interest
The authors declare that the research was conducted in the absence of any commercial or financial relationships that could be construed as a potential conflict of interest.
Publisher’s note
All claims expressed in this article are solely those of the authors and do not necessarily represent those of their affiliated organizations, or those of the publisher, the editors and the reviewers. Any product that may be evaluated in this article, or claim that may be made by its manufacturer, is not guaranteed or endorsed by the publisher.
Supplementary material
The Supplementary Material for this article can be found online at: https://www.frontiersin.org/articles/10.3389/fmars.2022.1104258/full#supplementary-material
References
Bauer J. E., Cai W. J., Raymond P. A., Bianchi T. S., Hopkinson C. S., Regnier P. A. (2013). The changing carbon cycle of the coastal ocean. Nature 504 (7478), 61–70. doi: 10.1038/nature12857
Berges J. A., Varela D. E., Harrison P. J. (2002). Effects of temperature on growth rate, cell composition and nitrogen metabolism in the marine diatom thalassiosira pseudonana (bacillariophyceae). Mar. Ecol. Prog. 225 (4), 139–146. doi: 10.3354/meps225139
Boyce D. G., Lewis M. R., Worm B. (2011). Global phytoplankton decline over the past century. Nature 466 (7306), 591–596. doi: 10.1038/nature09268
Brown J., Hill A. E., Fernand L., Horsburgh K. J. (1999). Observations of a seasonal jet-like circulation at the central north Sea cold pool margin. Estuarine Coast. Shelf Sci. 48 (3), 343–355. doi: 10.1006/ecss.1999.0426
Chen W., Feng J., Wu R. (2013). Roles of ENSO and PDO in the link of the East Asian winter monsoon to the following summer monsoon. J. Climate 26 (2), 622–635. doi: 10.1175/JCLI-D-12-00021.1
Chen P., Zang L., Shi X., Zhang C. (2012). Estimated nutrients contribution of the north yellow Sea cold water mass in summer. Periodical Ocean Univ. China 42 (4), 71–74. doi: 10.16441/j.cnki.hdxb.2012.04.011
Choi B. J., Lee J. A., Choi J. S., Park J. G., Lee S. H., Yih W. (2017). Influence of the tidal front on the three-dimensional distribution of spring phytoplankton community in the eastern yellow Sea. Chemosphere 173, 299–306. doi: 10.1016/j.chemosphere.2017.01.048
Daneri G., Lizárraga L., Montero P., González H. E., Tapia F. J. (2012). Wind forcing and short-term variability of phytoplankton and heterotrophic bacterioplankton in the coastal zone of the concepción upwelling system (Central Chile). Prog. Oceanography 92-95, 92–96. doi: 10.1016/j.pocean.2011.07.013
Dickey-Collas M., Brown J., Fernand L., Hill A. E., Horsburgh K. J., Garvine R. W. (1997). Does the western Irish Sea gyre influence the distribution of pelagic juvenile fish? J. Fish. Biol. 51 (sA), 206–229. doi: 10.1111/j.1095-8649.1997.tb06100.x
Eppley R. W. (1972). Temperature and phytoplankton growth in the sea. Fish. Bull. 70 (4), 1063–1085.
Estrade P., Marchesiello P., Verdière D., Colin A., Roy C. (2008). Cross-shelf structure of coastal upwelling: A two–dimensional extension of ekman's theory and a mechanism for inner shelf upwelling shut down. J. Mar. Res. 66 (5), 589–616. doi: 10.1357/002224008787536790
Fu M., Sun P., Wang Z., Wei Q., Qu P., Zhang X., et al. (2018). Structure, characteristics and possible formation mechanisms of the subsurface chlorophyll maximum in the yellow Sea cold water mass. Continental Shelf Res. 165, 93–105. doi: 10.1016/j.csr.2018.07.007
Fu M., Wang Z., Li Y., Li R., Sun P., Wei X., et al. (2009). Phytoplankton biomass size structure and its regulation in the southern yellow Sea (China): Seasonal variability. Continental Shelf Res. 29 (18), 2178–2194. doi: 10.1016/j.csr.2009.08.010
Guo C., Zhang G., Sun J., Leng X., Xu W., Wu C., et al. (2020). Seasonal responses of nutrient to hydrology and biology in the southern yellow Sea. Continental Shelf Res. 206, 104207. doi: 10.1016/j.csr.2020.104207
Holt J. T., Proctor R. (2003). The role of advection in determining the temperature structure of the Irish Sea. J. Phys. Oceanography 33 (11), 2288–2306. doi: 10.1175/1520-0485(2003)033<2288:TROAID>2.0.CO;2
Houghton R. W., Schlitz R., Beardsley R. C., Butman B., Chamberlin J. L. (1982). The middle atlantic bight cold pool: evolution of the temperature structure during summer 1979. J. Phys. Oceanography 12 (10), 1019–1029. doi: 10.1175/1520-0485(1982)012<1019:TMABCP>2.0.CO;2
Huang M., Liang X. S., Wu H., Wang Y. (2018). Different generating mechanisms for the summer surface cold patches in the yellow Sea. Atmosphere-Ocean 56 (4), 199–211. doi: 10.1080/07055900.2017.1371580
Jacox M. G., Edwards C. A. (2011). Effects of stratification and shelf slope on nutrient supply in coastal upwelling regions. J. Geophys. Res. 116 (C3), C03019. doi: 10.1029/2010JC006547
Kahru M., Gille S. T., Murtugudde R., Strutton P. G., Manzano-Sarabia M., Wang H., et al. (2010). Global correlations between winds and ocean chlorophyll. J. Geophysical Res. 115 (C12), C12040. doi: 10.1029/2010JC006500
Kim J., Yeh S., Chang E. (2014). Combined effect of El niño-southern oscillation and pacific decadal oscillation on the East Asian winter monsoon. Climate Dynamics 42 (3-4), 957–971. doi: 10.1007/s00382-013-1730-z
Liang X., Huang M., Wu H., Wang Y. (2018). “The yellow sea surface cold patches in warm seasons,” in Coastal environment, disaster, and infrastructure-a case study of china's coastline (London: IntechOpen).
Lie H., Cho C. (2016). Seasonal circulation patterns of the yellow and East China seas derived from satellite-tracked drifter trajectories and hydrographic observations. Prog. Oceanograph. 146, 121–141. doi: 10.1016/j.pocean.2016.06.004
Li W., Ge J., Ding P., Ma J., Glibert P. M., Liu D. (2021). Effects of dual fronts on the spatial pattern of chlorophyll-a concentrations in and off the changjiang river estuary. Estuaries Coasts 44 (5), 1408–1418. doi: 10.1007/s12237-020-00893-z
Lin L., Liu D., Fu Q., Guo X., Liu G., Liu H., et al. (2022). Seasonal variability of water residence time in the subei coastal water, yellow Sea: The joint role of tide and wind. Ocean Model. 180, 102137. doi: 10.1016/j.ocemod.2022.102137
Lin L., Liu D., Guo X., Luo C., Cheng Y. (2020). Tidal effect on water export rate in the Eastern shelf seas of China. J. Geophysical Research: Oceans 125 (5), e2019JC015863. doi: 10.1029/2019JC015863
Lin L., Liu D., Luo C., Xie L. (2019b). Double fronts in the yellow Sea in summertime identified using sea surface temperature data of multi-scale ultra-high resolution analysis. Continental Shelf Res. 175, 76–86. doi: 10.1016/j.csr.2019.02.004
Lin L., Wang Y., Liu D. (2019a). Vertical average irradiance shapes the spatial pattern of winter chlorophyll-a in the yellow Sea. Estuarine Coast. Shelf Sci. 224, 11–19. doi: 10.1016/j.ecss.2019.04.042
Li Y., Peng S., Wang J., Yan J., Huang H. (2018). On the mechanism of the generation and interannual variations of the summer upwellings West and southwest off the hainan island. J. Geophysical Research: Oceans 123 (11), 8247–8263. doi: 10.1029/2018JC014226
Liu X., Huang B., Huang Q., Wang L., Ni X., Tang Q., et al. (2015). Seasonal phytoplankton response to physical processes in the southern yellow Sea. J. Sea Res. 95, 45–55. doi: 10.1016/j.seares.2014.10.017
Liu C., Sun Q., Xing Q., Wang S., Tang D., Zhu D., et al. (2019). Variability in phytoplankton biomass and effects of sea surface temperature based on satellite data from the yellow Sea, China. PLos One 14 (8), e220058. doi: 10.1371/journal.pone.0220058
Liu D., Wang Y. (2013). Trends of satellite derived chlorophyll-a, (1997–2011) in the bohai and yellow seas, China: Effects of bathymetry on seasonal and inter-annual patterns. Prog. Oceanography 116 (9), 154–166. doi: 10.1016/j.pocean.2013.07.003
Liu S. M., Zhang J., Chen S. Z., Chen H. T., Hong G. H., Wei H., et al. (2003). Inventory of nutrient compounds in the yellow Sea. Continental Shelf Res. 23 (11-13), 1161–1174. doi: 10.1016/S0278-4343(03)00089-X
Lü X., Qiao F., Xia C., Wang G., Yuan Y. (2010). Upwelling and surface cold patches in the yellow Sea in summer: Effects of tidal mixing on the vertical circulation. Continental Shelf Res. 30 (6), 620–632. doi: 10.1016/j.csr.2009.09.002
Lv T., Liu D., Zhou P., Lin L., Wang Y., Wang Y. (2022). The coastal front modulates the timing and magnitude of spring phytoplankton bloom in the yellow Sea. Water Res. 220, 118669. doi: 10.1016/j.watres.2022.118669
Meng Q., Li P., Zhai F., Gu Y. (2020). The vertical mixing induced by winds and tides over the yellow Sea in summer: a numerical study in 2012. Ocean Dynamics 70 (7), 847–861. doi: 10.1007/s10236-020-01368-2
Na H., Kim K. Y., Chang K. I., Kim K., Yun J. Y., Minobe S. (2010). Interannual variability of the Korea strait bottom cold water and its relationship with the upper water temperatures and atmospheric forcing in the Sea of Japan (East Sea). J. Geophysical Research: Oceans 115 (C9), C09031. doi: 10.1029/2010JC006347
Pisoni J. P., Rivas A. L., Piola A. R. (2015). On the variability of tidal fronts on a macrotidal continental shelf, northern Patagonia, Argentina. Deep-Sea Res. Part II 119, 61–68. doi: 10.1016/j.dsr2.2014.01.019
Shen C., Yan Y., Zhao H., Pan J., T. Devlin A. (2018). Influence of monsoonal winds on chlorophyll-α distribution in the beibu gulf. PLos One 13 (1), e191051. doi: 10.1371/journal.pone.0191051
Shi J., Liu Y., Mao X., Guo X., Wei H., Gao H. (2017). Interannual variation of spring phytoplankton bloom and response to turbulent energy generated by atmospheric forcing in the central southern yellow Sea of China: Satellite observations and numerical model study. Continental Shelf Res. 143, 257–270. doi: 10.1016/j.csr.2016.06.008
Song H., Ji R., Stock C., Wang Z. (2010). Phenology of phytoplankton blooms in the Nova scotian shelf-gulf of Maine region: remote sensing and modeling analysis. J. Plankton Res. 32 (11), 1485–1499. doi: 10.1093/plankt/fbq086
Stabeno P. J., Bond N. A., Salo S. A. (2007). On the recent warming of the southeastern Bering Sea shelf. Deep Sea Res. Part II: Top. Stud. Oceanogr. 54 (23), 2599–2618. doi: 10.1016/j.dsr2.2007.08.023
Su N., Du J., Liu S., Zhang J. (2013). Nutrient fluxes via radium isotopes from the coast to offshore and from the seafloor to upper waters after the 2009 spring bloom in the yellow Sea. Deep Sea Res. Part II: Topical Stud. Oceanography 97, 33–42. doi: 10.1016/j.dsr2.2013.05.003
Su Y. S., Weng X. C. (1994). “Water masses in China seas,” in Oceanology of China seas (Netherlands: Springer), 3–16.
Tian T., Wei H., Su J., Chung C. (2005). Simulations of annual cycle of phytoplankton production and the utilization of nitrogen in the yellow Sea. J. Oceanography 61 (2), 343–357. doi: 10.1007/s10872-005-0045-z
Wang Y., Gao Z. (2020). Contrasting chlorophyll-a seasonal patterns between nearshore and offshore waters in the bohai and yellow seas, China: A new analysis using improved satellite data. Continental Shelf Res. 203, 104173. doi: 10.1016/j.csr.2020.104173
Wang S. Q., Ishizaka J., Yamaguchi H., Tripathy S. C., Hayashi M., Xu Y. J., et al. (2014). Influence of the changjiang river on the light absorption properties of phytoplankton from the East China Sea. Biogeosciences 11 (7), 1759–1773. doi: 10.5194/bg-11-1759-2014
Wang Y., Liu D., Tang D. L. (2017). Application of a generalized additive model (GAM) for estimating chlorophyll-a concentration from MODIS data in the bohai and yellow seas, China. Int. J. Remote Sens. 38 (3), 639–661. doi: 10.1080/01431161.2016.1268733
Wang B. D., Wang X. L., Zhan R. (2003). Nutrient conditions in the yellow Sea and the East China Sea. Estuar. Coast. Shelf Sci. 58 (1), 127–136. doi: 10.1016/S0272-7714(03)00067-2
Wang B., Wu L., Zhao N., Liu T., Hirose N. (2021). Summer wind effects on coastal upwelling in the southwestern yellow Sea. J. Mar. Sci. Eng. 9 (9), 1021. doi: 10.3390/jmse9091021
Wei Q., Fu M., Sun J., Yao Q., Wang B., Liu X., et al. (2020). Seasonal physical fronts and associated biogeochemical-ecological effects off the jiangsu shoal in the Western yellow Sea, China. J. Geophys. Res.: Oceans 125 (10), e2020JC016304. doi: 10.1029/2020JC016304
Wei H., Wang L., Lin Y. A., Chung C. S. (2002). Nutrient transport across the thermocline in the central yellow Sea. Adv. Mar. Sci. 20 (3), 15–20.
Wei Q. S., Yu Z. G., Wang B. D., Fu M. Z., Xia C. S., Liu L., et al. (2016). Coupling of the spatial–temporal distributions of nutrients and physical conditions in the southern yellow Sea. J. Mar. Syst. 156, 30–45. doi: 10.1016/j.jmarsys.2015.12.001
Wihsgott J. U., Sharples J., Hopkins J., Woodward E. M., Hull T., Greenwood N., et al. (2019). Observations of vertical mixing in autumn and its effect on the autumn phytoplankton bloom. Prog. Oceanography 177, 102059. doi: 10.1016/j.pocean.2019.01.001
Williams C., Sharples J., Mahaffey C., Rippeth T. (2013). Wind-driven nutrient pulses to the subsurface chlorophyll maximum in seasonally stratified shelf seas. Geophysical Res. Lett. 40 (20), 5467–5472. doi: 10.1002/2013GL058171
Wollast R. (1998). “Evaluation and comparison of the global carbon cycle in the coastal zone and in the open ocean,” in The Sea, vol. 10 . Eds. Brink K. H., Robinson A. R. (Hoboken, New Jersey: John Wiley & Sons Inc.), 213–252.
Xuan J., Yang Z., Huang D., Wang T., Zhou F. (2016). Tidal residual current and its role in the mean flow on the changjiang bank. J. OF Mar. Syst. 154, 66–81. doi: 10.1016/j.jmarsys.2015.04.005
Xu Y., Chant R., Gong D., Castelao R., Glenn S., Schofield O. (2011). Seasonal variability of chlorophyll a in the mid-Atlantic bight. Continental Shelf Res. 31 (16), 1640–1650. doi: 10.1016/j.csr.2011.05.019
Yamaguchi H., Kim H. C., Son Y. B., Sang W. K., Okamura K., Kiyomoto Y., et al. (2012). Seasonal and summer interannual variations of SeaWiFS chlorophyll a in the yellow Sea and East China Sea. Prog. Oceanograph. 105 (5), 22–29. doi: 10.1016/j.pocean.2012.04.004
Yuan D., Li Y., Wang B., He L., Hirose N. (2017). Coastal circulation in the southwestern yellow Sea in the summers of 2008 and 2009. Continent. Shelf Res. 143, 101–117. doi: 10.1016/j.csr.2017.01.022
Zhabin I. A., Vanin N. S., Dmitrieva E. V. (2019). Summer wind-driven upwelling and tidal mixing on the Western kamchatka shelf in the Sea of Okhotsk. Russian Meteorol. Hydrol. 44 (2), 130–135. doi: 10.3103/S1068373919020067
Zhai F., Wu W., Gu Y., Li P., Song X., Liu P., et al. (2021). Interannual-decadal variation in satellite-derived surface chlorophyll-a concentration in the bohai Sea over the past 16 years. J. Mar. Syst. 215, 103496. doi: 10.1016/j.jmarsys.2020.103496
Keywords: Yellow Sea Cold Water Mass, wind-driven upwelling, phytoplankton, stratification, summer monsoon, nutrient flux
Citation: Lin L, Liu D, Wang Y, Lv T, Zhao Y and Tan W (2023) Effect of wind on summer chlorophyll-a variability in the Yellow Sea. Front. Mar. Sci. 9:1104258. doi: 10.3389/fmars.2022.1104258
Received: 21 November 2022; Accepted: 15 December 2022;
Published: 12 January 2023.
Edited by:
Xueen Chen, Ocean University of China, ChinaReviewed by:
Xiao Wu, Ocean University of China, ChinaSarat Chandra Tripathy, National Centre for Polar and Ocean Research (NCPOR), India
Copyright © 2023 Lin, Liu, Wang, Lv, Zhao and Tan. This is an open-access article distributed under the terms of the Creative Commons Attribution License (CC BY). The use, distribution or reproduction in other forums is permitted, provided the original author(s) and the copyright owner(s) are credited and that the original publication in this journal is cited, in accordance with accepted academic practice. No use, distribution or reproduction is permitted which does not comply with these terms.
*Correspondence: Dongyan Liu, ZHlsaXVAc2tsZWMuZWNudS5lZHUuY24=