 Zhiyuan Li
 Yu Long3
 Xiao-Hua Zhu
 Fabrice Papa
95% of researchers rate our articles as excellent or good
Learn more about the work of our research integrity team to safeguard the quality of each article we publish.
Find out more
ORIGINAL RESEARCH article
Front. Mar. Sci. , 13 January 2023
Sec. Ocean Observation
Volume 9 - 2022 | https://doi.org/10.3389/fmars.2022.1103215
This article is part of the Research Topic Application of Remote Sensing in Coastal Oceanic Processes View all 11 articles
A narrow strip of low salinity water that hugs the western Bay of Bengal (BoB) is known as a “river in the sea” (RIS). During the autumns of 2020 and 2021, Soil Moisture Active Passive (SMAP) identified an intensification of the RIS that was characterized by a continuous, uniform strip of low salinity water (<31 psu) that was 100 km wide extending along the western BoB coast to south of Sri Lanka. The analysis shows that the La Niña events in 2020–2021 were responsible for this intensification. During the La Niña events of 2020 and 2021, cyclonic circulation anomalies were generated along the BoB coast, causing a stronger Eastern Indian Coastal Current (EICC). Meanwhile, the northern BoB received increased river discharge during the summer monsoons of the two years. The stronger EICC and increased river discharge together led to anomalous freshwater transport that contributed to the intensification of the RIS. Notably, the RIS extended far southward during La Niña events of 2016 and 2017. However, the spatial structure of the RIS differed sharply between 2016–2017 and 2020–2021. The results indicate that pairs of eddies in the western BoB steered the freshwater offshore by several hundred kilometers. As a result, offshore extending tongue-shaped freshwater plumes were formed that inhibited the formation of an organized RIS structure along the western BoB coast during 2016–2017. This study highlights that the year-to-year variability of the RIS was significantly influenced by the La Niña events and modulated by mesoscale processes.
The Bay of Bengal (BoB) is a semienclosed basin in the Northern Indian Ocean (NIO), with reversing winds that blow from the southwest during the summer monsoon and from the northeast during the winter monsoon. During the summer monsoon, the BoB receives substantial amounts of freshwater from precipitation and river runoff (Papa et al., 2010; Papa et al., 2012; Chaitanya et al., 2014; Li et al., 2021b). These freshwater influxes lead to a lower sea surface salinity (SSS) in the BoB than its western counterpart, the Arabian Sea (Figure 1). The low SSS in the BoB causes strong stratification in the upper layer, favoring the formation of a barrier layer between the bottom of the mixed layer and the top of the thermocline (Sprintall and Tomczak, 1992; Vinayachandran et al., 2002; Thadathil et al., 2007). Moreover, the freshwater in the BoB is transported to the Arabian Sea and equatorial Indian Ocean (EIO), playing an important role in the water and salt balances in the NIO (Sengupta et al., 2006; Trott et al., 2019).
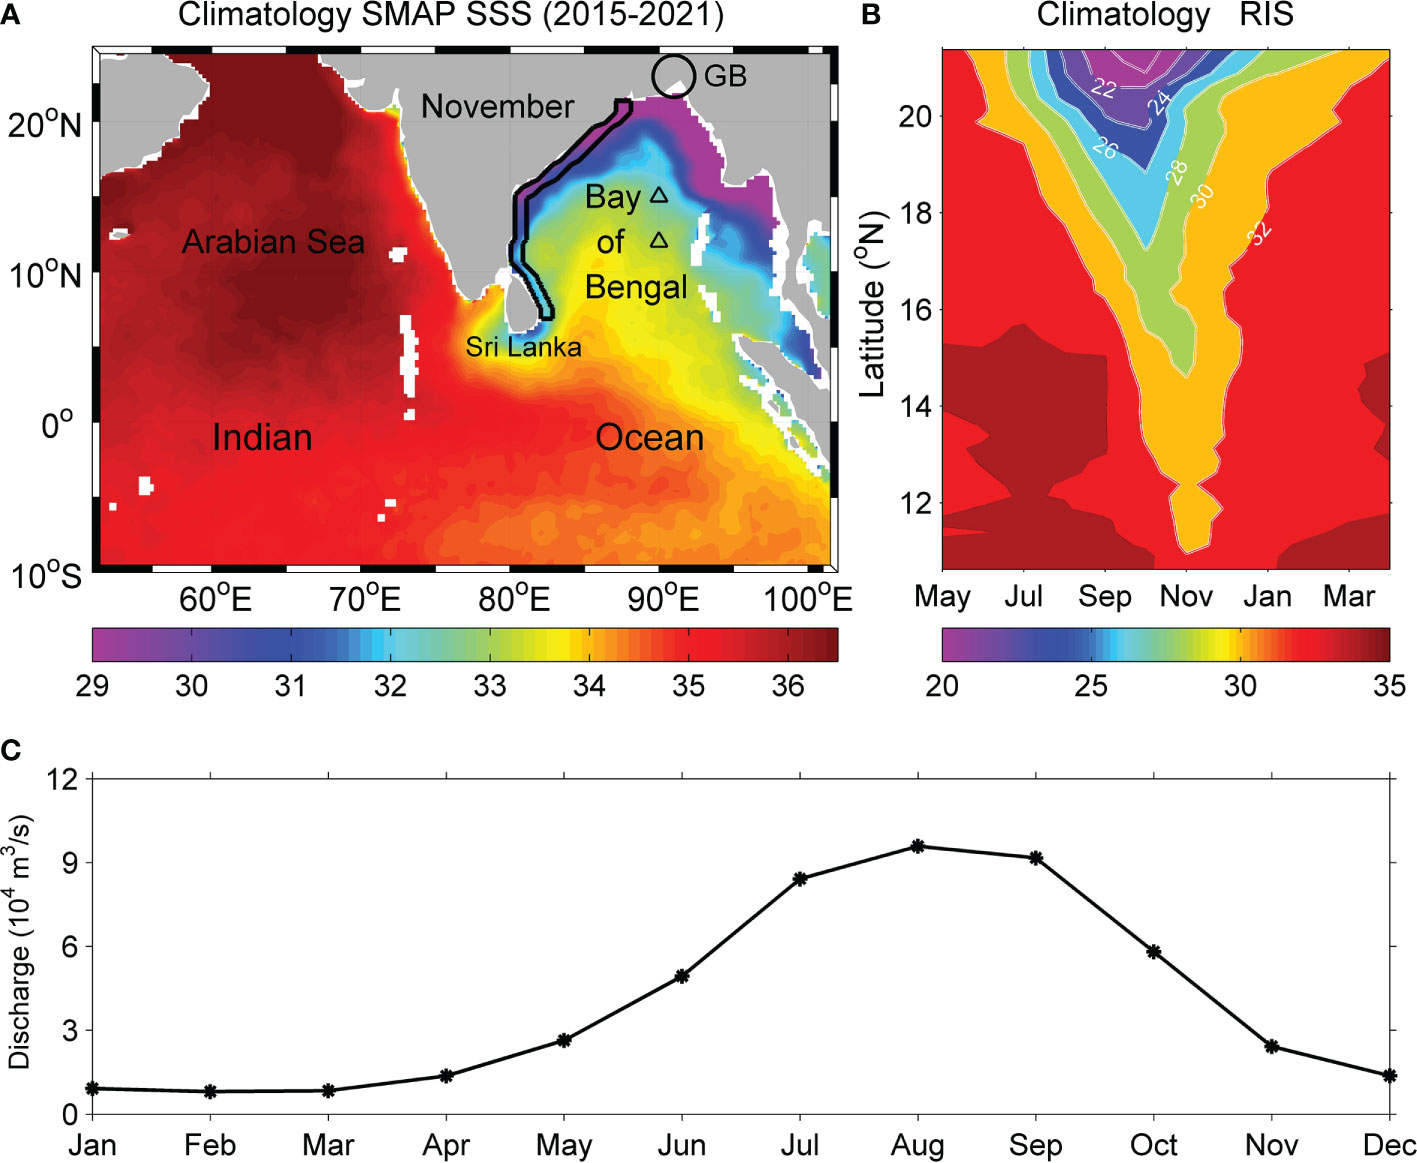
Figure 1 (A) November climatology of SMAP SSS in the northern Indian Ocean during 2015–2021. The black line denotes the coastal strip extending 1° away from the western BoB boundary to characterize the RIS. The black circle indicates the Ganges-Brahmaputra (GB) and the triangles represent the RAMA buoy at station B15 (15°N, 90°E) and B12 (12°N, 90°E). (B) Latitude–time plot of the climatological SMAP SSS in the strip shown in (A). (C) Climatological monthly discharge of the GB river.
Based on in situ and satellite data, many studies have observed freshwater plumes along the western BoB coast (Murty et al., 1992; Shetye et al., 1993; Shetye et al., 1996; Fournier et al., 2017; Sree Lekha et al., 2018; Li et al., 2021a). It was reported that the Eastern Indian Coastal Current (EICC) transports the river freshwater southward to form freshwater plumes along the coast (Han and McCreary, 2001; Jensen, 2001; Durand et al., 2009; Akhil et al., 2014; Akhil et al., 2016). Recently, based on salinity data collected by fishermen, Chaitanya et al. (2014) identified a narrow (~100 km wide) strip of low salinity water along the western BoB coast as a “river in the sea” (RIS). As a striking hydrographic feature in the BoB, the RIS has attracted attention from several investigators (Akhil et al., 2014; Fournier et al., 2017; Suneel et al., 2020). These studies confirmed the existence of the RIS from the evolution of the SSS averaged over a coastal strip box along the western BoB coast. However, the spatial and temporal variability of the RIS has not been well studied and the formation processes of the RIS remain unclear.
Influenced by the El Niño-Southern Oscillation (ENSO) and Indian Ocean Dipole (IOD), the BoB exhibits strong year-to-year variability (Saji et al., 1999; Webster et al., 1999; Thompson et al., 2006; Grunseich et al., 2011; Subrahmanyam et al., 2011; Du and Zhang, 2015; Pant et al., 2015; Sherin et al., 2018; Subrahmanyam et al., 2018). When an ENSO or IOD event occurs, remote equatorial waves propagate into the BoB to cause sea surface height anomalies (SSHAs) along the boundary. For example, during La Niña or negative IOD (nIOD) events, positive SSHAs were observed off the western BoB coast (Grunseich et al., 2011; Aparna et al., 2012). The positive SSHAs (cyclonic circulation anomalies) contribute to a stronger EICC during October–December (OND), causing the RIS to extend farther southward along the coast (Akhil et al., 2016; Fournier et al., 2017; Suneel et al., 2020; Li et al., 2021b). For example, the RIS extended far southward along the western BoB coast in 2016, which was attributed to the influence of the nIOD in 2016 (Fournier et al., 2017; Suneel et al., 2020). However, the 2016 was a combination event of a nIOD and a La Niña, and the influences of the La Niña on the southward extension of the RIS still remain unclear in the studies of Fournier et al. (2017) and Suneel et al. (2020).
Launched in 2015, NASA’s Soil Moisture Active Passive (SMAP) satellite provides a better SSS retrieval compared with that of other satellite data, especially in coastal regions (Tang et al., 2017; Bao et al., 2019; Fore et al., 2020). The SMAP data have been successfully used to study the freshwater extension in the BoB (Fournier et al., 2017; Akhil et al., 2020; Roman-Stork et al., 2020; Sree Lekha et al., 2020; Suneel et al., 2020; Li et al., 2021a; Paul et al., 2021). During the autumns of 2020 and 2021, a continuous, narrow strip of low salinity water extended southward along the western BoB coast to south of Sri Lanka, indicating the intensification of the RIS during these two years. However, the processes responsible for the intensification of the RIS during 2020–2021 remain unclear. In this study, we investigate the intensification of the RIS during 2020–2021 based on the SMAP satellite observations. We show that the two consecutive La Niña events of 2020 and 2021 were responsible for the intensification of the RIS.
The rest of this paper is organized as follows. In Section 2, the data used in this study are described. In Section 3, we use the SMAP SSS to quantify the spatial and temporal variability of RIS and the influences of the La Niña and mesoscale eddies on the year-to-year variability of the RIS are investigated. In Section 4, a discussion is provided. A summary and conclusion are given in Section 5.
We use the monthly and daily SMAP L3 V5.0 SSS produced by NASA’s Jet Propulsion Laboratory (Fore et al., 2020). Although the goal of the SMAP mission is to measure soil moisture, its radiometer-radar instrument enables SMAP to provide estimates of SSS (Entekhabi et al., 2010). The SMAP data have a spatial resolution of 0.25° x 0.25° and are available from April 2015 to present. The data can be downloaded from the Asia-Pacific Data-Research Center of the International Pacific Research Center (IPRC). We use the daily SSS measured by the Research Moored Array for African-Asian-Australian Monsoon Analysis and Prediction (RAMA) moored buoys (McPhaden et al., 2009) at 15°N, 90°E (B15) and 12°N, 90°E (B12) in the northern BoB. The RAMA data are provided by the Global Tropical Moored Buoy Array Project Office of the National Oceanic and Atmosphere Administration and the Pacific Marine Environmental Laboratory (https://www.pmel.noaa.gov/). The RAMA data are smoothed with a 10-day running mean for analysis. Then, the RAMA SSS is used to validate the accuracy of the SMAP data. At both stations, the SMAP SSS shows reasonably good agreement with the RAMA SSS (Figure 2). At station B15 (15°N, 90°E), the correlation coefficient between the SSS of the two datasets is 0.76, and the root mean square error (rmse) is 0.45 psu. At station B12 (12°N, 90°E), the correlation coefficient between the SSS of the two datasets is 0.66, and the rmse is 0.42 psu. This demonstrates the good ability of the SMAP SSS in studying the SSS variability in the BoB.
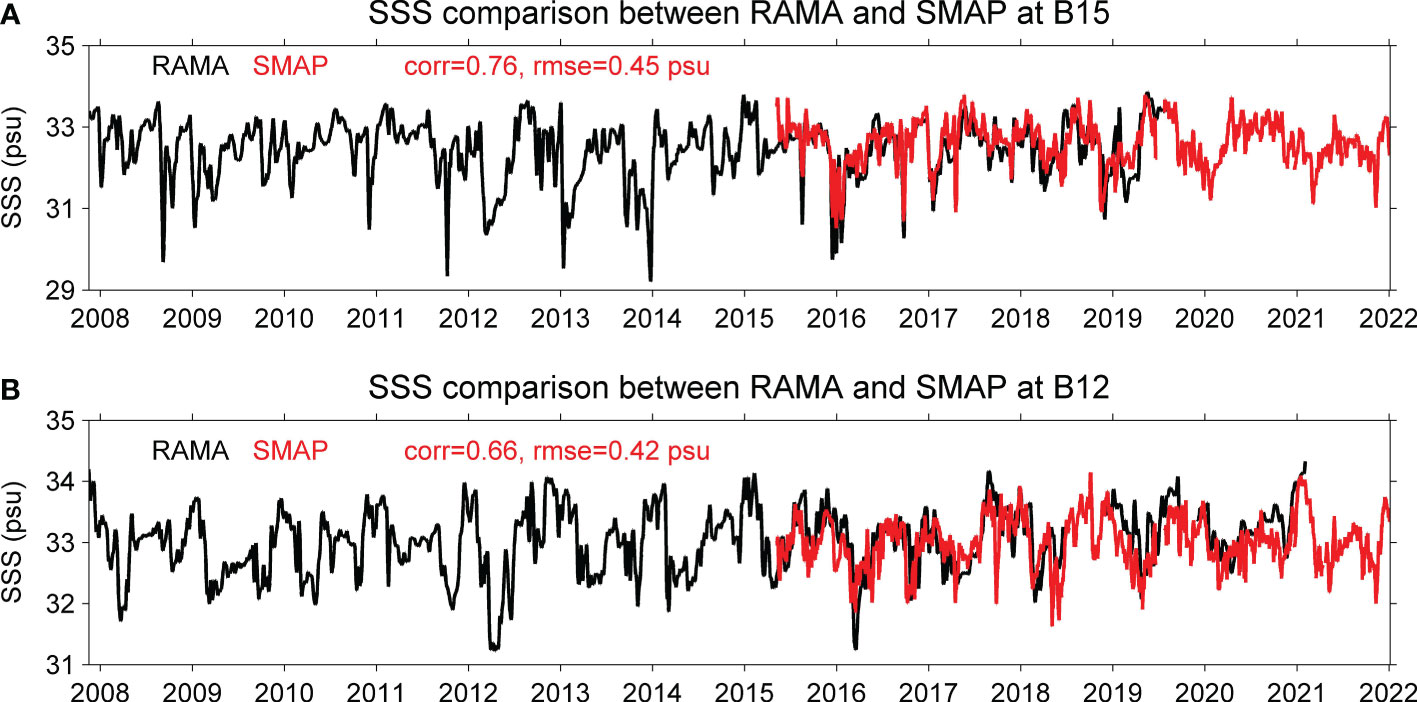
Figure 2 Comparison of SSS between RAMA and SMAP at station B15 (A) and (B) B12. The correlation coefficient and root mean square error is estimated for the period both data are available.
We use the monthly and daily maps of sea surface height (SSH) and geostrophic current obtained from the Copernicus Marine and Environment Monitoring Service (CMEMS). The SSH indicates the residual of the mean dynamic topography from the absolute dynamic topography. The IOD is indicated by the dipole mode index (DMI), which is defined as the difference of area-averaged sea surface temperature anomaly (SSTA) between the western (50°E-70°E, 10°S-10°N) and eastern (90°E-110°E, 10°S-0°) tropical Indian Ocean (Saji et al., 1999). The ENSO is characterized by the Oceanic Niño Index (ONI), which is defined as the area-averaged SSTA in the Niño 3.4 region. The monthly ONI and DMI indices can be accessed from the Ocean Observations Panel for Climate (https://stateoftheocean.osmc.noaa.gov/). Papa et al. (2010; 2012) used the altimetry-derived river discharge, based on the empirical regression curves of the altimetry-measured river water height and observed river discharge, to retrieve the variations in the Ganges-Brahmaputra (GB) River freshwater flux into the BoB. We use the updated satellite-derived monthly GB river discharge products, now available for 1993–2021 (Papa et al., 2012).
To characterize the year-to-year variability of the RIS along the western BoB coast, a time–latitude plot of the 7-year (2015–2021) monthly SMAP SSS averaged over a coastal strip box is shown (Figure 3A). A common feature of the 7-year SMAP SSS is that very low salinity water (<25 psu) was present in the northern BoB during the summer monsoon, reflecting the freshwater input from rivers and precipitation. During the following autumn and winter, this low salinity water extended southward and formed an RIS structure along the western BoB coast. Meanwhile, the RIS exhibited a clear year-to-year variability in terms of the southward extension, indicated by the position of 32 psu SSS contour. Specifically, the 32 psu SSS contour extended southward to approximately 13.5°N, 13°N, and 12.5°N in 2015, 2018, and 2019, respectively, reflecting that the southward extension of the RIS was weakened during these years. In 2016, 2017, 2020, and 2021, the southward extension of the RIS along the western BoB coast was substantially intensified. The 32 psu SSS contour extended southward to approximately 8°N in 2016 and 2017. In particular, the southward extension of the RIS was the strongest in 2020 and 2021, which was characterized by the 32 psu SSS contour extending to south of Sri Lanka (Figure 3A).
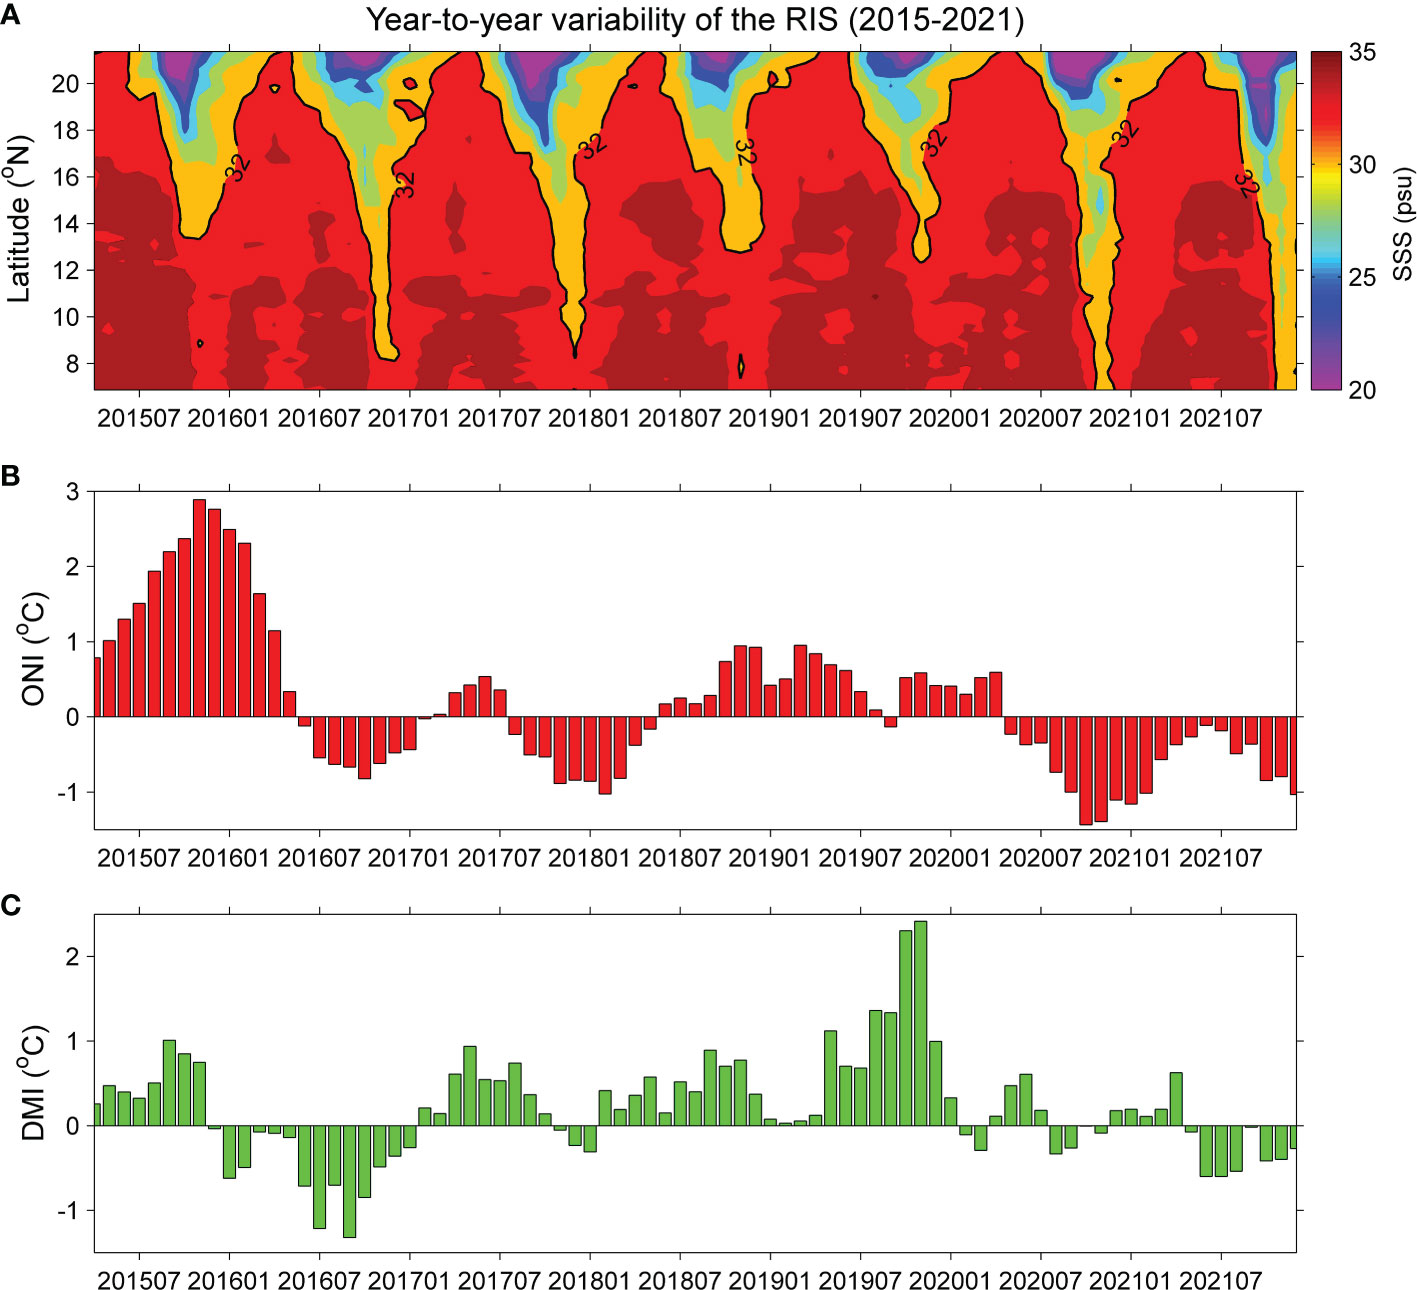
Figure 3 (A) Time–latitude plot of SMAP SSS averaged over the coastal strip Box 1, and (B) monthly Oceanic Niño Index (ONI) and (C) Dipole Mode Index (DMI) during April 2015 to December 2021.
The ENSO and IOD are two modes that influence the interannual variability in the BoB (Saji et al., 1999; Webster et al., 1999; Thompson et al., 2006; Pant et al., 2015; Sherin et al., 2018; Subrahmanyam et al., 2018; Li et al., 2021b). ENSO and IOD events can co-occur with each other: a positive IOD (pIOD) co-occurs with an El Niño event and a nIOD co-occurs with a La Niña event (Hong et al., 2008; Gnanaseelan et al., 2012; Stuecker et al., 2017). Li et al. (2021b) demonstrated that ENSO/IOD events can cause anomalous freshwater transport during the autumn and winter, contributing to the interannual variability of the SSS in the BoB. This motivates us to examine the relationships between the ENSO/IOD events and the year-to-year variability of the RIS during 2015–2021.
Considering that both the ENSO and IOD develop to a mature phase during the boreal autumn, an ENSO or IOD event is identified only when the ONI or DMI is larger than 0.5°C during September–November. Namely, an El Niño (La Niña) event corresponds to the ONI >0.5°C (<–0.5°C) and a pIOD (nIOD) event corresponds to the DMI >0.5°C (<–0.5°C). According to this criterion, El Niño/pIOD events were identified in 2015, 2018, and 2019, and La Niña/nIOD events were identified in 2016, 2017, 2020, and 2021 (Figures 3B, C). In detail, co-occurrences of El Niño and pIOD were identified in 2015 and 2018, and a pure pIOD event was identified in 2019. A co-occurrence of La Niña and nIOD was identified in 2016, and pure La Niña events were identified in 2017, 2020, and 2021. Therefore, these results indicate that the southward extension of the RIS along the western BoB coast was weakened during the El Niño/pIOD events of 2015, 2018, and 2019, and intensified during the La Niña/nIOD events of 2016, 2017, 2020, and 2021.
It has been reported that the EICC played an important role in influencing the southward extension of the RIS (Akhil et al., 2014; Chaitanya et al., 2014; Akhil et al., 2016; Fournier et al., 2017; Li et al., 2021a). The EICC flows southward along the western BoB coast with a maximum speed in November (Jensen, 2001; Durand et al., 2009; Das et al., 2019). Thus, composite November SSHA for 2015, 2018, and 2019 (Figure 4A) and 2016, 2017, 2020, and 2021 (Figure 4B) are shown to investigate the influences of the El Niño/pIOD and La Niña/nIOD events on the EICC during these years. During the composite El Niño/pIOD events of 2015, 2018 and 2019, a negative SSHA was observed in the eastern EIO and the boundary of the BoB, forming anticyclonic circulation anomalies along the western BoB coast (Figure 4A) that led to a weaker EICC during these years. An organized southward EICC cannot be identified along the western BoB coast in 2019. Instead, the current in the western BoB was characterized by various cyclonic eddies (CEs) and anticyclonic eddies (ACEs) (Figure 4D). During the composite La Niña/nIOD events of 2016, 2017, 2020, and 2021, the SSHA indicated cyclonic circulation anomalies along the western BoB coast (Figure 4B) that led to a stronger EICC during these years (Figures 4E–H).
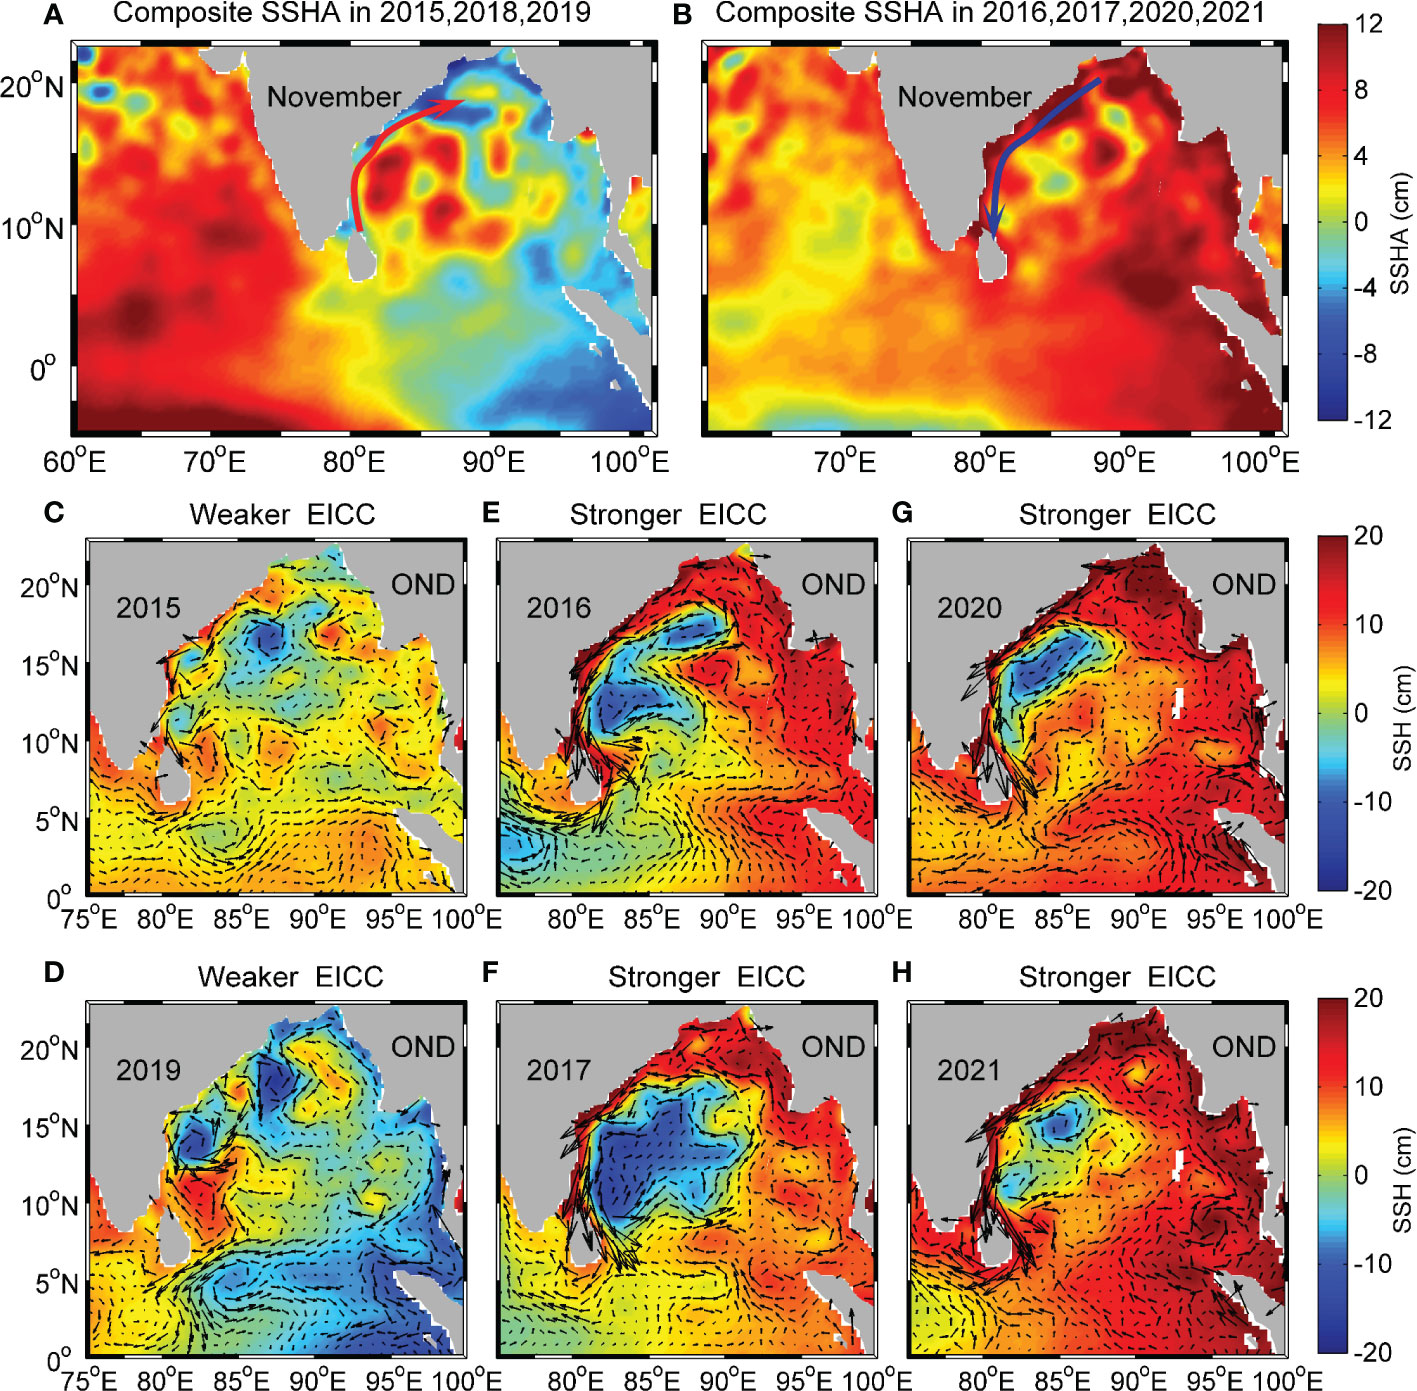
Figure 4 Composite November SSHA for 2015, 2018, and 2019 (A, B) 2016, 2017, 2020, and 2021. The red (blue) arrow indicates the cyclonic (anticyclonic) circulation anomalies along the western BoB coast. Weaker EICC in 2015 (C, D) 2019, stronger EICC in 2016 (E), 2017 (F), 2020 (G, H) 2021. The EICC is represented by the surface geostrophic current associated with the SSH during October–December (OND).
During the summer monsoon (June–October), the GB River inputs a large amount of local freshwater into the BoB that influences the extension of the RIS (Han et al., 2001; Papa et al., 2010; Papa et al., 2012; Pant et al., 2015). Therefore, it is necessary to examine the contribution of the local freshwater flux to the year-to-year variability of the RIS during 2015–2021. The monthly evolution of the GB River discharge exhibits evident seasonal cycles, with large values occurring during the summer monsoon (Figure 5A). Meanwhile, a year-to-year variability of the river discharge was also observed during the 7 years. To better quantify the year-to-year variability, we use the accumulated river discharge during the summer monsoon for analysis (Figure 5B).
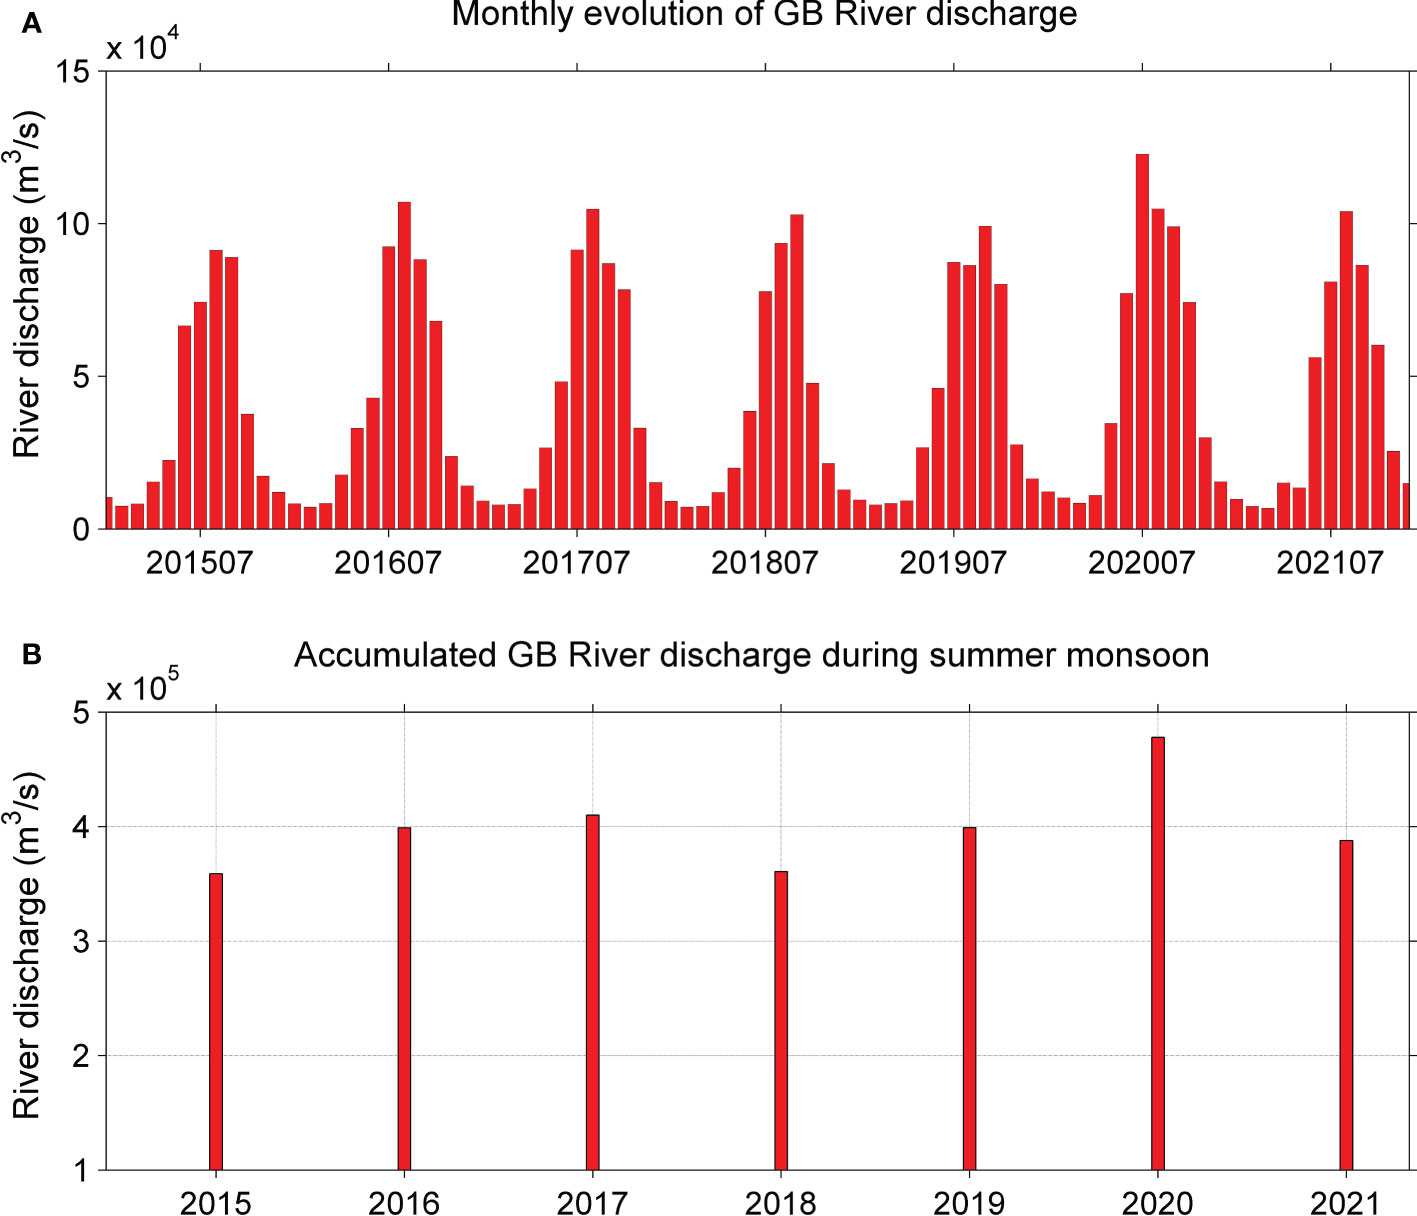
Figure 5 (A) Monthly and (B) accumulated GB River discharge during the summer monsoon from 2015 to 2021.
During the 7 years, the accumulated GB River discharge exhibited relatively smaller values in 2015 and 2018 and larger values in 2016, 2017, 2019, 2020, and 2021. This means that the BoB received less freshwater from the GB River during the summer monsoons of 2015 and 2018. Therefore, the reduced river discharge and weaker EICC together contributed the RIS to extending less southward along the western BoB coast during the two years. In contrast, the BoB received more freshwater from the GB River during the summer monsoons of 2016, 2017, 2020, and 2021. The increased river discharge and stronger EICC together led the RIS to extending farther southward along the western BoB coast during these four years (Figure 3A). In addition, the BoB received a substantial amount of freshwater during the summer monsoon of 2019. However, the RIS did not extend southward significantly along the western BoB coast in 2019 (Figure 3A). This is due to the absence of an organized southward EICC during that year (Figure 4D).
In the following, the November SSS distributions in the BoB are shown to characterize the spatial structure of the RIS during 2016, 2017, 2020, and 2021. During 2020–2021, the SMAP SSS exhibited low salinity water along the entire western BoB coast, with the 31 psu SSS contour reaching south of Sri Lanka. Moreover, the low salinity water comprised a uniform strip that was approximately 100 km wide (Figures 6A, B). These features indicate an organized RIS structure along the western BoB coast during these two years. During 2016–2017 (Figures 6C, D), however, the low salinity water along the western BoB coast showed distinct features from those during 2020–2021. During 2016–2017, the low salinity water was discontinuous along the western BoB coast, and its width was non-uniform. For example, the SSS distribution indicated two separate freshwater plumes in the western BoB in 2016; one plume was located approximately between 8°N–17°N and another one was located in the BoB north of 17°N (Figure 6C).
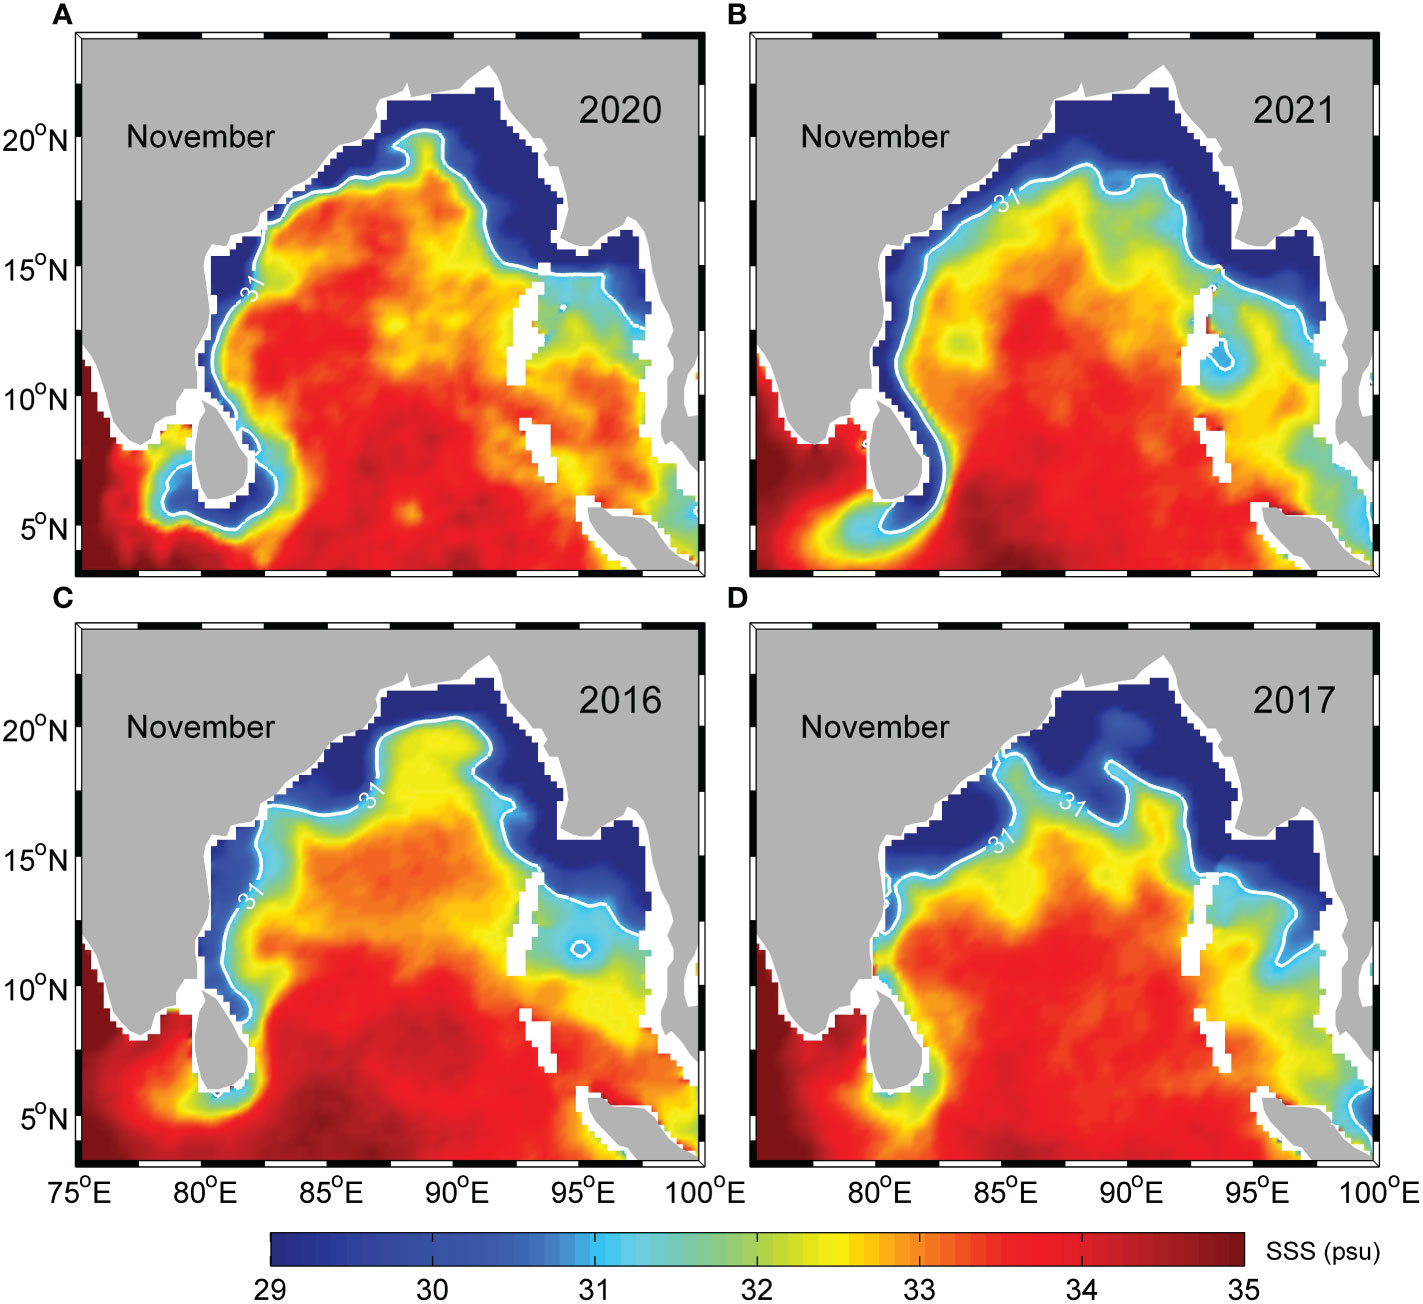
Figure 6 November SMAP SSS in the BoB for 2020 (A), 2021 (B), 2016 (C), and (D) 2017. The white line indicates the SSS contour of 31 psu.
It has been reported that the EICC plays an important role in the formation of the RIS (Akhil et al., 2014; Chaitanya et al., 2014). The magnitudes of the EICC during 2016–2017 and 2020–2021 were comparable (Figures 4E–H). Thus, the differences in the spatial structure of the RIS between 2016–2017 and 2020–2021 cannot be fully attributed to the EICC. This suggests that other processes influenced the formation of the RIS in the BoB, as shown below.
Figure 7 shows the consecutive snapshots of the weekly SMAP SSS in the BoB in 2020 and 2021, respectively. In both two years, the SMAP SSS provided good insights into how the freshwater in the northern bay extended southward to form an organized RIS structure along the western BoB coast. For 2020, the formation process of the RIS can be divided into three stages. During the first stage, substantial freshwater was distributed in the northern bay (Figure 7A). However, no evident southward extension of the freshwater could be recognized during this stage (Figures 7B, C). During the second stage, the freshwater extended southward quickly to form a narrow strip of low salinity water along the entire western BoB coast, namely the RIS (Figures 7D–G). During the third stage, the organized RIS gradually dissipated (Figure 7H).
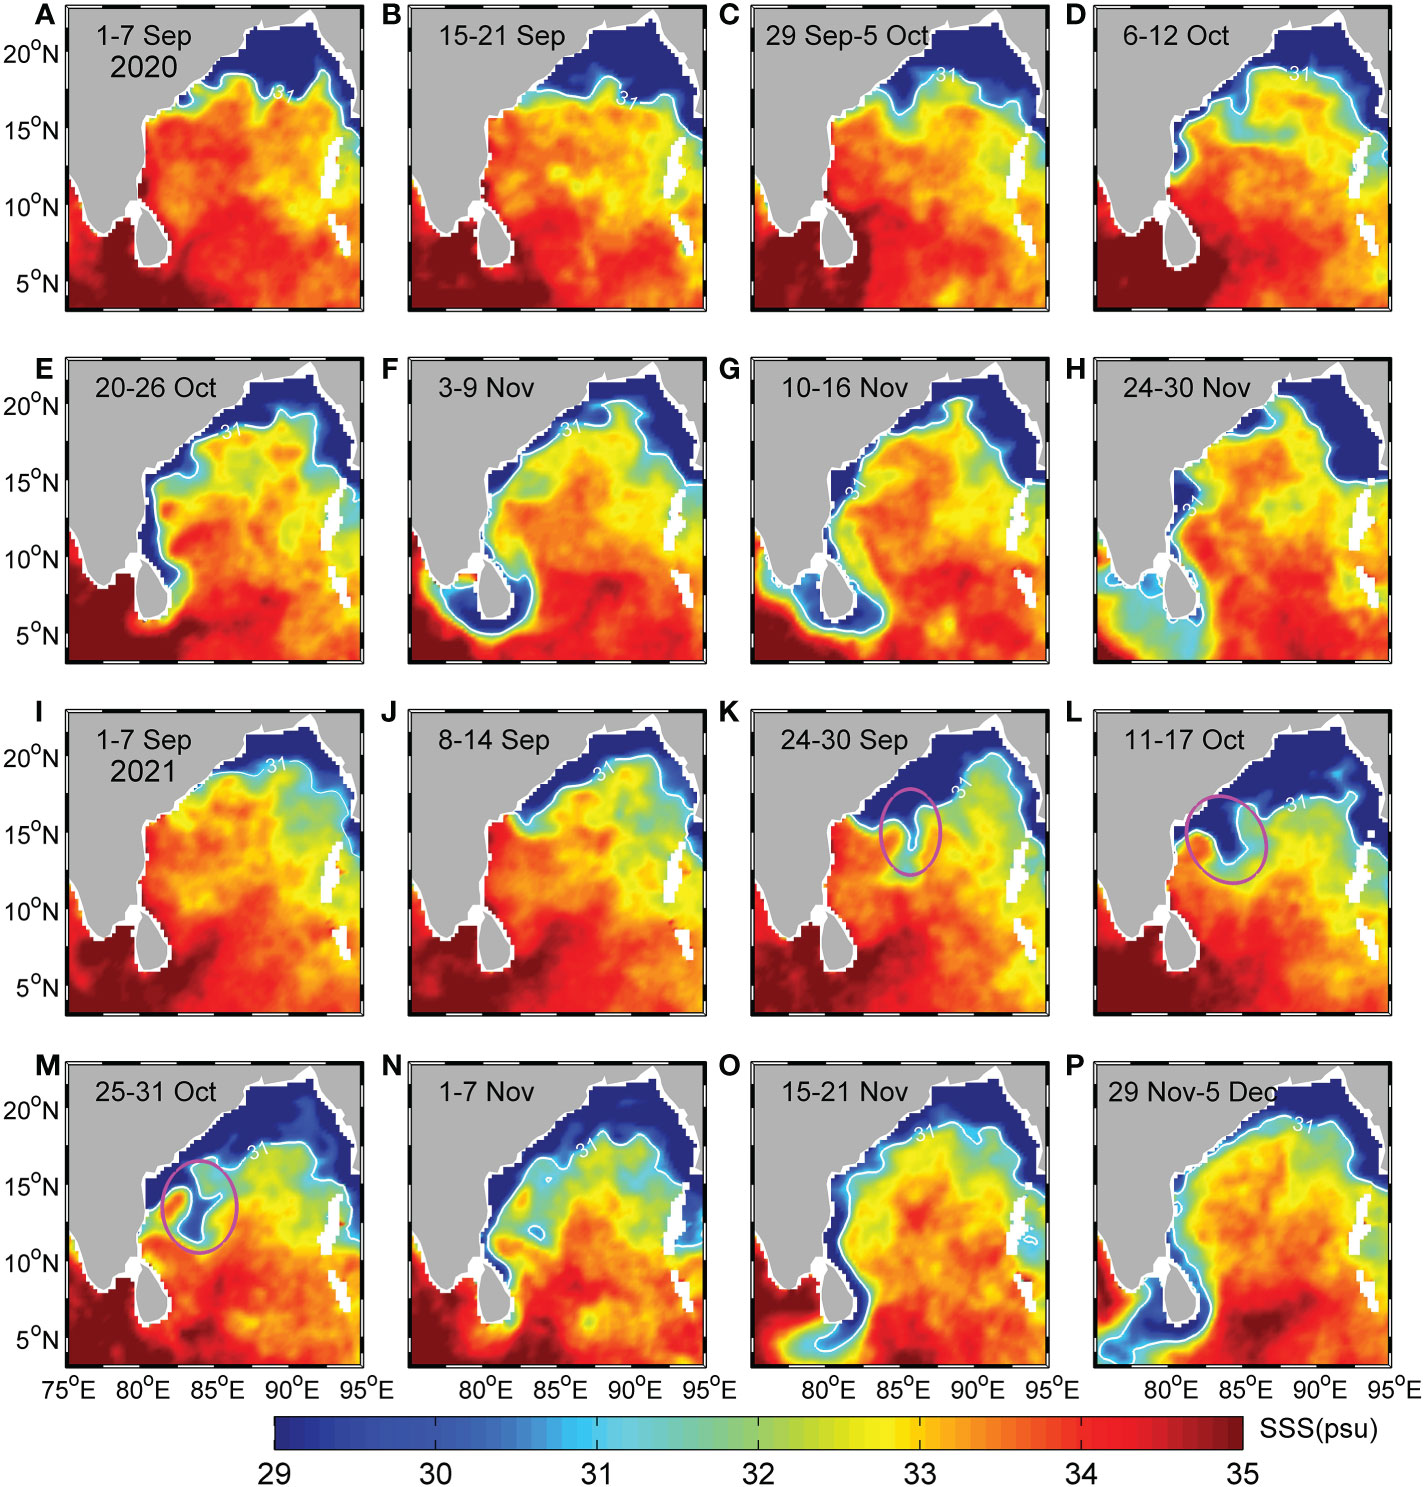
Figure 7 Consecutive snapshots of weekly SMAP SSS in the BoB for 2020 (A–H) and 2021 (I–P), respectively. The white line indicates the SSS contour of 31 psu, and the purple ellipses represent the bulge structure of freshwater off the BoB coast.
In contrast, the formation process of the RIS in 2021 can be roughly divided into four stages. During the first stage, the freshwater in the northern bay extended southward quickly and formed a narrow strip of low salinity water along the northwestern BoB coast (Figures 7I, J). During the second stage, the southward extension of the freshwater ceased, and substantial freshwater accumulated off the BoB coast. Interestingly, a bulge structure of freshwater was formed off the BoB coast (Figures 7K–M). During the third stage, the bulge structure disappeared, and the accumulated freshwater extended southward, forming an organized RIS along the entire western BoB coast (Figures 7N, O). During the fourth stage, the organized RIS gradually weakened (Figure 7P).
Figure 8 shows the representative snapshots of the weekly SSH and associated geostrophic currents in the BoB during the formation processes of the RIS, similar to that in Figure 7. During early September 2020, several eddies (one ACE and two CEs) in the western BoB and a high level of SSH in the northern BoB were prominent. However, an organized southward current along the western BoB coast is not visible (Figure 8A). The absence of a southward coastal current can explain why the freshwater in the northern bay did not extend southward along the coast (Figures 7A–C). In the following October, the high level of SSH in the northern BoB propagated southward to favor a southward EICC along the coast (Figure 8B). As a result, the EICC transported the freshwater in the northern BoB southward to form a narrow strip of freshwater (namely the RIS) along the BoB coast (Figures 7D, 8B). By November, an organized RIS along the entire western BoB coast could be clearly recognized (Figures 7G), corresponding to the strong EICC during this period (Figure 8C).
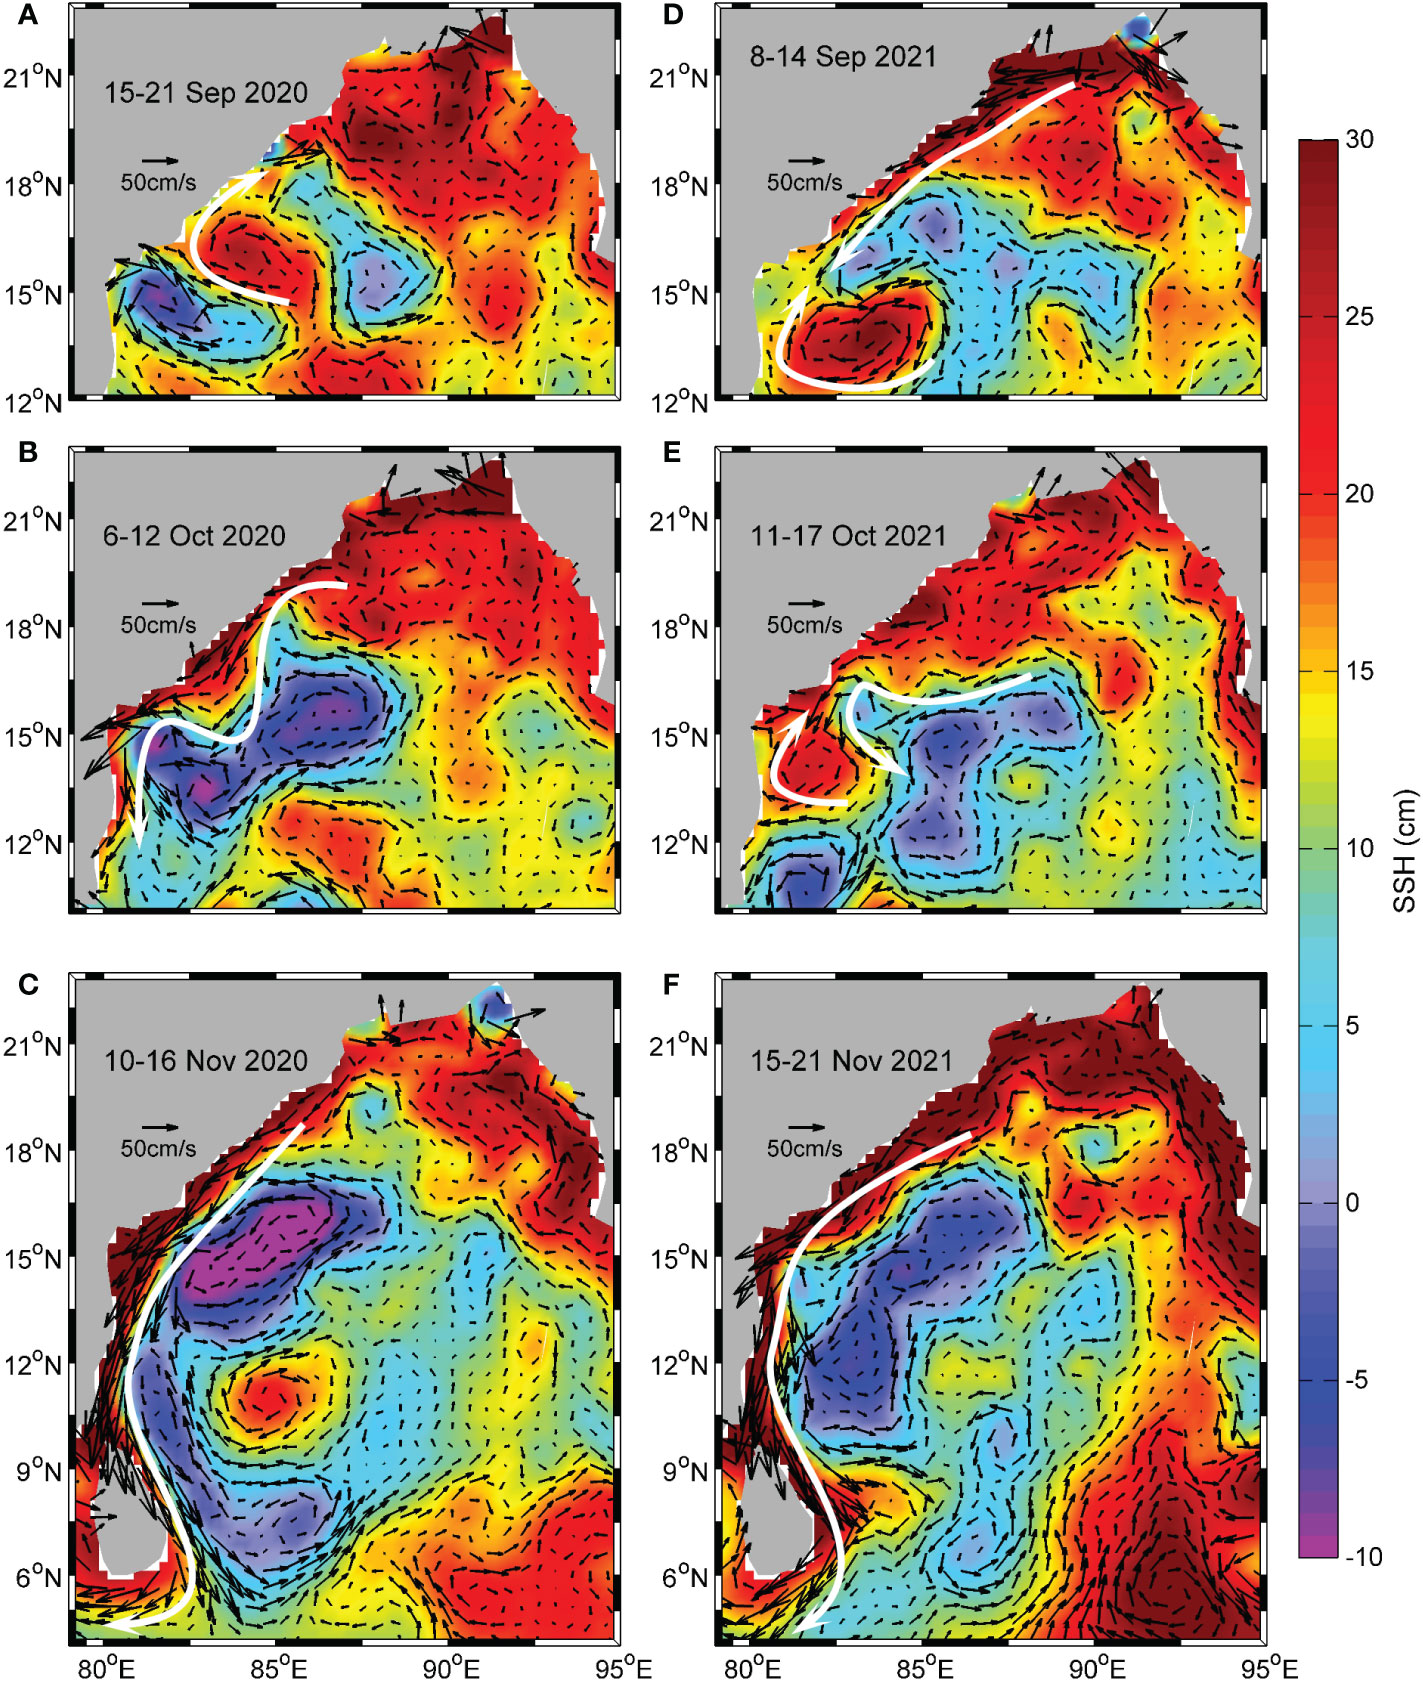
Figure 8 Snapshots of weekly SSH and associated geostrophic currents in the BoB during September to November of 2020 (A–C) and (D–F) 2021. The white arrow represents the eddy-induced current and the EICC in the western BoB.
Similar features were found in 2021. For example, when a southward EICC was present (Figures 8D, F), it transported the freshwater to form an organized RIS along the western BoB coast (Figures 7J, N–P). The freshwater stopped extending further southward along the coast and formed a bulge structure off the BoB coast during late September to October (Figures 7K–M) because of the following reasons. First, a large ACE (centered at 14°N, 83.5°E) induced a strong anticyclonic current in the southwestern BoB (Figure 8D); Second, the high level of SSH in the central northern bay propagated westward to the BoB coast, causing the organized EICC in the northwestern BoB to be destroyed. Both aspects inhibited the southward extension of freshwater along the western BoB coast (Figure 7K). Notably, several CEs in the central BoB combined with the ACE (off the southwestern BoB coast) to induce an offshore current (white arrow in Figure 8E). This current steered the accumulated freshwater offshore, forming a bulge structure off the BoB coast (Figures 7L, M). As indicated in Figures 7, 8, the EICC was a key factor forming the RIS structure along the western BoB coast. Meanwhile, the freshwater extension was also modulated by pairs of eddies off the western BoB coast.
Figure 9 shows the representative snapshots of the weekly SMAP SSS in the BoB from September to November of 2016 and 2017. In both years, tongue-shaped freshwater plumes extending from the coast to the central bay were particularly noticeable. For example, an offshore extending tongue-shaped freshwater plume with a double-branch structure could be clearly observed for September 2016 (Figure 9A). The length of this plume (distance from the front of the plume to the coastline) was approximately 700 km. Several weeks later, the double-branch structure of the plume could still be found, although its shape was slightly varied (Figure 9B). By November 2016, the two branches of the freshwater plume evolved into two separated freshwater plumes (Figure 9C). Similar offshore extending tongue-shaped freshwater plumes could also be found in 2017 (Figures 9D–F). The formation and evolution of the offshore extending tongue-shaped freshwater plumes during the two years are explained below.
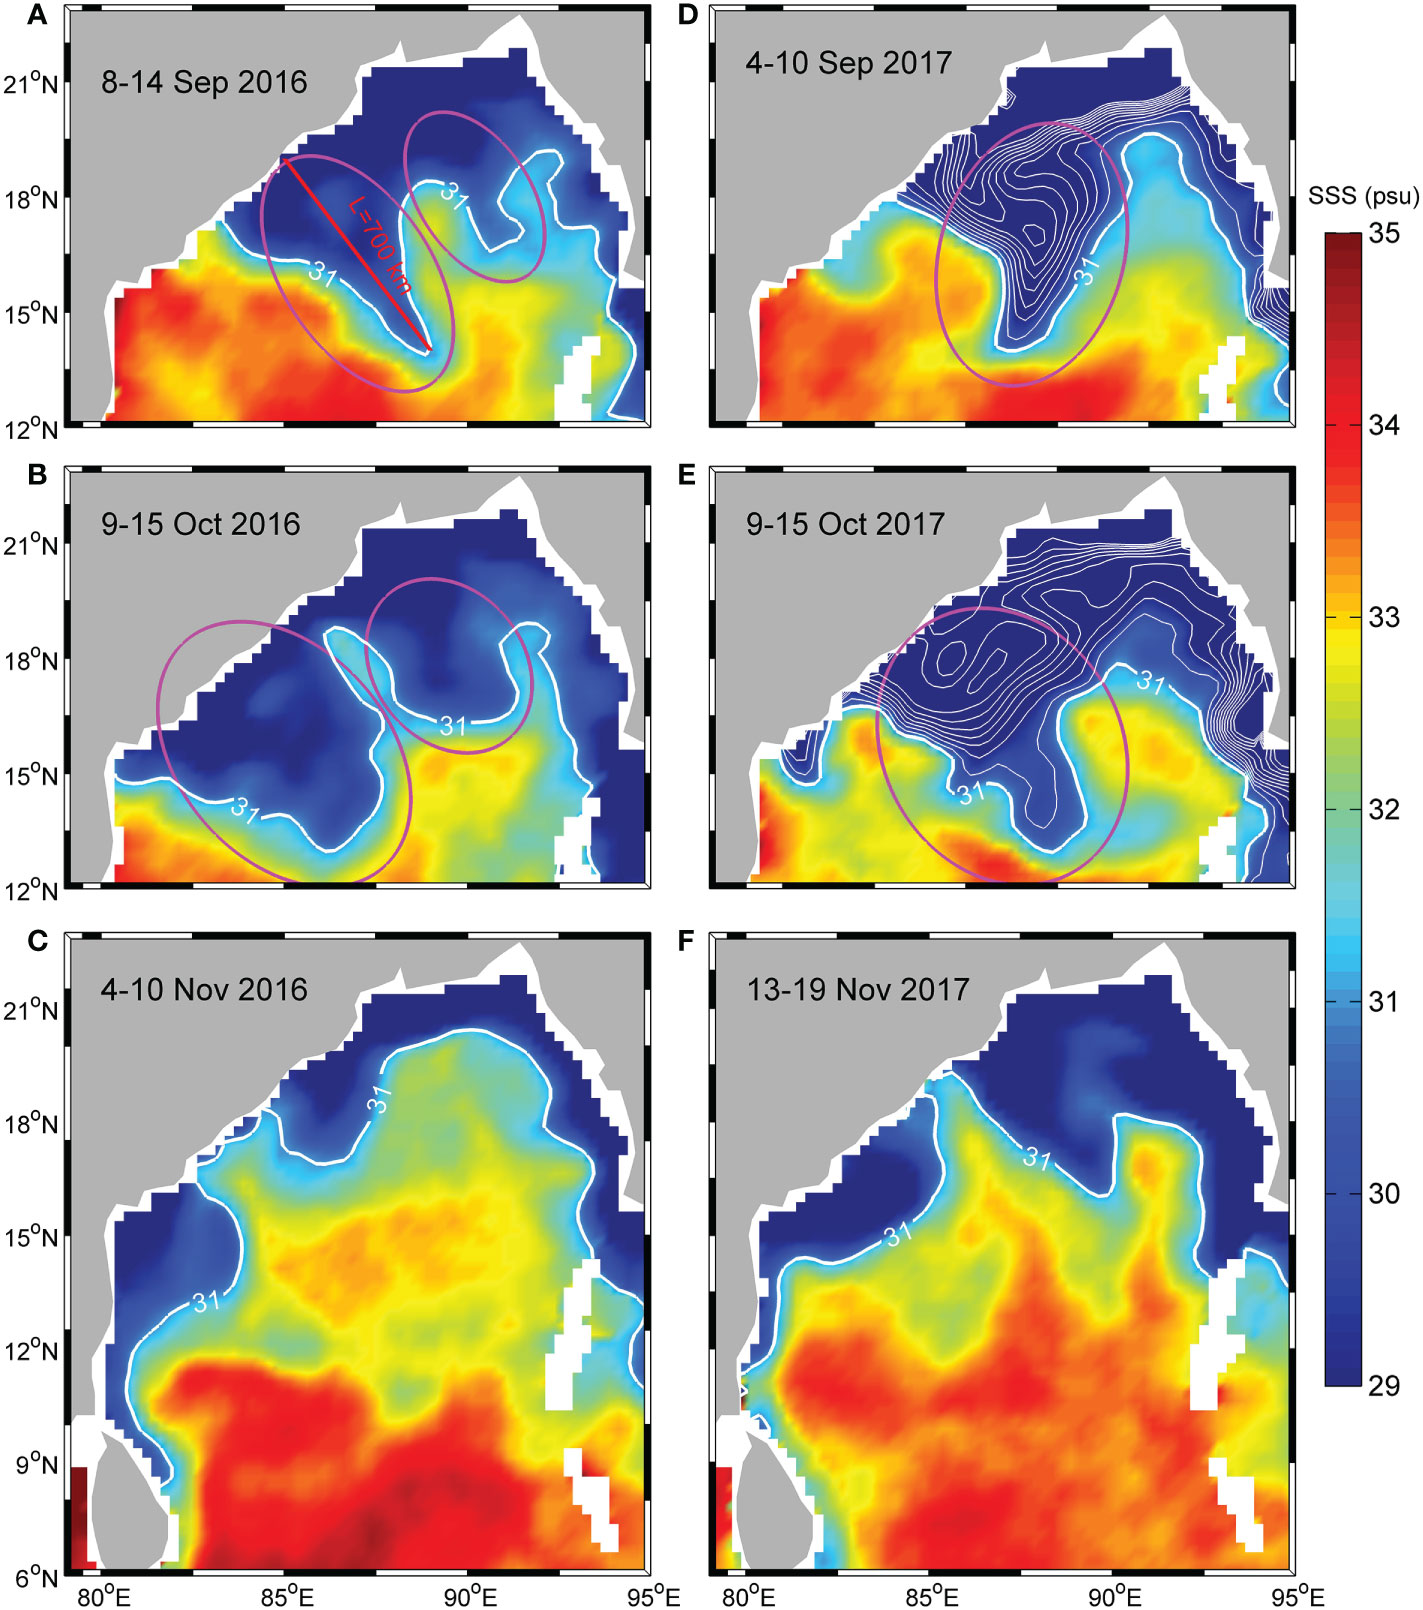
Figure 9 Snapshots of weekly SMAP SSS in the BoB during September to November of 2016 (A–C) and (D–F) 2017. The white lines indicate the SSS contours with an interval of 1 psu, and the SSS contour of 31 psu is bold. The purple ellipses highlight the offshore extending tongue-shaped freshwater plumes, with the red line indicating their lengths.
During September of both years (2016 and 2017), several eddies formed a cyclonic circulation pattern in the northern BoB (white arrows in Figures 10A, D). The offshore/onshore currents associated with the cyclonic circulation steered the freshwater to the central northern BoB, leading to the formation of the tongue-shaped freshwater plumes that extended offshore (Figure 9A). Differently, an ACE (centered at 17.5°N, 89°E) divided the cyclonic circulation into two parts (green arrows in Figure 10A), leading the tongue-shaped freshwater plume exhibiting a double-branch structure in 2016 (Figure 9A). In the following October of each year, the position and shape of these eddies varied (Figures 10B, E), and the offshore extending freshwater plumes also evolved, while the spatial shape basically remained unchanged (Figures 9B, E). By November, the western BoB was characterized by a southward EICC in the southern part (white arrows in Figures 10C, F) and an anticyclonic current in the northern region (green arrows in Figures 10C, F). As a result, the offshore extending freshwater plume evolved into two separate freshwater plumes along the western BoB (Figures 9C, F).
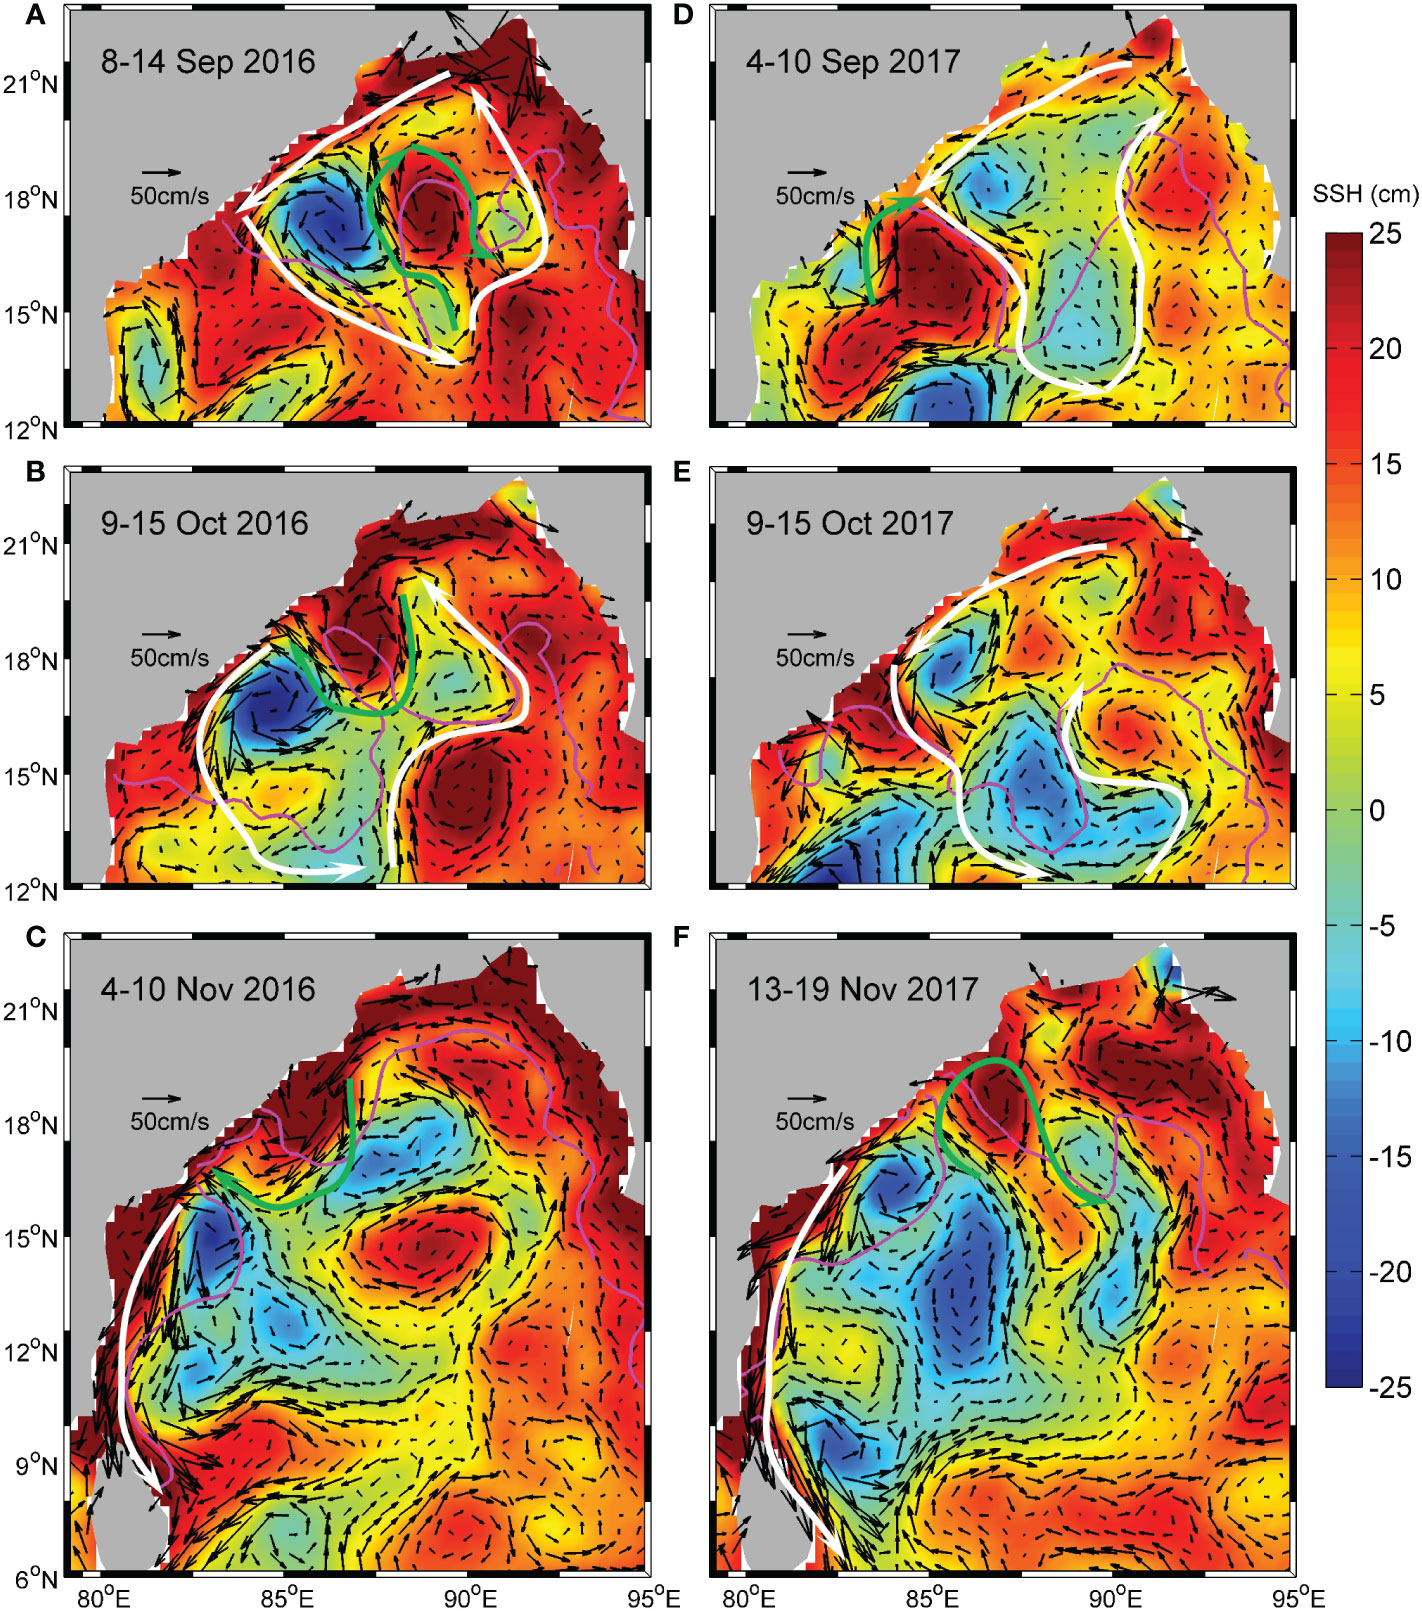
Figure 10 Snapshots of weekly SSH and associated geostrophic currents in the BoB during September to November of 2016 (A–C) and (D–F) 2017. The white arrows represent the cyclonic currents, and the green arrows indicate the ACE induced anticyclonic currents. The purple line indicates the SSS contour of 31 psu to represent the boundary of the freshwater plumes.
The southward extension of the RIS along the western BoB coast exhibited clear year-to-year variability during 2015–2021. Especially, the RIS extended far southward in 2016, 2017, 2020, and 2021, reflecting the intensification of the RIS during these years (Figure 3). Fournier et al. (2017) and Suneel et al. (2020) attributed the intensification of the RIS in 2016 to the occurrence of a nIOD event during that year, while the La Niña’s role was neglected. In this study, an intensification of RIS was observed in 2017, 2020, and 2021, which were three pure La Niña years without the co-occurrence of nIOD events (Figure 3). In particular, the RIS extended southernmost during 2020–2021, reaching south of Sri Lanka (Figures 6A, B). This strongly suggests that the La Niña events of 2017, 2020, and 2021 were responsible for the intensification of the RIS during these years. For the combination event of 2016, although the nIOD’s role cannot be excluded, we argue that the La Niña’s role in the intensification of the RIS must be considered. Our analysis demonstrates that during the autumns of 2016, 2017, 2020, and 2021, westerly anomalies favored positive SSHAs that cyclonically propagated from the eastern EIO into the BoB as coastal waves (Figure 4B). This agrees with the findings of Aparna et al. (2012) that positive SSHAs occurred off the western BoB coast during a La Niña event. The positive SSHAs associated with the coastal waves formed a stronger EICC along the western BoB coast (Figure 4), which was demonstrated in several previous studies (Grunseich et al., 2011; Akhil et al., 2016; Fournier et al., 2017).
To clarify the anomalies during the La Nina years, the GB River discharge for the years 1993–2021 is presented in Figure 11. It shows that the river discharge anomaly was positive during nine of the ten La Nina years (except 2005) (Figure 11C). This indicates that a positive GB River discharge anomaly occurred during the summer monsoons of La Niña years (Figures 11D). This is consistent with the findings of Webster et al. (1998) that the Indian Summer Monsoon Rainfall strengthens during La Niña years. This may explain why anomalous increased river discharges occurred in 2016, 2017, 2020, and 2021 (Figure 5). The influences of precipitation minus evaporation (P−E) anomalies on the RIS are not considered in this study, although the P−E also shows a prominent year-to-year variability (Behera et al., 1999; Pant et al., 2015). This is because the influences of P−E (integrated over the ocean only) on the RIS is much smaller than that of the GB River discharge because the horizontal scale of the RIS is only approximately 100 km wide. Consequently, we argue that the intensification of the RIS during 2016, 2017, 2020, and 2021 were the result of anomalous freshwater transport along the western BoB coast. The stronger EICC and increased river discharge both played important roles.
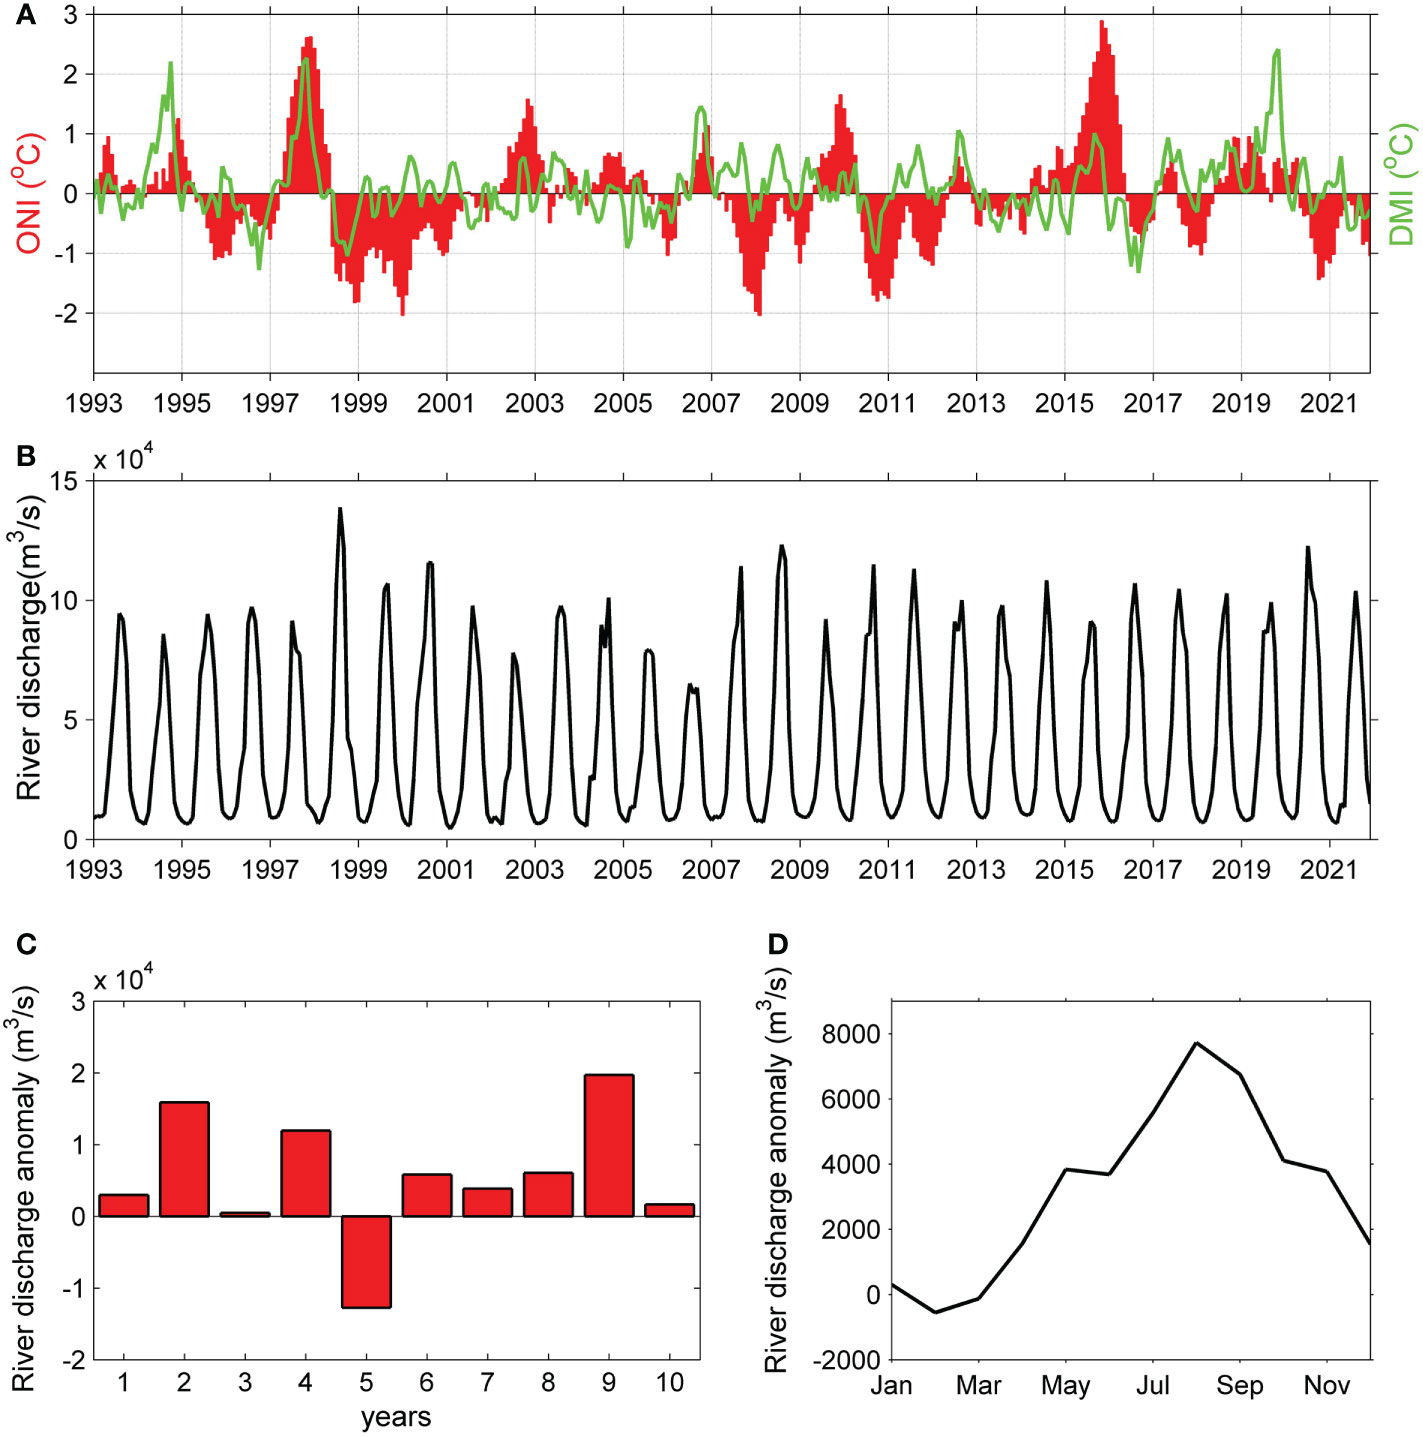
Figure 11 Monthly Oceanic Niño Index (ONI) and Dipole Mode Index (DMI) (A) and (B) GB River discharge during 1993–2021. (C) GB River discharge anomaly averaged over the summer monsoon during 10 La Niña years. (D) Composite GB River discharge anomaly averaged over the 10 La Niña years. In the composite analysis, the La Niña years are 1995, 1998, 1999, 2000, 2005, 2010, 2016, 2017, 2020, and 2021.
It is interesting that the RIS also extended far southward during the La Niña events of 2016–2017 (Figure 3A). However, the spatial structure of the RIS differed sharply between 2016–2017 and 2020–2021 (Figure 6). During 2020–2021, the November SSS distribution showed a continuous, uniformly narrow (~100 km wide) strip of freshwater along the western BoB coast, which corresponds well with the representative features of the RIS proposed by Chaitanya et al. (2014). However, the November SSS distribution during 2016–2017 in the BoB indicated that such an organized RIS almost “did not exist”. Combining the SMAP SSS and satellite altimeter data, we find that during the autumns of 2016 and 2017, pairs of eddies in the western BoB steered the freshwater offshore, extending several hundred kilometers, forming tongue-shaped plumes to the central bay (Figures 9, 10). The offshore extending freshwater plumes significantly affected the RIS through two aspects. First, the offshore extending freshwater plumes inhibited the formation of an RIS structure (narrow strip of freshwater) along the western BoB coast. This can explain why the spatial structures of the RIS were different between 2016–2017 and 2020–2021. Second, because the freshwater was transported offshore to the central bay, less freshwater remained to be transported southward along the coast. This can explain why the RIS did not extend as far southward during 2017 than during 2021, although the EICC and river discharge were comparable during the two years. Notably, such substantial offshore extending freshwater plumes were not formed during 2020–2021. Therefore, an organized RIS structure along the western BoB coast was observed during 2020–2021 (Figure 7).
By examining the 7-year SMAP SSS (2015–2021), offshore extending tongue-shaped freshwater plumes in the northern BoB were also found in 2015 (Figure 12). We attribute the formation of these plumes to the GB River freshwater modulated by pairs of eddies, which is consistent with the results of Li et al. (2021a). The western BoB is characterized by various ACEs and CEs (Chen et al., 2012; Cheng et al., 2013; Chen et al., 2018; Cheng et al., 2018; Lasitha Perera et al., 2019), and the influences of the pairs of eddies on the freshwater extension in the BoB need more consideration. We find that these tongue-shaped freshwater plumes can extend to the central northern BoB, which influence the stratification in the central bay. Moreover, the tongue-shaped freshwater plumes exhibit a strong SSS gradient (Figures 10D, E, 12A, B), which can further contribute to a large density gradient. The thermal–wind relationship indicates that a strong density gradient causes a vertical shear of velocity. Thus, the tongue-shaped freshwater plumes can influence the vertical structure of circulation in the BoB. In the future, eddy-resolving numerical models are necessary to simulate the formation of offshore extending tongue-shaped freshwater plumes in the BoB.
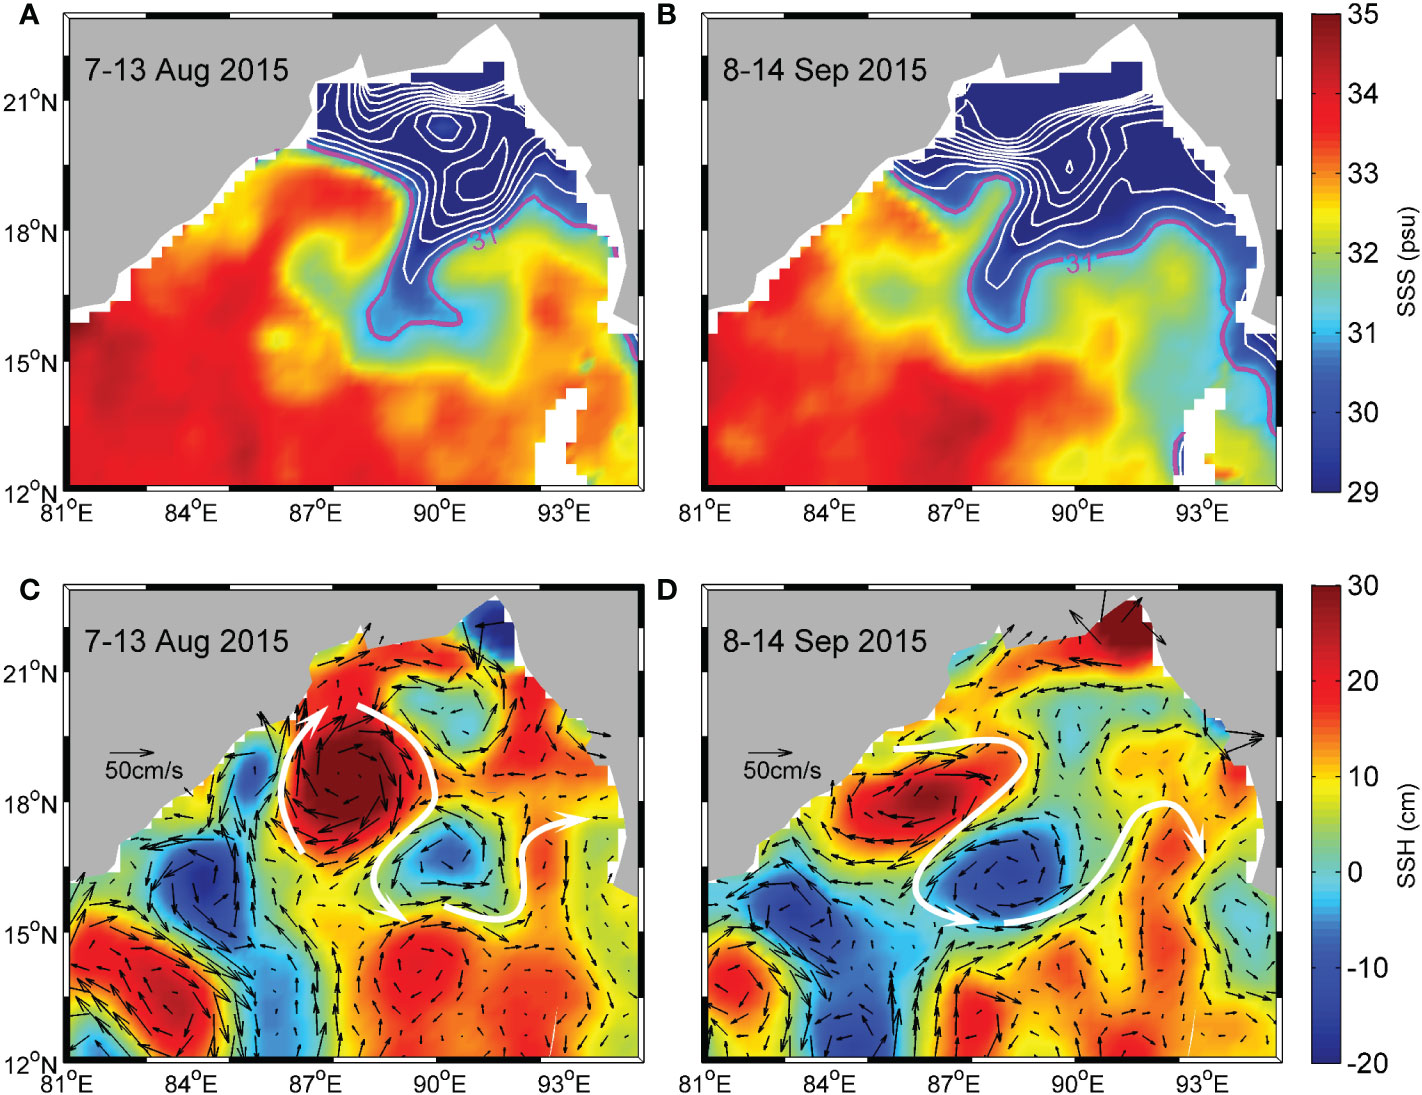
Figure 12 Distributions of SSS (A, B) and SSH and associated geostrophic currents (C, D) in the BoB for 7 August 2015 to 13 August 2015 (left) and (right) 8 September 2016 to 14 September 2015. The white lines indicate the contours of SSS with an interval of 1 psu. The purple line represents the SSS contour of 31 psu to highlight the boundary of the tongue-shaped freshwater plumes. The white arrows indicate the eddy-induced currents.
A narrow strip (~100 km) of freshwater hugs the western BoB coast, referred to as a “RIS” (Chaitanya et al., 2014). Limited by the spatial sampling, in-situ salinity measurements are unable to capture the RIS in the BoB (Fournier et al., 2017). The SMAP provides a better SSS retrieval than other satellite observations, such as the Soil Moisture and Ocena Salinity (SMOS) (data quality in the northern BoB) and Aquarius missions (data are unavailable in coastal regions) (Akhil et al., 2016; Fournier et al., 2017), even if Akhil et al. (2020) recently show significant improvements in using SMOS to capture salinity variations close to the eastern coast of India. This motivates us to use the SMAP data to quantify the RIS in this study. Our results indicate that the SMAP data have significant advantages in quantifying the spatial and temporal variability of the RIS. First, the SMAP SSS shows a continuous, uniform strip of low salinity water that was 100 km wide hugging the entire western BoB coast (Figures 6A, B), confirming the findings of Chaitanya et al. (2014). To our knowledge, this is the first time that an organized RIS structure has been identified using the SSS distribution in the BoB. Second, the SMAP SSS can properly characterize the year-to-year variability of the RIS in terms of the southward extension. In the future, the long-term SMAP SSS opens new possibilities to study the interannual variability of the RIS in the BoB. Third, the SMAP SSS provides unprecedented views into the formation process of the RIS on short time scales of several weeks, which demonstrates that the mesoscale eddies profoundly modulate the spatial structure of the RIS (Figures 9, 10).
In this study, we investigate the RIS along the western BoB coast using the SMAP satellite observations for 2015–2021. The SMAP data exhibit significant advantages in quantifying the spatial and temporal variability of the RIS in the BoB. During the autumns of 2020 and 2021, SMAP SSS clearly identified a continuous, uniform strip of low salinity water (<31 psu) that was 100 km wide extending along the western BoB coast to south of Sri Lanka, reflecting the intensification of the RIS during these two years. Combining the SMAP SSS and satellite altimeter data, the processes responsible for the intensification of the RIS during 2020–2021 were explored.
The analysis indicates that the La Niña events of 2020–2021 were responsible for the intensification of the RIS. During these La Niña events, cyclonic circulation anomalies were generated along the boundary of the BoB to cause a stronger EICC. Meanwhile, the northern BoB received anomalous increased river discharge during the summer monsoons of the two years. The combination of the stronger EICC and increased river discharge led to anomalous freshwater transport along the western BoB coast that contributed to the intensification of the RIS. The SMAP SSS shows that the RIS extended far southward along the BoB coast during the La Niña events of 2016–2017. However, the spatial structures of the RIS differed sharply between 2016–2017 and 2020–2021. During 2016–2017, pairs of eddies in the western BoB steered the river freshwater offshore, extending several hundred kilometers, forming tongue-shaped freshwater plumes to the central bay. These offshore extending freshwater plumes inhibited the formation of an organized RIS structure along the western BoB coast during these two years. This study shows that the year-to-year variability of the RIS was significantly influenced by the La Niña events and modulated by mesoscale processes. In the future, eddy-resolving numerical models with high resolution are necessary to simulate the RIS in the BoB.
The datasets presented in this study can be found in online repositories. The names of the repository/repositories and accession number(s) can be found in the article/supplementary material.
ZL carried out the analysis and wrote the manuscript with the supervision of X-HZ. YL and FP made contributions to the data collection and data processing. All authors discussed the results and commented on the manuscript. All authors contributed to the article and approved the submitted version.
This study was sponsored by the National Natural Science Foundation of China (41920104006, 42106035), the Scientific Research Fund of Second Institute of Oceanography, MNR (JZ2001), the Project of State Key Laboratory of Satellite Ocean Environment Dynamics, Second Institute of Oceanography (SOEDZZ2106 and SOEDZZ2207), the Oceanic Interdisciplinary Program of Shanghai Jiao Tong University (project number SL2021MS021), the Innovation Group Project of Southern Marine Science and Engineering Guangdong Laboratory (Zhuhai) (No. 311020004).
The authors declare that the research was conducted in the absence of any commercial or financial relationships that could be construed as a potential conflict of interest.
All claims expressed in this article are solely those of the authors and do not necessarily represent those of their affiliated organizations, or those of the publisher, the editors and the reviewers. Any product that may be evaluated in this article, or claim that may be made by its manufacturer, is not guaranteed or endorsed by the publisher.
Akhil V., Durand F., Lengaigne M., Vialard J., Keerthi M., Gopalakrishna V., et al. (2014). A modeling study of the processes of surface salinity seasonal cycle in the bay of Bengal. J. Geophysical Res.: Oceans 119, 3926–3947. doi: 10.1002/2013JC009632
Akhil V., Lengaigne M., Vialard J., Durand F., Keerthi M., Chaitanya A., et al. (2016). A modeling study of processes controlling the bay of Bengal sea surface salinity interannual variability. J. Geophysical Res.: Oceans 121 (12), 8471–8495. doi: 10.1002/2016JC011662
Akhil V., Vialard J., Lengaigne M., Keerthi M., Boutin J., Vergely J., et al. (2020). Bay of Bengal sea surface salinity variability using a decade of improved SMOS re-processing. Remote Sens. Environ. 248, 111964. doi: 10.1016/j.rse.2020.111964
Aparna S., Mccreary J., Shankar D., Vinayachandran P. (2012). Signatures of indian ocean dipole and El niño–southern oscillation events in sea level variations in the bay of bengal. J. Geophysical Res.: Oceans 117, 8055. doi: 10.1029/2012JC008055
Bao S., Wang H., Zhang R., Yan H., Chen J. (2019). Comparison of satellite-derived sea surface salinity products from SMOS, aquarius, and SMAP. J. Geophysical Res.: Oceans 124, 1932–1944. doi: 10.1029/2019JC014937
Behera S., Krishnan R., Yamagata T. (1999). Unusual ocean-atmospheric conditions in the tropical Indian ocean during 1994. Geophysical Res. Letter 26, 3001–3004. doi: 10.1029/1999GL010434
Chaitanya A., Lengaigne M., Vialard J., Gopalakrishna V., Durand F., KranthiKumar C., et al. (2014). Salinity measurements collected by fishermen reveal a ‘‘river in the sea’’ flowing along the Eastern coast of India. Bull. Am. Meteorological Soc. 95, 1897–1908. doi: 10.1175/BAMS-D-12-00243.1
Chen G., Li Y., Xie Q., Wang D. (2018). Origins of eddy kinetic energy in the bay of Bengal. J. Geophysical Res.: Oceans 123, 2097–2115. doi: 10.1002/2017JC013455
Chen G., Wang D., Hou Y. (2012). The features and interannual variability mechanism of mesoscale eddies in the bay of Bengal. Continental Shelf Res. 47, 178–185. doi: 10.1016/j.csr.2012.07.011
Cheng X., McCreary J. P., Qiu B., Qi Y., Du Y., Chen X. (2018). Dynamics of eddy generation in the central bay of bengal. J. Geophysical Res.: Oceans 123, 6861–6875. doi: 10.1029/2018JC014100
Cheng X., Xie S., McCreary J. P., Qi Y., Du Y. (2013). Intraseasonal variability of sea surface height in the bay of Bengal, J. Geophysical Res.: Oceans 118, 816–830, doi: 10.1002/jgrc.20075.
Das B., Anandh T., Kuttippurath J., Chakraborty A. (2019). Characteristics of the discontinuity of western boundary current in the bay of Bengal. J. Geophysical Res.: Oceans 124, 4464–4479. doi: 10.1029/2019JC015235
Du Y., Zhang Y. (2015). Satellite and Argo observed surface salinity variations in the tropical Indian Ocean and their association with the Indian Ocean Dipole mode. J. Clim 28 (2), 695–713. doi: 10.1175/JCLI-D-14-00435.1
Durand F., Shankar D., Birol F., Shenoi S. (2009). Spatiotemporal structure of the East India coastal current from satellite altimetry. J. Geophysical Res. 114, C02013. doi: 10.1029/2008JC004807
Entekhabi D., Njoku E., O'Neill P., Kellogg K., Crow W., Edelstein W., et al. (2010). The soil moisture active passive (SMAP) mission. Proc. IEEE 98 (5), 704–716. doi: 10.1109/JPROC.2010.2043918
Fore A., Yueh S., Tanh W., Hayashi A. (2020). JPL SMAP ocean surface salinity products [Level 2B, level 3 running 8-day, level 3 monthly] (Pasadena, CA, USA: Jet Propulsion Laboratory).
Fournier S., Vialard J., Lengaigne M., Lee T., Gierach M., Chaitanya A. (2017). Modulation of the GangesBrahmaputra river plume by the Indian ocean dipole and eddies inferred from satellite observations. J. Geophysical Res.: Oceans 122, 9591–9604. doi: 10.1002/2017JC013333
Gnanaseelan C., Deshpande A., McPhaden M. (2012). Impact of Indian ocean dipole and El Niño/Southern oscillation wind-forcing on the wyrtki jets. J. Geophysical Res. 117, C08005. doi: 10.1029/2012JC007918
Grunseich G., Subrahmanyam B., Murty V., Giese B. (2011). Sea Surface salinity variability during the Indian ocean dipole and ENSO events in the tropical Indian ocean. J. Geophysical Res. 116, C11013. doi: 10.1029/2011JC007456
Han W., McCreary J. (2001). Modeling salinity distributions in the Indian ocean. J. Geophysical Res. 106 (C1), 859–877. doi: 10.1029/2000JC000316
Han W., McCreary J. P., Kohler K. E. (2001). Influence of precipitation minus evaporation and bay of Bengal rivers on dynamics, thermodynamics, and mixed layer physics in the upper Indian ocean. J. Geophysical Res. 106, 6895–6916. doi: 10.1029/2000JC000403
Hong C., Lu M., Kanamitsu M. (2008). Temporal and spatial characteristics of positive and negative Indian ocean dipole with and without ENSO. J. Geophysical Res. 113, D08107. doi: 10.1029/2007JD009151
Jensen T. (2001). Arabian Sea And bay of Bengal exchange of salt and tracers in an ocean model. Geophysical Res. Lett. 28, 3967–3970. doi: 10.1029/2001GL013422
Lasitha Perera G., Chen G., McPhaden M., Priyadarshana T., Huang K., Wang D. (2019). Meridional and zonal eddy-induced heat and salt transport in the bay of Bengal and their seasonal modulation. J. Geophysical Res.: Oceans 124, 8079–8101. doi: 10.1029/2019JC015124
Li Z., Huang S., Zhu X., Sun Z., Long Y., Xie H. (2021a). Short-term offshore extension of Brahmaputra-Ganges and irrawaddy freshwater plumes to the central northern bay of Bengal based on in situ and satellite observations. Acta Oceanologica Sin. 40 (5), 80–93. doi: 10.1007/s13131-021-1729-y
Li Z., Lian T., Ying J., Zhu X.-H., Papa F., Xie H., et al. (2021b). The cause of an extremely low salinity anomaly in the bay of Bengal during 2012 spring. J. Geophysical Res.: Oceans 126, e2021JC017361. doi: 10.1029/2021JC017361
McPhaden M., Meyers G., Ando K., Masumoto Y., Murty V., Ravichandran M., et al (2009). RAMA: The research moored array for African-Asian-Australian monsoon analysis and prediction. Bull. Am. Meteorological Soc 90, 459–480.
Murty V. S. N., Sarma Y. V. B., Rao D. P., Murty C. S. (1992). Water characteristics, mixing and circulation in the bay of Bengal during southwest monsoon. J. Mar. Res. 50 (2), 207–228. doi: 10.1357/002224092784797700
Pant V., Girishkumar M., Udaya Bhaskar T., Ravichandran M., Papa F., Thangaprakash V. (2015). Observed interannual variability of near-surface salinity in the bay of Bengal. J. Geophysical Res.: Oceans 120, 3315–3329. doi: 10.1002/2014JC010340
Papa F., Bala S., Pandey R., Durand F., Gopalakrishna V., Rahman A., et al. (2012). Ganga-Brahmaputra river discharge from Jason-2 radar altimetry: An update to the long-term satellite-derived estimates of continental freshwater forcing flux into the bay of Bengal. J. Geophysical Res. 117, C11021. doi: 10.1029/2012JC008158
Papa F., Durand F., Rossow W., Rahman A., Bala S. (2010). Satellite altimeter derived monthly discharge of the ganga-Brahmaputra river and its seasonal to interannual variations from 1993 to 2008. J. Geophysical Res. 115, C12013. doi: 10.1029/2009JC006075
Paul N., Sukhatme J., Sengupta D., Gayen B. (2021). Eddy induced trapping and homogenization of freshwater in the Bay of Bengal. J. Geophysical Res: Oceans 126, e2021JC017180.
Roman-Stork H., Subrahmanyam B., Murty V. (2020). The role of salinity in the southeastern Arabian Sea in determining monsoon onset and strength. J. Geophysical Res.: Oceans 125, e2019JC015592. doi: 10.1029/2019JC015592
Saji N., Goswami B., Vinayachandran P., Yamagata T. (1999). Nature 401, (6751), 360–363. doi: 10.1038/43855
Sengupta D., Bharath R., Shenoi S. (2006). Surface freshwater from bay of Bengal runoff and Indonesian throughflow in the tropical Indian ocean. Geophysical Res. Lett. 33, L22609. doi: 10.1029/2006GL027573
Sherin R., Durand F., Gopalakrishna V., Anuvinda S., Chaitanya A., Bourdallé-Badied R., et al. (2018). Signature of Indian ocean dipole on the western boundary current of the bay of Bengal revealed from 27 years of repeated in situ observations. Deep-Sea Res. Part I 136, 91–106. doi: 10.1016/j.dsr.2018.04.002
Shetye S., Gouveia A., Shankar D., Shenoi S., Vinayachandran P., Sundar D., et al. (1996). Hydrography and circulation in the western bay of Bengal during the northeast monsoon. J. Geophysical Res. 101 (C6), 14011–14025. doi: 10.1029/95JC03307
Shetye S., Gouveia A., Shenoi S., Sundar D., Michael G., Nampoothiri G. (1993). The western boundary current of the seasonal subtropical gyre in the bay of Bengal. J. Geophysical Res. 98 (C1), 945–954. doi: 10.1029/92JC02070
Sprintall J., Tomczak M. (1992). Evidence of the barrier layer in the surface layer of the tropics. J. Geophysical Res. 97 (C5), 7305. doi: 10.1029/92JC00407
Sree Lekha J., Buckley J. M., Tandon A., Sengupta D. (2018). Subseasonal dispersal of freshwater in the northern bay of Bengal in the 2013 summer monsoon season. J. Geophysical Res.: Oceans 123, 6330–6348. doi: 10.1029/2018JC014181
Sree Lekha J., Lucas A., Sukhatme J., Joseph J., Ravichandran M., Suresh Kumar N., et al (2020). Quasi-biweekly mode of the Asiansummer monsoon revealed in Bay ofBengal surface observations. J. Geophysical Res: Oceans 125, e2020JC016271. doi: 10.1029/2020JC016271
Stuecker M., Timmermann A., Jin F., Chikamoto Y., Zhang W., Wittenberg A., et al. (2017). Revisiting ENSO/Indian ocean dipole phase relationships. Geophysical Res. Lett. 44, 2481–2492. doi: 10.1002/2016GL072308
Subrahmanyam B., Murty V., Heffner D. (2011). Sea Surface salinity variability in the tropical Indian ocean. Remote Sense Environ. 115, 944–956. doi: 10.1016/j.rse.2010.12.004
Subrahmanyam B., Trott C., Murty V. (2018). Detection of intraseasonal oscillations in SMAP salinity in the bay of Bengal. Geophysical Res. Lett. 45, 7057–7065. doi: 10.1029/2018GL078662
Suneel V., Alex M., Thomas P., Gurumoorthi K., Rao V., Harikrishnan S., et al. (2020). Impact of remote equatorial winds and local mesoscale eddies on the existence of “River in the sea” along the East coast of India inferred from satellite SMAP. J. Geophysical Res.: Oceans 125, e2020JC016866. doi: 10.1029/2020JC016866
Tang W., Fore A., Yueh S., Lee T., Hayashi A., Sanchez-Franks A., et al. (2017). Validating SMAP SSS with in situ measurements. Remote Sens. Environ. 200, 2561–2564. doi: 10.1109/IGARSS.2017.8127518
Thadathil P., Muraleedharan P. M., Rao R. R., Somayajulu Y. K., Reddy G. V., Revichandran C. (2007). Observed seasonal variability of barrier layer in the bay of Bengal. J. Geophysical Res. 112, C02009. doi: 10.1029/2006JC003651
Thompson B., Gnanaseelan C., Salvekar P. (2006). Variability in the Indian ocean circulation and salinity and its impact on SST anomalies during dipole events. J. Mar. Res. 64, 853–880. doi: 10.1357/002224006779698350
Trott C., Subrahmanyam B., Murty V., Shriver J. (2019). Large-Scale fresh and salt water exchanges in the Indian ocean. J. Geophysical Res.: Oceans 124, 6252–6269. doi: 10.1029/2019JC015361
Vinayachandran P., Murty V., Ramesh Babu V. (2002). Observations of barrier layer formation in the bay of Bengal during summer monsoon. J. Geophysical Res. 107 (C12), 8018. doi: 10.1029/2001JC000831
Webster P., Magana A., Palmer T., Shukla J., Tomas R., Yanai M., et al. (1998). Monsoons: processes, predictability, and the prospects for prediction. J. Geophysical Res.: Oceans 103 (C7), 14451–14510.
Keywords: Bay of Bengal, river in the sea, SMAP, La Niña, Eastern Indian Coastal Current, mesoscale process
Citation: Li Z, Long Y, Zhu X-H and Papa F (2023) Intensification of “river in the sea” along the western Bay of Bengal Coast during two consecutive La Niña events of 2020 and 2021 based on SMAP satellite observations. Front. Mar. Sci. 9:1103215. doi: 10.3389/fmars.2022.1103215
Received: 20 November 2022; Accepted: 27 December 2022;
Published: 13 January 2023.
Edited by:
Xiaoteng Shen, Hohai University, ChinaReviewed by:
Miaohua Mao, Yantai Institute of Coastal Zone Research (CAS), ChinaCopyright © 2023 Li, Long, Zhu and Papa. This is an open-access article distributed under the terms of the Creative Commons Attribution License (CC BY). The use, distribution or reproduction in other forums is permitted, provided the original author(s) and the copyright owner(s) are credited and that the original publication in this journal is cited, in accordance with accepted academic practice. No use, distribution or reproduction is permitted which does not comply with these terms.
*Correspondence: Xiao-Hua Zhu, eGh6aHVAc2lvLm9yZy5jbg==
Disclaimer: All claims expressed in this article are solely those of the authors and do not necessarily represent those of their affiliated organizations, or those of the publisher, the editors and the reviewers. Any product that may be evaluated in this article or claim that may be made by its manufacturer is not guaranteed or endorsed by the publisher.
Research integrity at Frontiers
Learn more about the work of our research integrity team to safeguard the quality of each article we publish.