 Beihan Jiang1
 Tuofu You
 Yuanmin Sun
- 1College of Civil Engineering, Fuzhou University, Fuzhou, China
- 2Third Institute of Oceanography, Ministry of Natural Resources, Xiamen, China
- 3Lianjiang Water Conservancy Bureau, Fuzhou, China
As a “marine ecological engineer”, the oyster reefs not only perform important ecological functions, but also reduce the damage caused by waves to protective structures such as seawalls. However, oyster reefs in shallow water change the nonlinear characteristics of waves and affect sediment transport and coastal evolution. Based on Fourier spectrum and analysis of Wavelet Transform, the influence of artificial bag oyster reefs on the energy and nonlinear phase coupling of irregular waves are studied through physical experiment. The results show that oyster reefs have a substantial effect on the energy of primary harmonic, which transfer to higher harmonics through triad interactions, and a considerable reduction in primary harmonic energy and an increase in higher harmonics energy are reflected in the energy spectra. The transmission spectrum behind the oyster reefs shows three peaks at primary, secondary and third harmonics. The bicoherence spectrum indicates that the peaks at secondary and third harmonics mainly result from the self-coupling of the primary harmonics and phase coupling between the primary and secondary harmonics respectively. As the water depth increases, the degree of nonlinear coupling between wave components decreases, which leads to the energy of wave components at different frequencies increases. With increasing top width, the length of the shoaling region increases, and the growth of triad nonlinear interactions are observed in wavelet-based bicoherence spectra, resulting in the spectral peak energy decreasing while the secondary harmonics energy increasing in the spectrum. Finally, the potential application of an ecological system composed by “oyster reefs + mangroves” is discussed. As the effect of water depth on wave energy is much greater than that of top width, in artificial oyster reef construction, it is recommended that keep the oyster reefs non-submerged in terms of wave dissipation. Further studies should take the dynamic growth effect of oyster reefs into account.
1 Introduction
With the global warming and sea level rise, coastal areas, as high-risk and high-vulnerability areas of climate change, face many risks such as land inundation, strong storm surge, saltwater intrusion, coastal erosion and flood damage (Hoegh-IPCC et al., 2014). A comprehensive protection system combining engineering and ecology should be adopted to improve the resilience of coasts and minimize disaster losses.
At present, the “gray” rigid structures built with concrete, such as seawalls and submerged breakwaters, play a dominant role in coastal protection (Spalding et al., 2014). The submerged breakwaters mainly have significant impact on wave resistance, sand prevention and flow diversion. At the same time, when the wave propagates over the submerged breakwaters, the wave breaks with a large amount of energy dissipation, which will reduce the impact of the current against the shore. Many studies have pointed out that the main factors affecting the wave dissipation coefficient of the submerged breakwaters are the top water depth, incident wave elements, relative width, etc. The wave dissipation effect of submerged breakwaters is obvious at low water level, but is relatively poor on long period waves, and increases with the increase of the top width (Daemen, 1991; D’angermound et al., 1996; Bian et al., 2020). As for the changes of waves before and after passing through submerged breakwaters, most scholars focus on the study of external structures such as wave reflection coefficient, transmission coefficient, wave pattern and wave height (Beji and Battjes, 1993; Ohyama and Nadaoka, 1994; Rambabu and Mani, 2005), but few on the internal structure of waves.
Although the “gray” structures such as submerged breakwaters can sufficiently alleviate shoreline retreat, the ecological damage they cause can be enormous (Kennish, 2002; National Research Council, 2007). These “gray” structures destroy the natural landscape of the coast and negatively impacts the coastal ecosystem (Saleh and Weinstein, 2016). In recent years, continuous research has shown that “green” coastal ecological projects, such as mangrove restoration, coral reef and oyster reef restoration, can dissipate wave energy and mitigate coastal erosion. At the same time, “green” structures such as oyster reefs can quickly self-restore after being damaged by storms. Compared with rigid protective structures, “green” structures have the advantage of lower maintenance costs and can substantially improve coastal ecosystem services (Morris et al., 2019; Jiang et al., 2022; Lipcius et al., 2021; Wang et al., 2022). Therefore, the “green” coastal ecological protection project is gradually paid attention to and applied by governments all over the world.
In addition to the artificial oyster reefs made of concrete directly, part of the collected oysters will also be put into net bags to construct the reef (Morris et al., 2019). Compared with the submerged breakwaters, the profile of oyster reefs is irregular, with a relatively high porosity and roughness. In addition, with the growth of oysters, the volume of oyster reef increases, and may not be always submerged. The influence on the wave is different from that of the submerged breakwaters. Oyster reefs change the offshore hydrodynamic conditions by increasing bed friction (Whitman and Reidenbach, 2012; Styles, 2015; Kibler et al., 2019), promoting wave attenuation (Manis et al., 2015), and increasing deposition on the leeward of the reef (De Paiva et al., 2018; Chowdhury et al., 2019). However, few studies investigate the influence of “green” structures composed of organisms such as oyster reefs on waves. Only a few institutions have issued disaster prevention design guidelines related to oyster reefs. In recent years, Allen (2013) examined the wave dissipation effect of three artificial reefs, namely, bag oyster reefs, concrete prism and triangular steel frame oyster reefs, under different hydrodynamic conditions through the physical models. Spiering et al. (2018) measured the wave dissipation effect and hydrodynamic influence of oyster reefs by using ADV and wave altimeters on site. Chauvin (2018) used pressure gauge to measure the wave attenuation of oyster reef breakwater and studied the wave attenuation law of various oyster reefs. Wiberg et al. (2019) measured the intertidal oyster reefs in four oyster reef restoration areas and found that oyster reefs close to the average sea level can substantially reduce the wave energy. Carter et al. (2017) predicted the nonlinearity of wave attenuation effect of various oyster reefs by numerical simulation.
In nearshore shallow water where oyster reefs grow, waves show strong nonlinear characteristics through physical phenomena such as shallow water deformation, refraction, reflection, diffraction, energy dissipation and breaking, and the wave speed, length, height and waveform will be substantially changed (Yu, 2013). Many studies have shown that the nonlinear interaction is accompanied by the whole process of wave propagation and deformation, which is the key to understand the wave dynamics. This strong nonlinear characteristic is also closely related to the extreme wave, sediment transport and coastal deformation (Nielsen, 1992; Drake and Calantoni, 2001; Nielsen and Callaghan, 2003; Saprykina et al., 2013). The variation of energy spectrum in the process of wave deformation in shallow water shows different characteristics compared with that in deep water. The study on the variation of wave energy in this nonlinear process will help to understand the energy transfer phenomenon between different wave components (Zanuttigh and Martinelli, 2018). Elgar and Guza (1985) found that when the wave propagates to a nearshore shoal, the wave asymmetry gradually increases, with the wave skewness gradually reaching a maximum during the shoaling process and then decreasing to zero in shallower water. Peng et al. (2009) studied the asymmetry and skewness of wave propagation by measured wave data, analyzed the influence of the local Ursell number on the asymmetry and skewness of waves, and fitted the relationship between the Ursell number, asymmetry and skewness to obtain a series of empirical formulas.
However, there are limitations to predict the waveform by local wave parameters in shallow water. Even if the height, period and water depth of the waves are completely the same, because of the difference in topographic conditions and the rapid change of hydrodynamic conditions, the incident wave and the conversion to locked wave may be different, resulting in different nonlinear parameters (Ma et al., 2015). Since the locked wave and the free wave follow different dispersion relationship, triad interaction analysis is a relatively simple method for distinguishing the locked wave and the free wave energy (De Wit et al., 2020). Analyzing the complete three-dimensional spectrum requires high-resolution spatial information, which is difficult to obtain. Therefore, Fourier bispectrum analysis, as an alternative to three-dimensional spectrum analysis, can be used to characterize the binding energy in a given frequency range. On the basis of the bispectrum, Doering and Bowen (1995) analyzed the data measured at a natural beach and derived several empirical relationships between the nonlinear parameters and the local Ursell number describing the variation of phase coupling between the primary harmonics. Young and Eldeberky (1998) investigated the nonlinear process of wave growth in deeper water and reported that the triad interactions play an important role in the evolution of wind waves. Additionally, Eldeberky and Battje (1996); Beji and Nadaoka (1999), and Dong et al. (2008) gave a proper description of the nonlinear evolution mechanism in shallow water through the theory of triad interactions.
Compared with the Fourier transform, the wavelet transform is a localized analysis of signal time and frequency (Ma, 2010). It performs step-by-step multiscale refinement of the signal through scaling and translation operations, and finally realizes time subdivision at high frequencies and frequency subdivision at low frequencies. It can also automatically adapt to the requirements of time-frequency signal analysis, thereby focusing on any details of the signal (Newman et al., 2021). In recent years, wavelet transform theory has been gradually applied to wave analysis. Wavelet-based bispectrum theory was first proposed by Van Milligen et al. (1995) and applied to the phase coupling of plasma turbulent. Chung and Powers (1998); Larsen and Hanssen (2000) proved that wavelet-based bispectrum had more degrees of freedom than Fourier-based bispectrum. Dong et al. (2009) successfully applied this method to the interaction of irregular waves on curved shoals. Ma et al. (2010) studied the nonlinear deformation of focused waves in medium water depth conditions by this method. The wavelet transform theory is also applied to analyze wave data collected in the nearshore area of lakes (Muchebve et al., 2016). Elsayed (2006) successfully applied the wavelet-based bispectrum to analyze the frequency coupling phenomenon in the process of wind wave growth. On the basis of wavelet-based bispectrum theory, Chen et al. (2018) studied the nonlinear characteristics of wave propagation on three bottom slopes and investigated the change in wave energy caused by nonlinear interactions. All these studies have confirmed the reliability of wavelet-based bispectrum on nonlinear feature analysis.
Investigating the wave evolution and energy transfer process around the oyster reefs is the basis for analyzing the wave dissipation mechanism of oyster reefs. Currently, only a few experimental studies have considered triad interactions under the impact of the oyster reefs. Therefore, through physical model experiment, Fourier analysis and wavelet-based bispectrum are adopted to study the evolution process of the wave energy spectrum and the nonlinear interactions among wave components during the irregular waves propagating through artificial bag oyster reefs, with a view to providing references for research and engineering in coastal ecological restoration and near-shore sediment transport.
2 Materials and methods
2.1 Wave flume
The physical experiment is conducted in the wave flume at the Fujian Key Laboratory of Hydrodynamics and Hydraulic Engineering, China. The wavemaker is installed at one end of the wave flume, with a length of 60 m, a width of 1.0 m, and a depth of 1.5 m deep. The minimum and maximum water depths are 0.2 m and 1.0 m, respectively. An energy dissipation network is equipped behind the wave maker, and wave absorbers are installed to help mitigate wave reflection at the other end of the flume, with an energy dissipation more than 95%. The description about this experiment set-up is shown in Figure 1.
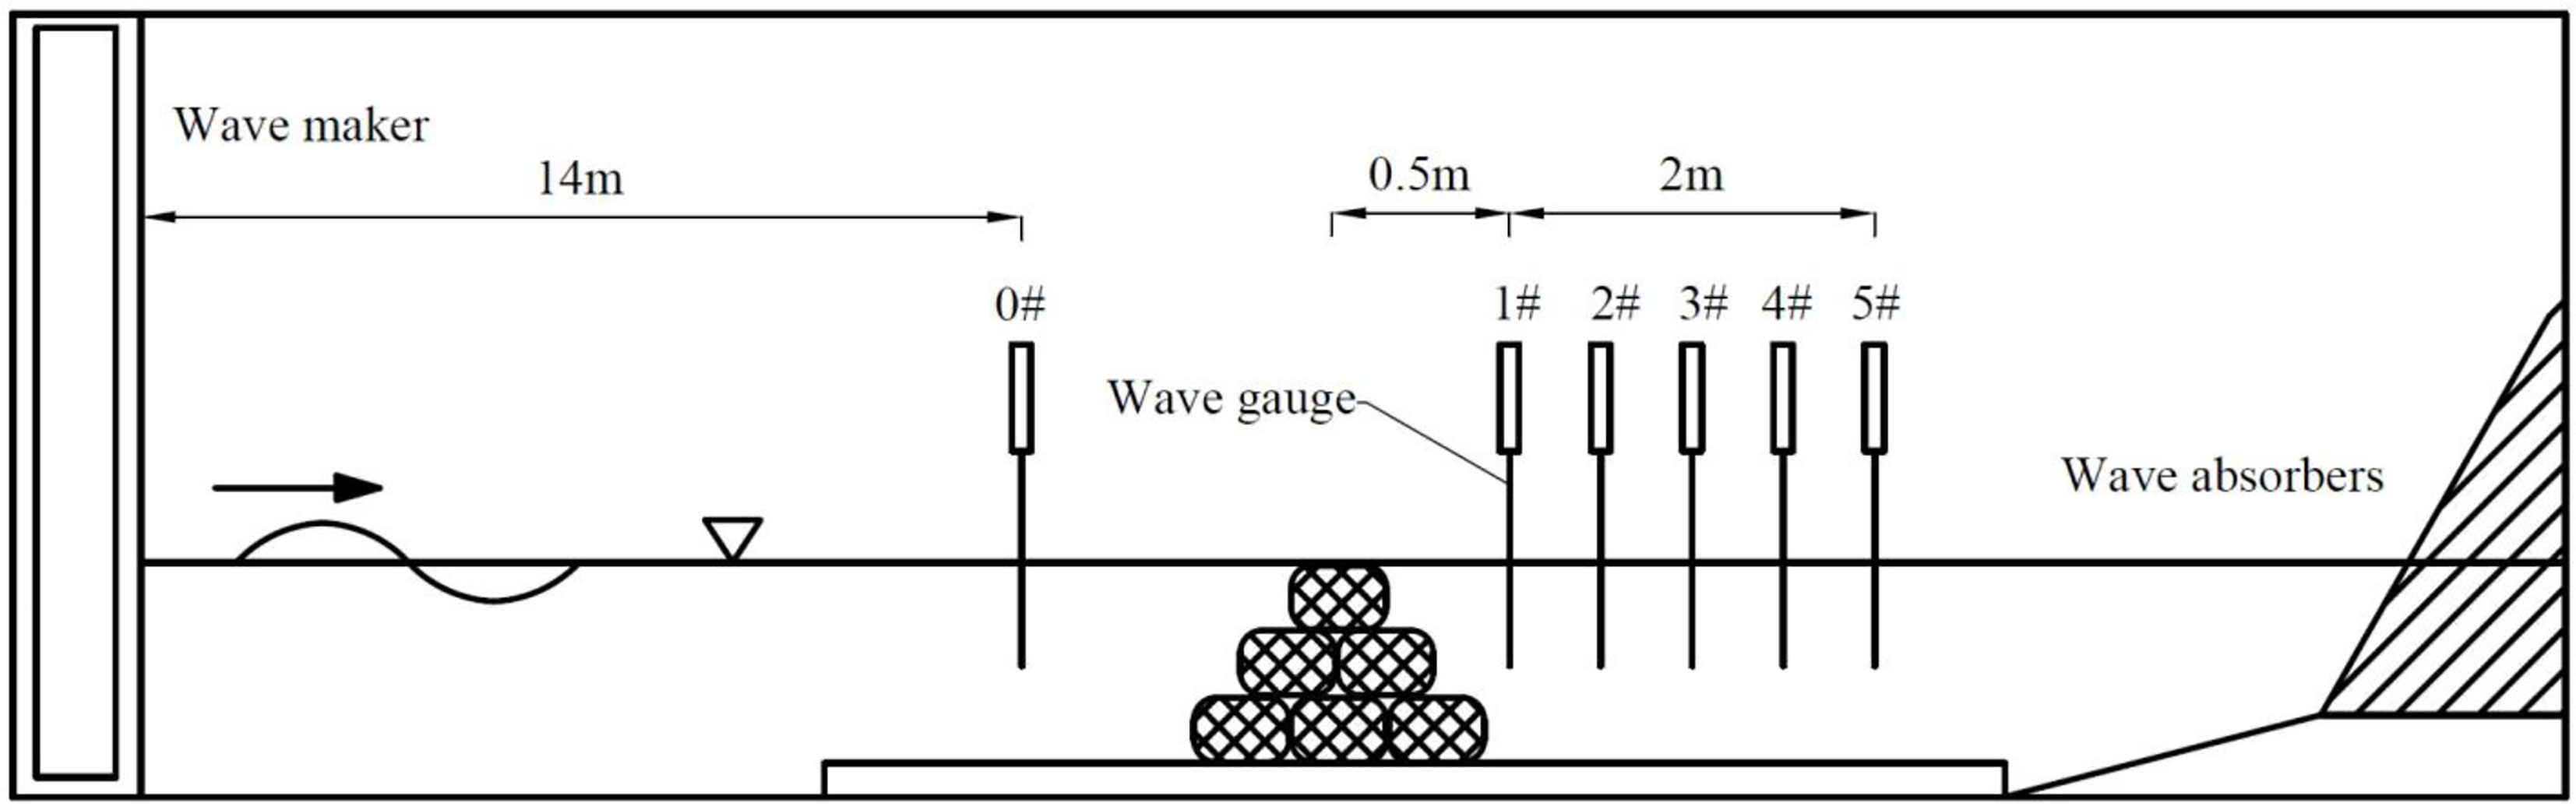
Figure 1 Experimental set-up.
The distance from the model to the wavemaker and to the wave elimination device should be 6 times and 2 times longer than the effective wavelength, respectively. All the conditions in this experiment meet the requirements. The No.0 wave gauge is arranged 14 m away from the wavemaker to measure the incident wave. Five wave gauge measuring points are arranged every 0.5 m from the center of the model, to measure the wave parameters after the oyster reefs, as shown in Figure 1. At the beginning of the experiment, the first four to five waves generated by the wave maker are generally unstable, which are ignored before data collection. Each record is 163.84 s in length with a sample interval of 0.02 s. For obtaining sufficient and accurate data of waves for statistical analysis, each record is repeatedly collected three times.
2.2 Oyster reef type
The bag type oyster reef, which has been widely used in the past years, is selected in the experiment. The material of oyster reef is composed of 4-6 cm long natural shells, with a length scale of 4 and a porosity of 0.7 approximately, which is consistent with the practical situation. Four types of oyster reefs are designed in this experiment, as shown in Figure 2. The green part indicates that the oyster reefs are covered by biodegradable materials with better water resistance, while the grid part is covered by net bags. M1 are three-layer oyster reefs to study the influence of different hydrodynamic conditions on the nonlinear characteristics of waves. M2-M4 are double-layer oyster reefs to study the influence of the top width of the oyster reefs on the nonlinear characteristics of waves. Each layer of the oyster reef is composed of two connected parts of the same reef. The width of each part is 0.47 m, and the top center height d of the reefs is 0.272 m (three layers), or 0.18 m (double layers). Due to the flexibility of the oyster reefs, the reef in the center top is higher, while in the junction and the sidewall are lower, as shown in Figure 3.
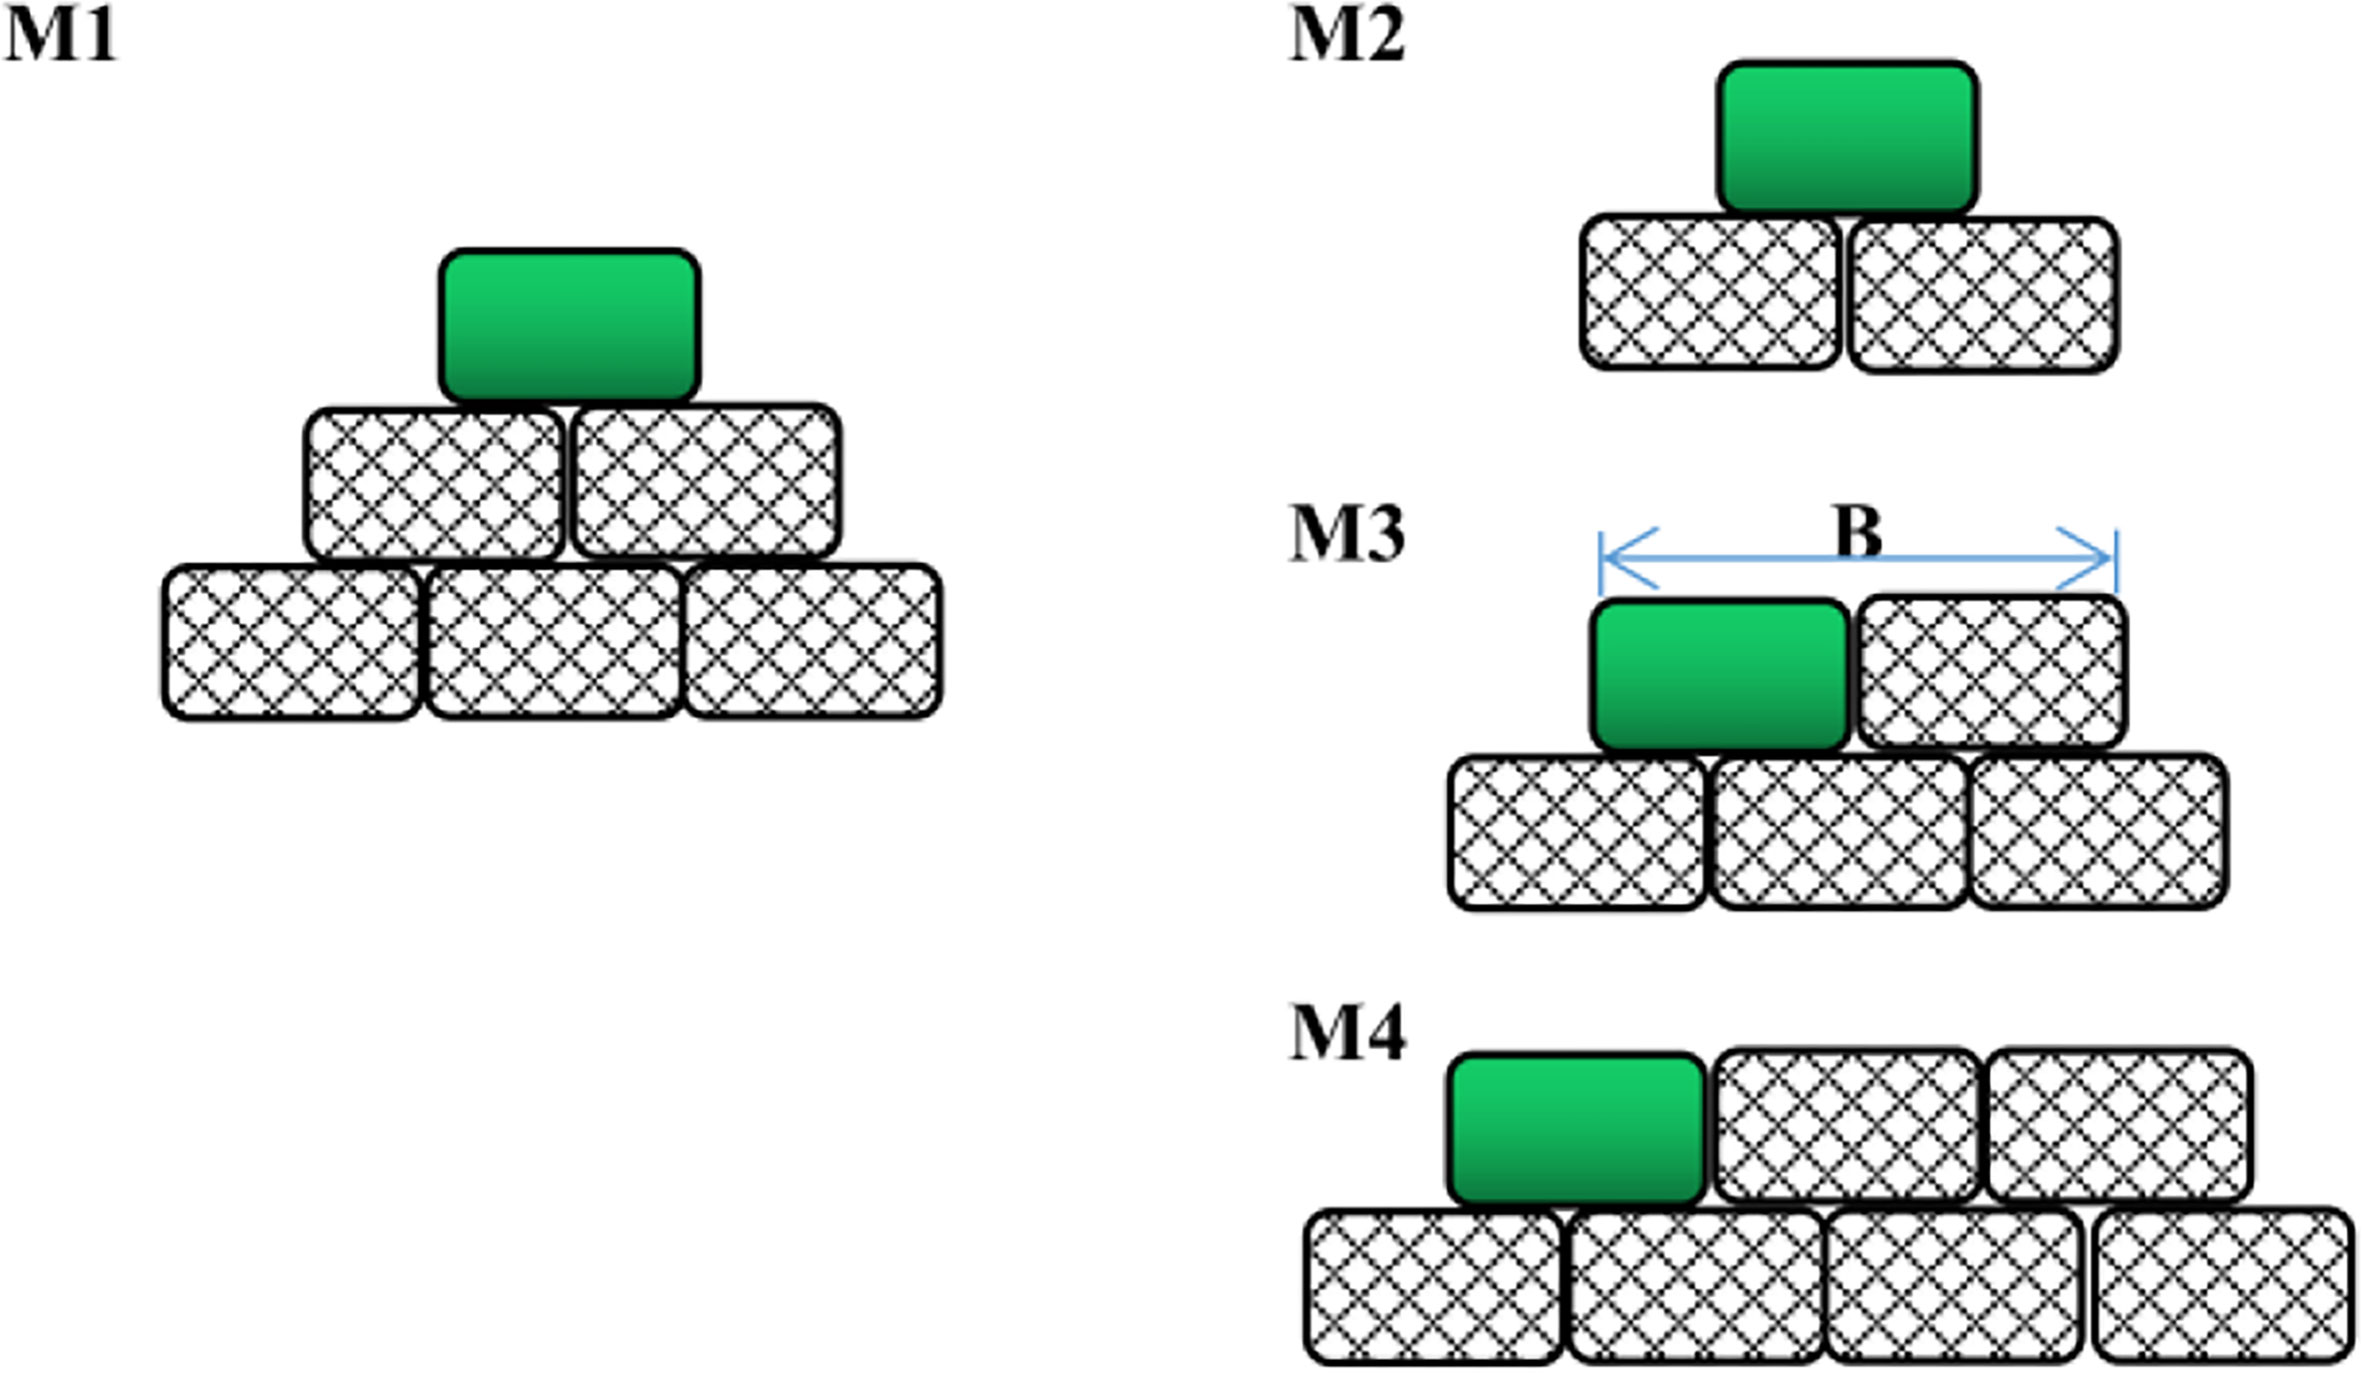
Figure 2 Oyster reef type.
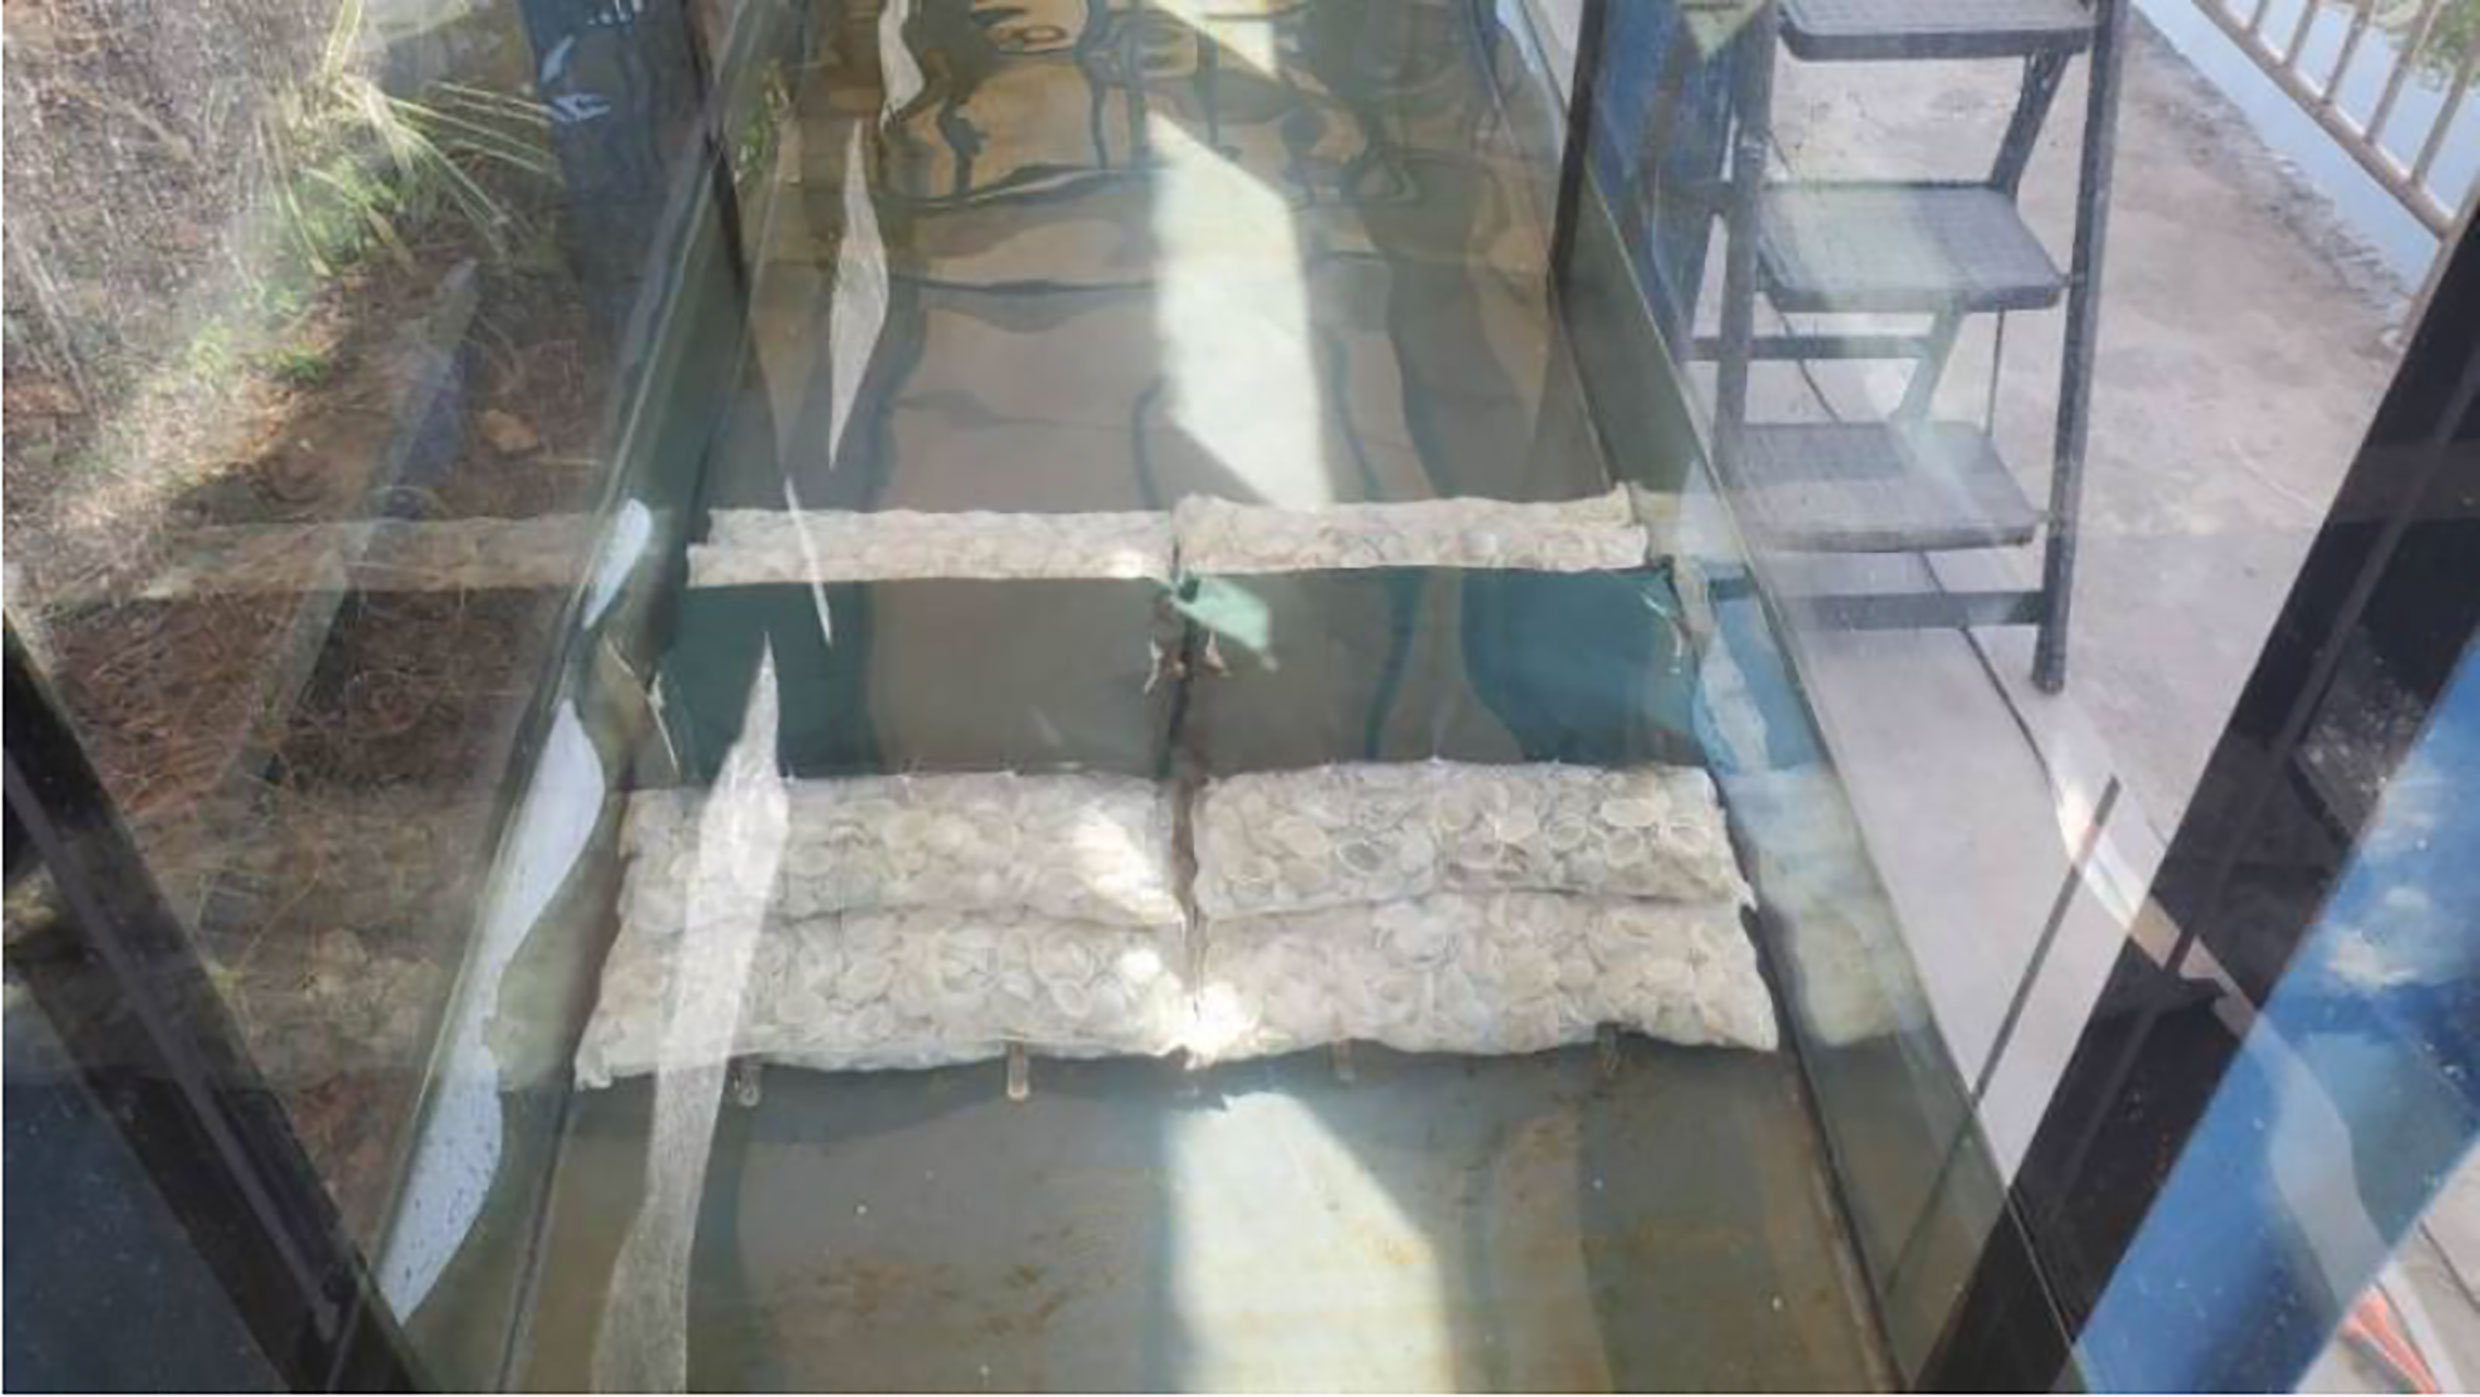
Figure 3 M1 physical model.
2.3 Hydrodynamic conditions
In the experiment of three-layer oyster reef, five water depths D of 0.26 m, 0.27 m, 0.28 m, 0.3 m and 0.32 m were considered respectively. Among them, D = 0.26 m and 0.27 m are the emerged conditions, and the rest water depths are submerged conditions. The range of incident wave height Hi (significant wave height) is 0.023 m - 0.043 m, corresponding to the actual wave height of 0.13 m - 0.17 m, which is suitable for the conservation and growth of oyster reefs. In the double-layer oyster reef experiment, two water depths of 0.27 m and 0.3 m were considered, both of which were submerged conditions, and the incident wave height is Hi = 0.043 m. The peak period of spectra is set as T = 1 s, and 1.5 s, as a comparison between short and long periods. The experimental parameters are shown in Table 1.
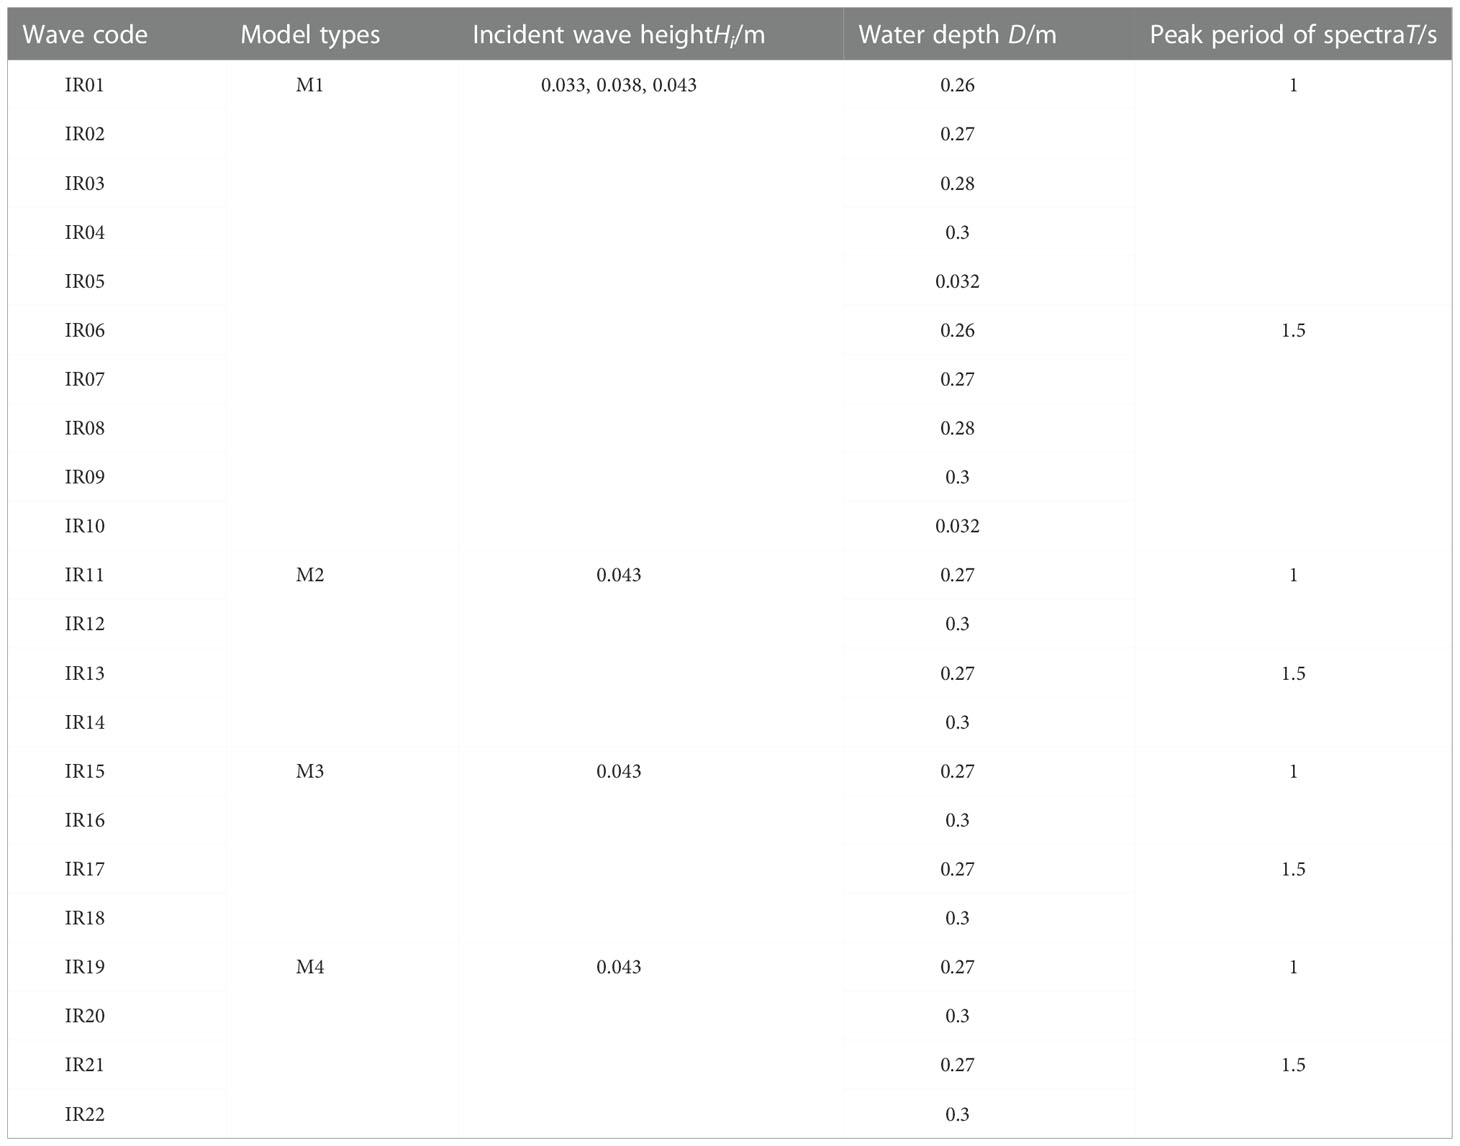
Table 1 Incident wave parameters.
The commonly used JONSWAP spectra is adopted as the incident wave, and the incident spectrum is simulated according to the following equations:
where S(f) is the spectra density function, reflecting the wave energy at the corresponding frequency. f is the frequency of wave component. T is the peak period of spectra, and γ is the peak enhancement factor. Only the case of γ = 3.3 is studied, which is close to the actual wave spectrum. σ is the spectral shape parameter, which controls the skewness of the spectrum. βJ is defined as a function of spectrum bandwidths. H1/3 and TH1/3 are the effective wave height and the corresponding effective period, respectively.
2.4 Data analysis method
2.4.1 Energy spectral analysis
Through Fourier spectrum analysis, the distribution of wave energy in the frequency domain can be clearly seen. This method is relatively mature and has been widely used. The fast Fourier transform (FFT) is used to calculate the spectrum of the wave, and then, the spectrum is smoothed by the Hanning window with a smooth degree of 6. Abroug et al. (2020) summarized the methods of previous researchers on wave spectrum partitioning. Through flume experiments, the wave energy spectrum of different spectral pattern, including P-M spectrum, J spectrum with γ = 3.3 and 7, were divided into four regions according to the proportion of energy in each frequency, namely, the spectral peak region E1, the transfer region E2, the high frequency region E3, the low frequency region E4. The partition is shown in Figure 4.
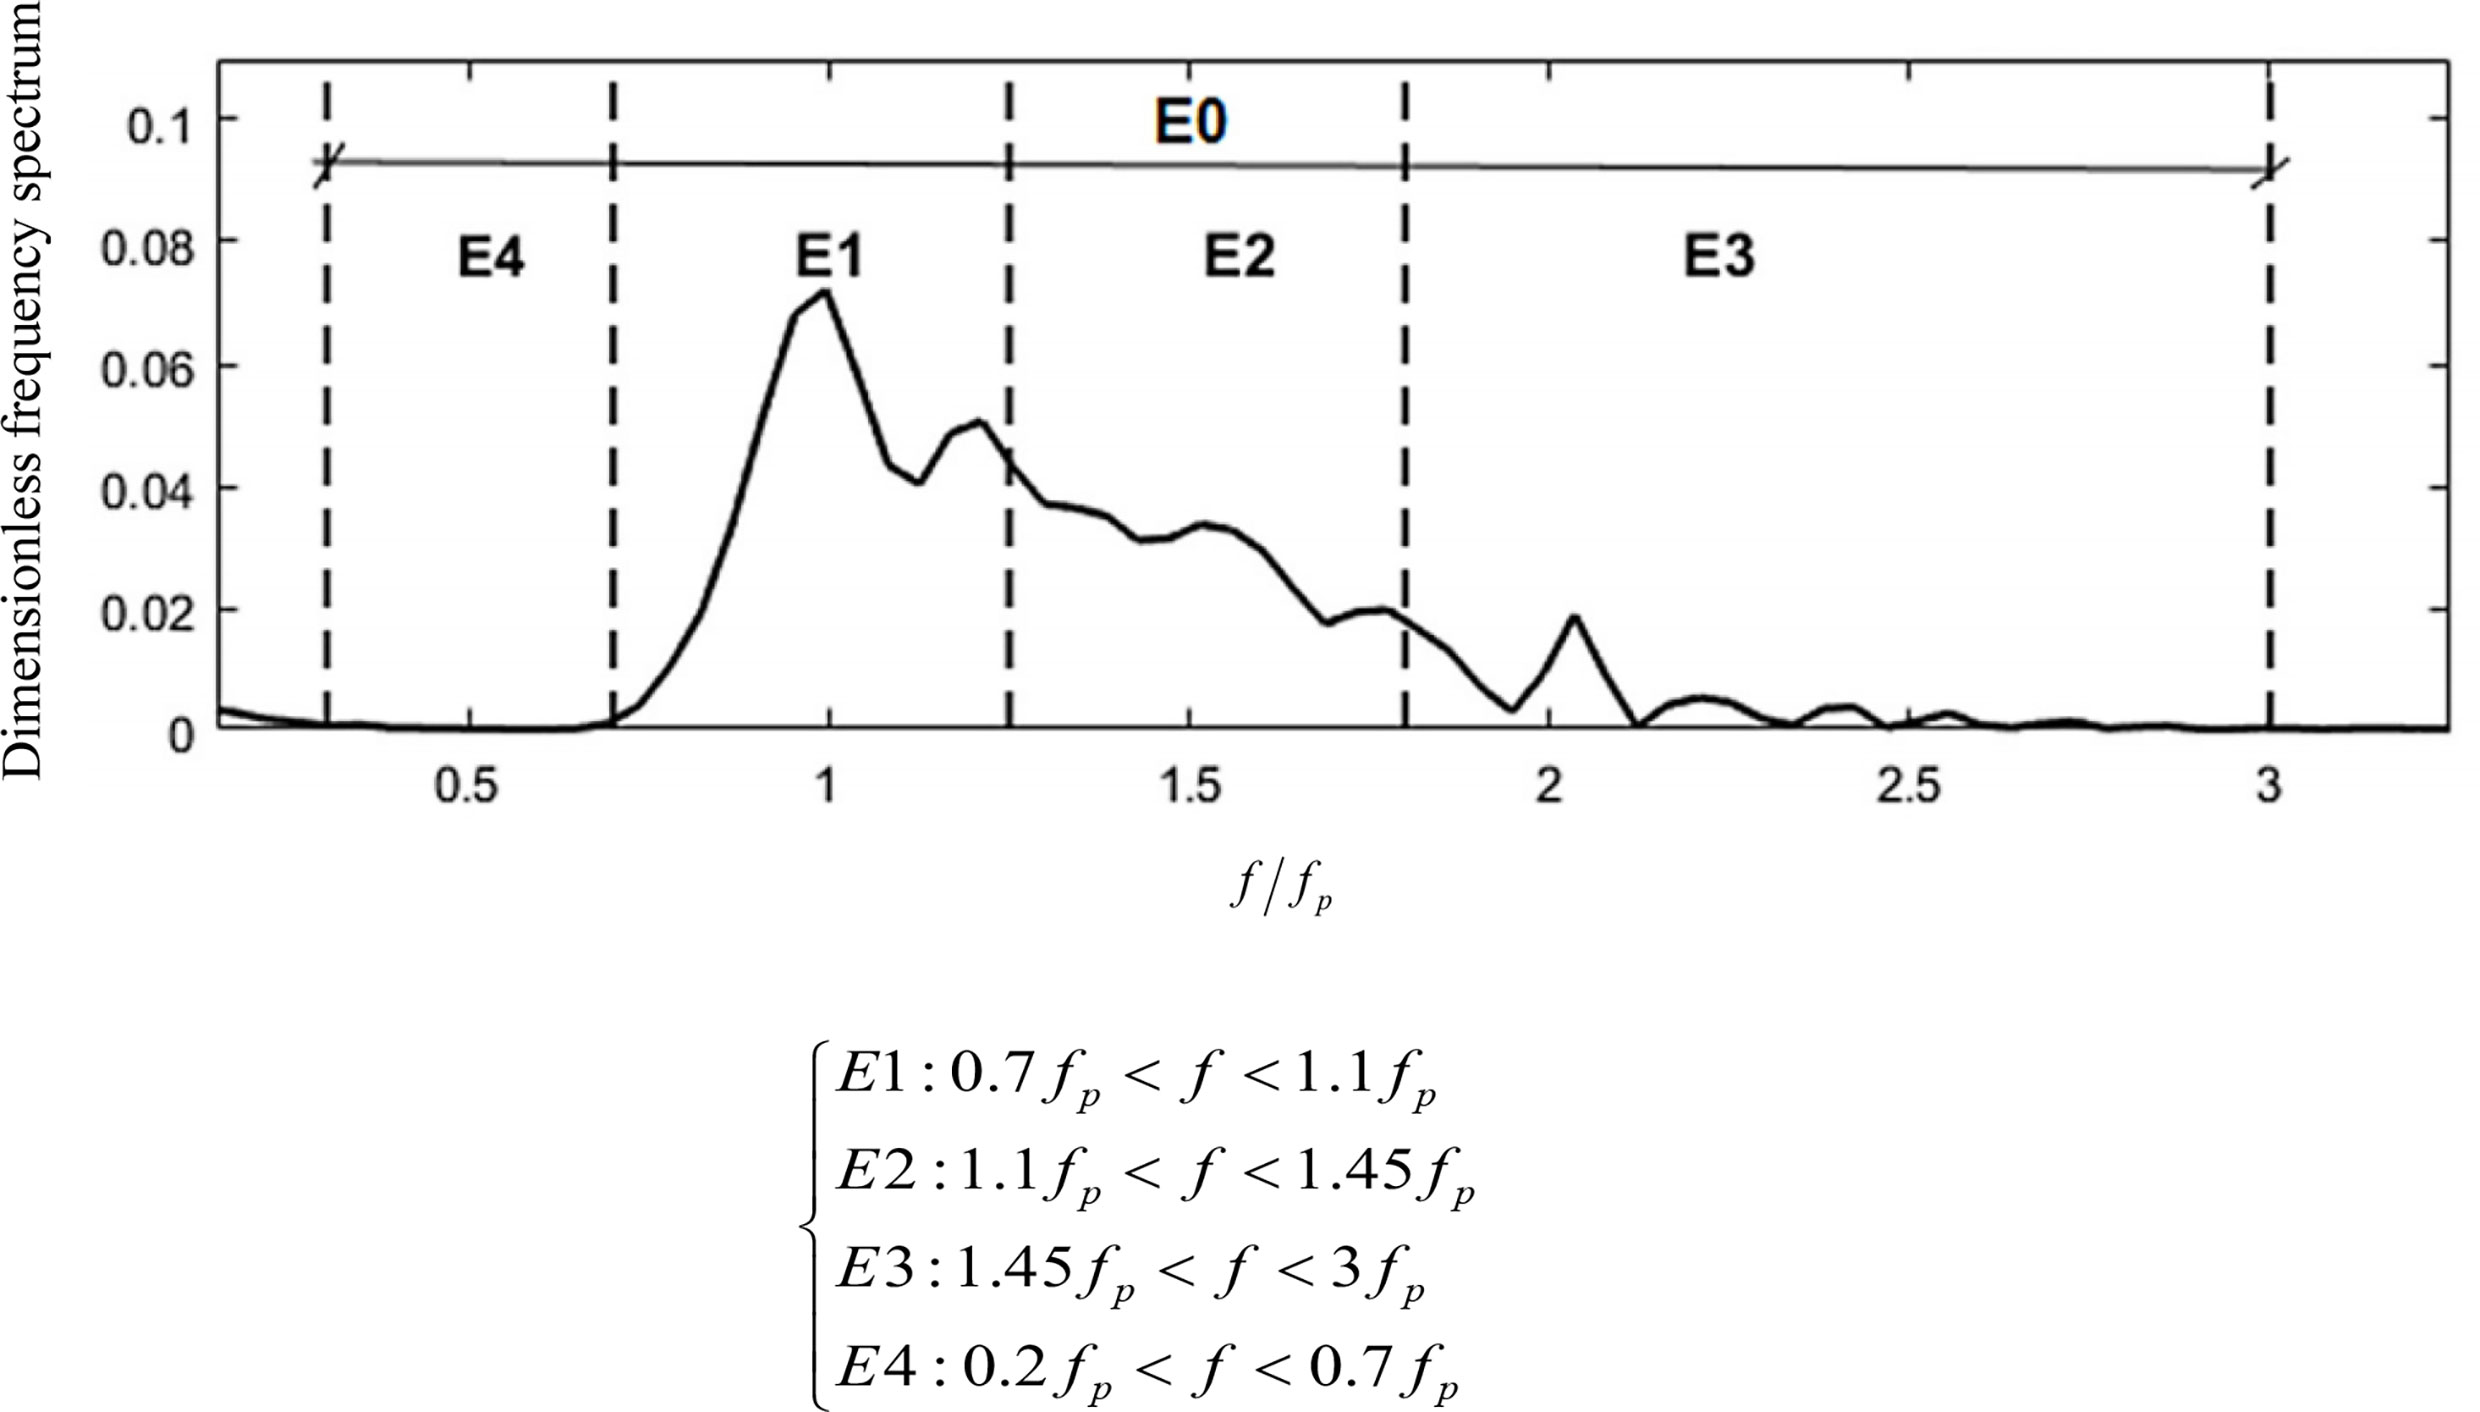
Figure 4 Energy spectrum partition proposed by Abroug et al. (2020).
2.4.2 Wavelet-based bispectrum analysis
The continuous wavelet transforms of a time series x(t) is defined as:
where the asterisk (*) represents the complex conjugate operation. And is generally called the analytic wavelet or the continuous wavelet, which represents family wavelets obtained from the mother wavelet function ψ(t) by translating in time, τ, and dilation with scale, a. The scale a can be interpreted as the reciprocal of frequency f, i.e. f = 1/a. Thus, the expression for can be defined as:
When analyzing data related to water waves, the Morlet wavelet is usually chosen as the mother wavelet (Liu, 2000a; Liu, 2000b). The wavelet is a plane wave modulated by the Gaussian envelope, with good local properties in both time and frequency domain, and is defined as:
where ω0is the peak frequency of the wavelet, which needs to be greater than 6.0 at least to meet the condition of the wavelet transform.
The wavelet-based bispectrum is defined as:
where f1 and f2must satisfy the resonant triad, that is, the correlation in Eq. (6):
The meaning of f and k is that the wave component (f, k) is generated by the sum frequency or difference frequency of the waves (f1, k1) and (f2, k2). If f and k satisfy the linear dispersion relationship, resonance interaction occurs, accompanied by intense energy transfer.
To directly measure the degree of nonlinear phase coupling between the wave components, the dimensionless wavelet bispectrum, also called wavelet bicoherence, is expressed as:
The value of b(f1, f2) is between 0 and 1 and represents the coupling degree between any two frequencies f1 and f2 under the triad interaction. b = 1 denotes that the three wave components are completely correlated, that is, the energy of f is transmitted completely through the nonlinear interaction between f1 and f2. b = 0 indicates no interaction between the three wave components, and the wave with a frequency of f is completely randomly generated. The imaginary part of b(f1, f2) dominates the energy transfer. For example, a positive value of imaginary part indicates the energy will transfer from f1 and f2 to their sum frequency f1+ f2= f, while a negative value denotes energy transferred in an opposite direction. In addition, the absolute value of the imaginary part also indicates the degree of waveform asymmetry.
It is convenient to introduce the summed bicoherence b, which shows the distribution of nonlinear interaction intensity. To measure the distribution of phase coupling, the summed bicoherence b(f) is introduced as follows:
where l(f) is the number of frequencies, and b(f) denotes the nonlinear strength.
3 Results and discussion
3.1 Energy spectral analysis
3.1.1 Variation of the wave surface elevation and spectrum along the way
After propagating through the oyster reefs, part of the frequency of the incident waves is converted into locked waves and released as free waves, due to the complex three-dimensional structure of the oyster reefs and the height changes along the way. At the same time, affected by diffraction, the wave evolution process is complicated, and the energy of each frequency will change, which can be studied by spectral analysis. To investigate the influence of the oyster reefs on wave energy, the water depth D = 0.27 m, which are similar to the height d of the three-layer oyster reefs M1 (0.272 m), the incident wave height Hi = 0.043 m and the period T = 1 s are selected as the representative conditions to analyze the change of measured water surface elevations (η) before and after the oyster reefs, which are shown in Figure 5. As can be seen, after the wave propagates over the oyster reefs, the wave height decreases greatly (about 40%), indicating that part of wave energy is consumed during passing through the reef. At the same time, the secondary peaks and valleys are observed after the oyster reefs, and the wave surface shape became more irregular, indicating that part of the wave energy was converted from low frequency to high frequency, resulting in locked higher harmonics and free harmonics. This is consistent with the phenomenon observed by Beji and Battjes (1993), and Brossard et al. (2009) that waves propagate on submerged breakwaters.
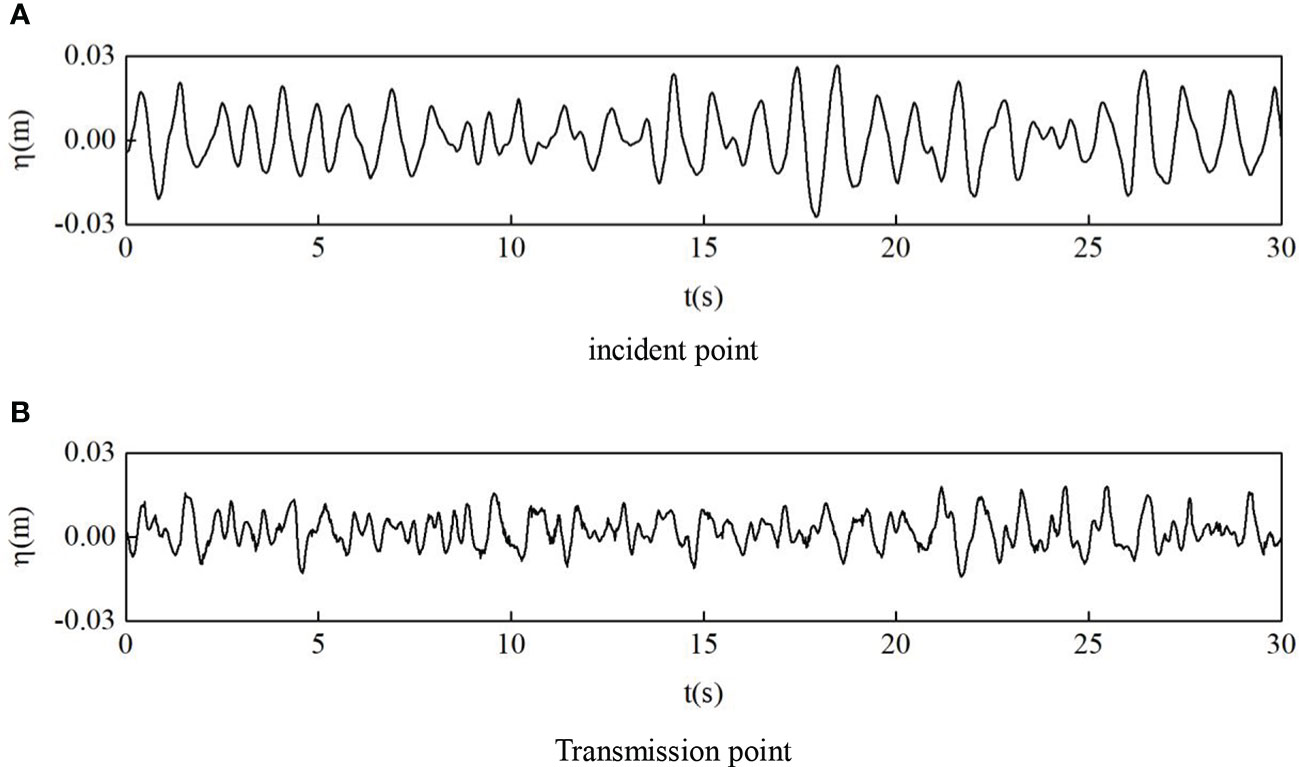
Figure 5 The measured water elevations (A) incident point (B) transmission point.
In the process of wave propagation, the fluctuation of water surface can be observed, but the composition of wave components and the distribution of energy are the main factors affecting the change of wave in the process of propagation. After passes through the oyster reefs, the energy of waves at each frequency will change, which can be studied by spectral analysis. The same condition as Figure 5 is selected to analyze the energy spectrum changes before and after the oyster reefs model, as shown in Figure 6.
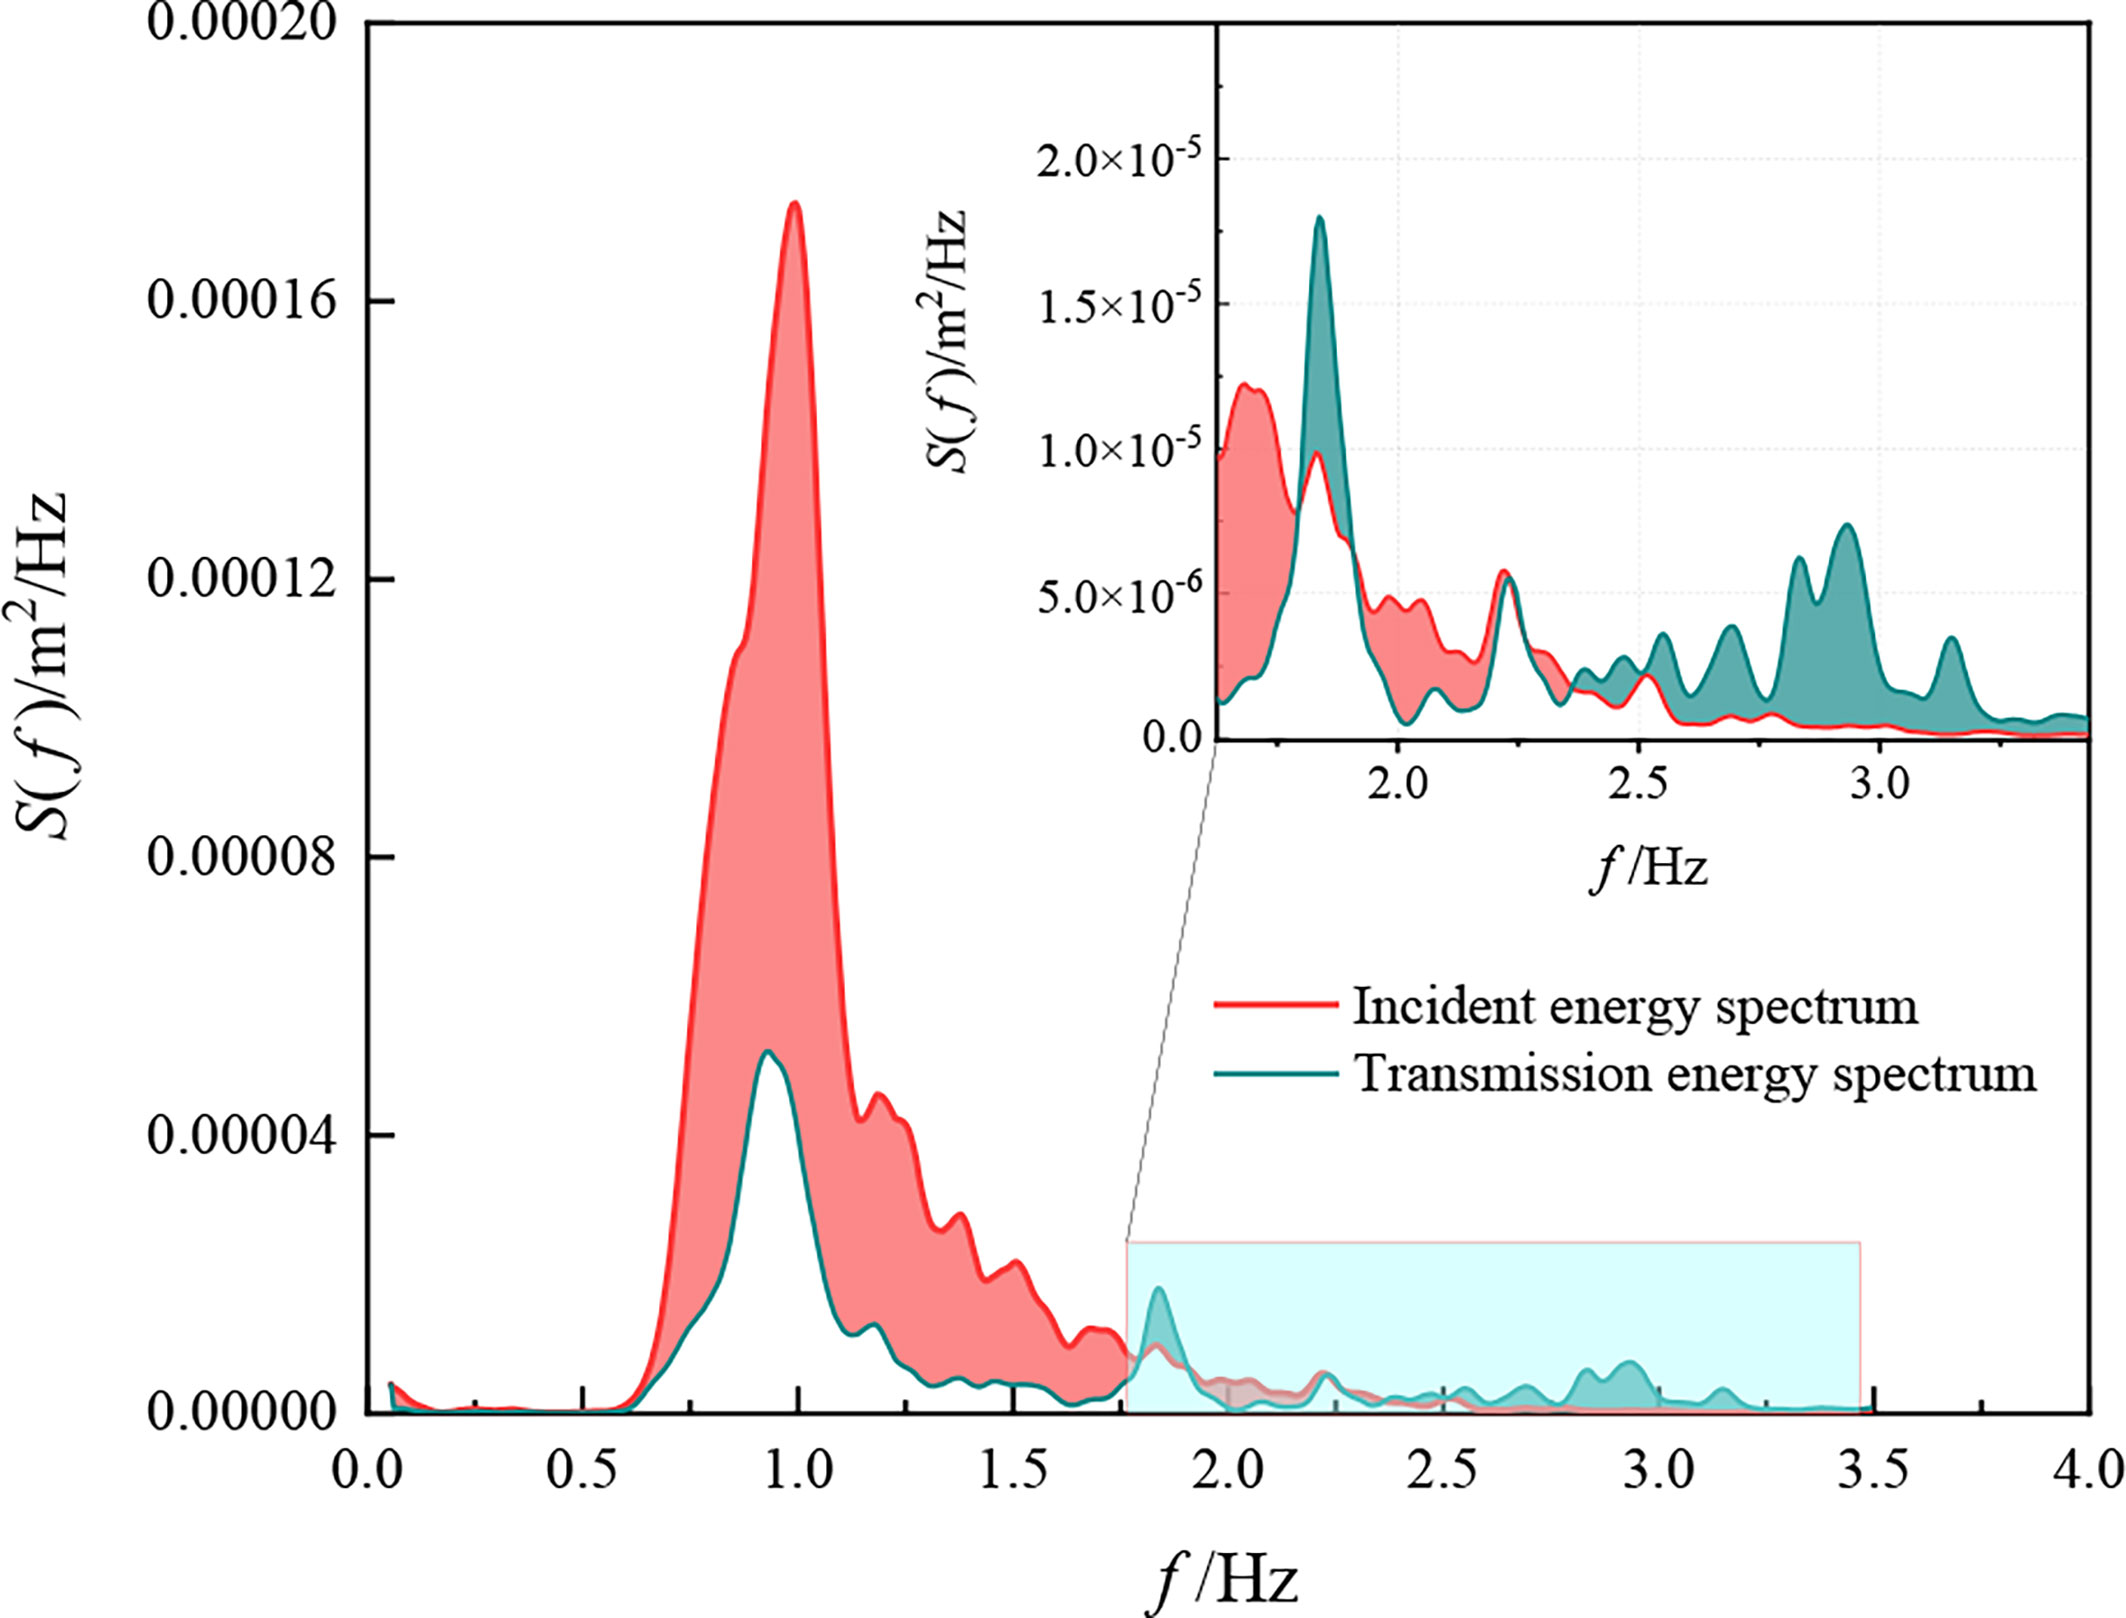
Figure 6 Comparison of incident and transmission spectra (M1, D = 0.27 m, Hi = 0.043 m, T = 1 s).
Figure 6 indicates that after the wave propagates through the oyster reefs, the energy transfer significantly from the primary to the higher harmonics because of the nonlinear interactions among wave components. In terms of spectrum shape, the incident spectrum is basically consistent with the theoretical spectral shape of the J spectrum, while the transmission spectrum shows three peaks, located at the primary, second and third harmonics. The energy in the E1 and E2 regions of the transmission spectrum is considerably lower than that of the incident spectrum, and the spectral peak energy is reduced by approximately 75%. In the high frequency region E3, the energy of transmitted wave near the secondary harmonic (2Hz) is substantially higher than that of the incident wave. There is basically no higher harmonics energy greater than 2.5Hz in the incident wave, while there is some higher harmonics energy in the transmitted wave. In the low frequency region E4, there is basically no energy in both the incident and transmitted waves, showing that the oyster reefs will not generate low frequency waves. In general, when the wave propagates through the oyster reefs, the energy of primary harmonic is greatly reduced and transfer to higher harmonics, resulting in the increase of higher harmonics energy, which is consistent with the conclusions of previous research on submerged breakwaters (Buccino and Calabrese, 2007).
Then, under the same water depth and incident wave height, the variation in the energy spectrum after the oyster reefs is analyzed, and the results are shown in Figure 7. As can be seen from the figure, when T = 1 s, the energy spectrum presents an obvious trimodal pattern, with the three peaks located at the primary harmonic (1Hz), the second harmonic (2Hz) and the third harmonic (3Hz) respectively. However, previous studies mostly observed the bimodal shape of the energy spectrum (Buccino and Calabrese, 2007). When T = 1.5 s, the spectrum shows a weak trimodal pattern, and the overall energy is considerably greater than T = 1 s.
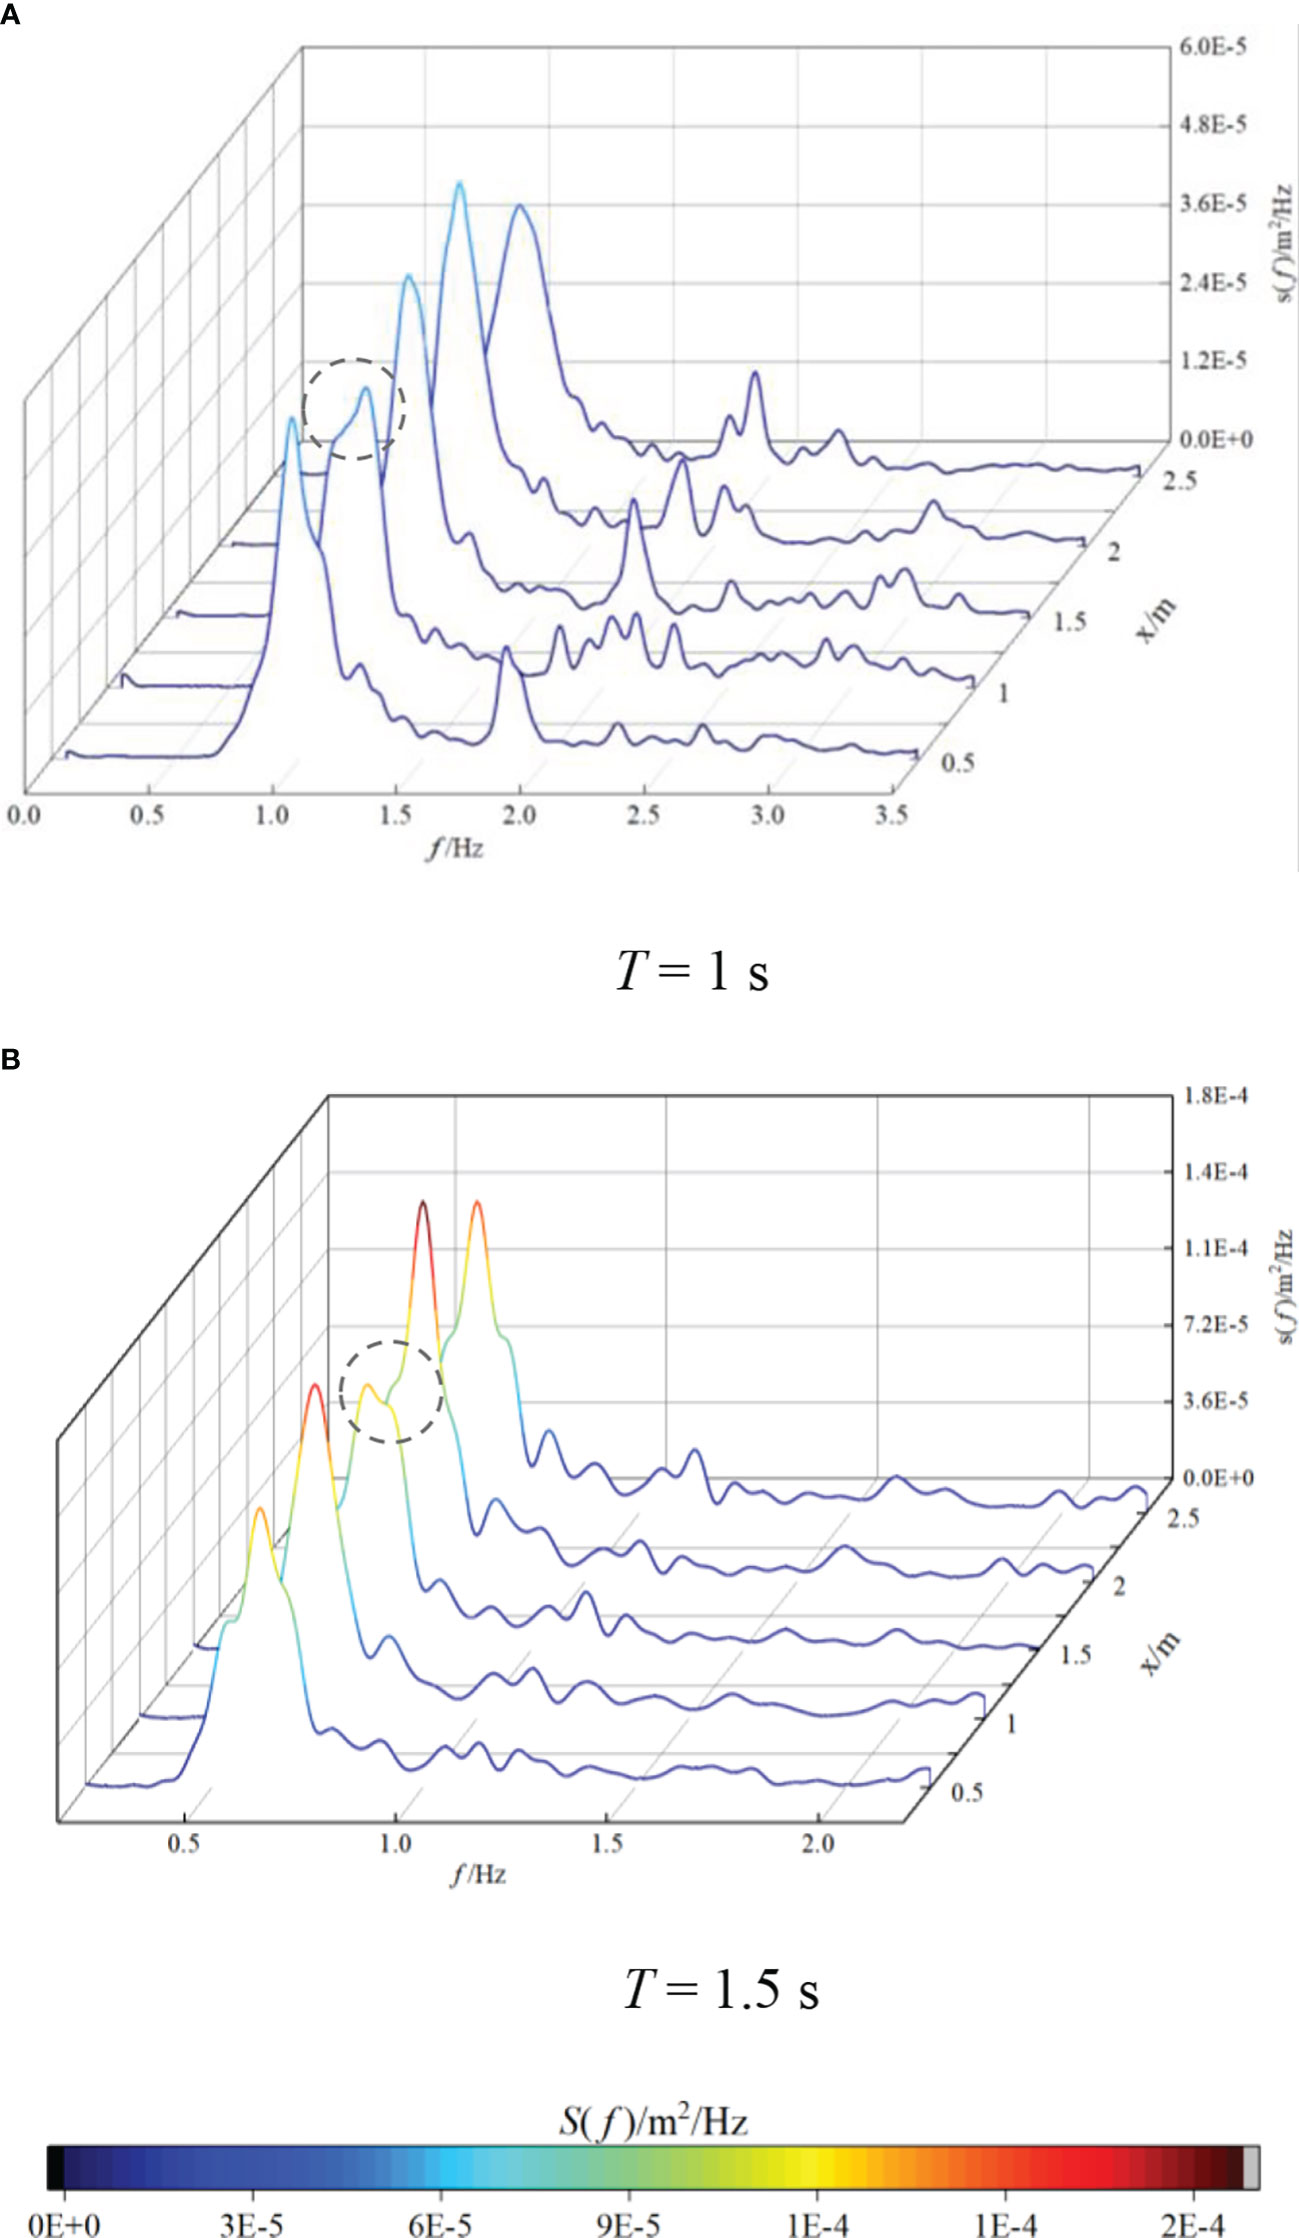
Figure 7 Comparison of wave energy spectra at different propagation distances (M1, D = 0.27 m, Hi = 0.043 m) (A) T = 1 s (B) T = 1.5 s.
With increasing distance x, the energy of the spectral peak region E1 changes greatly. When T = 1 s, the energy in E1 shows a law of decreasing, rising and then decreasing. When T = 1.5 s, the pattern is a rising, falling and then rising. The energy in the transfer region E2 and the high frequency region E3 is little fluctuation. When T = 1 s, the spectrum of high frequency region E3 presents more burrs compared to T = 1.5 s, indicating that the bound wave is converted into a free wave and then released is at a faster speed in the short-period wave, which is consistent with the research results from Chen et al. (2018).
In addition, at some positions, a unique phenomenon of energy loss may occur near the dominant frequency (in the dashed circle), which may due to the fact that the high-frequency waves are broken by the focusing effect after diffraction, and the gas is rapidly exchanged, resulting in turbulent dissipation. The location of wave focusing is affected by the period T. The smaller the period is, the closer the location is to the oyster reefs.
3.1.2 Influence of water depth on the wave energy spectrum
To investigate the influence of water depth D on the wave spectrum, the energy spectrum at x = 1.5 m after three-layer oyster reefs M1 is calculated under water depth D = 0.26 m – 0.32 m, incident wave height Hi = 0.043 m, and period T = 1 s. The results are shown in Figure 8.
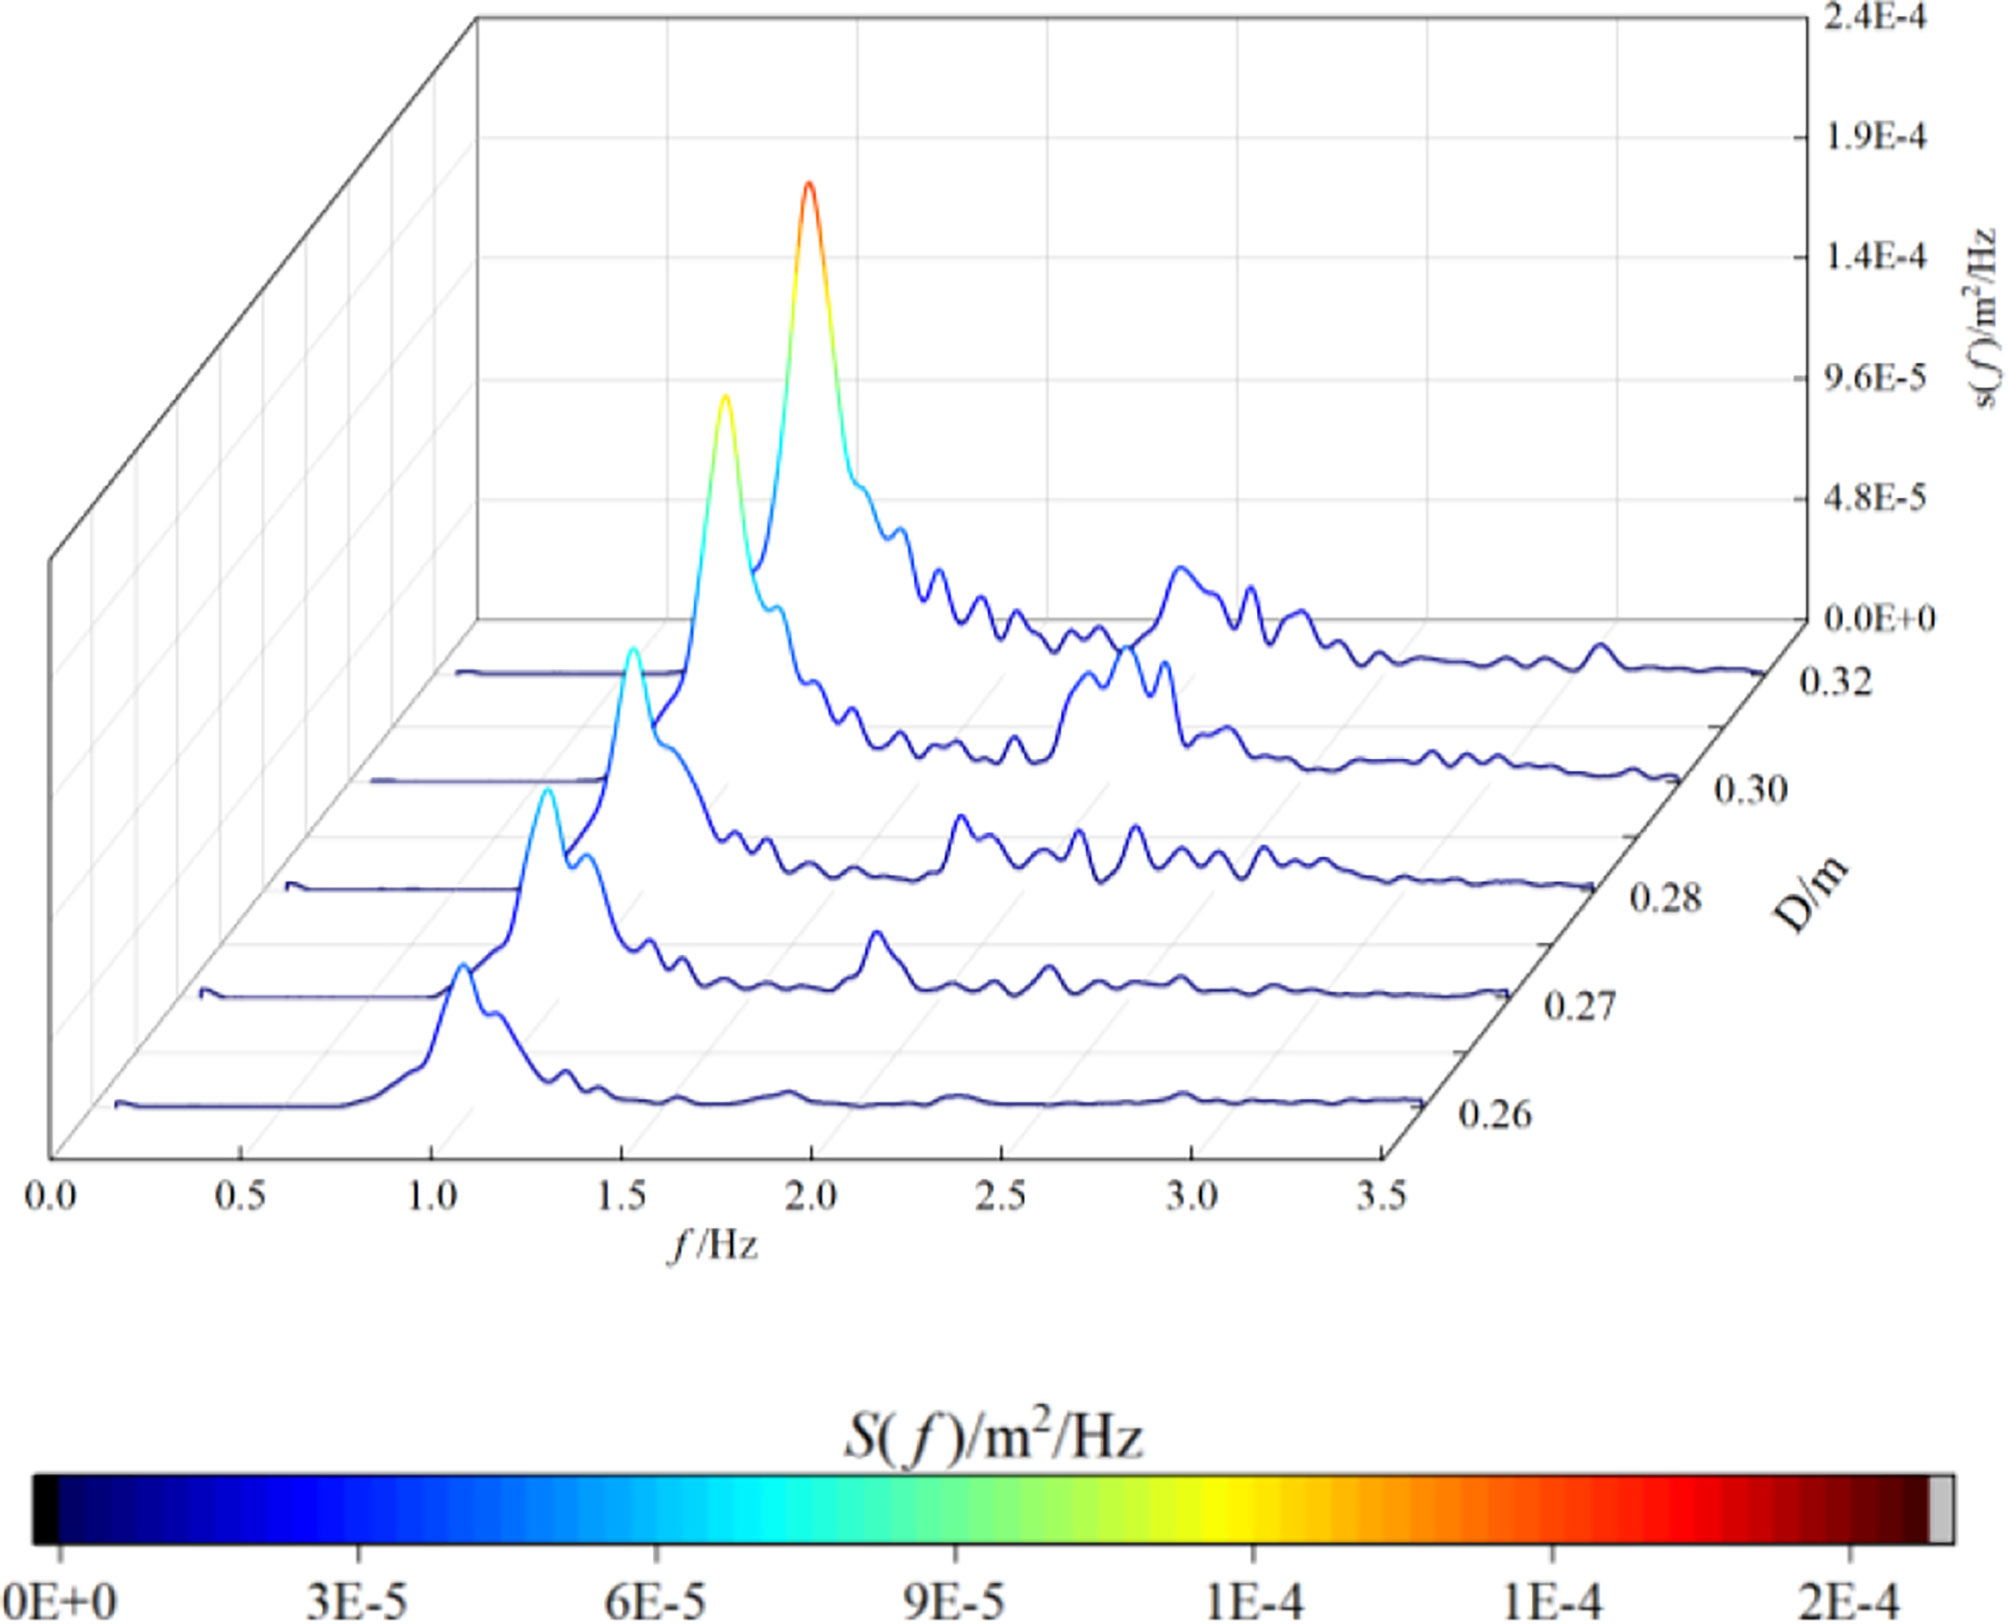
Figure 8 Comparison of wave energy spectra under different water depths (M1, Hi = 0.043 m, T = 1 s, x = 1.5 m).
As can be seen from the figure, with increasing water depth, the energy of different frequencies generally increases, especially in the primary and secondary harmonics. When the water depth is small (D = 0.26 m and D = 0.27 m), with the model non-submerged, a large number of locked waves cannot be released due to the reflection of the oyster reefs. Thus, no increase in energy is observed in the high frequency region E3. At large water depths (D > 0.27 m), the model is submerged, and more locked waves are released as free waves, showing an increase of energy in the high frequency region E3.
3.1.3 Influence of top width on wave energy spectrum
Because of the three-dimensional structure of the oyster reefs, the top width B may be an important factor affecting the distribution of wave height. To investigate the influence of the top width on nonlinearity, the relationship between the energy spectrum and relative top width B/d is analyzed under water depth D = 0.27 m, incident wave height Hi = 0.043 m, period T = 1 s, and x = 1.5 m behind the oyster reefs. The results are presented in Figure 9.

Figure 9 Comparison of the energy spectrum distribution under different top widths (D = 0.27 m, Hi = 0.043 m, T = 1 s, x = 1.5 m).
As can be shown from the figure, with increasing relative top width B/d, the energy of the frequency near the primary harmonic decreases, while the energy near the secondary harmonic increases. This is because when the top width increases, the length of the shoaling region increases, leading to a gradually increase of triad nonlinear interactions in the shoaling process. Some locked higher harmonics are continuously released, resulting in a considerable increase in high-frequency energy. When the relative top width up to 2.56 (M4), the energy of higher harmonic is obviously larger compared to the other two smaller top width (M2, M3).
Since the spectral peak region E1 concentrates the main energy of the waves, the total energy of the wave spectrum will be lower after propagating through the wider oyster reefs, indicating a better energy dissipation effect. Therefore, when the oyster reefs are arranged in the ecological restoration project, the wider oyster reefs should be used as much as possible to take into account the effect of wave dissipation.
3.2 Nonlinear analysis of the bispectrum based on the continuous wavelet transform
As discussed in the spectral analysis, the energy transfer in the nonlinear interactions among wave components can be clearly seen. Nevertheless, which part of the harmonics participated in the triad interactions is unclear. Furthermore, the intensity of coupling between wave components and the influencing factors are also worth discussing. Therefore, the triad interaction, to investigate where the energy comes from and what components it is transmitted to, is analyzed by the wavelet-based bicoherence method.
3.2.1 Viaration of wavelet-based bispectrum along the way
Figure 10 shows the calculation results of the bispectrum of the M1 (three-layer oyster reefs) model at the incident point and along x = 0.5 m, x = 1 m, and x = 2 m, under period T = 1.5 m, incident wave height Hi = 0.033 – 0.043 m and water depth D = 0.28 m. The interaction between different wave components can be clearly seen by the analysis of the bispectrum.
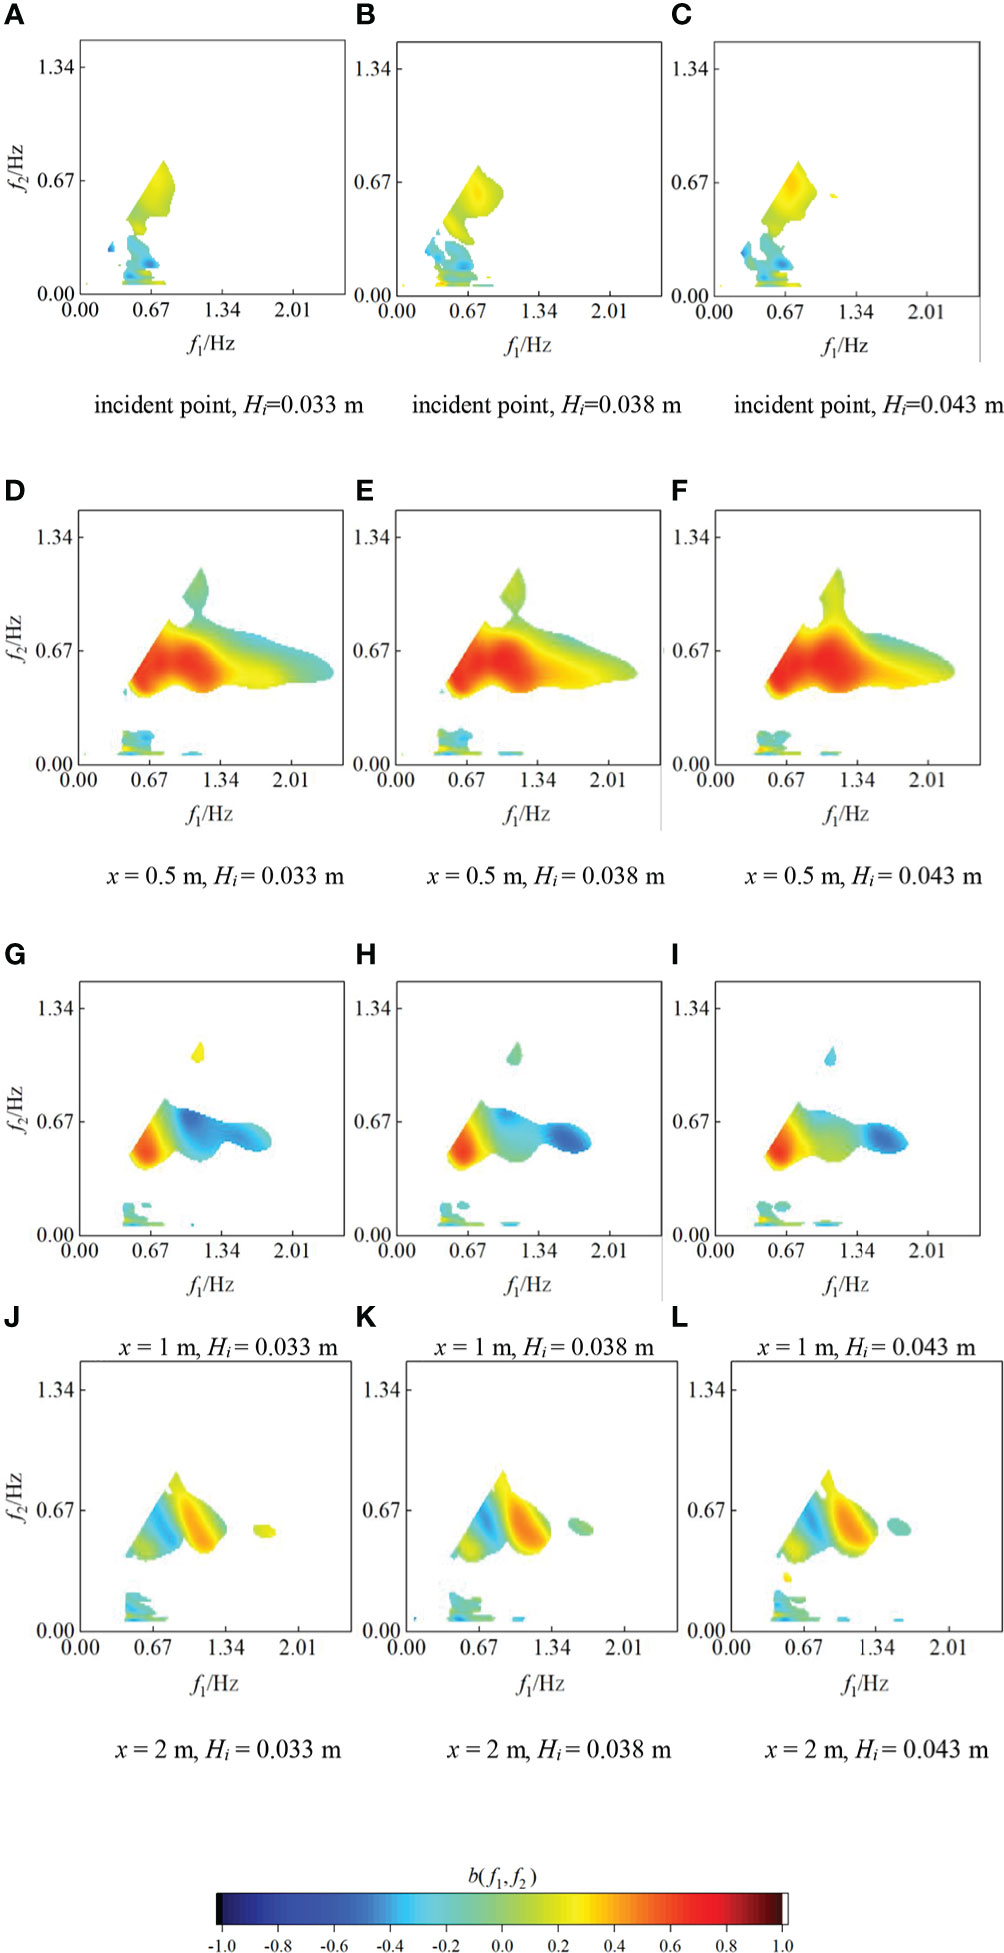
Figure 10 Changes in the wavelet-based bispectrum under different incident wave heights (M1, D = 0.28 m, T = 1.5 s) (A) incident point, Hi=0.033 m (B) incident point, Hi=0.038 m (C) incident point, Hi=0.043 m (D) x = 0.5 m, Hi = 0.033 m (E) x = 0.5 m, Hi = 0.038 m (F) x = 0.5 m, Hi = 0.043 m (G) x = 1 m, Hi = 0.033 m (H) x = 1 m, Hi = 0.038 m (I) x = 1 m, Hi= 0.043 m (J) x = 2 m, Hi = 0.033 m (K) x = 2 m, Hi = 0.038 m (L) x = 2 m, Hi= 0.043 m.
It can be seen from Figure 10 that both the incident wave height Hi and the distance x affect the bispectrum. As the Figures 10A–C show, at the incident point, the wave is not affected by the oyster reefs, only the primary wave (0.67Hz) and a few low frequency waves components participate in the weak interactions, and the phase coupling degree at this position is almost identical at different wave heights.
According to Figures 10D-F, at x = 0.5 m, a large number of bound harmonics are released at this point, the components involved in the nonlinear interactions are the most, and the coupling degree is the largest near the primary harmonic. As the incident wave height Hi increases from 0.033 m to 0.043 m, the value of bicoherence between the primary harmonics b(0.67, 0.67) increases from 0.65 to 0.68, and b(1.34, 0.67) between the primary and secondary harmonics increases from 0.63 to 0.66. It follows that the coupling intensity of the triad interactions keeps increasing with a slight magnitude. The value of b(0.67, 0.67) and b(1.34, 0.67) are both high, indicating that the increase in the higher harmonics of 2fp and 3fp (fp is the frequency of spectral peak) results from the self-coupling of primary harmonics and the phase coupling between the primary and secondary harmonics, respectively, which is consistent with the findings of Elgar and Guza (1985). The oyster reefs have a substantial effect on primary harmonic (0.67Hz) of the wave, the energy of which transfer to the higher harmonics through the triad interactions. Therefore, after propagating through the oyster reefs, the energy of primary harmonic reduces significantly, while the energy of second and third harmonics increases, which corresponds to the trimodal pattern of the transmitted wave spectrum in Figure 6.
According to Figures 10 G–I, at x = 1 m, the number of frequencies participating in nonlinear interactions decreases, and the coupling degrees of the primary and secondary harmonics are both large. The value of bicoherence b(0.67, 0.67) = 0.41, b(1.34, 0.67) = -0.37, which is greatly weakened compared with the value at x = 0.5 m. As shown, with increasing distance, the coupling degree between different frequencies is weakened, that is, the intensity of the triad interactions decreases. The coupling value of the high-frequency changes from positive to negative, which means that energy transfer in an opposite direction, that is, energy transferred from the high frequency to the low frequency waves. At this position, not only is the low frequency energy transferred to the high frequency but also vice versa, and the energy transfer between the high and low frequencies is relatively balanced. Therefore, the overall variation in the energy spectrum is not great, as shown in Figure 7.
According to Figures 10J-L, at x = 2 m, the frequency with the strongest nonlinear interactions is transferred to the secondary harmonic. The value of bicoherence b(0.67, 0.67) = -0.16, b(1.34, 0.67) = 0.31. With increasing distance x, the coupling degree of the primary harmonics decreases continuously, becoming negative and approaching 0 when x = 2 m. This result indicates that when the wave propagates for a long distance (x > 2 m), the triad interactions basically no longer occur in the primary harmonic, and only a small part of the secondary harmonic energy transfer to higher harmonics, so the energy spectrum basically no longer changes.
The above analysis shows that the area with the strongest nonlinear interaction is near oyster reefs (x = 0.5 m). As the distance increases, less wave modes involved in the nonlinear interaction, and the coupling intensity decreases accordingly. After x = 2 m, the triad coupling weakens to a minor degree, and the energy spectrum basically does not change. This result further indicates that it is a gradual evolution process for bound higher harmonics releasing into free waves, which is also consistent with previous conclusions of Dong et al. (2009).
To intuitively show the nonlinear interactions intensity of wave components at different frequencies, the summed bicoherence b under the same conditions is further provided. The results are shown in Figure 11.
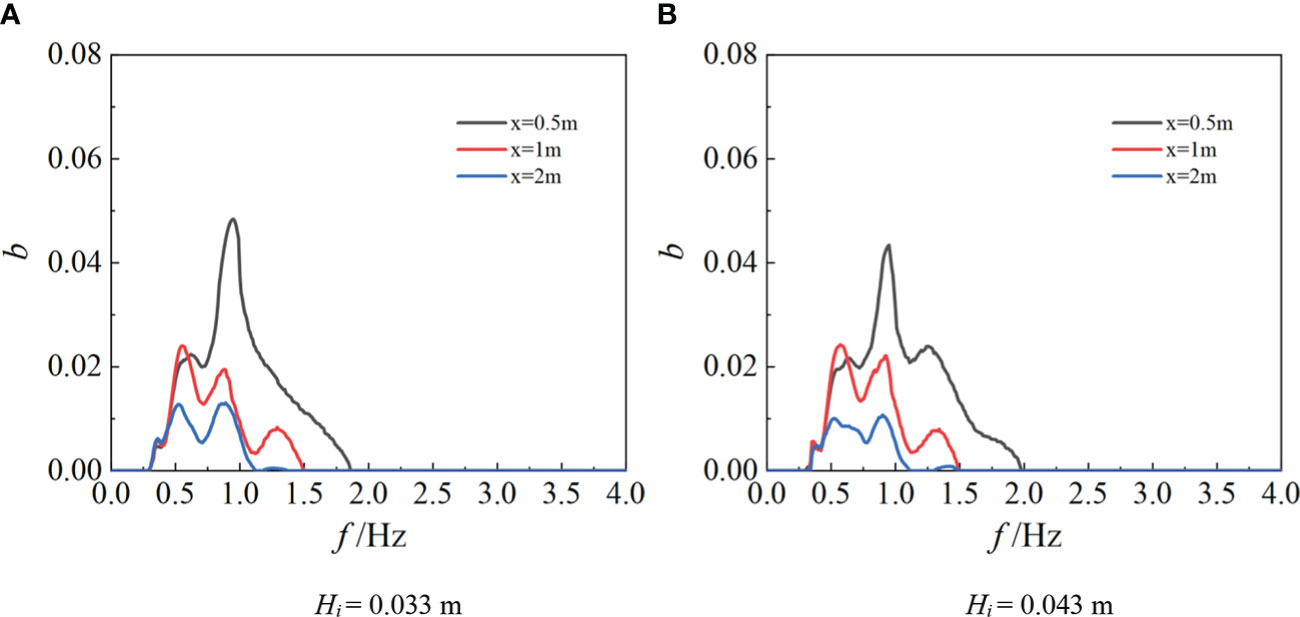
Figure 11 Comparison of summed bicoherence along the way (M1, D = 0.28 m, T = 1.5 s) (A) Hi= 0.033 m (B) Hi= 0.043 m.
It can be clearly demonstrated that with increasing distance, the summed bicoherence at each frequency decreases continuously, which suggests that the nonlinear interaction between different frequencies gradually weakens. The nonlinear phase couple at high frequency near the model (x = 0.5 m) is strongest, which proves the previous conclusion that the oyster reefs cause the energy transfer from the primary to higher harmonics. The energy transfer between high and low frequencies is basically balanced far from oyster reefs (x = 2 m), which is consistent with the results mentioned above. Comparing the values of summed bicoherence corresponding to different Hi in Figures 10A, B, the summed bicoherence of different incident wave heights shows basically the same change, indicating that the incident wave height has little effect on the nonlinear intensity.
It has been noted that the oyster reefs mainly affect the wave energy of the primary harmonic. Under the triad nonlinear interactions, the energy dissipation may increase in the process of energy transfer from the primary to higher harmonics, which may explain the mechanism of wave dissipation in oyster reefs to a certain extent, that is, wave energy is dissipated by the energy transfer between different frequencies.
3.2.2 Influence of water depth on the nonlinear interaction
To investigate the influence of the oyster reefs on wave nonlinear interaction under different water depths, the wavelet-based bispectrum at positions of x = 0.5 m and 1 m is given under period T = 1.5 s, incident wave height Hi = 0.043 m, and water depths D = 0.26 m, 0.28 m and 0.3 m, as shown in Figure 12.
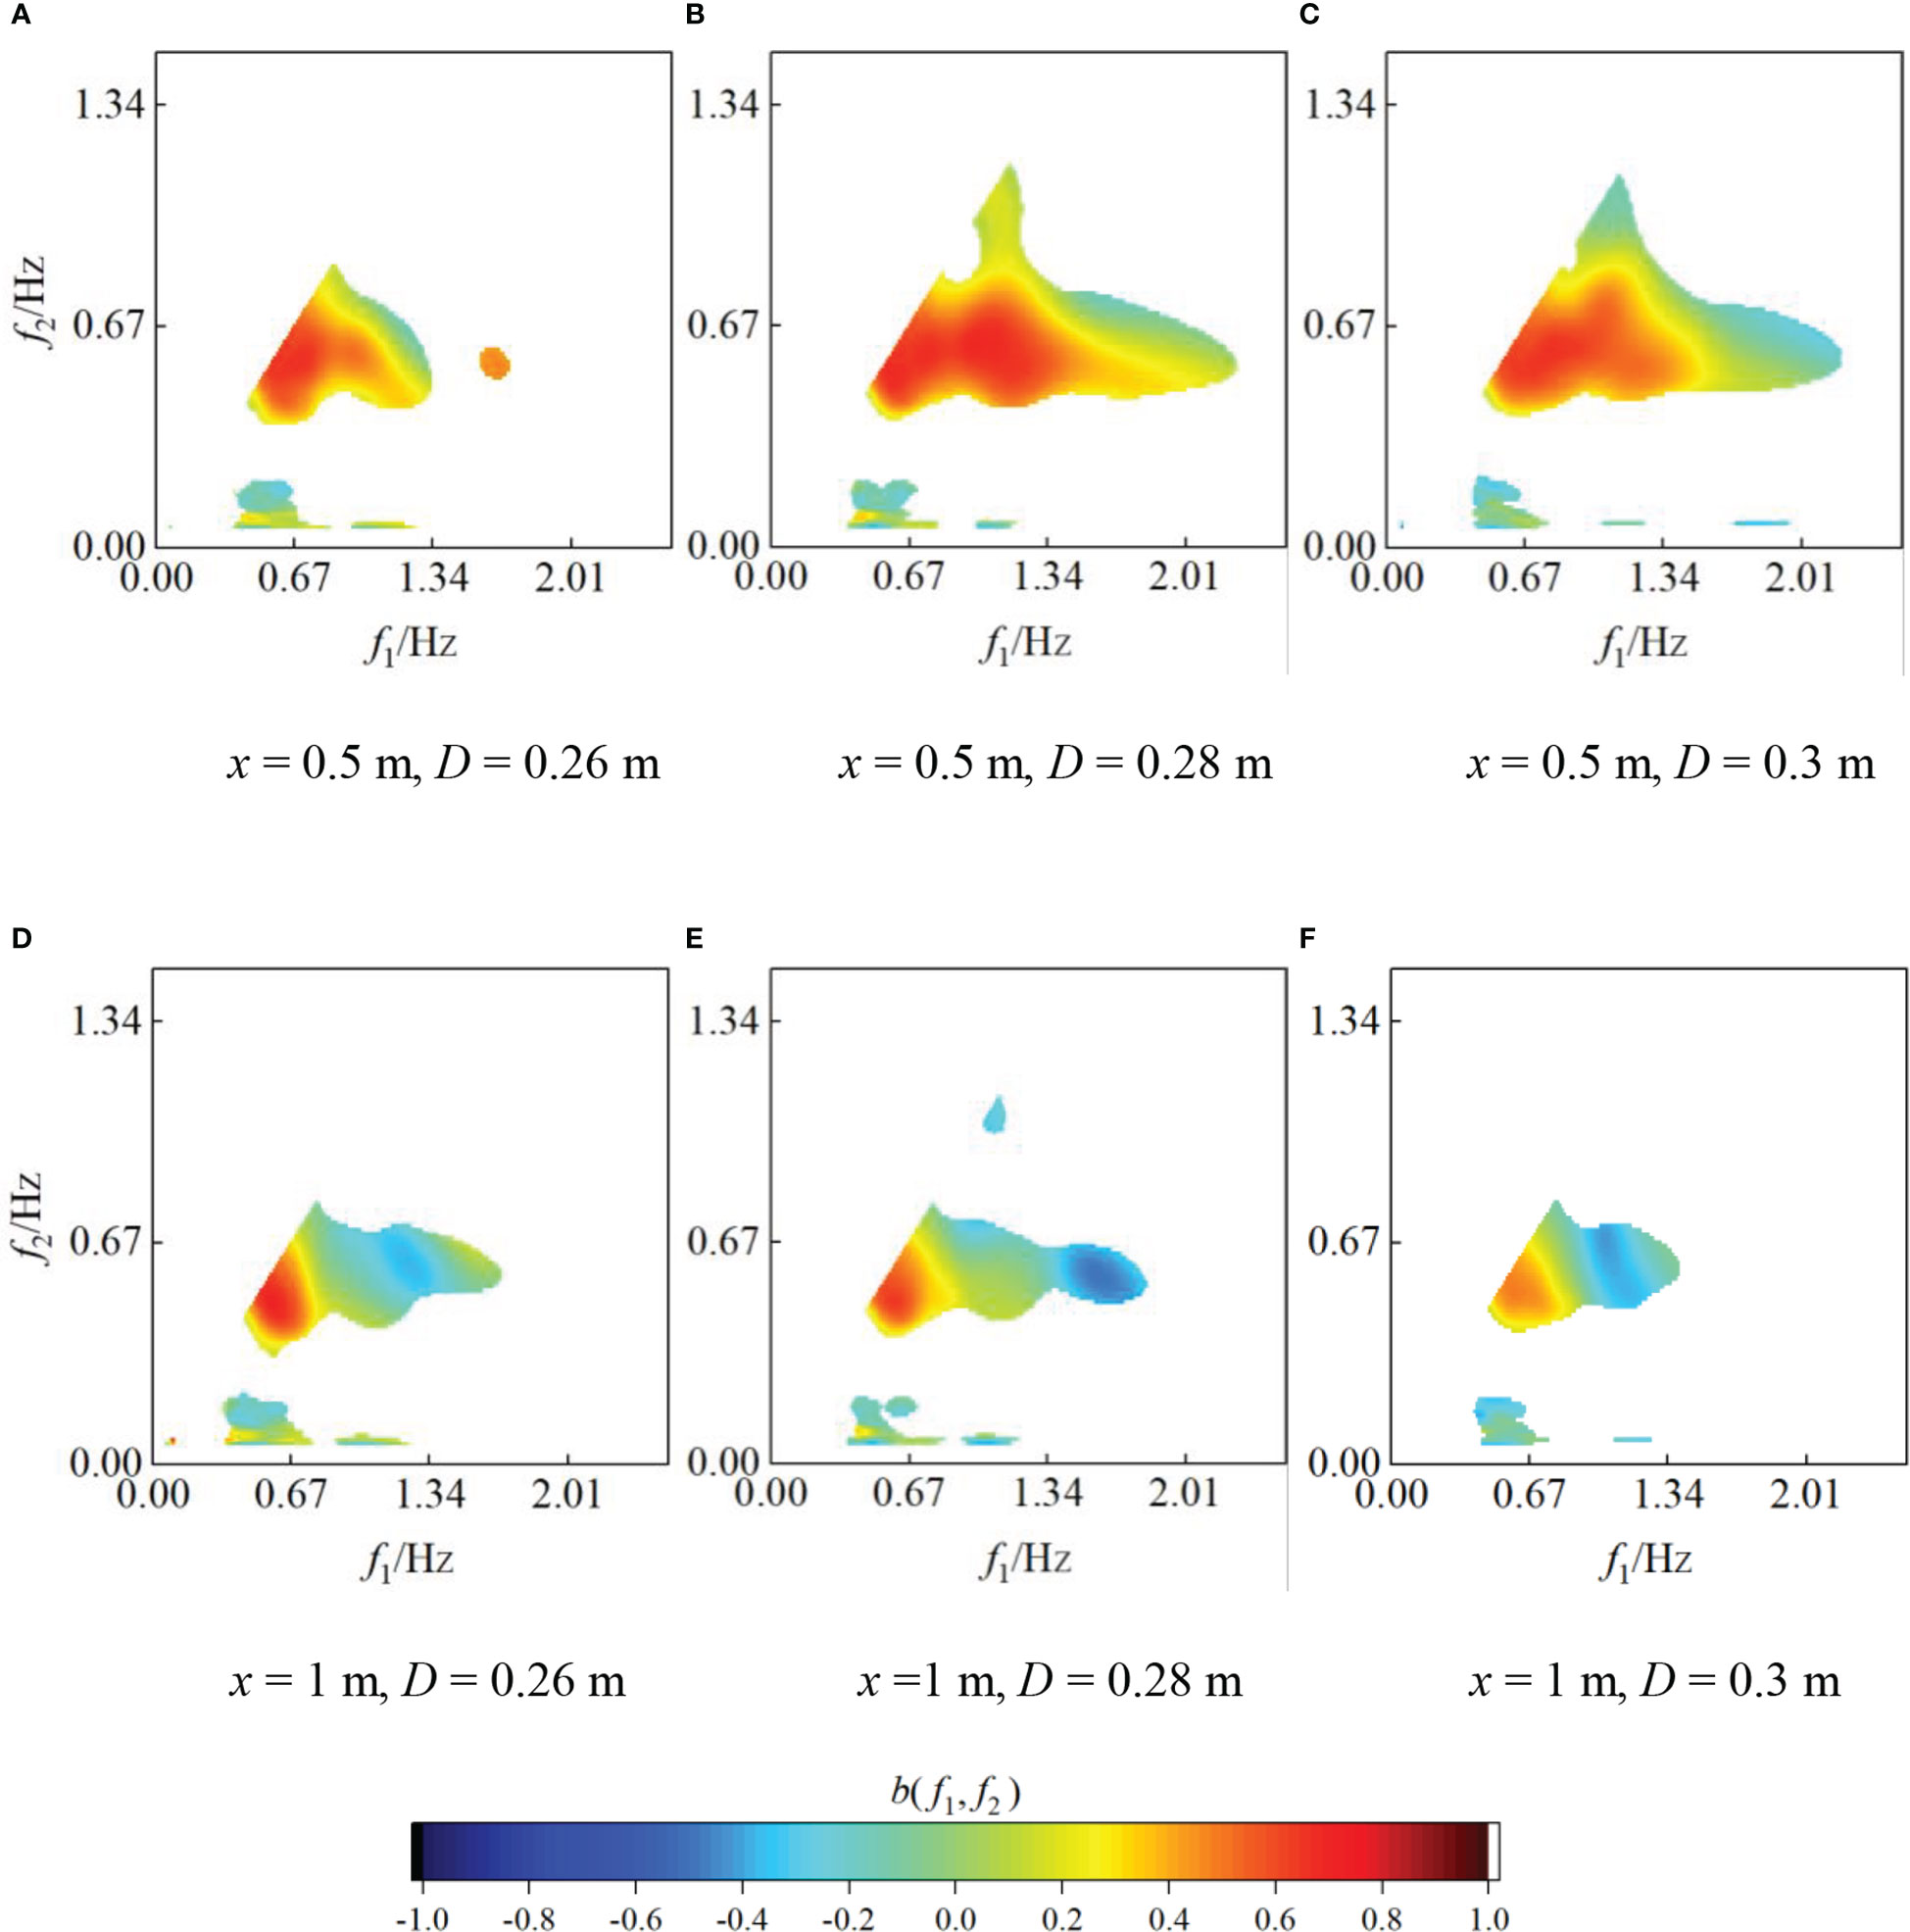
Figure 12 Changes in the wavelet-based bispectrum under different water depths (M1, Hi = 0.043 m, T = 1.5 s) (A) x = 0.5 m, D = 0.26 m (B) x = 0.5 m, D = 0.28 m (C) x = 0.5 m, D = 0.3 m (D) x = 1 m, D = 0.26 m (E) x =1 m, D = 0.28 m (F) x = 1 m, D = 0.3 m.
From Figure 12, as the water depth D increases from 0.26 m to 0.3 m, the model switches from emerged to submerged, and the bispectrum at different positions changes significantly. The number of wave modes involved in the coupling process increases first and then decreases. The coupling intensity between the frequencies generally decreases.
At x = 0.5 m, near the oyster reefs, a large number of frequencies involved in the triad interactions with strong couplings. The value of bicoherence of the primary harmonics b(0.67, 0.67) decreases gradually with increasing water depth D. For example, when D = 0.26 m, 0.28 m and 0.3 m, b(0.67, 0.67) is 0.66, 0.64 and 0.51 respectively, indicating that the nonlinear intensity between the primary harmonics decreases with increasing water depth. When D = 0.26 m, the number of frequencies involved in the nonlinear interactions is substantially lower than that at other water depths. This is because the bound waves cannot be released by the reflection of the oyster reefs, resulting in a low energy of secondary harmonic, which is consistent with the results of the energy spectrum in Figure 8.
At x = 1 m, b(0.67, 0.67) is 0.58, 0.47, and 0.35 with increasing water depth, and the coupling degree also decreases gradually. The coupling value at high frequency changes from -0.17 to -0.4, showing an energy transfer in the opposite direction.
Notably, with increasing water depth, the oyster reefs changing from nonsubmerged to submerged, the degree of phase coupling between the primary harmonics and between the primary and secondary harmonics decreases, which means the energy transferred between different frequencies decreases. As a result, the energy of both primary and the secondary harmonics increase with increasing water depth, as exhibited in Figure 8. Therefore, in coastal ecological restoration projects, to reduce the wave energy, oyster reefs could be designed as nonsubmerged.
The influence of water depth on the summed bicoherence b is further studied, as shown in Figure 13. According to the Figure, with increasing water depth, the value of summed bicoherence first increases and then decreases, reaching a maximum at D = 0.28 m. At the distance of x = 0.5 m, more locked waves are released in the nonsubmerged (D > 0.27 m) oyster reefs, so frequency mode related to the strongest nonlinear phase couple shifts to higher frequencies. At x = 1 m, the summed bicoherence of the primary frequency is essentially unchanged. When D = 0.28 m, the value of summed bicoherence near the secondary harmonic is the highest, which is due to the large intensity of the energy reverse transmission.
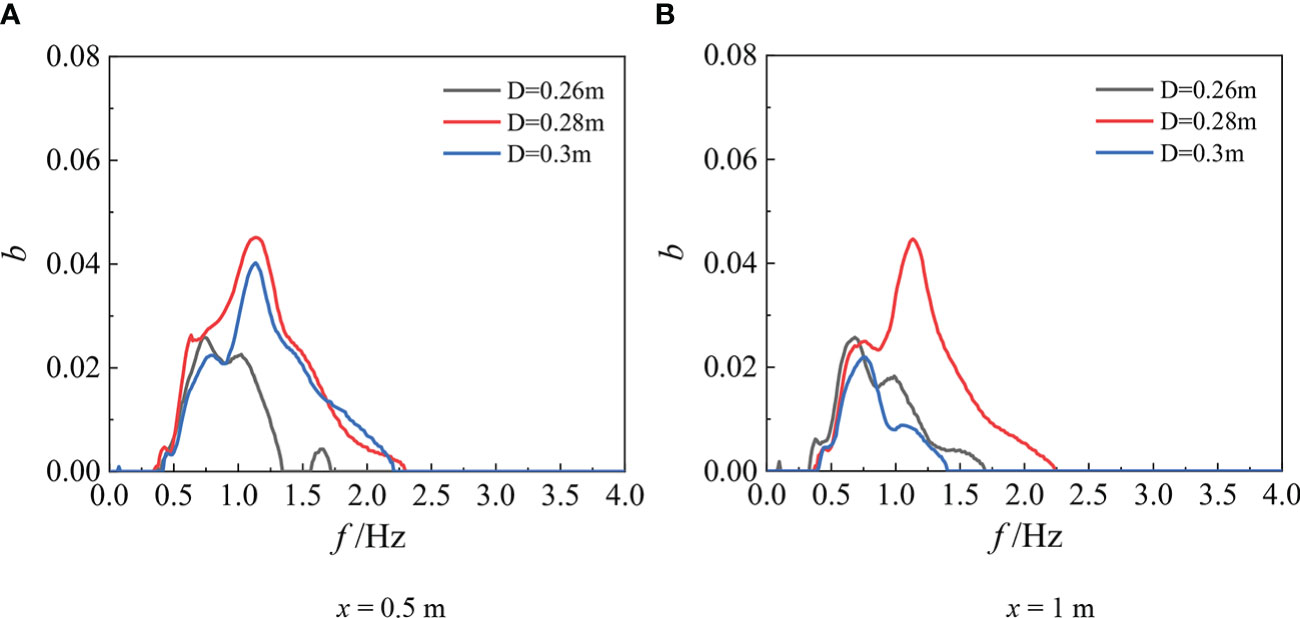
Figure 13 Comparison of summed bicoherence under different water depths (M1, Hi= 0.043 m, T = 1.5 s) (A) x = 0.5 m (B) x = 1 m.
3.3.3 Influence of top width on the nonlinear interaction
As described in Section 3.1.3, the top width impacts greatly on the energy spectrum. To further investigate the energy transfer characteristics under different top widths, the wave bispectrum of M2-M4 models at x = 0.5 m is analyzed. The results are presented in Figure 14. It can be seen that the relative top width B/d has a great influence on the bispectrum at the primary and secondary harmonics, and the influence differs between periods.
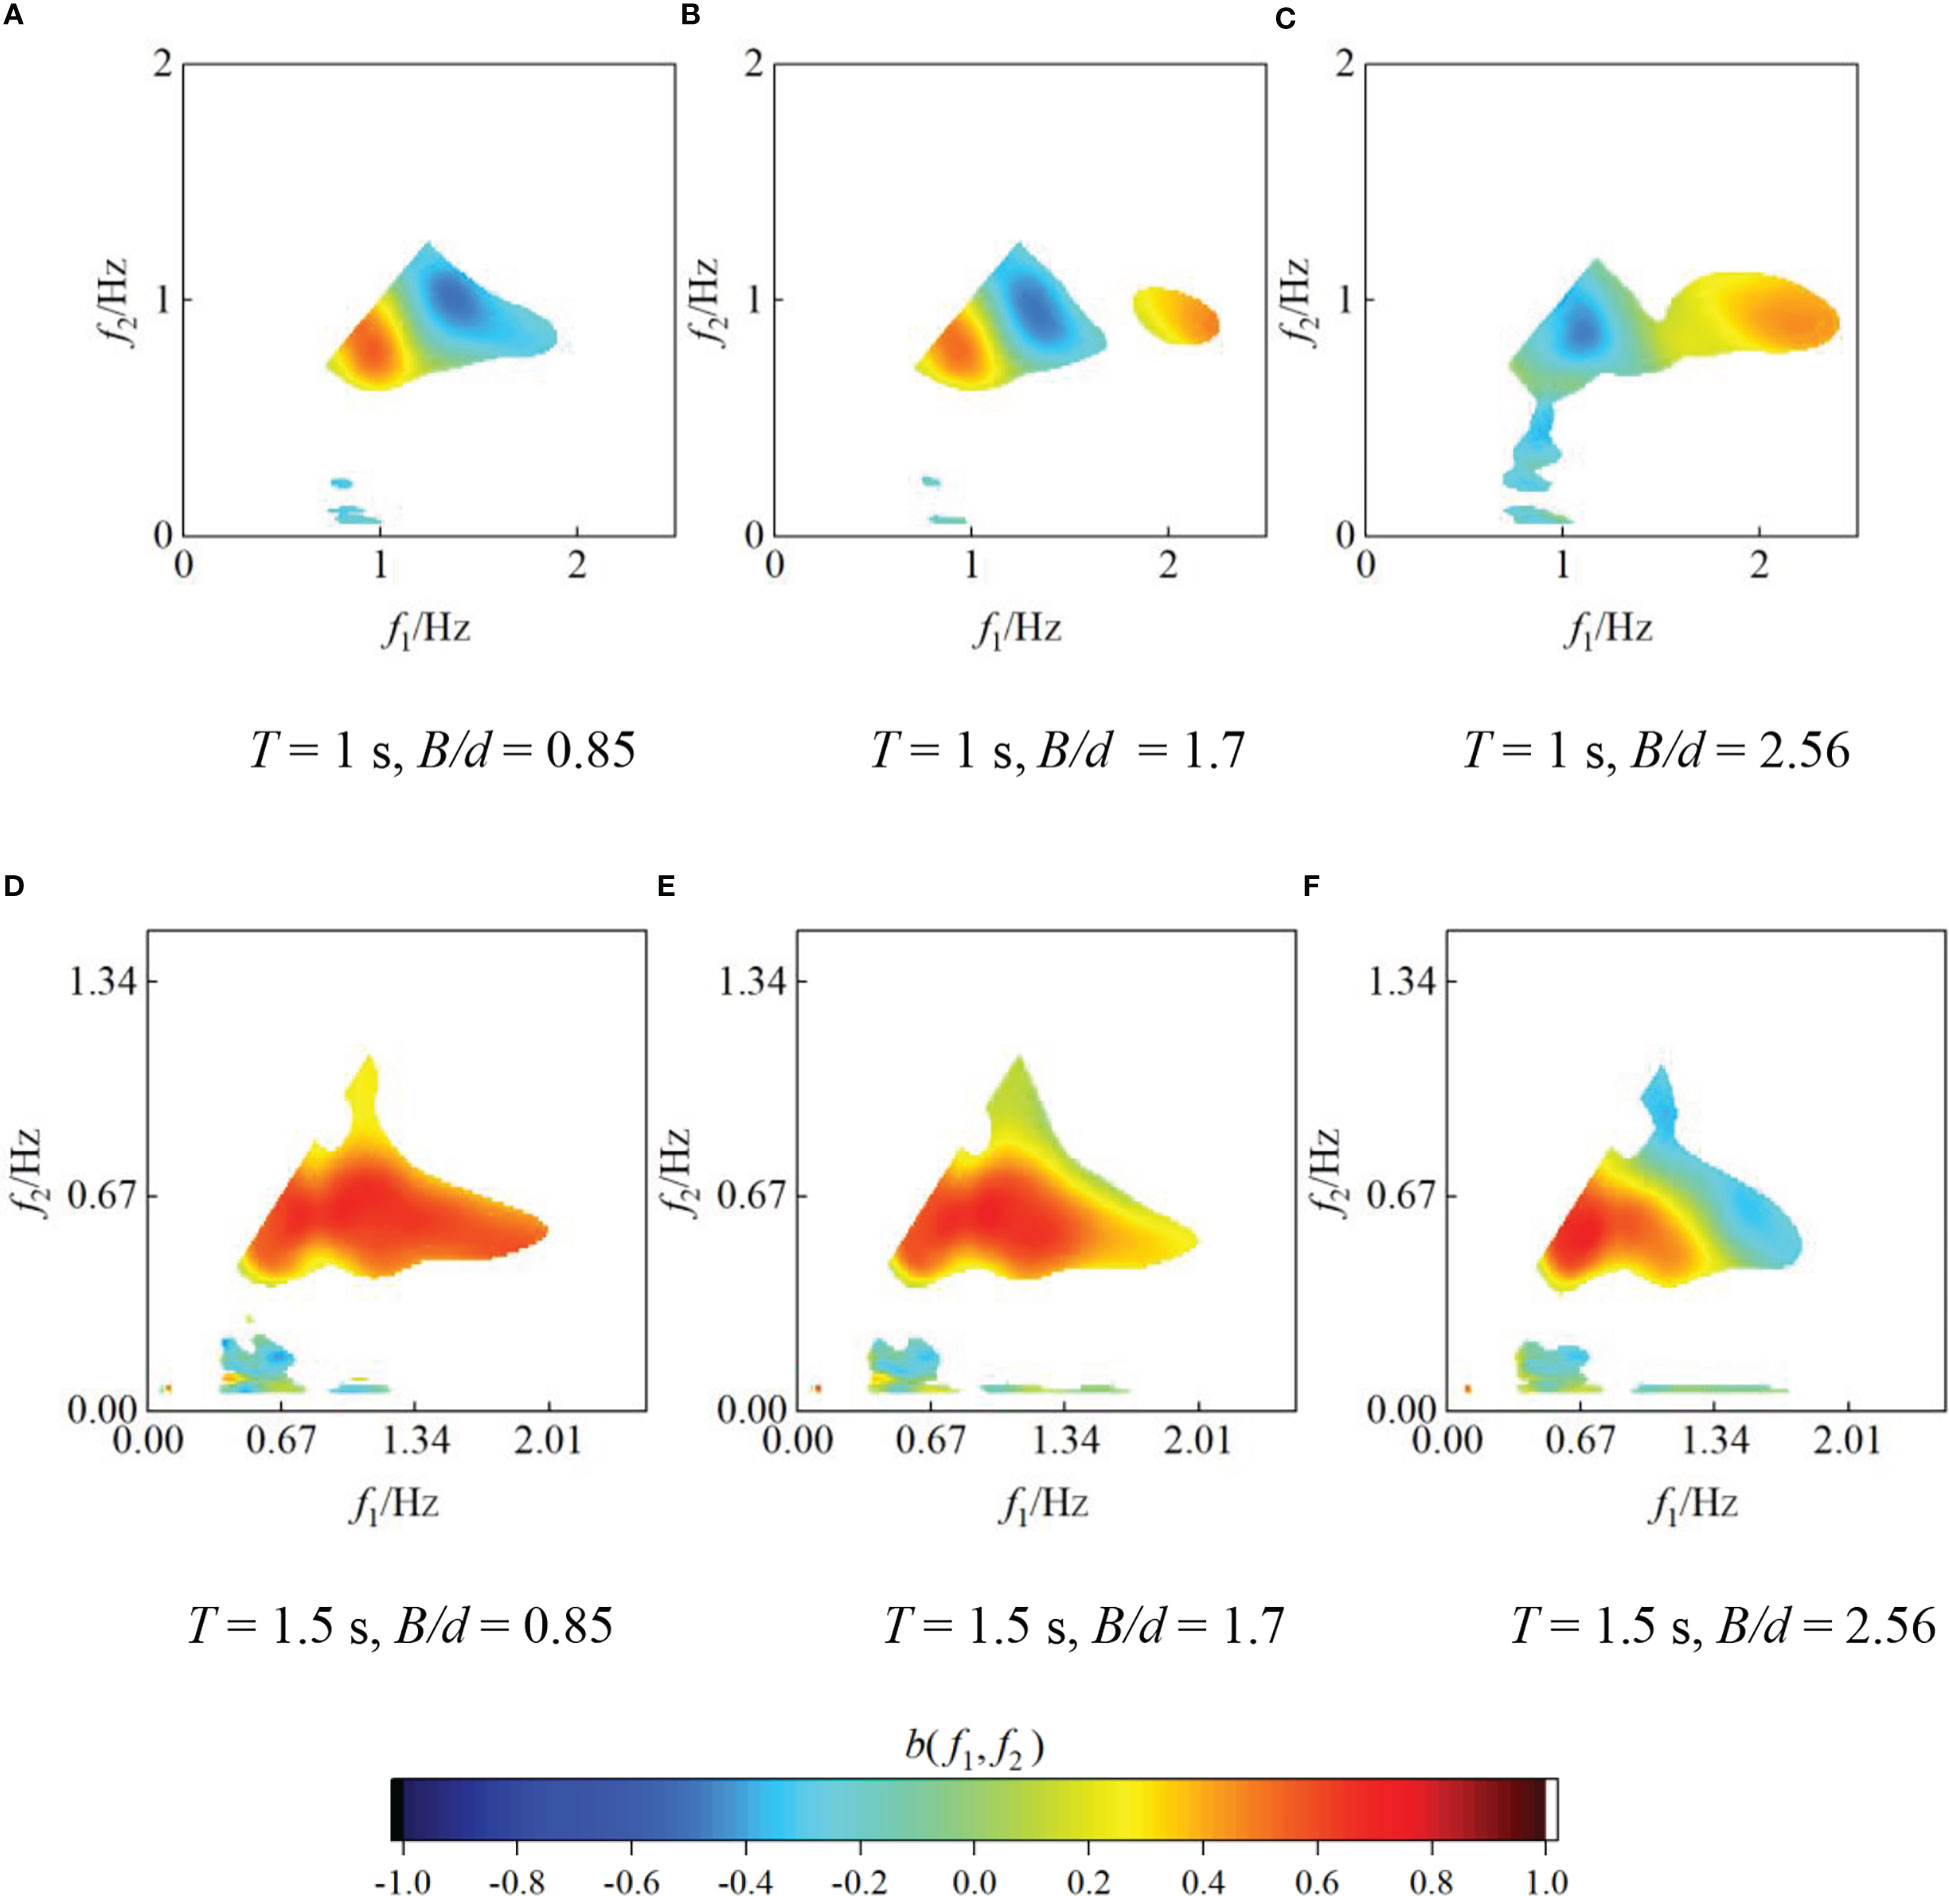
Figure 14 Wavelet-based bispectrum variation under different top widths (Hi = 0.043m, D = 0.27m, x = 0.5m) (A) T = 1 s, B/d = 0.85 (B) T = 1 s, B/d = 1.7 (C) T = 1 s, B/d = 2.56 (D) T = 1.5 s, B/d = 0.85 (E) T = 1.5 s, B/d = 1.7 (F) T = 1.5 s, B/d = 2.56.
At T = 1 s, with increasing the top width, the wave components participating in the nonlinear interactions increase, and the coupling intensity between the primary harmonics decreases. Energy transfer in the opposite direction near the frequency of 1.5Hz and the coupling intensity decreases continuously, while the coupling value at 2Hz is positive and continuously strengthens. This is because as the top width increases, the times of the water shallowing and reverse-shallowing increases, the free wave is relocked and then rereleased to a higher frequency. As the energy locked lower than the energy released to high-frequency waves, the energy of high frequency (2Hz) increases.
At T = 1.5 s, with increasing top width, the wave modes involved in phase coupling process decrease. The coupling intensity between the primary harmonics is basically unchanged, while the intensity of the higher harmonics is weakened and becomes negative. For example, when B/d = 2.56, b(1.34, 0.67) = -0.21. The phenomenon being different from that when T = 1 s is because when the period is longer, that is, the wave steepness is smaller, the free wave releases at a slower speed, and the energy locked is higher than the energy released into the free wave of high-frequency. Therefore, with increasing top width, almost all the free waves released are relocked by the oyster reefs, which means that the energy transferred to the secondary harmonic is returned back to the primary harmonic, resulting in almost no change in the coupling intensity of the primary harmonics.
Figure 15 shows the influence of the top width on the summed bicoherence variation under different periods. When T = 1 s, with increasing top width, the value of b at the primary frequency decreases and the peak shifts to the primary frequency, while the b between 1.5Hz and 2Hz increases gradually. When T = 1.5 s and B/d< 1.7, the b of the dominant frequency almost constant, and the peak appears at 1.5Hz, and the peak value decreases by approximately 60% as B/d increases from 1.7 to 2.56. Notably, the decrease of b is caused by free waves locked rather than the energy reverse transmission.
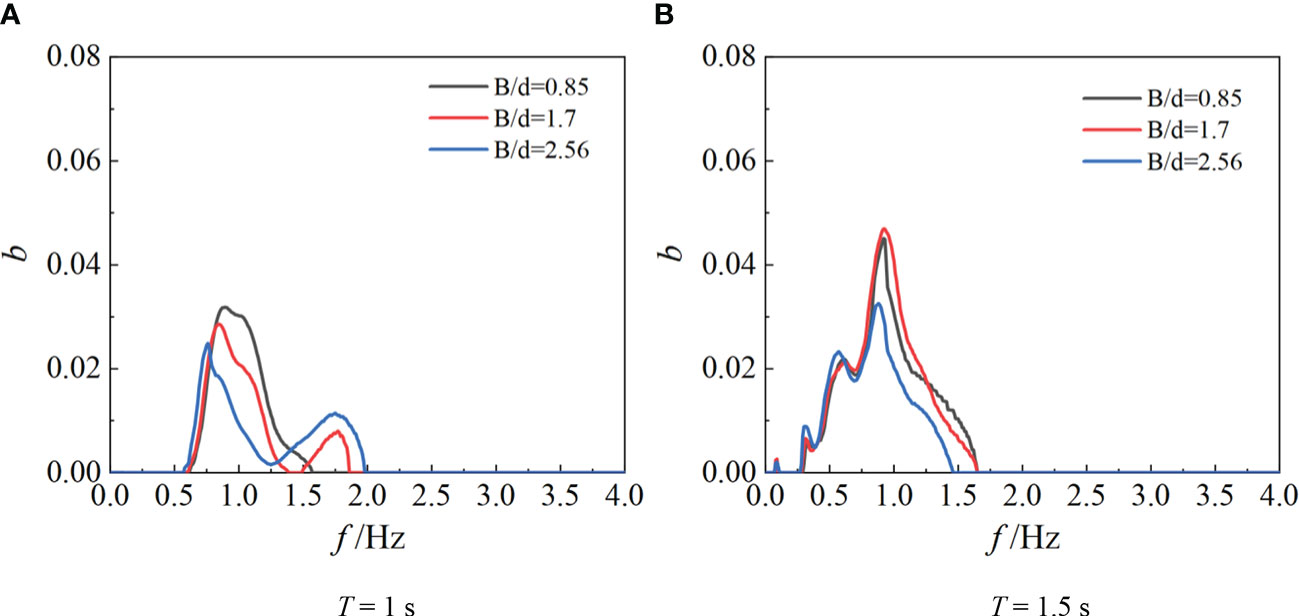
Figure 15 Comparison of summed bicoherence under different top widths (Hi = 0.043 m, D = 0.27 m, x = 0.5 m) (A) T = 1 s (B) T = 1.5 s.
4 Discussion
In addition, at some positions, a unique phenomenon of energy loss may occur near the dominant frequency (in the dashed circle of Figure 7), which may due to the fact that the high-frequency waves are broken by the focusing effect after diffraction, and the gas is rapidly exchanged, resulting in turbulent dissipation. The location of wave focusing is affected by the period T. The smaller the period is, the closer the location is to the oyster reefs.
After the oyster reefs, the primary harmonic energy generally presents a process of decreasing, and the smaller the water depth and the larger the top width, the greater the reduction of the primary harmonic energy. The high frequency energy shows an increases trend after the oyster reefs, and the smaller the water depth and the larger the top width, the smaller the increase of the high frequency energy. It can be seen that the wave dissipation effect of oyster reefs is partly due to friction dissipation, which reduces the primary harmonic energy behind the reefs rapidly. The other part is due to the attenuation of wave energy accelerated by the conversion of wave energy from low frequency component to high frequency component, which is consistent with the conclusion of submerged breakwaters (Chen et al., 2010).
Since the primary frequency E1 region concentrates the main energy of the wave, according to the experiment results, the total energy of the wave spectrum will be lower after passing through the oyster reefs with smaller water depth and larger top width, indicating a better energy dissipation effect. Therefore, in the ecological restoration project, to reduce the wave energy, oyster reefs are recommended to be designed as nonsubmerged, and the wider oyster reef should be used. However, it is also noted that the influence of top width on energy is much smaller than that of water depth, which confirms the previous view that the relative submerged depth is the most important parameter affecting the wave transmission coefficient of the submerged breakwaters (Seabrook and Hall, 1998). In engineering practice, increasing the top width of oyster reefs will increase the project cost. Therefore, the relationship between wave dissipation effect and economic investment should be considered comprehensively to design the appropriate top width.
The imaginary part of bispectrum is used to illustrate the phase coupling between wave components and the energy transfer caused by nonlinear wave-wave interaction. The nonlinear interaction is strongest in the area near the oyster reef (x = 0.5 m), where the secondary and third harmonics are generated. The amplitude of third harmonic is small, but it can be seen from the spectrum obviously (Figures 6, 7). As the distance increases, less wave modes involved in the nonlinear interaction, and the coupling intensity decreases accordingly. After x = 2 m, the triad coupling weakens to a minor degree, and the energy spectrum basically does not change. This result further indicates that it is a gradual evolution process for bound higher harmonics releasing into free waves, which is also consistent with previous conclusions of Dong et al. (2009).
At present, the success rate of coastal ecological projects is low, and the expected role of wave consumption is often unable to play in ecological projects (Lewis, 2009). For example, in coastal ecological projects focusing on mangrove restoration, the mortality rate of mangrove plants is high, which makes it almost impossible to attenuate wave. This result is partly due to the coastal hydrodynamic conditions (Hurst et al., 2015), including wave energy being too high and the sediment movement caused by wave nonlinearity being too strong (Constance et al., 2021). Based on the significant influence of oyster reefs on wave energy and nonlinear characteristics, if the oyster reefs could be arranged in front of immature mangroves to form a coastal ecological restoration system of “oyster reefs + mangroves”, oyster reefs could dissipate wave energy before mangroves grow up steadily, improving the survival rate and expanding the suitable growth area of mangroves. Meanwhile, mangroves can degrade and purify the biological wastewater produced by oyster reefs (Chen et al., 2011). Finally, the combination system can improve the energy dissipation effect during storm surge (You, 2022). The combination of oyster reefs and mangroves can not only play its role in disaster reduction but also improve ecological benefits, which may have application potentiality in coastal ecological restoration projects.
After arriving at the reef, the oyster larvae will cling to the reef permanently, allowing the reef to expand continuously. Only the static or initial state of oyster reefs, rather than the dynamic growth, is considered in the experiment. The interaction and feedback mechanism between the hydrodynamic characteristics of waves and the growth process of oyster reefs is the direction of future research.
5 Conclusion
Physical experiments are carried out to study the energy transfer process and nonlinear triad interactions after waves propagating over the artificial bag oyster reefs, based on Fourier spectral and wavelet bispectral analysis.
The oyster reefs mainly affect primary harmonic energy, which transfer to higher harmonics by triad nonlinear interactions. The transmission spectrum presents three peaks at primary, second and third harmonics. The energy increase in 2fp and 3fp results from the phase coupling between the primary and secondary harmonics. The nonlinear interaction is strongest near the oyster reefs, and is weakened with increasing of distance.
With increasing water depth, the energy of both the primary and secondary harmonics increases. This is because the energy transferred between different frequencies decreases with the nonlinear coupling decreases. An increase in the top width leads to a decrease of the primary harmonic energy and an increase of the secondary harmonic energy, which is due to the increase of the shoaling region length, resulting in the enhancement of triad nonlinear interactions and the increase of high-frequency free waves released.
However, the influence of top width on energy is far less than that of water depth. Therefore, in the coastal restoration projects, taken wave dissipation into consideration, it is recommended that keep the oyster reefs nonsubmerged. However, for the top width of oyster reefs, it is necessary to be designed reasonably by considering both the project cost and the influence on wave energy dissipation effect.
Data availability statement
The original contributions presented in the study are included in the article/supplementary material. Further inquiries can be directed to the corresponding author.
Author contributions
BJ contributed to the experimental design and data analysis. HZ contributed to the paper writing. TY conceived the study. YS provided funding and participated in the experiment. CF and FC contributed to the discussion and paper writing. WL contributes to data computation and analysis. All authors contributed to the article and approved the submitted version.
Funding
This study was supported by National Key R&D Program of China (Grant No. 2022YFC3106100) and the National Natural Science Foundation of China (Grant No. 42188102, 51509038, 51709048).
Acknowledgments
The authors would like to thank Fujian Hydrodynamic Research Center for their technical support.
Conflict of interest
The authors declare that the research was conducted in the absence of any commercial or financial relationships that could be construed as a potential conflict of interest.
Publisher’s note
All claims expressed in this article are solely those of the authors and do not necessarily represent those of their affiliated organizations, or those of the publisher, the editors and the reviewers. Any product that may be evaluated in this article, or claim that may be made by its manufacturer, is not guaranteed or endorsed by the publisher.
References
Abroug I., Abcha N., Dutykh D., Jarno-Druaux A., Marin F. (2020). Experimental and numerical study of the propagation of focused wave groups in the nearshore zone. Phys. Lett. A. 384 (6), 126144. doi: 10.1016/j.physleta.2019.126144
Allen R. J. (2013). Physical modeling of wave transmission for submerged and emergent breakwaters used in living shorelines. [Dissertation] (Mobile AL: University of South Alabama).
Beji S., Battjes J. A. (1993). Experimental investigation of wave propagation over a bar. Coast. Engineering. 19 (1-2), 151–162. doi: 10.1016/0378-3839(93)90022-z
Beji S., Nadaoka K. (1999). A spectral model for unidirectional nonlinear wave propagation over arbitrary depths. Coast. Engineering. 36 (1), 1–16. doi: 10.1016/S0378-3839(98)00046-5
Bian F., Huang Z., Ju L. (2020). Physical model test study on wave dissipation performance of submerged breakwater with different structural forms. Port & Waterway Engineering 08 (36), 41–58. doi: 10.16233/j.cnki.issn1002-4972.20200804.014
Brossard J., Perret G., Blonce L., Diedhiou A. (2009). Higher harmonics induced by a submerged horizontal plate and a submerged rectangular step in a wave flume. Coast. Engineering. 56 (1), 11–22. doi: 10.1016/j.coastaleng.2008.06.002
Buccino M., Calabrese M. (2007). Conceptual approach for prediction of wave transmission at low-crested breakwaters. J. Waterway, Port, Coast, Ocean Eng. 133, 213–224. doi: 10.1061/(ASCE)0733-950X(2007)133:3(213
Carter J., Fenical S., Harter C., Todd J. (2017). CFD modeling for the analysis of living shoreline structure performance, coastal structures and solutions to coastal disasters 2015: Resilient coastal communities (Reston, VA: American Society of Civil Engineers), 442–450.
Chauvin J. M. (2018). Wave attenuation by constructed oyster reef breakwaters. [Master's thesis] (Louisiana State University). doi: 10.31390/gradschool_theses.4752
Chen J., Jiang C., Hu S., Huang W. (2010). Numerical study on the characteristics of flow field and wave propagation near submerged breakwater on slope. Acta Oceanologica Sinica. 29 (1), 88–99. doi: 10.1007/s13131-010-0011-5
Chen Z., Li S., Zhou Q., Hong M., Zhang J., Li C., et al. (2011). Analysis of water quality change after aquaculture wastewater entering mangrove. Anhui Agric. Sci. 10, 6039–6040. doi: 10.13989/j.cnki.0517-6611.2011.10.059
Chen H., Tang X., Zhang R., Gao J.. (2018). Effect of bottom slope on the nonlinear triad interactions in shallow water. Ocean Dynamics. 68 (4), 469–483. doi: 10.1007/s10236-018-1143-y
Chowdhury M. S. N., Walles B., Sharifuzzaman S. M., Hossain M. S., Ysebaert T., Smaal A. C., et al. (2019). Oyster breakwater reefs promote adjacent mudflat stability and salt marsh growth in a monsoon dominated subtropical coast. Sci. Rep. 9 (1), 8549. doi: 10.1038/s41598-019-44925-6
Chung J., Powers E. J. (1998). “The statistics of wavelet-based bicoherence,” in Proceedings of the IEEE-SP International Symposium on Time-Frequency and Time-Scale Analysis (Pittsburgh, PA, USA: IEEE). 141–144.
Constance A., Haverkamp P. J., Bunbury N., Schaepman-Strub G. (2021). Extent change of protected mangrove forest and its relation to wave power exposure on aldabra atoll. Global Ecol. Conserv. 27, e01564. doi: 10.1016/j.gecco.2021.e01564
Daemen I. F. R. (1991). Wave transmission at low-crested breakwater. [Dissertation] (Dell: Delft University of Technology).
D’angermound K., Meer J. W., Jong R. J. (1996). “Wave transmission at low-crested structures,” in Proceedings of the 25th International Conference on Coastal Engineering, (New York, NY, USA: ASCE). 2418–2427.
De Paiva J. N. S., Walles B., Ysebaert T., Bouma T. J. (2018). Understanding the conditionality of ecosystem services: the effect of tidal flat morphology and oyster reef characteristics on sediment stabilization by oyster reefs. Ecol. Engineering. 112, 89–95. doi: 10.1016/j.ecoleng.2017.12.020
De Wit F., Tissier M., Reniers A.. (2020). The relationship between sea-swell bound wave height and wave shape. J. Mar. Sci. Engineering. 8 (9), 643. doi: 10.3390/jmse8090643
Doering J. C., Bowen A. J. (1995). Parameterization of orbital velocity asymmetries of shoaling and breaking waves using bispectral analysis. Coast. Engineering. 26 (1–2), 15–33. doi: 10.1016/0378-3839(95)00007-X
Dong G., Ma Y., Perlin M., Ma Y., Yu B., Wang G.. (2009). Experimental study of long wave generation on sloping bottoms. Coast. Engineering. 56 (1), 82–89. doi: 10.1016/j.coastaleng.2008.10.002
Dong G., Ma Y., Perlin M., Ma X., Yu B., Xu J. (2008). Experimental study of wave-wave nonlinear interactions using the wavelet-based bicoherence. Coast. Engineering. 55 (9), 741–752. doi: 10.1016/j.coastaleng.2008.02.015
Drake T. G., Calantoni J. (2001). Discrete particle model for sheet flow sediment transport in the nearshore. J. Geophys. Res-Oceans 106 (C9), 19859–19868. doi: 10.1029/2000JC000611
Eldeberky Y., Battjes Y. (1996). Spectral modeling of wave breaking: Application to Boussinesq equations. J. Geophys. Res-Oceans 101 (C1), 1253–1264. doi: 10.1029/95JC03219
Elgar S., Guza R. T. (1985). Observations of bispectra of shoaling surface gravity-waves. J. Fluid Mechanics. 161, 425–448. doi: 10.1017/S0022112085003007
Elsayed M. A. K. (2006). A novel technique in analyzing non-linear wave-wave interaction. Ocean engineering. 33 (2), 168–180. doi: 10.1016/j.oceaneng.2005.04.010
IPCC. (2014). “Climate change 2014: Impacts, adaptation, and vulnerability. part b: Regional aspects,” in Contribution of working group II to the fifth assessment report of the intergovernmental panel on climate change (U K and New York. (USA: Cambridge University Press).
Hurst T. A., Pope A. J., Quinn G. P. (2015). Exposure mediates transitions between bare and vegetated states in temperate mangrove ecosystems. Mar. Ecol. Prog. Ser. 533, 121–134. doi: 10.3354/meps11364
Jiang W., Shi W., Li N., Fan R., Zhang W., Quan W., et al. (2022). Oyster and barnacle recruitment dynamics on and near a natural reef in China: Implications for oyster reef restoration. Front. Mar. Science. 9. doi: 10.3389/fmars.2022.905373
Kennish M. J. (2002). Environmental threats and environmental future of estuaries. Environ. Conserv. 29, 78–107. doi: 10.1017/S0376892902000061
Kibler K. M., Kitsikoudis V., Donnelly M., Spiering D. W., Walters L. (2019). Flow–vegetation interaction in a living shoreline restoration and potential effect to mangrove recruitment. Sustainability. 11, 3215. doi: 10.3390/su11113215
Larsen Y., Hanssen A. (2000). “Wavelet-polyspectra: principles and properties. signal processing X theories and applications,” in Proceedings of EUSIPCO 2000, Tenth European Signal Processing Conference. (Tampere, Finland: IEEE). 797–800.
Lewis R. R. (2009). Chapter 24 - methods and criteria for successful mangrove forest restoration. Coast. Wetlands: integrated ecosystem approach., 787–800. doi: 10.1016/B978-0-444-63893-9.00024-1
Lipcius R. N., Zhang Y., Zhou J., Shaw L., Shi J.. (2021). Modeling oyster reef restoration: Larval supply and reef geometry jointly determine population resilience and performance. Front. Mar. Science. 8. doi: 10.3389/fmars.2021.677640
Liu P. C. (2000a). Is the wind wave frequency spectrum outdated. Ocean engineering. 27 (5), 577–588. doi: 10.1016/S0029-8018(98)00074-2
Liu P. C. (2000b). Wave grouping characteristics in nearshore great lakes. Ocean engineering. 27 (11), 1221–1230. doi: 10.1016/S0029-8018(99)00042-6
Ma Y. (2010). Study on wave nonlinearity based on continuous wavelet transform. [Dissertation] (Dalian: Dalian University of Technology).
Ma Y., Dong G., Perlin M., Ma X., Wang G., Xu J. (2010). Laboratory observations of wave evolution, modulation and blocking due to spatially varying opposing currents. J. Fluid Mechanics. 661, 108–129. doi: 10.1017/S0022112010002880
Ma Y., Ma X., Dong G. (2015). Variations of statistics for random waves propagating over a bar. J. Mar. Sci. Tech. 23 (6), 864–869. doi: 10.6119/JMST-015-0610-3
Manis J. E., Garvis S. K., Jachec S. M., Walters L. J. (2015). Wave attenuation experiments over living shorelines over time: a wave tank study to assess recreational boating pressures. J. Coast. Conserv. 19, 1–11. doi: 10.1007/s11852-014-0349-5
Morris R. L., Bilkovic D. M., Boswell M. K., Bushek D., Cebrian J., Goff J., et al. (2019). The application of oyster reefs in shoreline protection: are we over engineering for an ecosystem engineer? J. Appl. Ecology. 56, 1703–1711. doi: 10.1111/1365-2664.13390
Muchebve E., Nakamura Y., Suzuki T., Kamiya H.. (2016). Analysis of the dynamic characteristics of seawater intrusion using partial wavelet coherence: a case study at nakaura Watergate, Japan. Stochastic Environ. Res. Risk Assessment. 30 (8), 2143–2154. doi: 10.1007/s00477-016-1336-1
National Research Council (2007). "Chapter 4 Mitigating eroding sheltered shorelines: A trade-off in ecosystem services," in: Mitigating shore erosion along sheltered coasts. Natl. Academies Press 92–97.
Newman J., Pidde A., Stefanovska A. (2021). Defining the wavelet bispectrum. Appl. Comput. Harmonic Analysis. 51, 171–224. doi: 10.1016/j.acha.2020.10.005
Nielsen P. (1992). Coastal bottom boundary layers and sediment transport (Singapore: Mainland Press).
Nielsen P., Callaghan D. P. (2003). Shear stress and sediment transport calculations for sheet flow under waves. Coast. Engineering. 47, 347–354. doi: 10.1016/S0378-3839(02)00141-2
Ohyama T., Nadaoka K. (1994). Transformation of a nonlinear-wave train passing over a submerged shelf without breaking. Coast. Engineering. 24, 1–22. doi: 10.1016/0378-3839(94)90024-8
Peng Z., Zou Q., Reeve D., Wang B. (2009). Parameterisation and transformation of wave asymmetries over a low-crested breakwater. Coast. Engineering. 56 (11-12), 1123–1132. doi: 10.1016/j.coastaleng.2009.08.005
Rambabu A. C., Mani J. S. (2005). Numerical prediction of performance of submerged breakwaters. Ocean Engineering. 32 (10), 1235–1246. doi: 10.1016/j.oceaneng.2004.10.023
Saleh F., Weinstein M. P. (2016). The role of nature-based infrastructure (NBI) in coastal resiliency planning: A literature review. J. Environ. Manage. 183 (PT.3), 1088–1098. doi: 10.1016/j.jenvman.2016.09.077
Saprykina Y., Kuznetsov S., Andreeva N., Shtremel M. N.. (2013). Scenarios of nonlinear wave transformation in the coastal zone. Oceanology. 53 (4), 422–431. doi: 10.1134/S0001437013040103
Spalding M. D., Ruffo S., Lacambra C., Meliane I., Hale L. Z., Shepard C. C., et al. (2014). The role of ecosystems in coastal protection: Adapting to climate change and coastal hazards. Ocean Coast. Manage. 90, 50–57. doi: 10.1016/j.ocecoaman.2013.09.007
Spiering D., Kibler K. M., Kitsikoudis V. (2018). “Hydrodynamic change following living shoreline restoration based on a before-After-Control-Impact experiment,” in World environmental and water resources congress 2018 (Minnesota, USA: Hydraulics and Waterways, Water Distribution Systems Analysis and Smart Water. Minneapolis), 54–64.
Seabrook S. R., Hall K. R. (1998). Wave transmission at submerged rubblemound breakwater; in Proceedings of the 26th International Conference on Coastal Engineering . (New York, NY, USA: ASCE). 2000–2013.
Styles R. (2015). Flow and turbulence over an oyster reef. J. Coast. Res. 31, 978–985. doi: 10.2112/JCOASTRES-D-14-00115.1
Van Milligen B. P., Sanchez E., Estrada T., Hidalgo C., Branas B., Carreras B., et al. (1995). Wavelet bicoherence: A new turbulence analysis tool. Phys. Plasmas. 8, 3 017–3 032. doi: 10.1063/1.871199
Wang X., Feng J., Lin C., Liu H., Chen M., Zhang Y., et al. (2022). Structural and functional improvements of coastal ecosystem based on artificial oyster reef construction in the bohai Sea, China. Front. Mar. Science. 9. doi: 10.3389/fmars.2022.829557
Whitman E. R., Reidenbach M. A. (2012). Benthic flow environments affect recruitment of crassostrea virginica larvae to an intertidal oyster reef. Mar. Ecol. Prog. Series. 463, 177–191. doi: 10.3354/meps09882
Wiberg P. L., Taube S. R., Ferguson A. E., Kremer M. R., Reidenbach M. A., et al. (2019). Wave attenuation by oyster reefs in shallow coastal bays. Estuaries Coasts. 42 (2), 331–347. doi: 10.1007/s12237-018-0463-y
You T. (2022). Experimental study on wave evolution characteristics in oyster reef- mangrove wave dissipation system. [Master's thesis] (Fuzhou: Fuzhou University).
Young I. R., Eldeberky Y. (1998). Observations of triad coupling of finite depth wind waves. Coast. Eng. 33 (2), 137–154. doi: 10.1016/S0378-3839(98)00006-4
Yu B. (2013). Experimental study on low-frequency waves. [Dissertation] (Dalian: Dalian University of Technology).
Keywords: oyster reef, nonlinear triad interaction, wavelet bicoherence, wave energy, spectrum analysis
Citation: Jiang B, Zhang H, You T, Sun Y, Fu C, Liao W and Cai F (2022) Experimental study on the effect of an oyster reef on the nonlinear characteristics of irregular waves. Front. Mar. Sci. 9:1096497. doi: 10.3389/fmars.2022.1096497
Received: 12 November 2022; Accepted: 08 December 2022;
Published: 23 December 2022.
Edited by:
Meilin Wu, South China Sea Institute of Oceanology (CAS), ChinaReviewed by:
Dake Chen, Nanjing Hydraulic Research Institute, ChinaYi Pan, Hohai University, China
Zhenwei Zhang, Xiamen University of Technology, China
Copyright © 2022 Jiang, Zhang, You, Sun, Fu, Liao and Cai. This is an open-access article distributed under the terms of the Creative Commons Attribution License (CC BY). The use, distribution or reproduction in other forums is permitted, provided the original author(s) and the copyright owner(s) are credited and that the original publication in this journal is cited, in accordance with accepted academic practice. No use, distribution or reproduction is permitted which does not comply with these terms.
*Correspondence: Yuanmin Sun, c3VueXVhbm1pbkB0aW8ub3JnLmNu