 Chi Huang
 Carissa Piñón1
 Mehrube Mehrubeoglu
 Kirk Cammarata
- 1Department of Life Sciences, Texas A&M University-Corpus Christi, Corpus Christi, TX, United States
- 2Department of Engineering, Texas A&M University-Corpus Christi, Corpus Christi, TX, United States
Spatiotemporal patterns in seagrass-epiphyte dynamics for Thalassia testudinum in the northwestern Gulf of Mexico were evaluated through biomass measurements and scanned-image based metrics to investigate the potentially harmful impact of excessive epiphyte accumulations on seagrass condition. Image analysis with Spectral Angle Mapper algorithms distinguished epiphyte and uncovered seagrass leaf pixels to generate a normalized metric of leaf area coverage (epiphyte pixels/total leaf pixels). Imaging metrics were compared to biomass-based metrics seasonally, among three locations with different environmental conditions (depth, salinity, temperature and nutrient levels inferred from sediment porewater measurements) near Redfish Bay, Texas, USA. Image analysis, in conjunction with biomass measures, provides enhanced insight into the seagrass-epiphyte dynamic relationship and how it varies with environmental conditions. Compared with the biomass and morphological measures, image analysis may be more informative as an indicator of environmental changes. Variation in linear regressions of epiphyte biomass vs. epiphyte area (pixels) suggested changes in the thickness and/or density of accumulated epiphytes across environmental contexts and seasons. Two different epiphyte colonization patterns were presented based on the correlation between the normalized metrics of epiphyte load and epiphyte leaf coverage. The epiphyte load was highest at low temperatures and locations with elevated DIN:P ratio in sediment porewater. Conversely, the mean leaf coverage by epiphytes stayed relatively constant (± 10%) across seasons but differed by location (25% ~55% in this case), suggesting that leaf growth in this study is regulated to maintain the proportion of uncolonized leaf surface and that epiphyte coverage plays a role in its regulation.
1. Introduction
As major primary producers, seagrasses rank high in their nutrient cycling ability and their economic value per hectare (Costanza et al., 1997; Dewsbury et al., 2016). Seagrass beds enhance biodiversity and provide ideal habitat and abundant food sources for marine organisms in different life stages, including commercially important species (Wolaver et al., 1980; Heck et al., 1997; Orth et al., 2006a; van Katwijk et al., 2016). The roles of nutrient filtration and blue carbon storage by seagrass beds further demonstrate the importance of seagrasses in coastal ecosystems (Hemminga and Duarte, 2000; Greiner et al., 2013). Seagrass reintroduction has been shown to enhance ecosystem functions worldwide, including habitat improvement and fisheries recoveries (Orth et al., 2006b; Bell et al., 2008; Greening et al., 2011; Bell et al., 2014; Katwijk et al., 2016). One of the most critical components of the seagrass ecosystem is epiphytes, which include large amounts of microorganisms, algae, and invertebrates attaching and growing on the surface of seagrass leaves (Humm, 1964; Corlett and Jones, 2007; Michael et al., 2008; Frankovich et al., 2009). The epiphytic algae provide primary food resources for the invertebrates in seagrass meadows (Kitting et al., 1984; Nielsen and Lethbridge, 1989). However, the seagrasses are not only just simple substrata for epiphytes (Pinckney and Micheli, 1998). Recent work (Crump et al., 2018) has dramatically illuminated the complex biochemical interactions between epiphytes and their hosts. In a successional pattern, diatoms and other microorganisms attach directly to the seagrass leaves, followed by a variety of red, green, and brown algae, some filamentous and some coralline (Corlett and Jones, 2007). Each of these epiphytes provides additional surfaces which can be utilized for secondary colonization by other algae. A significant component of the epiphytic biofilm is comprised of invertebrates, some of which consume the epiphytic algae and some just take advantage of the substrate (Moncreiff et al., 1992; Heck and Valentine, 2006; Peterson et al., 2007; Whalen et al., 2013).
Although seagrass epiphytes play an essential role in the primary production of the seagrass ecosystem, excessive accumulations of epiphytes compete with seagrass for light, nutrients and oxygen (Sand-Jensen, 1977; Duarte, 1995; Noisette et al., 2020; Brodersen and Kühl, 2022). Light attenuation is the primary driver limiting seagrass growth by decreasing photosynthesis and oxygen diffusion into roots (Lee and Dunton, 2000; Koch and Erskine, 2001; Ralph et al., 2007; O’Brien et al., 2018). Eutrophication stress enhances the growth of epiphytic algae to reduce light availability, with adverse effects on photosynthesis (Dennison and Alberte, 1982; Bulthuis and Woelkerling, 1983; Lee and Dunton, 1997; Ow et al., 2020), nutrient uptake processes (McGlathery, 2001; Armitage et al., 2005; Noisette et al., 2020) and species diversity in seagrass meadows (Moore and Wetzel, 2000; Peterson et al., 2007). More epiphyte biomass and less light availability were found along a gradient of external nitrogen loading, and epiphyte accumulation was limited by available nitrogen and phosphorus concentration (Wright et al., 1995; Johnson et al., 2006). Grazers exert top-down control of epiphytes, impacting seagrass productivity (Heck and Valentine, 2006). Nutrition content or algal chemical defenses affect feeding preferences and can deter grazing (Nielsen and Lethbridge, 1989; Crump et al., 2018). Such loss of top-down control increases epiphyte abundance and reduces the light required for seagrass growth.
Hence, understanding the epiphyte-seagrass dynamics under multiple biotic and abiotic factors may illuminate the influence of environmental conditions on the health of seagrass ecosystems. However, it has been argued that epiphyte abundance and composition are limited in predicting seagrass loss and thus has limited utility as an environmental indicator of nutrients (Worm and Sommer, 2000; Cambridge et al., 2007; Fourqurean et al., 2010). These complex epiphyte communities are spatiotemporally dynamic (Whalen et al., 2013). Epiphyte community structure on Thalassia testudinum at Grand Cayman (Corlett and Jones, 2007) was different from that for Florida Bay (Frankovich et al., 2009). Additional variation with seasons and environmental conditions have been noted for epiphytic algae and invertebrates (Novak, 1982; Borum, 1985; Armitage et al., 2005; Hasegawa et al., 2007; Peterson et al., 2007; Whalen et al., 2013). Multiple studies of nutrient impacts on seagrass response showed that nutrient levels alone could affect the growth of seagrass and associated epiphytes, but the effects were highly variable between studies (Frankovich and Fourqurean, 1997; Moore and Wetzel, 2000; Worm and Sommer, 2000; Armitage et al., 2005; Johnson et al., 2006). However, none of these studies teased apart relationships for seagrass leaves in the growth vs. dying phases, and the methods employed were spatiotemporally limited.
The dominant methods to monitor the response of seagrass growth and epiphyte accumulation focus on biomass, including dry weight biomass, ash-free dry weight biomass, or chlorophyll a and b, and other pigments (Heijs, 1984; Pinckney and Micheli, 1998; Armitage et al., 2006; Peterson et al., 2007; Smith et al., 2018). The epiphytes are typically scraped gently from seagrass for biomass analysis (Libes, 1986; Ray et al., 2014) but weak acid or chelators can also be used to more effectively remove organisms (Zimba and Hopson, 1997) However, the traditional biomass measures fail to provide detailed information on the complex relationship between epiphytes and seagrass because high-resolution spatiotemporal leaf coverage information is lost. Since an individual seagrass leaf may persist for months, the morphological and physiological states of the leaf and epiphytes provide a temporally integrated record of any environmental conditions which impact their relationship. Nevertheless, traditional dry weight biomass metrics present single values that represent variable periods exceeding a month. Previous studies using biomass measurements recognized, but did not fully capture the dynamic spatiotemporal information of epiphyte distribution on the seagrass leaves (Bulthuis and Woelkerling, 1983; Borum, 1987; Biber et al., 2004; Atmaja et al., 2021) because of temporally-limited sampling and the spatial limitations of the biomass measures.
A novel imaging-based technology was developed (Huang, 2020) to obtain more detailed spatiotemporal analysis of the dynamic epiphyte-seagrass relationship. Many plant studies, such as the evaluation of algal communities’ recruitment and composition shifts, diagnosis of injured seagrass leaves, bacterial aggregation on leaf surfaces, and shoot biomass estimation, have been investigated via image analyses (Monier and Lindow, 2004; Boese et al., 2008; Fikes and Lehman, 2008; Golzarian et al., 2011; Aoki et al., 2022). Spatial patterns of seagrasses’ photosynthetic efficiency were obtained by Imaging-PAM fluorometry (Ralph et al., 2005). A machine-learning approach (Pattern Recognition Software) was trained with specific features, such as the images’ color, brightness, and texture, and subsequently used for feature identification (Shamir et al., 2010). Geographic Information System (GIS) technology has been applied in terrestrial epiphyte ecology research based on image analysis (Bader et al., 2000). A novel epiphyte fluorescence imaging measurement was used to measure photosynthetic accessory pigments as a proxy for epiphyte abundance (Ray et al., 2014). The widespread availability of public resources for image analysis makes these methodologies particularly attractive for seagrass and epiphyte analyses.
This study aims to characterize spatiotemporal epiphyte accumulation patterns on Thalassia. testudinum, a prevalent climax seagrass species in the northwestern Gulf of Mexico, and delineate the shifts in seagrass and epiphyte growth under different environmental conditions through a an accessible, scanner-based imaging method (Huang, 2020). This approach provides highly informative metrics of epiphyte accumulation profiles and seagrass morphological responses to interpret changing seagrass-epiphyte dynamics under several different environmental conditions. The spatiotemporal epiphyte accumulation patterns, along with environmental condition information such as water temperature, salinity, sediment porewater nutrient levels, and depth, were correlated to evaluate their influences on seagrass-epiphyte interactions and to test the hypothesis that image-analysis methodology can capture the corresponding spatiotemporal shifts in both seagrass morphology and epiphyte communities.
2. Materials and methods
2.1. Study sites
The seagrass study sites were located near the Redfish Bay State Scientific Area in Aransas Pass, Texas, USA (Figure 1). The study location is bounded by the City of Aransas Pass Wastewater Treatment Plant on the northwest, the Intracoastal Waterway (ICWW) to the southeast, and centered around the ICW RV Park. Three study areas were selected based on perceived differences in epiphyte communities on the monotypic Thalassia testudinum beds in areas with different exposures to nutrient sources (Figure 1; Table 1). The WWTP area received direct discharge of treated wastewater effluent (WWTP; Shallow: N 97.14861, W -27.88485; Medium: N 97.14790, W -27.88467; Deep: N 97.14761, W -27.88435). There were additional possible impacts from a fish cleaning station and associated feeding and roosting of pelicans. The “Control” area received indirect discharge of treated wastewater effluent that was additionally polished by wetlands (“Control”; Shallow: N 97.15044, W -27.88053; Deep: N 97.15002, W -27.88021). Both WWTP and “Control” areas were near mangrove stands as well. A third site called CI was near the “Control” area, but distal to the wetland. It had additional potential impacts from an adjacent subtidal oyster bed and the ICWW channel (CI; N 097.15044, W -27.88485) Site CI is impacted by boat and barge wake that washes over the shallow oyster reef. It is the most shallow site, with visibly higher epiphyte accumulations. All sampling stations are primarily sandy mud sediment, but the CI site additionally has an abundance of embedded oyster shell. Each site was expected to differ primarily by nutrient conditions, and preliminary observations suggested differences in the epiphyte communities.
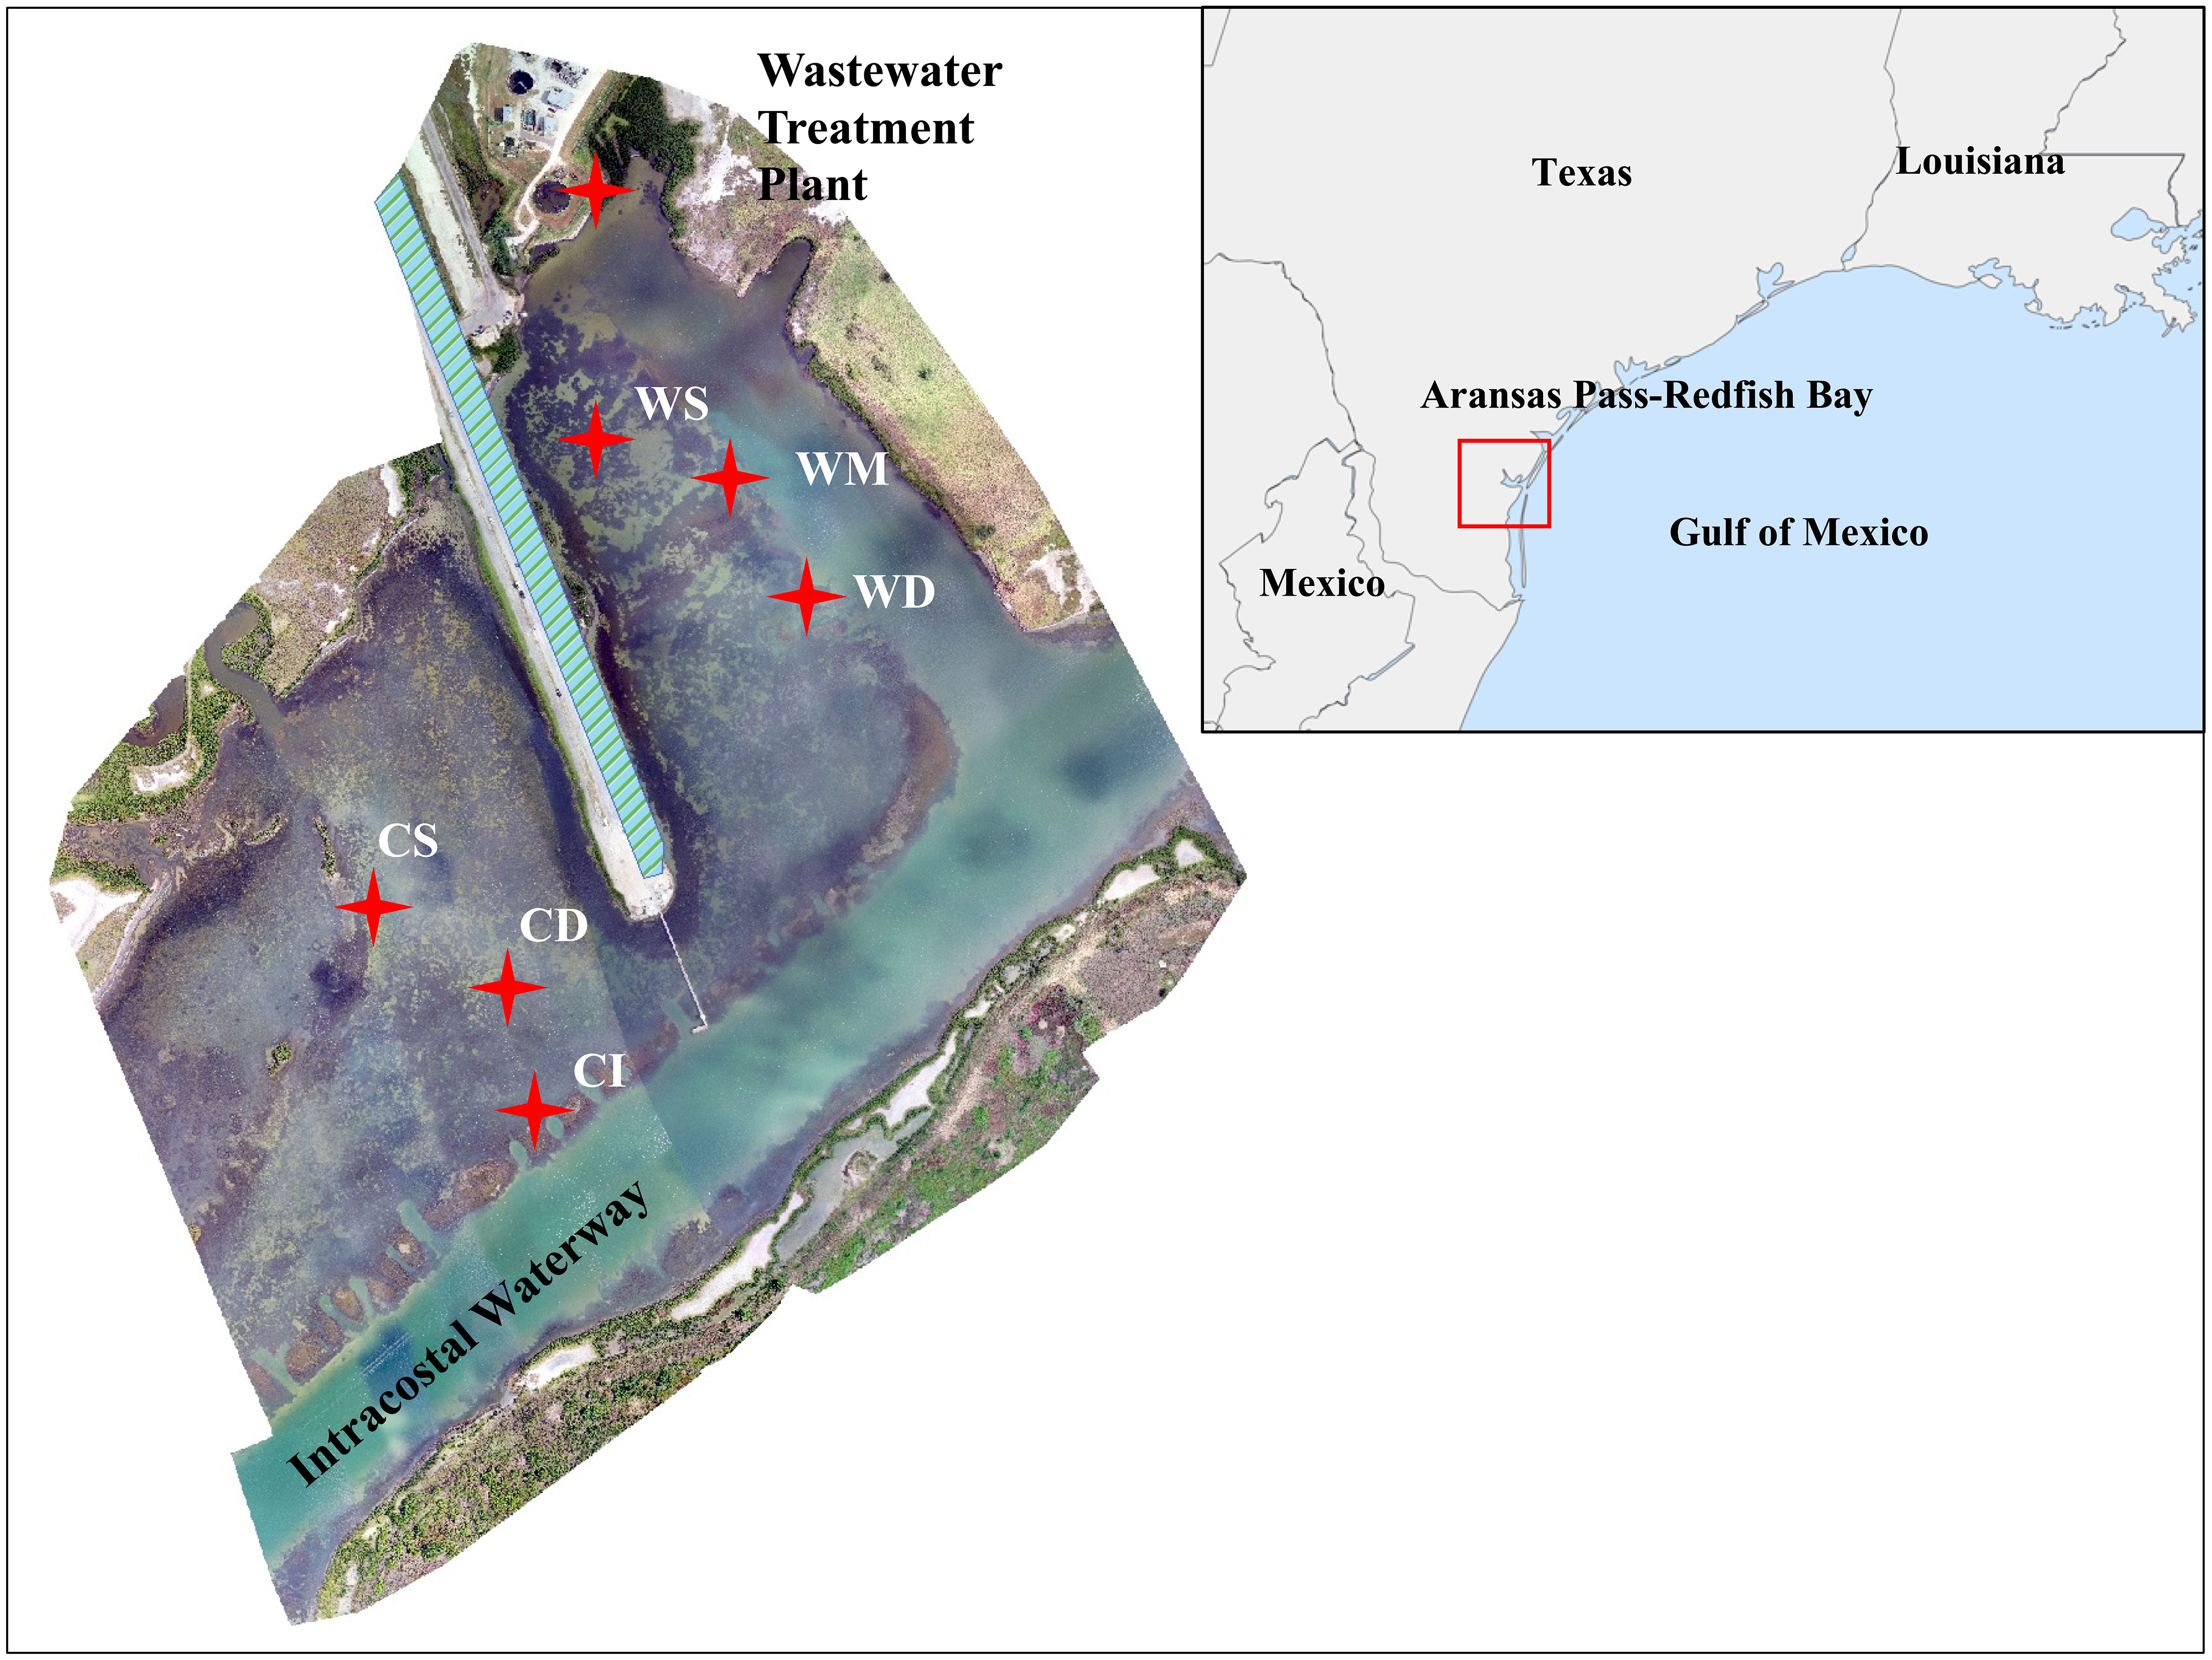
Figure 1 Aransas Pass-Redfish Bay sampling area, USA, showing sampling sites. The “Control” area includes shallow (CS, 58.1±13.1 cm) and deep (CD, 82.3±13.4 cm) sites. The “WWTP” sites include shallow (WS, 67.2±17.8 cm), medium (WM, 79.3±16.6 cm), and deep (WD, 93.2±16.5 cm) sites. The CI (47.2±11.9 cm) site adjacent to the ICWW channel is also shown. The average depth ± standard deviation for each sampling site is shown in parentheses. (Aerial imagery of study area courtesy of Dr. Hua Zhang at Texas A&M University-Corpus Christi).
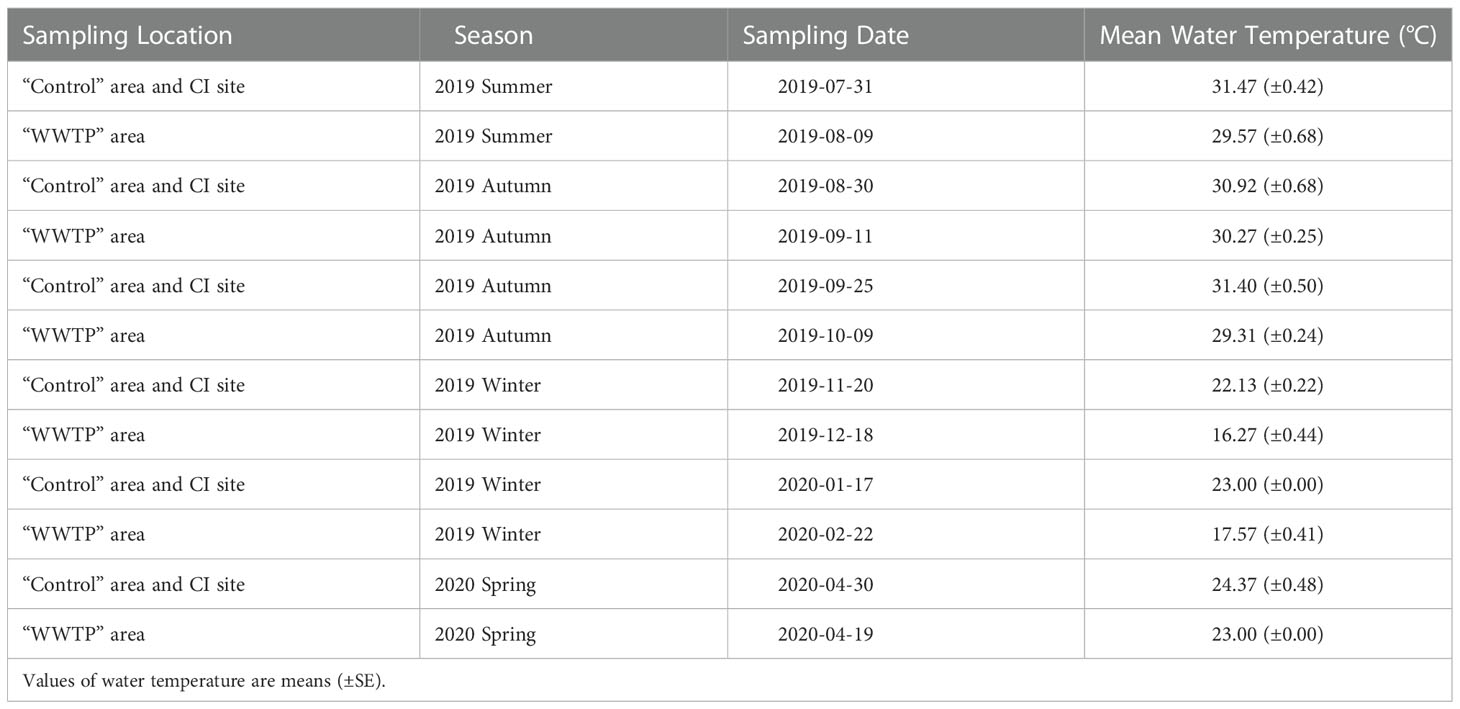
Table 1 Season data for locations-times two-way ANOVA designated by sampling date and corresponding water temperature.
2.2. Measurement of environmental conditions
Field conditions (depth, salinity, temperature, and general observations of wind, weather, etc.) were recorded at each visit to each sampling site to provide contextual information on factors that may affect seagrass condition and epiphyte. Depth was measured with a calibrated PVC pole. Salinity was measured using a refractometer (VEE GEE, STX-3), under standard conditions in the laboratory, on 50 mL water samples collected at seagrass canopy depth, without headspace. The temperature of the water column near the seagrass canopy height was measured with a calibrated thermometer.
Sediment for porewater analysis was sampled in May 2020 in triplicate from the six sampling sites (Figure 1) using a 10 cm inner diameter PVC corer inserted to a depth of 20 cm. Sediments from a zone of 5-15 cm depth, which represents the root zone of the seagrass, was collected from the cores and centrifuged at 5000g for 20 minutes at 4°C for porewater extraction. After centrifugation, supernatants were filtered through VWR glass microfiber filters, grade 696 (particle retention: 1.2μm). The filtrates were stored at -25°C and shipped frozen for nutrient analyses at the University of California-Davis (UC Davis) Analytical Lab (Davis, CA, USA). Nutrient analyses included ammonium (), Nitrate (), total dissolved inorganic nitrogen (DIN), and phosphate (). The nutrient levels of sediment porewater measured at this single time are considered to be an indicator of long-term relative nutrient exposure at each site.
2.3. Seagrass and epiphyte sampling and processing
The epiphyte-seagrass dynamics were quantified by biomass measurements and image-based metrics (Huang, 2020). Shoots of Thalassia testudinum were collected monthly or bimonthly at the six sampling locations from 2019 summer to 2020 spring. Regular sampling (at least bimonthly) across different seasons was necessary to capture the morphological response of seagrass in relation to accumulation patterns of epiphytes. The volume and time requirements of seagrass processing work necessitated that sampling in the “Control” and WWTP areas be staggered at approximately two- to three-week intervals. Three rings made of 7.6 cm diameter PVC pipe were placed haphazardly for triplicate replication of seagrass samples. Seagrass shoots located inside the ring (an area of approximately 45 cm2) were harvested with all leaves intact to equitably represent the morphological variation in seagrass growth and epiphyte accumulation. Collected seagrass shoots. placed into bottles without water to minimize disruption of the epiphytes, were stored dark and cold (4°C) at the lab, and imaged within 72 h.
For analyses, seagrass shoots were gently rinsed with deionized water, and the green portion of each individual leaf was measured for length and width and arranged on a fluid mount tray (Epson, Carson, CA) for imaging. As needed, microscope slides were used to weigh down twisted seagrass leaves to lie flat. Leaf images were captured by the Epson Perfection V-750 Pro color flatbed scanner (Epson, Carson, CA) using 24-bit color scanning at 1200 dpi resolution. After scanning, epiphytes were removed from each seagrass blade by scraping with a microscope slide. Epiphytes were quantitatively transferred to a pre-weighed empty aluminum dish. The epiphytes and epiphyte-free seagrass were dried to constant weight at 60°C to measure the biomass of each individual leaf.
2.4. Image analysis
Scanned seagrass leaf images (TIFF files) were analyzed to characterize the total leaf area, the epiphyte covered area and the uncovered leaf area (Huang, 2020). The pixels of seagrass and epiphytes on the images were classified using the spectral angle mapper (SAM) algorithm in ENVI 5.0 (L3 Harris Technologies, Niles, Ohio). Each image pixel was interpreted by a vector consisting of three hues of the light spectrum (Red band, Green band, and Blue band). The SAM algorithm distinguished the uncolonized seagrass leaf and epiphyte-covered areas based on a spectral angle between the vectors of targeted pixels and reference pixels in three-dimensional coordinates. The assignment of each pixel as seagrass or epiphyte was made using a threshold of spectral angle (< 2.3°). 482 reference pixels of seagrass, which had visually different colors due to variable growing conditions, were selected for establishing the seagrass spectral library. The epiphyte spectral library contained 843 reference pixels of epiphytes from variously colored groups of epiphytes. Finally, 2061 scanned images of each seagrass blade were analyzed via the seagrass and epiphyte spectral libraries.
Normalized and un-normalized biomass and image-derived metrics were evaluated. Correlations between epiphyte biomass vs. epiphyte covered area (number of epiphyte pixels), and between epiphyte load (epiphyte biomass/seagrass biomass) vs. leaf coverage % by epiphyte (epiphyte pixels/pixels of whole blade) were quantified by several regression models, including the linear, quadratic, power law, and the exponential models (Fong and Harwell, 1994). The best model was then selected, given the goodness of fits, such as linearity, R2 value, the Akaike Information Criterion correction (AICc), and the intrinsic biological meaning (Johnson and Omland, 2004). The regression analyses were drawn from samples within different environmental contexts or sampling times to demonstrate their site- and seasonal- patterns via R version 3.6.2.
2.5. Carbon and nitrogen content and stable isotope analysis
Stable isotope analyses were performed (separately) for seagrass and epiphytes to inform the physiology and status of T. testudinum and its epiphytes under the different environmental conditions at each sampling site. Four shoots of T. testudinum were collected from each of the 6 sampling sites in June 2020. The seagrass and epiphytes were processed separately as described above to obtain dried samples, which were then ground using a mortar and pestle. Leaf and epiphyte tissue content (total carbon and total nitrogen) and stable isotope ratios (δ13C, δ15N) were analyzed at the UC Davis Stable Isotope Facility (Davis, CA, USA). The mean standard deviation for reference material replicates was ±0.03 ‰ for δ15N and ±0.04 ‰ for δ13C, and the mean absolute accuracy for calibrated reference materials was within ±0.05 ‰ for δ15N and ±0.04 ‰ for δ13C.
2.6. Statistical methods for analysis of variance
The spatiotemporal variance of salinity, nutrient level of sediment porewater, and water temperature were tested using analysis of variance (ANOVA). Comparisons of the epiphyte-seagrass dynamics across environmental contexts from July 2019 to April 2020 were analyzed using two-way ANOVA followed by Tukey’s honest significant difference. The different sampling times in the “Control” area, “WWTP” area and CI site precluded the use of ANOVA for statistical comparisons between sampling locations across six sampling times. Instead, data were reallocated to four seasons based on the sampling date and average water temperature (Table 1) to facilitate environmental comparisons. Seagrass growth response was inferred from the mean seagrass leaf biomass and mean seagrass leaf area (number of covered and uncovered leaf pixels), and the epiphyte accumulation was determined by epiphyte biomass per leaf and epiphyte covered leaf area (number of epiphyte pixels). The normalized expressions of epiphyte metrics relative to the host seagrass leaves, such as epiphyte load (epiphyte biomass/seagrass biomass) and image-derived % cover (epiphyte pixels/pixels of whole blade), were used to further understand the seagrass-epiphyte dynamic relationship spatiotemporally. A mixed model (Fixed × Random) nested ANOVA was performed to evaluate the significance of differences in epiphyte-seagrass dynamics among sites of different depths in the “Control” and “WWTP” areas separately. Variables were grouped by sampling times (random factor) nested in different ‘depth’ sites. Differences in the C and N content and the C and N isotope composition were compared between the sampling locations. All comparisons were analyzed using ANVOA, with significant differences between specific groups assessed using Tukey post-hoc test separately. All analyses were conducted via R version 3.6.2. with a false discovery probability of p = 0.1 through the “Westfall” and “Shaffer” procedures for multiple comparisons of balanced and unbalanced data, respectively (Shaffer, 1986; Westfall, 1997).
3. Results
3.1. Classification outputs of seagrass and epiphyte image analyses
A true color image of an epiphyte-covered seagrass leaf and the classified outputs derived from the seagrass and the epiphyte spectral libraries are shown in Figure 2. It takes around 15 seconds to classify a scanning image of an individual seagrass leaf. The seagrass-classified images showed 482 uncovered leaf spectral classes with different colors, including growing areas and senescing or injured areas, which presented different levels of green and yellow or brown, respectively. The epiphyte-classified images contained 843 spectral classes of variable epiphytic groups distinguished by different colors. Due to natural variation and errors of visually estimated differences during spectral library establishment, numerous spectral classes might characterize identical features.
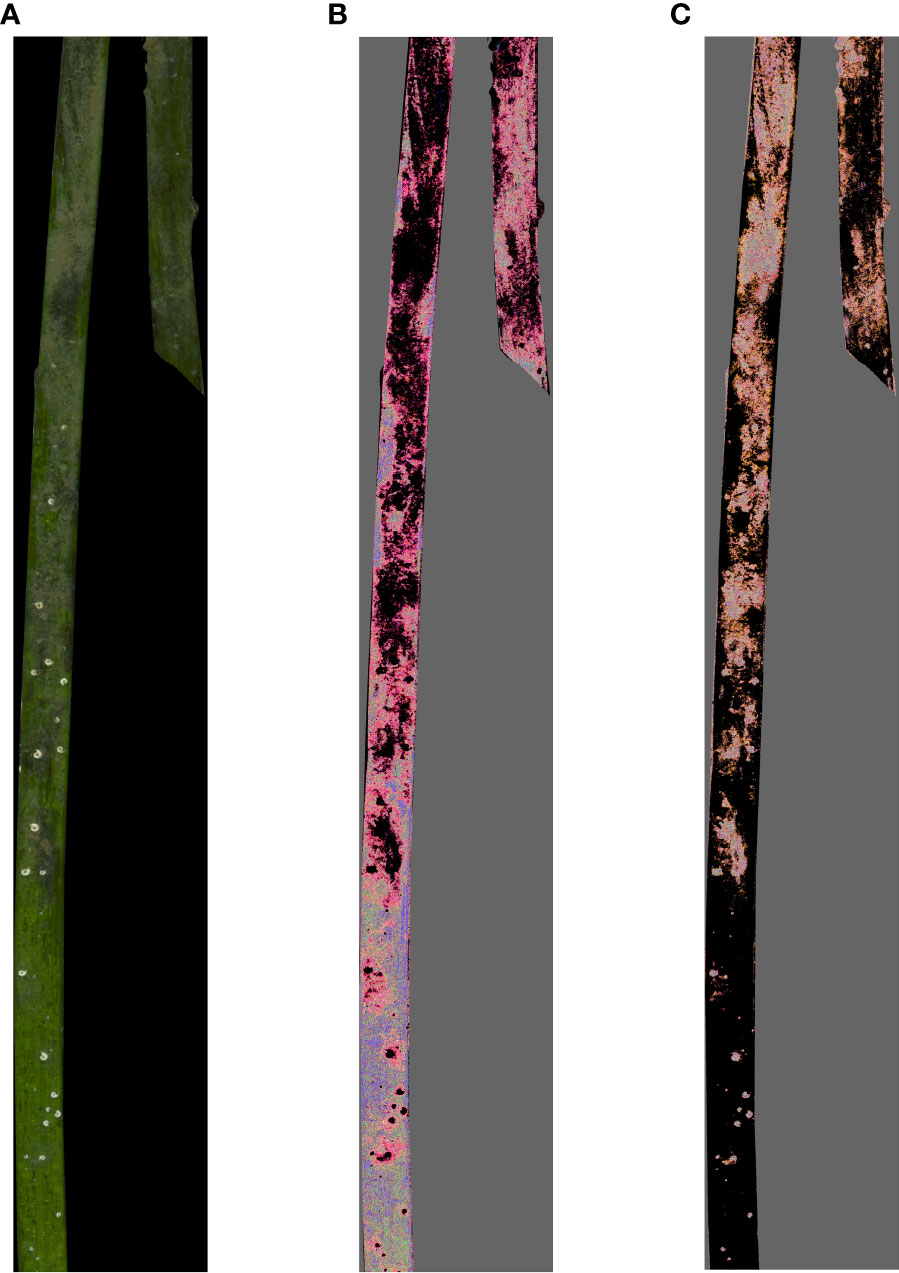
Figure 2 An example of seagrass blade color scans (A) and ENVI classification of seagrass and epiphyte (B, C, respectively). The black area represents the scanning background in image A, and the black areas in images (B, C) are the unclassified pixels using a particular spectral library. (A) original scanned blade; (B) seagrass classified Image (ENVI); (C) epiphyte classified image (ENVI). Images lightened by 35%.
3.2. Comparison of metrics for seagrass and epiphytes across all study sites
Comparison of mean values of biomass- and imaging-based metrics across all study sites for the entire study period (Figure 3) revealed similar site to site patterns (ordination) of variation. Both epiphyte metrics, biomass load and % coverage, were normalized to the amount of seagrass substrate. Although there were no significant differences in epiphyte accumulation between the WWTP and the “Control” areas, site CI exhibited significantly higher values for both biomass and imaging metrics (p < 0.05). Thus, both biomass- and imaging-based metrics revealed greater relative epiphyte accumulation at CI site. Leaf biomass and blade areas did not significantly differ among the CI, the CS, and the CD site across sampling times. Conversely, there was significantly lower leaf biomass at the WS site than at the WM and the WD site, respectively (Figures 3A, B; p < 0.05).
Figure 3 Average (+/-SE) metrics of seagrass growth (A) leaf biomass and (B) blade area, and metrics of epiphyte-seagrass dynamics (C) epiphyte load and (D) epiphyte coverage (%) of leaf and (C) epiphyte load at different sampling locations “Control” area, WWTP area, and CI site. For each panel, bars showing the different letters differ significantly from each other at p < 0.05 using Tukey’s pairwise test.
3.3. Environmental conditions and site comparisons
Water temperatures ranged from 16 to 32 °C and were stable in summer and early autumn (29.17~32.00 °C from July to October) (Table 1). Temperatures dropped in November and fluctuated through winter, with an average temperature of 20.75 °C. In April, the mean temperature warmed to 24.00 °C (Table 1).
Salinity levels ranged from 25 – 37 and differed significantly with seasonal change (highest in summer) (df = 3, F = 31.68, P < 0.05), but there was no significant difference in the mean salinity among the “Control” area, CI site, and “WWTP” area (Table S1). However, the transition from Autumn to Winter (Table 1) was accompanied by a decrease in salinity by about 8, as well as a decrease in temperature by 9-13 °C.
The depths of the study sites varied from 29 cm to 125 cm over the course of the study, with mean values ranging from 47.2 cm to 93.2 cm. The relationship of the seagrass and epiphyte metrics to variation in average depth of study sites showed only weak correlations (Figure S1; R2 = 0.31, 0.22). Likewise, with the exception of pixels of leaf area, only weak correlations were observed for seagrass and epiphyte metrics with mean temperature and mean salinity (Figures S2 and S3 respectively). Divergence of the correlations of leaf area and leaf biomass metrics, with temperature and salinity indicated greater variability in the biomass data. Thus, mean depth, temperature or salinity differences do not appear to play a major role in the biomass observations.
The different potential environmental influences on each site from direct vs polished wastewater effluent, a shipping channel or oyster beds prompted an examination of relative nutrient levels. Sediment porewater nutrient levels were taken to be indicators of long-term nutrient exposure history at each site. Table 2 shows the results obtained from a measurement in May 2020. The average concentrations of nitrate () and ammonium () from the CI site sediment porewater were nearly 1.5 times higher than from the “Control” area. However, these differences were not significant among the three locations. The average concentration of phosphate () at the “WWTP” area was more than two times higher than at “Control” and CI sites (df = 2, F = 8.369, P < 0.05), which was significant (Table 2). The total dissolved inorganic nitrogen (DIN = + ) (45.01~68.55 μmole/L) differed among the three sampling locations but was not significant. However, ratios of DIN:P ( + : ), varied significantly from 7.82 in the “WWTP” area to 154.55 at the CI site (df = 2, F = 11.93, P < 0.05) (Table 2).
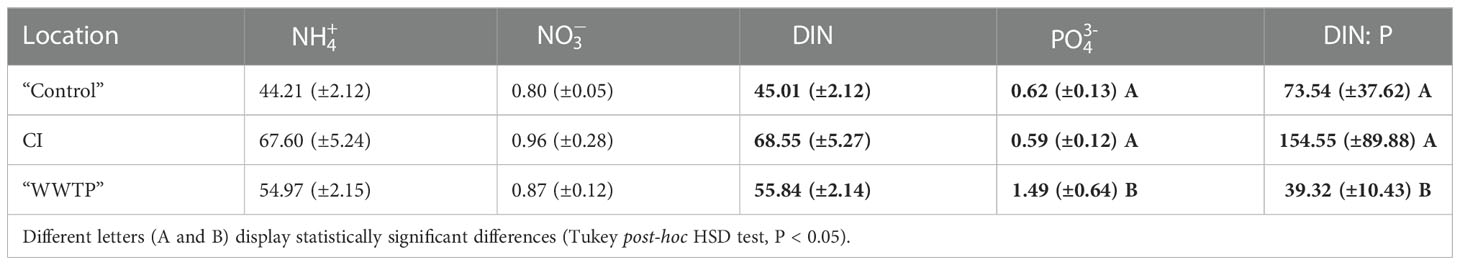
Table 2 Average concentration (μmole/L) of ammonium, nitrate, total DIN, phosphate, and DIN:P ratio of sediment porewater (+/-SD) from the “Control” area (n = 6), CI site (n = 3), and “WWTP” area (n = 9).
The tissue C and N content and stable isotope ratios were examined (Figure 4) to describe the status of epiphytes and seagrass at the environmentally unique sites. The carbon and nitrogen concentrations of seagrass were significantly higher than in corresponding epiphyte samples (Figure 4, ANOVA, p < 0.05). The C concentration of seagrass for the CI site was significantly higher than at the WWTP or “Control” areas. In contrast, the epiphyte C concentration was highest in the “Control” area. The N concentration of seagrass was not significantly different among the 3 locations, but the CI site had the lowest N concentration for the epiphytes. Epiphytes from the WWTP area had the lowest C/N ratio (Figure 4, ANOVA, p < 0.05), while seagrass did not show a significant difference in the C/N ratio among the three sampling locations.
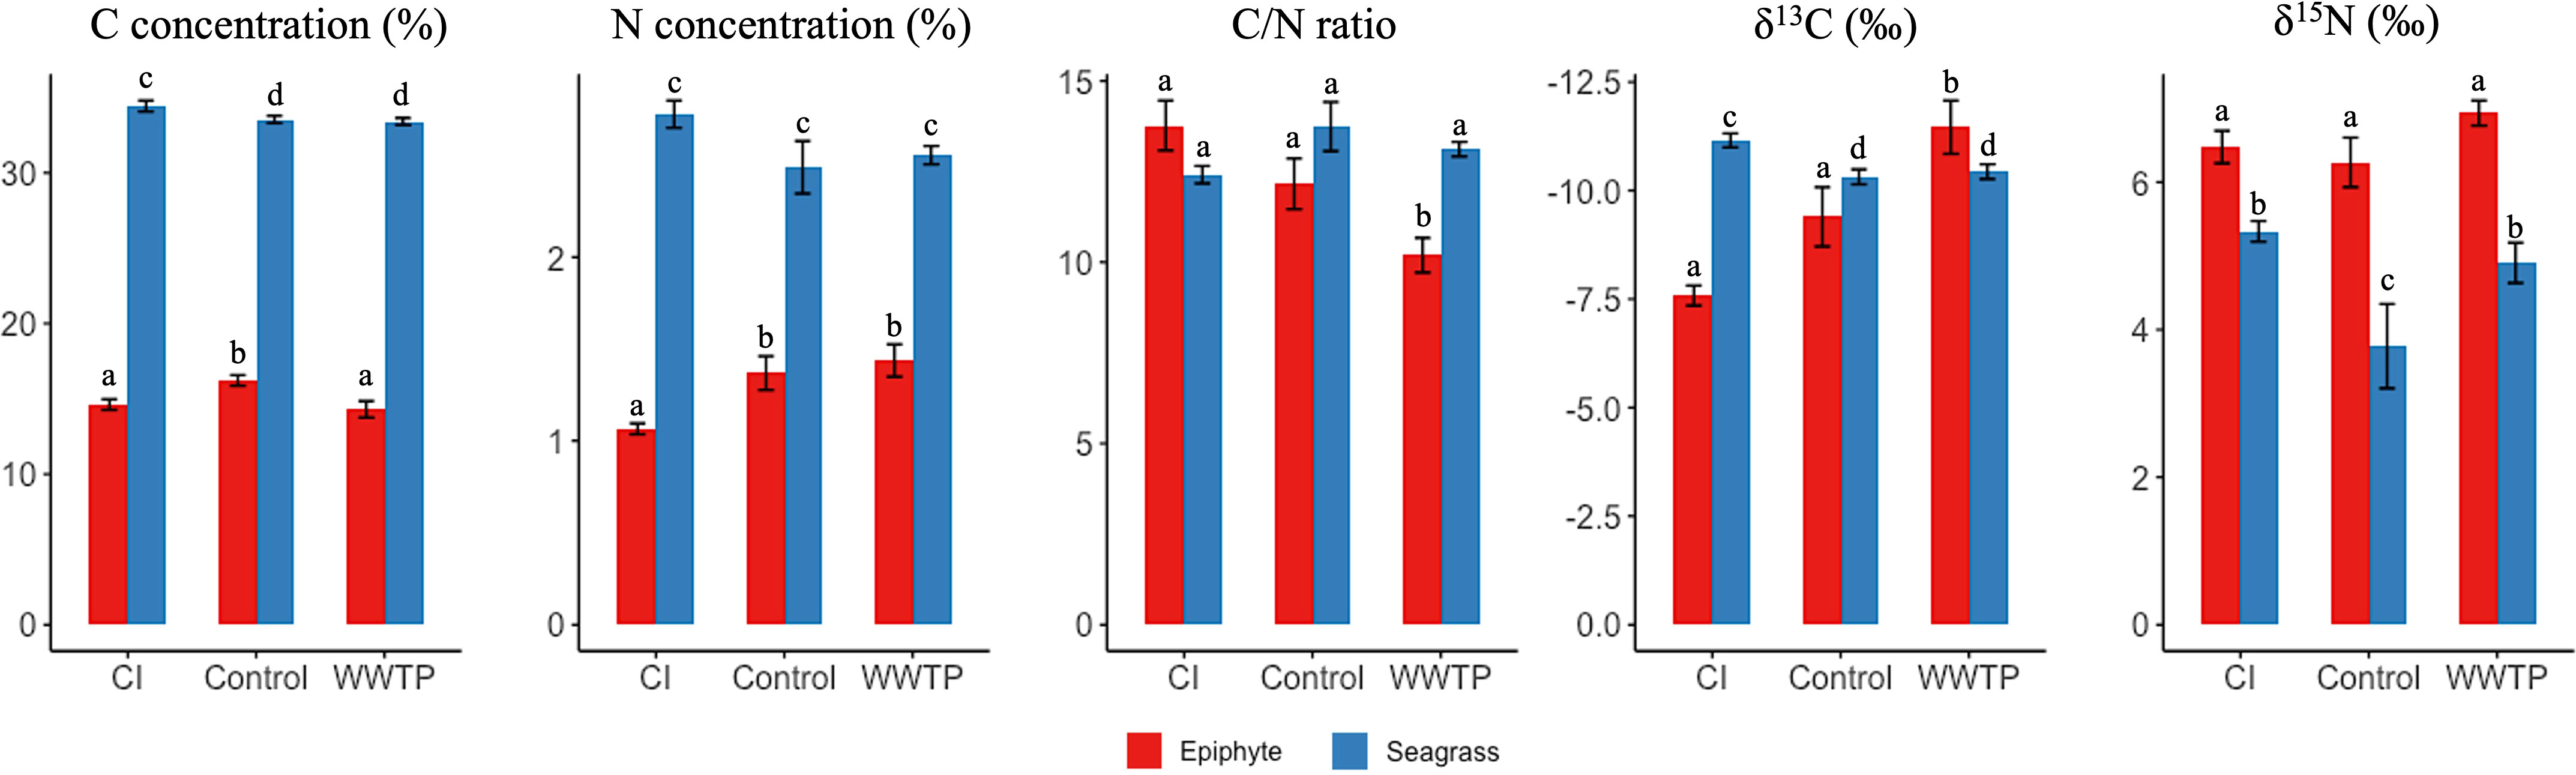
Figure 4 Mean ( +/- SE) of the concentration of carbon (C), the concentration of nitrogen (N), the C/N ratio, the δ13C, and the δ15N of T. testudinum and related epiphytes among three sampling locations. Epiphyte and seagrass are shown in red and blue, respectively. For each panel, bars showing the different letters differ significantly from each other at p < 0.1 using Tukey’s pairwise test.
The isotopic composition analysis of carbon (δ13C) demonstrated the greatest depletion of 13C for epiphytes at the WWTP area, whereas for seagrass, the depletion of 13C was greatest at the CI site (Figure 4, ANOVA, p < 0.05). For δ15N analysis, the δ15N values of epiphytes were significantly enriched compared to their seagrass hosts. Although there was no significant difference in the δ15N values of epiphytes among the three sampling locations, seagrass at the “Control” area was lighter than seagrass from the CI and WWTP sites (Figure 4 ANOVA, p < 0.1).
3.4. Comparative metrics for the epiphyte-seagrass relationship
Comparisons of the different measures of epiphyte accumulation were made across different seasonal environmental influences. Linear regression between dried biomass of epiphyte per seagrass leaf and the numbers of identified epiphyte pixels per leaf revealed unique accumulation patterns by different sampling locations and seasons. The proportion of variation explained by linear regression ranged from 0.67 to 0.94, and there was a marked and consistent increase in the slope of the regression line, from all sampling areas (environmental contexts), with seasonal progression from summer through winter (Table 3). The different slopes demonstrate a seasonally changing relationship between epiphyte biomass and epiphyte coverage of the leaf. As an example, linear regression of the data from the “Control” area, July 31, 2019, had an R2 of 0.81 and a slope of 0.017, representing that there was 0.017 µg epiphyte biomass per identified epiphyte pixel. Epiphyte accumulation gradually increased to 0.0559 µg per epiphyte pixel through winter into spring (Table 3). Similarly, epiphyte accumulation in the “WWTP” area increased from 0.014 µg to 0.033 µg over the same period (but with a peak at 0.0675 µg in February). At the CI site, epiphytes increased from 0.024 µg to 0.0434 µg over the same period (but with a peak at 0.0709 µg in February).
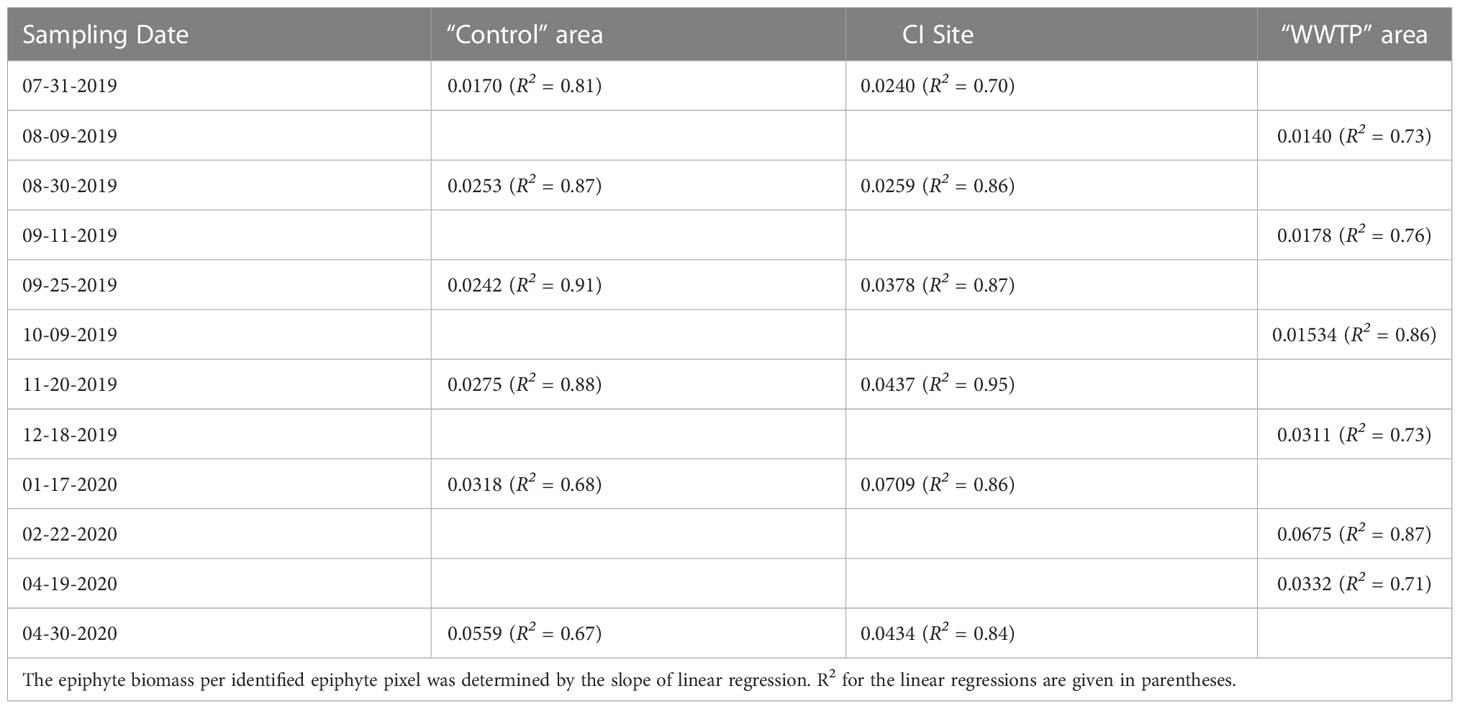
Table 3 Slope of regression of epiphyte accumulation on epiphyte covered area for “Control” area, “WWTP” area, and CI site.
Expression of epiphyte metrics relative to the host seagrass leaves is another approach to represent the epiphyte-seagrass dynamic relationship. The epiphyte load (epiphyte biomass/seagrass biomass) and the image-derived % epiphyte coverage were correlated and revealed seasonal changes in the seagrass-epiphyte relationship (Figures 5–7). Potential regression models were applied across six sampling times for the three locations. Two scenarios emerged to describe the relationship between epiphyte load (Y) and epiphyte coverage of the leaf (X) under variable environmental conditions. Analyses of this relationship in the “WWTP” area (Figure 5) showed a strong linear regression (Scenario 1) from August through December 2019. However, the exponential-rise model (Scenario 2) was the best-fitted model in February and April 2020 based on the AICc values (Figure 5). In the “Control” area and CI site, the exponential model was generated during August (Figures 6, 7) and was also presented at the CI site in April 2020 (Figure 6). The linear relationship between epiphyte load and epiphyte coverage held under most environmental circumstances, except August samplings from “Control” and CI; and April sampling from “WWTP” and CI (Figures 5–7). Different slope values revealed different accumulation rates of epiphyte biomass relative to epiphyte coverage. The slopes of this relationship varied from 0.75 to 3.43, with a progressive increase from August to December and with the highest values observed during winter or spring, when the coolest observed water temperatures prevailed (Table 1).
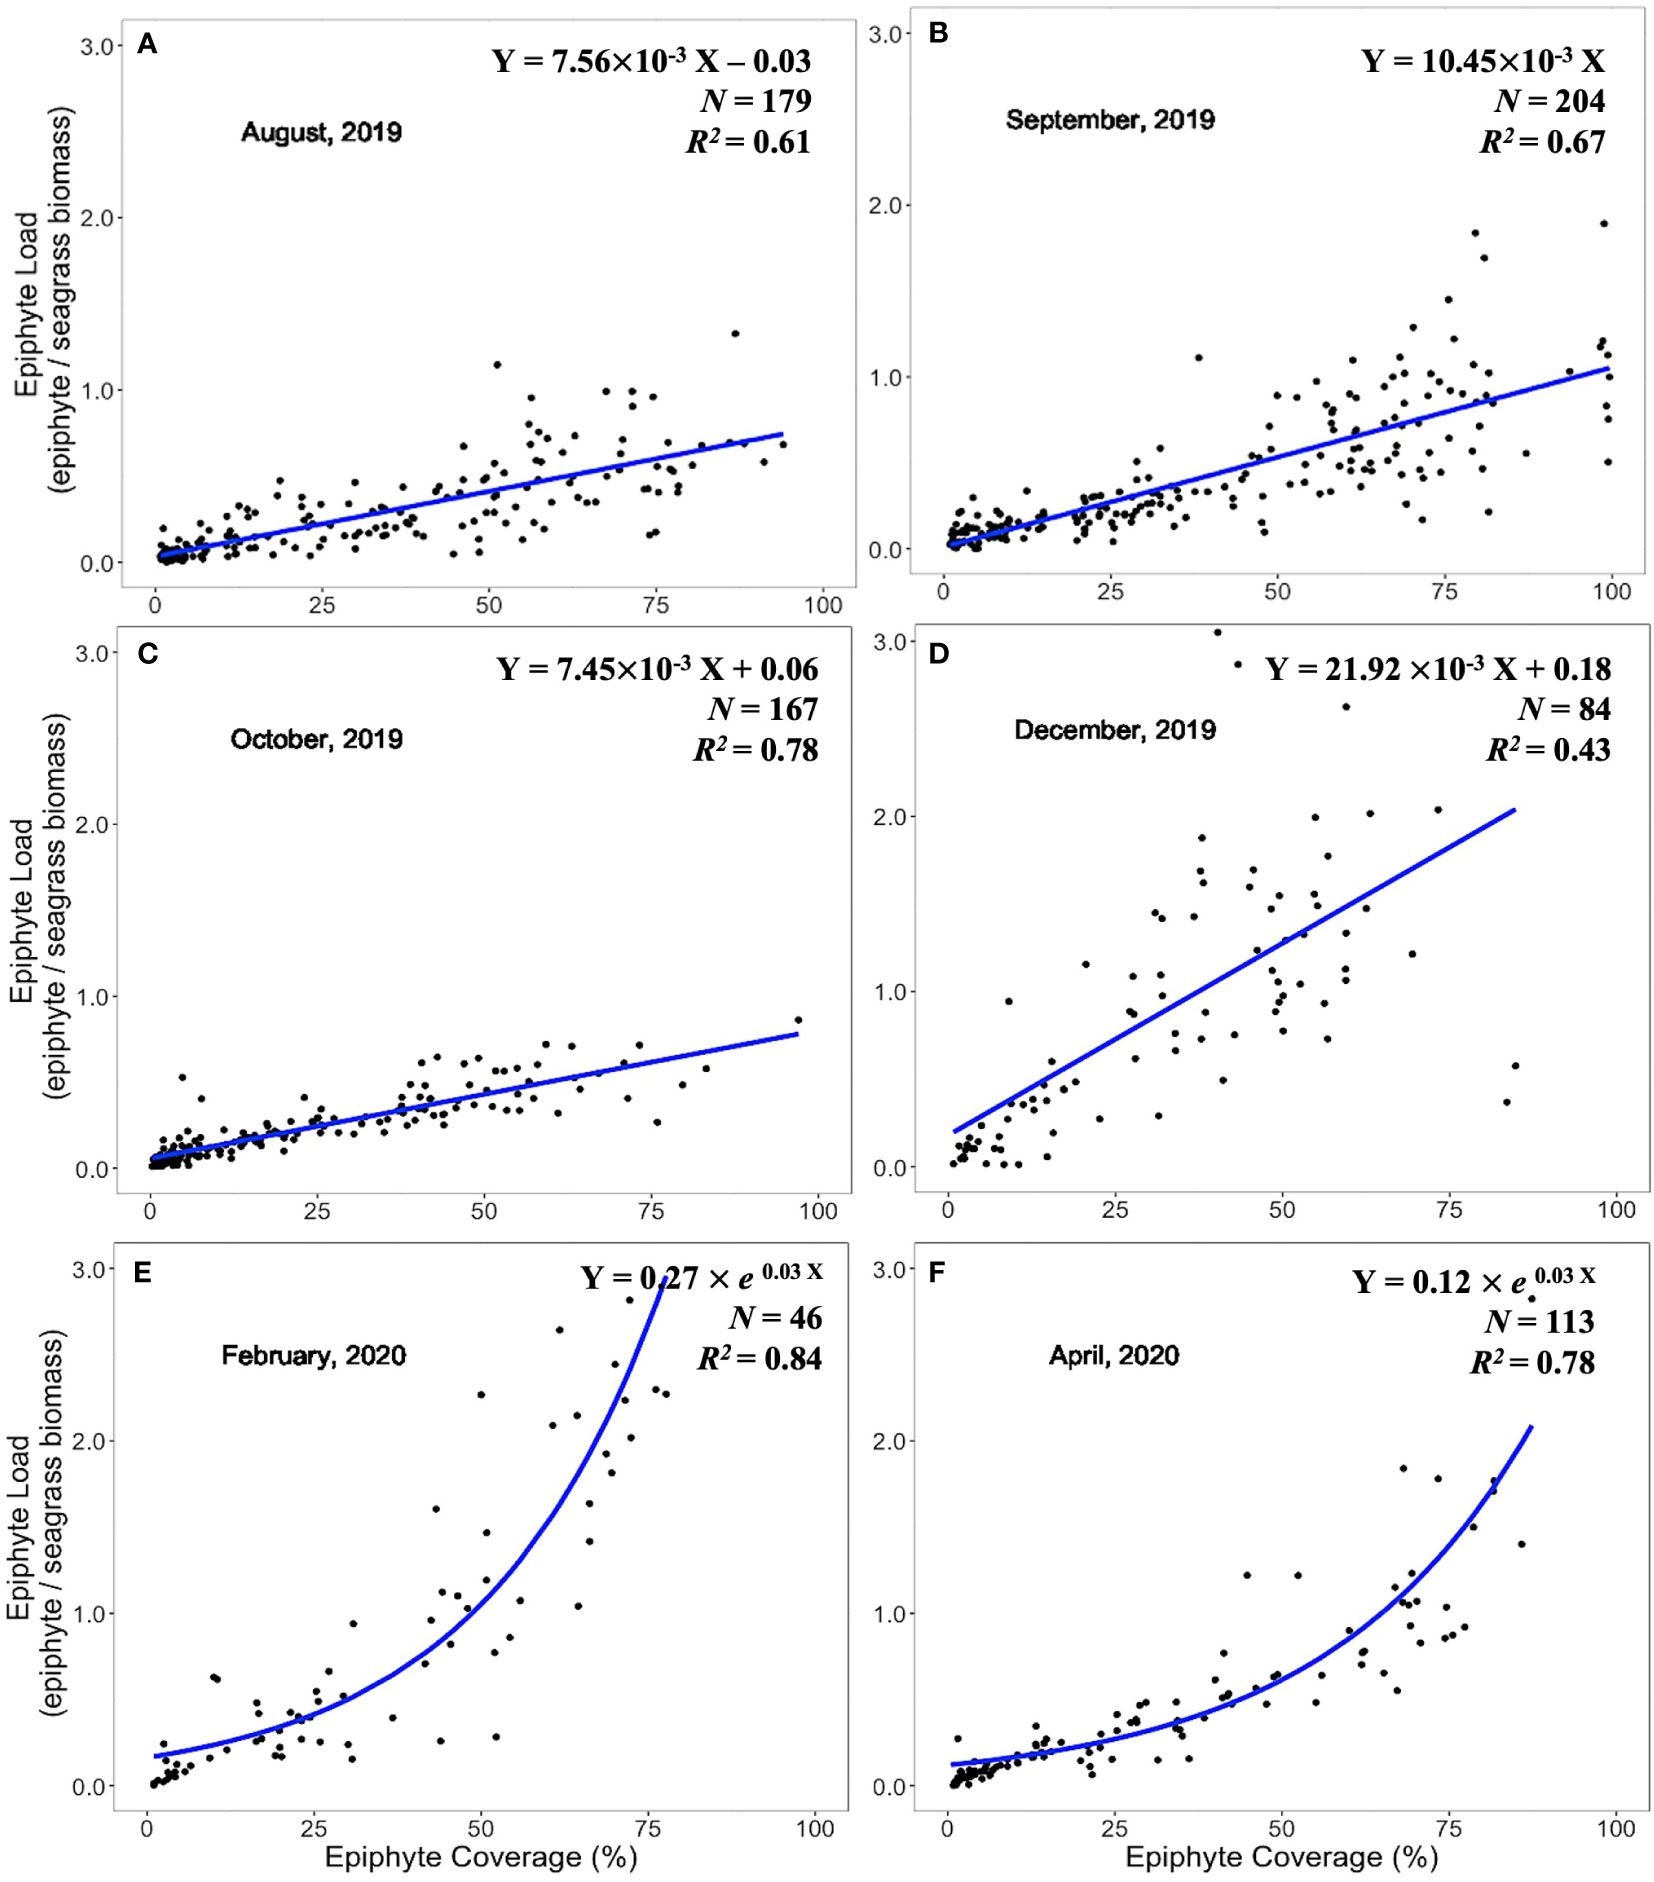
Figure 5 Linear and exponential accumulation scenarios 1 and 2, respectively, in “WWTP” area. Graphs (A–F) showed the best fitted regression of the relationship between epiphyte load and epiphyte coverage from August 2019 to April 2020.
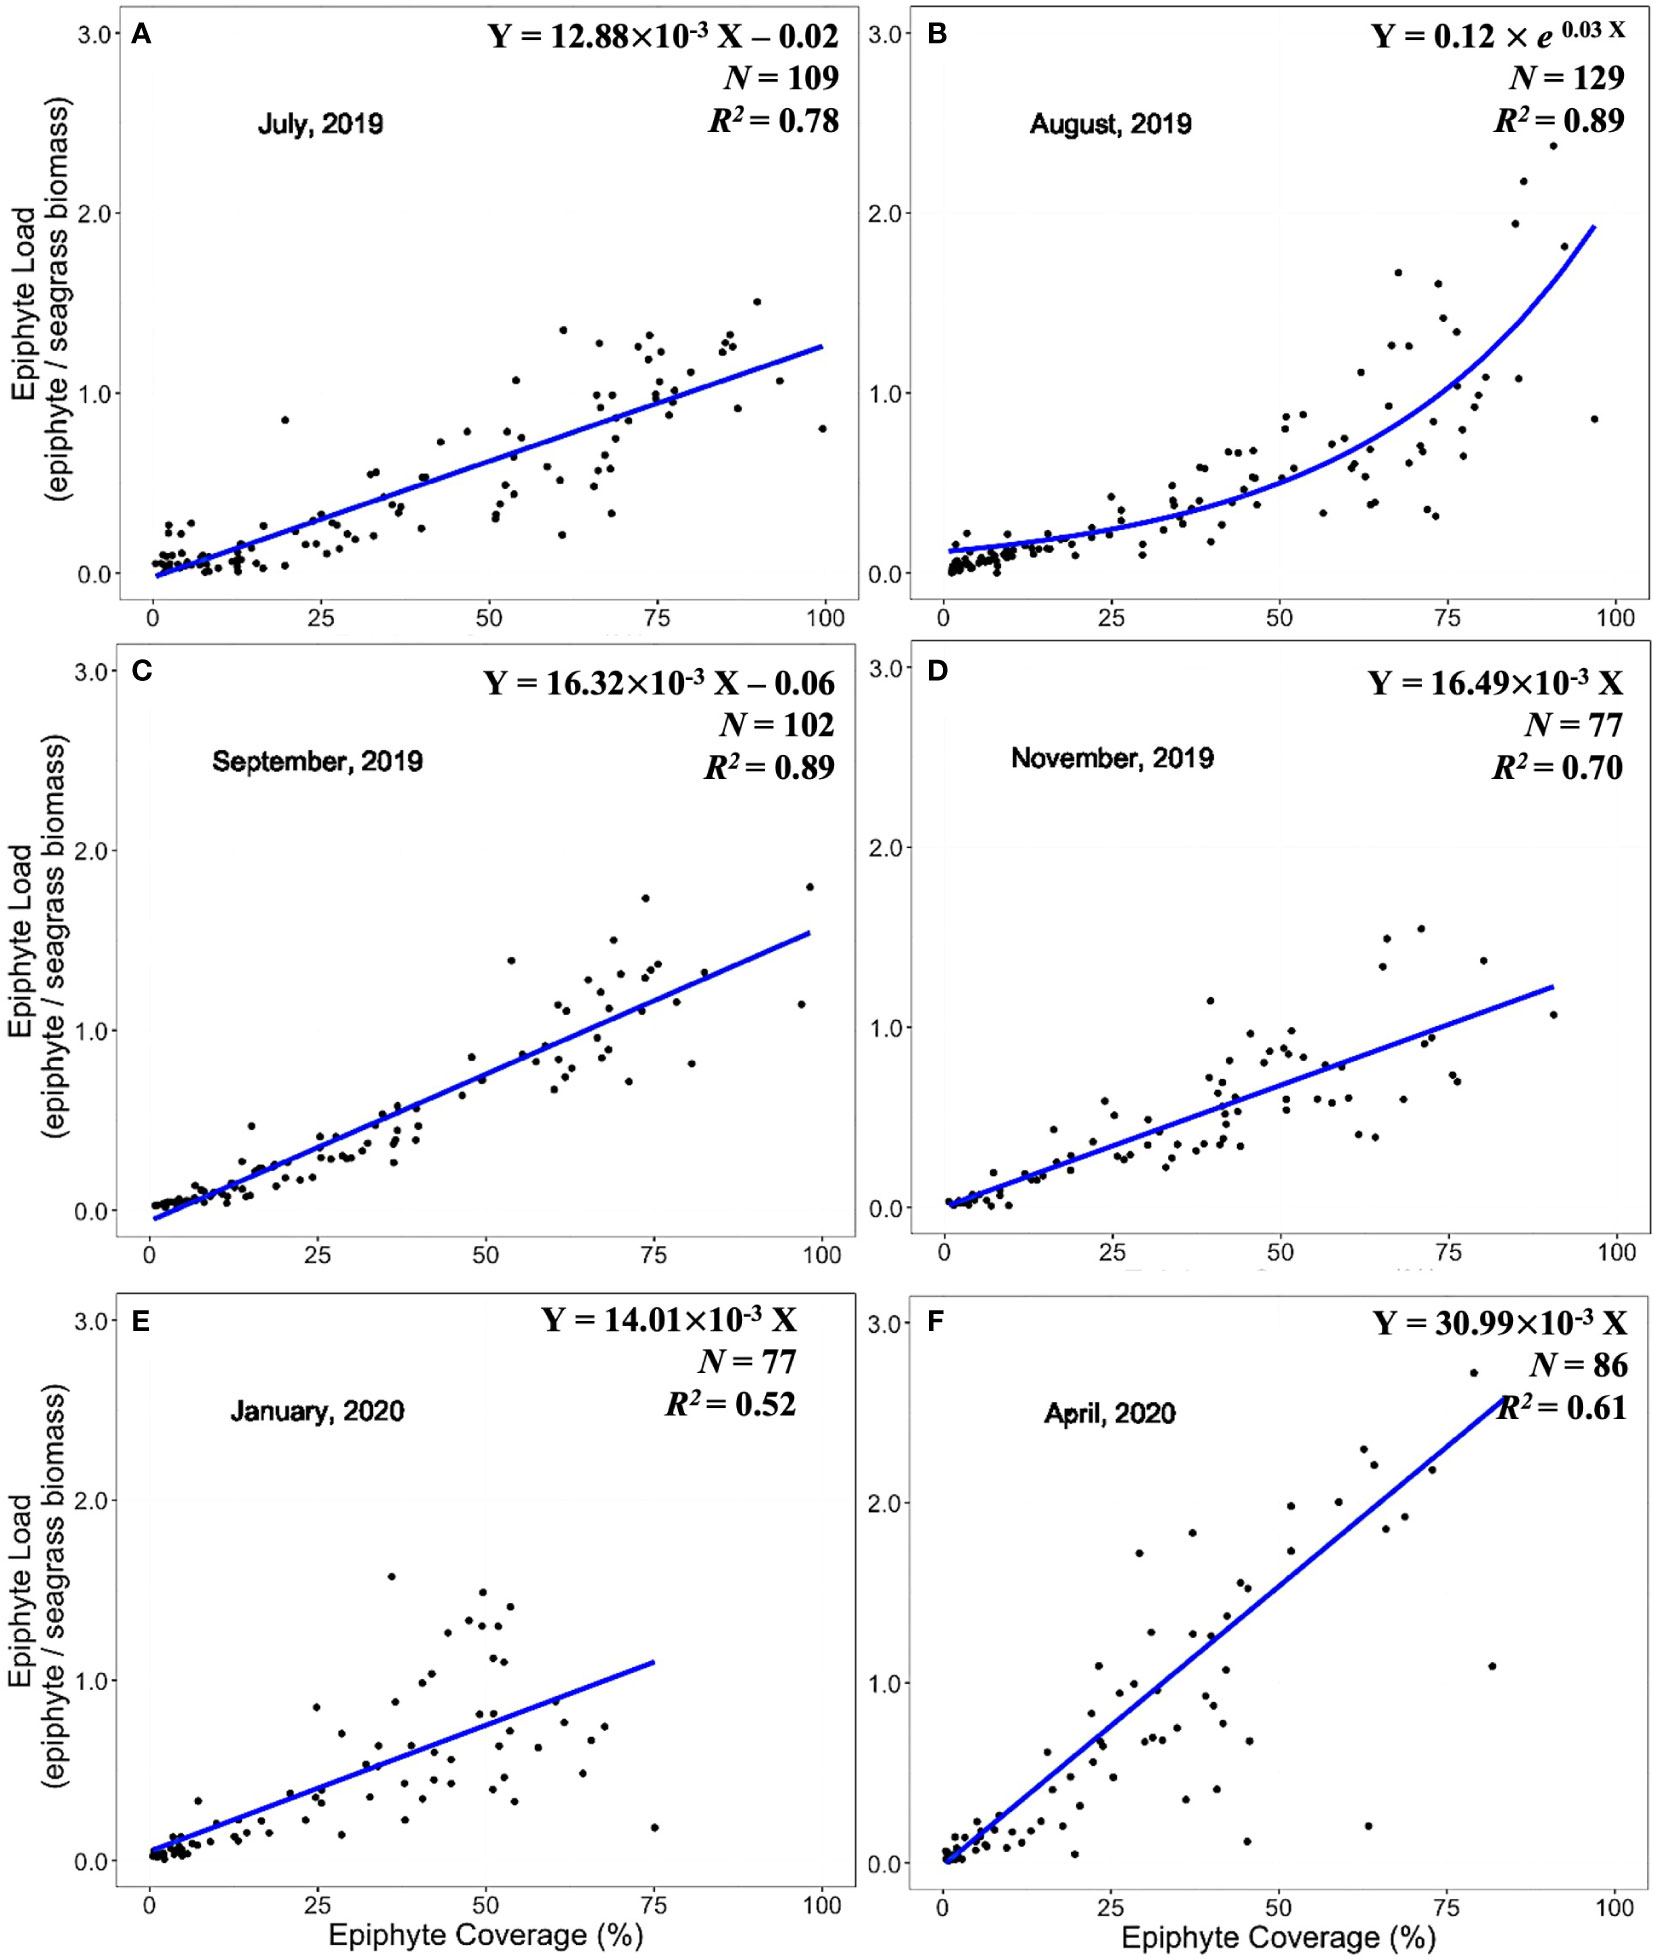
Figure 6 Linear and exponential accumulation scenarios 1 and 2, respectively, in “Control” area. Graphs (A-F) showed the best fitted regression of the relationship between epiphyte load and epiphyte coverage from July 2019 to April 2020.
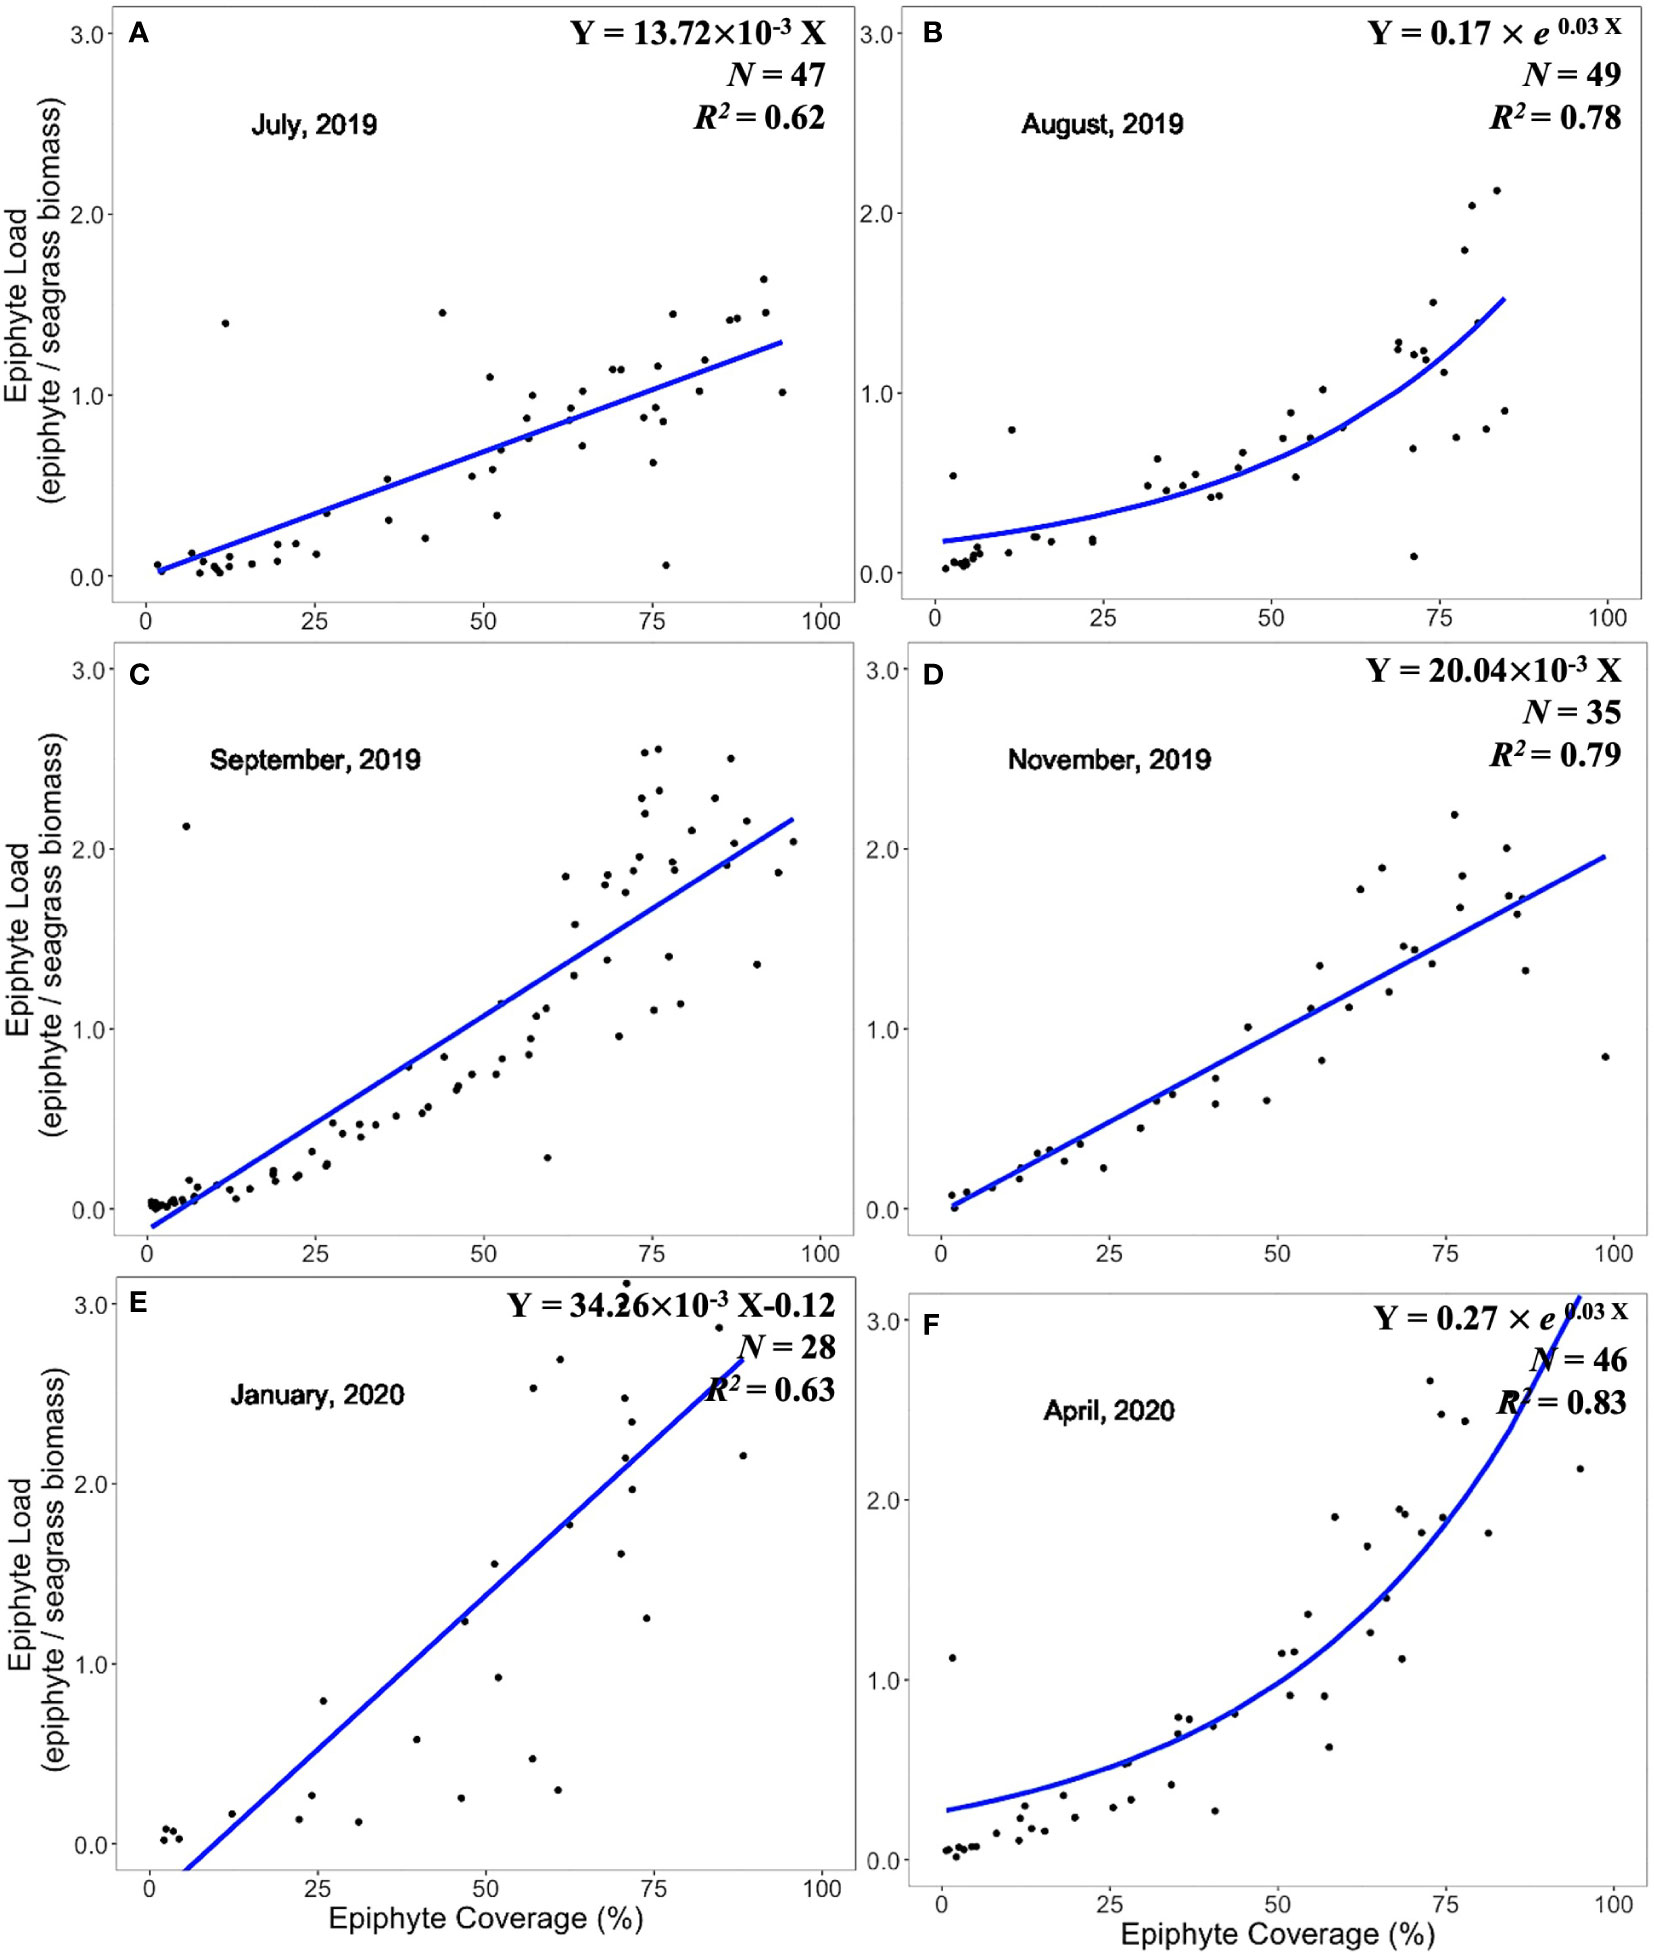
Figure 7 Linear and exponential accumulation scenarios 1 and 2, respectively, at CI site. Graphs (A-F) showed the best fitted regression of the relationship between epiphyte load and epiphyte coverage from July 2019 to April 2020.
3.5. Spatial and temporal comparisons of seagrass growth and epiphyte accumulation patterns
The observed changes in seagrass-normalized epiphyte accumulation could be due to changes in epiphyte growth, seagrass growth, or a combination of both. Figures 8–11 present different aspects of each possibility. Because sampling events at different sites did not occur simultaneously, measures were grouped by season for comparisons (Table 1). Seagrass leaf biomass and imaged seagrass leaf area presented similar seasonal patterns in general, where the high levels in Summer or Autumn declined in the transition through Winter and Spring (Figures 8–11). There were no significant differences in the seagrass leaf biomass and blade area between the “Control” area and the CI site from summer to spring (Figure 8, Table 4). The leaf biomass in the WWTP area was significantly higher than at the “Control” area and the CI site in the summer (df = 2, F = 8.10, p < 0.05) and autumn (df = 2, F = 10.06, p < 0.05), but it decreased strikingly and exhibited significantly lower value than the other two locations in the winter (df = 2, F = 3.40, p < 0.05) (Figure 8). In the spring, there was no significant difference in the leaf biomass among the three locations (Table 4).
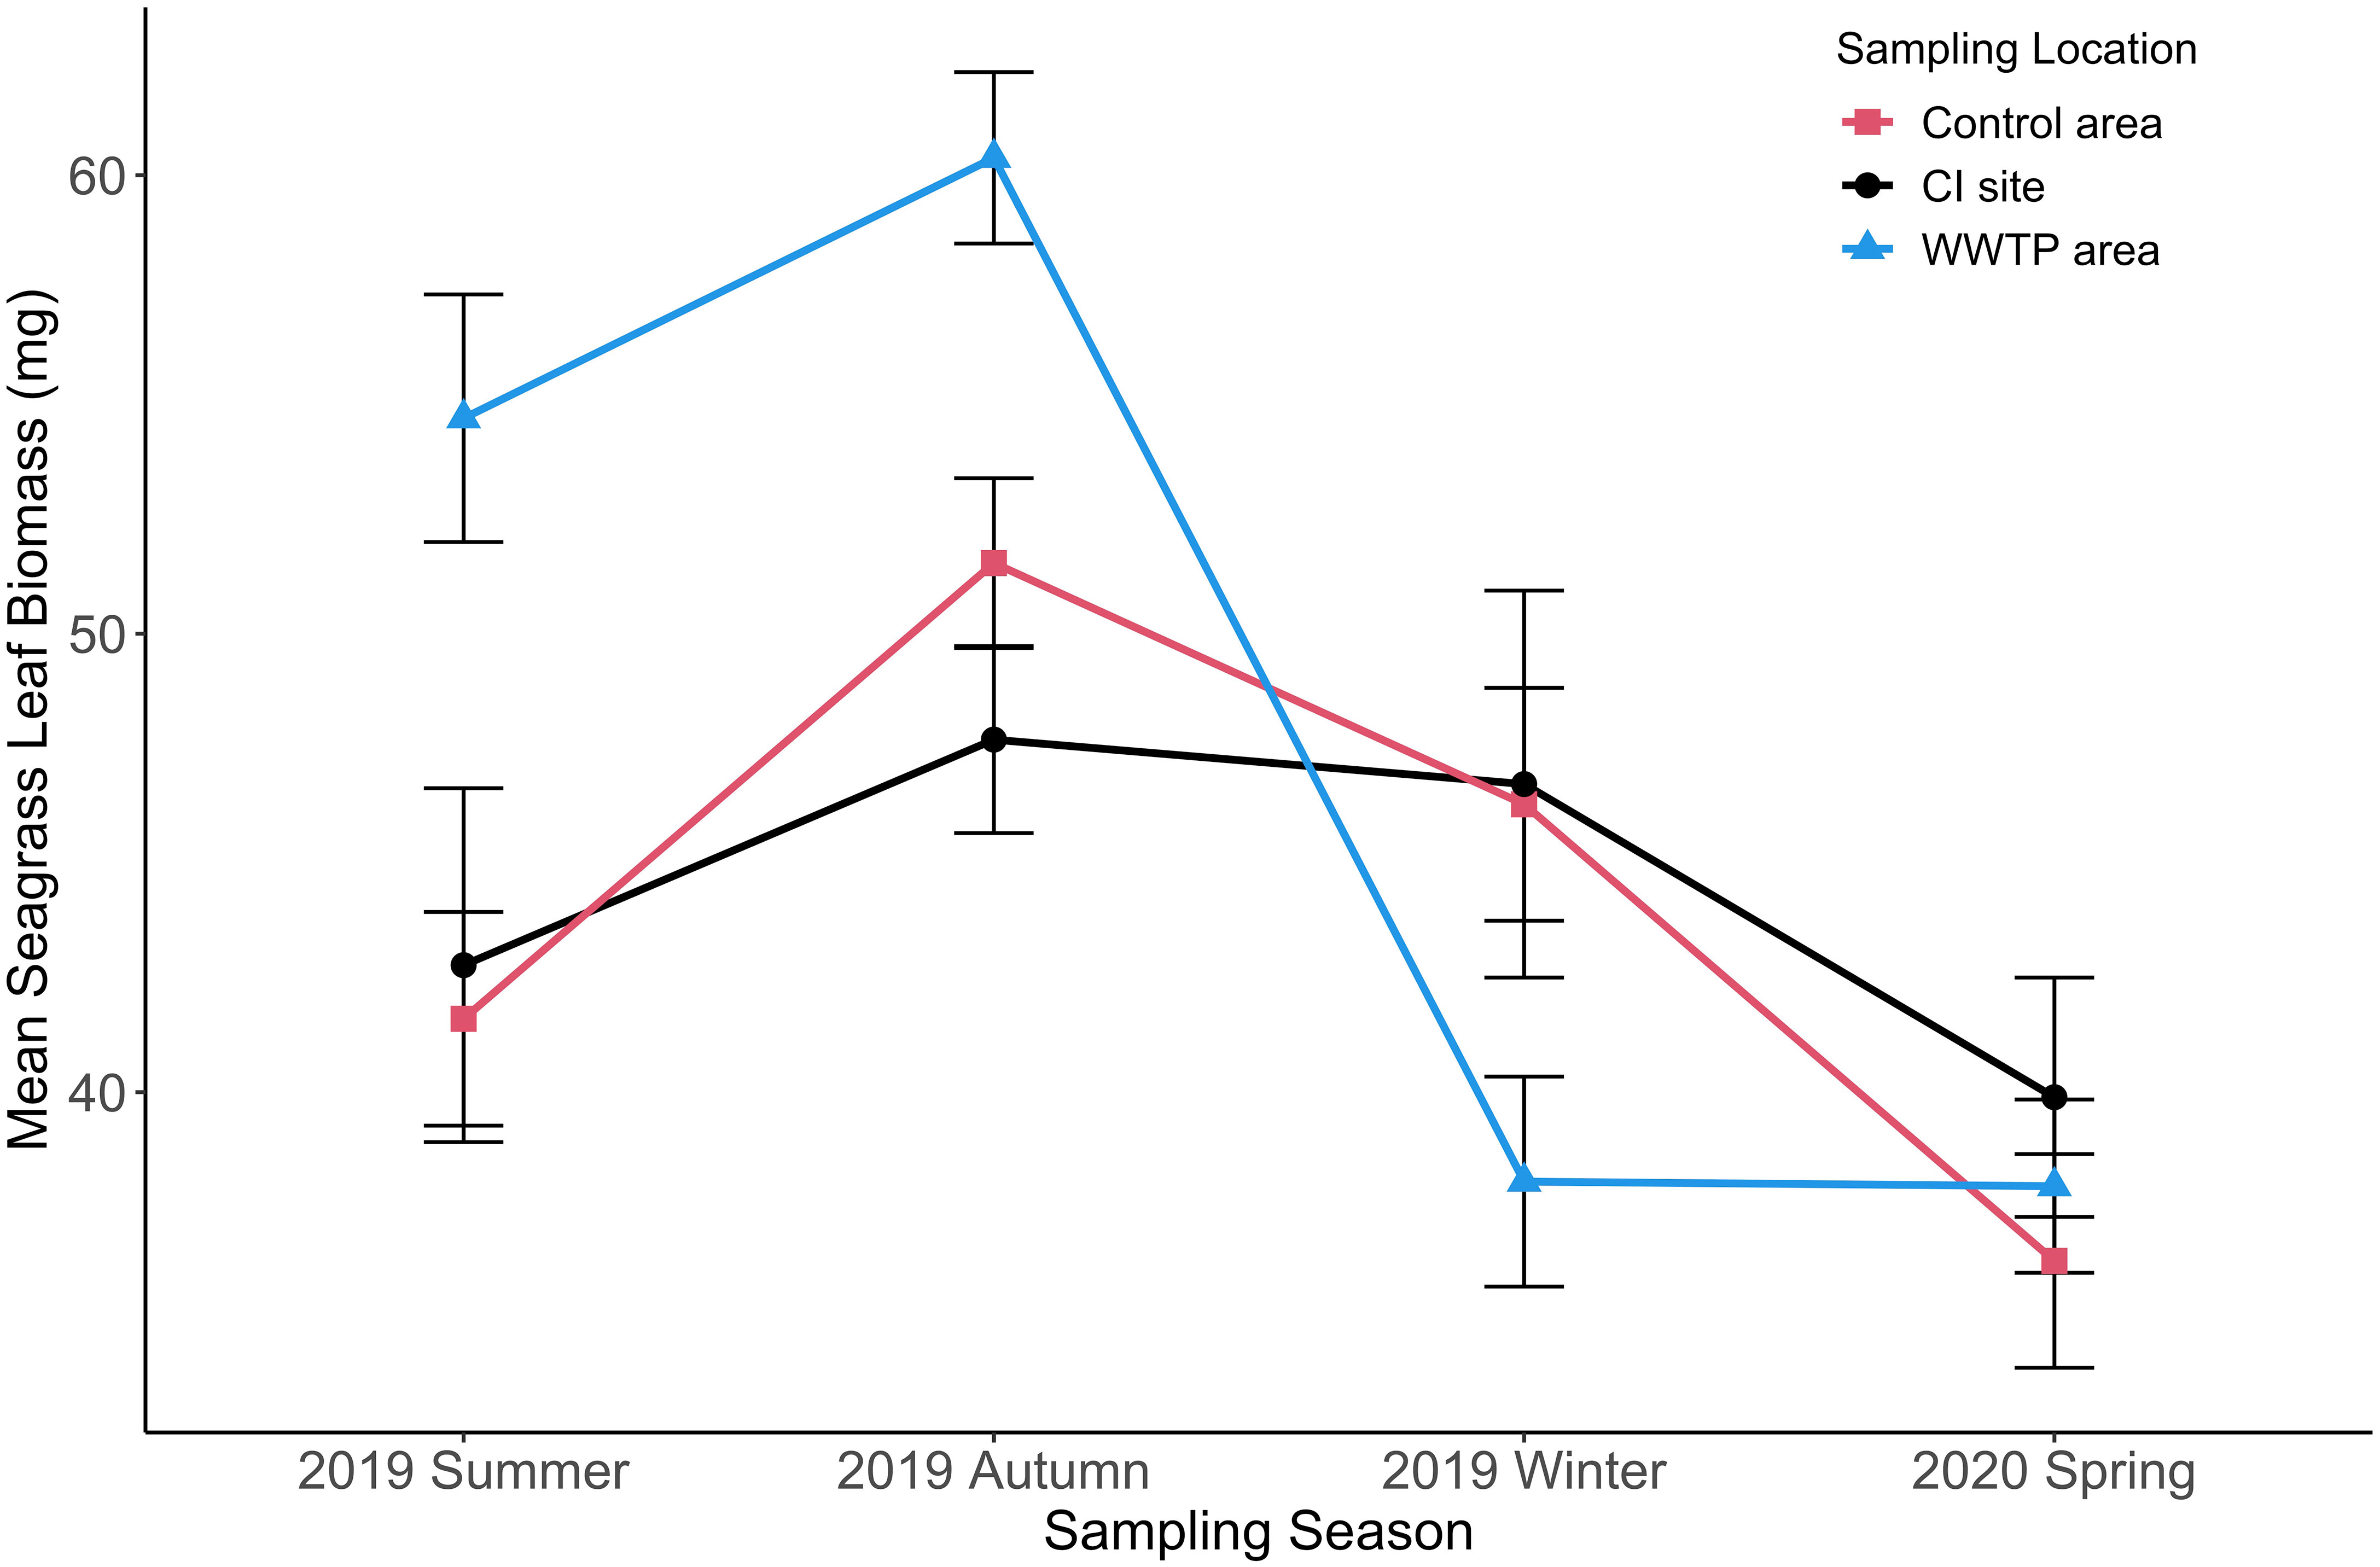
Figure 8 Mean seagrass leaf biomass (+/-SE) for three sampling locations from summer to spring. (n = 2062).
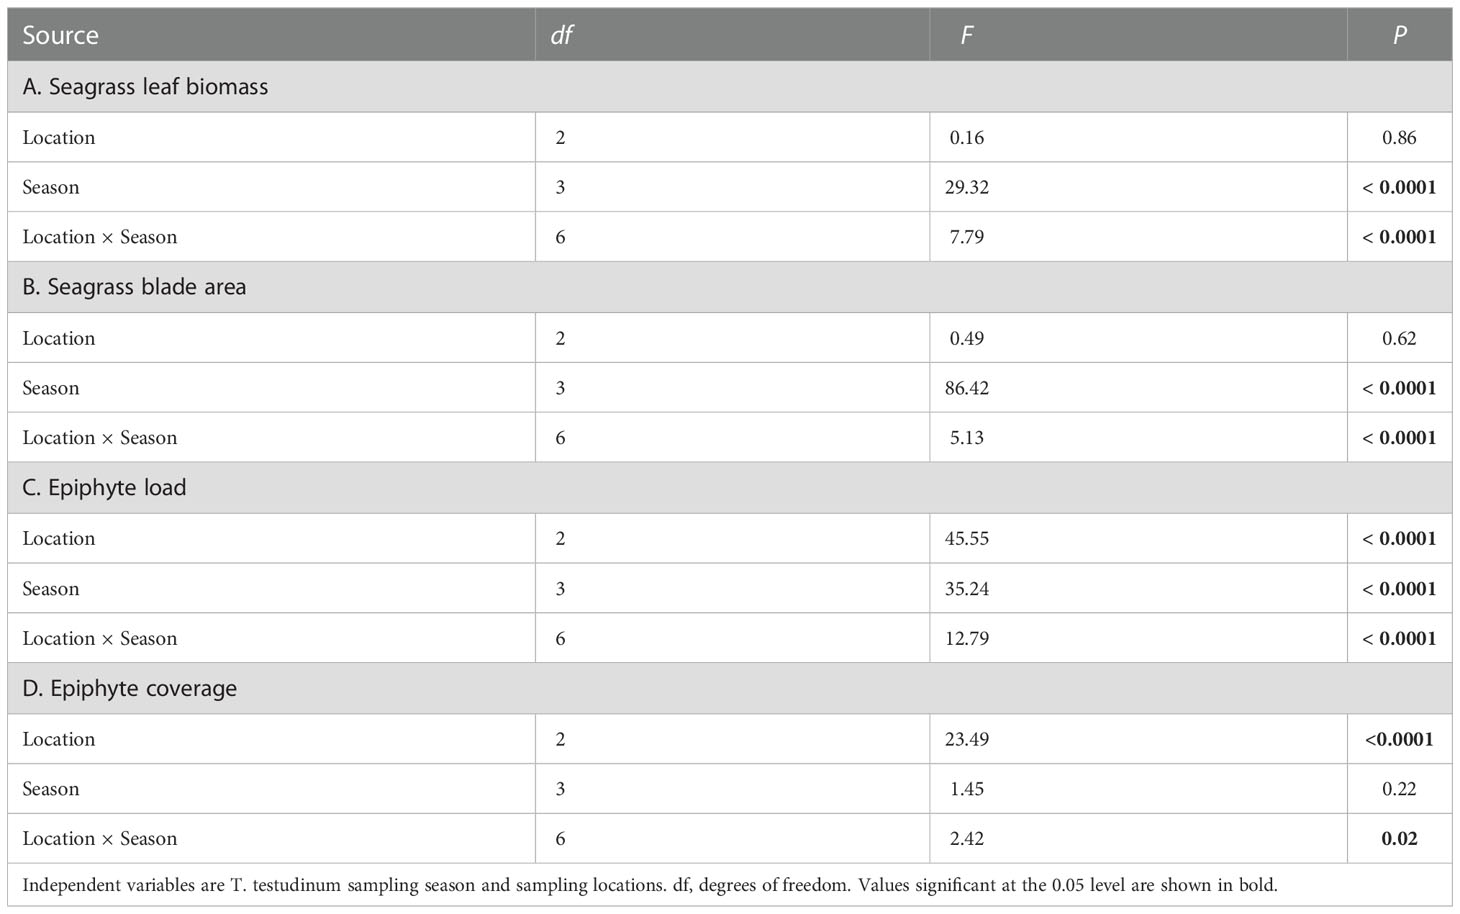
Table 4 Two-way ANOVA for Thalassia testudinum leaf biomass (g) and blade area (pixels), epiphyte load, and epiphyte coverage (%) variables.
The blade area also did not exhibit a significant difference between the “Control” area and the CI site from summer to spring (Figure 9; Table S2). In the “Control” area (df = 3, F = 5.95, p < 0.05) and the CI site (df = 3, F = 16.50, p < 0.05), the blade areas were both significantly higher in the summer and autumn than in the winter and spring (Figure 9). The blade area from the “WWTP” area was significantly higher than from the “Control” area and the CI site in the autumn (df = 3, F = 11.60, p < 0.05). A sharp decrease in average blade area from the “WWTP” area was observed in the transition to winter when the blade area was significantly lower than at the other two locations. Generally, the seasonal changes of leaf biomass and blade area among three sites with different environmental conditions were similar, with high values in summer and autumn which significantly decreased in winter and stayed low through April (Table S2).
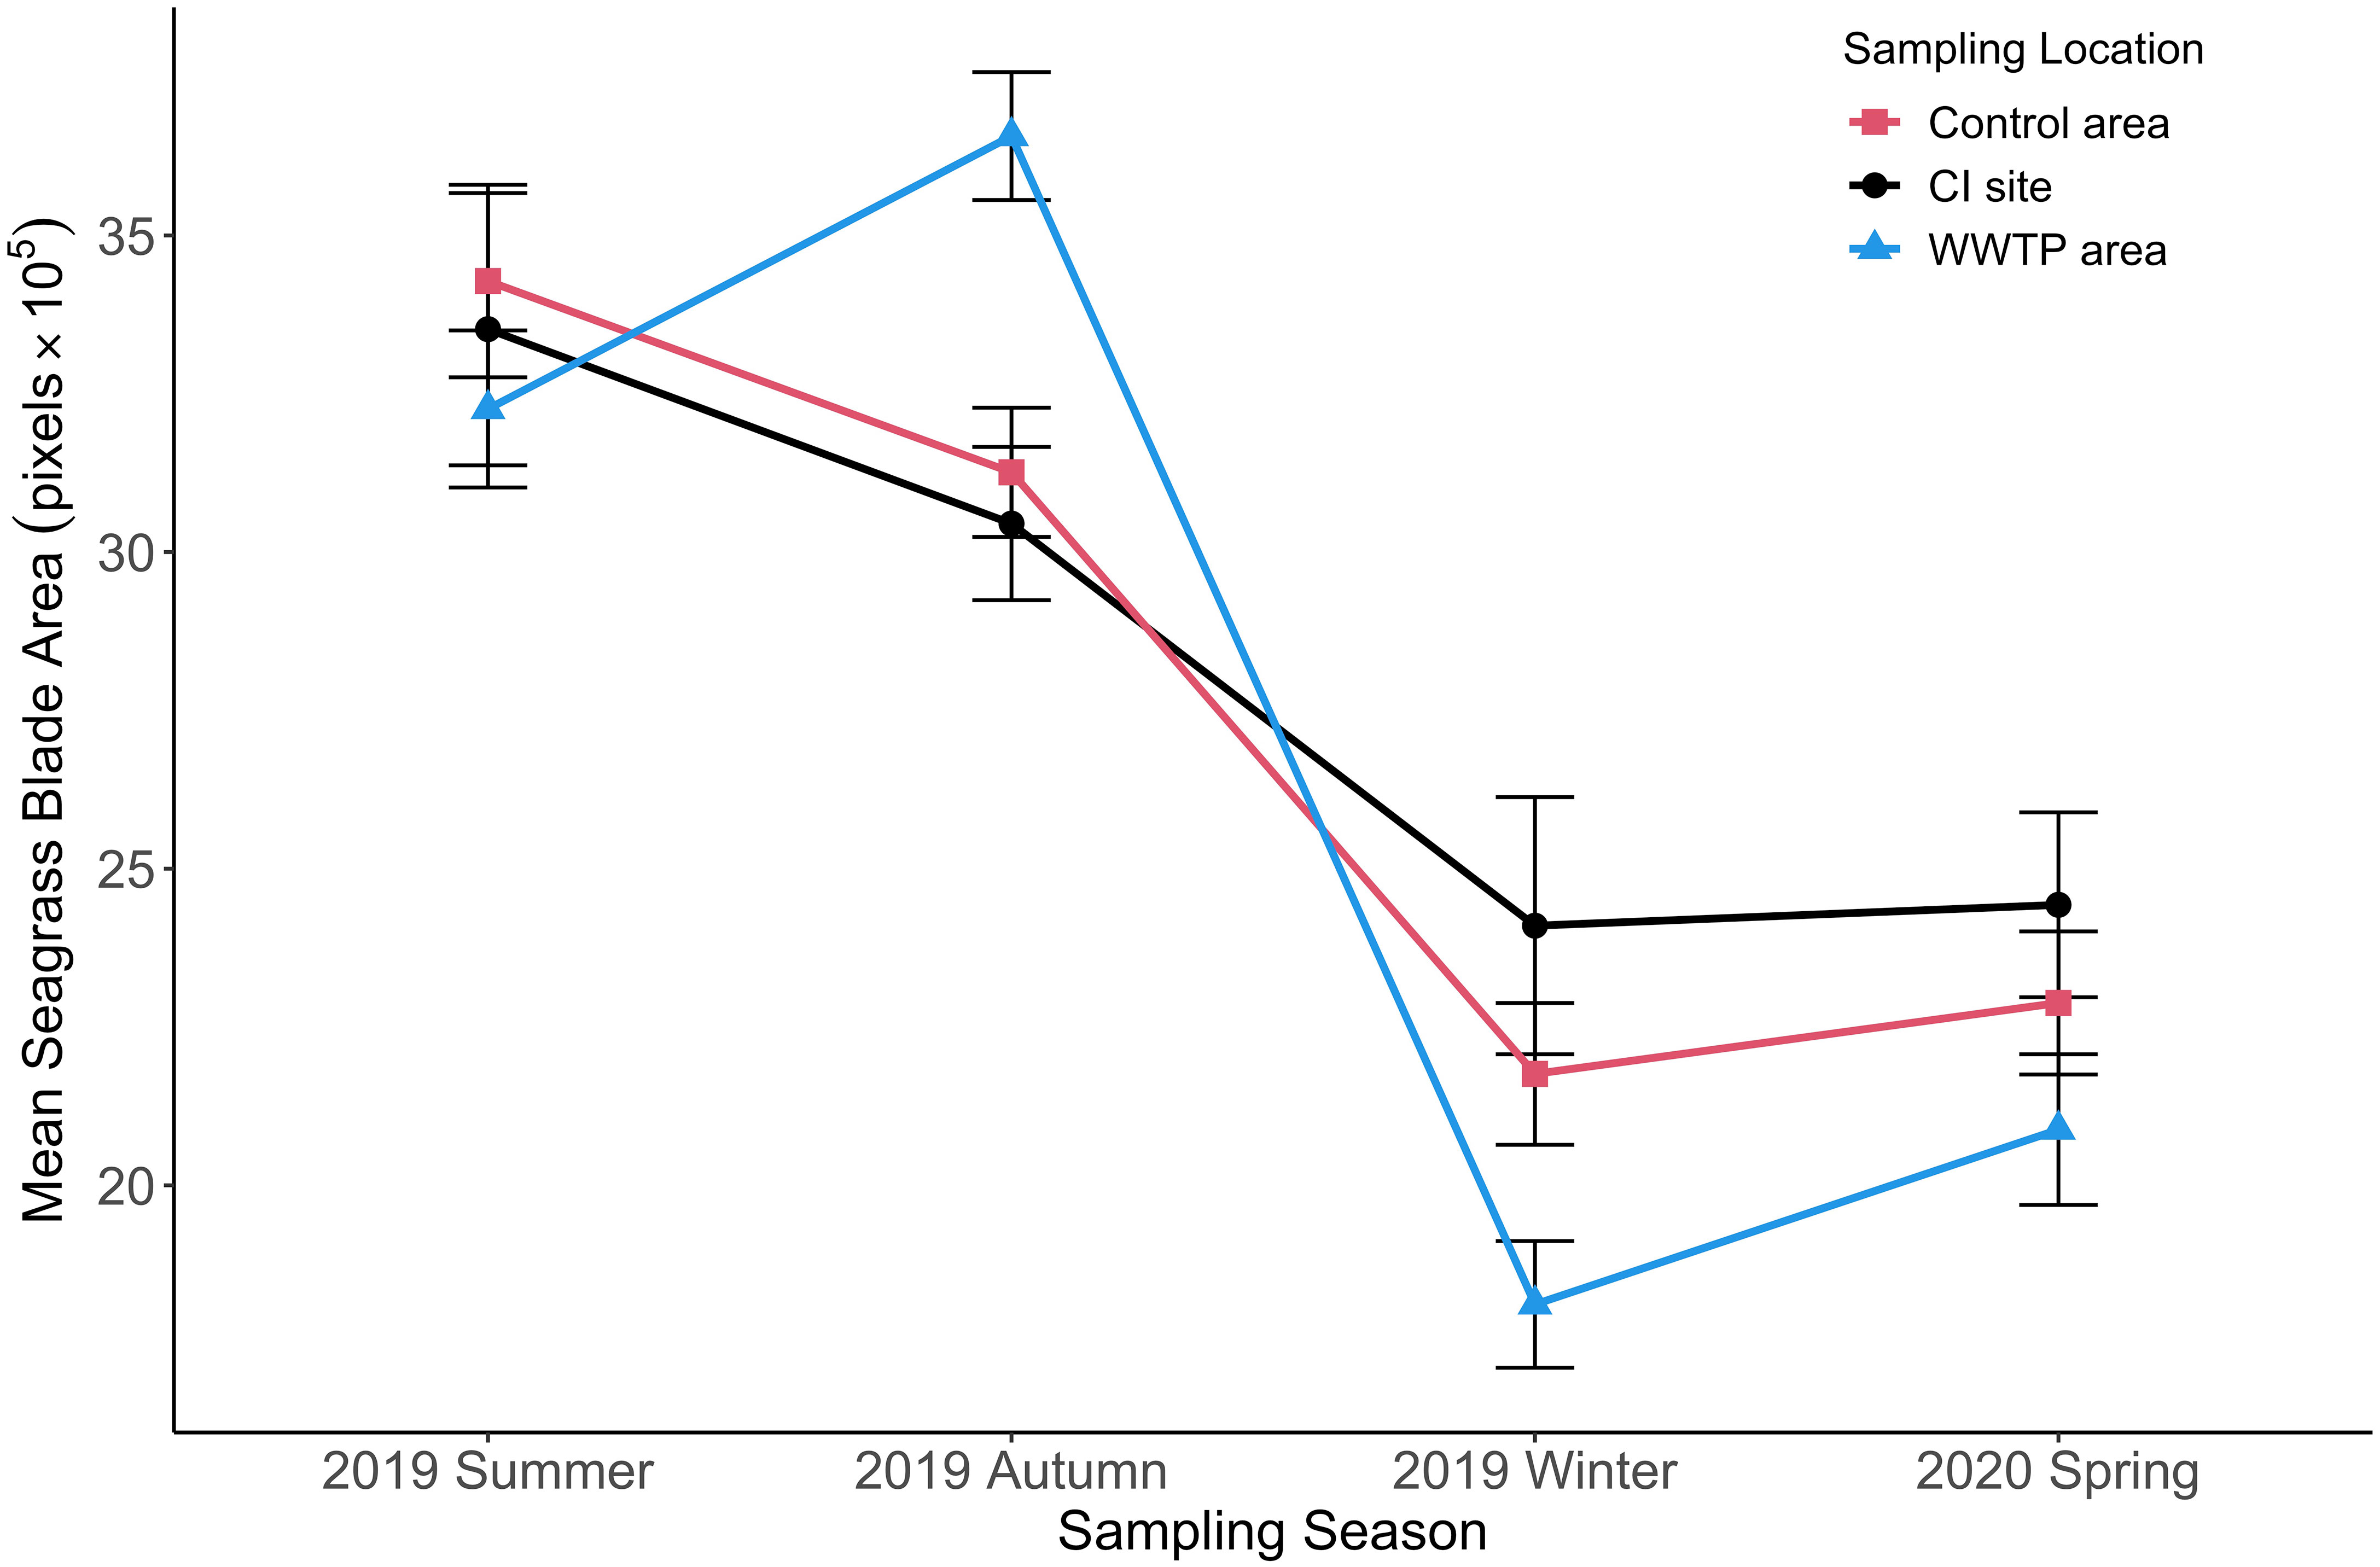
Figure 9 Mean seagrass blade area (+/-SE) for three sampling locations from summer to spring. (n = 2055).
Seasonally aggregated observations of epiphyte accumulations expressed as epiphyte load and epiphyte coverage of leaves showed different patterns by season and site (Figures 10, 11). Epiphyte loads (epiphyte biomass relative to seagrass biomass) presented an inverse temporal pattern compared to seagrass growth. There were significant differences in epiphyte load among the three sampling locations (Figure 10; Table 4). Epiphyte loads at the CI site were significantly higher than at the “Control” area and “WWTP” area in all seasons (df = 2, F = 70.64, p < 0.05). Opposite to the seagrass growth pattern, the epiphyte load pattern increased significantly (df = 2, F = 25.89, P < 0.05) in the winter (Figure 10), except for the “Control” area, where epiphyte load did not change significantly in winter but was instead highest in the spring. On the contrary, the epiphyte load in the “WWTP” area decreased from winter to spring and was significantly lower than in the other two locations in the spring (df = 2, F = 8.03, p < 0.05). Overall, epiphyte loads exhibited seasonal changes inverse to the seagrass growth. The CI site had the greatest epiphyte/seagrass biomass ratio, whereas the “WWTP” area had the lowest values except in the winter.
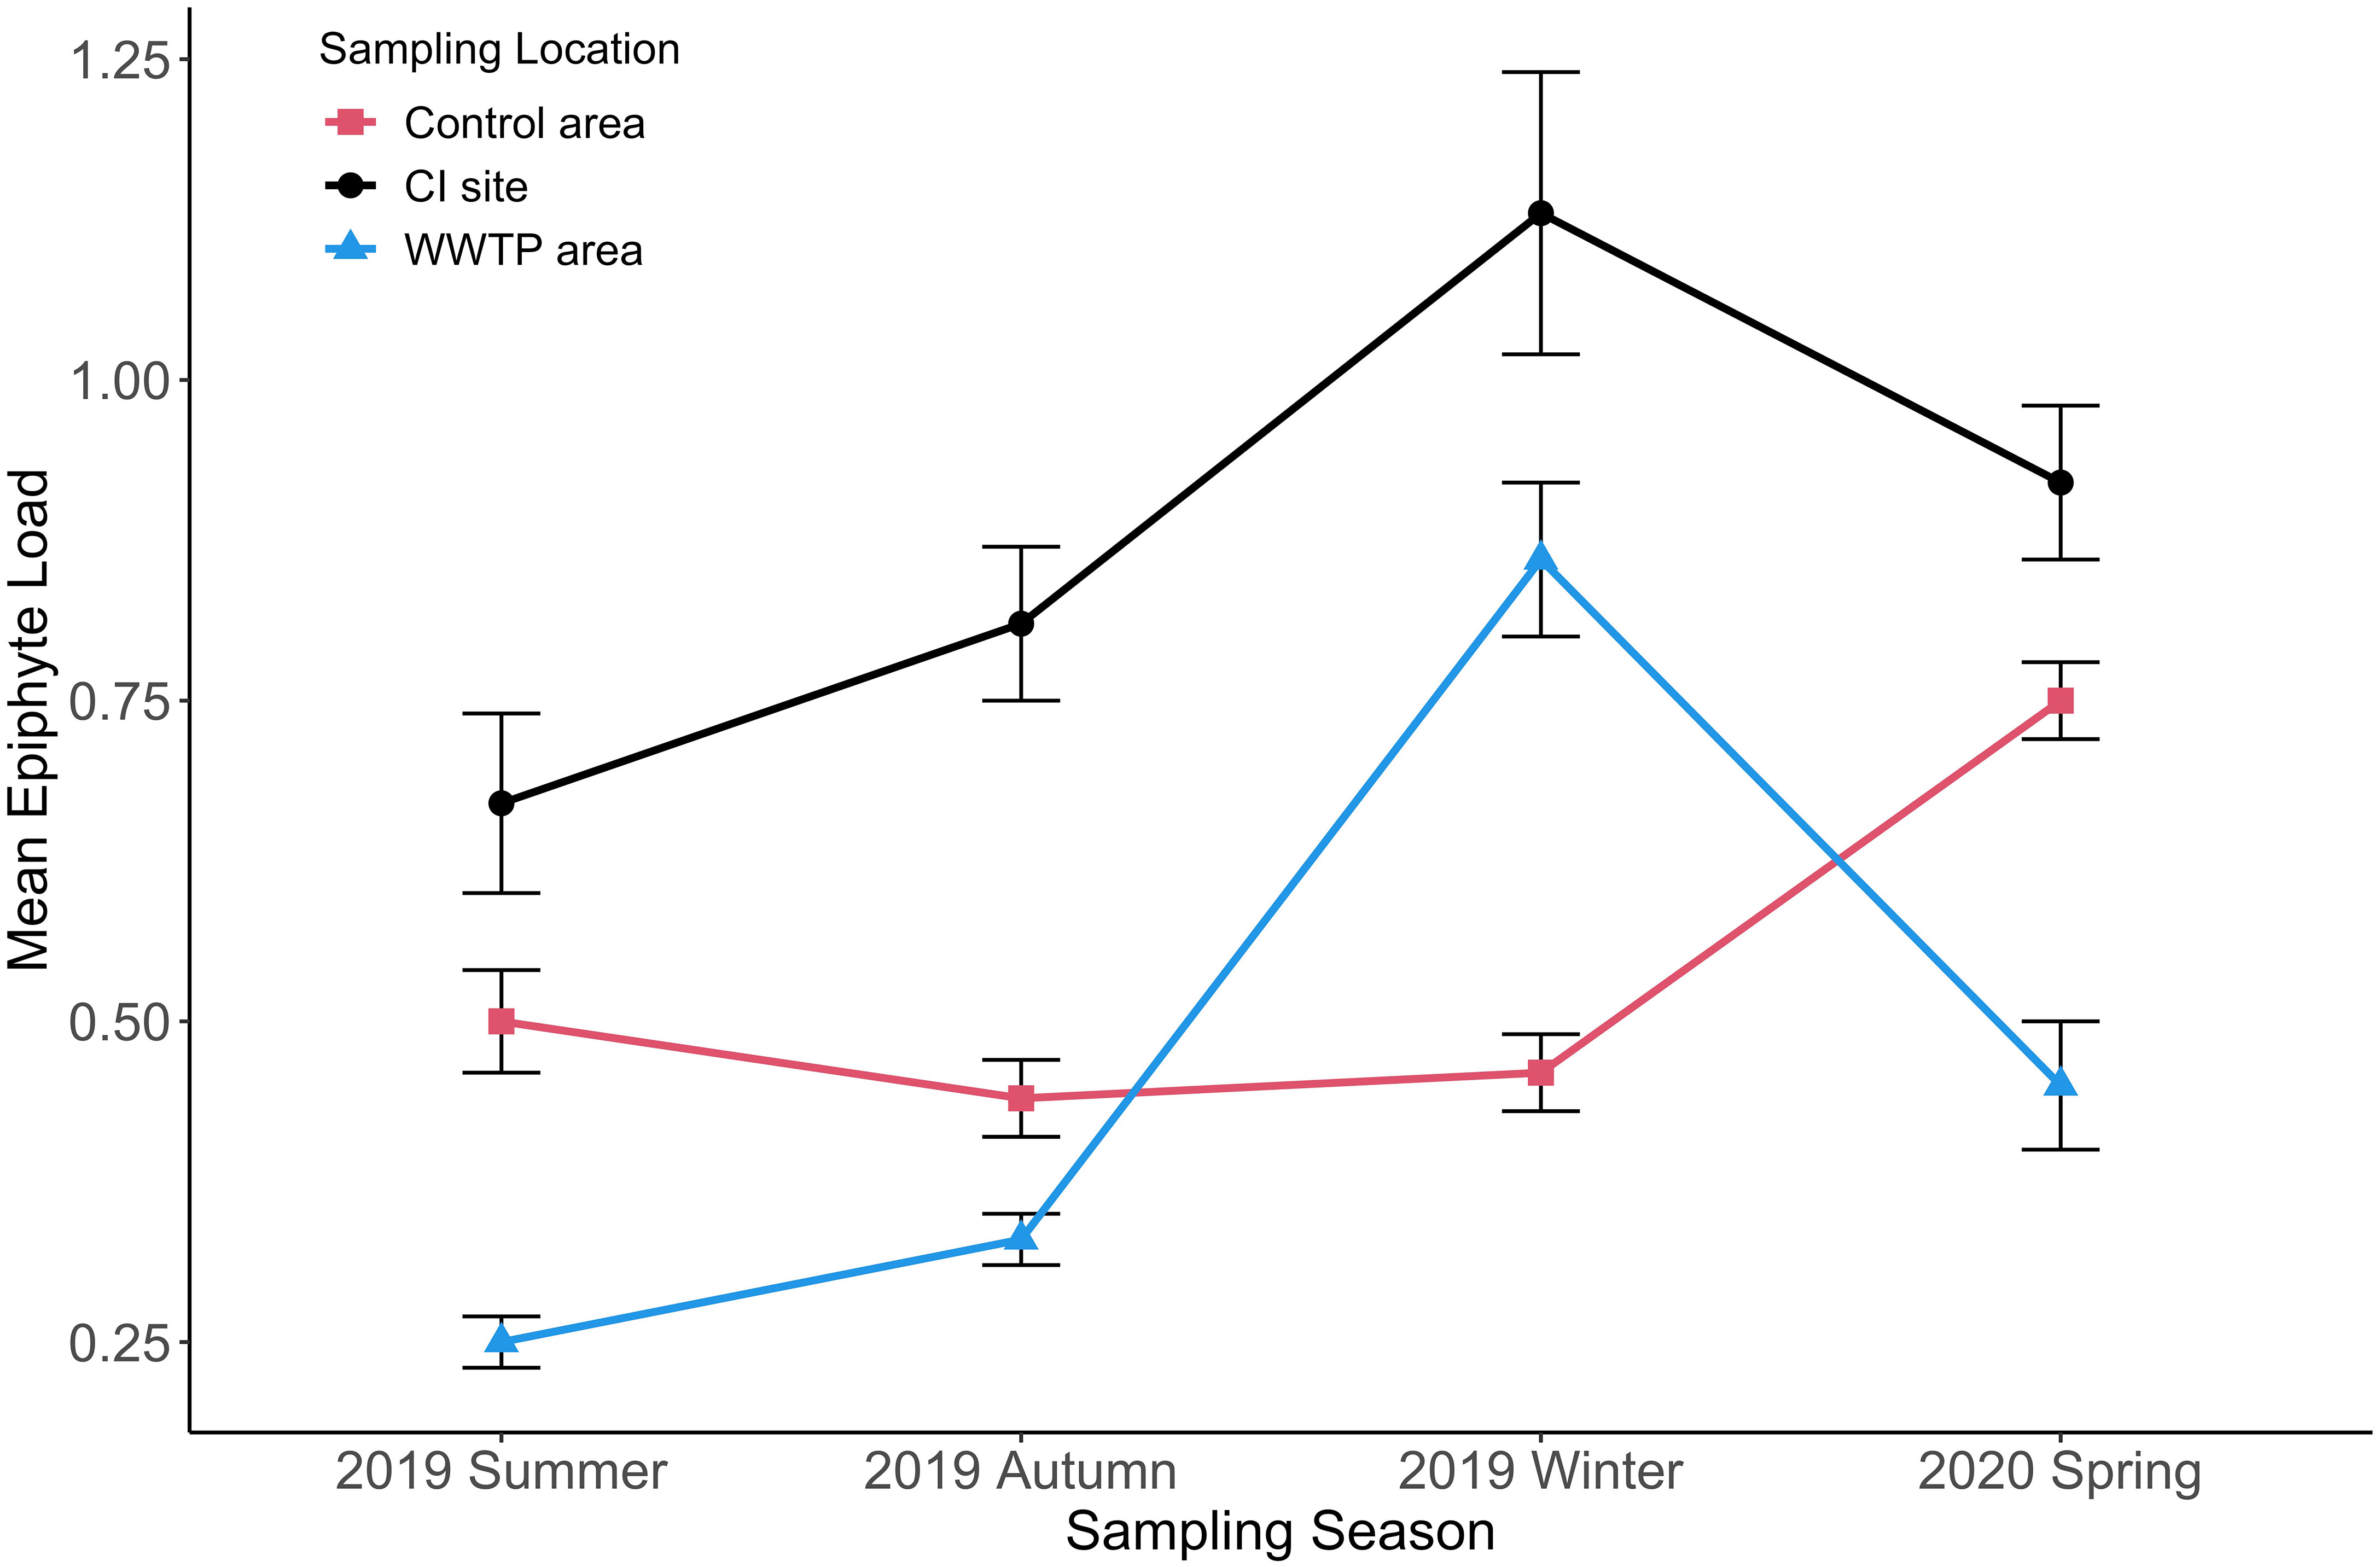
Figure 10 Mean epiphyte load (+/-SE) for three sampling locations from summer to spring. (n = 1833).
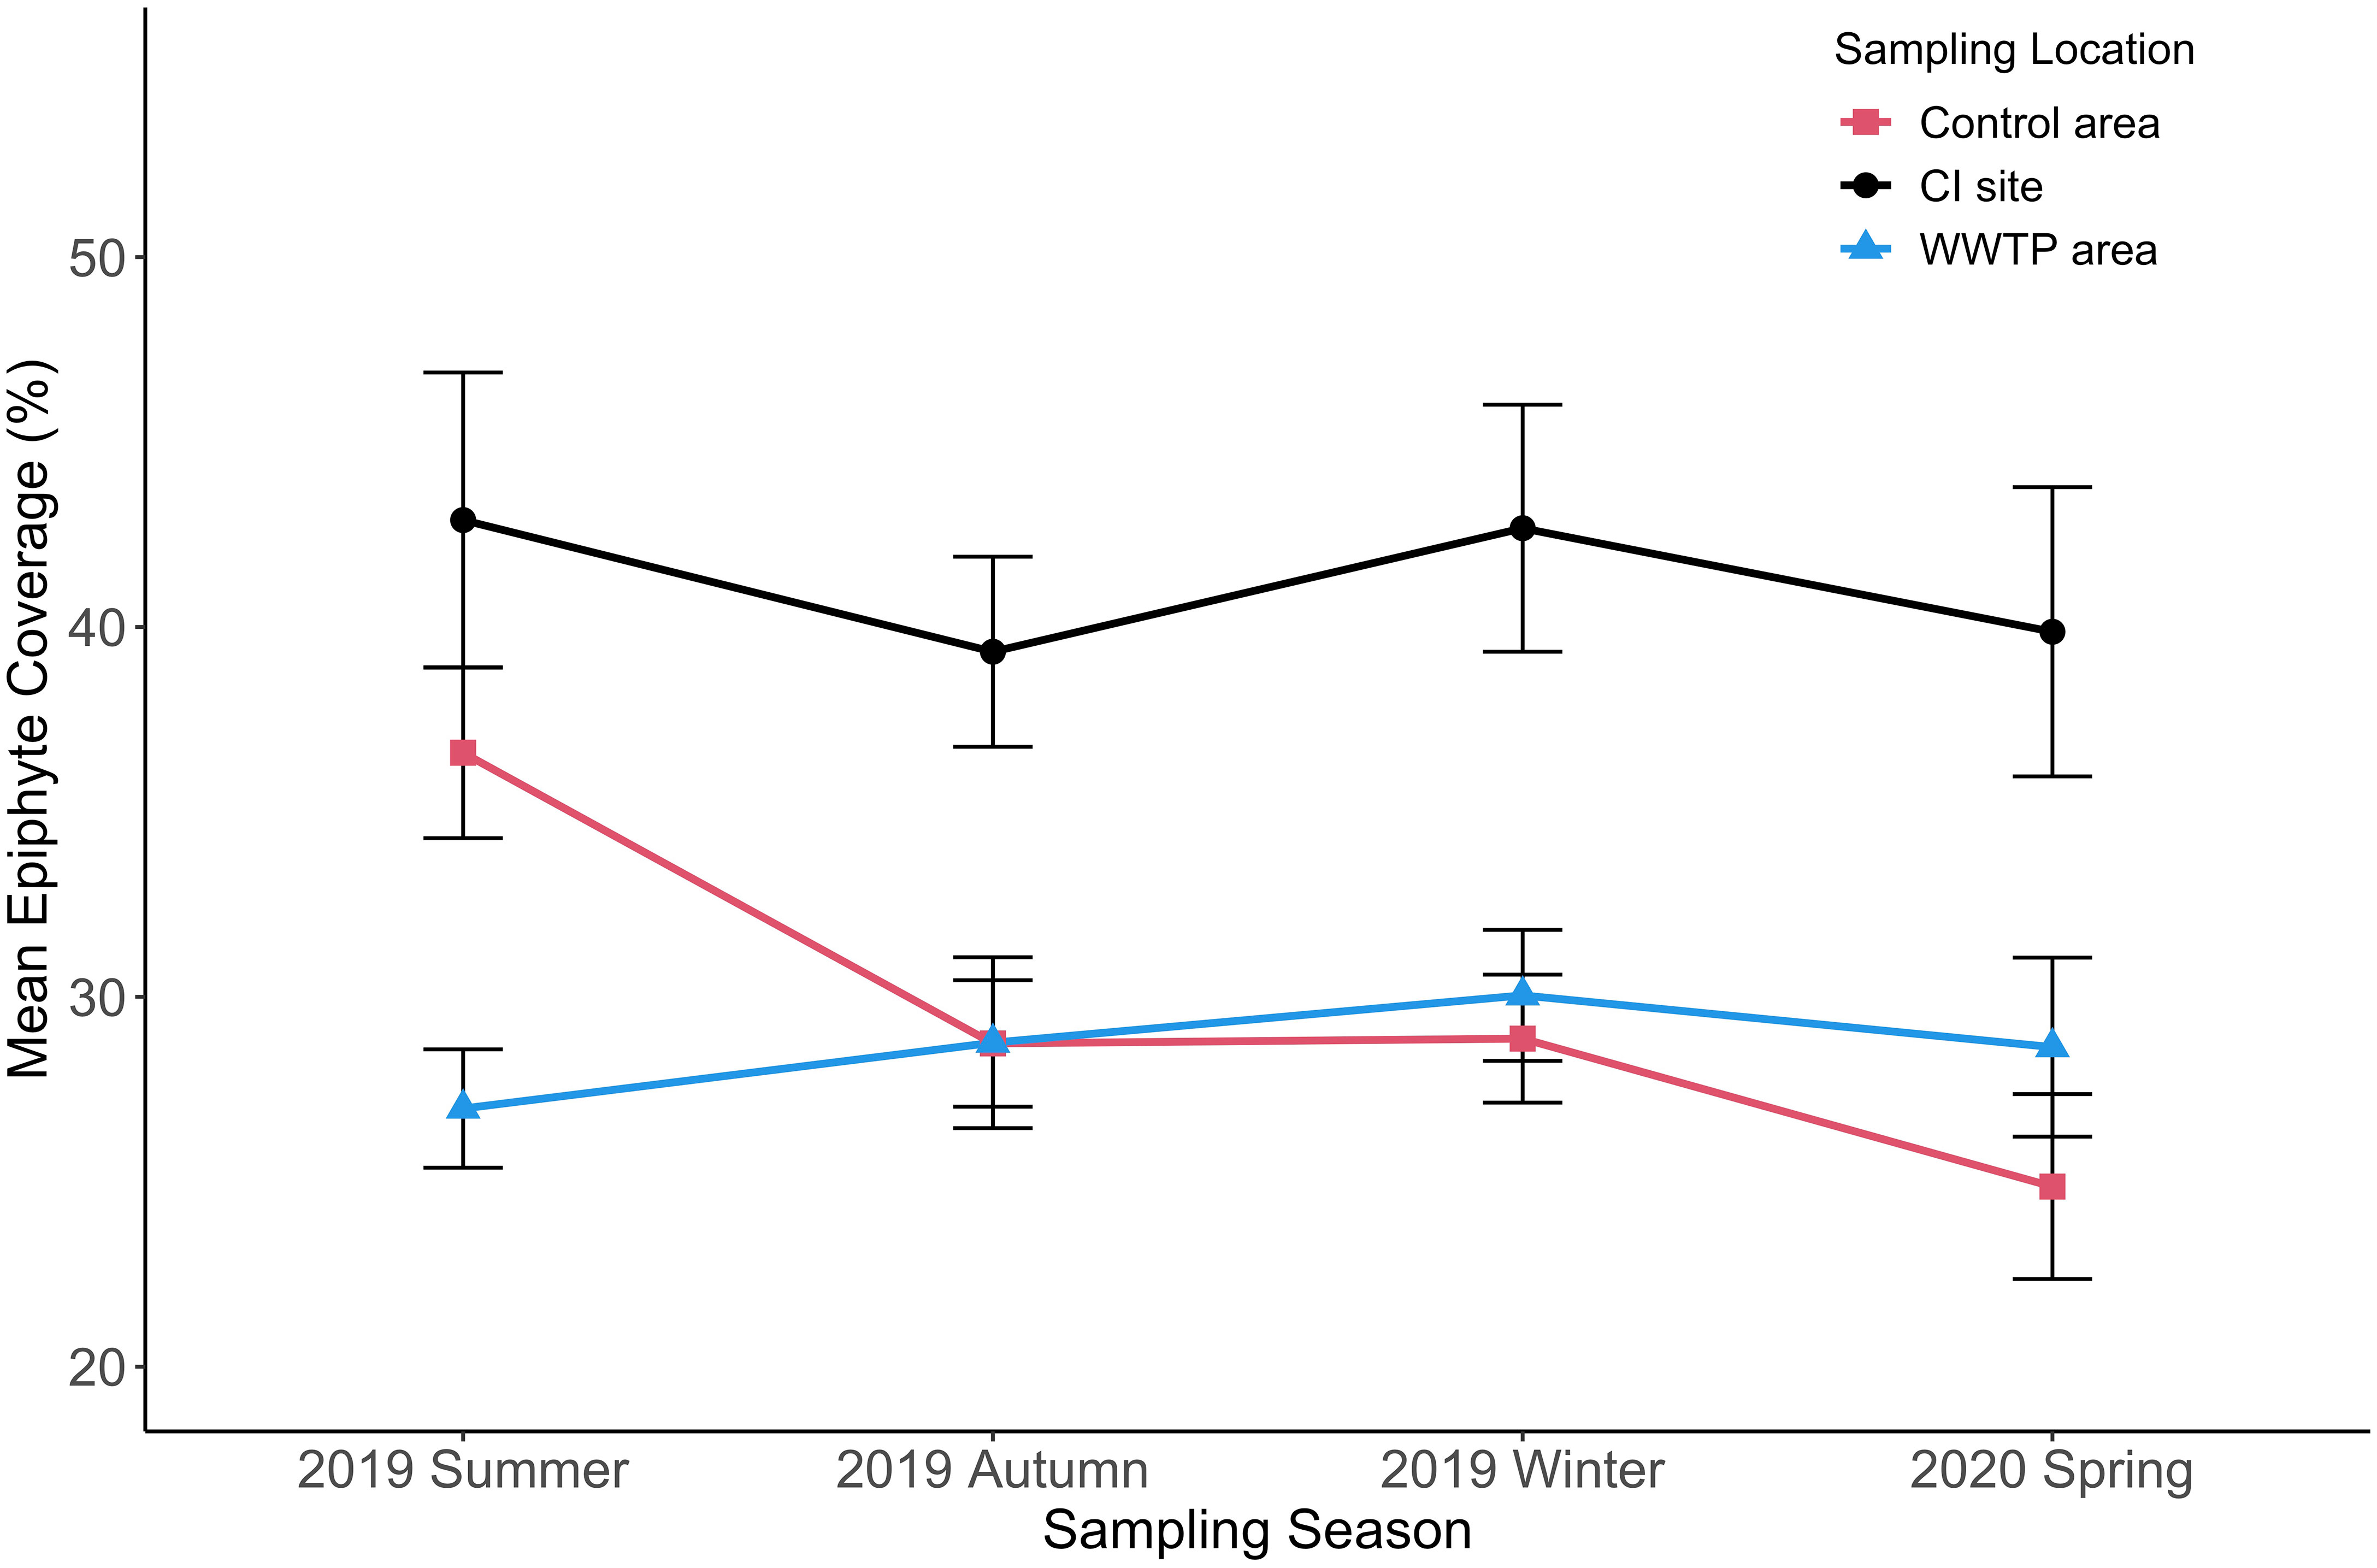
Figure 11 Mean epiphyte coverage (+/-SE) for three sampling locations from 2019 summer to 2020 spring. (n = 2001).
Epiphyte coverage (Figure 11) did not show a significant seasonal change but was affected by the environments of the three sampling locations. Across sampling periods, epiphyte coverage was highest at the CI site. This difference was significant in all seasons (Table 4). The epiphyte coverage in the “Control” area was significantly higher than in the WWTP area in the summer (df = 2, F = 10.21, p < 0.05) and then there were no significant differences in epiphyte coverage from autumn to spring. Even though the seasonal pattern of epiphyte coverage was not similar to that for epiphyte load, these two indicators both ordinated the CI site as highest across all seasons (Figure 11, Table S2). The relative consistency in epiphyte coverage across seasons (CI varied from ~40 – 45%; WWTP varied from ~25 – 30%; Control varied from ~25 – 35%) highlights a unique aspect of the complicated epiphyte-seagrass relationship that is not readily apparent from biomass measurements.
4. Discussion
This study measured epiphyte accumulation patterns via image analysis to quantitatively distinguish the uncovered leaf areas from those colonized by diverse epiphytes. Comparisons to biomass-based epiphyte accumulation metrics among sites of different environmental influences revealed different response patterns and insight into the spatiotemporal dynamics of the epiphyte-seagrass relationship. Both types of metrics were correlated for both seagrasses and epiphytes, but the latter relationship varied between linear and exponential with site- and season-dependent patterns. The two modes of correlation (linear vs. exponential) can be explained by the super-imposition of seasonal leaf growth patterns of the seagrass host, and successional epiphyte growth (new layers), filamentous growth, and/or community compositional changes towards denser (e.g., calcareous) epiphytes. The mean % leaf coverage by epiphytes varied in a narrow range ( ± 10%) across seasons, in contrast to the strong and opposing seasonal variations observed for biomass metrics of seagrasses and epiphytes. Importantly, the relatively consistent leaf coverage metric ordinated the major site difference of greatest epiphyte accumulation at CI irrespective of the season. Compared to image-based % leaf cover, the seagrass and epiphyte biomass metrics showed greater variability compounded by the large and opposing seasonal growth changes. These results suggest that leaf growth is regulated to maintain the proportion of uncolonized leaf surface (Fong and Harwell, 1994; Biber et al., 2004).
The observed spatiotemporal variability of seagrass growth and epiphyte accumulation suggested that multiple environmental variables affect the seagrass-epiphyte relationship with complex dynamics. Environmental variables compared included water temperature, depth, salinity and sediment porewater nutrients. Decreasing seasonal temperatures were correlated with diminished seagrass leaf biomass, and an increased slope of epiphyte accumulation at all sites. Porewater nutrients exhibited significant site differences in phosphate and the DIN/phosphate ratio. Phosphate was most enriched in the porewater at the WWTP area, where the highest maximum seagrass biomasses were found. In contrast, the greatest porewater DIN/phosphate ratio, observed at the CI site, corresponded to the greatest epiphyte accumulations. Porewater at the Control site had lower but nonsignificant DIN compared to the CI site, but a significantly different DIN/phosphate ratio that was between those of WWTP and CI, much like the epiphyte load metric in that area.
The explanation most consistent with all observations is that seagrass growth correlated with porewater phosphate levels, and was negatively impacted by low temperatures, whereas the epiphyte community accumulation as a whole is correlated with the DIN/phosphate ratio and relatively unaffected by the winter temperatures observed here. This explains a high slope and exponential accumulation of epiphyte biomass in the winter. But this epiphyte accumulation pattern was also observed in late summer at “Control” and CI sites. This could be explained by highly active levels of both seagrass leaf and epiphyte growth, with successional secondary colonization occurring to a high degree in the warm waters. Two major unknowns that require further definition are the knowledge of how the epiphyte community changes and what role invertebrate or fish grazers play in controlling the epiphyte accumulation and community composition at these sites. Our unpublished fluorescence and 18S and COI metabarcoding data suggest that the algal epiphyte communities differ in the proportions of green and red algae, and that there are greater relative abundances of invertebrates at the Control and CI compared to WWTP.
4.1. Comparative metrics for epiphyte accumulation and epiphyte-seagrass relationship
The seasonal shift in seagrass-epiphyte dynamics evaluated by image analysis in this study is consistent with previous studies on multiple seagrass species, (Bulthuis and Woelkerling, 1983; Lee and Dunton, 1996; Moore and Wetzel, 2000; Hasegawa et al., 2007). Image analysis has the potential to unlock a wealth of knowledge regarding the seagrass-epiphyte dynamic relationship if it can be applied to detect changing epiphyte community composition with environmental conditions.
For all three sampling locations, the slopes of linear regressions of epiphyte biomass vs. epiphyte pixels changed in a consistent seasonal pattern where the slope increased with progression from autumn through winter. The observation of increased epiphyte biomass per unit of epiphyte-covered area is consistent with continued epiphyte growth despite observed decreases in seagrass leaf growth and production during winter and early spring (Figures 5–7). Cooler water temperatures (and perhaps shorter days/lower light levels) may be critical environmental factors diminishing leaf growth (Zieman, 1975; Marbà et al., 1994; Zieman et al., 1999; Koch and Erskine, 2001; Kim et al., 2020). However, these observations could also be partly explained by shifts in the epiphyte community composition that increase biofilm “thickness” and/or density of the epiphyte biofilm per unit area of leaf coverage as previously observed (Corlett and Jones, 2007; Giovannetti et al., 2010). The epiphyte biofilms in this study varied from 14 – 70 ng biomass per pixel. The highest epiphyte biomass per epiphyte area (pixels) was observed at the CI site (Table S2), which had significantly highest DIN/Phosphate ratio as well as unique influences from proximity to oysters and hydrodynamic disturbance from boat traffic in the ICWW.
Changes in the relationship between epiphyte load and epiphyte coverage are attributed to two types of epiphyte-seagrass dynamics under different seasonal conditions (Figures 5–7). In the first accumulation scenario (typical of most samples from August – December), the strong linear relationship between epiphyte load and epiphyte coverage implied that primary epiphyte colonization on the available seagrass leaf surface was dominant due to the growth of new leaf surface (Table 3).
In the second epiphyte accumulation phase, indicated by fitting exponential regressions of epiphyte load with epiphyte coverage for several specific sites and times, the model clearly demonstrates a strong tendency for accumulation of epiphyte biomass more rapidly than the expansion of epiphyte coverage. Epiphyte coverage of leaves saturates if leaf growth slows relative to the primary colonization rate. Existing epiphytes continue to grow in size, thickness and/or density (e.g., calcareous) in an orderly succession with three or more layers (Willcocks, 1982; Kitting et al., 1984; Corlett and Jones, 2007; Saha et al., 2019). On older leaves where growth has slowed, stopped, or even reversed (senescence), epiphyte biomass accumulates via further secondary colonization and growth contributed by filamentous algae and invertebrates (Novak, 1982; Armitage et al., 2006; Whalen et al., 2013), while the underlying primary coralline algae eventually die (Borum, 1987). It is not uncommon for epiphyte biomass to exceed seagrass biomass (Figures 5–7; Kitting et al., 1984; Moncreiff et al., 1992). A community shift to a greater abundance of filamentous algae and/or heavier calcareous epiphytes, such as serpulid worms, would potentially increase both biomass and biological diversity.
While previous reports suggested a higher biomass accumulation rate of epiphytes on seagrass leaves in the summer (Heijs, 1984; Hasegawa et al., 2007), our observations noted a reverse seasonal pattern of maximum epiphyte accumulation, relative to seagrass growth, in the winter and spring seasons, coinciding with most observations of exponential correlations. The exceptions of the August exponential correlations at the “Control” and CI sites suggests that there are multiple environmental scenarios that can produce a similar physiological outcome. Shading is not the only impact of epiphyte biofilms. Availability of O2, CO2, or other gasses might be linked to localized necrosis or the initiation of leaf senescence to avoid excessive consumption of stored plant reserves. The recent works of Brodersen (Brodersen et al., 2015; Brodersen et al., 2020) have expanded on old ideas (Sand-Jensen, 1977) about epiphyte biofilms altering gas exchange and leaf physiology. Such measurements, alongside transcriptomic profiling (Crump et al., 2018) are likely to reveal underlying physiological regulatory mechanisms unique to seagrasses.
For the shift from the first to second accumulation scenarios of epiphytes, it is unclear whether the leaf stops growing due to environmental factors, allowing epiphytes to accumulate exponentially, or if the epiphytes outgrow the seagrass and reduce light to the point of reducing seagrass leaf growth. The two patterns may also occur simultaneously on different parts of the same long leaf, which could be further investigated with the imaging approach. However, even with the heaviest epiphyte accumulations, coverage only rarely reaches 100% (on senescing leaves), and the basal 5 cm of Thalassia testudinum leaves (near the leaf sheath) is usually not visibly covered by epiphytes. This two-phase epiphyte accumulation may imply an existing threshold or trigger point for the balance between leaf growth response to epiphyte shading and leaf senescence. Accordingly, environmental effects on seagrasses and epiphytes are considered separately below.
4.2. Environmental effects on seagrass growth
The seasonal growth pattern of T. testudinum at all locations, maximum in the summer and early autumn followed by a decline through winter or early spring (Figures 8, 9), is widely observed (Herzka and Dunton, 1997; Fourqurean et al., 2001) and may be initiated by low temperature and/or salinity (Fernández-Torquemada and Sánchez-Lizaso, 2005), with the former most likely in this study (Tables 1, 3; Figures S2, S3). Slow recovery of leaf area in April is consistent with photosynthesis rates at sub-optimal water temperature (23° C) (Herzka and Dunton, 1997; Campbell et al., 2006; Collier and Waycott, 2014; Rasmusson et al., 2020). Decreasing temperatures and salinity may have initiated the significant decline of leaf biomass and leaf area in winter and early spring (Tables 1, 3; Figures S2 and S3). Seagrass biomass was only weakly correlated with depth and salinity, but seagrass leaf area did show correlation with both temperature and salinity. The variability in thickness of seagrass blades might cause the inconsistence between the leaf biomass and areas.
Sediment porewater nutrients were measured during May under the assumption that the porewater nutrient differences would reflect the long-term exposure history to water column nutrients. Seagrass biomass and leaf area were significantly higher at two of three WWTP sites during warmer water summer and autumn periods (Figures 8, 9), which correlated with the significantly greatest porewater phosphate levels at WWTP. There were no corresponding significant increases in DIN, or DIN/phosphate ratio at the WWTP site (Table 2). Likewise N content and C:N ratios did not differ significantly in seagrasses from any of the study sites (Figure 4), suggesting that all three sampling locations are replete with N (Duarte et al., 2018).
Observed differences in seagrass stable isotope ratios showed 13C significantly more depleted at CI, and 15N significantly less enriched at “Control”. The most negative δ13C values of seagrass leaves at the CI site (Figure 4), could be explained by the seagrass leaves having low light and CO2 availability due to coverage by the greatest accumulation of epiphytes (Grice et al., 1996; Lapointe et al., 2020; Premarathne et al., 2021). Carbon-limited photosynthesis would increase discrimination against 13C compared to “Control” and WWTP seagrasses. It suggests that the influence of light and/or CO2 availability caused by high epiphyte accumulations might be an important factor controlling seagrass productivity in this study. However, conditions that seem inconsistent with differential light and/or CO2 limitation are CI having the shallowest depth, as well as hydrodynamic turbulence from nearby boat traffic. The lower δ15N value of T. testudinum in the “Control” area compared to the WWTP area (and CI) might reflect the influence of the wetland used to polish the treated wastewater there. The WWTP site receives treated wastewater unpolished by wetlands, but also potential influence from a fish cleaning station and associated bird roosting.
4.3. Environmental effects on epiphyte accumulation patterns
Unlike the seasonal pattern of seagrass growth, the epiphyte load, relative to the seagrass host, presented an opposite seasonal pattern. The epiphyte load in the “WWTP” area and the CI site followed a similar seasonal pattern, with the maximum in winter and low relative epiphyte accumulation in summer (Figure 10). The increased epiphyte load from summer to winter is consistent with previous reports of epiphyte accumulation on Cymodocea nodosa and Zostera marina (Nelson and Waaland, 1997; Reyes and Sansón, 2001). Seasonal seagrass growth condition has been suggested as the primary factor controlling the temporal epiphyte accumulation pattern (Momota and Nakaoka, 2018; Bračun et al., 2021). A faster leaf turnover rate may drive a lower epiphyte load in the summer than in the winter (Duarte and Sand-Jensen, 1990; Peterson et al., 2007), which causes a shorter period for epiphyte accumulation on the available leaf surface. However, our observation of exponential epiphyte accumulation in August suggests that the lifetime of the leaf is still sufficiently long enough to be overtaken by excessive epiphyte growth. Here, “excessive growth” might be somewhat arbitrarily defined as an epiphyte/seagrass biomass ratio > 1, but this value approximates the point of deviation from a linear accumulation response (See Figures 5–7).
Epiphyte colonization may be secondarily controlled by environmental conditions such as the DIN/phosphate ratio in this study (Biber et al., 2004). Despite the acute decline of seagrass leaf area in the winter and spring, epiphytes appear to secondarily colonize on top of the basal layers of diatoms and coralline red algae to initiate an exponential accumulation phase (Armitage et al., 2006; Corlett and Jones, 2007; Whalen et al., 2013). Community succession patterns and compositional changes would impact the per-pixel biomass values. Notably, the average % epiphyte coverage metric (Figure 11) showed relatively little seasonal fluctuation compared to the epiphyte load metric (Figure 10). It would be informative to distinguish and quantify changes in epiphyte community composition by combining image analysis, pigment analysis and molecular taxonomy.
Site to site differences in biotic and abiotic factors, especially temperature, nutrients, and grazer densities, also play essential roles in epiphyte accumulation. (Thom et al., 1995; Nelson and Waaland, 1997; Wear et al., 1999; Frankovich and Zieman, 2005; Whalen et al., 2013; Ruesink, 2016). Some epiphytic algae on T. testudinum tolerate low temperature but decline rapidly over 30 (Biber et al., 2004). Summer water temperatures possibly drive seasonal epiphyte community composition changes (Stanca and Parsons, 2021). Our observation that epiphyte coverage ordinated higher at CI site across all seasons indicates that environmental factors playing a major role in these site-to-site differences are consistent.
Oyster impacts on porewater nutrients (Booth and Heck, 2009; Wagner et al., 2015), hydrodynamics (Booth and Heck, 2009; Smith et al., 2009) and epiphyte community composition and relative abundances (Frankovich and Fourqurean, 1997; Smith et al., 2018), may provide the consistent forcing observed at CI. The significantly highest DIN/phosphate ratio of the sediment porewater suggests long-term greater nutrient exposure, and nutrient effects on epiphytes have been explored extensively (Frankovich and Zieman, 2005; Johnson et al., 2006; Frankovich et al., 2009; Nelson, 2017). But temporal shifts in top-down grazer control have been noted (Whalen et al., 2013), and 18S sequence abundance actually suggests a greater epiphytic animal abundance at CI (unpublished observations), Thus relatively less effective grazer control of epiphyte accumulation at CI seems incongruous as the major explanation for this site’s consistently greater epiphyte accumulation. On the other hand, hydrodynamic wave effects from proximity to the ICWW (Schanz et al., 2002) could disrupt grazing pressure across seasons.
Although the nitrogen sources for seagrass differ among the three locations, the similarity of δ15N of epiphytes did not reveal any such differences. Porewater nutrient differences may be more indicative of past nutrient history (e.g., untreated wastewater spill) as opposed to recent conditions affecting epiphytes. Thus increased epiphyte load and coverage at CI seems likely due to the influence of nutrient levels and hydrodynamics, on the epiphyte community composition and abundance (Armitage et al., 2005). The greater degree of carbon isotope discrimination by epiphytes (-12.46 < δ13C < -10.82) at the WWTP area than at other locations (-7.35 < δ13C < -7.82) might derive from different epiphytic communities (algae and animals) among the three locations (Smit et al., 2005), especially the presence of invertebrates. The seagrass host can also produce secondary compounds that influence microbial, algal and animal epibiota (Harrison, 1982; Harrison and Durance, 1985; Crump et al., 2018).
While nutrient enrichment at the “WWTP” area was expected to promote seagrass and epiphyte growth (Borum, 1985; Lee et al., 2007; Baggett et al., 2010), such effects were not observed on any consistent basis in comparison to nearby sites receiving only polished wastewater or under influence from oyster habitat. Future studies would benefit from monitoring grazers, epiphyte community change, and seasonal water column nutrient levels to improve understanding of the seagrass-epiphyte relationship.
This study demonstrated the utility of the image analysis approach to understand the seagrass-epiphyte dynamic relationship and the impact of environmental stressors on this relationship. The emerging interpretation from these results is that epiphyte community change from environmental factors impacts both biomass and imaging measures in sometimes different ways that provide complementary insights. Specifically, the relationship between epiphyte biomass accumulation and epiphyte coverage of the leaf provides insight into the morphology of the epiphyte biofilm in ways that impact the seagrass host such as light attenuation and gas exchange (Sand-Jensen, 1977; Brodersen et al., 2015). It is worth examining more closely to understand the significance of the epiphyte composition and colonization pattern in conjunction with seagrass physiology. However, evaluation of the image analysis method shows that classification discrepancies still exist (Huang, 2020), and a major challenge is accurate classification of diverse epiphyte constituents through refinement of epiphyte and seagrass reference spectra. An advanced image-analysis tool should be able to define the spatiotemporal changes in epiphyte communities and improve efficiency through deep learning with neural networks (Mehrubeoglu et al., 2021).
Data availability statement
The raw data supporting the conclusions of this article will be made available by the authors, without undue reservation.
Author contributions
KC, CH, and CP designed the experiment; CH, CP, and KC sampled and processed the seagrasses and epiphytes; CH and KC performed the data analyses; CH, MM, and KC performed the validation of imaging analysis; CH and KC prepared the manuscript. All authors contributed to the article and approved the submitted version.
Funding
The image analysis development and seagrass sampling were supported by a Texas A&M University-Corpus Christi Research Enhancement Award to KC. Funding for the nutrient measurement and the stable isotope analyses were from the Millicent Quammen Memorial Research Award, Texas A&M University-Corpus Christi to CH, and the Research and Innovation Award, Texas A&M University-Corpus Christi to CH. The open access publication fee was paid by the Open Access Publication Fund administered by the Mary and Jeff Bell Library at Texas A&M University-Corpus Christi.
Conflict of interest
The authors declare that the research was conducted in the absence of any commercial or financial relationships that could be construed as a potential conflict of interest.
Publisher’s note
All claims expressed in this article are solely those of the authors and do not necessarily represent those of their affiliated organizations, or those of the publisher, the editors and the reviewers. Any product that may be evaluated in this article, or claim that may be made by its manufacturer, is not guaranteed or endorsed by the publisher.
Supplementary material
The Supplementary Material for this article can be found online at: https://www.frontiersin.org/articles/10.3389/fmars.2022.1096307/full#supplementary-material
References
Aoki L. R., Rappazzo B., Beatty D. S., Domke L. K., Eckert G. L., Eisenlord M. E., et al. (2022). Disease surveillance by artificial intelligence links eelgrass wasting disease to ocean warming across latitudes. Limnol. Oceanogr. 67, 1577–1589. doi: 10.1002/lno.12152
Armitage A. R., Frankovich T. A., Fourqurean J. W. (2006). Variable responses within epiphytic and benthic microalgal communities to nutrient enrichment. Hydrobiologia 569, 423–435. doi: 10.1007/s10750-006-0146-8
Armitage A. R., Frankovich T. A., Heck K. L., Fourqurean J. W. (2005). Experimental nutrient enrichment causes complex changes in seagrass, microalgae, and macroalgae community structure in Florida bay. Estuaries 28, 422–434. doi: 10.1007/BF02693924
Atmaja P. S. P., Bengen D. G., Madduppa H. H. (2021). The second skin of seagrass leaves: A comparison of microalgae epiphytic communities between two different species across two seagrass meadows in lesser sunda islands. Trop. Life Sci. Res. 32, 97. doi: 10.21315/tlsr2021.32.2.7
Bader M., van Dunné H. J. F., Stuiver H. J. (2000). Epiphyte distribution in a secondary cloud forest vegetation; a case study of the application of GIS in epiphyte ecology. Ecotropica 6, 181–195.
Baggett L. P., Heck K. L. Jr., Frankovich T., Armitage A. R., Fourqurean J. W. (2010). Nutrient enrichment, grazer identity, and their effects on epiphytic algal assemblages: field experiments in subtropical turtlegrass thalassia testudinum meadows. Mar. Ecol. Prog. Ser. 406, 33–45. doi: 10.3354/meps08533
Bell S. S., Fonseca M. S., Kenworthy W. J. (2008). Dynamics of a subtropical seagrass landscape: links between disturbance and mobile seed banks. Landscape Ecol. 23, 67–74. doi: 10.1007/s10980-007-9137-z
Bell S. S., Middlebrooks M. L., Hall M. O. (2014). The value of long-term assessment of restoration: Support from a seagrass investigation. Restor. Ecol. 22, 304–310. doi: 10.1111/rec.12087
Biber P. D., Harwell M. A., Cropper W. P. (2004). Modeling the dynamics of three functional groups of macroalgae in tropical seagrass habitats. Ecol. Model. 175, 25–54. doi: 10.1016/j.ecolmodel.2003.10.003
Boese B. L., Clinton P. J., Dennis D., Golden R. C., Kim B. (2008). Digital image analysis of zostera marina leaf injury. Aquat. Bot. 88, 87–90. doi: 10.1016/j.aquabot.2007.08.016
Booth D. M., Heck K. (2009). Effects of the American oyster crassostrea virginica on growth rates of the seagrass halodule wrightii. Mar. Ecol. Prog. Ser. 389, 117–126. doi: 10.3354/meps08163
Borum J. (1985). Development of epiphytic communities on eelgrass (Zostera marina) along a nutrient gradient in a Danish estuary. Mar. Biol. 87, 211–218. doi: 10.1007/BF00539431
Borum J. (1987). Dynamics of epiphyton on eelgrass (Zostera marina l.) leaves: Relative roles of algal growth, herbivory, and substratum turnover. Limnol. Oceanogr. 32, 986–992. doi: 10.4319/lo.1987.32.4.0986
Bračun S., Wagner M., Koblmüller S. (2021). Spatio-temporal occurrence patterns of epibiota along the leaves of the seagrass cymodocea nodosa in the northern Adriatic Sea. Mar. Biol. Res. 17, 592–602. doi: 10.1080/17451000.2021.2015389
Brodersen K. E., Kühl M. (2022). Effects of epiphytes on the seagrass phyllosphere. Front. Mar. Sci. 9. doi: 10.3389/fmars.2022.821614
Brodersen K., Kühl M., Trampe E., Koren K. (2020). Imaging O2 dynamics and microenvironments in the seagrass leaf phyllosphere with magnetic optical sensor nanoparticles. Plant J. 104, 1504–1519. doi: 10.1111/tpj.15017
Brodersen K. E., Lichtenberg M., Paz L.-C., Kühl M. (2015). Epiphyte-cover on seagrass (Zostera marina l.) leaves impedes plant performance and radial O2 loss from the below-ground tissue. Front. Mar. Sci. 2, 58.
Bulthuis D. A., Woelkerling W. (1983). Biomass accumulation and shading effects of epiphytes on leaves of the seagrass, heterozostera tasmanica, in Victoria, Australia. Aquat. Bot. 16, 137–148. doi: 10.1016/0304-3770(83)90089-X
Cambridge M. L., How J. R., Lavery P. S., Vanderklift M. A. (2007). Retrospective analysis of epiphyte assemblages in relation to seagrass loss in a eutrophic coastal embayment. Mar. Ecol. Prog. Ser. 346, 97–107. doi: 10.3354/meps06993
Campbell S. J., McKenzie L. J., Kerville S. P. (2006). Photosynthetic responses of seven tropical seagrasses to elevated seawater temperature. J. Exp. Mar. Biol. Ecol. 330, 455–468. doi: 10.1016/j.jembe.2005.09.017
Collier C. J., Waycott M. (2014). Temperature extremes reduce seagrass growth and induce mortality. Mar. pollut. Bull. 83, 483–490. doi: 10.1016/j.marpolbul.2014.03.050
Corlett H., Jones B. (2007). Epiphyte communities on Thalassia testudinum from grand Cayman, British West indies: Their composition, structure, and contribution to lagoonal sediments. Sedimentary Geol. 194, 245–262. doi: 10.1016/j.sedgeo.2006.06.010
Costanza R., d’Arge R., de Groot R., Farber S., Grasso M., Hannon B., et al. (1997). The value of the world’s ecosystem services and natural capital. Nature 387, 253–260. doi: 10.1038/387253a0
Crump B. C., Wojahn J. M., Tomas F., Mueller R. S. (2018). Metatranscriptomics and amplicon sequencing reveal mutualisms in seagrass microbiomes. Front. Microbiol. 9, 388. doi: 10.3389/fmicb.2018.00388
Dennison W. C., Alberte R. S. (1982). Photosynthetic responses of zostera marina l. (Eelgrass) to in situ manipulations of light intensity. Oecologia 55, 137–144. doi: 10.1007/BF00384478
Dewsbury B. M., Bhat M., Fourqurean J. W. (2016). A review of seagrass economic valuations: gaps and progress in valuation approaches. Ecosystem Serv. 18, 68–77. doi: 10.1016/j.ecoser.2016.02.010
Duarte C. M. (1995). Submerged aquatic vegetation in relation to different nutrient regimes. Ophelia 41, 87–112. doi: 10.1080/00785236.1995.10422039
Duarte C. M., Delgado-Huertas A., Anton A., Carrillo-de-Albornoz P., López-Sandoval D. C., Agustí S., et al. (2018). Stable isotope (δ13C, δ15N, δ18O, δD) composition and nutrient concentration of red Sea primary producers. Front. Mar. Sci. 5. doi: 10.3389/fmars.2018.00298
Duarte C., Sand-Jensen K. (1990). Seagrass colonization: biomass development and shoot demography in Cymodocea nodosa patches. Mar. Ecol. Prog. Ser. 67, 97–103. doi: 10.3354/meps067097
Fikes R. L., Lehman R. L. (2008). Small-scale recruitment of flora to a newly developed tidal inlet in the Northwest gulf of Mexico. Gulf Mexico Sci. 26, 130–132. doi: 10.18785/goms.2602.05
Fernández-Torquemada Y., Sánchez-Lizaso J. L. (2005). Effects of salinity on leaf growth and survival of the Mediterranean seagrass posidonia oceanica (L.) delile. J. Exp. Mar. Biol. Ecol. 320, 57–63. doi: 10.1016/j.jembe.2004.12.019
Fong P., Harwell M. A. (1994). Modeling seagrass communities in tropical and subtropical bays and estuaries: a mathematical model synthesis of current hypotheses. Bull. Mar. Sci. 54, 757–781.
Fourqurean J. W., Muth M. F., Boyer J. N. (2010). Epiphyte loads on seagrasses and microphytobenthos abundance are not reliable indicators of nutrient availability in oligotrophic coastal ecosystems. Mar. pollut. Bull. 60, 971–983. doi: 10.1016/j.marpolbul.2010.03.003
Fourqurean J. W., Willsie A., Rose C. D., Rutten L. M. (2001). Spatial and temporal pattern in seagrass community composition and productivity in south Florida. Mar. Biol. 138, 341–354. doi: 10.1007/s002270000448
Frankovich T. A., Armitage A. R., Wachnicka A. H., Gaiser E. E., Fourqurean J. W. (2009). Nutrient effects on seagrass epiphyte community structure in Florida bay. J. Phycol. 45, 1010–1020. doi: 10.1111/j.1529-8817.2009.00745.x
Frankovich T. A., Fourqurean J. W. (1997). Seagrass epiphyte loads along a nutrient availability gradient, Florida bay, USA. Mar. Ecol. Prog. Ser. 159, 37–50. doi: 10.3354/meps159037
Frankovich T. A., Zieman J. C. (2005). A temporal investigation of grazer dynamics, nutrients, seagrass leaf productivity, and epiphyte standing stock. Estuaries 28, 41–52. doi: 10.1007/BF02732752
Giovannetti E., Montefalcone M., Morri C., Bianchi C. N., Albertelli G. (2010). Early warning response of Posidonia oceanica epiphyte community to environmental alterations (Ligurian Sea, NW Mediterranean). Mar. pollut. Bull. 60, 1031–1039. doi: 10.1016/j.marpolbul.2010.01.024
Golzarian M. R., Frick R. A., Rajendran K., Berger B., Roy S., Tester M., et al. (2011). Accurate inference of shoot biomass from high-throughput images of cereal plants. Plant Methods 7, 1–11. doi: 10.1186/1746-4811-7-2
Greening H. S., Cross L. M., Sherwood E. T. (2011). A multiscale approach to seagrass recovery in Tampa bay, Florida. Ecol. Restor. 29, 82–93. doi: 10.3368/er.29.1-2.82
Greiner J. T., McGlathery K. J., Gunnell J., McKee B. A. (2013). Seagrass restoration enhances “Blue carbon” sequestration in coastal waters. PloS One 8, null. doi: 10.1371/journal.pone.0072469
Grice A. M., Loneragan N. R., Dennison W. C. (1996). Light intensity and the interactions between physiology, morphology and stable isotope ratios in five species of seagrass. J. Exp. Mar. Biol. Ecol. 195, 91–110. doi: 10.1016/0022-0981(95)00096-8
Harrison P. G. (1982). Control of microbial growth and of amphipod grazing by water-soluble compounds from leaves of zostera marina. Mar. Biol. 67, 225–230. doi: 10.1007/BF00401288
Harrison P. G., Durance C. D. (1985). Reductions in photosynthetic carbon uptake in epiphytic diatoms by water-soluble extracts of leaves of Zostera marina. Mar. Biol. (Berl.) 90, 117–119. doi: 10.1007/BF00428222
Hasegawa N., Hori M., Mukai H. (2007). Seasonal shifts in seagrass bed primary producers in a cold-temperate estuary: Dynamics of eelgrass Zostera marina and associated epiphytic algae. Aquat. Bot. 86, 337–345. doi: 10.1016/j.aquabot.2006.12.002
Heck K.L., Nadeau D. A., Thomas R. (1997). The nursery role of seagrass beds. Gulf Mexico Sci. 15, 8. doi: 10.18785/goms.1501.08
Heck K. L. Jr., Valentine J. F. (2006). Plant–herbivore interactions in seagrass meadows. J. Exp. Mar. Biol. Ecol. 330, 420–436. doi: 10.1016/j.jembe.2005.12.044
Heijs F. M. L. (1984). Annual biomass and production of epiphytes in three monospecific seagrass communities of Thalassia hemprichii (Ehrenb.) aschers. Aquat. Bot. 20, 195–218. doi: 10.1016/0304-3770(84)90087-1
Hemminga M. A., Duarte C. M. (2000). Seagrass ecology (Edinburgh Building, Cambridge CB2 2RU, UK: Cambridge University Press) 256–276.
Herzka S., Dunton K. (1997). Seasonal photosynthetic patterns of the seagrass Thalassia testudinum in the western gulf of Mexico. Mar. Ecol. Prog. Ser. 152, 103–117. doi: 10.3354/meps152103
Huang C. (2020) Image analysis of epiphyte-seagrass dynamics on thalassia testudinum from different environmental conditions. Available at: https://tamucc-ir.tdl.org/handle/1969.6/89696 (Accessed November 7, 2022).
Humm H. J. (1964). Epiphytes of the sea grass, Thalassia testudinum, in Florida. Bull. Mar. Sci. 14, 306–341.
Johnson M. W., Heck K. L., Fourqurean J. W. (2006). Nutrient content of seagrasses and epiphytes in the northern gulf of Mexico: Evidence of phosphorus and nitrogen limitation. Aquat. Bot. 85, 103–111. doi: 10.1016/j.aquabot.2006.02.003
Johnson J. B., Omland K. S. (2004). Model selection in ecology and evolution. Trends Ecol. Evol. 19, 101–108. doi: 10.1016/j.tree.2003.10.013
Katwijk M. M., Thorhaug A., Marbà N., Orth R. J., Duarte C. M., Kendrick G. A., et al. (2016). Global analysis of seagrass restoration: the importance of large-scale planting. J. Appl. Ecol. 53, 567–578. doi: 10.1111/1365-2664.12562
Kim M., Qin L.-Z., Kim S. H., Song H.-J., Kim Y. K., Lee K.-S. (2020). Influence of water temperature anomalies on the growth of zostera marina plants held under high and low irradiance levels. Estuaries Coasts 43, 463–476. doi: 10.1007/s12237-019-00578-2
Kitting C. L., Fry B., Morgan M. D. (1984). Detection of inconspicuous epiphytic algae supporting food webs in seagrass meadows. Oecologia 62, 145–149. doi: 10.1007/BF00379006
Koch M. S., Erskine J. M. (2001). Sulfide as a phytotoxin to the tropical seagrass Thalassia testudinum: interactions with light, salinity and temperature. J. Exp. Mar. Biol. Ecol. 266, 81–95. doi: 10.1016/S0022-0981(01)00339-2
Lapointe B. E., Herren L. W., Brewton R. A., Alderman P. K. (2020). Nutrient over-enrichment and light limitation of seagrass communities in the Indian river lagoon, an urbanized subtropical estuary. Sci. Total Environ. 699, 134068. doi: 10.1016/j.scitotenv.2019.134068
Lee K.-S., Dunton K. H. (1996). Production and carbon reserve dynamics of the seagrass Thalassia testudinum in corpus Christi bay, Texas, USA. Mar. Ecol. Prog. Ser. 143, 201–210. doi: 10.3354/meps143201
Lee K.-S., Dunton K. H. (1997). Effect of in situ light reduction on the maintenance, growth and partitioning of carbon resources in Thalassia testudinum banks ex könig. J. Exp. Mar. Biol. Ecol. 210, 53–73. doi: 10.1016/S0022-0981(96)02720-7
Lee K.-S., Dunton K. H. (2000). Effects of nitrogen enrichment on biomass allocation, growth, and leaf morphology of the seagrass Thalassia testudinum. Mar. Ecol. Prog. Ser. 196, 39–48. doi: 10.3354/meps196039
Lee K.-S., Park S. R., Kim Y. K. (2007). Effects of irradiance, temperature, and nutrients on growth dynamics of seagrasses: A review. J. Exp. Mar. Biol. Ecol. 350, 144–175. doi: 10.1016/j.jembe.2007.06.016
Libes M. (1986). Productivity-irradiance relationship of posidonia oceanica and its epiphytes. Aquat. Bot. 26, 285–306. doi: 10.1016/0304-3770(86)90028-8
Marbà N., Gallegos M. E., Merino M., Duarte C. M. (1994). Vertical growth of Thalassia testudinum: seasonal and interannual variability. Aquat. Bot. 47, 1–11. doi: 10.1016/0304-3770(94)90043-4
McGlathery K. J. (2001). Macroalgal blooms contribute to the decline of seagrass in nutrient-enriched coastal waters. J. Phycol. 37, 453–456. doi: 10.1046/j.1529-8817.2001.037004453.x
Mehrubeoglu M., Vargas I., Huang C., Cammarata K. (2021). “Segmentation of seagrass blade images using deep learning,” in Real-time image processing and deep learning 2021 (SPIE; Bellingham, Washington USA) 11736, 26–38. doi: 10.1117/12.2587057
Michael T. S., Shin H. W., Hanna R., Spafford D. C. (2008). A review of epiphyte community development: surface interactions and settlement on seagrass. J. Environ. Biol. 29, 629–638.
Momota K., Nakaoka M. (2018). Seasonal change in spatial variability of eelgrass epifaunal community in relation to gradients of abiotic and biotic factors. Mar. Ecol. 39, e12522. doi: 10.1111/maec.12522
Moncreiff C., Sullivan M., Daehnick A. (1992). Primary production dynamics in seagrass beds of Mississippi sound: the contributions of seagrass epiphytic algae, sand microflora, and phytoplankton. Mar. Ecol. Prog. Ser. 87, 161–171. doi: 10.3354/meps087161
Monier J.-M., Lindow S. E. (2004). Frequency, size, and localization of bacterial aggregates on bean leaf surfaces. Appl. Environ. Microbiol. 70, 346–355. doi: 10.1128/AEM.70.1.346-355.2004
Moore K. A., Wetzel R. L. (2000). Seasonal variations in eelgrass (Zostera marina l.) responses to nutrient enrichment and reduced light availability in experimental ecosystems. J. Exp. Mar. Biol. Ecol. 244, 1–28. doi: 10.1016/S0022-0981(99)00135-5
Nelson W. G. (2017). Development of an epiphyte indicator of nutrient enrichment: Threshold values for seagrass epiphyte load. Ecol. Indic. 74, 343–356. doi: 10.1016/j.ecolind.2016.11.035
Nelson T. A., Waaland J. R. (1997). Seasonality of eelgrass, epiphyte, and grazer biomass and productivity in subtidal eelgrass meadows subjected to moderate tidal amplitude. Aquat. Bot. 56, 51–74. doi: 10.1016/S0304-3770(96)01094-7
Nielsen J., Lethbridge R. (1989). Feeding and the epiphyte food resources of gastropods living on leaves of the seagrass Amphibolis griffithii in south-western Australia. J. Malacol. Soc. Aust. 10, 47–58. doi: 10.1080/00852988.1989.10674005
Noisette F., Depetris A., Kühl M., Brodersen K. E. (2020). Flow and epiphyte growth effects on the thermal, optical and chemical microenvironment in the leaf phyllosphere of seagrass (Zostera marina). J. R. Soc. Interface 17, 20200485. doi: 10.1098/rsif.2020.0485
Novak R. (1982). Spatial and seasonal distribution of the meiofauna in the seagrass. posidonia oceanica Netherlands J. Sea Res. 16, 380–388. doi: 10.1016/0077-7579(82)90044-8
O’Brien K. R., Adams M. P., Ferguson A. J., Samper-Villarreal J., Maxwell P. S., Baird M. E., et al. (2018). “Seagrass resistance to light deprivation: implications for resilience,” in Seagrasses of Australia (Australia: Springer), 287–311. doi: 10.1007/978-3-319-71354-0
Orth R. J., Carruthers T. J. B., Dennison W. C., Duarte C. M., Fourqurean J. W., Heck K. L., et al. (2006a). A global crisis for seagrass ecosystems. BioScience 56, 987–996. doi: 10.1641/0006-3568(2006)56[987:AGCFSE]2.0.CO;2
Orth R. J., Luckenbach M. L., Marion S. R., Moore K. A., Wilcox D. J. (2006b). Seagrass recovery in the Delmarva coastal bays, USA. Aquat. Bot. 84, 26–36. doi: 10.1016/j.aquabot.2005.07.007
Ow Y. X., Ng K. J., Lai S., Yaakub S. M., Todd P. (2020). Contribution of epiphyte load to light attenuation on seagrass leaves is small but critical in turbid waters. Mar. Freshw. Res. 71, 929–934. doi: 10.1071/MF19178
Peterson B. J., Frankovich T. A., Zieman J. C. (2007). Response of seagrass epiphyte loading to field manipulations of fertilization, gastropod grazing and leaf turnover rates. J. Exp. Mar. Biol. Ecol. 349, 61–72. doi: 10.1016/j.jembe.2007.04.012
Pinckney J. L., Micheli F. (1998). Microalgae on seagrass mimics: does epiphyte community structure differ from live seagrasses? J. Exp. Mar. Biol. Ecol. 221, 59–70. doi: 10.1016/S0022-0981(97)00115-9
Premarathne C., Jiang Z., He J., Fang Y., Chen Q., Cui L., et al. (2021). Low light availability reduces the subsurface sediment carbon content in halophila beccarii from the south China Sea. Front. Plant Sci. 12. doi: 10.3389/fpls.2021.664060
Ralph P. J., Durako M. J., Enríquez S., Collier C. J., Doblin M. A. (2007). Impact of light limitation on seagrasses. J. Exp. Mar. Biol. Ecol. 350, 176–193. doi: 10.1016/j.jembe.2007.06.017
Ralph P. J., Macinnis-Ng C. M. O., Frankart C. (2005). Fluorescence imaging application: effect of leaf age on seagrass photokinetics. Aquat. Bot. 81, 69–84. doi: 10.1016/j.aquabot.2004.11.003
Rasmusson L. M., Buapet P., George R., Gullström M., Gunnarsson P. C., Björk M. (2020). Effects of temperature and hypoxia on respiration, photorespiration, and photosynthesis of seagrass leaves from contrasting temperature regimes. ICES J. Mar. Sci. 77, 2056–2065. doi: 10.1093/icesjms/fsaa093
Ray B. R., Johnson M. W., Cammarata K., Smee D. L. (2014). Changes in seagrass species composition in northwestern gulf of Mexico estuaries: effects on associated seagrass fauna. PloS One 9, e107751. doi: 10.1371/journal.pone.0107751
Reyes J., Sansón M. (2001). Biomass and production of the epiphytes on the leaves of cymodocea nodosa in the canary islands. Botanica Marina 44 (4). doi: 10.1515/BOT.2001.039
Ruesink J. L. (2016). Epiphyte load and seagrass performance are decoupled in an estuary with low eutrophication risk. J. Exp. Mar. Biol. Ecol. 481, 1–8. doi: 10.1016/j.jembe.2016.03.022
Saha M., Berdalet E., Carotenuto Y., Fink P., Harder T., John U., et al. (2019). Using chemical language to shape future marine health. Front. Ecol. Environ. 17, 530–537. doi: 10.1002/fee.2113
Sand-Jensen K. (1977). Effect of epiphytes on eelgrass photosynthesis. Aquat. Bot. 3, 55–63. doi: 10.1016/0304-3770(77)90004-3
Schanz A., Polte P., Asmus H. (2002). Cascading effects of hydrodynamics on an epiphyte–grazer system in intertidal seagrass beds of the wadden Sea. Mar. Biol. 141, 287–297. doi: 10.1007/s00227-002-0823-8
Shaffer J. P. (1986). Modified sequentially rejective multiple test procedures. J. Am. Stat. Assoc. 81, 826–831. doi: 10.1080/01621459.1986.10478341
Shamir L., Delaney J. D., Orlov N., Eckley D. M., Goldberg I. G. (2010). Pattern recognition software and techniques for biological image analysis. PloS Comput. Biol. 6, 1–10. doi: 10.1371/journal.pcbi.1000974
Smit A. J., Brearley A., Hyndes G. A., Lavery P. S., Walker D. I. (2005). Carbon and nitrogen stable isotope analysis of an amphibolis griffithii seagrass bed. Estuarine Coast. Shelf Sci. 65, 545–556. doi: 10.1016/j.ecss.2005.07.002
Smith C. S., Ito M., Namba M., Nakaoka M. (2018). Oyster aquaculture impacts Zostera marina epibiont community composition in akkeshi-ko estuary, Japan. PloS One 13, e0197753. doi: 10.1371/journal.pone.0197753
Smith K. A., North E. W., Shi F., Chen S.-N., Hood R. R., Koch E. W., et al. (2009). Modeling the effects of oyster reefs and breakwaters on seagrass growth. Estuaries Coasts 32, 748–757. doi: 10.1007/s12237-009-9170-z
Stanca E., Parsons M. L. (2021). Examining the dynamic nature of epiphytic microalgae in the Florida keys: What factors influence community composition? J. Exp. Mar. Biol. Ecol. 538, 151538. doi: 10.1016/j.jembe.2021.151538
Thom R., Miller B., Kennedy M. (1995). Temporal patterns of grazers and vegetation in a temperate seagrass system. Aquat. Bot. 50, 201–205. doi: 10.1016/0304-3770(95)00449-A
Wagner S., Jaffé R., Cawley K., Dittmar T., Stubbins A. (2015). Associations between the molecular and optical properties of dissolved organic matter in the Florida Everglades, a model coastal wetland system. Front. Chem. 3, 66. doi: 10.3389/fchem.2015.00066
Wear D. J., Sullivan M. J., Moore A. D., Millie D. F. (1999). Effects of water-column enrichment on the production dynamics of three seagrass species and their epiphytic algae. Mar. Ecol. Prog. Ser. 179, 201–213. doi: 10.3354/meps179201
Westfall P. H. (1997). Multiple testing of general contrasts using logical constraints and correlations. J. Am. Stat. Assoc. 92, 299–306. doi: 10.1080/01621459.1997.10473627
Whalen M. A., Duffy J. E., Grace J. B. (2013). Temporal shifts in top-down vs. bottom-up control of epiphytic algae in a seagrass ecosystem. Ecology 94, 510–520. doi: 10.1890/12-0156.1
Willcocks P. A. (1982). Colonization and distribution of the red algal epiphytes melobesia mediocris and smithora naiadum on the seagrass. Phyllospadix torreyi. Aquat. Bot. 12, 365–373. doi: 10.1016/0304-3770(82)90028-6
Wolaver T. G., Wetzel R. L., Zieman J. C., Webb K. L. (1980). “Nutrient interactions between salt marsh, mudflats, and estuarine water,” in Estuarine perspectives (Elsevier), 123–133. doi: 10.1016/C2013-0-10959-2
Worm B., Sommer U. (2000). Rapid direct and indirect effects of a single nutrient pulse in a seaweed-epiphyte-grazer system. Mar. Ecol. Prog. Ser. 202, 283–288. doi: 10.3354/meps202283
Wright A., Bohrer T., Hauxwell J., Valiela I. (1995). Growth of epiphytes on Zostera marina in estuaries subject to different nutrient loading. Biol. Bull. 189, 261–261. doi: 10.1086/BBLv189n2p261
Zieman J. C. (1975). Seasonal variation of turtle grass, Thalassia testudinum könig, with reference to temperature and salinity effects. Aquat. Bot. 1, 107–123. doi: 10.1016/0304-3770(75)90016-9
Zieman J. C., Fourqurean J. W., Frankovich T. A. (1999). Seagrass die-off in Florida bay: Long-term trends in abundance and growth of turtle grass. Thalassia testudinum Estuaries 22, 460–470. doi: 10.2307/1353211
Keywords: epiphyte-seagrass dynamics, image analysis, Thalassia testudinum, environmental conditions, epiphyte abundance, seagrass, nutrients, indicator
Citation: Huang C, Piñón C, Mehrubeoglu M and Cammarata K (2023) Image analysis reveals environmental influences on the seagrass-epiphyte dynamic relationship for Thalassia testudinum in the northwestern Gulf of Mexico. Front. Mar. Sci. 9:1096307. doi: 10.3389/fmars.2022.1096307
Received: 12 November 2022; Accepted: 19 December 2022;
Published: 16 January 2023.
Edited by:
Qiuying Han, Hainan Tropical Ocean University, ChinaCopyright © 2023 Huang, Piñón, Mehrubeoglu and Cammarata. This is an open-access article distributed under the terms of the Creative Commons Attribution License (CC BY). The use, distribution or reproduction in other forums is permitted, provided the original author(s) and the copyright owner(s) are credited and that the original publication in this journal is cited, in accordance with accepted academic practice. No use, distribution or reproduction is permitted which does not comply with these terms.
*Correspondence: Kirk Cammarata, S2lyay5DYW1tYXJhdGFAdGFtdWNjLmVkdQ==