 Xuanliang Ji
 Juan Feng
 Jianping Li
 Xingrong Chen
- 1State Key Laboratory of Remote Sensing Science, College of Global Change and Earth System Science, Beijing Normal University, Beijing, China
- 2Key Laboratory of Research on Marine Hazards Forecasting, National Marine Environmental Forecasting Center, Ministry of Natural Resources, Beijing, China
- 3Frontiers Science Centre for Deep Ocean Multispheres and Earth System (FDOMES)/Key Laboratory of Physical Oceanography/Institute for Advanced Ocean Studies, Ocean University of China, Qingdao, China
- 4Laboratory for Ocean Dynamics and Climate, Pilot Qingdao National Laboratory for Marine Science and Technology, Qingdao, China
The Hadley circulation (HC), as a thermally driven large-scale meridional circulation, acts a significant role in the changes of global climate. The modulation of Indo-Pacific warm pool (IPWP) thermal conditions on the relationship between the HC and different tropical sea surface temperature (SST) meridional structures was investigated. Based on the two components of HC and SST, one equatorially asymmetric component (HEA for HC, SEA for SST) and one equatorially symmetric component (HES for HC, SES for SST), the connections of HC to different SST variations in the warm and cold IPWP are explored. The result demonstrates that the relationship of the HC to tropical SST is suppressed in the cold IPWP conditions, whereas it is equivalent to the climatology in the warm IPWP conditions. The plausible mechanism is that the cold (warm) IPWP events are in concordance with the La Niña (El Niño) decay phase. The La Niña decay phase are associated with significant equatorially asymmetric SST anomalies within the IPWP, generating an anomalous meridional circulation and favoring a strengthened equatorially asymmetric anomalous meridional circulation. By contrast, the SST anomalies associated with El Niño decay phase are insignificant. The role of La Niña decay conditions in determining the suppressed connection between SST and HC is further verified by exploring the result after 1979. A similar suppressed response contrast has been detected. Therefore, the results demonstrate that warm and cold ENSO events have impacts on the interannual thermal conditions of IPWP, whereby it plays considerable role in impacting the relationship between the HC and tropical SST. Particularly, with the rapid warming, the interconnection between ENSO events and thermal conditions of IPWP under different timescales could be altered, the influence of which on the responses of the HC to tropical SST remains uncertain and is worthy further researching.
1 Introduction
The Hadley circulation (HC) is characterized as a zonal-mean meridional mass circulation in the atmosphere with a rough range from 30°S to 30°N. It consists of upward movement around the equator, poleward movement in the upper troposphere accompanied with a cooling trend, downward motion at subtropic areas of both hemispheres, and equatorward motion in the lower troposphere. As a worldwide tropical atmospheric meridional circulation, the HC has attracted lots of attention [e.g., Oort and Rasmusson (1970); Lindzen (1994); Dima and Wallace (2003); Feng and Li (2013); Hu et al. (2018a)]. The energy is transferred from tropical to subtropical regions by the vertical and horizontal motion of HC. Meanwhile, the weather and climate variations, like typhoon, precipitation and drought, are generally regulated by the HC [e.g., Hou (1998); Trenberth and Stepaniak (2003); Zhang and Wang (2013); Wu et al. (2017); Sharmila and Walsh (2018)]. Therefore, the climate can change easily in response to the relative mirror changes in the spatial structure or intensity of HC. Additionally, studies have proved that the variability of the HC is significantly affected by the variations of sea surface temperature (SST) over the tropics (Hu et al. (2018b); Yu et al., 2022; Zaplotnik et al., 2022).
The Indo-Pacific warm pool (IPWP) is the largest reservoir of warm water on earth. The IPWP is featured as a zone where the SSTs are warmer than 28°C, and it is usually deemed as the heat engine of the earth [e.g., Yan et al. (1992); Kim et al. (2012); De Deckker (2016); Bai et al. (2022)]. It plays an important character in purveying the energy and moisture flux via atmospheric movement (Duan et al., 2008; Dong et al., 2013). A continuous warming and extension of IPWP in the past decades has been captured by both observations and simulations (Rao et al., 2011; Kim et al., 2012; Dong et al., 2013; Lin et al., 2013; Weller et al., 2016; Xiao et al., 2017; Roxy et al., 2019; Xiao et al., 2019; Watanabe et al., 2020; Xiao et al., 2020; Bai et al., 2022). For instance, the warming rate of SST in the tropic Indian Ocean (IO) is approximately two to three times larger than that in the tropic Pacific Ocean (PO) (Luo et al., 2012). Compared with the expanding rate of IPWP from 1900 to 1980 (2.3×10⁵ km2 per year), the expanding rate from 1981 to 2018 (4×10⁵ km2 per year) is twofold larger (Roxy et al., 2019).
Considering the exponential relationship between the saturated water vapor pressure and SST, the strength of atmospheric vertical motion is very sensitive to the variations of SST over the IPWP region. Therefore, even small changes of SST can cause a remarkable impact on the climate from local to global scale through regulating HC and Walker circulation (Zhou and Wang, 2006; Fu and Johanson, 2009; Feng and Li, 2013; Zhang and Wang, 2013; Lo et al., 2014; Zhou et al., 2017). Therefore, the HC has a good relation with the tropic thermal condition. Ma and Li (2008) has ascribed the interdecadal variations of the HC to the increasing trend of SST over the IPWP and the interannual variations to El Niño-Southern Oscillation (ENSO). In addition, the enhanced variations of HC in the boreal winter have also been ascribed to the strengthened asymmetric mode of ENSO during the last decades (Guo and Li, 2016). Moreover, the possible impacts of SST warming on the HC variations have been studied, and it is found that the global SST warming is conducive to the enhancement of the predominant mode of the HC’s seasonal variability (Zhou and Wang, 2006; Ma and Li, 2008; Zhou et al., 2020; Xian et al., 2021). Meanwhile, the variations of thermal conditions over the IPWP also greatly impact the connection between the HC and the tropic SST, especially after 1980 (Feng et al., 2018). Moreover, as concluded in previous studies, the variations of HC are closely associated with the distribution of meridional structure of the tropic SST (Feng and Li, 2013; Guo and Tan, 2018; Sun et al., 2018). Different meridional structures of SST, like the asymmetric structure and symmetric structure along the equator, can generate great impacts on the HC at different temporal-spatial scales, indicating the response ratio of the asymmetric (symmetric) structure of the HC to asymmetric (symmetric) structure of SST varied with different thermal conditions (Feng et al., 2016; Guo et al., 2016; Xian et al., 2021).
These studies have shown that the IPWP SST has a strong warming and expansion tendency and is crucial to the HC variability. However, whether the thermal conditions of IPWP exhibit certain role in impacting the relationship between the tropical SST and HC remains unclear. Meanwhile, the past studies are primarily focused on the impact of IPWP on the HC, while few studies have focused on the influences of the variations of IPWP thermal conditions on the responses between different meridional structures of SST and HC before the year of 1980. However, as mentioned above, the SST over the IPWP region presents a robust interdecadal variation feature, and the SST in Indian Ocean has a close correlation with ENSO in terms of interdecadal variation. Therefore, on different interdecadal backgrounds, how does the interannual variation of different thermal conditions over the IPWP region affect the connection between the SST and HC? How does the main physical process modulate the relationship? What are the differences between the influences of the interdecadal variation and that of the interannual variation of IPWP thermal conditions on the correlation between the HC and SST? In addition, researchers found a significant 10-year period oscillation in the IPWP volume. The SSTs in the IPWP have a decadal mutation around 1976–1986, showing a negative anomalous feature before 1976 and a positive one after 1986 (Yin et al., 2020). However, a suppressed circulation over the tropic PO would occur when the SST or the extent size of IPWP is significantly weaker than the climatology. Moreover, investigations have found that over 95% warming and 85% expansion over the IPWP area are caused by a continuous emission of greenhouse gases induced by human activities since the 1950s (Dong et al., 2013; Weller et al., 2016; Bai et al., 2022).
Hence, this study focuses on the possible influence of warm and cold thermal conditions over the IPWP region on the response contrast of the HC to the different meridional spatial structures of SST from 1948 to 1978, which presents a negative phase of the IPWP in decadal time scale. The remainder of this paper is arranged as follows. The data and methods are introduced in section 2. The results about the correspondence between different spatial structures of SST and the HC are presented in section 3. The discussion about the modulating mechanisms is presented in section 4. The conclusions are shown in section 5.
2 Materials and methods
2.1 Materials
In this study, two atmospheric and five SST reanalysis fields are used to estimate the impacts of different meridional spatial structures of SST on the variations of HC over the IPWP region.
The atmospheric datasets are used to depict the variation characteristics of HC from 1948 to 1978. In our study, we use the NOAA-CIRES-DOE Twentieth Century Reanalysis (20CR) V2c (NOAA-20C) with a horizontal resolution of 2°×2° (Compo et al., 2011), and the atmospheric reanalysis data of the 20th century from European Centre for Medium-Range Weather Forecasts (ECMWF) (ERA-20C) with a horizontal resolution of 2.5°×2.5° (Dee et al., 2016). In addition, another two atmospheric reanalysis datasets obtained from the National Centers for Environmental Prediction–National Center for Atmospheric Research (NCEP-NCAR) Reanalysis 1 (NCEP-REA1) and NCEP-Department of Energy Reanalysis 2 (NCEP-REA2) from 1979 to 2020 are employed to verify the influence mechanisms of SST on the HC.
Five global SST reanalysis fields are used to explore the temporal-spatial variation characteristics of tropic SST and to conduct the cross-validation of the data reliability with each other. They are obtained from the Met Office Hadley Centre Sea Ice and SST dataset (HadISST) with a 1°×1° horizontal resolution (Rayner et al., 2003), the NOAA Extended Reconstructed SST version3 (ERSST3) and version5 (ERSST5) with a resolution of 2°×2° (Huang et al., 2017; Huang et al., 2020), and the Centennial in situ Observation-Based Estimates (COBE) SST version1 (COBESST1) and version2 (COBESST2) with a 1°×1°resolution (Hirahara et al., 2014).
2.2 Method
The intensity and spatial structures of the HC can be quantified by the mass stream function (MSF, Ψ). The Ψ can be solved through vertically integrating meridional wind (Cheng et al., 2022) and is defined as follows:
Where in Eq. (1), v is the meridional velocity; R is the earth’s radius; ϕ is the latitude; g is the gravitational acceleration; p is the pressure The overbar and square brackets represent temporal and zonal averaging, respectively.
In this study, the 1030 hPa is assumed as the sea surface layer and the 0 hPa is as the top of atmosphere layer (Qin et al., 2006). The Ψ is separated into two parts, one is integrated from the bottom to the top, and the other is integrated from the top to the bottom. Finally, the Ψ is corrected by the two integrals with a weight coefficient.
According to the linear decomposition scheme in Feng et al. (2018), the spatial structures of the HC and zonal-mean SST are divided into two components, namely the equatorially asymmetric component and symmetric component. For SST, the symmetric component (SES) and asymmetric component (SEA) are defined as:
For the variations of HC, considering the opposite distribution of the MSF values in the northern hemisphere (NH) and the southern hemisphere (SH), the HC equatorially symmetric component (HES) and asymmetric component (HEA) are expressed as:
Where in Eq. (2) and Eq. (3), the indexes of j and are meridional locations that are symmetric along the equator. Moreover, a relative response magnitude of the variations of HC to different meridional structures of SST is used, which is defined as the response ratio:
Where in Eq. (4), PC1(HES) is the first principal component (PC1) of the variability of HES under the EOF (empirical orthogonal function) analysis, and it is similar for other variables. The denominator (numerator) in Eq. (4) indicates the regression ratio of the HES (HEA) to the SES (SEA). Therefore, the ratio value in Eq. (4) indicates the sensibility of the HC to SST.
Here, a same extent ranging from 20°S to 20°N and 40° to 160°E is used to identify the variation characteristics of the IPWP region and to directly compare the potential interdecadal impacts of the IPWP warming. To characterize the cycle of IPWP event, the areal-averaged of the anomalous SSTs in the IPWP region under a calendar year, which exceeds positive (negative) 0.75 times of standard deviation and lasts for at least six months, is interpreted as a warm (cold) IPWP event. Then, 5 warm events (in 1958, 1959, 1969, 1970 and 1973) and 5 cold events (in 1951, 1965, 1971, 1974 and 1976) during 1948–1978 are obtained. Figure 1 shows the distributions of composite difference of SST between IPWP warm and cold thermal conditions, as well as the 28°C isotherm under the two conditions. The spatial feature of the SST under warm conditions is much distinct than that under cold conditions. The distribution of 28°C isotherm has a good consistency with the previous studies (Lin et al., 2013; Roxy et al., 2019), indicating that the selected warm and cold events are reasonable and can be used to conduct the following study. In addition, the position of the 28°C isotherm under IPWP warm condition (solid line in Figure 1) is wider than that under IPWP cold condition (dashed line in Figure 1). Considering the discontinuity of time under warm and cold IPWP conditions, the anomalous SST subsets in different events are constructed by removing the climatological monthly-mean values and the linear trend of the SST, which are referenced to the full 31 years.
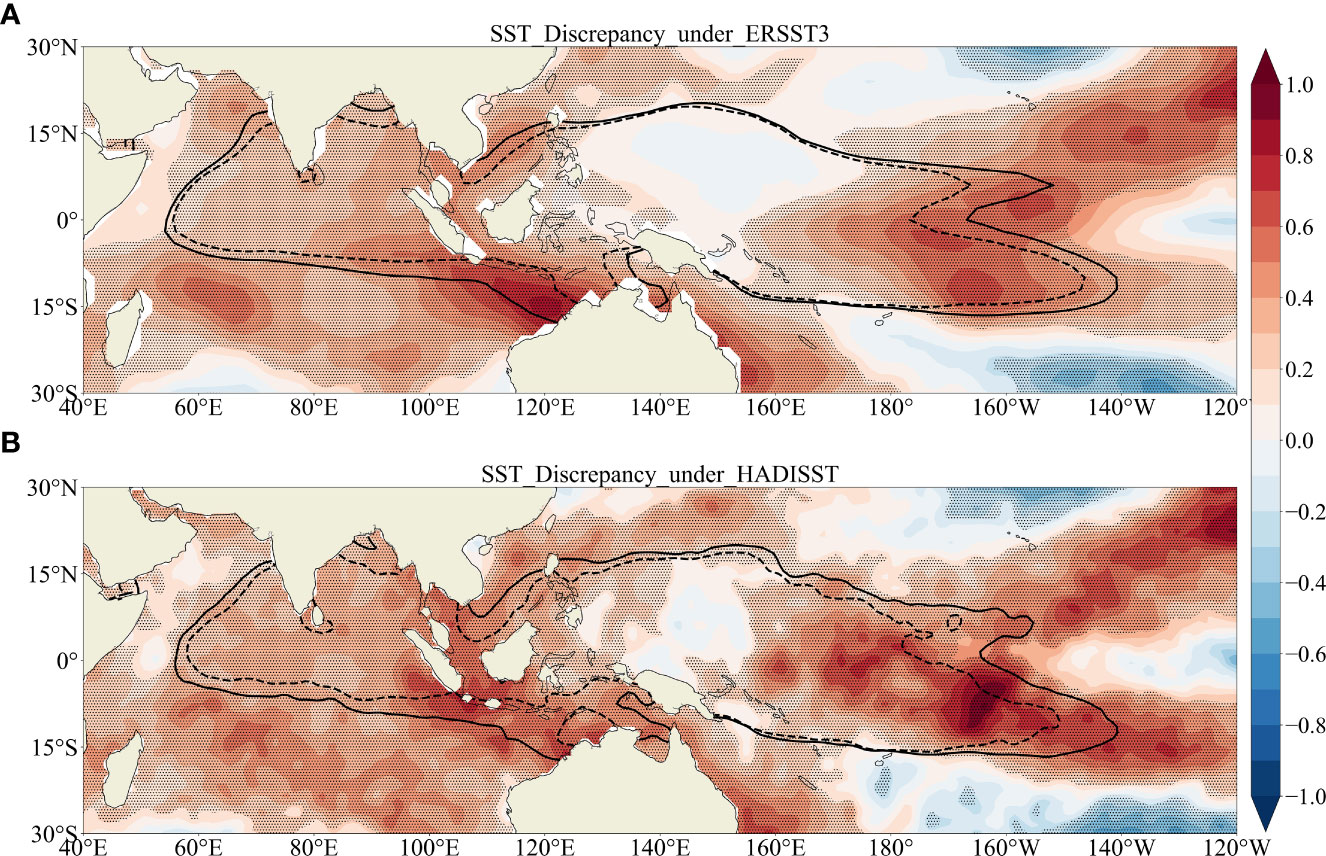
Figure 1 Characteristic sea-surface temperature (SST) discrepancy (shading) with 28°C SST isotherm (line) under IPWP warm and cold events for (A) ERSST3 and (B) HadISST. The solid and dashed lines show the 28°C SST isotherm under IPWP warm events and cold events, respectively. The dotted represent significance at the 0.05 level.
To analyze the respondence of the meridional circulation on the meridional spatial structures of SST under different IPWP thermal conditions, the empirical orthogonal function (EOF), composite analysis, regression analysis and correlation analysis methods are employed. In addition, a two-sided Welch’s t-test is used for the significance test of the correlativity, regression and composite values.
3 Results
3.1 Climatological characteristics of the HC
The climatological mean MSF and its first principal mode (EOF1) analyzed with the NOAA-20C and ERA-20C datasets are displayed in Figure 2. The two datasets show similar climatological spatial distributions of the HC, with an updraft to the north of the equator and two downdrafts around 30°N and 30°S (Figures 2A, C). Both the intensity and the spatial range of the tropic HC in the SH act slightly more robust than those in the NH. Figure 2B and Figure 2D display the first principal mode distribution feature of monthly mean MSF with a time length of 372 months, which presents an equatorially asymmetric feature with the updraft located around 20°S and the two downdrafts to the south of 30°S and around 20°N. The equatorially asymmetric mode has a stronger component centered at the north of the equator and extends from 20°S to 20°N, with an explained variance about 34%. The results indicate that an equatorially asymmetric mode is dominant in the interannual variability of the long-term monthly-mean HC.
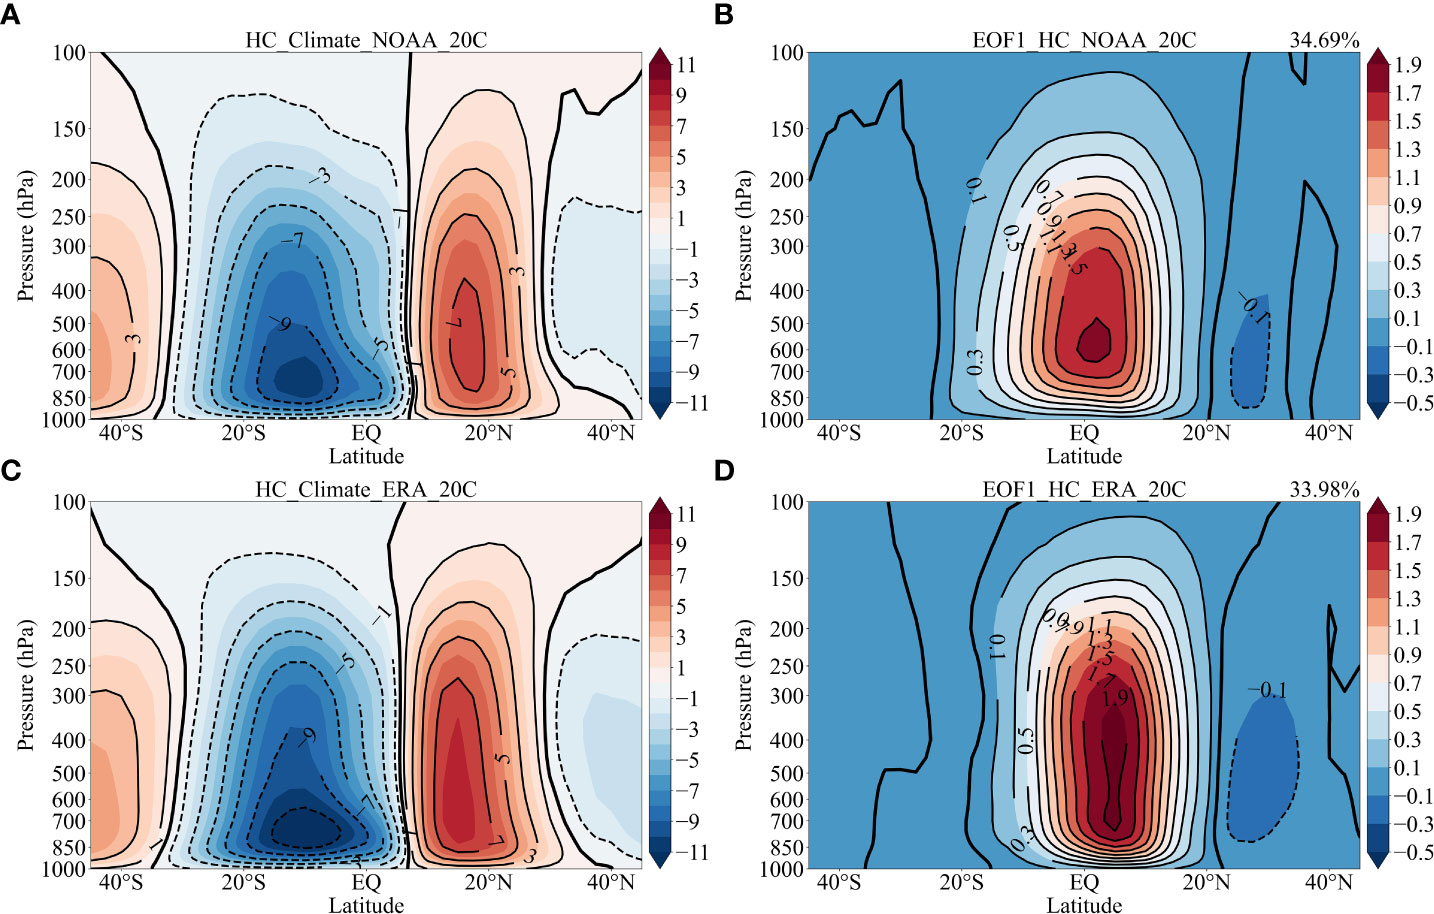
Figure 2 The climatological mean MSF from 1948 to1978 based on the (A) NOAA-20C and (C) ERA-20C. The contour interval is 2× 10¹⁰ kg s-1. (B, D) as in (A, C) but for the principal mode of the HC. Positive (negative) contours are displayed as solid (dotted) lines with an interval of 0.2×10¹⁰ kg s−1.
3.2 Climatological characteristics of the zonal-mean SST
The spatial distributions of climatological zonal-mean SST over the tropical region and the EOF1 based on the ERSST3 and HadISST datasets are displayed in Figure 3. The climatological zonal-mean tropical SST (Figure 3A) shows a remarkable feature with two peaks in two hemispheres and a symmetrical distribution along the equator. Moreover, the peak values in two hemispheres are unbalanced, with a larger value in the NH and a lower one in the SH, which agrees well with the averaged location of the upward branch of the HC is to the north of the equator (Figure 2A), which is mainly due to a larger ocean area in the SH. The EOF1 of the zonal-mean SST presents an equatorially symmetric spread characteristic with the peak value in the equator (Figure 3B), with 78.79% (79.27%) under ERSST3 (HadISST) ratio of explained variance to the total variance, representing a fundamental variability. According to the correlation analysis, the principal component of this mode (PC1) shows a good agreement with Niño 3 and Niño 3.4 indexes (figure not shown), and the correlation coefficients are 0.86 and 0.84, respectively, indicating that the ENSO dominates the tropical SST variability. It is noted that the spatial structure of EOF1 of SST does not correspond to that of HC, indicating that the global mean SST variability cannot be used to explain the spatial structure change of the dominant mode of HC.
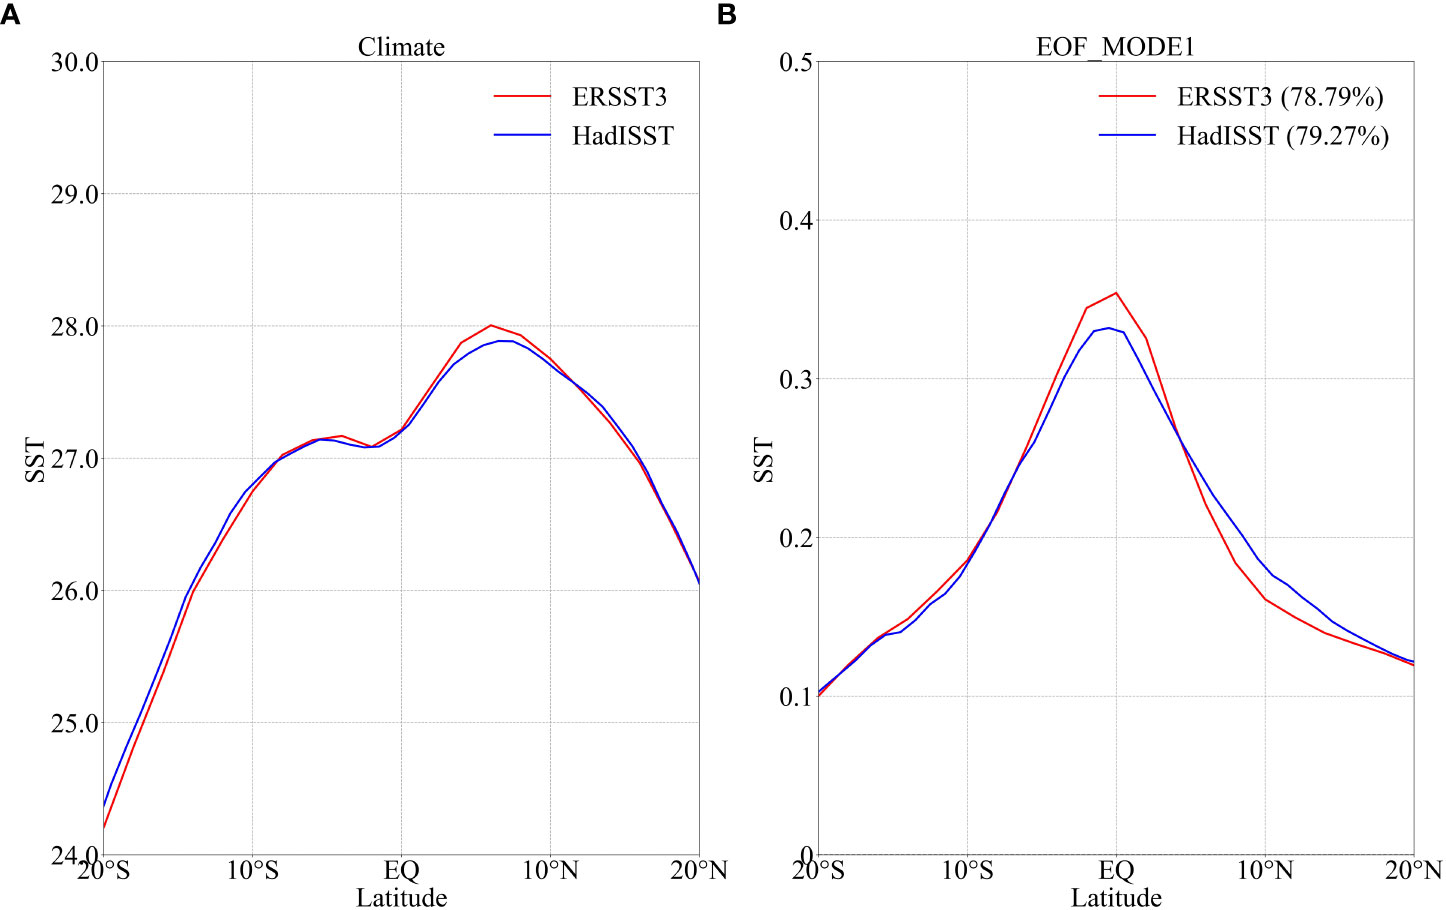
Figure 3 The distributions of climatological zonal-mean tropic SST (A) and Principal mode of the SST (°C) from 1948 to1978 (B). Red and blue lines are based on the ERSST3 and HadISST, respectively.
3.3 Variations of the HES and HEA
The spatial distributions of the climatological mean and the relative HES EOF1 and HEA EOF1 under the IPWP warm phase are shown in Figure 4. Similar spatial distributions of the climatological mean HEA are found for the two datasets, with an ascending movement in the NH and a descending movement in the SH (Figures 4A, C). Meanwhile, the climatological mean HES has a consistent distribution (Figures 4B, D) with a zero-value distribution along the entire vertical layers at the equator. As for the climatological spread of HES, there are two proportionate cells on the two sides of the equator, with a mutual ascending movement in the equatorial region and a descending movement over the subtropical region in both the SH and NH. The distributions of HEA and HES are different because the symmetric and asymmetric components are decomposed along the equator as shown in Eq. (3). Although the HEA and HES have comparable extents, they do not coincide in the strength of the HES. The HEA is significantly weaker than the HES. Moreover, the EOF analysis is carried out for the HEA and HES as shown in the contour lines of Figure 4. The spatial distribution structure under the HEA EOF1 is similar to the climatological distribution, while the extent is significantly narrower than that of the climatology. The ascending motion is around 20°N, while the descending motion is around 20°S, resulting in a much wider range than that after 1980 (Feng et al., 2018). The difference may be caused by the different underlying thermal conditions in IPWP region during the two periods (Yin et al., 2020). The spatial distribution of the HES EOF1 presents a similar feature with its climatological mean distribution, but the extent is narrower in NOAA-20C dataset than that in ERA-20C dataset. Additionally, the HEA EOF1 accounts for 56.35% (54.51%) of the total variance under NOAA-20C (ERA-20C), showing more concentrated variability than 31.25% (37.01%) for the HES EOF1.
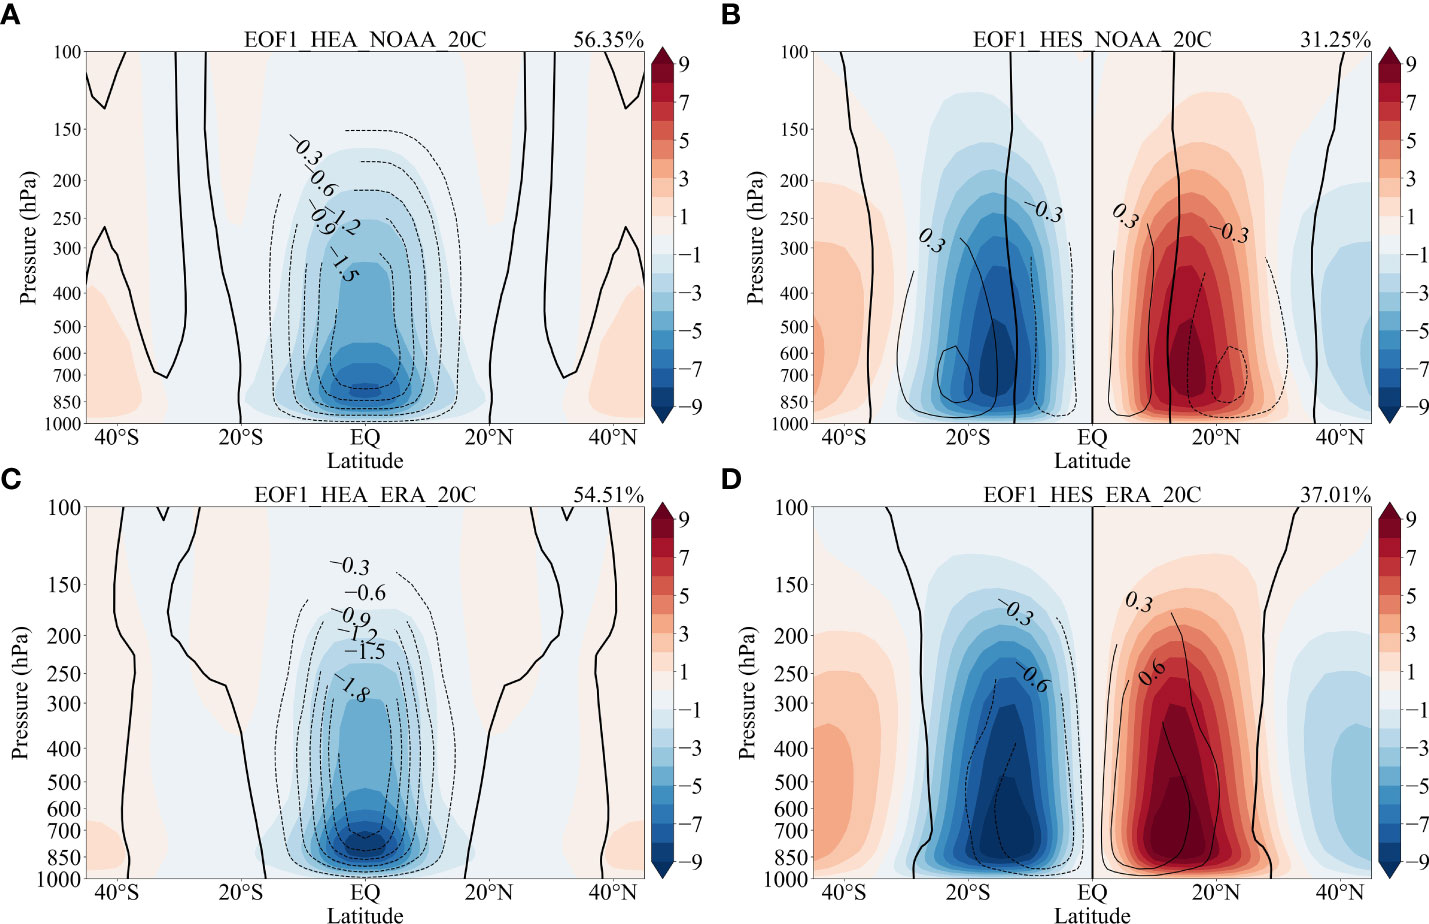
Figure 4 A The EOF1 of the monthly HEA (contour line, with an interval of 0.3×10¹⁰ kg s−1), and the climatological mean of the HEA (shaded) based on NOAA-20C under IPWP warm events. Solid (dotted) contour line is positive (negative), and the zero line is thickened. (C) as in (A), but based on the ERA-20C dataset. (B, D) as in (A, C) respectively, but for the HES.
Figure 5 shows the HEA EOF1 and HES EOF1 under IPWP cold phase. The spatial distribution characteristics of the climatological mean HEA (Figures 5A, C) and HES (Figures 5B, D) under IPWP cold conditions resemble those under IPWP warm conditions. As shown in Figure 5A and Figure 5C, the central intensity of HEA EOF1 is significantly weaker under IPWP cold events than that under IPWP warm events (Figures 4A, C), indicating that the magnitude of HEA EOF1 has a decreasing trend from warm to cold conditions. Moreover, the explained variance of HES EOF1 under IPWP cold condition is significantly larger than that in warm condition, suggesting that the variability of HES under IPWP cold condition is more concentrated. In general, the aforementioned results about the difference of the HEA and HES under different thermal conditions suggest that the variability of the HC is more sensible to cold events than to warm events over the IPWP region.
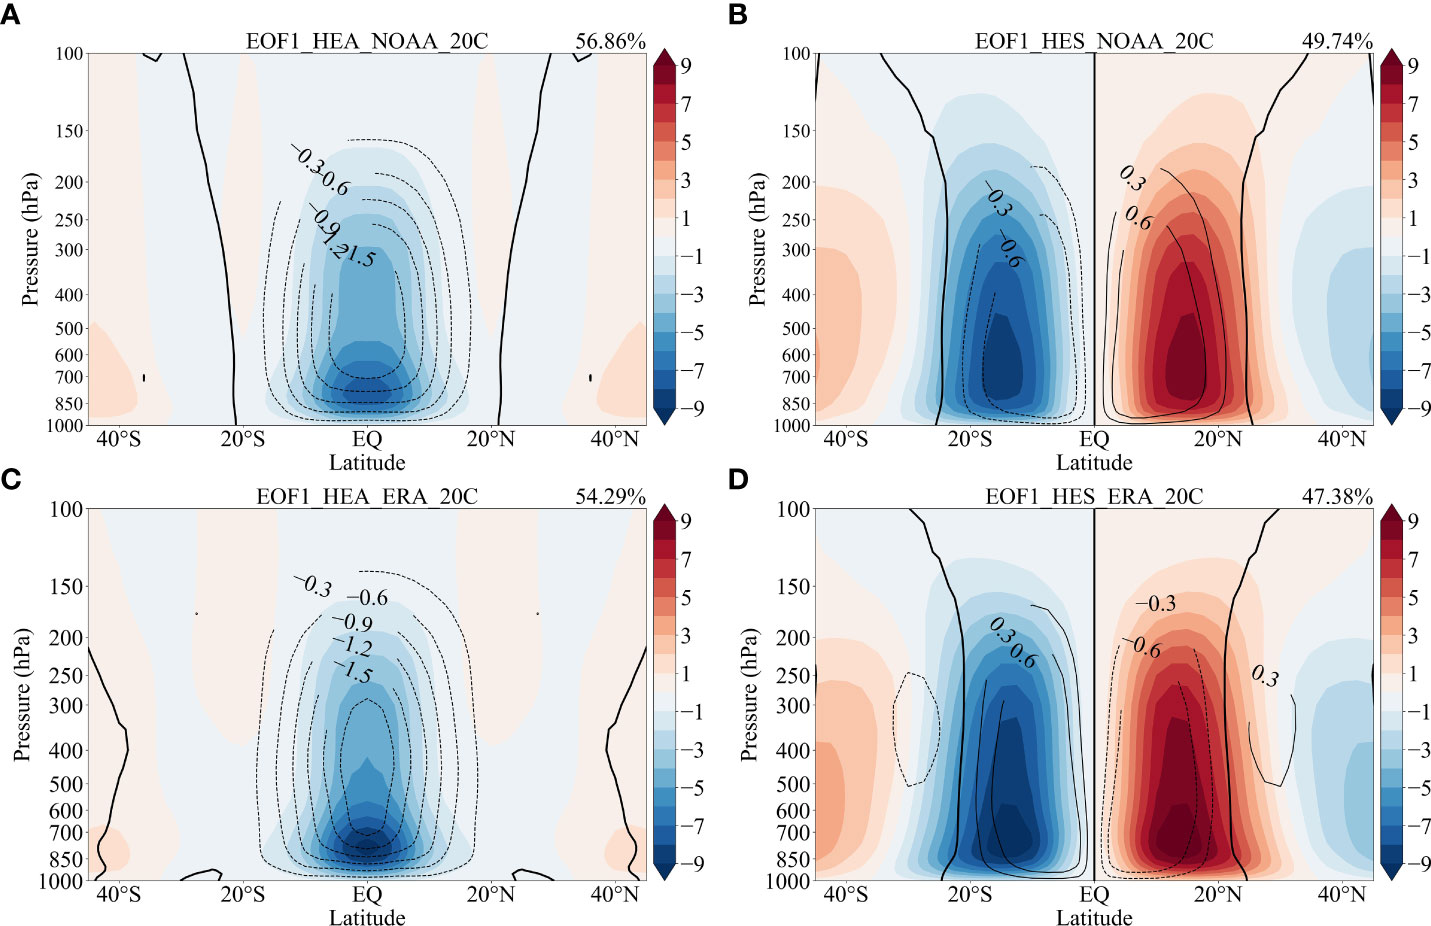
Figure 5 As in Figure 4, but for the variation under IPWP cold events.
3.4 Variations of the SES and SEA
The variations of the SES EOF1 and SEA EOF1 under IPWP warm and cold conditions are shown in Figure 6. The spatial variations of SEA variability are consistent in all the five SST fields (Figures 6A, C), with a positive anomalous distribution in the NH and a negative one in the SH under the two thermal conditions. The position of peak value under the first principal mode is different from the results of Feng et al. (2018), with a maximum (minimum) value around 18°N (18°S), which shows a decadal variability of IPWP. Meanwhile, the location of the extreme value has a good agreement with the locations of downward and upward motions (Figure 4), which indicated that the positions of the downward (upward) movement of HC correspond to the location of the meridional gradient change of SST from negative (positive) phase to positive (negative) phase. This is mainly due to the pertinence between the meridional wind and SST (Feng and Li, 2013; Huang et al., 2019). In contrast, the spatial distribution of the SEA EOF1 under IPWP cold conditions presents a slightly flatter structure without a significant peak from 20°S to 20°N, which favors a wider HC. The explained variance decreases by about 2% from IPWP warm events to cold events for the four datasets (ERSST3, HadISST, COBESST1 and COBESST2), by about 9% for the ERSST5 dataset, indicating a consistent suppressed variability of the SEA during the cold IPWP events comparing with the warm events.
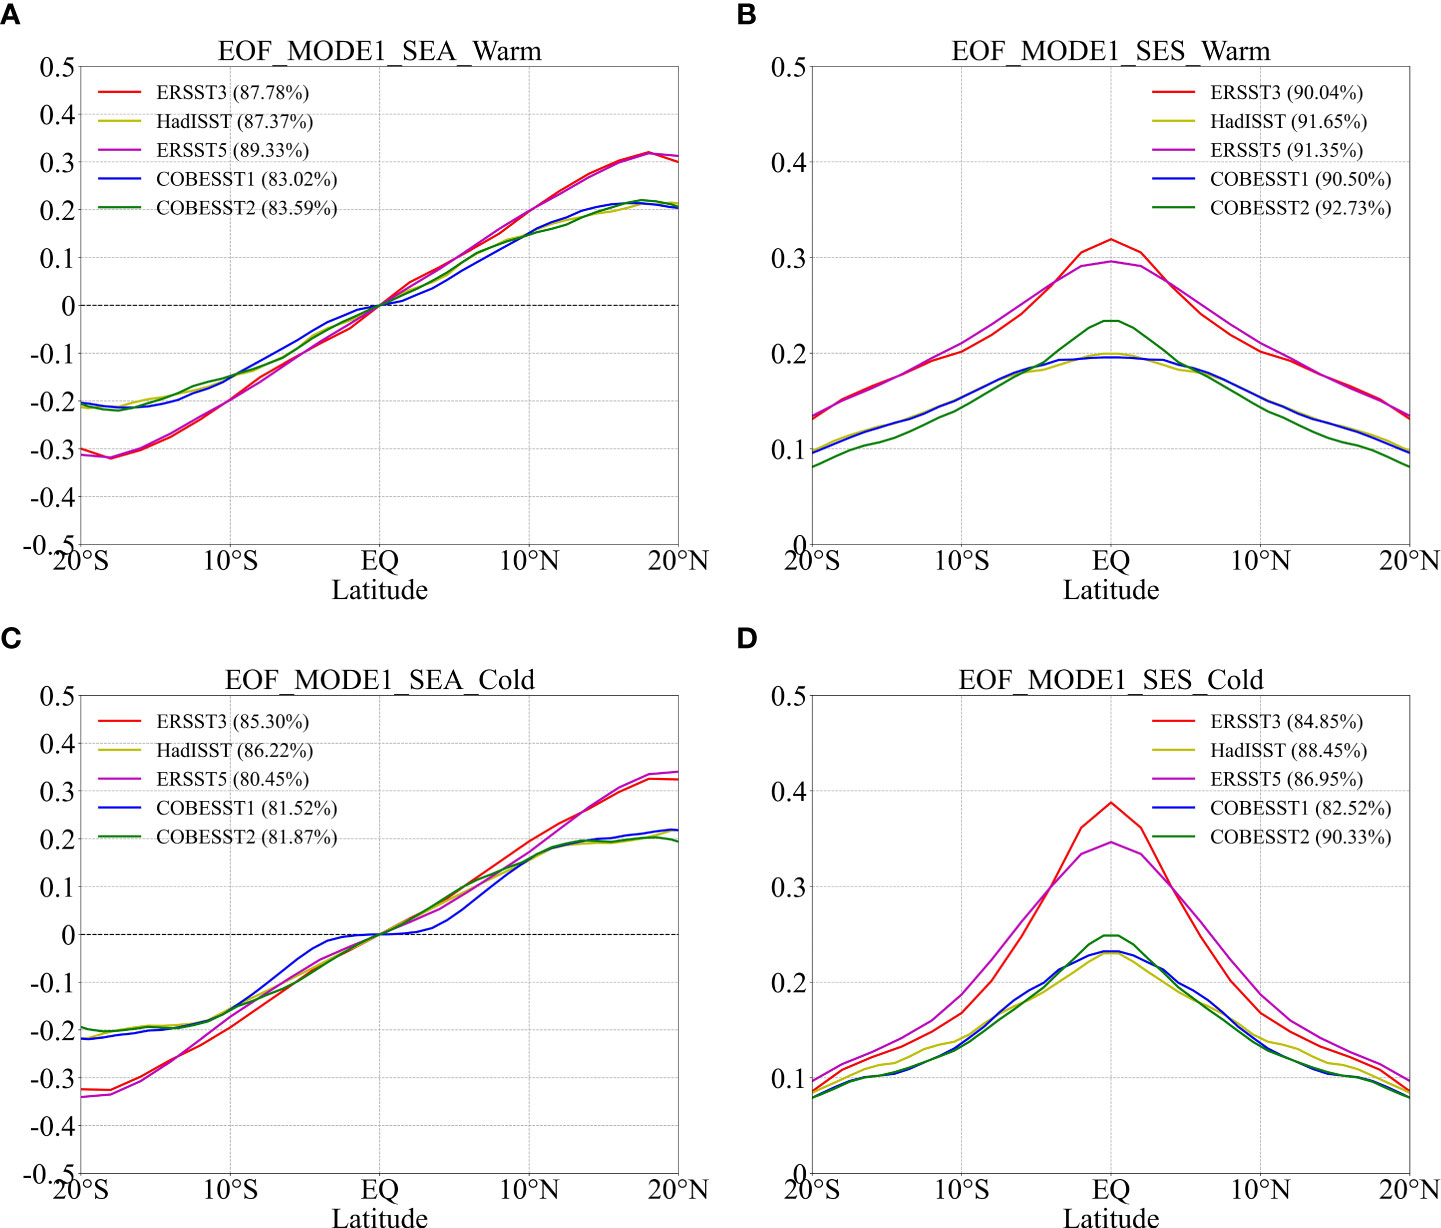
Figure 6 (A) The dominant principal mode of the SEA under IPWP warm events. (B) as in (A) but for the SES. (C, D) as in (A, B) respectively, but for the variation during IPWP cold events. The red, yellow, magenta, blue and green lines are based on the ERSST3, HadISST, ERSST5, COBESST1 and COBESST2 datasets, respectively.
The variation of SES EOF1 (Figures 6B, D) shows a parabolic pattern centered around the equator under IPWP warm and cold conditions, which has a good coincidence with the association of positive phase of ENSO with equatorially symmetrical anomaly of tropical SST. In contrast to the slope of SES EOF1 under IPWP warm events, that under IPWP cold events is much larger, with a stronger SST variability and gradient, resulting in a broader meridional circulation. It also explains the wider distribution of HES EOF1 during IPWP cold events (Figures 4B, 5B). Meanwhile, the explained variance of SES EOF1 is higher than that of SEA EOF1 under IPWP warm events, and the explained variances of SEA EOF1 and SES EOF1 decrease from warm events to cold events. Therefore, the variability of SES component is strengthened under IPWP warm events, while a declined explained variance of the SES EOF1 is detected under IPWP cold events.
3.5 Response contrast of the HC to SST
Ulteriorly, the response ratios of HEA (HES) to SEA (SES) under IPWP warm and cold conditions are analyzed. Based on the ERSST3 and NOAA-20C datasets, the scatterplots of the SEA (SES) PC1 against the HEA (HES) PC1, as well as their fitted curves are displayed in Figure 7. It can be found that the variations of HES (HEA) have a prominently linear correlation with SES (SEA). However, the response ratio of HEA to SEA shows large distinction in different IPWP conditions, with a value of 22.6-unit under IPWP warm conditions (Figure 7A) against a value of 12.02-unit under IPWP cold conditions (Figure 7C) based on a 1-unit variation in SEA. Nevertheless, there is a little change of the response coefficient of HES to SES. That is, the SES changes 1-unit, then accompanied with a 6.41-unit change of HES under IPWP warm events (Figure 7B) and an 8.87-unit change of HES under IPWP cold events (Figure 7D). Similar results are derived from different datasets as displayed in Table 1, indicating that the response ratio of HEA to SEA under IPWP cold phase is significantly suppressed. Therefore, the response contrast of HC to the meridional structure of SST under IPWP warm events differs from that under IPWP cold events. As shown in Table 1, the response contrast of asymmetric component of the HC and SST relative to the symmetric component of the HC and SST under IPWP warm events is about 4 within different datasets, which approximately resembles the value under the long-term interannual variation (Feng et al., 2016). Nonetheless, the response contrast decreases to about 2 under IPWP cold events, suggesting that a suppression of the HC to SST maybe exist under these events. Thus, the difference reveals that the HC is more sensible to underlying thermic status under IPWP warm conditions, while less sensitive under IPWP cold conditions, suggesting that the response contrast of HC to tropical SST varies with the different underlying thermal conditions of the IPWP.
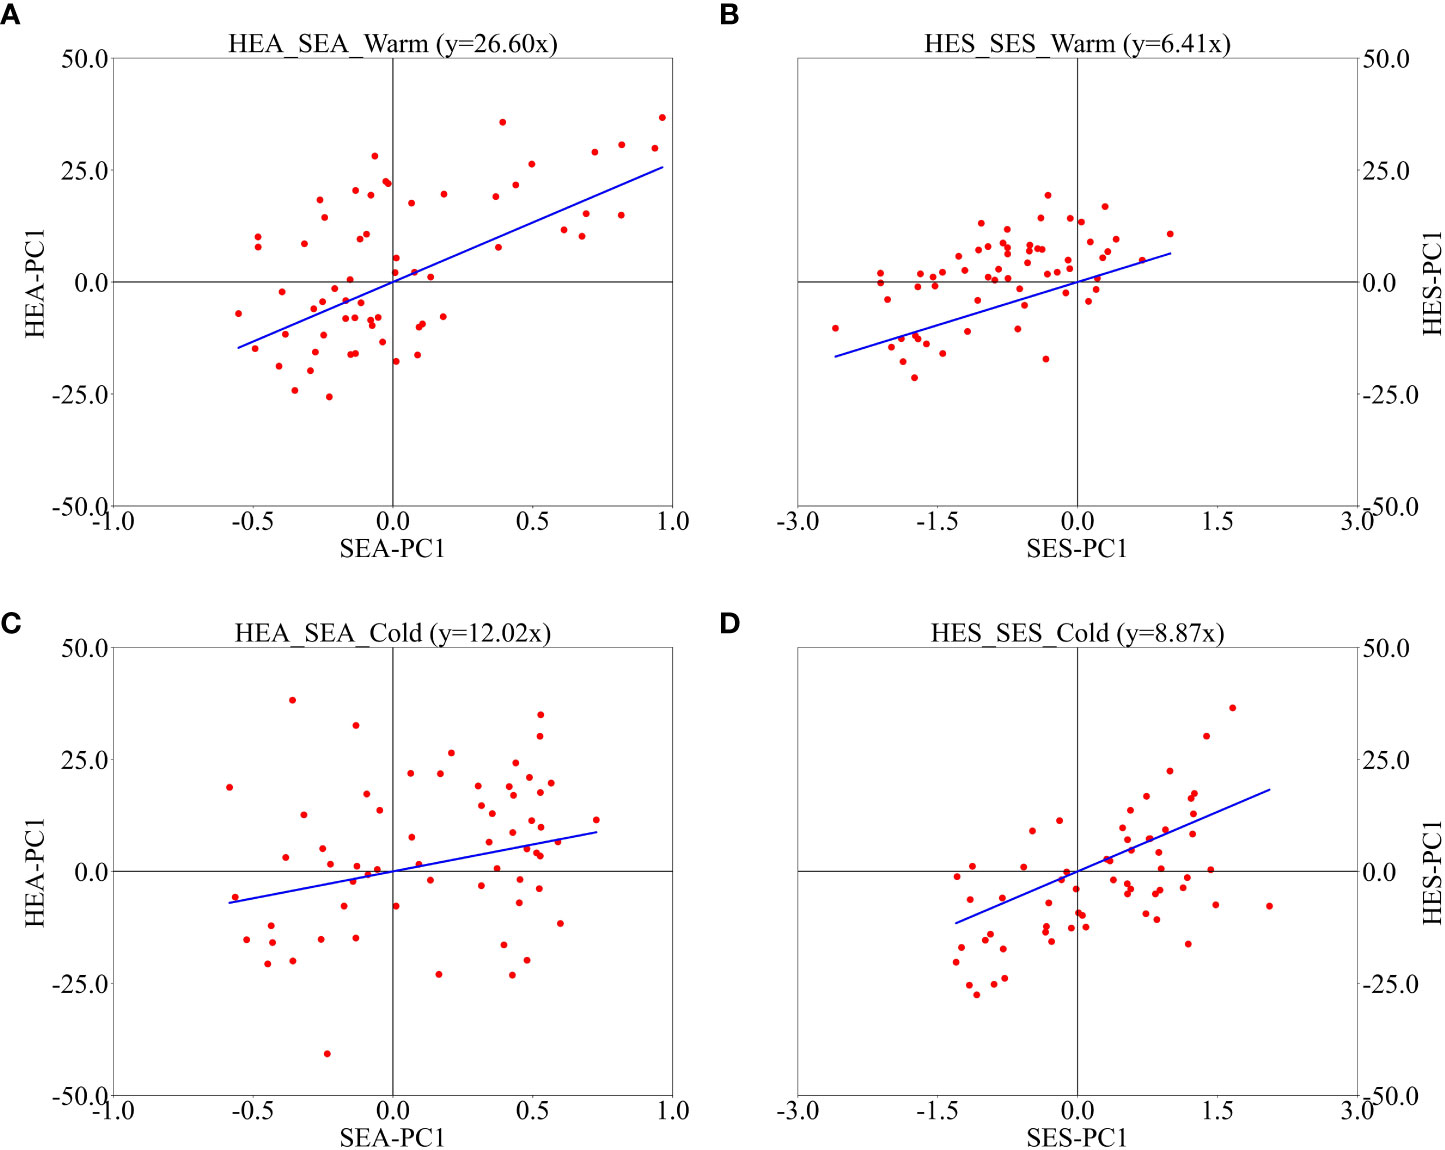
Figure 7 (A) Scatterplot of the SEA PC1 values against the HEA PC1 values under IPWP warm events (red circle) and their linear fitting (blue). (B) as in (A) but for the SES PC1 values against the HES PC1 values. (C, D) as in (A, B) respectively, but during the IPWP cold events.
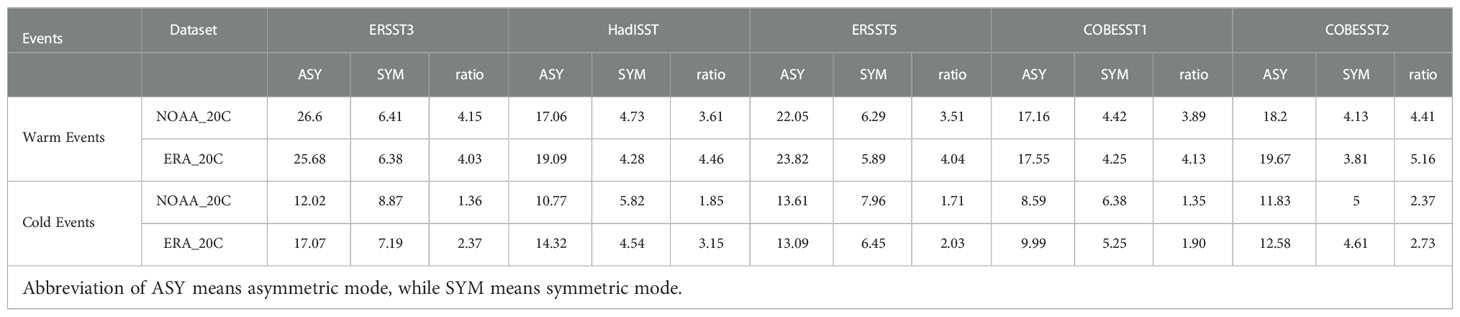
Table 1 Coefficients of regression between the PC1 values of HES (HEA) and that of the SES (SEA), and their response contrast obtained from multiple reanalysis fields.
4 Discussion
As mentioned above, the HC has different responses to tropical SST under different IPWP thermal conditions. To research the potential influence mechanism on the suppressed response contrast of the HC to SST under IPWP cold events, the associated distributions of a composite SST anomaly for IPWP warm and cold events are inspected (Figure 8). It can be found that the anomalous SST patterns have a good agreement with each other for the ERSST3 and HadISST datasets (also for other three SST datasets; figure not shown). Under IPWP warm events, the SSTs over the IPWP, the southeastern Australian, the central Pacific, the southwestern North America, the southeast of South America and tropical Atlantic regions show significant positive anomalies, while the SSTs over the regions of north Pacific and north Atlantic show virtually negative anomalies. In addition, the anomalous magnitude of SST presents different spatial distributions, especially with a warmer anomaly in the south IO (Yu et al., 2022). The anomalous SSTs in the tropical area of the Atlantic Ocean shows a different spatial feature, with larger positive anomalies to the north of equator and smaller positive anomalies to the south of equator. Moreover, the spatial structure of the anomalous SST under IPWP cold events is different from that under IPWP warm events. The significantly positive anomaly of SST occurs in the tropical eastern Pacific, while a negative anomaly appears in the tropical central Pacific, as well as in the IPWP region and tropical Atlantic. Similar with the distribution of the positive anomaly under IPWP warm phase, a stronger negative anomaly exists in the south IO region and in the north Atlantic Ocean when compared with the corresponding anomaly on the opposite flank region of the equator. Therefore, it is illustrated that the anomalous SSTs under IPWP warm and cold conditions not only appear in the IPWP region, but also over the globe.
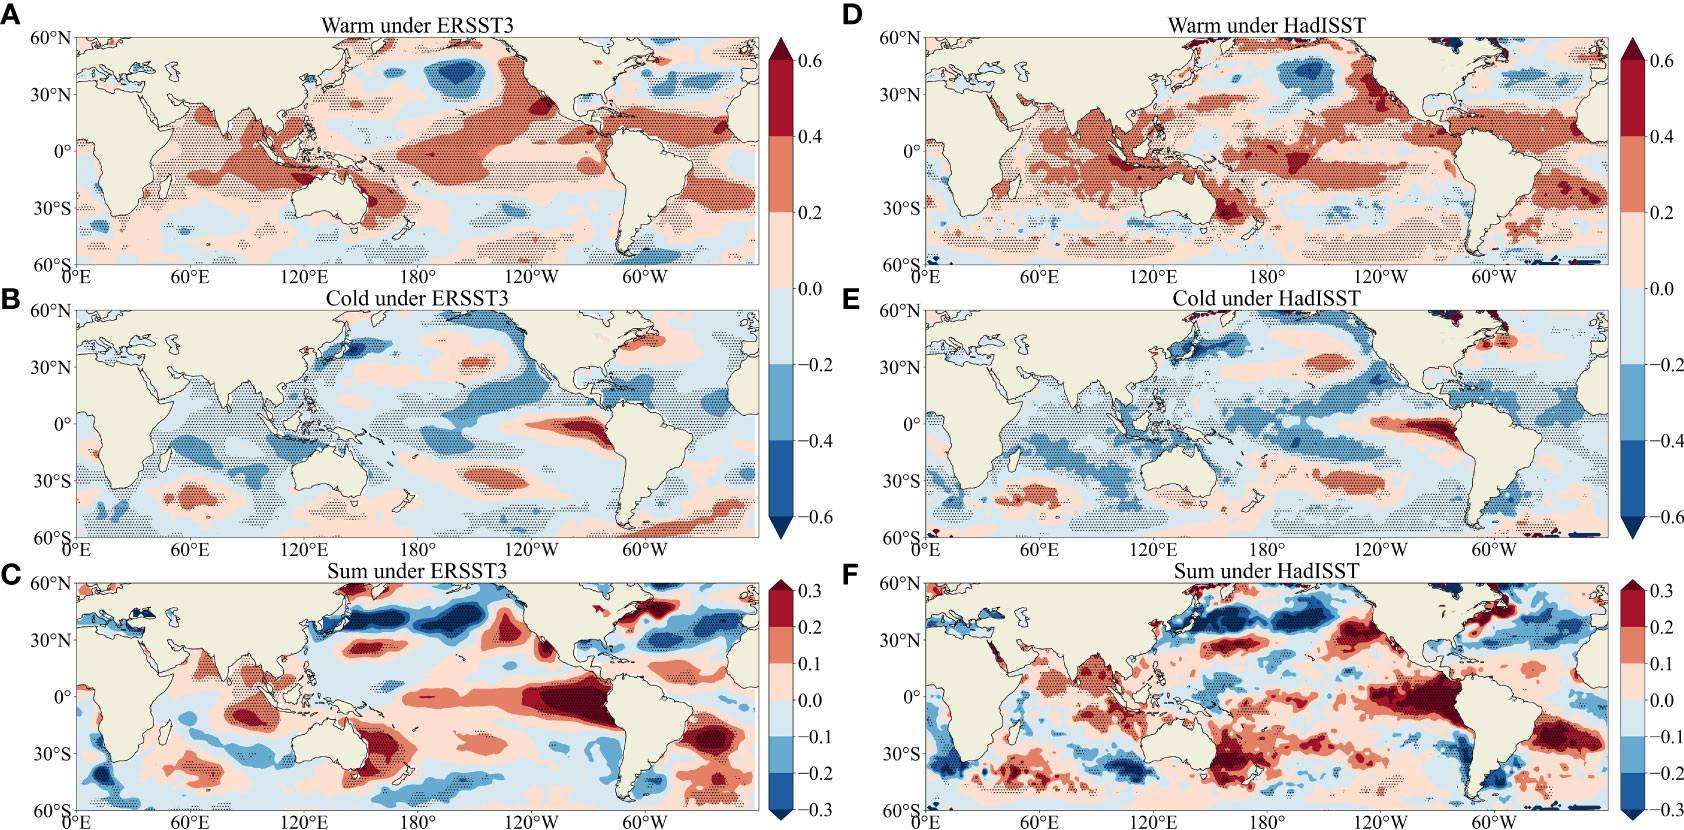
Figure 8 Composite SST anomalies for ERSST3 (A) under the IPWP warm and (B) cold events. (C) The summation of the anomalous SST under the IPWP warm and cold phases. Right panel (D–F), as the left panel (A–C), but for the HadISST. The dotted represent significance at the 0.05 level.
To analyze the source of SST asymmetric distribution under IPWP warm and cold phases, the distribution of the summation of anomalous SSTs under IPWP warm and cold phases are respectively given in Figures 8C, F. The sum of anomalous SST in the tropical Pacific and IPWP region shows a significantly positive anomaly, with the strongest signal in the tropical Pacific, which suggests that its distribution has an ENSO–like pattern. And it agrees well with the finding about the significant correlation between ENSO and IO warm pool discovered by Kim et al. (2012) and Zhao et al. (2019). Therefore, this study aims to find out the commonality between the selected IPWP events and the ENSO events during this period, and the physical process modulating and affecting the atmospheric circulation.
To further explore the relationship between IPWP warm/cold conditions and ENSO phases, the possible effects of ENSO warm and cold phases are analyzed. Based on the Niño 3 index from HadISST, the ENSO events in 1948–1978 have been classified into 8 El Niño events and 6 La Niña events. Every ENSO event is ulteriorly separated into development year and decay year (Table 2). The comparison shows that four of the five IPWP warm events have good agreement with El Niño decay events, and all the five IPWP cold events correspond to the La Niña decay events. Furthermore, the four warm IPWP events (1958, 1969, 1970 and 1973) well agree with strong El Niño events. The results connote that the occurrence of IPWP warm events is associated with the decaying phases of the strong El Niño, while the cold IPWP events are related to the decaying phases of the La Niña.
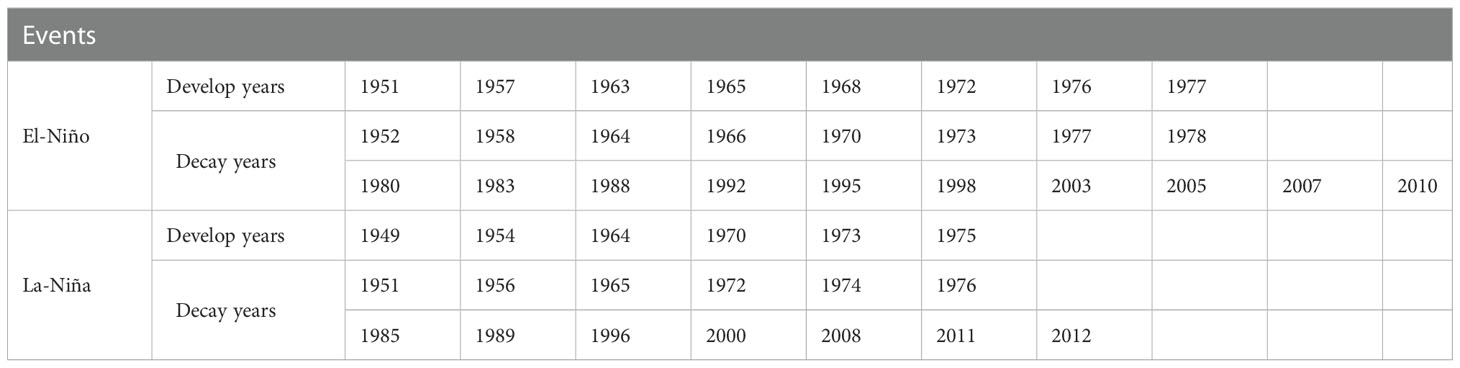
Table 2 Development and decay years of El-Niño and La-Niña.
To further reveal the possible influences of ENSO on SST over the IPWP region, the composite SST anomalies under El Niño and La Niña decay years are shown in Figure 9. The spatial distributions under the two ENSO decay phases are similar to those under the two IPWP events, respectively. A larger positive anomaly and a negative anomaly also exist over the southern IO. However, there are some different distribution features, especially in the tropical eastern Pacific. The SST presents a negative anomaly during El Niño decay years and a weaker positive anomaly during IPWP warm years. In addition, the positive SST anomaly in the tropic eastern Pacific during La Niña decay years is slightly stronger than that during IPWP cold years. This discrepancy mainly results from the lagged effect between ENSO and the IPWP (Kim et al., 2012). Although there are some differences, the spatial distributions of SST anomalies under IPWP conditions are highly correlated with those under different ENSO phases, with a correlation coefficient of 0.83 between IPWP cold events and La Niña decay phase and a coefficient of 0.58 between IPWP warm events and El Niño decay phase. The results indicate that the SST anomalies during the anomalous IPWP events are mainly caused by the different phases of ENSO. Previous studies have found that the ENSO events can cause an anomalous distribution of SST [e.g., Lin et al. (2013); Guo and Tan (2018); Sun et al. (2018)]. Under El Niño and La Niña decay events, the anomalous SST within the IPWP leads to an anomalous meridional gradient of SST. Since the meridional circulation are determined by the meridional gradient of SST (Feng et al., 2016). To this point, the meridional profiles of the zonal-mean SST anomalies over the IPWP under ENSO decay conditions are examined (Figure 10). It is seen that the SST anomalies present different meridional anomalies between the El Niño and La Niña decay phases. The SST profile during the El Niño decay phases present an equatorial asymmetric structure with larger amplitude to the south of the equator; however, the anomalous SST are insignificant. This result implies the SST anomalies within the IPWP along with the El Niño decay phase could not significantly alter the meridional structure of the IPWP SST, paralleling to little variation in the response ratio during the warm IPWP events.
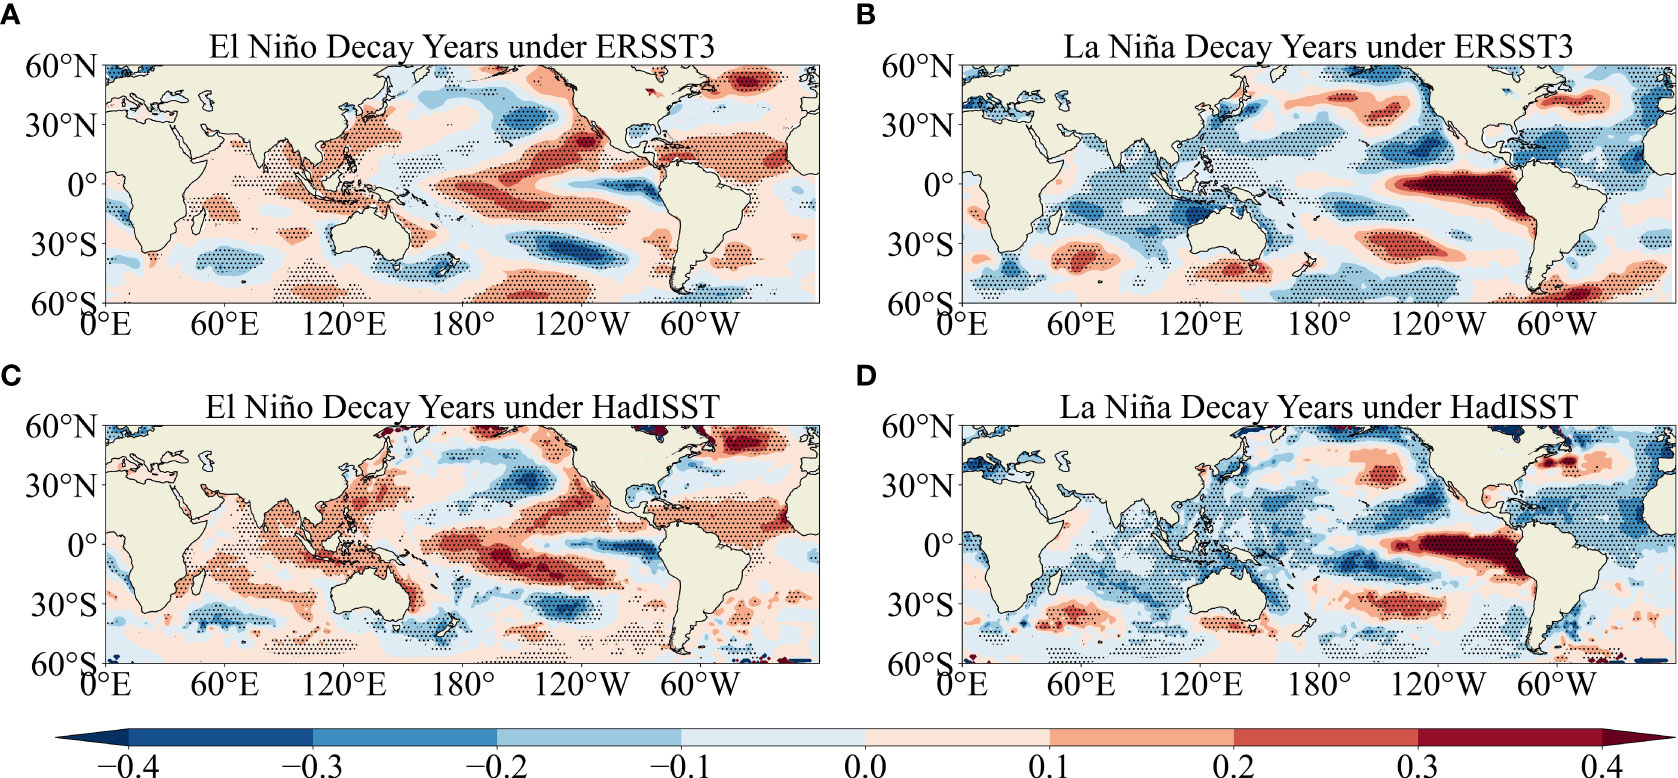
Figure 9 Composite SST anomalies from the ERSST3 dataset (A) during El Niño decay events and (B) La Niña decay events. (C, D) as in (A, B) but for the HadISST dataset. The dotted represent significance at the 0.05 level.
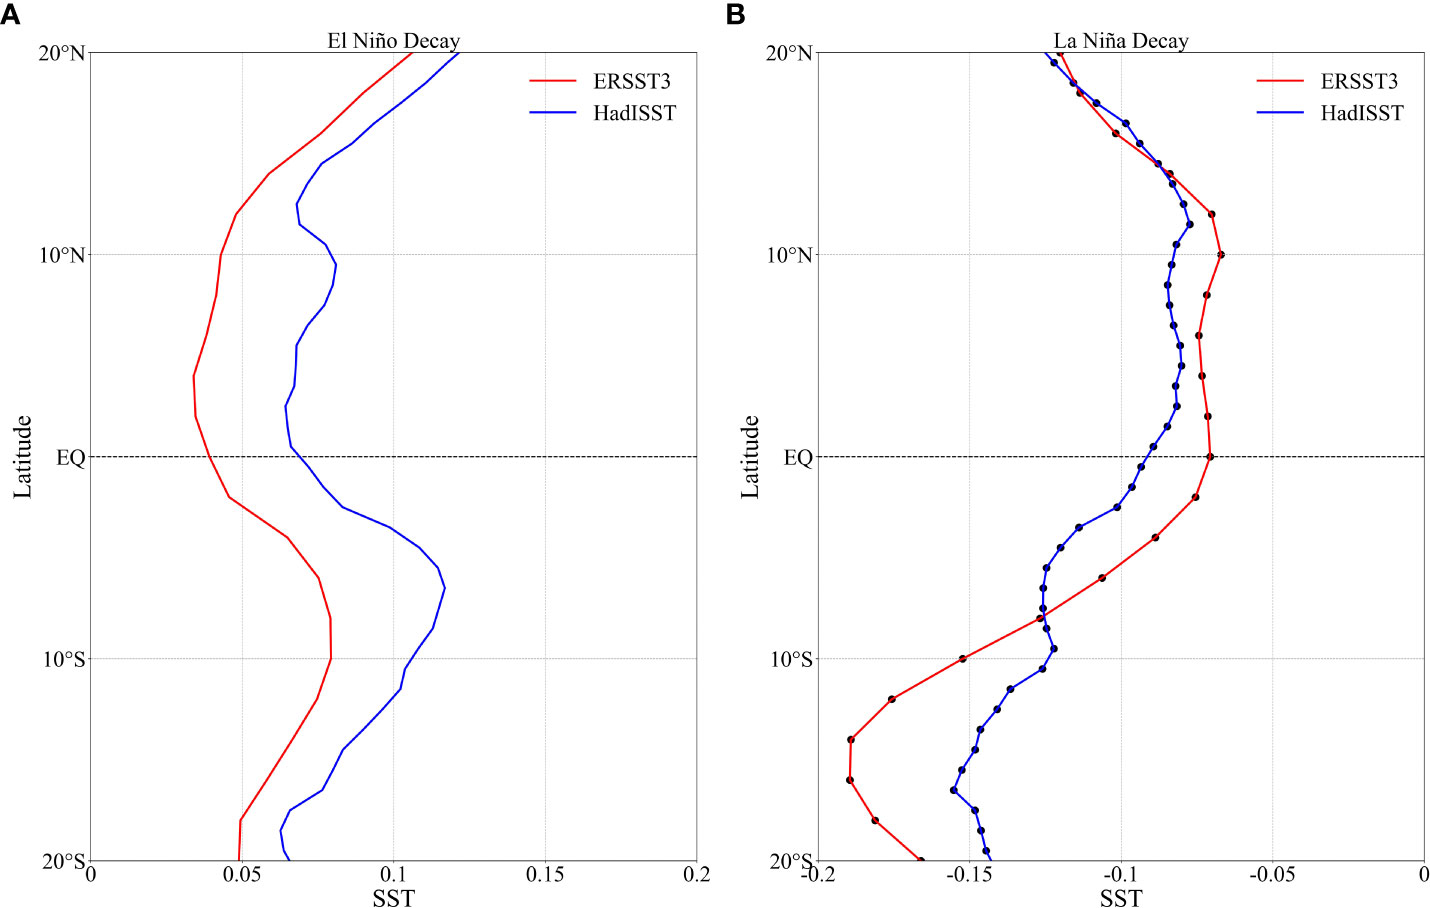
Figure 10 (A) Profiles of zonal-mean SST over the IPWP region for El Niño decay events and (B) La Niña decay events. The red and blue lines indicate the ERSST3 and HadISST fields, respectively. The dark spots represent significance at the 0.01 level.
Under La Niña decay conditions, the SST shows significant negative anomalies with larger magnitude in the SH. Note that the meridional structure of the anomalous SST associated with the La Niña decay phase agree with that in the SEA EOF1, which shows negative values in the SH. This result indicates the equatorially symmetric component of the SST would be suppressed in the cold IPWP events, consistent with the enhanced explained variance of the HES EOF1 during the cold IPWP events. Meanwhile, the significant negative SST anomalies with different magnitude between the SH and NH within the whole IPWP would induce an anomalous SST meridional gradient, which would intensify the amplitude of equatorially asymmetric component. Previous studies have shown that a larger (less) meridional gradient of SST would induce a stronger (weaker) atmospheric anomaly from observations, simulations and theoretical experiments (Lindzen, 1994; Feng et al., 2016; Sun et al., 2018; Xie et al., 2022). And the transition of meridional gradient profile of SST under different phases will affect the location of anomalous atmospheric convergence. Therefore, the response of the HEA to SEA would be decreased under the significantly negative anomaly during the La Niña decay phases, leading to a suppressed response ratio of HEA to SEA (Table 1). Hence, in contrast to the climatological mean response ratio of HEA to SEA, the response ratio for IPWP cold events is smaller. It should be noticed that a suppressed response of the HC to SST over IPWP region since 1980 (Feng et al., 2018), and they pointed out that the suppressed phenomenon is resulted by the equatorially symmetric structure of SST anomaly under cold phase. The different mechanism is mainly connected with the different status of SST anomaly during the two periods (Yin et al., 2020). Thus, different meridional distribution and magnitude of SST anomalies under different underlying thermal conditions can explain the restrained response contrast of HC to SST under IPWP cold phase.
The above analysis shows that the meridional circulation has been affected by the anomalous SST meridional distribution in ENSO events from 1948 to 1978, especially under La Niño decay conditions. To further establish the role of La Niño decay phase in determining the suppressed relationship between the HC and SST during the IPWP cold conditions, we have expanded the result to the period after 1979. Seven La Niña decay years are selected during the period 1979 to 2020 (Table 2). A similar variation characteristic has been obtained between the two atmospheric circulation fields (NCEP-REA1 and NCEP-REA2) and ERSST3 dataset, and only the results from NCEP-REA2 and ERSST3 are shown in Figure 11. As can be seen, the response contrast of HC to SST is about 2 (an averaged value of NCEP-REA1 and NCEP-REA2). This result further confirms the influence mechanism about a decreased response ratio of HEA to SEA under La Niña decay conditions, which further leads to a suppressed response contrast of HC to SST.
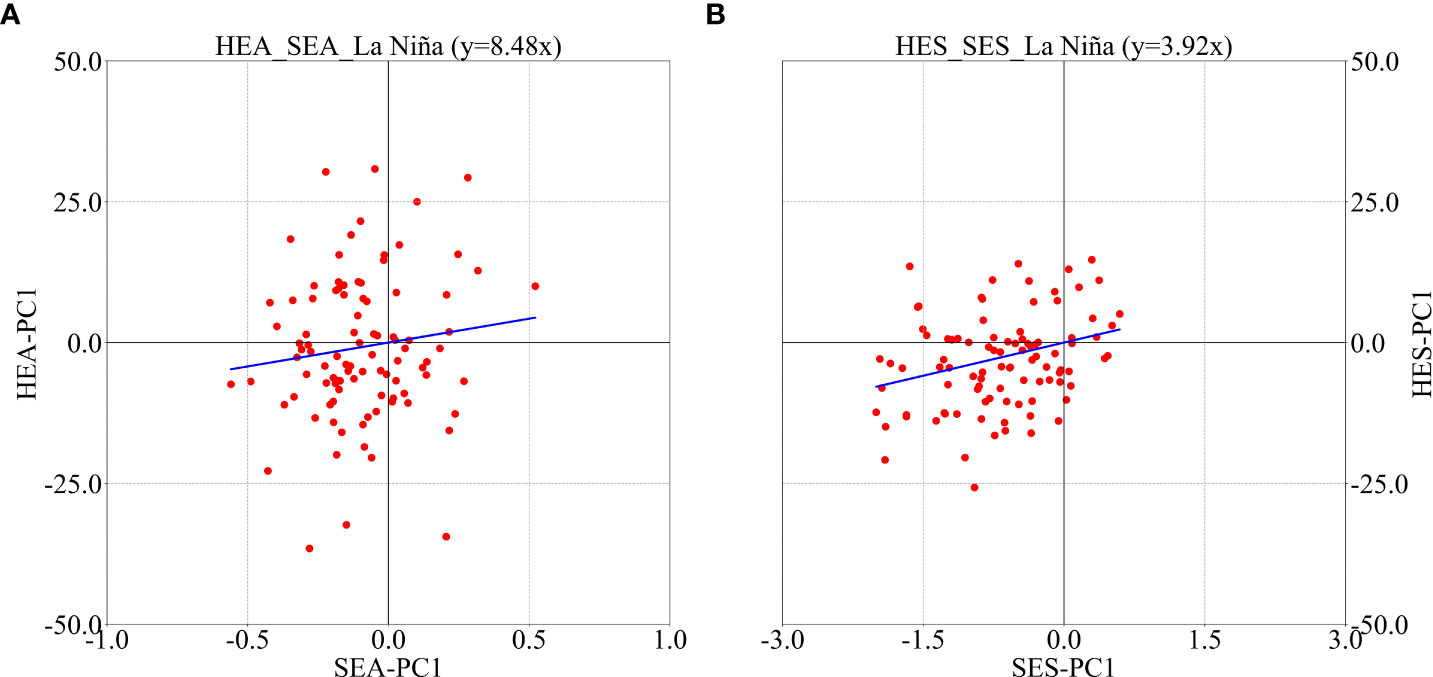
Figure 11 (A) Scatterplot of the SEA PC1 values against the HEA PC1 values for the La Niña decay events since 1979 (circle) and their linear fitting line (blue) using NCEP Reanalysis 2 dataset. (B) as in (A) but for the SES PC1 values against the HES PC1 values.
The above findings indicate the different response ratios of the HC to SST during different IPWP thermal conditions, which are caused by the correspondingly anomalous SST under different ENSO phases. The meridional gradient changes of SST anomalies under El Niño decay years and La Niña decay years lead to an anomalous meridional SST gradient, resulting a suppressed relationship between the HC and tropical SST. In addition, another significant difference of SST anomaly under the two IPWP phases is found in the north Atlantic Ocean (Figure 8) named as the Atlantic Multidecadal Oscillation (AMO). Goswami et al. (2006) proposed a mechanism to explain the relationship between AMO and tropical IO: a positive-phase AMO will cause atmospheric responses, resulting in a warming variation and strengthening thermal contrast between the Indian sub-continent and the tropic IO. Therefore, the variations of AMO may lead to the variations of asymmetric and symmetric component of HC. It warrants taking a further work on the study of the influence of AMO variations on the HC.
5 Conclusions
In this study, based on five atmospheric and oceanic reanalysis datasets from 1948 to 1978, the influences of the meridional structures of zonal-mean SST on the HC under the IPWP warm and cold conditions are investigated. By using the EOF analysis, the EOF1 of the monthly-mean MSF shows an equatorially asymmetric structure with an explained variance value of 34%, which indicates that an equatorially asymmetric mode takes a dominant role in the variability of long-term monthly mean HC. The EOF1 of tropical SST has a single peak value at the equator and decreases with latitude. And the PC1 of SST has a good agreement with Niño 3 (3.4) index, with a correlation coefficient being 0.86(0.84).
Then, both the HC and SST are decomposed into equatorially asymmetric component (HEA/SEA) and equatorially symmetric component (HES/SES), so as to investigate the influence of different spatial structures of tropical zonal-mean SST on the HC under IPWP warm and cold phases. Five IPWP warm events and five cold events are selected based on the areal-averaged SST anomalies over the IPWP region. The various reanalysis datasets consistently indicate that the response contrast of the HC to SST varies with different IPWP conditions. The response ratio of HEA to SEA is about four times larger than that of HES to SES under IPWP warm phase, comparable to the response contrast in the seasonal cycle (Feng et al., 2016). However, the response contrast of HC to SST under cold IPWP events decreases to two times, implying that the response ratio of HEA to SEA is generally suppressed under the IPWP cold phase which further indicates an asymmetric impact of the IPWP thermal conditions on the relationship between the HC and tropical SST.
The possible influence mechanism of the suppressed response ratio of HC to SST under warm and cold conditions over the IPWP region is investigated. It is seen that four of the five selected IPWP warm events coincide with the El Niño decay yeas, while all of the five cold events are in agreement with La Niña decay years. The profile distribution of SST anomaly demonstrates that the anomalous SSTs within the IPWP during El Niño are insignificant, consistent with the less changed response ratio during the IPWP warm events. However, equatorial asymmetric SST negative anomalies within IPWP are observed during the La Niña decay phases, which would intensify the amplitude of the equatorial asymmetric SST, resulting in suppressed response ratio of the HC to SST during the cold IPWP events. Furthermore, a similar suppressed response contrast value has been obtained by expanding the result from 1979 to 2020. Therefore, it should be noted that the thermal condition of the IPWP plays a pivotal role in affecting the response of HC to SST, by which the modulation of different phases of ENSO is essential.
Finally, an assumption is proposed here. The HC will be continuously affected by the global warming under an endless release of greenhouse gases. It is possible that the poleward expand of HC will continue and further influence the global climate change, but the intensity and range of the HC may show quite different variation features under different underlying thermal conditions. Moreover, with the rapid warming, the interconnection between ENSO events and thermal conditions of IPWP under different time-scales could be changed, the influence of which on the responses of the HC to tropical SST remains uncertain and is worthy further researching. Therefore, understanding the modulation mechanism of the different meridional structures of SST on the HC can provide a useful method to predict the variations of the HC under different scenarios.
Data availability statement
The original contributions presented in the study are included in the article/supplementary material. Further inquiries can be directed to the corresponding author. The EAR-20C was obtained ECMWF from and is available at https://apps.ecmwf.int/datasets/data/era20c-daily/levtype=sfc/type=an/. The NOAA-CIRED-DOE 20CR, NCEP/NCAR reanalysis1, NCEP-Department of Energy Reanalysis, ERSST3, ERSST5, COBESST1 and COBESST2 datasets were obtained from NOAA and are available at http://www.esrl.noaa.gov/psd/data/gridded/. The HadISST dataset was obtained from the Met Office Hadley Centre and is available online at https://www.metoffice.gov.uk/hadobs/hadisst/data/download.html.
Author contributions
XJ and JF designed the original ideas. XJ performed the data processing and analyses. JF contribute the concept of the manuscript. XJ wrote the original manuscript. JF, JL and XC revised and improved the manuscript. All authors contributed to the article and approved the submitted version.
Funding
This work was jointly supported by the National Natural Science Foundation of China (42222501 and 41975079), the Project of Southern Marine Science and Engineering Guangdong Laboratory (Zhuhai) under contract No. SML2020SP008, and the Key Laboratory of Space Ocean Remote Sensing and Application, Ministry of Natural Resources under contract No. 201901001.
Conflict of interest
The authors declare that the research was conducted in the absence of any commercial or financial relationships that could be construed as a potential conflict of interest.
Publisher’s note
All claims expressed in this article are solely those of the authors and do not necessarily represent those of their affiliated organizations, or those of the publisher, the editors and the reviewers. Any product that may be evaluated in this article, or claim that may be made by its manufacturer, is not guaranteed or endorsed by the publisher.
References
Bai W., Liu H., Lin P., Hu S., Wang F. (2022). Indo-pacific warm pool present warming attribution and future projection constraint. Environ. Res. Lett. 17, 054026. doi: 10.1088/1748-9326/ac5edf
Cheng W., Macmartin D. G., Kravitz B., Visioni D., Bednarz E. M., Xu Y., et al. (2022). Changes in Hadley circulation and intertropical convergence zone under strategic stratospheric aerosol geoengineering. NPJ Climate And Atmospheric Sci. 5 (32). doi: 10.1038/s41612-022-00254-6
Compo G. P., Whitaker J. S., Sardeshmukh P. D., Matsui N., Allan R. J., Yin X., et al. (2011). The twentieth century reanalysis project. Q. J. Of R. Meteorological Soc. 137, 1–28. doi: 10.1002/qj.776
De Deckker P. (2016). The indo-pacific warm pool: Critical to world oceanography and world climate. Geosci. Lett. 3, 20. doi: 10.1186/s40562-016-0054-3
Dee D. P., Hersbach H., Poli P., Berrisford P., Simmons A. J., Vitart F., et al. (2016). Era-20c: An atmospheric reanalysis of the twentieth century. J. Of Climate 29, 4083–4097. doi: 10.1175/JCLI-D-15-0556.1
Dima I. M., Wallace J. M. (2003). On the seasonality of the Hadley cell. J. Of Atmospheric Sci. 60, 1522–1527. doi: 10.1175/1520-0469(2003)060<1522:OTSOTH>2.0.CO;2
Dong L., Zhou T., Wu B. (2013). Indian Ocean warming during 1958–2004 simulated by a climate system model and its mechanism. Climate Dynamics 42, 203–217. doi: 10.1007/s00382-013-1722-z
Duan A., Sui C., Wu G. (2008). Simulation of local air-Sea interaction in the great warm pool and its influence on Asian monsoon. J. Of Geophysical Res. 113. doi: 10.1029/2008JD010520
Feng J., Li J. P. (2013). Contrasting impacts of two types of enso on the Boreal spring Hadley circulation. J. Of Climate 26, 4773–4789. doi: 10.1175/JCLI-D-12-00298.1
Feng J., Li J., Jin F., Liu Z., Nan X., Guo Y. (2016). Contrasting responses of the Hadley circulation to equatorially asymmetric and symmetric meridional Sea surface temperature structures. J. Of Climate 29, 8949–8963. doi: 10.1175/JCLI-D-16-0171.1
Feng J., Li J., Kucharski F., Wang Y., Sun C., Xie F., et al. (2018). Modulation of the meridional structures of the indo-pacific warm pool on the response of the Hadley circulation to tropical sst. J. Of Climate 31, 8971–8984. doi: 10.1175/JCLI-D-18-0305.1
Fu Q., Johanson C. M. (2009). Hadley Cell widening: Model simulations versus observations. J. Of Climate 22, 2713–2725. doi: 10.1175/2008JCLI2620.1
Goswami B. N., Madhusoodanan M. S., Neema C. P., Sengupta D. (2006). A physical mechanism for north Atlantic sst influence on the Indian summer monsoon. Geophysical Res. Lett. 33 (2). doi: 10.1029/2005GL024803
Guo Y.-P., Li J.-P. (2016). Impact of enso events on the interannual variability of Hadley circulation extents in Boreal winter. Adv. In Climate Change Res. 7, 46–53. doi: 10.1016/j.accre.2016.05.001
Guo Y., Li J., Feng J., Xie F., Sun C., Zheng J. (2016). The multidecadal variability of the asymmetric mode of the Boreal autumn Hadley circulation and its link to the Atlantic multidecadal oscillation. J. Of Climate 29, 5625–5641. doi: 10.1175/JCLI-D-15-0025.1
Guo Y.-P., Tan Z.-M. (2018). The Hadley circulation regime change: Combined effect of the Western pacific warming and increased enso amplitude. J. Of Climate 31, 9739–9751. doi: 10.1175/JCLI-D-18-0306.1
Hirahara S., Ishii M., Fukuda Y. (2014). Centennial-scale Sea surface temperature analysis and its uncertainty. J. Of Climate 27, 57–75. doi: 10.1175/JCLI-D-12-00837.1
Hou A. Y. (1998). Hadley Circulation as a modulator of the extratropical climate. J. Of Atmospheric Sci. 55, 2437–2457. doi: 10.1175/1520-0469(1998)055<2437:HCAAMO>2.0.CO;2
Huang R., Chen S., Chen W., Hu P., Yu B. (2019). Recent strengthening of the regional Hadley circulation over the Western pacific during Boreal spring. Adv. In Atmospheric Sci. 36, 1251–1264. doi: 10.1007/s00376-019-9004-2
Huang B., Menne M. J., Boyer T., Freeman E., Gleason B. E., Lawrimore J. H., et al. (2020). Uncertainty estimates for Sea surface temperature and land surface air temperature in noaaglobaltemp version 5. J. Of Climate 33, 1351–1379. doi: 10.1175/JCLI-D-19-0395.1
Huang B., Thorne P. W., Banzon V. F., Boyer T., Chepurin G., Lawrimore J. H., et al. (2017). Extended reconstructed Sea surface temperature, version 5 (Ersstv5): Upgrades, validations, and intercomparisons. J. Of Climate 30, 8179–8205. doi: 10.1175/JCLI-D-16-0836.1
Hu S., Chou J., Cheng J. (2018a). Three-pattern decomposition of global atmospheric circulation: Part I–decomposition model and theorems. Climate Dynamics 50, 2355–2368. doi: 10.1007/s00382-015-2818-4
Hu Y., Huang H., Zhou C. (2018b). Widening and weakening of the Hadley circulation under global warming. Sci. Bull. 63, 640–644. doi: 10.1016/j.scib.2018.04.020
Kim S. T., Yu J.-Y., Lu M.-M. (2012). The distinct behaviors of pacific and Indian ocean warm pool properties on seasonal and interannual time scales. J. Of Geophysical Research: Atmospheres 117, D05128. doi: 10.1029/2011JD016557
Lindzen R. S. (1994). Climate dynamics and global change. Annu. Rev. Of Fluid Mechanics 26, 353–378. doi: 10.1146/annurev.fl.26.010194.002033
Lin C.-Y., Ho C.-R., Lee Y.-H., Kuo N.-J., Liang S.-J. (2013). Thermal variability of the indo-pacific warm pool. Global And Planetary Change 100, 234–244. doi: 10.1016/j.gloplacha.2012.10.022
Lo L., Shen C. C., Wei K. Y., Burr G. S., Mii H. S., Chen M. T., et al. (2014). Millennial meridional dynamics of the indo-pacific warm pool during the last termination. Climate Of Past 10, 2253–2261. doi: 10.5194/cp-10-2253-2014
Luo J. J., Sasaki W., Masumoto Y. (2012). Indian Ocean warming modulates pacific climate change. Proc. Natl. Acad. Sci. U.S.A. 109, 18701–18706. doi: 10.1073/pnas.1210239109
Ma J., Li J. (2008). The principal modes of variability of the Boreal winter Hadley cell. Geophysical Res. Lett. 35 (1). doi: 10.1029/2007GL031883
Oort A. H., Rasmusson E. M. (1970). On the annual variation of the monthly mean meridional circulation. Monthly Weather Rev. 98, 423–442. doi: 10.1175/1520-0493(1970)098<0423:OTAVOT>2.3.CO;2
Qin Y., Wang P., Guan Z., Yue Y. (2006). Comparison of the Hadley cells calculated from two reanalysis data sets. Chin. Sci. Bull. 51, 1741–1746. doi: 10.1007/s11434-006-2030-3
Rao S. A., Dhakate A. R., Saha S. K., Mahapatra S., Chaudhari H. S., Pokhrel S., et al. (2011). Why is Indian ocean warming consistently? Climatic Change 110, 709–719. doi: 10.1007/s10584-011-0121-x
Rayner N. A., Parker D. E., Horton E. B., Folland C. K., Alexander L. V., Rowell D. P., et al. (2003). Global analyses of Sea surface temperature, Sea ice, and night marine air temperature since the late nineteenth century. J. Of Geophysical Res. 108, D14. doi: 10.1029/2002JD002670
Roxy M. K., Dasgupta P., Mcphaden M. J., Suematsu T., Zhang C., Kim D. (2019). Twofold expansion of the indo-pacific warm pool warps the mjo life cycle. Nature 575, 647–651. doi: 10.1038/s41586-019-1764-4
Sharmila S., Walsh K. J. E. (2018). Recent poleward shift of tropical cyclone formation linked to Hadley cell expansion. Nat. Climate Change 8, 730–736. doi: 10.1038/s41558-018-0227-5
Sun Y., Li L. Z. X., Ramstein G., Zhou T., Tan N., Kageyama M., et al. (2018). Regional meridional cells governing the interannual variability of the Hadley circulation in Boreal winter. Climate Dynamics 52, 831–853. doi: 10.1007/s00382-018-4263-7
Trenberth K. E., Stepaniak D. P. (2003). Seamless poleward atmospheric energy transports and implications for the Hadley circulation. J. Of Climate 16, 3706–3722. doi: 10.1175/1520-0442(2003)016<3706:SPAETA>2.0.CO;2
Watanabe M., Dufresne J.-L., Kosaka Y., Mauritsen T., Tatebe H. (2020). Enhanced warming constrained by past trends in equatorial pacific Sea surface temperature gradient. Nat. Climate Change 11, 33–37. doi: 10.1038/s41558-020-00933-3
Weller E., Min S. K., Cai W., Zwiers F. W., Kim Y. H., Lee D. (2016). Human-caused indo-pacific warm pool expansion. Sci. Adv. 2, E1501719. doi: 10.1126/sciadv.1501719
Wu Y.-K., Chen L., Hong C.-C., Li T., Chen C.-T., Wang L. (2017). Role of the meridional dipole of ssta and associated cross-equatorial flow in the tropical Eastern pacific in terminating the 2014 El niño development. Climate Dynamics 50, 1625–1638. doi: 10.1007/s00382-017-3710-1
Xian T., Xia J., Wei W., Zhang Z., Wang R., Wang L.-P., et al. (2021). Is Hadley cell expanding? Atmosphere 12 (12), 1699. doi: 10.3390/atmos12121699
Xiao F., Wang D., Leung M. Y. T. (2020). Early and extreme warming in the south China Sea during 2015/2016: Role of an unusual Indian ocean dipole event. Geophysical Res. Lett. 47. doi: 10.1029/2020GL089936
Xiao F., Wang D., Zeng L., Liu Q.-Y., Zhou W. (2019). Contrasting changes in the Sea surface temperature and upper ocean heat content in the south China Sea during recent decades. Climate Dynamics 53, 1597–1612. doi: 10.1007/s00382-019-04697-1
Xiao F., Zeng L., Liu Q.-Y., Zhou W., Wang D. (2017). Extreme subsurface warm events in the south China Sea during 1998/99 and 2006/07: Observations and mechanisms. Climate Dynamics 50, 115–128. doi: 10.1007/s00382-017-3588-y
Xie X., Huang P., Zhou S., Zhang J. (2022). Changes in enso-driven Hadley circulation variability under global warming. Atmospheric Res. 274 (15). doi: 10.1016/j.atmosres.2022.106220
Yan X. H., Ho C. R., Zheng Q., Klemas V. (1992). Temperature and size variabilities of the Western pacific warm pool. Science 258, 1643–1645. doi: 10.1126/science.258.5088.1643
Yin X., Huangfu J., Zhou L.-T. (2020). An interdecadal extension of the indo-pacific warm pool and its strengthened influence on the south China Sea summer monsoon since the late 1980s. Environ. Res. Lett. 15, 064015. doi: 10.1088/1748-9326/ab8588
Yu M., Feng J., Li J., An R. (2022) Interdecadal shift of the El niño’s modulation on the connection between the Hadley circulation and tropical sst. Climate Dynamics. doi: 10.1007/s00382-022-06522-8
Zaplotnik Ž., Pikovnik M., Boljka L. (2022). Recent Hadley circulation strengthening: A trend or multidecadal variability? J. Of Climate 35, 4157–4176. doi: 10.1175/JCLI-D-21-0204.1
Zhang G., Wang Z. (2013). Interannual variability of the Atlantic Hadley circulation in Boreal summer and its impacts on tropical cyclone activity. J. Of Climate 26, 8529–8544. doi: 10.1175/JCLI-D-12-00802.1
Zhao S., Jin F. F., Stuecker M. F. (2019). Improved predictability of the Indian ocean dipole using seasonally modulated enso forcing forecasts. Geophysical Res. Lett. 46, 9980–9990. doi: 10.1029/2019GL084196
Zhou X., Li J., Xie F., Ding R., Li Y., Zhao S., et al. (2017). The effects of the indo-pacific warm pool on the stratosphere. Climate Dynamics 51, 4043–4064. doi: 10.1007/s00382-017-3584-2
Zhou C., Lu J., Hu Y., Zelinka M. D. (2020). Responses of the Hadley circulation to regional Sea surface temperature changes. J. Of Climate 33, 429–441. doi: 10.1175/JCLI-D-19-0315.1
Keywords: hadley circulation, sea surface temperature, indo-pacific warm, el niño, la niña
Citation: Ji X, Feng J, Li J and Chen X (2023) Relationship between the hadley circulation and tropical SST meridional structures under different thermal conditions in the indo-pacific warm pool. Front. Mar. Sci. 9:1088276. doi: 10.3389/fmars.2022.1088276
Received: 04 November 2022; Accepted: 15 December 2022;
Published: 12 January 2023.
Edited by:
Chunyan Li, Louisiana State University, United StatesReviewed by:
Lei Zhou, Shanghai Jiao Tong University, ChinaDongxiao Wang, South China Sea Institute of Oceanology (CAS), China
Copyright © 2023 Ji, Feng, Li and Chen. This is an open-access article distributed under the terms of the Creative Commons Attribution License (CC BY). The use, distribution or reproduction in other forums is permitted, provided the original author(s) and the copyright owner(s) are credited and that the original publication in this journal is cited, in accordance with accepted academic practice. No use, distribution or reproduction is permitted which does not comply with these terms.
*Correspondence: Juan Feng, fengjuan@bnu.edu.cn