 Bin Wang1,2,3
 Jianfang Chen1,2,4*
 Haiyan Jin2,4
 Dewang Li2
 Shengquan Gao2
 Shichao Tian5Lin Sun2,6Haizhou Zhang7Linwei Li2,6
- 1College of Oceanography, Hohai University, Nanjing, China
- 2Key Laboratory of Marine Ecosystem Dynamics, Second Institute of Oceanography, Ministry of Natural Resources, Hangzhou, China
- 3Donghai Laboratory, Zhoushan, China
- 4State Key Laboratory of Satellite Ocean Environment Dynamics, Second Institute of Oceanography, Ministry of Natural Resources, Hangzhou, China
- 5Institute of Grassland Research, Chinese Academy of Agriculture Science, Hohhot, China
- 6Ocean College, Zhejiang University, Zhoushan, China
- 7North China Sea Marine Forecasting Center of State Oceanic Administration, Qingdao, China
The summer hypoxia off the Changjiang Estuary is one of the largest coastal hypoxic systems in the world and has displayed spatial heterogeneity in recent years. Based on observation data in the summer of 2014, hypoxia was identified both in the bottom and mid-layers. Except for the typical bottom hypoxia in the submarine canyon, the subsurface oxygen minima (SOM) were captured in the mid-layer of 10~15 m, with lower dissolved oxygen in the mid-layer than at the bottom (30–50 m). This SOM phenomenon was located in the lower boundary of the pycnocline and above the Taiwan warm current (TWC) and Kuroshio subsurface water (KSSW). Due to the southern expansion of Changjiang diluted water (CDW), a high phytoplankton biomass (the maximum chlorophyll a of 25 μg L−1, pH of 8.6, and DO of 11 mg L−1) band occupied the surface area along 123°E. By analyzing the 24-h continuous observation and high-resolution profile data, we revealed that the subsurface oxygen minima were predominantly controlled by remineralization and bottom-flushing effects. Fast local consumption occurred near the pycnocline layer, while the lateral transport of oxygen-rich ambient water replenished the bottom oxygen deficit from south to north. We summarize and contextualize three hot spots of hypoxia into a conceptual diagram and emphasize the influences of advection, mixing, and respiration on their location and severity. Overall, compared with the discussion about the low DO background of TWC/KSSW, this research highlights the flushing effects of TWC/KSSW that will reshape the hypoxia structure and alleviate the hypoxia severity in the south hypoxia area off the Changjiang Estuary.
1. Introduction
Increases in the severity and extent of coastal hypoxia (dissolved oxygen (DO)<62 μmol kg−1; i.e., about 25% of air saturation) have been reported globally. It is usually attributed to the combined forcing of global warming (Gruber, 2011; Laurent et al., 2018; Bates and Johnson, 2020) and excess anthropogenic nutrient enrichment (Rabalais et al., 2014; Levin, 2018; Pitcher et al., 2021). Changes in DO concentration in seawater from 1976 to 2000 decreased nearshore (<300 m) at a rate of −0.28 μmol kg−1 year−1 (Gilbert et al., 2010). This rate was much faster than the rate of decrease in the open sea (−0.02 μmol kg−1 year−1). Reduced dissolved oxygen in aquatic systems will subsequently influence the living resources in coastal ecosystems (Levin et al., 2015; Levin, 2018; Fennel and Testa, 2019).
Eutrophication and biogeochemical processes in estuaries and coastal oceans are the leading causes of hypoxia (Diaz and Rosenberg, 2008; Rabalais et al., 2014; Fennel and Testa, 2019). However, recent studies have emphasized the importance of ocean dynamics (such as circulations and wind stress) in determining the different structures of hypoxia. For example, the subsurface oxygen minima occurred in several coastal areas, in contrast to the normal bottom hypoxia. In coastal California upwelling systems, deep water with low oxygen and nutrient enrichment enters the shelf and aggravates the coastal hypoxia (Grantham et al., 2004). In Tokyo Bay, the intrusion of outer seawater causes the redistribution of low-oxygen water masses at the bottom of the bay and the emergence of subsurface layers of hypoxia (Fujiwara and Yamada, 2002). On the Louisiana shelf, midwater oxygen minimum layers affect the vertical distribution of zooplankton and fish (Parker-Stetter et al., 2009). Current- and wave-induced resuspension brought the organic matter (OM) to the offshore mid-shelf area, resulting in the subsurface oxygen minima (SOM) (Fry et al., 2015). Overall, coastal hypoxia has displayed spatial heterogeneity in recent years due to the fluctuation of dynamic physical and biological processes.
Hypoxia off the Changjiang Estuary (CJE) in the East China Sea (ECS) has been increasingly reported and has experienced large interannual variability in spatial extent and duration. Dynamic changes in the Changjiang diluted water (CDW) (Zhang et al., 2018; Wei et al., 2021a), topography (Wang et al., 2012; Zhu et al., 2016), and variations of wind patterns (Ni et al., 2016) and ocean circulations (Zhou et al., 2017) appear to modulate the structure of the hypoxia jointly each year. The coupling between surface phytoplankton bloom and bottom hypoxia has been confirmed in several studies (Wang et al., 2017; Chen et al., 2021a; Meng et al., 2022). Furthermore, a temporal and spatial mismatch or decoupling of surface high-biomass regions and hypoxic zones was also observed. Nonuniform offshore advection and detachment of subsurface segments of water underlying the Changjiang River plume are the key drivers (Zhou et al., 2020; Wei et al., 2022). Zhang et al. (2022) characterized the use of timescales of deficit and residence to evaluate near-bottom DO variations. More recently, Wei et al. (2021b) reported the mid-layer hypoxic phenomenon in the Zhejiang coastal area in August 2018 and attributed it to the seaward expansion of low-oxygen water protruding from the bottom-sloping region. As hypoxia expands off the CJE (Chen et al., 2020; Wang et al., 2021), the vertical structure of oxygen and nutrients becomes increasingly important (Wei et al., 2022). The pelagic organisms are more sensitive to oxygen than the benthos, thus the mid-layer hypoxia would be disastrous for their survival, especially for small zooplankton and juvenile fishes (Vaquer-Sunyer and Duarte, 2008; Hofmann et al., 2011).
During the field cruise in the summer of 2014, we first observed a SOM occurring in the 15–20 m water layer instead of the bottom water. In this study, we focus on three objectives. (1) We determined the cause of the southward expansion of CDW during summer rather than the usually defined northeastern expansion because of the southern wind. (2) Using the 24-h continuous observation and high-resolution profile data, we present the vertical structure of these subsurface oxygen minima and elucidate their controlling mechanisms. (3) We discussed the bottom-flushing effects of the Taiwan warm current (TWC) and Kuroshio subsurface water (KSSW) and their potential role in modulating the extent of summer hypoxia in the ECS.
2. Materials and methods
2.1. Study area
The ECS is one of the largest marginal seas in East Asia and is mainly affected by the East Asian monsoon, with the southwestern monsoon occurring in summer and the northeastern monsoon occurring in winter (Liu et al., 2003). The spreading of CDW and the offshore circulation are the two main dynamic processes in the estuarine and offshore areas. Changjiang (also known as Yangtze River), the third largest river in the world, has an annual discharge of 9.25 × 10¹¹ m3 year−1, a sediment load of 2.5 × 10¹⁴ g year−1, and an organic matter of 3 × 10¹² g C year−1. More importantly, a large number of nutrients (9 × 10¹¹ g year−1 of nitrate, 2 × 10¹⁰ g year−1 of phosphate) were transported into the ECS, fueling one of the most productive continental shelf seas in the world (Liu et al., 2015; Zhang et al., 2021). Summertime Changjiang River plumes are highly variable but generally have three typical pathways of plume extension (Xuan et al., 2012; Wu et al., 2014; Moon et al., 2019): northeastward, eastward, and southeastward (Bai et al., 2014). Among them, the less-captured southward expansion of CDW is important to fuel the biomass in Min–Zhe coastal area, which is usually observed in the dry season (Wu et al., 2014). In the subsurface, the TWC and KSSW were mixed together and moved northward to Zhejiang offshore areas. It can reach 32°N at the end of the submarine canyon, which is located off the CJE along the 50-m isobaths around 122.5°–123°E (Wang, 1991; Su, 1998). With low temperature (14.8°C), high salinity (34.6), and high phosphate (with N/P<16) (Chen and Wang, 1999), the substantial intrusion of TWC/KSSW (N/P<16) in summer in the subsurface water can alleviate the phosphorus limitation caused by the “excess nitrogen” in the ECS (N/P>16) (Wong et al., 1998; Yang et al., 2012). Continuous nutrient input from river plumes in the upper and TWC/KSSW in the subsurface co-support the high primary productivity in the summer of inner ECS. The average annual chlorophyll a concentration on the inner shelf of ECS is 1.05 mg m−3 (Chen et al., 2003; Furuya et al., 2003; Yamaguchi et al., 2012; Hao et al., 2019). High OM deposition and subsequent decomposition reduce the DO in the bottom layer, resulting in an increasingly severe seasonal bottom hypoxia phenomenon in the ECS (Wang et al., 2017; Zhou et al., 2020).
2.2. Sampling and method
The field cruise was conducted onboard the R/V Zhehaihuanjian off the CJE from 21 August to 05 September 2014 (Figure 1). Water depths at the sampling stations ranged from the surface to 75 m. At each station, discrete seawater samples from one to five layers were collected using Niskin bottles mounted with a precalibrated CTD unit (Sea-Bird Electronics, SBE-917 plus Bellevue, WA, 98005 USA). For DO measurements, samples collected from the Niskin bottles were fixed and titrated onboard following the classic Winkler procedure, which has a precision of ±1 μmol L–1. A pH analyzer (Orion Star Newton Drive, Carlsbad, 9200, USA) with an Orion®8102BN Ross combination electrode calibrated against three NIST standard buffers (4.01, 7.00, and 10.01) was used to measure pH with a precision of 0.01 units.
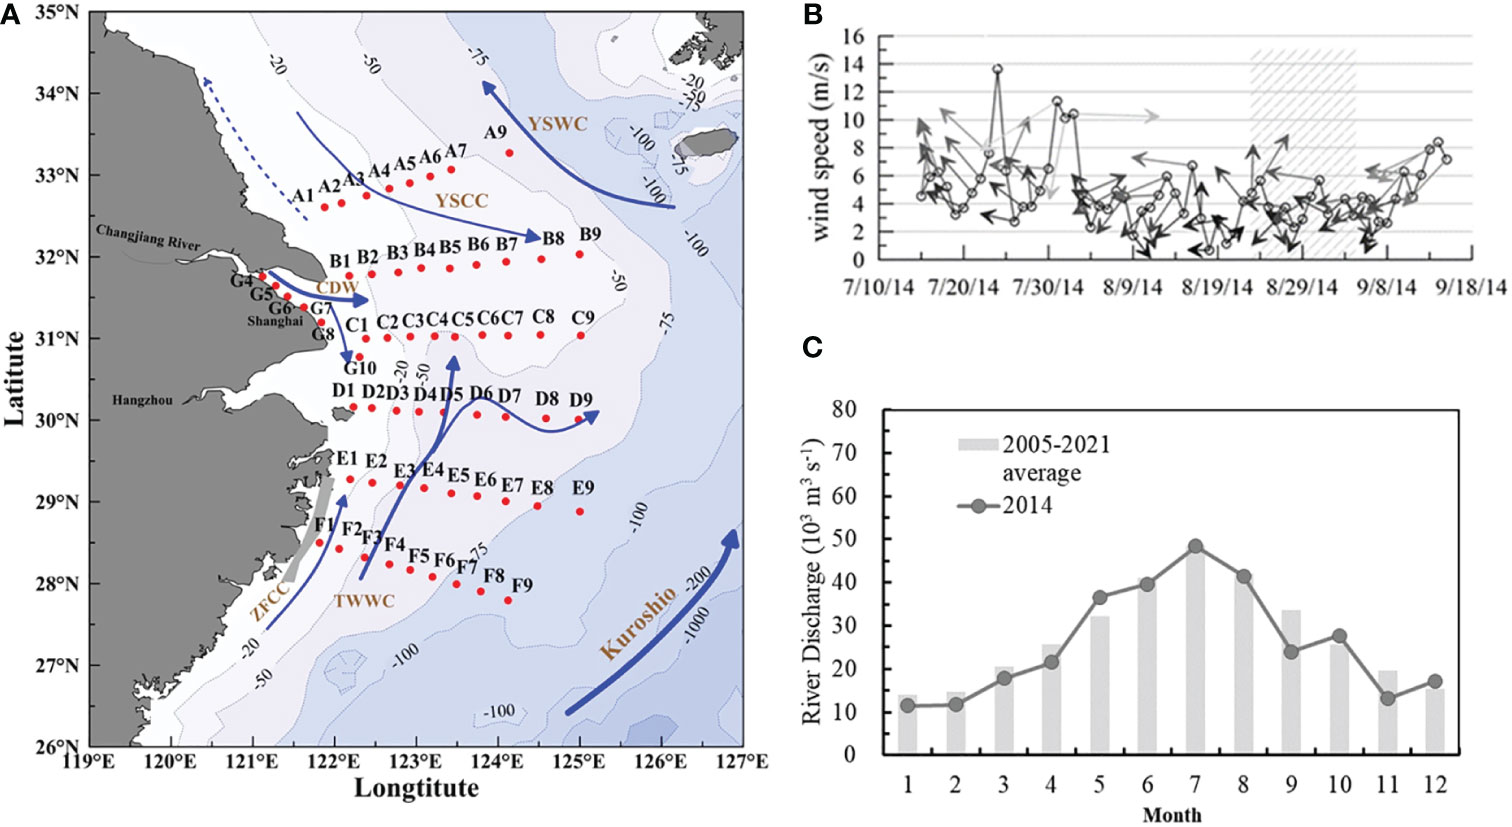
Figure 1 Study area and station map marked with coastal ocean currents. (A) Sampling stations are marked with solid red dots, and the solid blue arrow lines represent the primary circulation in the ECS in summer. The gray-shaded area is the upwelling area of Min–Zhejiang. (CDW, Changjiang diluted water; TWC, Taiwan warm current; YSWC, Yellow Sea warm current; YSCC, Yellow Sea coastal current; ZFCC, coastal current of Fujian and Zhejiang). (B) Daily wind pattern from July to September; shaded rectangle represents the sampling period. (C) Monthly averaged river discharge at Datong hydrological stations in 2014, and averaged 2005–2021.
Nutrient samples were filtered through cellulose acetate filters (0.45 μm pore size) and then refrigerated. A Skalar San++ automated analyzer was used to determine the concentrations of nitrate, silicate, and phosphate. The quantification limits (in μmol L−1) are 0.1 for nitrate, 0.1 for silicate, and 0.03 for phosphate, with a precision of 5% (Grasshoff et al., 2009). Chl a was measured using a Turner Designs 10-AU fluorometer. Dissolved inorganic carbon (DIC) was measured in triplicate using a DIC analyzer (Apollo Scitech Inc. Newark, DE 19713 USA, AS-C3), whereas total alkalinity (TA) was measured in duplicate using open-cell Gran titrations with 25 ml samples (Apollo Scitech Inc., AS-ALK2 alkalinity titrator). Both of these methods have a precision of better than 0.1% ( ± 2 µmol kg−1) (Cai et al., 2011; Huang et al., 2012). Certified reference materials (CRMs) from Dickson et al. (2007) were used for daily DIC and TA calibrations.
2.3. Model calculations
Three-end-member mixing models have been used to distinguish the effects of physical mixing and biological processing on the concentrations of seawater constituents (Han et al., 2012; Sarmiento and Gruber, 2013). Using these end-member characteristics (Table 1) in combination with the θ and S measured for each sample, we can determine the fractional contribution fi of each water mass i and thereby predict the conservative concentrations of nutrients, DO, DIC, and TA. The difference (Δ) between the calculated and the measured constituent was attributed to biological effects (Su et al., 2017; Wang et al., 2017). In this study, we only chose the central and south stations to discuss the water mass fractions. fa represents the traction of CDW, fb represents the fraction of shelf surface water (SSW), and fc represents the fraction of shelf bottom water (SBW). SBW has also been introduced as the TWC/KSSW in this study.
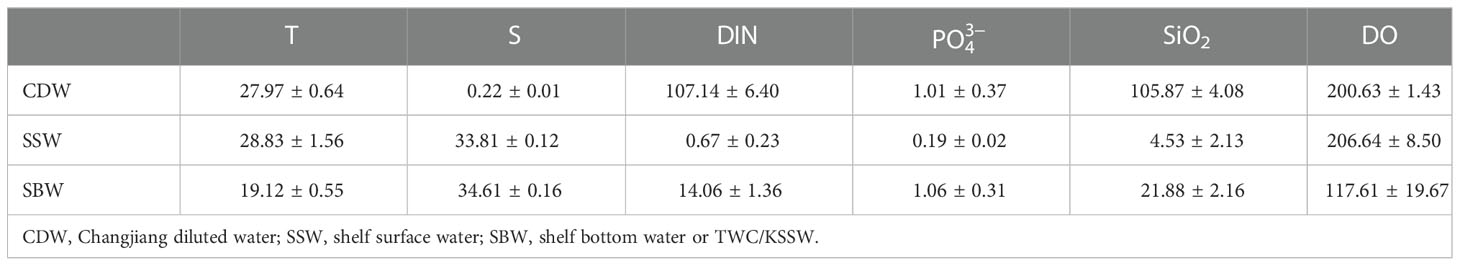
Table 1 End-member of different water masses in August 2014.
3. Results
3.1. Spatial distributions of salinity and dissolved oxygen
Apart from the usual northeast expansion in summer, the low-salinity water in late August 2014 expanded mainly to the south and southeast areas (Figure 2). From the surface to 10 m depth, the CDW with salinities less than 30 covered a large area from 29°N to 32°N and west of 124°E (Figure 2A). The strong north-south salinity front was prominent on the surface at 123°E, and a similar salinity front still existed up to 10 m depth. In the inner frontal area, the salinity range was 22–30. Outside of this salinity front area, the surface salinity was approximately 31–32. Below 20 m depth, higher-salinity (>32) TWC/KSSW occupied in the south area of 32°N. In the bottom water, the saline bottom water (S>34) covered a large area from 29°N to 32°N in latitude and 122°E to 125°E in longitude, indicating the intrusion of TWC/KSSW in this summer. For DO, there was a large high-DO area from 122°E to 123.5°E and from 28°N to 30°N at the surface. The highest DO concentration was 11 mg L−1. This wide high-DO (DO>8 mg L−1) band was consistent with the CDW plume area, mainly located in the inner part of the salinity front. The DO distribution pattern in the 10-m layer had two low-DO centers. One was located off the CJE, with the DO decreased to 4 mg L−1. The other low-DO center was located at 28°N, 123°E. In the 20 m layers, a low-DO (DO<3 mg L−1) tongue spread from the far eastward inner shore to 125°E. The canter transect was immediately off the CJE at approximately 31°N. In the bottom water, hypoxic water was observed centered at 31°N, 123°E, where the submerged valley of the CJE existed.
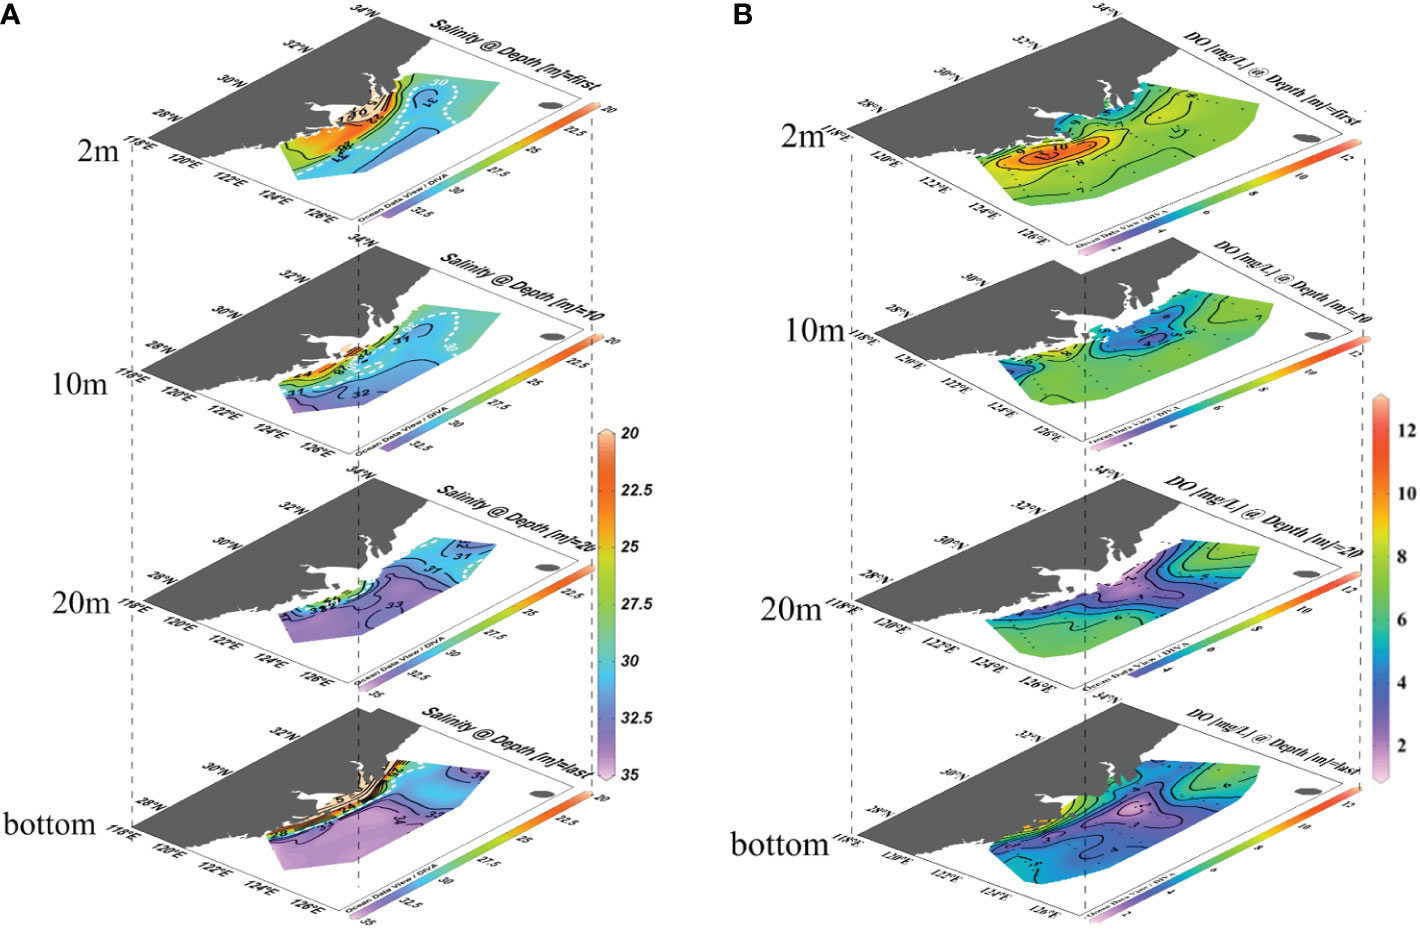
Figure 2 Salinity and DO spatial distributions in the water column (depth of 2 m, 10 m, 20 m, and bottom). (A) Salinity distribution. (B) Dissolved oxygen distribution map (unit: mg L−1). The distributions of salinity and DO at the bottom layer cover the regions with varying depths and intersect with the upper layers at nearshore regions.
For transect distribution, the largest vertical hypoxic area was located in section C, at approximately 31°N, 122.5–123.5°E. The hypoxic zone then decreased to the north (sections A and B) and south (sections D, E, and F). In the southern area, low-DO water only occupied a limited area, close to the west inner-shore area, with a depth of less than 50 m (Figure 3), and was absent in the eastern area. Notably, the SOM can be captured in sections C, D, and F but not in sections A, B, and E. This SOM occurred in the upper 15–20 m along 123°E, with a water depth of >50 m. In particular, the subsurface oxygen minima in sections C and D were closely connected to the hypoxic core area, whereas in section F, the SOM was separated and detached from the hypoxic core. In across-shore transect G-C (Figure 4), the hypoxia zone is consistent with TWC/KSSW coverage, with a low temperature (<22°C), high-density anomaly, low N/P ratio (N/P<15), and high SBW fraction (fc) (>0.8). In the upper area above the hypoxic area, the subsurface chlorophyll a maximum (SCM) was prominent at a depth layer of 10 m. However, in cross-shore transect D (Figure 5), the hypoxia zone is located on the inner nearshore side, which is absent from the TWC/KSSW with an fc of 0.7. Above the pathway of TWC/KSSW was the SOM layer. Notably, the SCM also appeared above this SOM layer. For the alongshore 123°E transect (Figure 6), DO concentration declined from south to north until reaching the steepness of the submarine canyon, where hypoxia existed. This hypoxic zone was also characterized by an fc of 0.7, an N/P ratio of 20, and a relatively higher temperature than the TWC core area. Thus, the flushing effects of TWC/KSSW are different between the pathway and when reaching the submarine canyon.
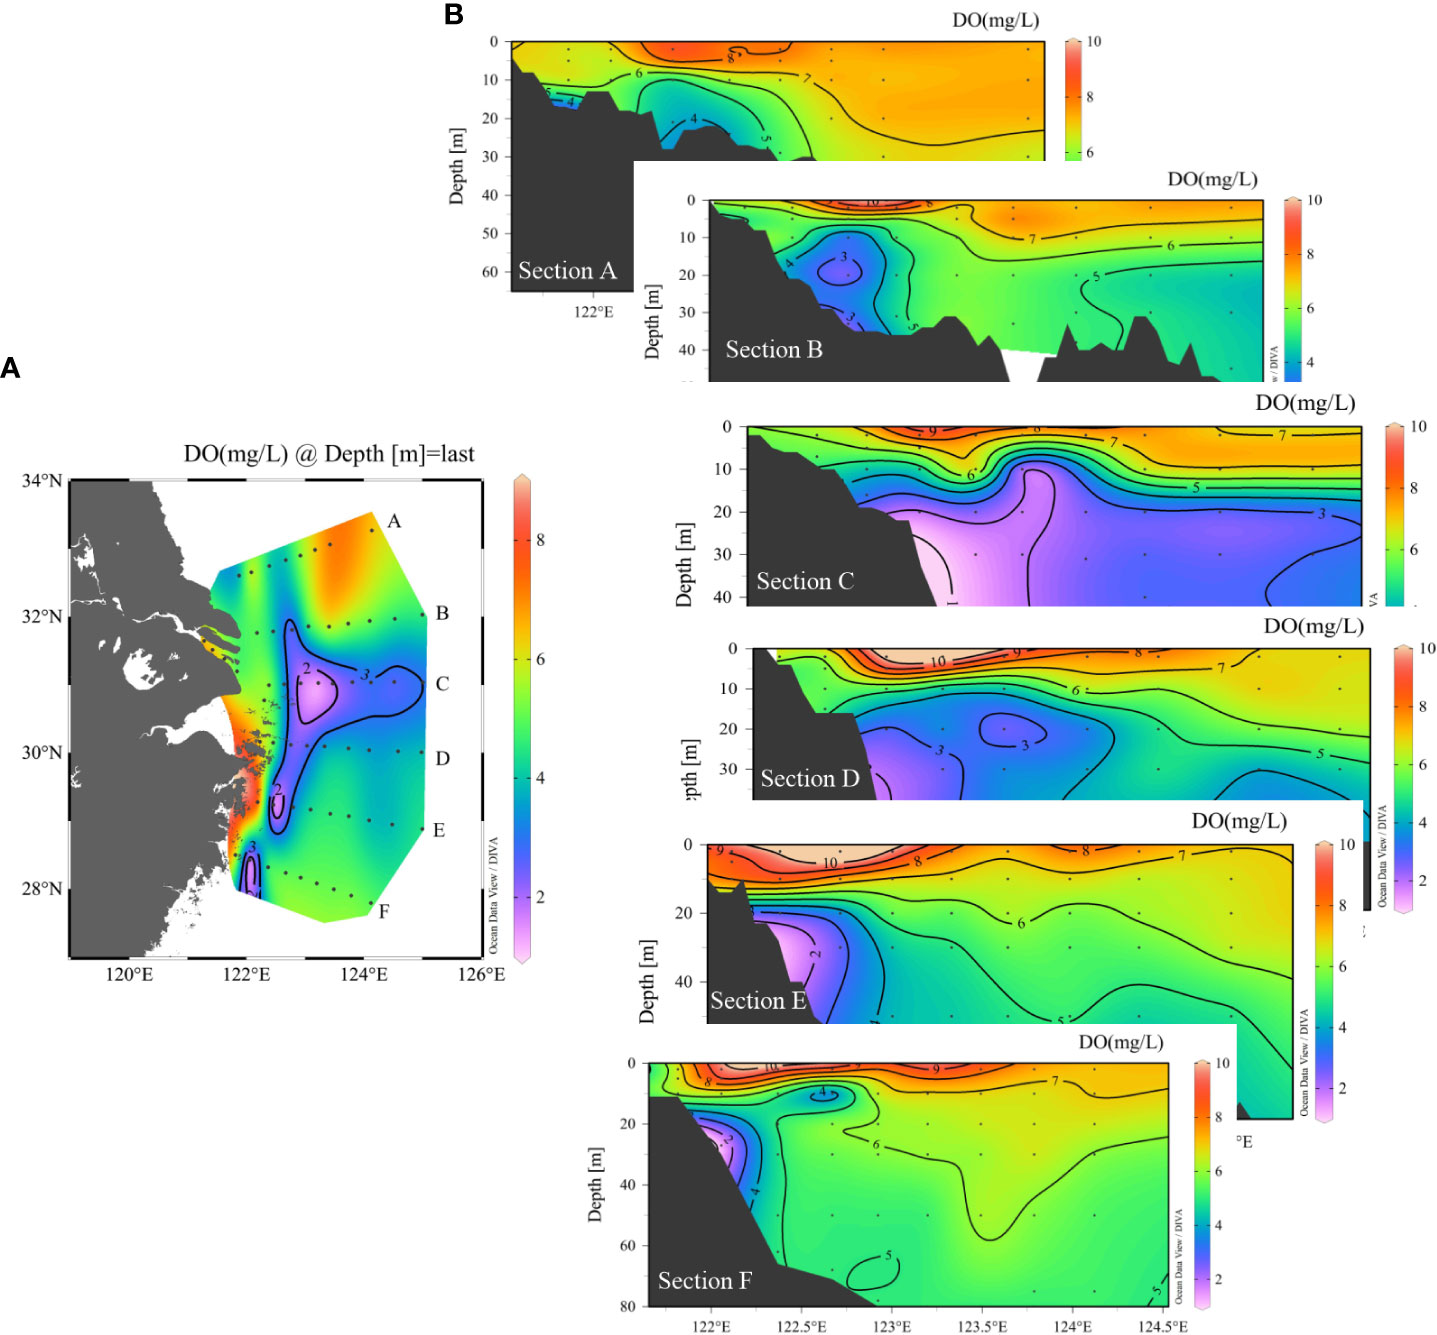
Figure 3 Transect DO distribution from north to south. Bottom purple areas represented the hypoxic area in each section (A–F). (A) Hypoxic zone in the bottom. (B) Transect distribution of DO from north to south. The location of each transect was located on the left station map marked with a caption.
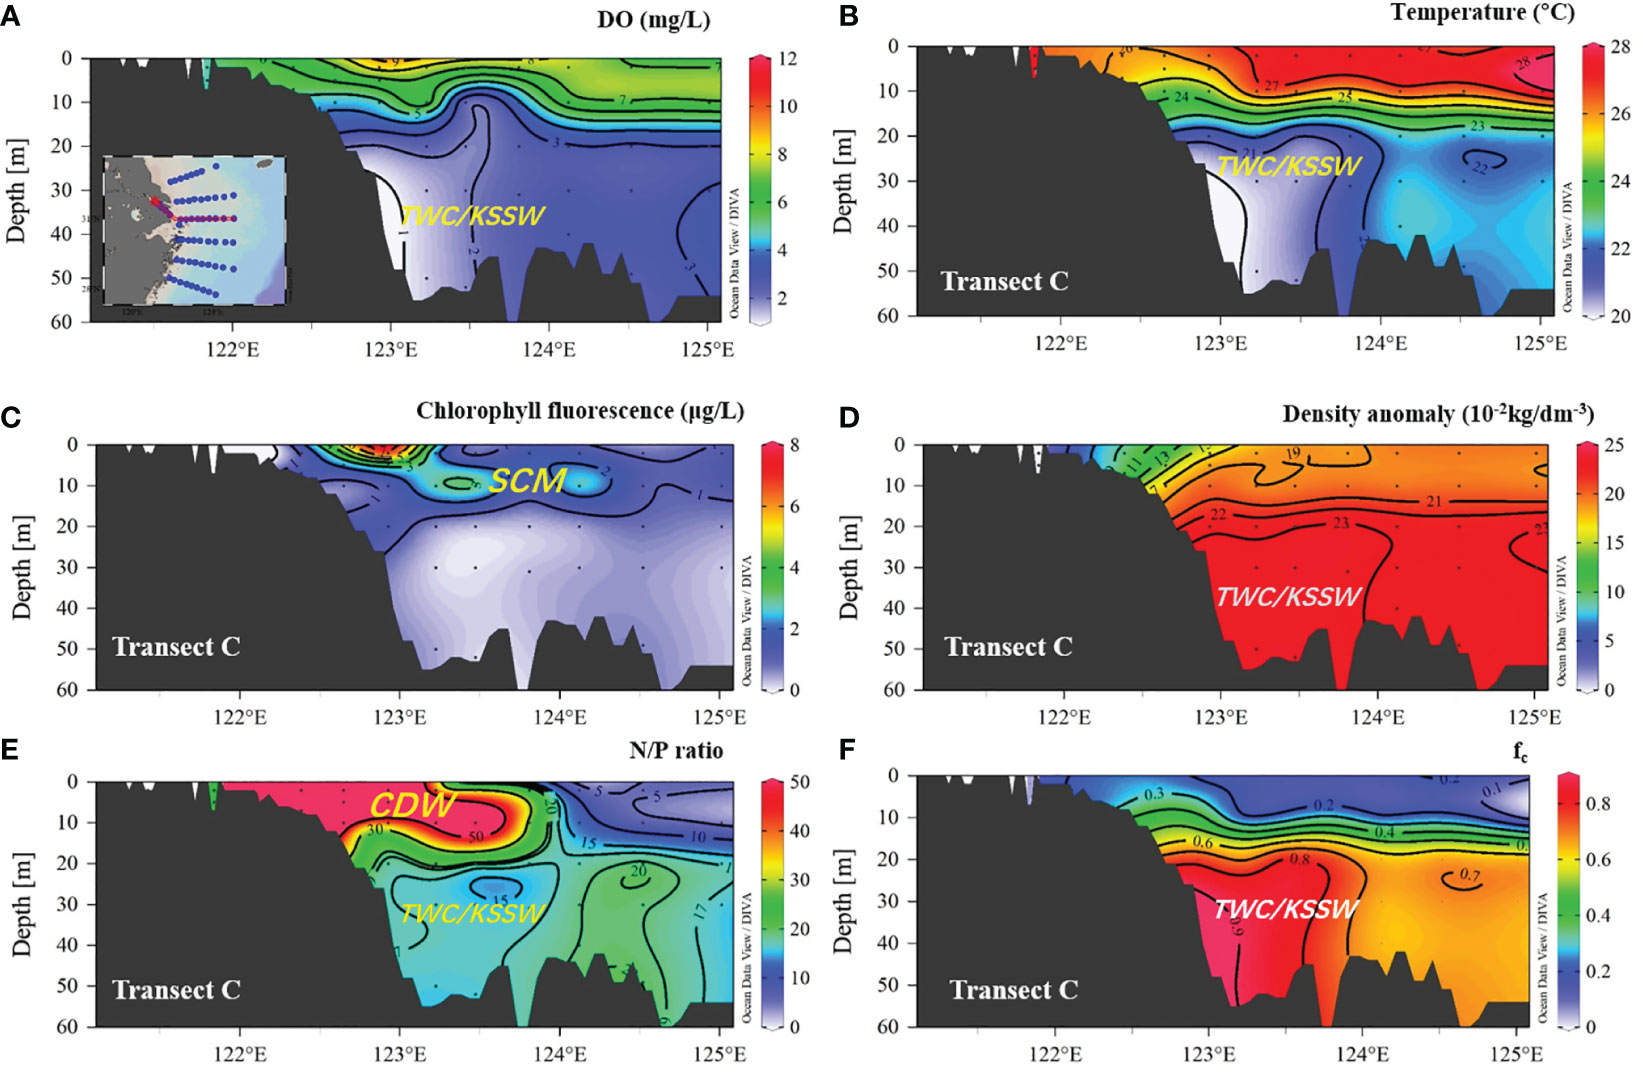
Figure 4 Distribution of DO, temperature, chlorophyll fluorescence, density anomaly, N/P ratio, and fc (fraction of TWC/KSSW) in transect G–C. (A) DO (mg L−1); (B) temperature; (C) chlorophyll fluorescence; (D) density anomaly, (E) N/P ratio, and (F) fc (fraction of TWC/KSSW). CDW, Changjiang diluted water; SCM, subsurface chlorophyll a maximum; TWC/KSSW, Taiwan warm current and Kuroshio subsurface water.
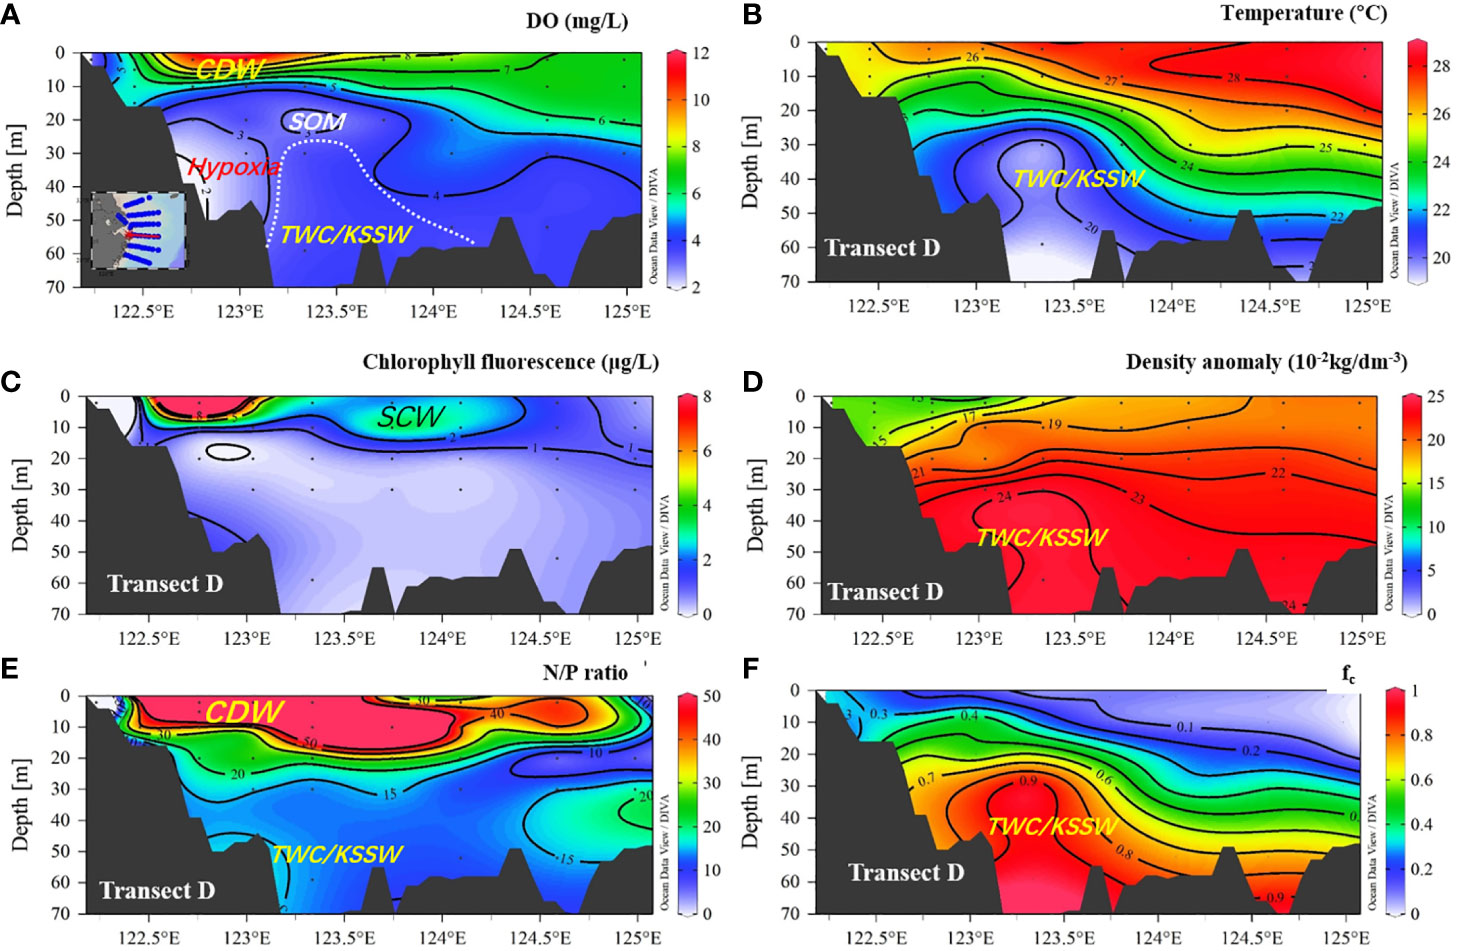
Figure 5 Distribution of DO, temperature, chlorophyll fluorescence, density anomaly, N/P ratio, and fc (fraction of TWC/KSSW) in transect D. (A) DO (mg/L); (B) temperature; (C) chlorophyll fluorescence; (D) density anomaly, (E) N/P ratio, and (F) fc (fraction of TWC/KSSW). CDW, Changjiang diluted water; SCM, subsurface chlorophyll a maximum; TWC/KSSW, Taiwan warm current and Kuroshio subsurface water.
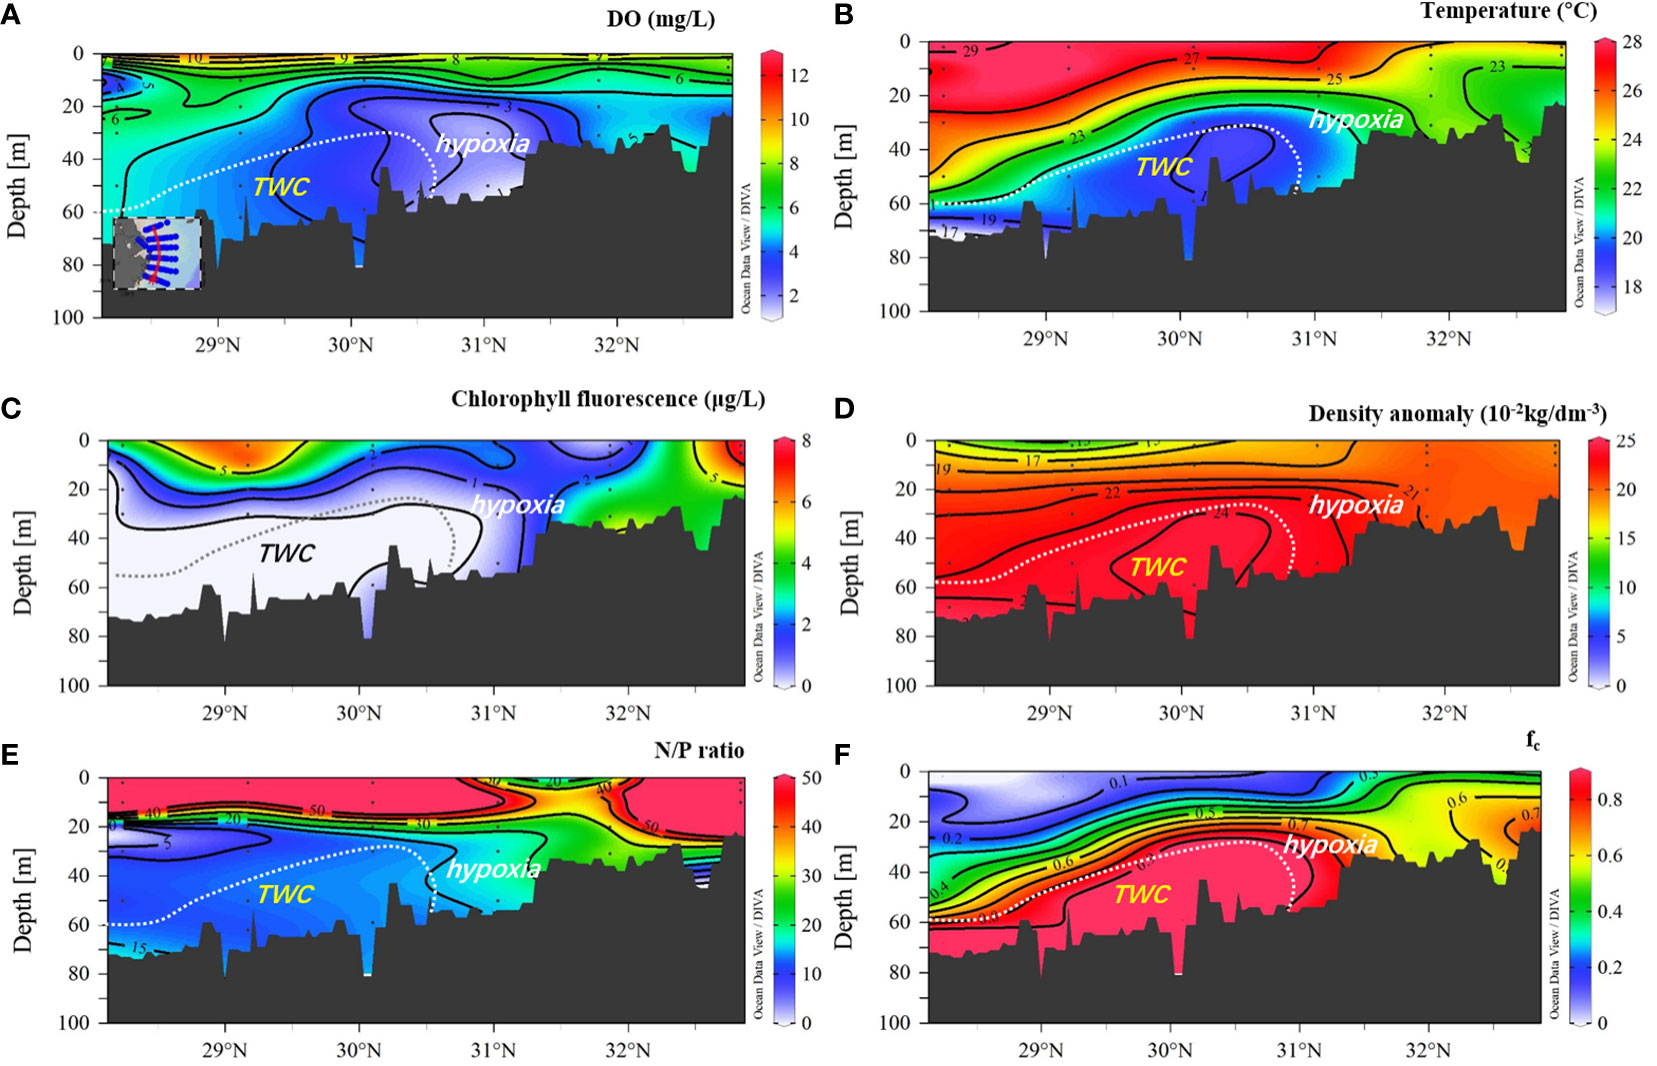
Figure 6 Distribution of DO, temperature, chlorophyll fluorescence, density anomaly, N/P ratio, and fc (fraction of TWC/KSSW) in transect 123°E. (A) DO (mg L−1); (B) temperature; (C) chlorophyll fluorescence; (D) density anomaly; (E) N/P ratio; and (F) fc (fraction of TWC/KSSW). CDW, Changjiang diluted water; SCM, subsurface chlorophyll a maximum; TWC/KSSW, Taiwan warm current and Kuroshio subsurface water.
3.2. Continuous observation results for the SOM
To better explore the structure of this SOM, 24-h continuous observation results at station D5 are presented in Figure 7. Station D5 is located in the center of the SOM, as shown in Figure 5A. This SOM layer exists in 18–28 m (Figure 7A), located in the lower boundary of the pycnocline with a density anomaly of 22 to 24, a temperature range of 22°C–26°C, and a salinity range of 32–34. Above this SOM layer was the CDW plume water (salinity< 30) in the upper 10 m and the high SCM in the upper 5–15 m (Chl a > 5 µg L−1). Below this SOM layer was the low temperature (<20°C;) and high-salinity (>34) TWC/KSSW water mass. Based on the 24-h observation, this SOM was stable throughout the entire day with a thickness of 10–15 m. As the TWC/KSSW upwelled into the 20 m depth at the ninth and 21st hours, this SOM layer was also uplifted to a depth of 15 m. Meanwhile, the SCM was prominent in the upper layer of 5–15 m depth throughout the day. The relatively higher Chl a concentration was captured 3 h later, after the uplifting of TWC/KSSW. Therefore, this SOM can be continuously supported by the labile OM from the upper phytoplankton bloom.
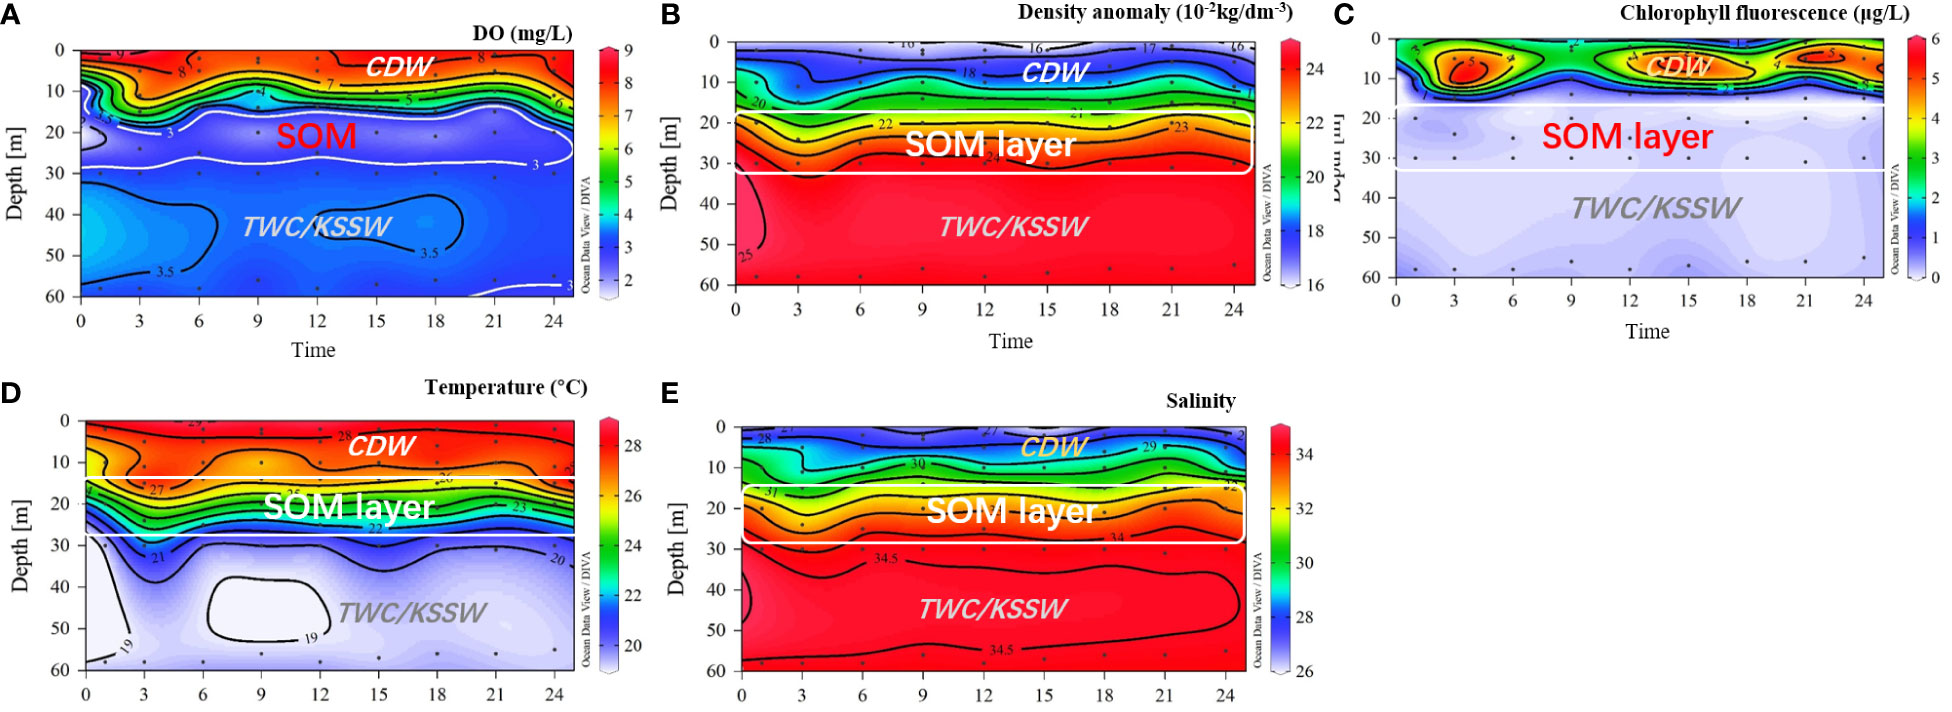
Figure 7 Continuous observation for 24 h in station D5. (A) DO; (B) density anomaly; (C) Chl a fluorescence; (D) temperature; (E) salinity. SOM, subsurface oxygen minimum; CDW, Changjiang diluted water.
3.3. High-resolution profiles of T, S, DO, and NO3
As shown in Figure 8, high-resolution profiles of T, S, DO, and NO3 at stations D3, D5, D6, and F4 were plotted. In the upper layer, the continuous profile data of temperature and salinity indicated that the depths of the mixed layers at stations D3, D5, and D6 were 8, 10, and 16 m, respectively. The mixing layer gradually increases from the nearshore to the continental shelf. The thickness of the thermocline is approximately 20 m, but with different gradients of 0.17°C m−1, 0.29°C m−1, and 0.38°C m−1, respectively. The mixed layer depth at station F4 was 5 m, whereas the thickness of the thermocline was 50 m. In the subsurface, the cold water at the bottom (<19.2°C) tends to climb along the continental slope but is prohibited because of the stratification intensity. For station D3, the bottom temperature was approximately 21°C from 30 to 50 m. For stations D5 and D6, the cold (<19.2°C) bottom water occupied the 30- to 60-m layer and 40- to 65-m layer, respectively. However, for station F4, the bottom water had the lowest temperature of 18°C from 60 to 70 m and reached strong temperature gradients around 55–60 m.
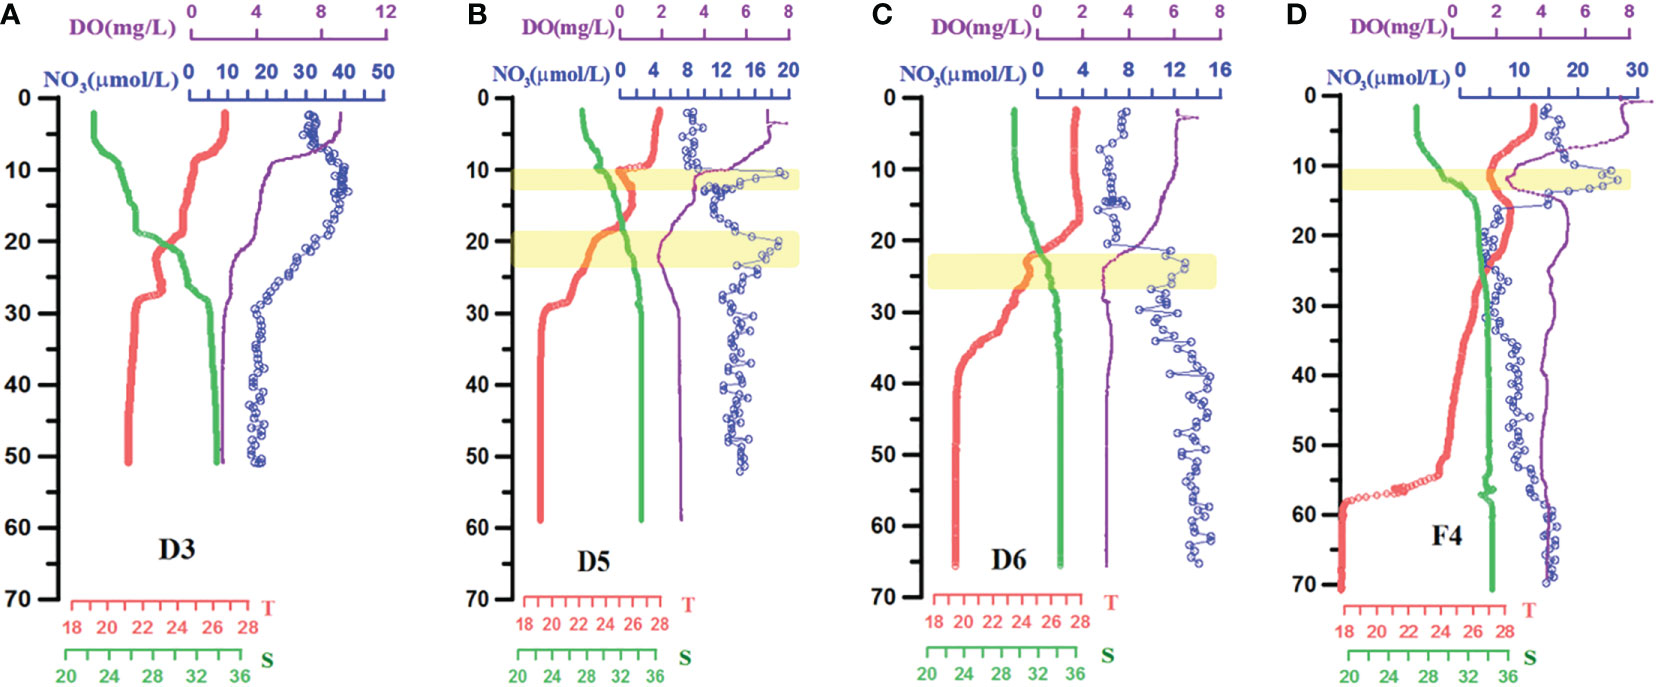
Figure 8 High-resolution depth profiles of temperature, salinity, DO, and nitrate (ISUS) in four stations: (A) D3; (B) D5; (C) D6; and (D) F4. Red solid line represents temperature, green is salinity, purple is DO, and the blue dotted line is .
According to the full-depth data from the DO and ISUS-NO3 profiles, the subsurface dissolved oxygen minima at stations D5 and F4 were more prominent (Figure 8). Stations D5 and D6 had their DO minima at 22 m (DO of 1.80 mg L−1) and 24 m (DO of 2.0 mg L−1), respectively, while at station D3, the DO minimum was located at the bottom (DO of 2.38 mg L−1). For the south-most station F4, the DO minimum value appeared at the 15-m layers (DO = 2.44 mg L−1), whereas the bottom DO value was 4.31 mg L−1. For the NO3 profiles, the high peak of NO3 at all four stations occurred within the lower part of the thermocline and halocline. More importantly, each high-NO3 peak corresponded to a low-DO peak. For station D5, there were two high-NO3 peaks (20 µmol L−1) at 10 and 20 m. The former peak is located in the upper isoclines, whereas the latter is located in the middle isoclines. For station F4, the high-NO3 peak (26 µmol L−1) was located at approximately 12 m within the middle isocline. Below this peak depth, NO3 declined significantly to approximately 5 µmol L−1 and gradually increased to 10–15 µmol L−1. In summary, stations D5 and F4 represent two different depth profiles of SOM, which were captured with high-resolution profile data.
4. Discussion
4.1. Southward expansion of CDW in summer, 2014
The southward expansion of the CDW has received much less attention than the typical northeast and east expansion situation in summer (Chen et al., 2021b). However, this less-captured southward expansion of the CDW in summer has a noticeable effect on plume-related processing and material transportation in the Min–Zhe coastal area. Upon multiyear satellite data, the southward along-shore expansion of CDW occurred only in very limiting years, driven by continued strong cyclonic wind forcing during typhoon (or tropical storms) periods (Bai et al., 2014; Chang et al., 2014). During our field cruise in the summer of 2014, the southward expansion of the CDW was prominent and dominated the main pathway (Figure 2A), which differed from the average year. In late August 2014, the Changjiang discharge was 4.83 × 10⁴ m3 s−1 in July and 4.11 × 10⁴ m3 s−1 in August, which was similar to the long-term average July discharge of 4.40 × 10⁴ m3 s−1 and August discharge of 4.83 × 10⁴ m3 s−1 (Figure 1C). The monthly average wind speed for the wind field was 5.9 m s−1 in the southwesterly direction. During the sampling period, the average wind speed declined to 3.1 m s−1 (Figure 1B). The weakening of the southwestern winds prohibited the northeastern expansion, and the eastward Ekman transport enhanced the southeast and southward expansion of CDW to Zhejiang coastal areas. Overall, we provide a nontypical expansion of the CDW with field data and propose that the southern expansion of the CDW is important in determining the southward phytoplankton biomass and the subsequent formation of the southern hypoxia of the Min–Zhe coastal area.
4.2. In situ respiration fueled the subsurface hypoxia
In addition to vertical stratification, in situ respiration of organic matter is another key process driving the dissolved oxygen deficit. In Figures 7, 8, the SOM layer was thinner than the pycnocline but well consistent with the NO3 maximum layer. This indicated that water mass mixing or protrusion alone could not result in the SOM. A process of biological utilization jointly makes the contribution. This in situ respiration mainly occurred in the 10–15 m and the 2–30 m layers at station D4. In station F4, in situ remineralization primarily occurred in the 5–15 m layer. According to depth-integrated calculations, the consumed DO at station D4 was roughly 260 µmol dm−2 (34.7 × 15/2), whereas the increase in nitrate was 30 µmol dm−2 (4 × 15/2). This resulted in a ΔDO/ΔNO3 ratio of 8.6, which is consistent with the classical Redfield ratios (Redfield, 1958). At station F4, the depth-integrated ΔDO and ΔNO3 were 345 µmol dm−2 (2.16 × 32 × 10/2) and 40 µmol dm−2 (8 × 10/2), respectively, resulting in a similar ratio of 8.6. Overall, it is evident that the process of in situ remineralization of OM by biological respiration consumes oxygen and releases nitrate.
In addition to the high-resolution depth profiles, we summarized the scatter plots of the different parameters (Figure 9). By dividing the hypoxia stations and the south ECS stations into two groups, the AOU/PO4 regression slope for the southern ECS stations was 110. This ratio is consistent with the slope on the pathway of KSSW (Qian et al., 2017; Wei et al., 2021b). For the hypoxia stations, the slope of AOU/PO4 was higher than 138 (Figure 9C). In particular at the SOM stations, this ratio can reach up to 160. This indicated that the in situ respiration process occurring during the phosphate limitation status had a much higher recycling efficiency of phosphate, leading to the high AOU/PO4 ratio. For density anomaly versus PO4 plot, these SOM stations also deviated from the cumulative scatter, which also indicates that the protruding process from the isocline was not clearly observed (Figure 9D). From the DO and fc plot, the hypoxia was mostly likely to happen when the fraction of TWC/KSSW was 0.7–0.8 (Figure 9B). When the fc increases to 0.9, the bottom DO increases to the DO background of TWC/KSSW. Therefore, we concluded that the in situ respiration fueled by upper-high biomass consumes the oxygen in subsurface water and leads to subsurface hypoxia.
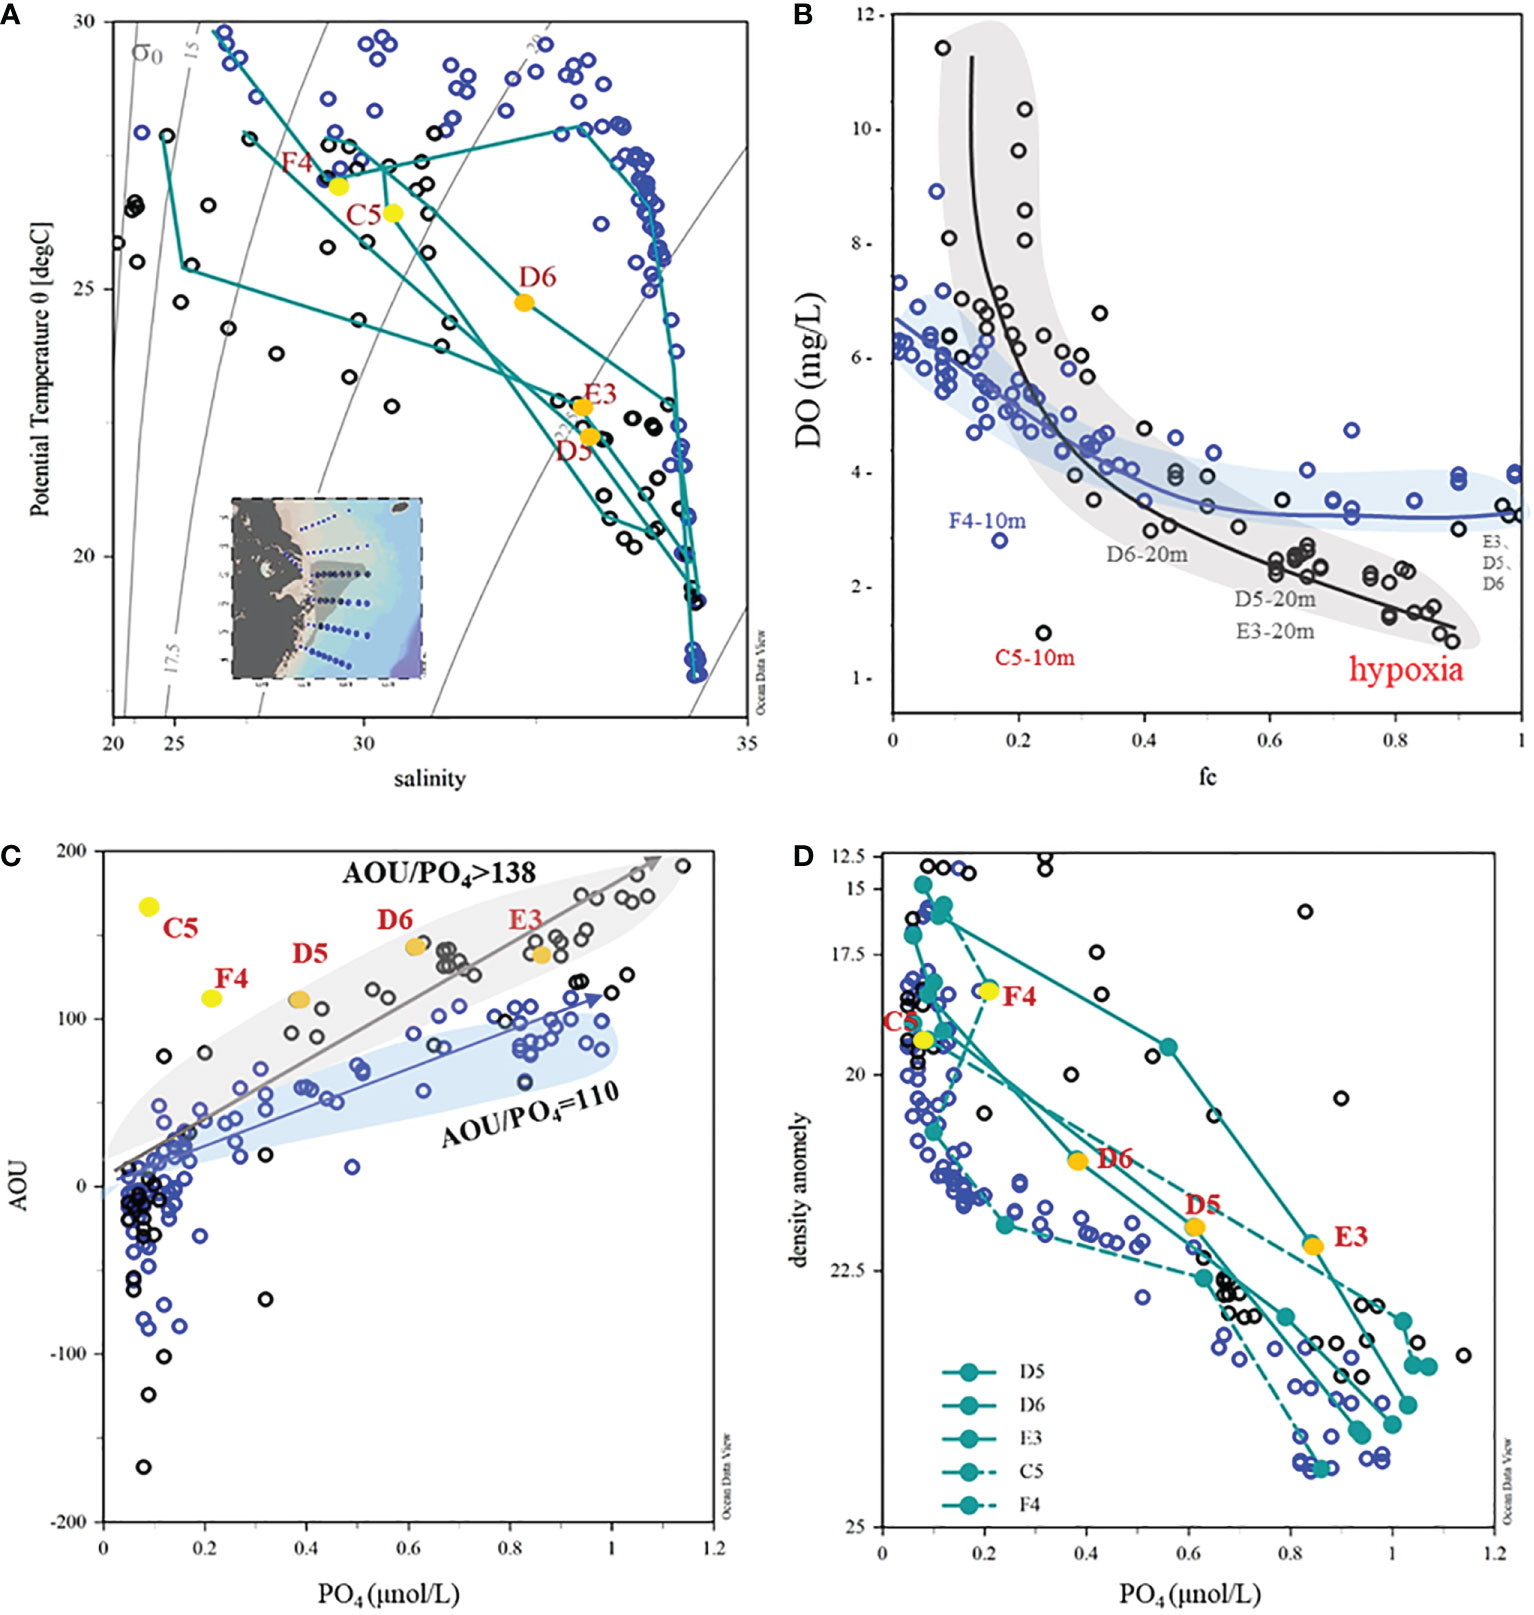
Figure 9 Scatter plot of physical and chemical parameters for hypoxia stations and the southern ECS stations. (A) T-S plot; (B) DO, and fc; (C) AOU and ; (D) density anomaly and AOU and .
4.3. Flushing effects resulted in the SOM
Several studies have confirmed the role of TWC/KSSW in providing the low-DO background for developing hypoxia. Notably, the TWC had a DO value higher than 3 mg L−1, which is beyond the definition of hypoxia. Here, we reveal that TWC is conducive to alleviating bottom hypoxia because of its renewal role for the bottom hypoxic water. The alleviation contribution has been discussed in several papers (Zhou et al., 2017; Chi et al., 2020; Zhou et al., 2020; Chen et al., 2021a). Zhang et al. (2022) suggested that lateral transport of oxygen-rich ambient water replenishes the local deficit of bottom DO. Luo et al. (2018) summarized data from 10 cruises in 2012 and 2013 and pointed out that hypoxia frequently occurred near the 30–50-m isobaths and was prone to occur without the presence of the KSSW. In this study, we confirmed the alleviation role of TWC/KSSW and proposed its contribution role in the formation of SOM.
Based on previous research, the northern and southern hypoxic areas off the Changjiang Estuary are widely recognized (Zhu et al., 2011; Luo et al., 2018; Wei et al., 2021a). In this study, we propose that the southern hypoxia should be separated due to the difference in TWC/KSSW in the submarine canyon area and in the southern area. In the central submarine canyon area, local deficit prevails over the lateral exchange and leads to long-lasting bottom hypoxia because of bathymetry and sufficient OM (Zhang et al., 2022). In the southern area, hypoxia usually occurs on slopes within restricted areas. This band area along 123°E is characterized by frequent algal blooms at the surface in spring and summer, but it is usually absent with bottom hypoxia (Luo et al., 2018; Pitcher et al., 2021). The flushing effects of subsurface water can continually refresh DO values in this area to alleviate bottom hypoxia. In addition, the local deficit promotes subsurface hypoxia, but lateral exchange along the 123°E replenished bottom water DO, which jointly led to the SOM. In summary, we contextualize these into a conceptual diagram to elucidate the formation mechanism of SOM (Figure 10). In particular, we provide a nontypical hypoxia case and aim to highlight the alleviation role of the TWC and the formation mechanism of SOM in the summer season along 123°E.
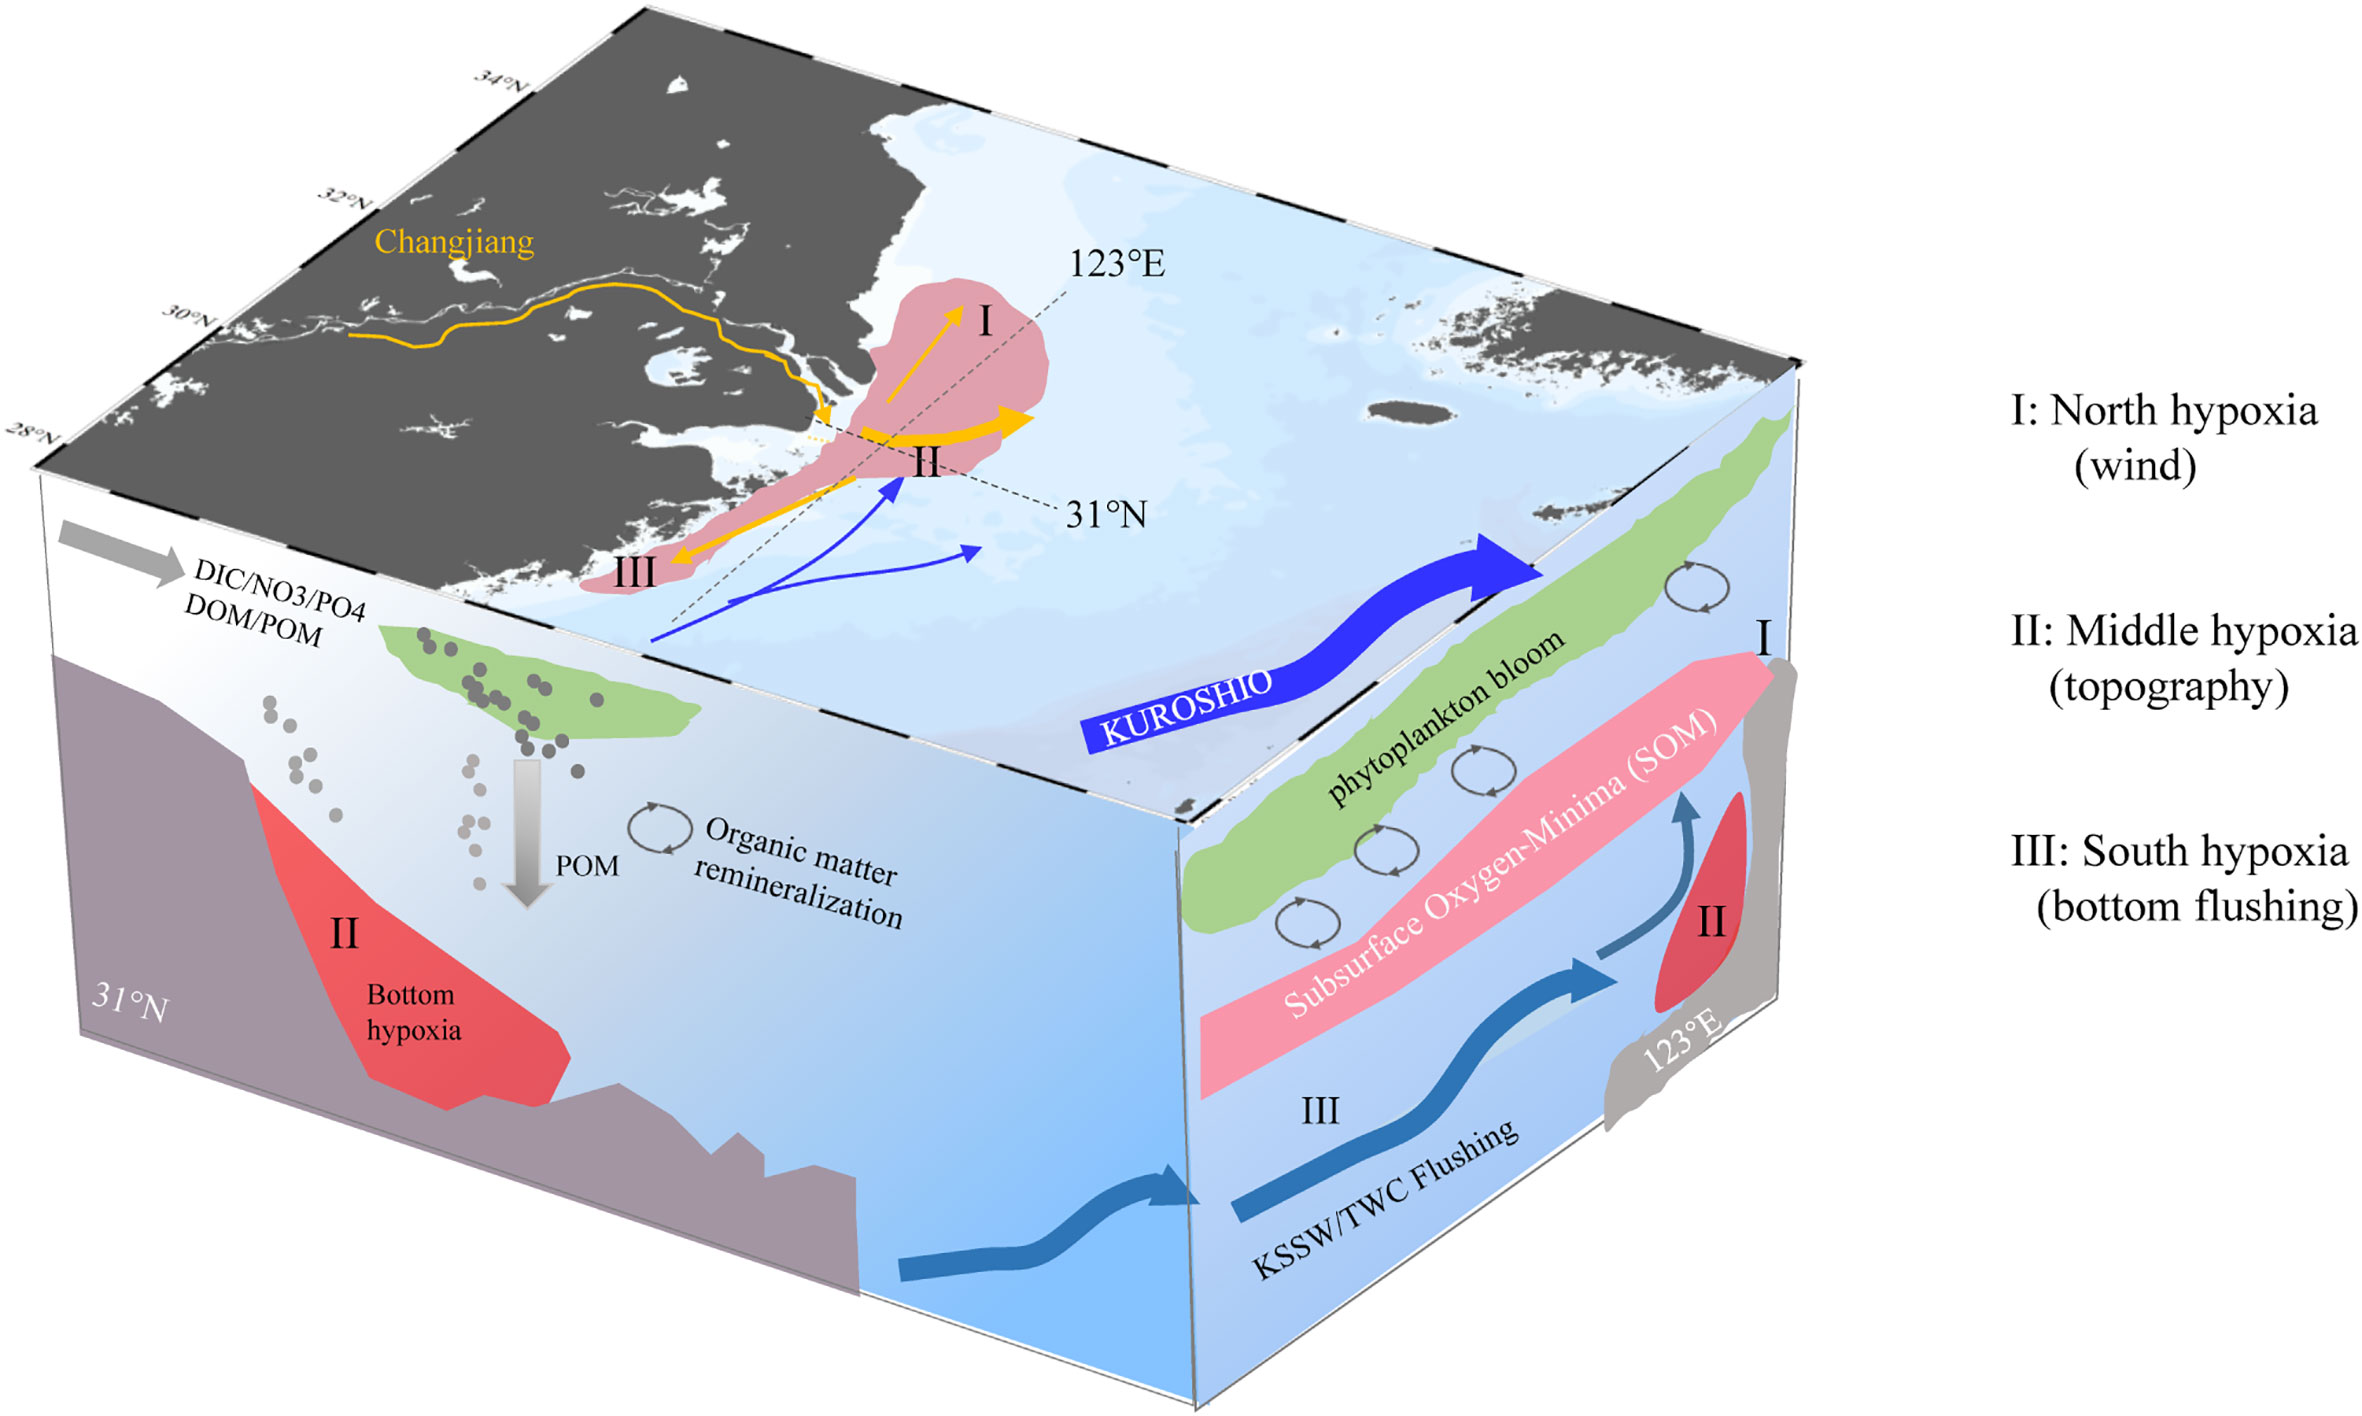
Figure 10 Conceptual diagram for three typical hypoxia areas off the Changjiang Estuary and the formation mechanism of subsurface oxygen minima (SOM). Both the cross-shore transect (31°N) and alongshore transect (123°E) are shown in the left and right vertical panels. Round cycles represent the organic matter remineralization. Three are three hypoxia areas (purple shading area of the estuary): the north hypoxia is most likely to encounter severe hypoxia but is easily interrupted by wind events; the middle hypoxia is most commonly observed for its long-lasting character due to topography; and the south hypoxia only existed close to the inner boundary of TWC/KSSW. The SOM usually occurs along the 123°E in the south hypoxia area, regulated by OM respiration and bottom flushing effects.
5. Conclusion
Using multidisciplinary observational data from the summer of 2014, this study investigated the SOM in the inner ECS and attempted to analyze its formation mechanism. Firstly, the southward expansion of CDW was prominent in this cruise, which substantially fueled the high biomass at the surface and subsequent OM respiration in the subsurface water along the Min–Zhe coastal area. Secondly, in situ respiration of organic matter in the water column is another key process driving the dissolved oxygen deficit. Most importantly, the flushing effects of TWC/KSSW (performing as the lateral exchange effects) prevailed over the local deficit effects below the pycnocline and shaped the vertical morphology of DO. This bottom renewal role finally determined the occurrence of SOM and could play an important role in alleviating the southern hypoxia of the CJE. These findings will give valuable insight into understanding hypoxia from the alongshore perspective and highlight the importance of integrating observation and simulation for improving future hypoxia prediction.
Data availability statement
The raw data supporting the conclusions of this article will be made available by the authors, without undue reservation.
Author contributions
BW, JC, and HJ conceived the study. BW, SG, ST, LS, HZ, and LL conducted the field studies and performed the sample analysis. BW and JC outlined the manuscript, and all coauthors substantially contributed to writing and revising the manuscript. All authors contributed to the article and approved the submitted version.
Funding
This study was jointly funded by the National Programme on Global Change and Air-Sea Interaction (Phase II)—Hypoxia and Acidification Monitoring and Warning Project in the Changjiang Estuary, the Long Term Observation and Research Plan in the Changjiang Estuary and the Adjacent East China Sea Project (LORCE) (SZ2001), the Key R&D Program of Zhejiang (Grant No. 2022C03044), the Science Foundation of Donghai Laboratory (Grant No. DH-2022KF0217, DH-2022KF0201, DH-2022KF0216), The National Natural Science Foundation of China (Nos. U1709201, U1609201, 42230404, 41706120, 41706086, and 41806095), Public Science and Technology Research Fund Projects of Ocean (grant 201205015), and the Fundamental Research Funds for the Second Institute of Oceanography, MNR (JG1529, JG2110).
Acknowledgments
We thank the crews of the Zhehaihuanjian and the colleagues on the cruise for their support in sample collection. We thank Daji Huang and Jia Li for providing the CTD data, and Hongchang Zhai and Zhibing Jiang for providing the Chl a data.
Conflict of interest
The authors declare that the research was conducted in the absence of any commercial or financial relationships that could be construed as a potential conflict of interest.
Publisher’s note
All claims expressed in this article are solely those of the authors and do not necessarily represent those of their affiliated organizations, or those of the publisher, the editors and the reviewers. Any product that may be evaluated in this article, or claim that may be made by its manufacturer, is not guaranteed or endorsed by the publisher.
References
Bai Y., He X., Pan D., Chen C.-T. A., Kang Y., Chen X., et al. (2014). Summertime changjiang river plume variation during 1998–2010. J. Geophysical Research: Oceans 119, 6238–6257. doi: 10.1002/2014JC009866
Bates N. R., Johnson R. J. (2020). Acceleration of ocean warming, salinification, deoxygenation and acidification in the surface subtropical north Atlantic ocean. Commun. Earth Environ. 1, 33. doi: 10.1038/s43247-020-00030-5
Cai W. J., Hu X. P., Huang W. J., Murrell M. C., Lehrter J. C., Lohrenz S. E., et al. (2011). Acidification of subsurface coastal waters enhanced by eutrophication. Nat. Geosci. 4, 766–770. doi: 10.1038/ngeo1297
Chang P.-H., Isobe A., Kang K.-R., Ryoo S.-B., Kang H.-S., Kim Y.-H. (2014). Summer behavior of the changjiang diluted water to the East/Japan Sea: A modeling study in 2003. Continental Shelf Res. 81, 7–18. doi: 10.1016/j.csr.2014.03.007
Chen C.-T. A., Bai Y., Huang T.-H., He X., Chen H.-W., Yu S. (2021b). Southward spreading of the changjiang diluted water in the la niña spring of 2008. Sci. Rep. 11, 307. doi: 10.1038/s41598-020-79634-y
Chen J., Li D., Jin H., Jiang Z., Wang B., Wu B., et al. (2020). “Changing nutrients, oxygen and phytoplankton in the East China Sea,” in Changing Asia-pacific marginal seas. Eds. Chen C.-T. A., Guo X. (Singapore: Springer Singapore), 155–178.
Chen C.-C., Shiah F.-K., Gong G.-C., Chen T.-Y. (2021a). Impact of upwelling on phytoplankton blooms and hypoxia along the Chinese coast in the East China Sea. Mar. pollut. Bull. 167, 112288. doi: 10.1016/j.marpolbul.2021.112288
Chen C.-C., Shiah F.-K., Gong G.-C., Chiang K.-P. (2003). Planktonic community respiration in the East China Sea: Importance of microbial consumption of organic carbon. Deep Sea Res. Part II: Topical Stud. Oceanography 50, 1311–1325. doi: 10.1016/S0967-0645(03)00025-0
Chen C.-T. A., Wang S.-L. (1999). Carbon, alkalinity and nutrient budgets on the East China Sea continental shelf. J. Geophysical Research: Oceans 104, 20675–20686. doi: 10.1029/1999JC900055
Chi L., Song X., Yuan Y., Wang W., Cao X., Wu Z., et al. (2020). Main factors dominating the development, formation and dissipation of hypoxia off the changjiang estuary (CE) and its adjacent waters, China. Environ. pollut. 265, 115066. doi: 10.1016/j.envpol.2020.115066
Diaz R. J., Rosenberg R. (2008). Spreading dead zones and consequences for marine ecosystems. science 321, 926–929. doi: 10.1126/science.1156401
Dickson A. G., Sabine C. L., Christian J. R. (2007). ). Guide to best practices for ocean CO2 measurements (Sidney, British Columbia: North Pacific Marine Science Organization).
Fennel K., Testa J. M. (2019). Biogeochemical controls on coastal hypoxia. Annu. Rev. Mar. Sci. 11, 105–130. doi: 10.1146/annurev-marine-010318-095138
Fry B., Justić D., Riekenberg P., Swenson E. M., Turner R. E., Wang L., et al. (2015). Carbon dynamics on the Louisiana continental shelf and cross-shelf feeding of hypoxia. Estuaries Coasts 38, 703–721. doi: 10.1007/s12237-014-9863-9
Fujiwara T., Yamada Y. (2002). Inflow of oceanic water into Tokyo bay and generation of a subsurface hypoxic water mass. J. Geophysical Res. 107, 13–11-13-19. doi: 10.1029/2000JC000749
Furuya K., Hayashi M., Yabushita Y., Ishikawa A. (2003). Phytoplankton dynamics in the East China Sea in spring and summer as revealed by HPLC-derived pigment signatures. Deep Sea Res. Part II: Topical Stud. Oceanography 50, 367–387. doi: 10.1016/S0967-0645(02)00460-5
Gilbert D., Rabalais N. N., Díaz R. J., Zhang J. (2010). Evidence for greater oxygen decline rates in the coastal ocean than in the open ocean. Biogeosciences 7, 2283–2296. doi: 10.5194/bg-7-2283-2010
Grantham B. A., Chan F., Nielsen K. J., Fox D. S., Barth J. A., Huyer A., et al. (2004). Upwelling-driven nearshore hypoxia signals ecosystem and oceanographic changes in the northeast pacific. Nature 429, 749–754. doi: 10.1038/nature02605
Grasshoff K., Kremling K., Ehrhardt M. (2009). Methods of seawater analysis (New Jersey: John Wiley & Sons).
Gruber N. (2011). Warming up, turning sour, losing breath: Ocean biogeochemistry under global change. Philos. Trans. A Math Phys. Eng. Sci. 369, 1980–1996. doi: 10.1098/rsta.2011.0003
Han A., Dai M., Kao S.-J., Gan J., Li Q., Wang L., et al. (2012). Nutrient dynamics and biological consumption in a large continental shelf system under the influence of both a river plume and coastal upwelling. Limnology Oceanography 57, 486–502. doi: 10.4319/lo.2012.57.2.0486
Hao Q., Chai F., Xiu P., Bai Y., Chen J., Liu C., et al. (2019). Spatial and temporal variation in chlorophyll a concentration in the Eastern China seas based on a locally modified satellite dataset. Estuarine Coast. Shelf Sci. 220, 220–231. doi: 10.1016/j.ecss.2019.01.004
Hofmann A. F., Peltzer E. T., Walz P. M., Brewer P. G. (2011). Hypoxia by degrees: Establishing definitions for a changing ocean. Deep Sea Res. Part I: Oceanographic Res. Papers 58, 1212–1226. doi: 10.1016/j.dsr.2011.09.004
Huang W. J., Wang Y., Cai W. J. (2012). Assessment of sample storage techniques for total alkalinity and dissolved inorganic carbon in seawater. Limnology Oceanography: Methods 10, 711–717. doi: 10.4319/lom.2012.10.711
Laurent A., Fennel K., Ko D. S., Lehrter J. (2018). Climate change projected to exacerbate impacts of coastal eutrophication in the northern gulf of Mexico. J. Geophysical Research: Oceans 123, 3408–3426. doi: 10.1002/2017JC013583
Levin L. A. (2018). Manifestation, drivers, and emergence of open ocean deoxygenation. Ann. Rev. Mar. Sci. 10, 229–260. doi: 10.1146/annurev-marine-121916-063359
Levin L. A., Liu K.-K., Emeis K.-C., Breitburg D. L., Cloern J., Deutsch C., et al. (2015). Comparative biogeochemistry–ecosystem–human interactions on dynamic continental margins. J. Mar. Syst. 141, 3–17. doi: 10.1016/j.jmarsys.2014.04.016
Liu K.-K., Peng T.-H., Shaw P.-T., Shiah F.-K. (2003). Circulation and biogeochemical processes in the East China Sea and the vicinity of Taiwan: An overview and a brief synthesis. Deep Sea Res. Part II: Topical Stud. Oceanography 50, 1055–1064. doi: 10.1016/S0967-0645(03)00009-2
Liu K.-K., Yan W., Lee H.-J., Chao S.-Y., Gong G.-C., Yeh T.-Y. (2015). Impacts of increasing dissolved inorganic nitrogen discharged from changjiang on primary production and seafloor oxygen demand in the East China Sea from 1970 to 2002. J. Mar. Syst. 141, 200–217. doi: 10.1016/j.jmarsys.2014.07.022
Luo X., Wei H., Fan R., Liu Z., Zhao L., Lu Y. (2018). On influencing factors of hypoxia in waters adjacent to the changjiang estuary. Continental Shelf Res. 152, 1–13. doi: 10.1016/j.csr.2017.10.004
Meng Q., Zhang W., Zhou F., Liao Y., Yu P., Tang Y., et al. (2022). Water oxygen consumption rather than sediment oxygen consumption drives the variation of hypoxia on the East China Sea shelf. J. Geophysical Research: Biogeosciences, 127, e2021JG006705. doi: 10.1029/2021JG006705
Moon J.-H., Kim T., Son Y.B., Hong J.-S., Lee J.-H., Chang P.-H., Kim S.-K. (2019). Contribution of low-salinity water to sea surface warming of the East China Sea in the summer of 2016. Prog. Oceanography, 175, 68–80. doi: 10.1016/j.pocean.2019.03.012
Ni X., Huang D., Zeng D., Zhang T., Li H., Chen J. (2016). The impact of wind mixing on the variation of bottom dissolved oxygen off the changjiang estuary during summer. J. Mar. Syst. 154, 122–130. doi: 10.1016/j.jmarsys.2014.11.010
Parker-Stetter S., Horne J. K., Langness M. M. (2009). The influence of midwater hypoxia on nekton vertical migration. Ices J. Mar. Sci. 66, 1296–1302. doi: 10.1093/icesjms/fsp006
Pitcher G. C., Aguirre-Velarde A., Breitburg D., Cardich J., Carstensen J., Conley D. J., et al. (2021). System controls of coastal and open ocean oxygen depletion. Prog. Oceanography 197, 102613. doi: 10.1016/j.pocean.2021.102613
Qian W., Dai M., Xu M., Kao S.-J., Du C., Liu J., et al. (2017). Non-local drivers of the summer hypoxia in the East China Sea off the changjiang estuary. Estuarine Coast. Shelf Sci. 198, 393–399. doi: 10.1016/j.ecss.2016.08.032
Rabalais N. N., Cai W.-J., Carstensen J., Conley D. J., Fry B., Hu X., et al. (2014). Eutrophication-driven deoxygenation in the coastal ocean. Oceanography 27, 172–183. doi: 10.5670/oceanog.2014.21
Redfield A. C. (1958). The biological control of chemical factors in the environment. Am. Scientist 46, 205–221.
Sarmiento J. L., Gruber N. (2013). Ocean biogeochemical dynamics (New Jersey: Princeton University Press).
Su J. (1998). Circulation dynamics of the China seas north of 18°N. Allan R Robinson, Kenneth H Brink. The Sea: Vol.II [M]. John Wiley & Sons Inc, 483–505.
Su J., Dai M., He B., Wang L., Gan J., Guo X., et al. (2017). Tracing the origin of the oxygen-consuming organic matter in the hypoxic zone in a large eutrophic estuary: The lower reach of the pearl river estuary, China. Biogeosciences 14, 4085–4099. doi: 10.5194/bg-14-4085-2017
Vaquer-Sunyer R., Duarte C. M. (2008). Thresholds of hypoxia for marine biodiversity. Proc. Natl. Acad. Sci. 105, 15452–15457. doi: 10.1073/pnas.0803833105
Wang Y. (1991). Bohai Sea, yellow Sea, East China Sea atlas of the oceans (in Chinese) (Beijing: Ocean press).
Wang K., Cai W.-J., Chen J., Kirchman D., Wang B., Fan W., et al. (2021). Climate and human-driven variability of summer hypoxia on a Large river-dominated shelf as revealed by a hypoxia index. Front. Mar. Sci. 8. doi: 10.3389/fmars.2021.634184
Wang B., Chen J., Jin H., Li H., Huang D., Cai W.-J. (2017). Diatom bloom-derived bottom water hypoxia off the changjiang estuary, with and without typhoon influence. Limnology Oceanography 62, 1552–1569. doi: 10.1002/lno.10517
Wang B., Wei Q., Chen J., Xie L. (2012). Annual cycle of hypoxia off the changjiang (Yangtze river) estuary. Mar. Environ. Res. 77, 1–5. doi: 10.1016/j.marenvres.2011.12.007
Wei Q., Wang B., Zhang X., Ran X., Fu M., Sun X., et al. (2021a). Contribution of the offshore detached changjiang (Yangtze river) diluted water to the formation of hypoxia in summer. Sci. Total Environ. 764, 142838. doi: 10.1016/j.scitotenv.2020.142838
Wei Q., Yao P., Xu B., Zhao B., Ran X., Zhao Y., et al. (2021b). Coastal upwelling combined with the river plume regulates hypoxia in the changjiang estuary and adjacent inner East China Sea shelf. J. Geophysical Research: Oceans 126, e2021JC017740. doi: 10.1029/2021JC017740
Wei Q., Yuan Y., Song S., Zhao Y., Sun J., Li C., et al. (2022). Spatial variability of hypoxia and coupled physical-biogeochemical controls off the changjiang (Yangtze river) estuary in summer. Front. Mar. Sci. 9. doi: 10.3389/fmars.2022.987368
Wong G. T. F., Gong G. C., Liu K. K., Pai S. C. (1998). "Excess nitrate" in the East China Sea. Estuarine Coast. Shelf Sci. 46, 411–418. doi: 10.1006/ecss.1997.0287
Wu H., Shen J., Zhu J., Li L. (2014). Characteristics of the Changjiang plume and its extension along the Jiangsu Coast. Cont. Shelf. Res. 76, 108–123. doi: 10.1016/j.csr.2014.01.007
Xuan J.-L., Huang D., Zhou F., Zhu X.-H., Fan X. (2012). The role of wind on the detachment of low salinity water in the Changjiang Estuary in summer. J. Geophysical Research: Oceans. 117, C10004. doi: 10.1029/2012JC008121
Yamaguchi H., Kim H.-C., Son Y. B., Kim S. W., Okamura K., Kiyomoto Y., et al. (2012). Seasonal and summer interannual variations of SeaWiFS chlorophyll a in the yellow Sea and East China Sea. Prog. Oceanography 105, 22–29. doi: 10.1016/j.pocean.2012.04.004
Yang D., Yin B., Liu Z., Bai T., Qi J., Chen H. (2012). Numerical study on the pattern and origins of kuroshio branches in the bottom water of southern East China Sea in summer. J. Geophysical Res. C: Oceans 117, C02014. doi: 10.1029/2011JC007528
Zhang W., Dunne J. P., Wu H., Zhou F., Huang D. (2022). Using timescales of deficit and residence to evaluate near-bottom dissolved oxygen variation in coastal seas. J. Geophysical Research: Biogeosciences 127, e2021JG006408. doi: 10.1029/2021JG006408
Zhang J., Du Y. N., Zhang G. S., Chang Y., Zhou Y. C., Zhang Z. F., et al. (2021). Increases in the seaward river flux of nutrients driven by human migration and land-use changes in the tide-influenced delta. Sci. Total Environ. 761, 144501. doi: 10.1016/j.scitotenv.2020.144501
Zhang W., Wu H., Zhu Z. (2018). Transient hypoxia extent off changjiang river estuary due to mobile changjiang river plume. J. Geophysical Research: Oceans 123, 9196–9211. doi: 10.1029/2018JC014596
Zhou F., Chai F., Huang D., Wells M., Ma X., Meng Q., et al. (2020). Coupling and decoupling of high biomass phytoplankton production and hypoxia in a highly dynamic coastal system: The changjiang (Yangtze river) estuary. Front. Mar. Sci. 7. doi: 10.3389/fmars.2020.00259
Zhou F., Chai F., Huang D., Xue H., Chen J., Xiu P., et al. (2017). Investigation of hypoxia off the changjiang estuary using a coupled model of ROMS-CoSiNE. Prog. Oceanography 159, 237–254. doi: 10.1016/j.pocean.2017.10.008
Zhu Z.-Y., Zhang J., Wu Y., Zhang Y.-Y., Lin J., Liu S.-M. (2011). Hypoxia off the changjiang (Yangtze river) estuary: Oxygen depletion and organic matter decomposition. Mar. Chem. 125, 108–116. doi: 10.1016/j.marchem.2011.03.005
Keywords: subsurface oxygen minima, East China Sea, Taiwan warm current, upwelling, flushing
Citation: Wang B, Chen J, Jin H, Li D, Gao S, Tian S, Sun L, Zhang H and Li L (2023) Subsurface oxygen minima regulated by remineralization and bottom flushing along 123°E in the inner East China Sea. Front. Mar. Sci. 9:1081975. doi: 10.3389/fmars.2022.1081975
Received: 27 October 2022; Accepted: 12 December 2022;
Published: 13 January 2023.
Edited by:
Chung-Chi Chen, National Taiwan Normal University, TaiwanReviewed by:
Thomas Malone, University of Maryland, College Park, United StatesYong Zhang, Shandong University (Qingdao), China
Copyright © 2023 Wang, Chen, Jin, Li, Gao, Tian, Sun, Zhang and Li. This is an open-access article distributed under the terms of the Creative Commons Attribution License (CC BY). The use, distribution or reproduction in other forums is permitted, provided the original author(s) and the copyright owner(s) are credited and that the original publication in this journal is cited, in accordance with accepted academic practice. No use, distribution or reproduction is permitted which does not comply with these terms.
*Correspondence: Jianfang Chen, amZjaGVuQHNpby5vcmcuY24=