 Carles Galià-Camps
 Carlos Carreras
 Xavier Turon
 Marta Pascual
- 1Departament de Genètica, Microbiologia i Estadística, Universitat de Barcelona (UB), Barcelona, Spain
- 2Institut de Recerca de la Biodiversitat (IRBio), Universitat de Barcelona (UB), Barcelona, Spain
- 3Department of Marine Ecology, Centre d’Estudis Avançats de Blanes (CEAB-CSIC), Blanes, Spain
Population genomic studies have increased in the last decade, showing great potential to understand the evolutionary patterns in a great variety of organisms, mostly relying on RAD sequencing techniques to obtain reduced representations of the genomes. Among them, 2b-RAD can provide further secondary reduction to adjust experimental costs by using base-selective adaptors, although its impact on genotyping is unknown. Here we provide empirical comparisons on genotyping and genetic differentiation when using fully degenerate or base-selective adaptors and assess the impact of missing data. We built libraries with the two types of adaptors for the same individuals and generated independent and combined datasets with different missingness filters (presence in 100%, 75% and 50% of the libraries). Our approach, by exploring locus-by-locus, found 92% of identical genotypes between the two libraries of the same individual when using loci shared among 100% of the libraries, which decreased to 35% when working with loci present in at least 50% of them. We show that missing data is a major source of individual genetic differentiation. The loci discordant by genotyping were in low frequency (7.67%) in all filtered files. Only 0.96% of them were directly attributable to base-selective adaptors reducing heterozygosity. An underestimation of heterozygosity in 6.44% of genotypes was found in libraries generated with fully degenerated adaptors, of which ca. 70% had <10 reads per locus indicating that sufficient read depth should be ensured for a correct genotyping. Base-selective adaptors reduce the number of loci, increase their coverage, and provide a reliable genotyping with no heterozygosity underestimation at a lower sequencing cost. We demonstrate that missing data is a major concern for a correct identification of genetic differentiation, and should not be neglected in genomic studies. Thus, we conclude that 2b-RAD libraries using base-selective adaptors are a robust tool to use in population genomics regardless the target species genome size, promoting their use in future studies.
1. Introduction
Biodiversity is the most threatened resource in the XXI century, and genomics play an important role in its evaluation and conservation (Breed et al., 2019). Population genomics is a necessary tool to capture the global diversity of species, to infer the processes and patterns underlying their genetic structure and to evaluate adaptation processes under changing environments (Narum et al., 2013; Torrado et al., 2020; Carreras et al., 2021). In invasive species, which entail economic and ecologic impacts but at the same time represent great systems to study evolution, genomics provide the ability to identify patterns and pathways of dispersal and adaptation processes (Casso et al., 2019; Rius and Turon, 2020; North et al., 2021). Although the cost of population genomic analyses has been reduced in the last decade, whole genome sequencing with enough coverage for a correct genotyping of a large number of individuals is unfeasible for most studies and species given their genome sizes and the lack of reference genomes. To overcome this problem, population genomic studies have been using restriction site associated DNA sequencing (RADseq) techniques to obtain reduced representations of genomes to diminish costs (Pecoraro et al., 2018; Casso et al., 2019). These techniques use restriction enzymes that cleave the genome into several targeted fragments ranging from tens to more than a thousand base pairs (Iguchi et al., 2021; Tonzo and Ortego, 2021; Hernandez-Castro et al., 2022; Min et al., 2022). Particularly, 2b-RAD uses IIb-enzymes that cleave at both sides of the recognition site (Wang et al., 2012), generating sticky ends with few random nucleotides depending on the enzyme. The length of the fragment is small, and thus, the technique is functional even with low quality degraded DNA samples (Barbanti et al., 2020). A unique feature of this method is that, since sticky ends have no fixed nucleotides, it allows a choice between fully degenerate or base-selective adaptors at the ligation step during library construction. Fully degenerate adaptors ligate to all fragments regardless the terminal nucleotide composition, selecting all of them for sequencing. On the contrary, base-selective adaptors contain fixed nucleotides in the positions selected by the researchers and only attach to those fragments with the complementary nucleotides, resulting in a further reduction of the final amount of loci for sequencing and analysis. Simulation studies have shown that using or not base-selective adaptors does not seem to have a large effect on genetic differentiation measures among individuals (Barbanti et al., 2020). However, it remains to be empirically tested if the genotypes of the shared loci are the same in datasets generated for the same individuals with both types of libraries, and if not, what are the potential causes and consequences for these genotype discrepancies.
In this work, we used individuals of the invasive tunicate species Styela plicata (Leseur, 1823), with an estimated genome size of 420Mb (Pfenninger et al., 2022), as a model to test the effect of using fully degenerate or base-selective adaptors on genotyping. We built different datasets and applied different filters to retain loci present in 50%, 75% and 100% of the libraries in order to 1) estimate the number of shared loci between library types and the mean locus depth, 2) evaluate locus-by-locus the source of genotyping discrepancies when using fully degenerate or base-selective adaptors, and 3) assess the effect of missing data on genotyping discrepancies and genetic differentiation measures. Our study highlights the importance of good coverage for reliable genotyping, and demonstrates the negligible impact of using base-selective adaptors in genomic diversity and differentiation metrics, validating the methodology. We thus favor the use of base-selective adaptors in population genomic works to come on invasive, endangered and commercial species with large genome sizes or reduced budget, optimizing time and economic resources for their monitoring and management.
2. Material and methods
2.1. Study species and laboratory protocols
Four Styela plicata individuals were collected from the harbors of Blanes (N=1) (41°40’N 2°47’E), Barcelona (N=2, separated by >100m) (41°22’N 2°10’E) and Vilanova i la Geltrú (N=1) (41°12’N 1°44’E) along the Catalan coast (NE Spain) and preserved in 96% ethanol. This sampling was designed in order to increase the probability of having unrelated individuals to empirically evaluate how the choice between base-selective adaptors and degenerate adaptors may affect genotyping, and consequently genetic divergence.
DNA was extracted from a fragment of the mantle of approximately 25mm2 by using the Gentra® Puregene® Tissue Kit (Qiagen® Inc.) following the manufacturer’s protocol. DNA quality and concentration were checked with NanoDrop™ (ThermoFisher Scientific™) and Quant-iT™ PicoGreen™ dsDNA reagent (Invitrogen™). All extractions were diluted to a concentration of ~50 ng/uL. Libraries were prepared following Barbanti et al. (Barbanti et al., 2020). For each individual, two libraries using the IIb-RAD enzyme AlfI were obtained. The digested fragments of the first library were ligated using fully degenerate adaptors (5’-NN-3’). The second library was constructed ligating only those digested fragments terminating with A and T (W) by using base-selective adaptors (5’-WN-3’) (Figure S1). We purified libraries with Invitrogen™ Dynabeads™ Magnetic Beads (ThermoFisher Scientific™) and quantified them with Quant-iT™ PicoGreen™ dsDNA reagent (Invitrogen™). Approximately 180ng DNA of each library were sent to the Centre for Genomic Regulation of Barcelona (CRG) to be 50 bp single-read sequenced on an Illumina HiSeq2500 platform. Demultiplexed raw sequence data are available at the European Nucleotide Archive (ENA) at EMBL-EBI under accession number PRJEB53487.
2.2. Bioinformatic and data analyses
We followed the protocol and scripts in Barbanti et al. (Barbanti et al., 2020) for filtering and de novo genotyping. Briefly, we removed the adaptor sequences, identified the enzyme target sites, trimmed the sequences and turned them into the same direction to avoid an overestimation of loci, since each fragment can be randomly sequenced in both directions. Only the reads with identified adaptor and enzyme target site were kept for the next steps. We assessed whether the number of trimmed reads was significantly different between treatments by using the Mann-Whitney-Wilcoxon tests in R using the function “wilcox.test”. We optimized the parameters of the function denovo_map.pl implemented in the program STACKS 1.47 (Catchen et al., 2013) as recommended (Paris et al., 2017; Díaz-Arce and Rodríguez-Ezpeleta, 2019). We established the “m”, “M” and “n” parameters as 2 (Figure S2), according to the number of polymorphic haplotype loci. Haplotype loci are alleles for a given locus that contain all phased SNPs present in a read sequence. We are working with haplotype loci since it has been demonstrated to be more informative for population genomic studies (Casso et al., 2019; Carreras et al., 2021). Thus, we used STACKS 1.47 because it provides haplotype loci depth per individual, allowing posterior filtering and removal of genotyping calls with insufficient read depth. We ran the STACKS function three times in order to get different datasets. The first dataset included the sequences of all libraries obtained with 5’-NN-3’ adaptors, from now on referred to as the NN dataset. The second dataset included all sequences obtained with 5’-WN-3’ adaptors, henceforth the WN dataset. Finally, a combined NN-WN dataset was obtained by processing altogether the sequences generated with the two library types, calling the haplotype loci genotypes in all individuals regardless the adaptors used. The genotyped haplotype loci were exported in VCF format where the different alleles for a given locus contained all phased SNPs within that locus as determined by each read sequence.
We processed the NN, WN and NN-WN datasets by applying additional filters using the program VCFtools 1.12 (Danecek et al., 2011). For each library, we retained the genotypes with a minimum depth of five reads (–minDP=5) and only polymorphic loci with at least two alleles (–min-allele=2). For each dataset, we generated three filtered files according to different values of missing data (percentage of libraries that have a genotype for a given locus). The first filtered file included the loci present in at least 50% of the libraries (–max-missing=0.5), in order to evaluate the effect of missing genotypes on genotyping discrepancies and genetic differentiation. The second filtered file included loci present in 75% of the libraries (–max-missing=0.75), to represent the filtering commonly applied in population genomics (Casso et al., 2019; Torrado et al., 2020; Carreras et al., 2021). The third filtered file included only the loci that were present in 100% of the libraries (–max-missing=1) to evaluate genotyping discrepancies and heterozygosity values when using base-selective and fully degenerate adaptors without missing data.
We calculated the number of total loci, missing loci, mean locus depth, and shared loci between libraries of the same individual. We classified the missing loci per individual in two types according to coverage categories, designated as a) 0–1 reads (the genotype is not recovered due to the effect of the “m” parameter of STACKS) and b) 2–4 reads (the genotype is initially recovered with an insufficient depth, and is posteriorly discarded by the minimum depth filter of VCFtools). Differences in the number of missing loci were assessed by Mann-Whitney-Wilcoxon pairwise tests according to coverage category and library type for the 50% and 75% filtering.
We used the combined NN-WN dataset and its three filters to compare, locus-by-locus, the genotypes of each individual as obtained in the two library types (NN or WN), and defined three different loci categories according to this comparison. The first category included the loci with exactly the same genotype in both library types per individual (non-discordant loci). The second category included loci for which the discrepancy is produced by the presence of missing data in one of the libraries of the individual (discordant by missingness). The third category included those loci that have discrepant genotypes between the two libraries of the individual, being either homozygous or heterozygous for different alleles (discordant by genotyping). Additionally, four different types of ‘discordant by genotyping’ loci were detected and herein four mismatch categories were designated. These mismatch categories corresponded to a) heterozygous loci in the NN library but homozygotes in the WN library (Nhe-Who; e.g.: TG/TA in NN library vs. TG/TG in WN library), b) heterozygous loci with different genotypes in both libraries (Nhe-Whe; e.g.: TG/TA in NN library vs. TG/CG in WN library), c) homozygous loci with different alleles in both libraries (Nho-Who; e.g.: TG/TG in NN library vs. TA/TA in WN library) and d) homozygous in NN libraries but heterozygous in WN libraries (Nho-Whe; e.g.: TG/TG in NN library vs. TG/TA in WN library), being the latter further subdivided into loci with lower and higher sequencing depth (reads<10 and ≥10, respectively). The occurrence of each locus and mismatch category was recorded for the three filtered files.
We generated a Prevosti’s genetic distances matrix among libraries for the combined NN-WN dataset using the function “prevosti.dist” available in the R package “poppr” (Kamvar et al., 2014). This statistic was used since it calculates pairwise absolute differences between individuals at all loci (Casso et al., 2019). Principal Coordinate Analyses (PCoA) were performed with the genetic distance matrices using the “pcoa” function in the “ape v5.0” R package (Paradis and Schliep, 2020). Results were plotted using the “ggplot2” package.
To evaluate if the discrepancies between library types were produced by insufficient locus coverage, we simulated datasets with 250K, 500K, 1M, 2M, 4M, 6M, 8M and 10M reads following the resampling analysis described in Barbanti et al. (Barbanti et al., 2020). Ten replicates for each coverage value were generated by performing a random selection with replacement resampling the raw sequences of each library with a customized script (Barbanti et al., 2020). We then generated ten replicate NN-WN loci catalogs for each coverage value, following the same procedure used for the whole dataset described above, and analyzed the number of loci and mean read depth per locus obtained in the simulated datasets with the 75% filter.
3. Results
3.1. Sequencing data and filtering
The mean number of raw reads per library was 1.02 x10⁶, ranging between 0.7x10⁶ and 1.3x10⁶ reads (Table 1). After filtering the reads, by keeping the ones with the adaptors and restriction enzyme site, an average of 77% of reads (Figure S3) were retained and used for genotyping. The number of reads per individual between the two library types (base-selective (WN) and fully degenerate (NN) adaptors) was not significantly different according to the Mann-Whitney-Wilcoxon test (W=0.73, p-value=0.69). However, one of the libraries with base-selective ligation (BAR2W) retained a lower percentage of reads (56%) after filtering, compared to the other libraries (71-89%). Agarose gels showed that this library presented a faint nonspecific band at 130 bp, below the more intense expected 160 bp band, probably caused by the ligation of some adaptors without genomic insert resulting in a higher proportion of unusable raw reads (Figure S3).

Table 1 Number of raw and filtered reads per individual and library.
After haplotype loci genotyping and before filtering we obtained a higher number of loci when using fully degenerate adaptors than base-selective adaptors, and this number was the highest for the combined dataset (Table 2). With 50% filtering, we observed the same trend of loci abundance as without filtering. On the contrary, for the 75% and 100% filtered files the lowest number of loci was obtained with the combined dataset (Table 2), probably due to the combined effect of insufficient read depth and adaptor selection (see below). The locus mean depth varied greatly among datasets, being always lower for NN than for WN libraries (Table 3). This result was expected since the number of reads was similar between the two library types (Table 1), while the total number of loci was larger for the NN dataset (Table 2). The mean depth per locus increased with stricter filtering, suggesting that loci need to have a good mean coverage to be present in all libraries.
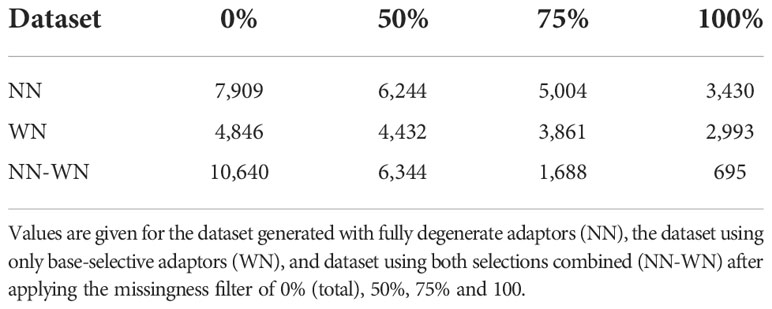
Table 2 Number of loci for each dataset.
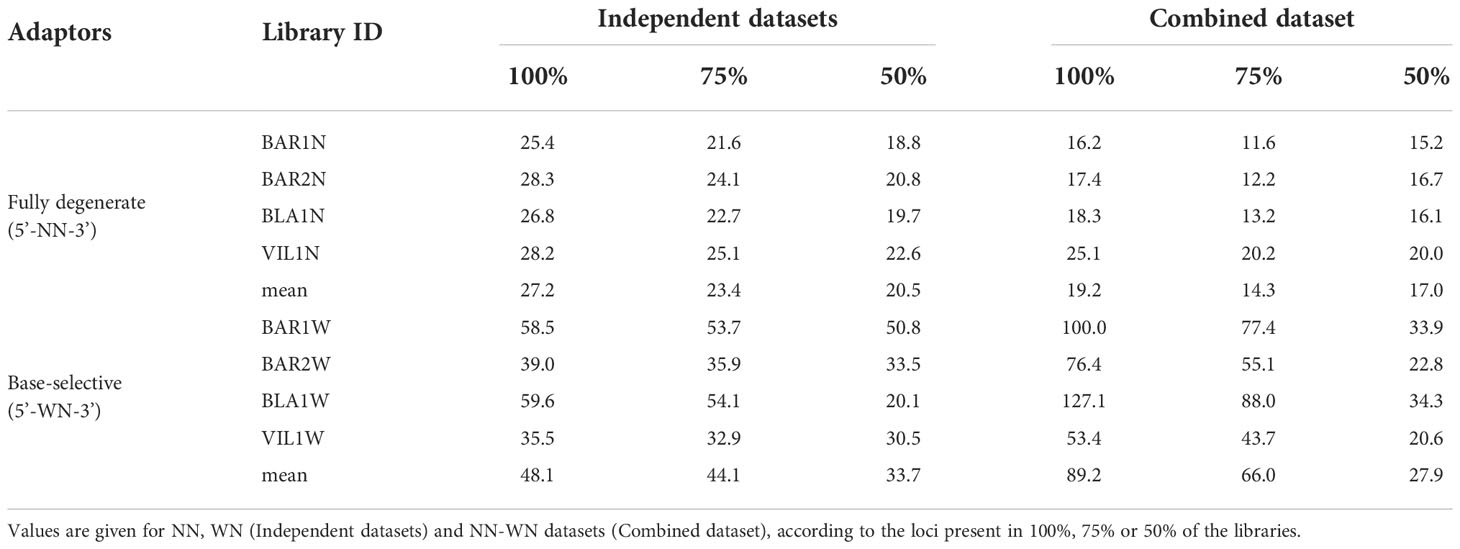
Table 3 Locus mean depth for each library in different datasets and filters.
3.2. Genetic differentiation and missing data
The distribution of the libraries in the principal coordinate analyses based on Prevosti’s distance using the NN-WN dataset differed among filters with different thresholds of data presence (Figure 1). Our results indicated that, when working with loci present in 100% of the libraries, the different individuals appeared clearly separated from each other, while the two library types for the same individual clustered tightly together. As we allowed loci to be present in a lower number of libraries, the three first PCoA components indicate that the differences between individuals become less evident, whereas the resemblance between the two libraries for each individual is also reduced (Figure 1).
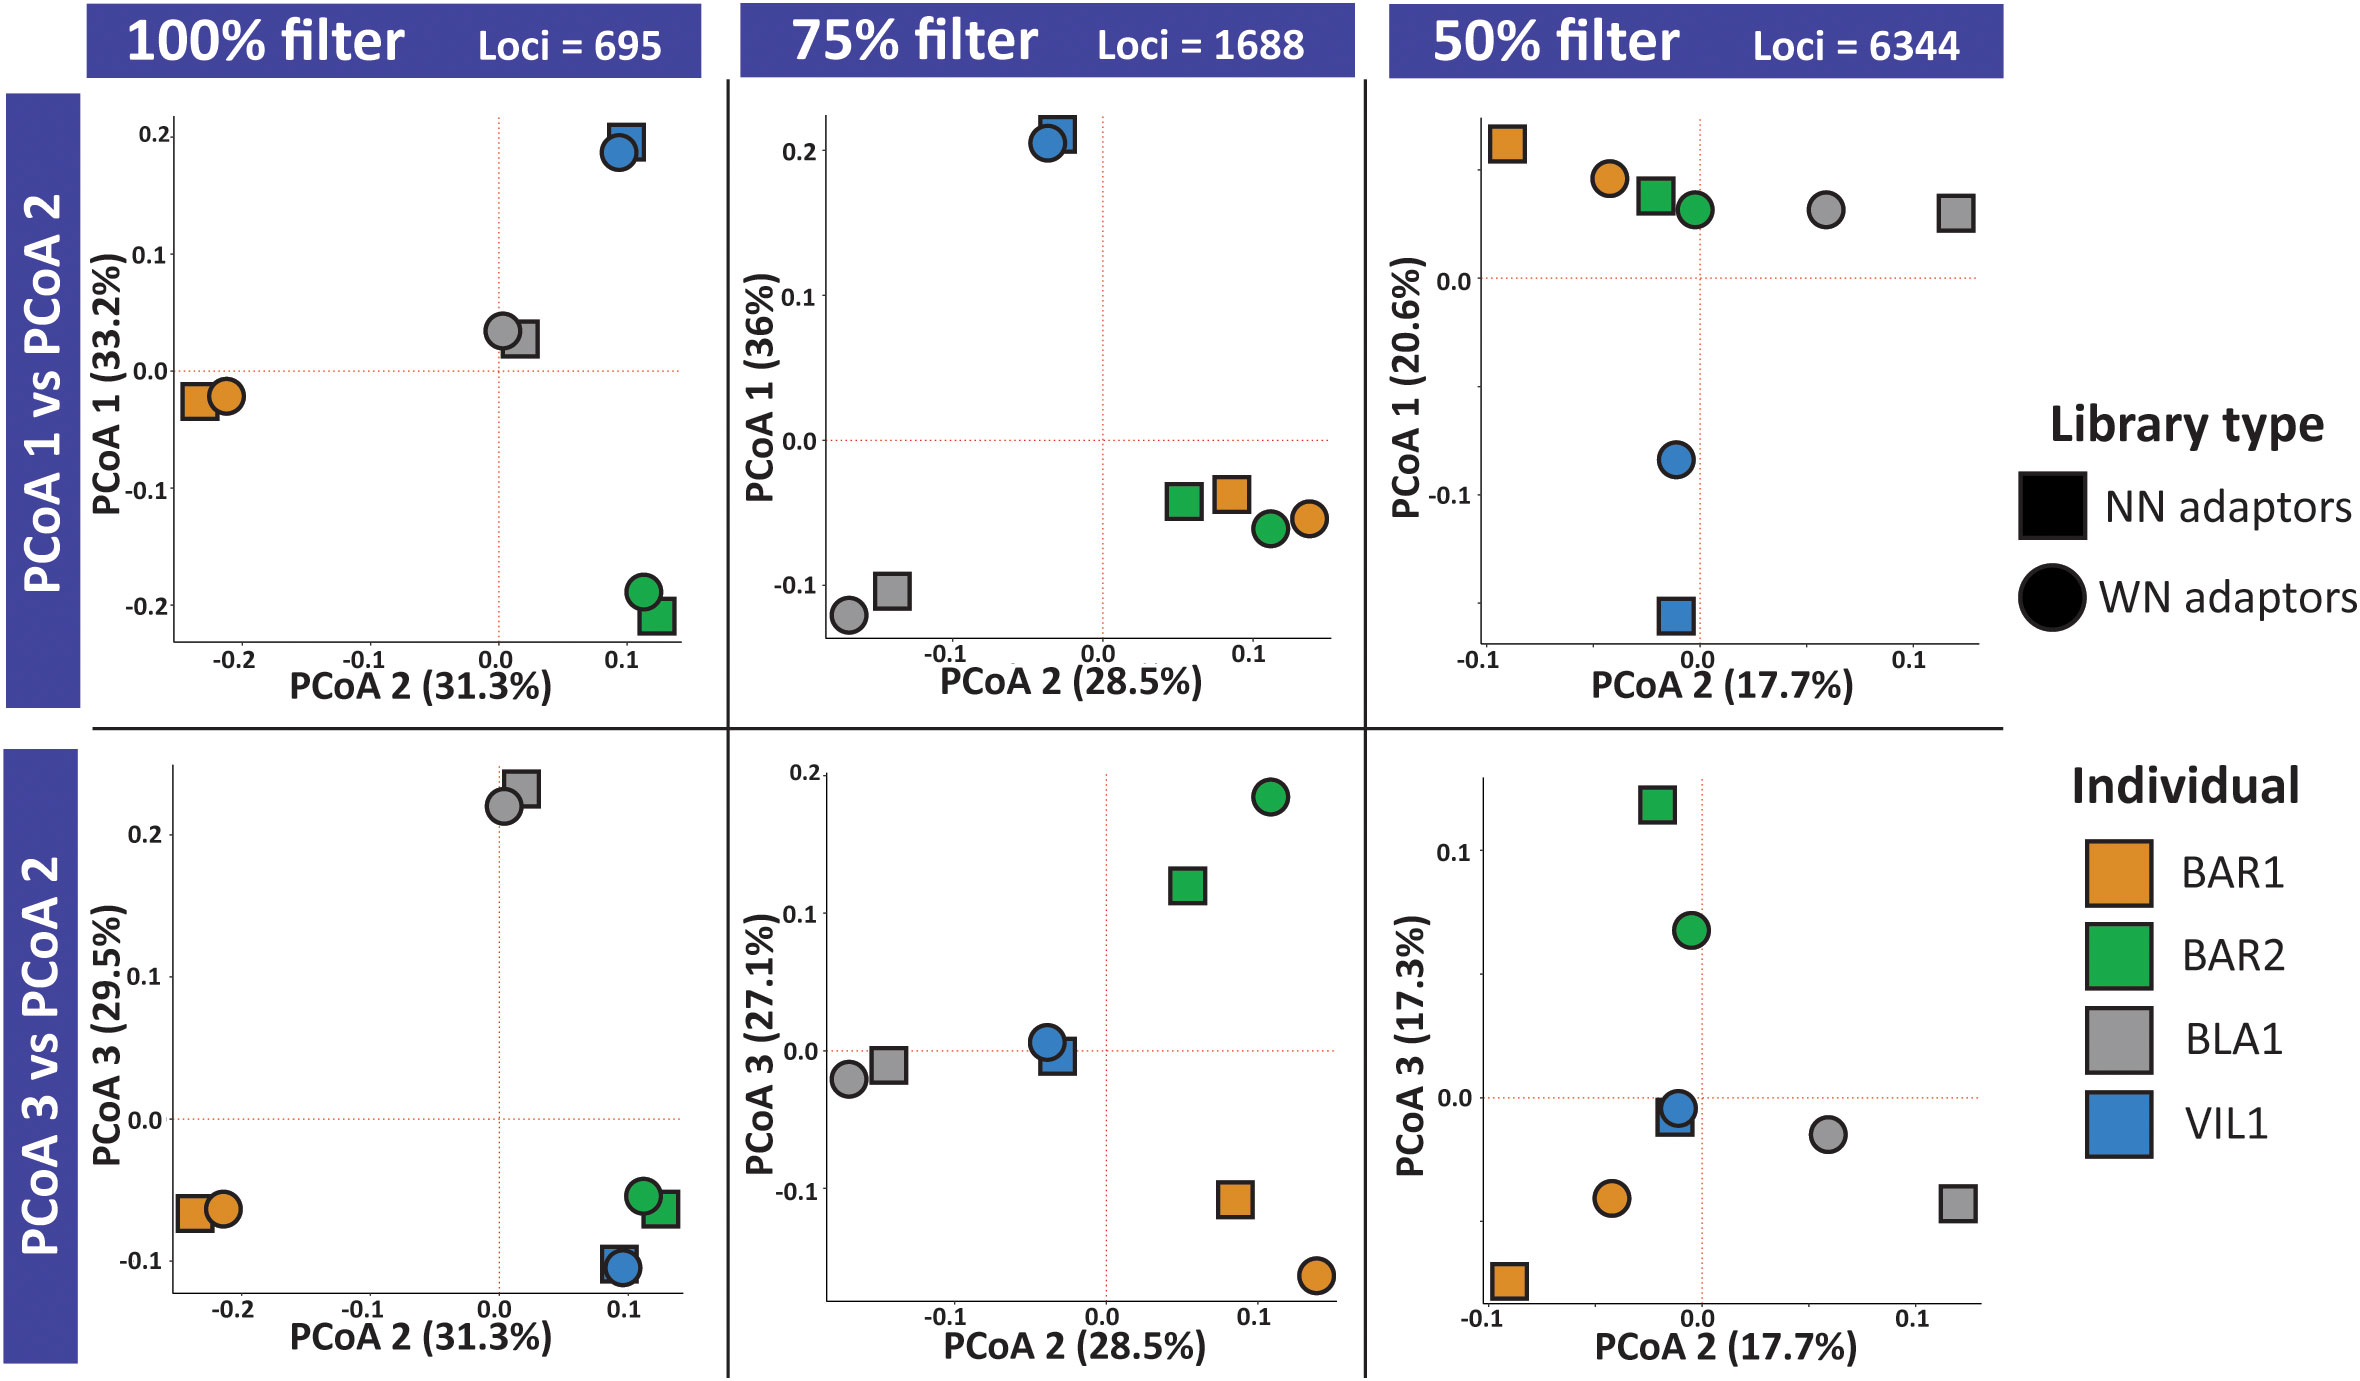
Figure 1 Principal coordinate analysis (PCoA) for the first three components based on Prevosti’s distances among libraries. Analysis performed with the combined (NN-WN) dataset for the filters of 100%, 75% and 50% loci presence. In the upper row, we plotted the first (y axis) and the second (x axis) components of the PCoA, while in the lower row we plotted the third (y axis) and the second (x axis) components.
We further evaluated the discrepancies between library types for each individual by checking, in the NN-WN dataset, the genotype information locus-by-locus by calculating the percentage of discrepancies and their category for each of the three filtering levels. The percentage of loci with ‘non-discordant genotypes’ was very high (92%) when only the loci present in 100% of libraries were considered, but was reduced to 35% when loci absent in up to 50% of the libraries were included (Figure 2). The ‘discordant by genotyping’ category remained more or less stable across the different filtering levels (between 5 and 10%). The percentage of ‘discordant by missingness’ loci (those loci whose discrepancy is produced by the presence of missing data in one of the libraries of the individual) shifted from 20% to 60%, respectively, in the 75% and 50% filters, while none was found in the 100% filter by definition, as this filter does not allow missing data (Figure 2).
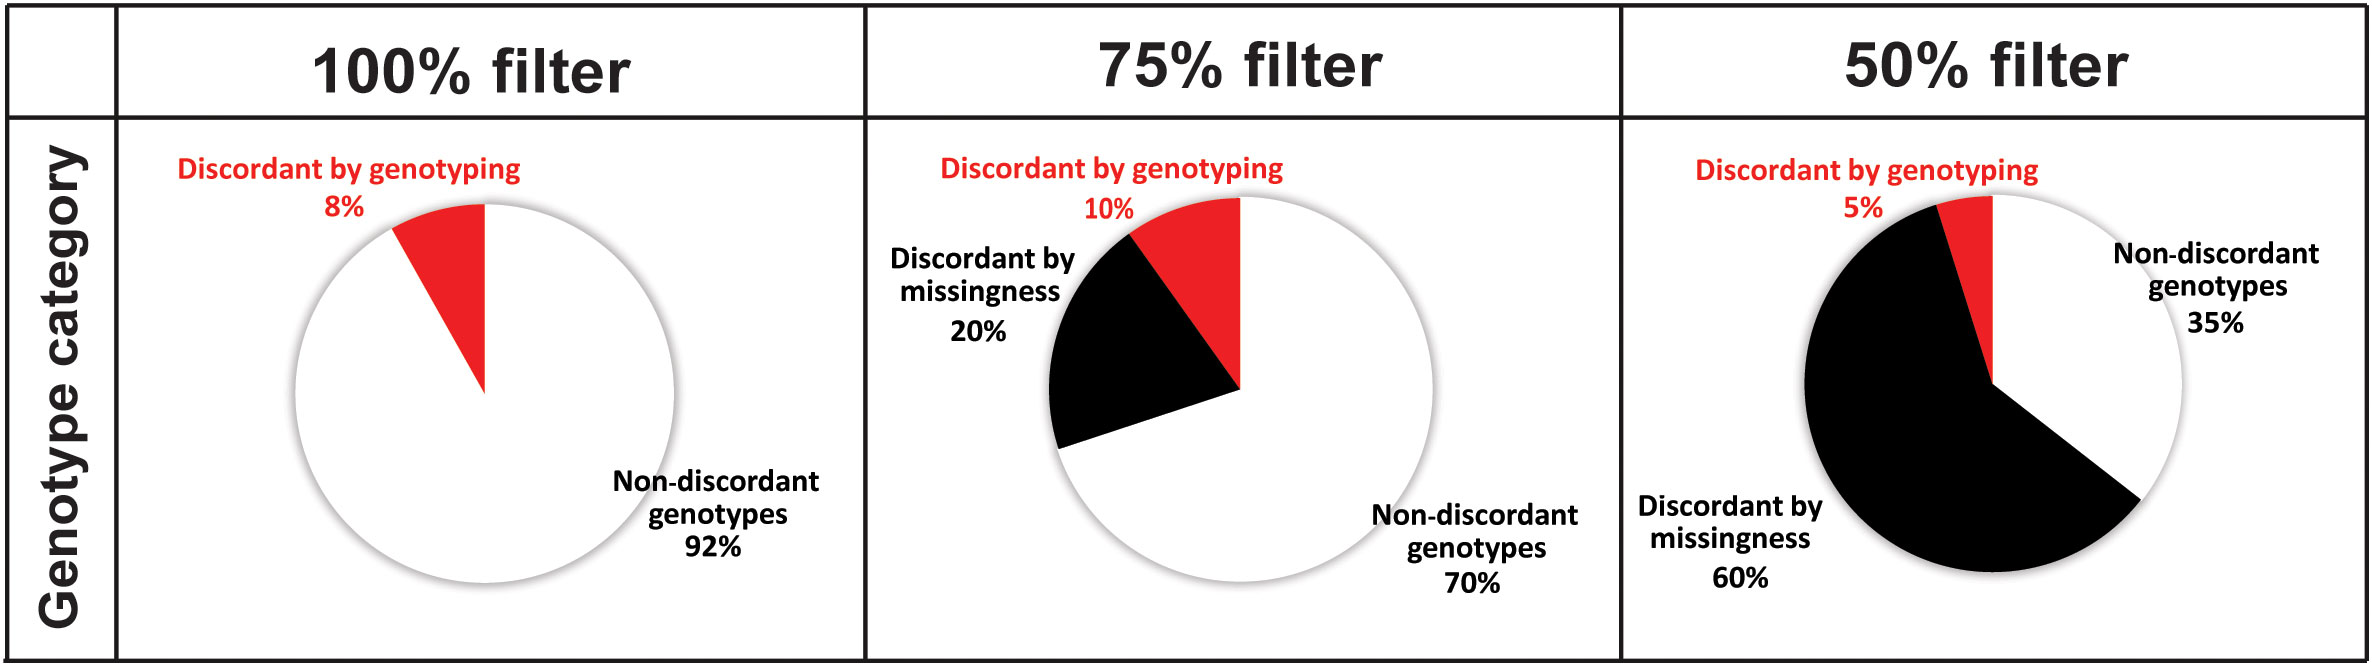
Figure 2 Mean percentage of loci of each genotype category when comparing the two library types for each individual in the NN-WN dataset. ‘Discordant by missingness’ are those loci without genotype for one of the libraries, ‘discordant by genotyping’ when both genotypes have information but do not agree, and ‘non-discordant’ when the loci display the same genotype. Each filtered file (100%, 75% and 50%) has been considered separately.
‘Discordant by missingness’ loci could originate when the initial sequenced reads were too low to accomplish the “m” parameter of STACKS (0 or 1 read) or because the number of reads was not enough to pass the 5-read depth filter imposed by VCFtools (2–4 reads). For each individual in the NN-WN dataset, we estimated the number of ‘discordant by missingness’ loci in these two categories, classified according to the number of reads, for the 75% and 50% filtered files (Table S1). The Mann-Whitney-Wilcoxon tests corroborated that the number of missing loci produced due to extremely low sequencing (0–1 reads) was significantly higher than those with a coverage of 2–4 reads, with the exception of the NN libraries at the 75% filter (Figure 3; Table S2). The same test was used to compare the two library types, resulting in a significantly higher percentage of missing loci of the NN libraries for those loci with 2–4 reads compared to the WN libraries at the two filtered files (Figure 3; Table S2). For the missing loci with 0–1 reads, the Mann-Whitney-Wilcoxon tests indicated that their percentage in the WN libraries was significantly higher than in NN libraries for the 50% filter (Figure 3). This is not surprising since by definition base selective adaptors are reducing the number of target loci, and thus a proportion of genotyped loci only exist in the NN dataset. The reverse trend, although not significant, was found in the 75% filtered files (Figure 3). It can be noted that standard deviations are markedly higher in NN libraries regardless of the filter applied (Figure 3), presumably due to the higher locus mean depth and lower frequency of missing data in VIL1N in the combined dataset (Table 3; Table S1).
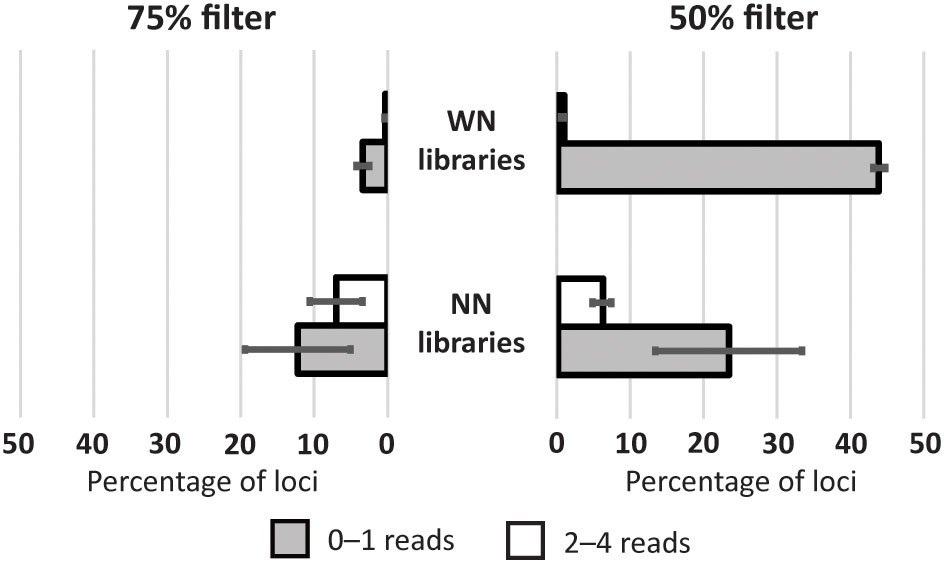
Figure 3 Percentage of loci belonging to each missing category in the NN-WN dataset. Values given for the WN and NN libraries in the 75% and 50% filtered files.
3.3. Effect of library building in genotype discordance
For the ‘discordant by genotype’ loci (those loci that have discrepant genotypes between the two libraries of the individual, being either homozygous or heterozygous for different alleles) we further identified four different combinations, herein referred to as mismatch categories (Figure 4). The most frequent mismatch category for genotype discrepancies (Figure 4) was found for loci homozygous in NN libraries but heterozygous in WN libraries (Nho-Whe) that included 78-89% of the ‘discordant by genotype’ loci, but that accounted for only 3.9-8.3% of to the total number of loci (Figure 4). Note that ca. 70% of those loci discrepancies are produced by a low locus depth (<10 reads). The second type of genotype discordance was found to be for heterozygous loci in the NN library but homozygotes in the WN library (Nhe-Who), which accounted for 9-17% of the ‘discordant by genotype’ (0.7-1.3% of the total loci) in the three filtered files. Another source of discrepancy, seldom found and representing less than 0.1% of the loci (2-4% of the ‘discordant by genotype’) in the three filtered files, was for heterozygous loci with different genotypes in both libraries (Nhe-Whe). Finally, the rarest combination was for homozygous loci with different alleles in both libraries (Nho-Who) that accounted for 0.16-0.3% of the total loci.
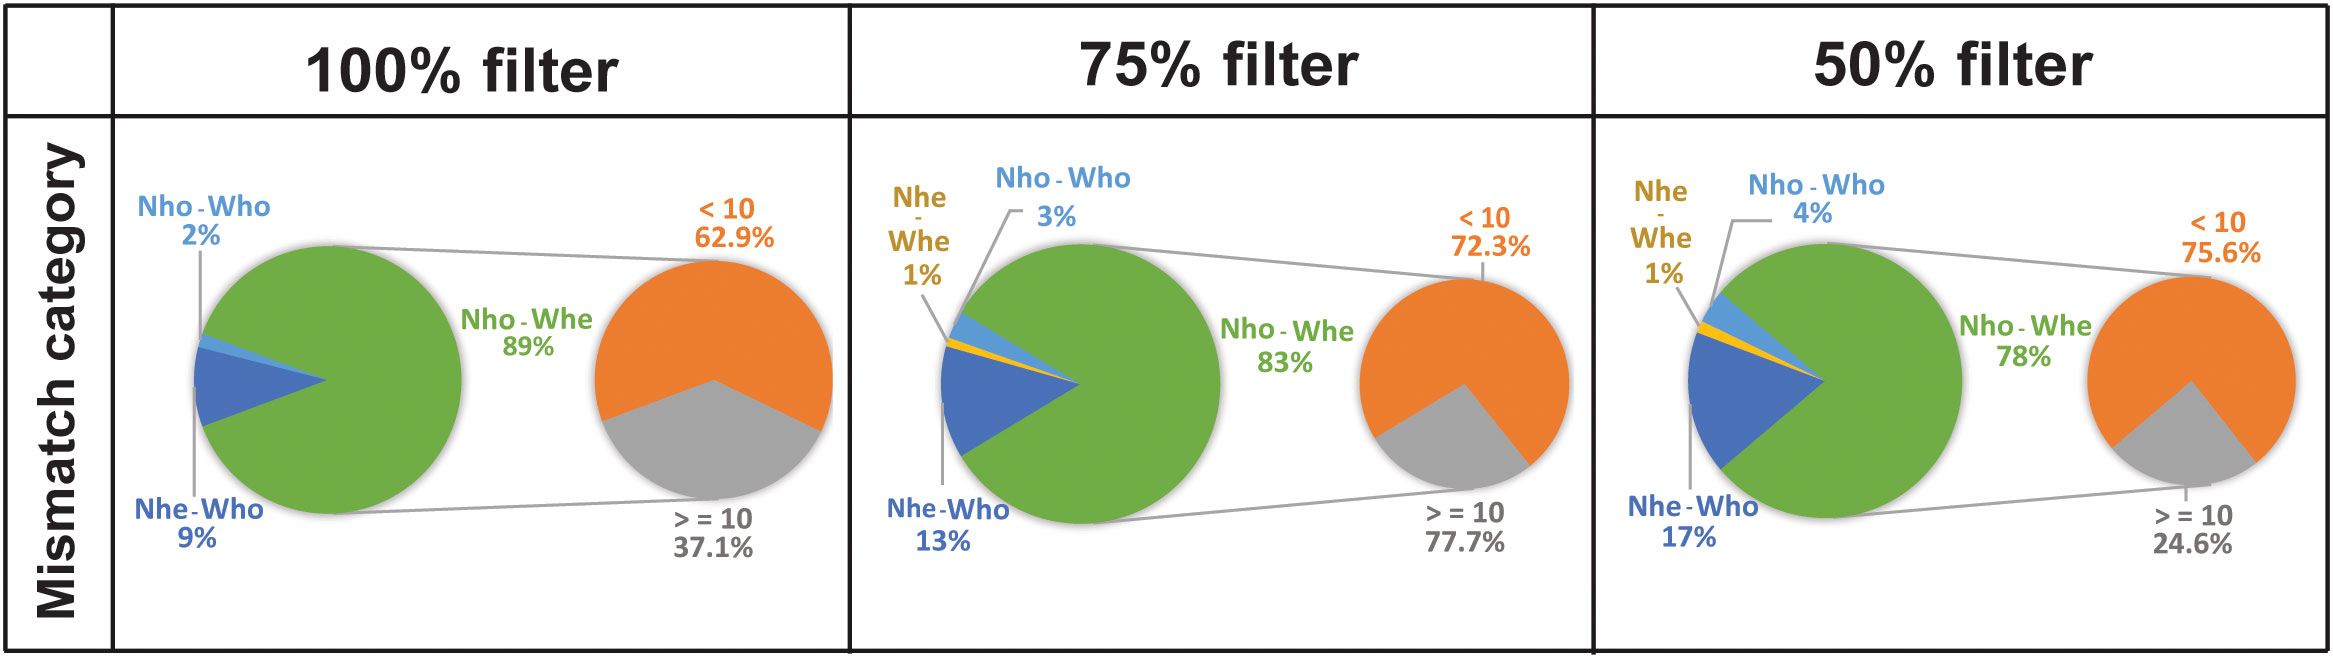
Figure 4 Percentage of ‘discordant by genotype’ loci for each filtered file in the combined dataset. The left pie of each panel shows the mean percentage of ‘discordant by genotype’ loci of each mismatch category for the NN-WN dataset comparing the genotypes in the two libraries for the same individual locus by locus. Each filtered file (100%, 75% and 50%) has been considered separately. Nho = homozygote for NN libraries, Who = homozygote for WN libraries, Nhe = heterozygote for NN libraries, Whe = heterozygote for WN libraries. Note that the percentage of discordant by genotype loci is only 8%, 10% and 5% of the total loci respectively. The pie on the right of each panel shows in detail how much Nho-Whe discordance was attributable to lower (<10 reads) and higher (>=10 reads) sequencing depth.
3.4. Resampling analysis and minimum sequencing effort
To evaluate if the mismatches between library types were produced by insufficient sequencing effort, we simulated different numbers of reads by resampling. For the two libraries of each individual, we simulated eight different datasets between 0.25 and 10 million reads (10 replicates each). We observed that the number of polymorphic loci detected increased with the number of reads following a logarithmic curve for both NN and WN libraries. The NN libraries reached their asymptotic values at ca. 10,000 polymorphic loci whereas for WN libraries this happened at ca. 4,000. The asymptotic values were expected at a mean sequencing effort of 8 million reads for the NN library and 1.5 million reads for the WN library (Figure 5). Thus, the average number of reads (1.02x10⁶) obtained in our empirical work (Table 1; Figure 5) was enough for an accurate loci assessment of the WN dataset but insufficient for the NN dataset. On the other hand, the mean locus depth followed a linear trend with increasing number of reads, being always higher for the WN libraries. Thus, genotype discrepancies due to heterozygous genotypes at WN libraries but homozygous at NN libraries could be caused by the low sequencing depth per locus of the latter. The results obtained by the 10 different replicates were very similar, as shown by the reduced values of the standard deviations (Figure 5).
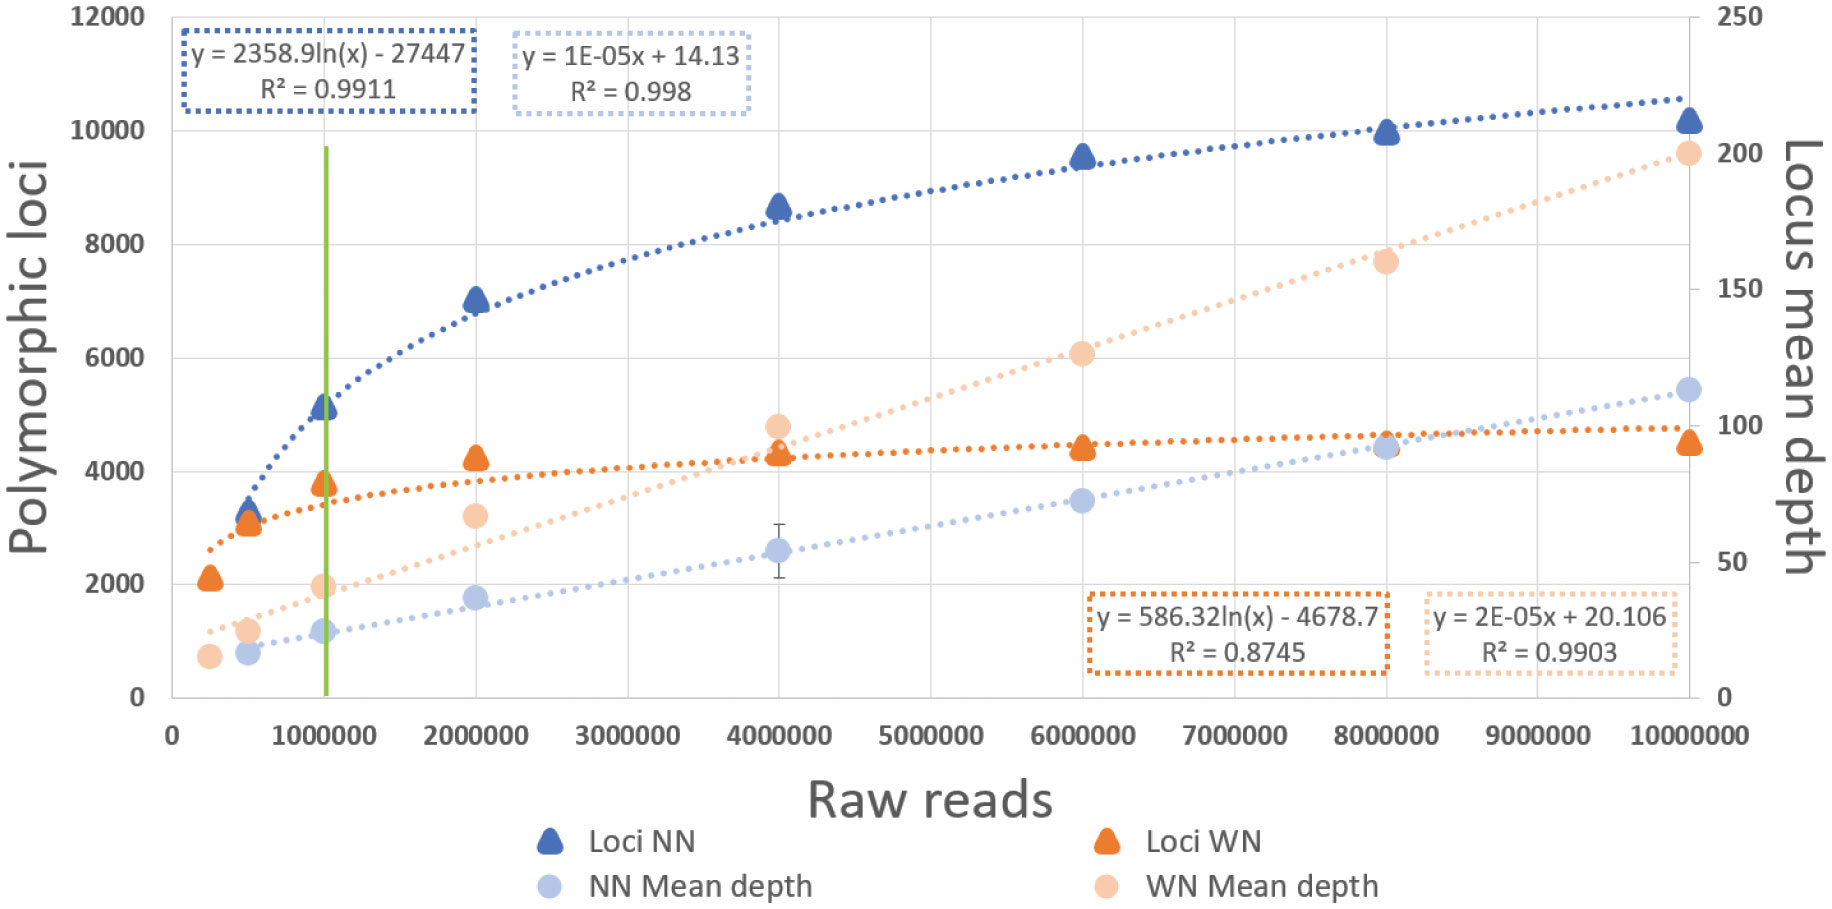
Figure 5 Results of the resampling analysis. Mean number of polymorphic loci and mean depth per locus at different initial raw number of reads simulated by resampling analyses (N=10 iterations) for the NN and WN 75% filtered files. Error bars represent the standard deviation of the 10 replicates for each simulated dataset with 250K, 500K, 1M, 2M, 4M, 6M, 8M and 10M raw reads. The green line indicates the mean number of raw reads empirically obtained in the present study. The formulas in the dark colored boxes correspond to the number of polymorphic loci regression and the formulas in the light colored boxes correspond to locus mean depth, for the NN (blue) and WN (orange) simulated datasets.
4. Discussion
Methodologies based on genome reduction with restriction enzymes have revolutionized the field of population genomics as they allow cost-effective de novo genotyping of non-model organisms with no prior information (Wang et al., 2012). Among the different available techniques, 2b-RAD allows a secondary reduction by using base-selective adaptors. Some simulation studies have shown the effectiveness of this secondary reduction to optimize costs by adjusting sequencing efforts (Barbanti et al., 2020) but to date no empirical study had systematically evaluated the potential impact of the use of base-selective adaptors on the reliability of the genotyping compared to the standard 2b-RAD protocol using fully degenerated adaptors. Our study comparing locus-by-locus the genotyping of the same individuals using the fully degenerated (NN) and the base-selective (WN) adaptors show that 92% of the shared loci present in all libraries have non-discordant genotypes. Consequently, the individuals with different library types cluster closely together. Our results indicate that, for a similar sequencing effort, we obtain more loci but with a lower mean locus depth when using the degenerated set of adaptors (NN) than the selective-base set of adaptors (WN), as found with simulated data in other species with different genome sizes (Barbanti et al., 2020). Furthermore, that study showed that after simulation of base-selective adaptors on non-selected datasets, the genetic distances among individuals with the two datasets were highly correlated. Our results confirm that selective-base ligation is an effective tool for reducing costs of sequencing while reducing the number of loci. They also suggest that the two methods are feasible in population genomics of species with small genome sizes, while the construction of base-selective libraries for species with large genome sizes is advisable when many individuals need to be analyzed with limited funds.
Furthermore, our results provide additional insights into the type and source of potential genotype discrepancies when using base-selective adaptors and fully degenerated adaptors. We observe that missing data and insufficient read depth per locus are major sources of error leading to incorrect genetic differentiation. This observation has major consequences and may affect other population genomic studies, regardless of the methodology used, where the impact of insufficient read depth and missing data in genetic differentiation should not be neglected.
4.1. Patterns and processes of missing data
We have shown that a major source of genetic discrepancies is given by missing data but not library construction with different sets of adaptors. Recent simulation and empirical studies highlights the effect of missing data on introducing biases when inferring population genetic structure (Hendricks et al., 2018; Yi and Latch, 2022). For the combined dataset of the two adaptor libraries (NN-WN) we show that there are no differences between library types when we used only those loci found in 100%, and to a lesser extent with the loci present in 75% of individuals, as their distribution overlaps in the principal coordinate analysis plot. However, as the frequency of missing data increases, the differentiation between library types for the same individual also increases. Interestingly, libraries with more missing data tend to be dragged away towards a more central position in the principal coordinate analysis, as reported in other studies (Yi and Latch, 2022). Nevertheless, the source of missing data varies as we observe in the different filtered files. For instance, in the 75% filtering, the NN library show on average 20% of missing loci while WN libraries have only 4%. The high value of missing loci in NN libraries can be attributed to insufficient low locus coverage and their posterior exclusion by quality filters based on minimum read depth. In our case, we can confirm by simulations that our sequencing effort of the NN libraries was substantially far from the optimal trade-off value established at approximately 4 million raw reads. In consequence, according to the simulations, the NN dataset might have lost more than half of the potential loci, driving the divergence among libraries of the same individual at the 75% filtering. Nonetheless, the effects of missing data might be solved by investing more in sequencing.
The 50% filtered file displays opposite patterns of missing data compared to the 75%. Despite the mean locus coverage of the base-selective libraries is above 20X, as recommended by Barbanti et al. (Barbanti et al., 2020), these libraries are abundant in missing loci and are dragged towards the center in the principal coordinate analysis. The presence of these missing loci, which are in fact those loci non-targeted by the base selective adaptors but found in NN libraries, should not be a concern since reducing the number of loci in the analysis is the expected and desirable outcome of secondary reduction performance. In agreement with this expectation, in our study the percentage of missing loci in the WN libraries change from 4.2% in the 75% filtered file to 45.1% in the 50% filtered file with small standard deviations in both cases. On the other hand, the NN libraries go from 12.2% to 23% in the two filtered files, respectively, with high standard deviations. These values might be interpreted as having high uncertainty in the loci genotyped in sequenced NN libraries, producing imbalanced coverage values, and confirms the robustness of sequencing the WN loci.
Other processes during library preparation and sequencing can affect the production of missing data, randomly biasing the distribution of reads (Rivera-Colón et al., 2021). This could be the case of VIL1N that presents less missing data (5%) and higher locus coverage (on average 20X) than the other NN libraries despite the number of raw reads not being the largest. Thus, when the number of reads is small, we may encounter large variance in loci identification and depth. However, when locus read depth is high, as in base-selective libraries, the frequency of missing loci is similar between libraries, resulting in smaller variance. Genetic distances among libraries and individuals are highly influenced by missing data (Yi and Latch, 2022; present study), and should be minimized to avoid incorrect analyses. The number of loci that will be obtained for a given species depending on its genome size and enzyme used could be empirically predicted (Rivera-Colón et al., 2021), in order to adjust in advance the sequencing effort necessary for a correct genotyping. In addition, the presence of nonspecific bands visualized in an agarose gel after library amplification, fruit of the presence of hybridized adaptors without insert, can also alert of posterior problems in the number of usable reads, as observed in BAR2W where 43% of reads were discarded. Fortunately, this error can be easily avoided by not sequencing libraries presenting an additional inferior band in a regular agarose gel. Thus, we conclude that WN libraries reduce the number of loci and provide higher confidence on genotyping for a given number of reads, and confirms that DNA samples built with both library types can be combined in the same analyses using a 100% filtering avoiding missing data. Nevertheless, even when applying the 100% missingness filtering, it is important to ensure that all samples have a good sequence depth. Low sequence depth results in random incomplete genotyping, since sequencing is not homogeneously distributed. When increasing the number of individuals with low sequence depth, the number of shared loci will rapidly decrease (Casso et al., 2019), compromising the analysis due to an extreme reduction of shared loci. Consequently, if different libraries are combined all of them should have an adequate sequencing.
4.2. Patterns and processes leading to genotyping mismatch
Genotype discordances represent a small proportion in the different filtered datasets (7.67%). They are driven by different processes resulting in four different patterns of heterozygosity and homozygosity in the NN and WN libraries of the same individual. Discrepancies in genotyping due to sequencing errors are especially rare (0.07%) and identified as heterozygotes for different alleles in the two library types (Nhe-Whe). This type of discrepancy can only be detected when more than two alleles are identified in a locus. Haplotype loci, where different phased SNPs are combined resulting in multiple alleles, improves the detection of these sequencing errors. Sequencing errors can also be the reason for Nho-Who mismatches (0.22%), homozygous for different alleles in the same locus. Consequently, technical artefacts seem to be infrequent during RAD library construction and sequencing. In this regard, low frequency mismatches (<1.5%) have been found recently using the same 2b-RAD methodology in the sharpsnout seabream (Diplodus puntazzo), when comparing technical replicates of the same individual (Torrado et al., 2022). Similarly, in the colonial ascidian Didemnum vexillum, less than 1% of genotyping mismatches between half thoraces of the same zooid were detected using whole genome amplification and genotyping by sequencing (Casso et al., 2019). The Nho-Who mismatch can also occur (other than by sequencing errors) when both datasets have low coverage at that particular locus and a different allele is randomly sequenced. Alternatively, low mean depth of the NN loci and allele selection by base-selective adaptors could also account for this mismatch. The most abundant mismatch category (Nho-Whe), involving a homozygous in the NN library and a heterozygote in the WN library (6.44%) was unexpected, since the use of base-selective adaptors should not increase heterozygosity. However, in our case, this observed discrepancy is attributed to insufficient sequencing depth in NN libraries, underestimating heterozygosity. The reduction in heterozygosity due to low sequence depth was highlighted in previous studies as a source of genotyping errors, where heterozygotes are mislabeled as homozygotes (Hendricks et al., 2018). Consequently, genotyping results in low coverage sequencing projects should provide cautionary interpretations and acknowledge these problems. New pipelines allow to treat appropriately low coverage data (Heller et al., 2021). However, these tools only work with SNPs data, which has been demonstrated to provide less information for population genomic studies (Casso et al., 2019; Carreras et al., 2021). Moreover, the genotype calling algorithm employed relies heavily on population allelic frequencies. Therefore, these tools should not be used when allelic frequencies are not available (as in the present study) or cannot be properly assessed due to insufficient sample sizes. We have observed that missing data drives the most abundant mismatch category (Nho-Whe), and this problem can be easily solved by sequencing a higher number of reads, reinforcing the importance of getting a good locus sequence depth for a correct genotyping. Finally, the Nhe-Who (0.96%) combination could be the unlikely consequence of a stochastically lower coverage of the WN compared to a higher coverage in the NN library for a given haplotype loci. A more plausible explanation might be due to the technique itself, which targets fewer loci or alleles when using base-selective adaptors, thus generating null alleles and losing some polymorphisms. For instance, if a given locus has a genotype G/A in one position in the adaptor target, a homozygous A/A genotype will be obtained using WN base-selective adaptors while NN libraries with sufficient read depth will recover both alleles, although with insufficient coverage could be homozygous for G/G resulting in a Nho-Who mismatch. A high number of Nhe-Who mismatches caused by base-selective adaptors would be a major concern for the methodology since it would reduce heterozygosity and cannot be solved by adjusting the sequencing effort. In our case, the frequency of this mismatch category is very rare, and we can thus conclude that the use of this secondary loci reduction in population genomic studies is sound to analyze a smaller fraction of the loci.
Overall, our results demonstrate that missing data is a major concern for a correct identification of genetic differentiation, and should not be neglected in genomic studies. Actually, based-selective adaptors reduce the number of loci, increase their coverage for a given sequencing effort, minimize missing data and provide a reliable genotyping at a lower sequencing cost. We have shown that when carrying out this secondary genome reduction, there is a low impact on heterozygosity, and therefore we validate that 2b-RAD libraries using base-selective adaptors are a robust tool to use in population genomics of species with a wide range of genome sizes, promoting the use of this technique in future studies.
Data availability statement
The datasets presented in this study can be found in online repositories. The names of the repository/repositories and accession number(s) can be found below: https://www.ebi.ac.uk/ena, PRJEB53487. All pre-filtered VCF files used in the study are available as Supplementary Dataset.
Author contributions
CG-C, CC, XT, and MP conceived and designed the study. CG-C did the laboratory analysis. CG-C and MP conducted the data analysis. CG-C wrote the manuscript with input from all authors. All authors contributed to the article and approved the submitted version.
Acknowledgments
This work was supported by project CTM2017‐88080 (MCIN/AEI/10.13039/501100011033 and by ERDF “A way of making Europe” of the European Union), its associated grant PRE2018-085227 given to CG, and project PID2020-118550RB (MCIN/AEI/10.13039/501100011033). All authors are part of the research group SGR2017-1120 of the Generalitat de Catalunya‐AGAUR.
Conflict of interest
The authors declare that the research was conducted in the absence of any commercial or financial relationships that could be construed as a potential conflict of interest.
Publisher’s note
All claims expressed in this article are solely those of the authors and do not necessarily represent those of their affiliated organizations, or those of the publisher, the editors and the reviewers. Any product that may be evaluated in this article, or claim that may be made by its manufacturer, is not guaranteed or endorsed by the publisher.
Supplementary material
The Supplementary Material for this article can be found online at: https://www.frontiersin.org/articles/10.3389/fmars.2022.1079839/full#supplementary-material
References
Barbanti A., Torrado H., Macpherson E., Bargelloni L., Franch R., Carreras C., et al. (2020). Helping decision making for reliable and cost-effective 2b-RAD sequencing and genotyping analyses in non-model species. Mol. Ecol. Resour. 20, 795–806. doi: 10.1111/1755-0998.13144
Breed M. F., Harrison P. A., Blyth C., Byrne M., Gaget V., Gellie N. J. C., et al. (2019). The potential of genomics for restoring ecosystems and biodiversity. Nat. Rev. Genet. 20, 615–628. doi: 10.1038/s41576-019-0152-0
Carreras C., Ordóñez V., García-Cisneros À., Wangensteen O. S., Palacin C., Pascual M., et al. (2021). The two sides of the Mediterranean: Population genomics of the black sea urchin Arbacia lixula (Linnaeus 1758) in a warming sea. Front. Mar. Sci. 8. doi: 10.3389/fmars.2021.739008
Casso M., Turon X., Pascual M. (2019). Single zooids, multiple loci: independent colonisations revealed by population genomics of a global invader. Biol. Invasions 21, 3575–3592. doi: 10.1007/s10530-019-02069-8
Catchen J., Hohenlohe P. A., Bassham S., Amores A., Cresko W. A. (2013). Stacks: an analysis tool set for population genomics. Mol. Ecol. 22, 3124–3140. doi: 10.1111/mec.12354
Danecek P., Auton A., Abecasis G., Albers C. A., Banks E., DePristo M. A., et al. (2011). The variant call format and VCFtools. Bioinformatics 27, 2156–2158. doi: 10.1093/bioinformatics/btr330
Díaz-Arce N., Rodríguez-Ezpeleta N. (2019). Selecting RAD-seq data analysis parameters for population genetics: The more the better? Front. Genetics 10 533. doi: 10.3389/fgene.2019.00533
Heller R., Nursyifa C., Garcia-Erill G., Salmona J., Chikhi L., Meisner J., et al. (2021). A reference-free approach to analyse RADseq data using standard next generation sequencing toolkits. Mol. Ecol. Resour. 21, 1085–1097. doi: 10.1111/1755-0998.13324
Hendricks S., Anderson E. C., Antao T., Bernatchez L., Forester B. R., Garner B., et al. (2018). Recent advances in conservation and population genomics data analysis. Evolutionary Appl. 11, 1197–1211. doi: 10.1111/eva.12659
Hernandez-Castro L. E., Villacís A. G., Jacobs A., Cheaib B., Day C. C., Ocaña-Mayorga S., et al. (2022). Population genomics and geographic dispersal in chagas disease vectors: Landscape drivers and evidence of possible adaptation to the domestic setting. PloS Genet. 18, e1010019. doi: 10.1371/journal.pgen.1010019
Iguchi A., Tada I., Nagano A. J., Yasuda N. (2021). Genetic structure of pacific crown-of-thorns starfish (Acanthaster cf. solaris) in southern Japan based on genome-wide RADseq analysis. Coral Reefs 40, 1379–1385. doi: 10.1007/s00338-021-02145-3
Kamvar Z. N., Tabima J. F., Grünwald N. J. (2014). Poppr: an r package for genetic analysis of populations with clonal, partially clonal, and/or sexual reproduction. PeerJ 2, e281. doi: 10.7717/peerj.281
Lesueur C.A. (1823). Descriptions of several new species of Ascidia. Journal of the Academy of Natural Sciences of Philadelphia. 3, 2–8. doi: 10.1093/bioinformatics/bty633
Min F., Xu F., Huang S., Wu R., Zhang L., Wang J. (2022). Genetic diversity of Chinese laboratory macaques based on 2b-RAD simplified genome sequencing. J. Med. Primatology 51, 101–107. doi: 10.1111/jmp.12571
Narum S. R., Alex Buerkle C., Davey J. W., Miller M. R., Hohenlohe P. A. (2013). Genotyping-by-sequencing in ecological and conservation genomics. Mol. Ecol. 22, 2841–2847. doi: 10.1111/mec.12350
North H. L., McGaughran A., Jiggins C. D. (2021). Insights into invasive species from whole-genome resequencing. Mol. Ecol. 30, 6289–6308. doi: 10.1111/mec.15999
Paradis E., Schliep K. (2019). ape 5.0: an environment for modern phylogenetics and evolutionary analyses in R. Bioinformatics, 35, 526–528. doi: 10.1093/bioinformatics/bty633
Paris J. R., Stevens J. R., Catchen J. M. (2017). Lost in parameter space: a road map for stacks. Methods Ecol. Evol. 8, 1360–1373. doi: 10.1111/2041-210x.12775
Pecoraro C., Babbucci M., Franch R., Rico C., Papetti C., Chassot E., et al. (2018). The population genomics of yellowfin tuna (Thunnus albacares) at global geographic scale challenges current stock delineation. Sci. Rep. 8, 13890. doi: 10.1038/s41598-018-32331-3
Pfenninger M., Schönnenbeck P., Schell T. (2022). ModEst: Accurate estimation of genome size from next generation sequencing data. Mol. Ecol. Resour. 22, 1454–1464. doi: 10.1111/1755-0998.13570
Rius M., Turon X. (2020). Phylogeography and the description of geographic patterns in invasion genomics. Front. Ecol. Evol. 8. doi: 10.3389/fevo.2020.595711
Rivera-Colón A. G., Rochette N. C., Catchen J. M. (2021). Simulation with RADinitio improves RADseq experimental design and sheds light on sources of missing data. Mol. Ecol. Resour. 21, 363–378. doi: 10.1111/1755-0998.13163
Tonzo V., Ortego J. (2021). Glacial connectivity and current population fragmentation in sky islands explain the contemporary distribution of genomic variation in two narrow-endemic montane grasshoppers from a biodiversity hotspot. Diversity Distributions 27, 1619–1633. doi: 10.1111/ddi.13306
Torrado H., Carreras C., Raventos N., Macpherson E., Pascual M. (2020). Individual-based population genomics reveal different drivers of adaptation in sympatric fish. Sci. Rep. 10, 12683. doi: 10.1038/s41598-020-69160-2
Torrado H., Pegueroles C., Raventos N., Carreras C., Macpherson E., Pascual M. (2022). Genomic basis for early-life mortality in sharpsnout seabream. Sci. Rep. 12, 17265. doi: 10.1038/s41598-022-21597-3
Wang S., Meyer E., McKay J. K., Matz M. V. (2012). 2b-RAD: a simple and flexible method for genome-wide genotyping. Nat. Methods 9, 808–810. doi: 10.1038/nmeth.2023
Keywords: RADseq, 2b-RAD, missing loci, locus mean depth, genetic differentiation, non-model organisms, heterozygosity, Empirical - comparison
Citation: Galià-Camps C, Carreras C, Turon X and Pascual M (2022) The impact of adaptor selection on genotyping in 2b-RAD studies. Front. Mar. Sci. 9:1079839. doi: 10.3389/fmars.2022.1079839
Received: 25 October 2022; Accepted: 29 November 2022;
Published: 12 December 2022.
Edited by:
Lorenzo Zane, University of Padua, ItalyReviewed by:
Stefano Mona, Université Paris Sciences et Lettres, FranceAdrián Casanova Chiclana, University of Santiago de Compostela, Spain
Muhua Wang, Sun Yat-sen University, China
Copyright © 2022 Galià-Camps, Carreras, Turon and Pascual. This is an open-access article distributed under the terms of the Creative Commons Attribution License (CC BY). The use, distribution or reproduction in other forums is permitted, provided the original author(s) and the copyright owner(s) are credited and that the original publication in this journal is cited, in accordance with accepted academic practice. No use, distribution or reproduction is permitted which does not comply with these terms.
*Correspondence: Carles Galià-Camps, Y2dhbGlhY2FtcHNAZ21haWwuY29t