 Hsiao-Yun Chang
 Kim McKown2,3
 Yong Chen
- 1School of Marine and Atmospheric Sciences, Stony Brook University, Stony Brook, NY, United States
- 2Marine Fisheries, New York State Department of Environmental Conservation, New York, NY, United States
- 3Retired, Kings Park, NY, United States
Climate change is known to have significant impacts on coastal marine ecosystems. However, a good understanding of the exact impacts requires consistent long-term monitoring programs, which are not available for many coastal marine ecosystems. The Hudson River Estuary (HRE) provides critical habitats for many estuarine, freshwater, and diadromous species. The Longitudinal River Ichthyoplankton Survey and Water Quality Survey in the Hudson River Biological Monitoring Program provided a long-term time series (1974-2017) for examining the changes in salinity and other environmental variables and identifying the temporal variability of fish diversity. In this study, we examined the environmental data and found a 2-phase pattern in the salinity time series data with a change point of 1984. We calculated a Margalef index and a Simpson index to examine species richness and evenness for early and older life stages in the upper and lower HRE, and explored the potential effects of rising sea level and salinity on fish biodiversity. This study reveals that sea level and salinity may play an important part in explaining increased species richness and evenness. The increased occurrence, establishment and range expansion of marine species as well as possible displacement of freshwater species may be associated with sea level-induced salinity change observed in the HRE. This study highlights a need for a long-term consistent monitoring program and a better understanding of climate change effects on the biota in coastal estuary ecosystems such as the HRE in order to enhance management, conservation, and restoration plans.
Introduction
The Hudson River Estuary (HRE) is a historically important resource that provides ecological, social and economic services for local communities. The estuary contains a wide range of salinity gradient and diverse environment that provides critical habitats for over 200 fish species at various life stages, including many commercially and recreationally important species such as striped bass (Morone saxatilis), American eel (Anguilla rostrata), and American shad (Alosa sapidissima) (Levinton and Waldman, 2006). Many economically and/or ecologically important fish species utilize the HRE for part or all of their life cycle.
Biodiversity has been widely used as an indicator to monitor and evaluate ecological health of aquatic or terrestrial systems (Dasgupta et al., 2017; Tu et al., 2020; Aziz et al., 2021; Tikadar et al., 2021). In general, higher biodiversity is indicative of a healthy ecosystem (Pawluk et al., 2021), suggesting a suitable environment with diverse functional guilds. Many factors could affect biodiversity in coastal waters, including environmental conditions (habitat suitability), introduced or invasive species, pollution, urbanization, and other anthropogenic activities (Aziz et al., 2021). Among these factors, climate-induced environmental changes have been identified as important in affecting fish distribution and community structure (Dasgupta et al., 2017; Shaha et al., 2022). Pawluk et al. (2021) investigated climate effects on fish diversity in eight subtropical bays of Texas, USA, identifying that temperature, salinity, and sea level as having significant effects on fish diversity with sea level being the most important factor for driving increasing fish diversity. Nevertheless, Gain et al. (2008) reported declines of 59% and 21% in the number of freshwater species due to increased salinity in two southwest coastal regions of Bangladesh.
As a result of climate change, the mean annual water temperature in the HRE and the sea level at the mouth of the estuary have been rising since the 1930s or earlier (Strayer et al., 2014). The changes in water temperature could have a direct impact on fish physiology as well as fish community (Nack et al., 2019). With sea level rise and change in thermal habitat induced by climate change, seawater intrusion introduces ecological and social problems when it moves the salt front landward which might result in salinization of freshwater system (Venâncio et al., 2019) and impacts on the fish habitat quality by altering the salinity gradient. Therefore, understanding the salinity variability and its impacts on the ecosystem becomes critically important for improved management, conservation, and restoration plans for the HRE ecosystem (Levinton and Waldman, 2006).
The objectives of this study are to (1) examine the long-term time series of salinity for the HRE; (2) identify patterns in the long-term time series of marine and freshwater species richness in the changing HRE environment; (3) evaluate the effects of sea level, salinity, temperature, and dissolved oxygen on species diversity of the fish assemblage in the HRE; and (4) identify dominant marine and freshwater species that could be directly or indirectly influenced by the changing environmental conditions in the HRE.
We used survey data collected from the Long River Survey (LRS) and Water Quality Survey of the Hudson River Biological Monitoring Program (HRBMP) from 1974 to 2017 to examine the species richness, evenness, and dominance for early (eggs and larva) and older (young-of-year and older) life stages in the upper and lower HRE. Based on a preliminary analysis (see Materials and Methods and Results), we hypothesized that the changed salinity gradient might have potential impacts on the fish communities in the upper and lower HRE. Specifically, we hypothesized that marine species richness in the lower HRE would increase with changed salinity gradient, while the marine species richness in the upper HRE is hypothesized to remain the same as the upper HRE provides a relatively stable freshwater environment. For freshwater species, we hypothesized that the species richness in the lower HRE would decrease with changed salinity gradients due to spatial avoidance (i.e. ability of organisms to detect and move away from a stressed environment, Venâncio et al., 2020; Venâncio et al., 2021); while the freshwater species richness in the upper HRE was hypothesized to increase due to displacement of the freshwater species in the lower HRE. To further examine other aspects of species’ diversity, we used species evenness which incorporates richness as well as species’ abundance for both life stages in upper and lower HRE. We hypothesized that the species evenness had changed over time due to the establishment or displacement of some marine or freshwater species of both life stages in the upper and lower reaches of the HRE. Finally, we examined species dominance defined as the number of different species that account for the top 90% of the abundance in each year. We then examined the abundance of marine and freshwater species which were frequently considered dominant species.
We limited the consideration to marine and freshwater species, because of the complex life-histories and robust salinity tolerances of estuarine and diadromous species. We aim to provide a preliminary guide for exploring the impacts of sea level rise and other climate-induced environmental changes on the HRE.
Materials and methods
Study area
The study area covered 226 km of the Hudson River from Albany, New York (rkm 245) to Yonkers, New York (rkm 19) and contains a wide gradient of salinities from head to mouth. The study area was originally divided into 13 river regions including the Battery area in the LRS of the HRBMP which started in 1974 (Figure 1). However, the Battery was not sampled until 1988. To maximize the availability of the longest time series in the database, the Battery strata was excluded from the analysis. The salt front location (freshwater-saltwater interface) is highly influenced by river discharge, which could affect wildlife habitats and water supplies (de Vries and Weiss, 2001). Therefore, a preliminary analysis was conducted to divide the HRE into brackish water and freshwater using daily salt front data collected by the United States Geological Survey from 1992 to 2015. Only May, June, and July data were used to match the season in this study (see data availability). Daily salt front data were averaged over months and season (May-July), ranging among years from rkm 64 (the lower bound of the Indian Point) to rkm 104 (close to the lower bound of the Poughkeepsie), with a mean of rkm 82 (Figure S1). It should be noted that the locations of salt front varied considerably within and among years during May to July with a standard deviation of 11 rkm among years (Figure S1), indicating highly variable saline environment in the HRE. Therefore, the lower HRE in this study was defined as the transition area of saline water from Yonkers (rkm 19) to Poughkeepsie (rkm 122) which is considered a saline environment with high variation in salinity. The upper HRE was defined from Hyde Park (rkm 123) to Albany (rkm 245) which is considered an environment with relatively lower salinity and a more constant freshwater environment. Due to limited data availability, the salt front data were only used to determine the upper and lower HRE prior to the analyses. The long-term LRS provided an excellent and unique opportunity to examine how the composition of marine and freshwater species responds to climate-induced environmental changes.
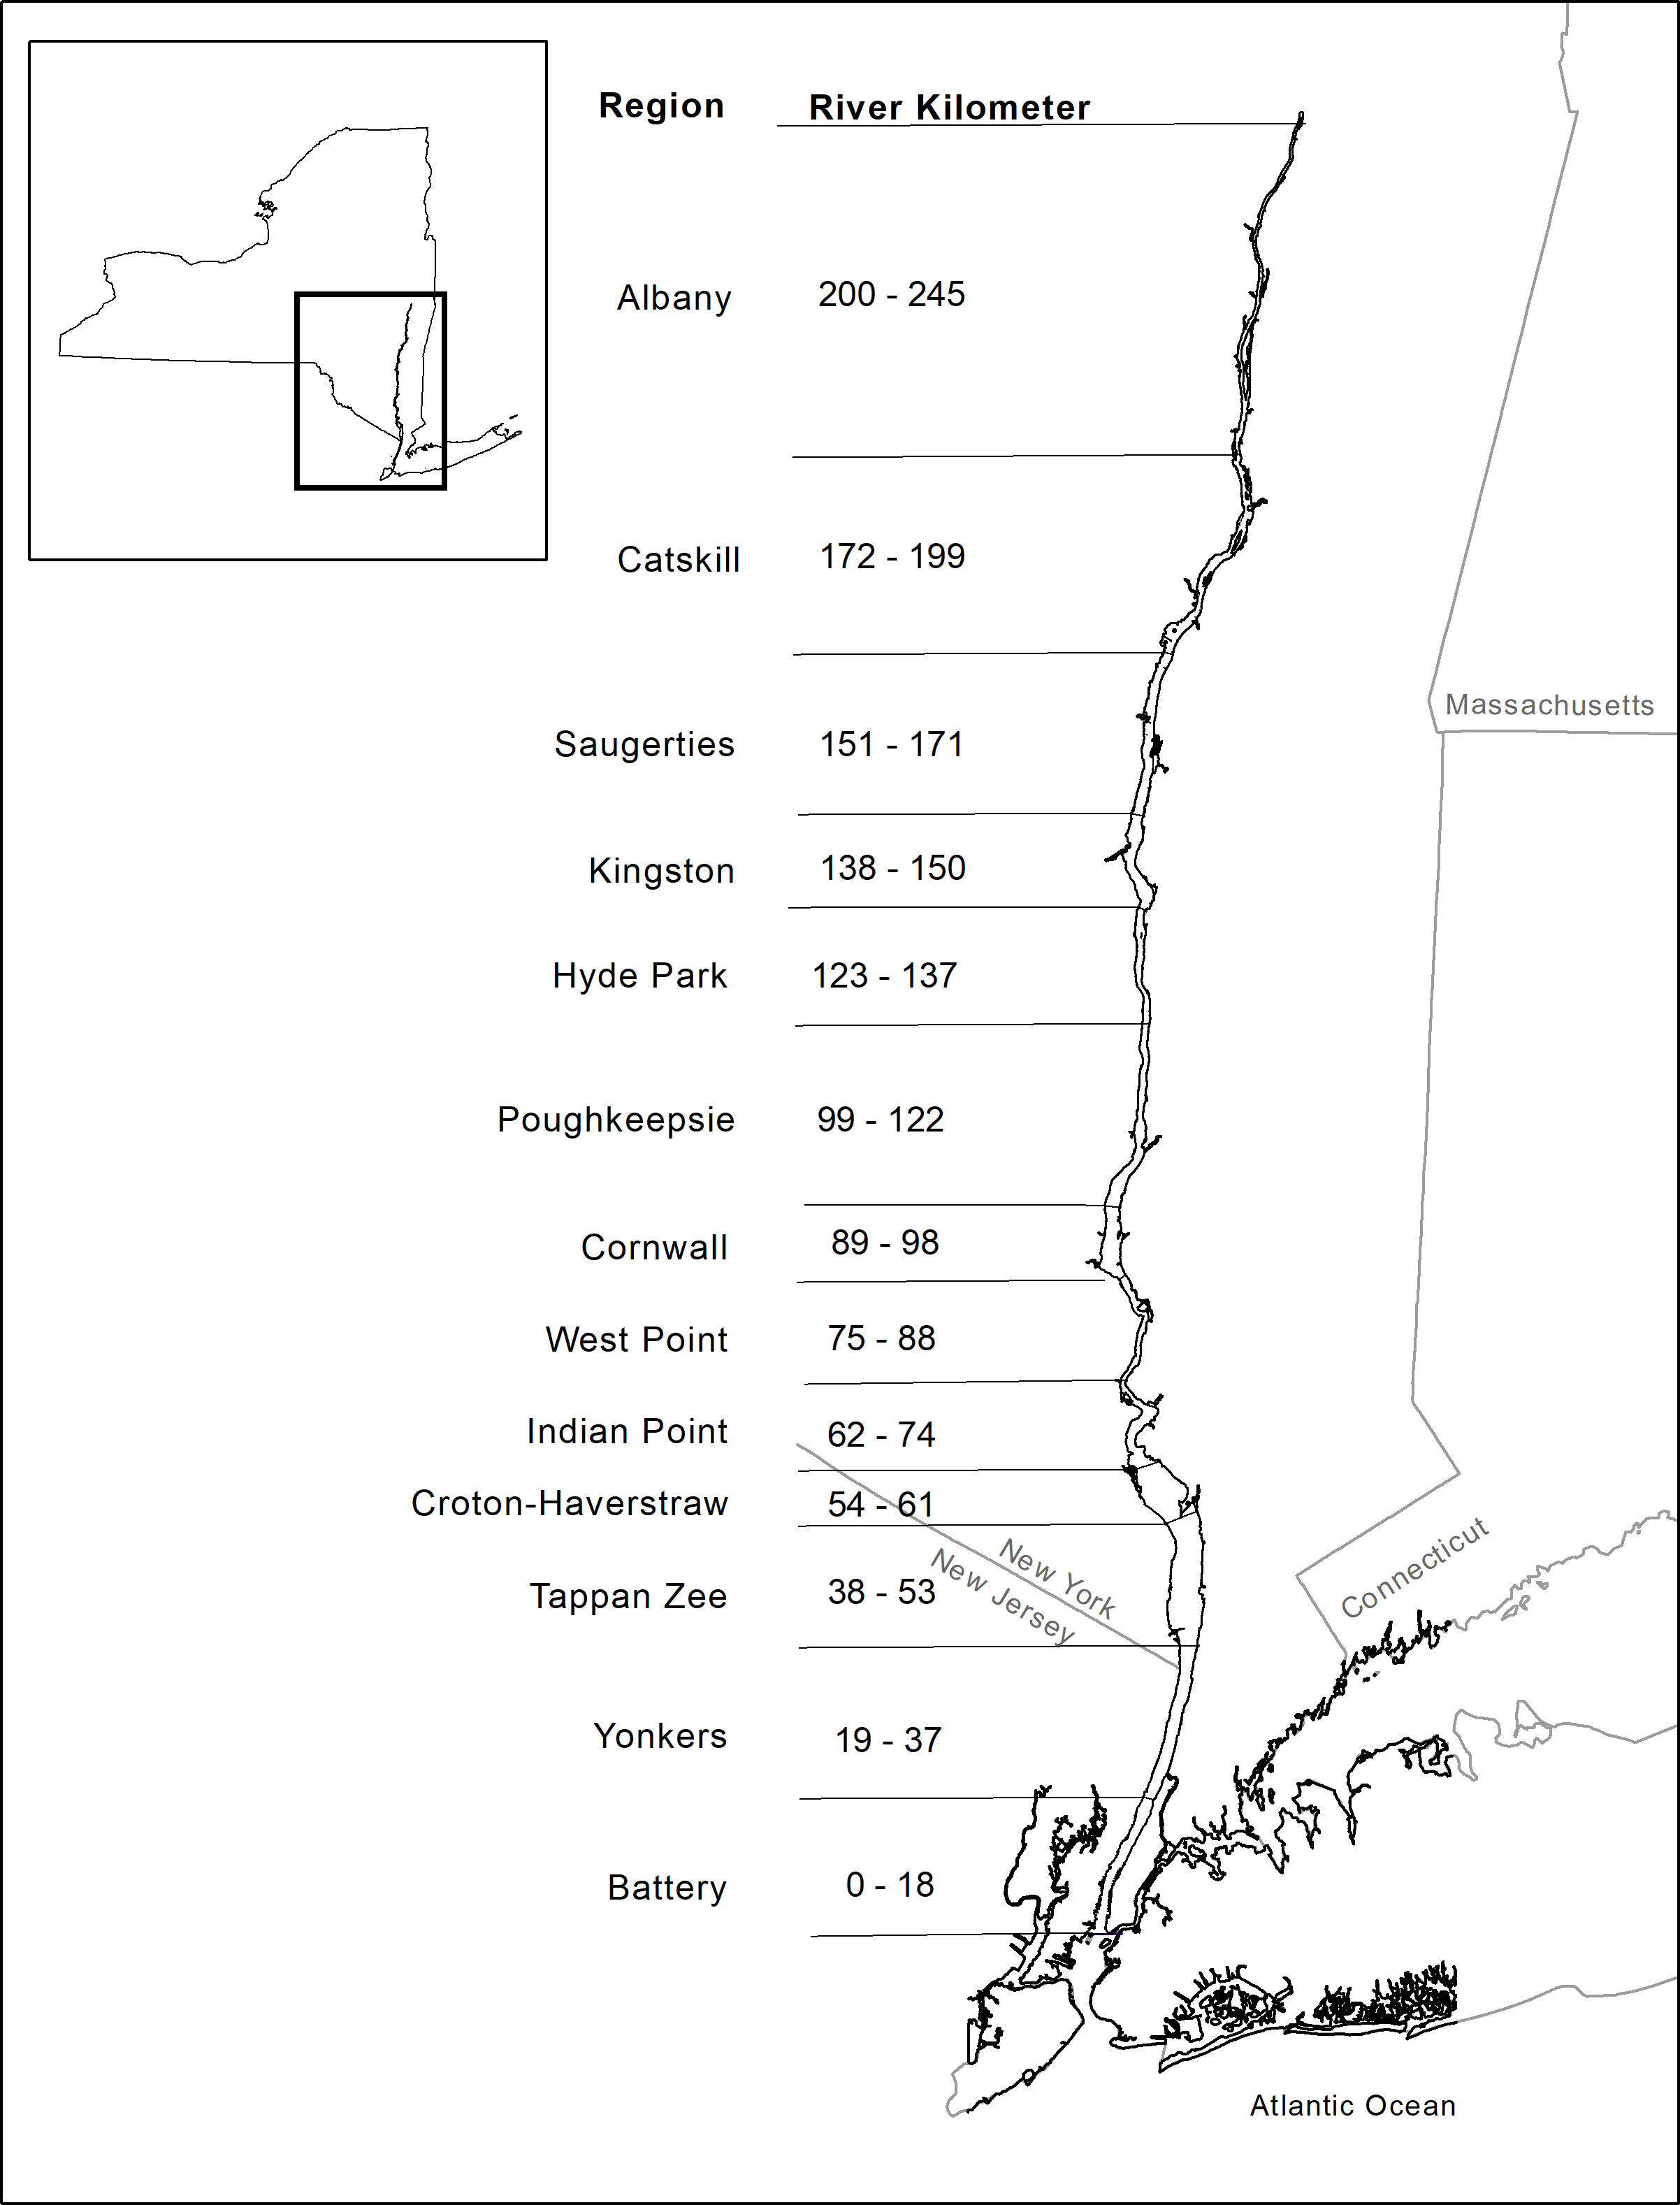
Figure 1 Map of the Hudson River Estuary surveyed by the Long River Survey of the Hudson River Biological Monitoring Program with 13 river regions (Battey data was not used in this study).
Long river survey
The LRS was conducted throughout the study area in 1974-2017 on a weekly basis during May-July (biweekly after this time period) using a stratum-based stratified random sampling design. However, no sampling was conducted in July during 1980-1987. Three strata were sampled, including shoal (water depth of 6 m or less), channel (water depth more than 3 m from the river bottom in more than 6 m depth), and bottom (water depth within 3 m of the river bottom in more than 6 m depth).
A 1 m2 tucker trawl was used for sampling shoal and channel strata, and a 1 m2 epibenthic sled was used for sampling the bottom. Both gears were fitted with 0.5 mesh plankton nets and were evenly used over sampling times and areas except for 2012 when only a tucker trawl was used. Epibenthic sled was not used in 2012 summer due to the old expiration of the Incidental Take Permit, and epibenthic sled was the gear that more likely caught the endangered sturgeon species than the tuck trawl. As a result, only tucker trawl was used for the LRS sampling in 2012 summer (ASA Analysis & Communication (ASAAC), 2013). Abundance data of ichthyoplankton and fishes at older life-stages were collected from the LRS, including eggs, yolk-sac-larva (YSL), post-yolk-sac-larva (PYSL), young-of-year (YOY), and older.
Sampling was conducted in both daytime and nighttime (daytime was defined as from 30 minutes after sunrise to 30 minutes before sunset, and the rest was defined as nighttime.) over the whole study area, but sampling intensity was heavily skewed toward nighttime since 2000 (Figure S2). Furthermore, no sampling was taken in daylight from 1987-1999. Therefore, only nighttime sampling data were used in this study to reduce the possible bias induced by differences between daytime and nighttime sampling as well as to maximize the availability of the longest time series.
Sea level rise data
Monthly mean sea level data collected by National Oceanic and Atmospheric Administration at the Battery station (https://tinyurl.com/y857uf97) were used. Mean sea level data from May-July were then averaged over for each year.
Water quality survey
Prior to 1982, water quality parameters including water temperature, dissolved oxygen, and conductivity were taken at depth associated with the LRS biological sampling (depth ranging from surface to bottom with a mean depth at 8.8 m). Since 1982, the water quality measurements were collected from fixed stations from 0.3 m below the surface, mid-depth, and 0.3 m above the bottom. As the sampling design of water quality survey changed in 1982, we used water quality data collected from fixed stations that had been consistently sampled over 1974-2017 with more than 20 observations. Salinity was converted from conductivity data collected in the survey (ASA Analysis & Communication (ASAAC), 2016). Salinity data were averaged over sampling stations and weeks during May-July within rkm in a given year. Mesohaline was defined as water with salinity of 5-18 ppt from ocean-derived salt, and oligohaline was defined as water with salinity of 0.5-5 ppt (Daniels et al., 2005; Shaha et al., 2022). The time series of river kilometers at the upper limits of mesohaline and oligohaline waters were used to quantify changes in the salinity gradient in the lower and upper HRE, respectively.
The time series of mesohaline and oligohaline upper limits were initially graphically inspected and a 2-phase pattern appeared to be present over the time series (Figure 2). A preliminary analysis of segmented regression (Muggeo, 2003; Muggeo, 2017) was therefore conducted to identify the possible change point(s). Zero to three change points were considered for the time series and the number of change points were optimized using BIC scores, the model with lowest BIC was selected. One change point of the year 1984 was identified for both time series of mesohaline (R2 = 0.297) and oligohaline (R2 = 0.192) upper limits. The averages of the upper limit of the mesohaline and oligohaline from 1974-1984 (phase 1) were down river at rkm 34.85 and rkm 74.77, respectively. From 1985 to 2017 (phase 2), the averages of the upper limits of both isohalines increased to rkm 48.05 and rkm 85.78, respectively. The observed shifting of isohalines may suggest changes in the salinity gradient and consequent habitat change. A student’s t-test was then used to test the hypothesis that the average location of the upper limits of the isohalines (rkm) in phase 2 were greater (further upriver) than the average location of the upper limits of the isohalines in phase 1. For both isohalines, the averages of the upper limits of the isohaline locations in phase 2 were significantly greater than the average upper limit of isohaline locations in phase 1 (1-sided tests. df=42, p<0.05).
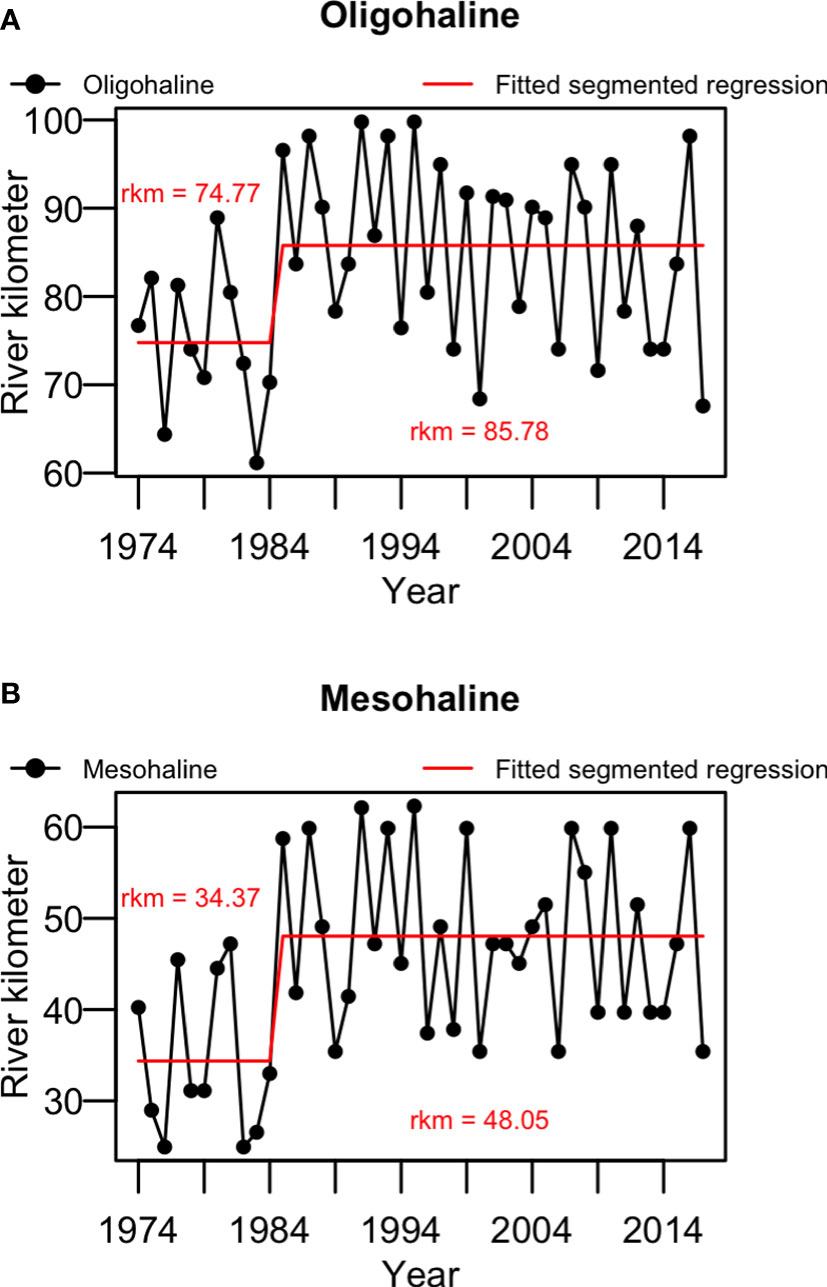
Figure 2 Time series of the locations of the upper limits of (A) oligohaline and (B) mesohaline of the Hudson River Estuary, during May-July in each year. The red lines indicate the fitted segmented regression, and the red text indicate the average of river kilometer (rkm) in phase 1 (1974-1984) and phase 2 (1985-2017).
Water temperature, dissolved oxygen, and salinity data were averaged over sampling locations and weeks during May-July within upper (rkm 123-245) and lower (rkm 19-122) HRE for each year. The averaged water quality data were used as the explanatory variables in linear models (see below).
Fish data
Collected fish samples from the LRS were analyzed in the laboratory and identified to species or lowest possible taxon and the numbers of individuals were counted. Life-stages of eggs, YSL, and PYSL were grouped into “Eggs and larva” (E&L) which were considered to have limited swimming ability to select preferred habitats or avoid unfavored environments. YOY and older life-stages were grouped into “YOY and older” (Y&O) which are considered to have sufficient swimming ability to select preferred habitats or avoid unfavored environments. Furthermore, the locations with the presence of E&L could be considered as spawning habitat, and the locations with the presence of Y&O could be considered as nursery habitat. It should be noted that increased swimming ability may increase the potential for gear avoidance. Therefore, population level effects for Y&O are limited to data collected by the sampling gear for this study.
Each species was classified based on their migration patterns (data source from FishBase and personal communication with the NYSDEC). Anadromous, catadromous, amphidromous, and estuarine species were classified into the “diadromous” group; freshwater and potamodromous were classified into the “freshwater” group, and brackish, marine, and oceanodromous species were classified into the “marine” group. Only freshwater and marine groups were considered in this study, and the diadromous group was not analyzed or discussed in depth due to their complex life-histories and higher tolerance of a wide range of salinities. Time series (1974-2017) of marine and freshwater species for the two groups of E&L and Y&O were used in the analyses.
Biological indicators and hypotheses testing
A Margalef index (d) was used to examine the changes in species richness for the two groups of E&L and Y&O in the upper and lower HRE. A Margalef index assesses the number of identified species taking into account the effects of sample size (Margalef, 1968; García-Seoane et al., 2016; Kunda et al., 2022):
where S = number of identified species, and N = total number of individuals.
The time series of Margalef indices for all species (dall) showed a 2-phase pattern as observed in the isohalines (see Results). The Margalef species richness index was therefore further examined for the E&L and Y&O of marine (dmarine) and freshwater (dfreshwater) species, and a series of hypotheses were then developed for examining the changes in marine and freshwater species richness between the two phases (Table 1). T-tests were used for the hypothesis testing at the significance level at 0.05.
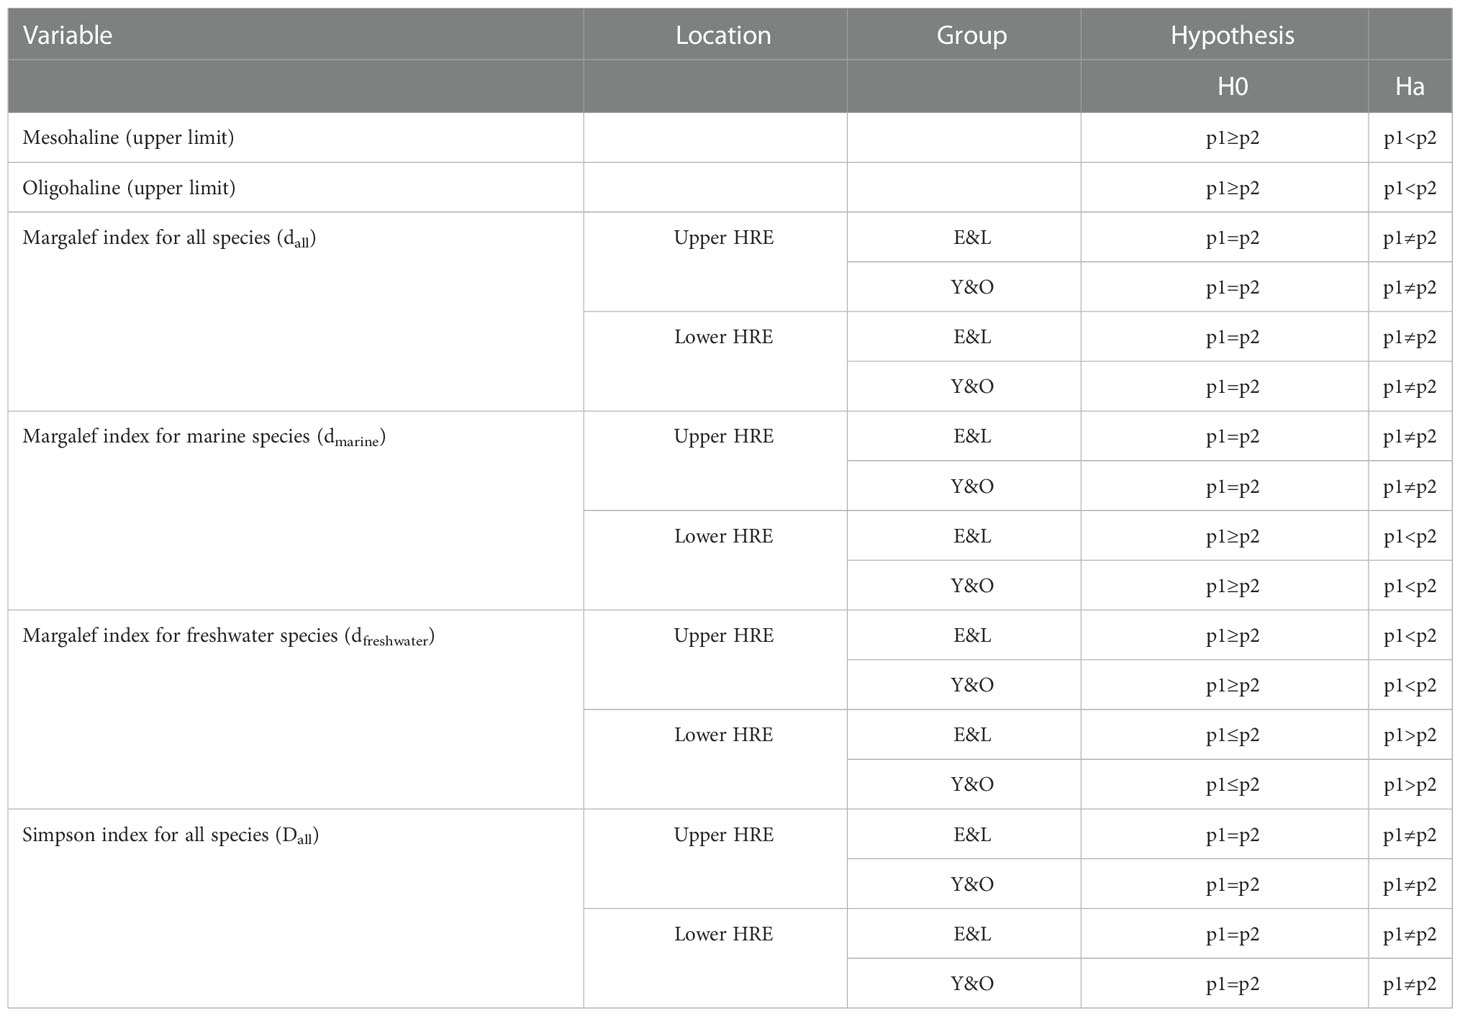
Table 1 A series of hypotheses developed for testing the differences between phase 1 (p1, 1974-1984) and phase 2 (p2, 1985-2017) for isohalines, Margalfe index for all, marine, and freshwater species, and Simpson index for all species during May-July in the upper and lower Hudson River Estuary (HRE).
A Simpson index (Dall) was used to evaluate species diversity taking into account the abundance of each species. It measures species evenness, giving more weight to abundant species (Simpson, 1949; García-Seoane et al., 2016; Kunda et al., 2022):
where n = the number of individuals of a species, and N = the total number of individuals of all species. The Simpson index was used for examining if there is increasing or decreasing establishments of fish species over the two phases. Therefore, it was hypothesized the averaged values of the Simpson index was equal over the two phases. T-tests were used for the hypothesis testing at the significance level at 0.05.
Linear models were used to examine the effects of sea level and environmental factors (water temperature, dissolved oxygen, and salinity) on Margalef species richness (for all species, marine species, and freshwater species) and Simpson species evenness (overall diversity for all species). The Simpson index was not used for marine and freshwater species, because this indicator was used to examine the species evenness in the overall HRE. I.e., if there were more establishments of fish populations, both Margalef and Simpson indices would increase. If the increased species richness (Margalef index) was due to strayers or temporary visitors, the Simpson index would not increase significantly as it is not sensitive to additional rare species and gives more wight to abundant species. Before model development, a variance inflation factor (VIF) analysis was conducted to identify multicollinearity (Chang et al., 2020). The four variables considered in the analysis had VIFs< 3. Therefore, all variables were used in the model. The relative importance of each variable was determined by the differences of R2 between the full and reduced models (excluding one variable), which quantifies the variance explained by the excluded variable. Residual diagnosis was graphically examined through Q-Q plots for evaluating the distribution of residual errors (Zuur et al., 2009). Shapiro-Wilk normality tests were conducted for testing the deviation of residual errors for each model. All statistical analyses were performed with R version 4.0.3 (R Core Team, 2020).
The numbers and proportions of marine and freshwater species that were only observed in phase 2 or disappeared in phase 2 for the two groups (E&L and Y&O) in the lower and upper HRE were identified and examined. In this study, species that only occurred in phase 2 were considered new species, and species that only occurred in phase 1 are considered disappeared species. However, it should be noted that species that were new to the LRS and disappeared from the LRS are not necessarily new to or disappeared from the HRE.
The number of the species that account for at least 90% of the abundance (i.e. species diversity or species dominance) for E&L and Y&O in the upper and lower HRE were examined (all species identified including freshwater, marine, and diadromous species data were used for determining species dominance). Of these dominant species, the number of marine and freshwater species as well as the abundance of species that became dominant species in phase 2 and were observed for more than five years were further investigated. The abundance index used was estimated as number of individuals per volume of water sampled (m3).
Results
Sea level and environmental variables
An increasing trend was found in the time series of annual mean sea level during May to July (Figure 3A). The rising rate of sea level appeared to be faster since the 2000s. Similar to the isohalines, a 2-phase pattern was found in the time series of salinity in both upper and lower HRE, where salinity increased to a higher level after the mid-1980s (Figure 3B). The time series of water temperature in the upper and lower HRE showed similar trends until the mid-1980s, the water temperatures of the lower HRE became slightly higher than temperatures in the upper HRE in most years since then (Figure 3C). The time series of dissolved oxygen in the lower and upper reaches of the HRE showed different patterns (Figure 3D). For the upper HRE, the dissolved oxygen decreased to a low level of around 7 mg/L in 1981-1982, then it increased to a high level of around 8.5 mg/L with a slightly decreasing trend from 1982 to 2017. As for the lower HRE, the dissolved oxygen fluctuated at around 7.5-8.5 mg/L between the 1970s and late 1990s, then started to decrease since the 2000s.
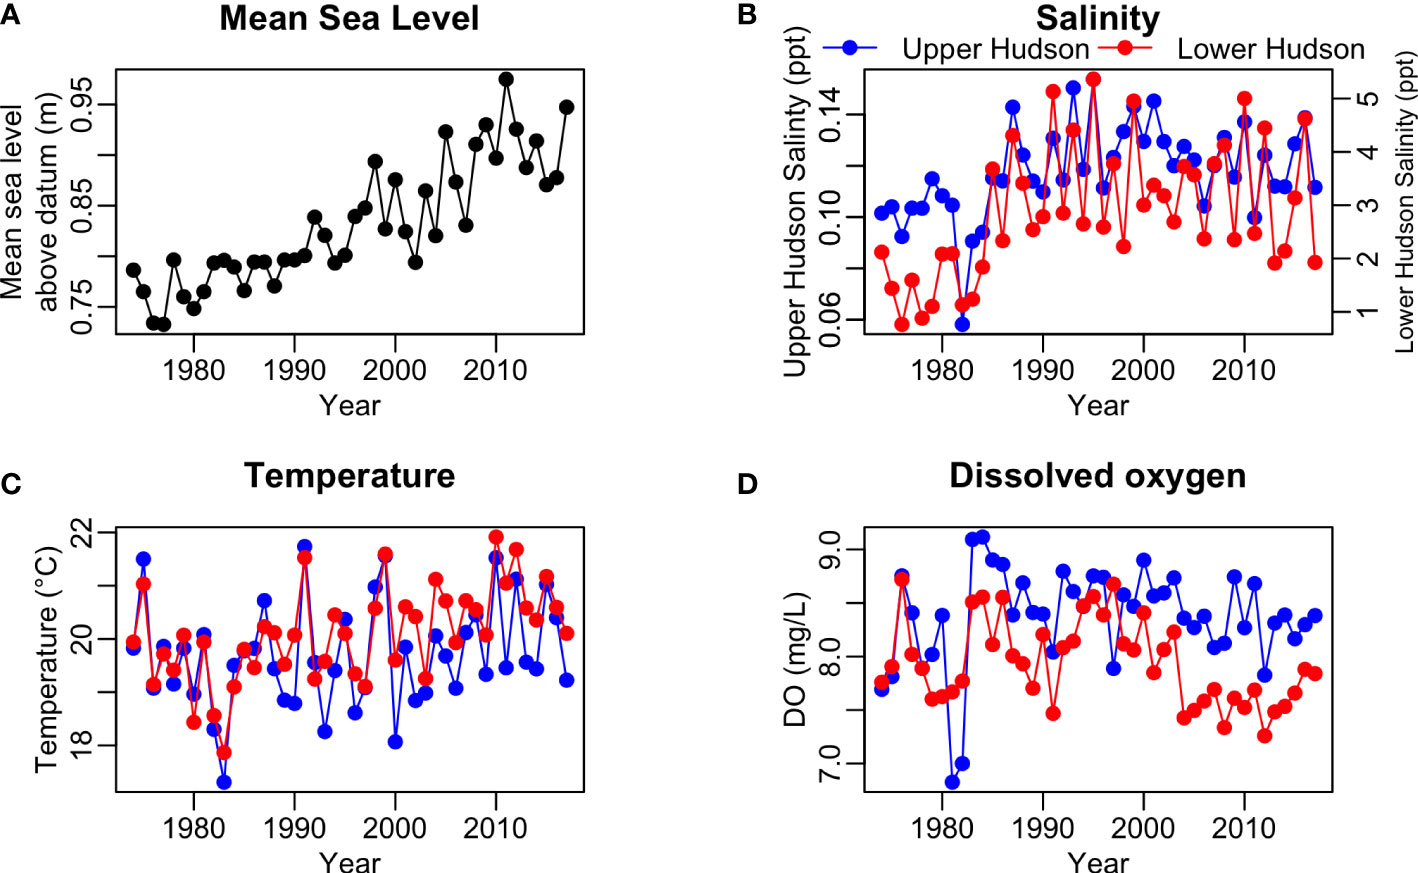
Figure 3 The time series of (A) the averaged sea level in meters above station datum at the Battery station in New York City (https://tinyurl.com/y857uf97), (B) the averaged salinity, (C) water temperature, and (D) dissolved oxygen in the upper and lower Hudson River Estuary during May-July in each year.
Species richness (Margalef index)
A 2-phase pattern identified in the time series of isohalines was also found in the time series of dall (Margalef index) (Figure 4A). The dall was higher in phase 2 (1985-2017) for E&L and Y&O in both lower and upper HRE. There was a significant difference between the averages of dall in the two phases were significantly different for all groups (2-sided t-tests, df = 42, p<0.05).
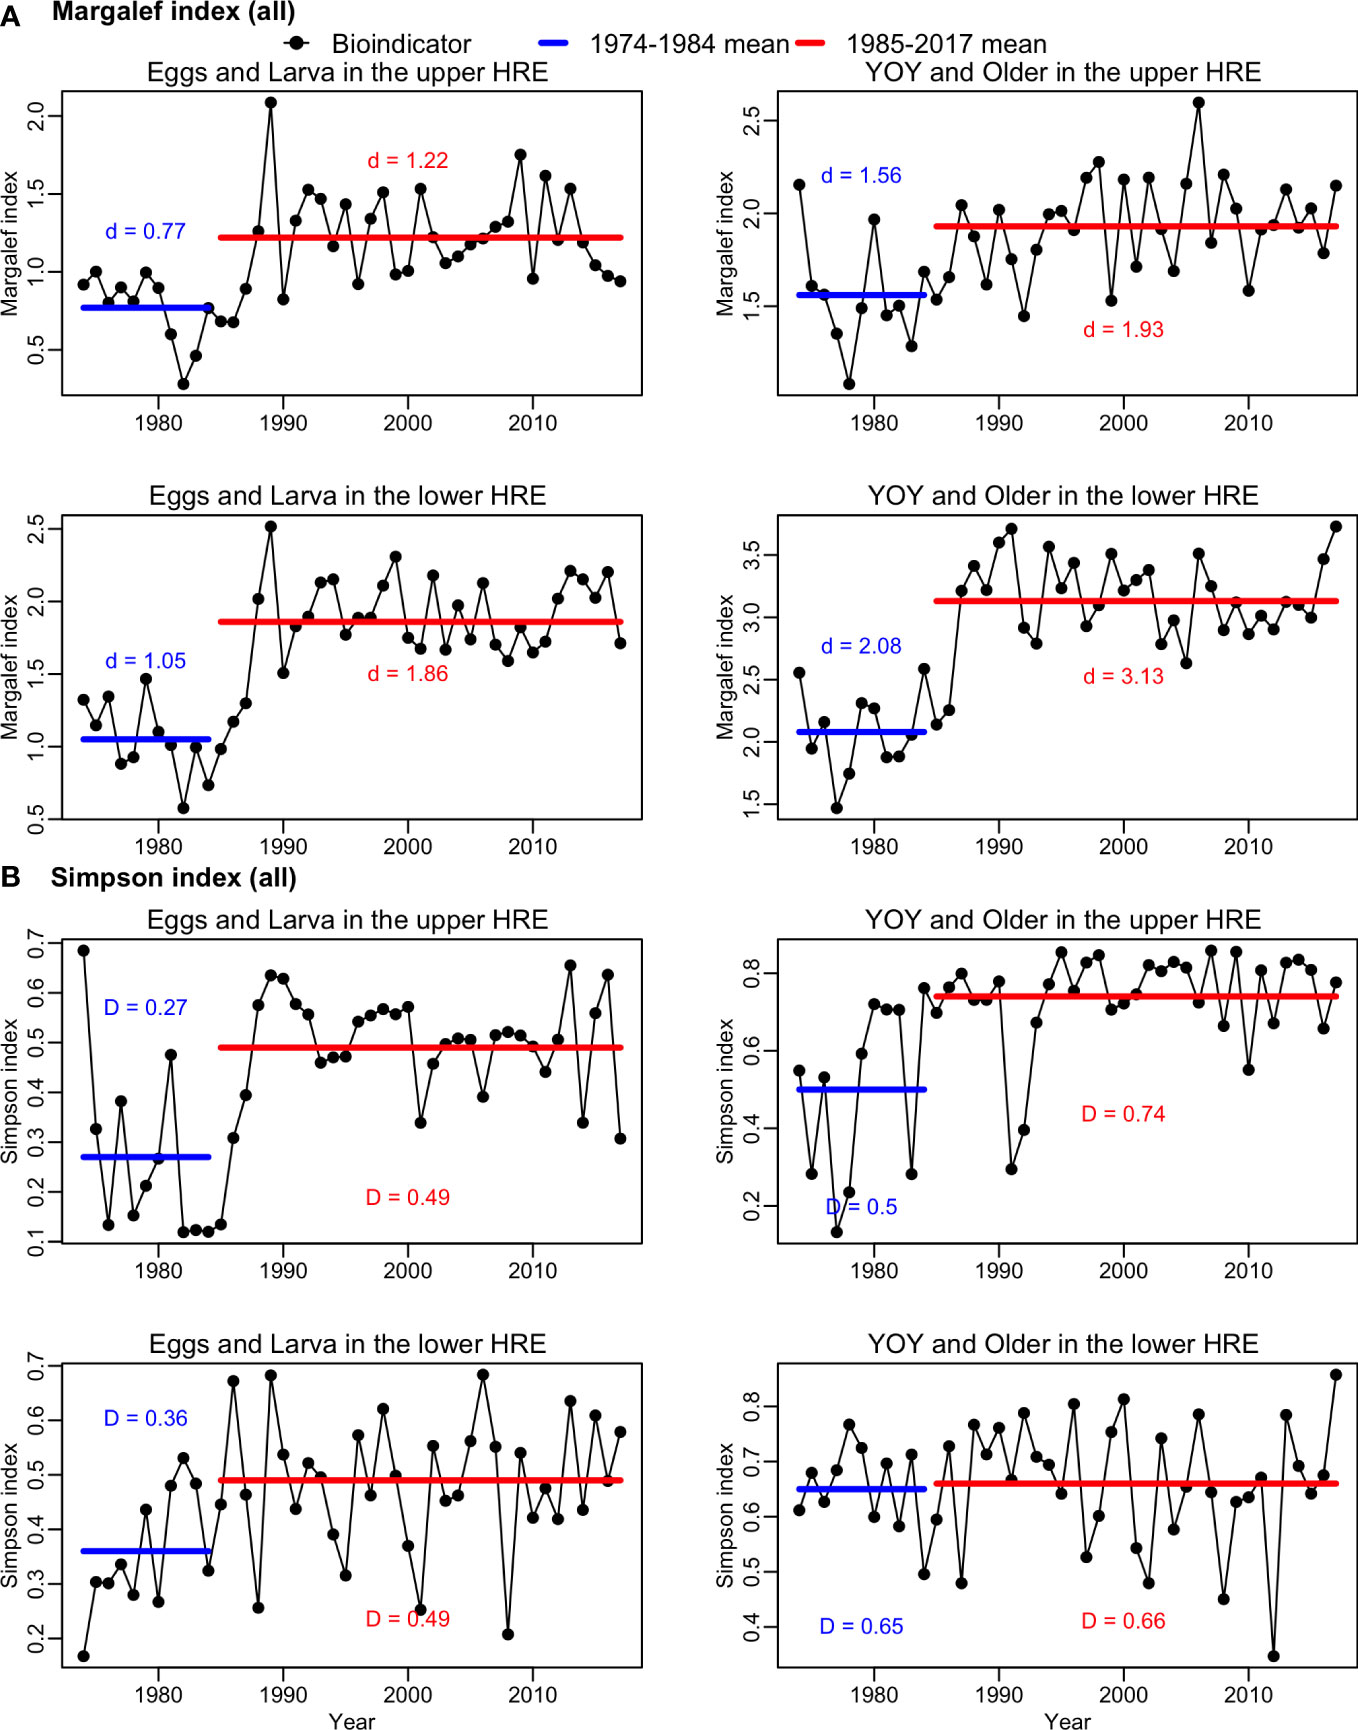
Figure 4 Time series of (A) Margalef index (dall) and (B) Simpson index (Dall) for all species of early (eggs and larva) and older (young-of-year [YOY] and older) life stages during May-July from 1974-2017 in the upper and lower Hudson River Estuary (HRE). The blue horizontal lines indicate the average numbers of species in phase 1 (1974-1984), and the red horizontal lines indicate the average numbers of species in phase 2 (1985-2017).
The linear models suggested that the dall was positively associated with sea level for E&L and Y&O in both lower and upper HRE (Table 2). Sea level was identified as an important variable in explaining the variation in dall. It explained 10.3% and 20.6% of the variation in dall for E&L and Y&O in the upper HRE, respectively; and it explained 10% and 11% of the variation for the E&L and Y&O in the lower HRE, respectively (Figure 5A). The salinity was positively associated with the E&L in the upper HRE (explained 10.5% of the variation) and on the Y&O in the lower HRE (explained 9% of the variation) (Figure 5A). The effects of water temperature and dissolved oxygen were not significant on dall for all groups, and only a relatively small amount of variation was explained by these two variables compared to sea level and salinity. The models were able to explain 31.4-44.5% of the variation (Table 2). The distributions of residuals for all dall models did not deviate from normal distribution (Shapiro-Wilk normality tests, p>0.05) except for the E&L in the upper HRE (Shapiro-Wilk normality test, p<0.05) due to a single outlier (Figure S3).
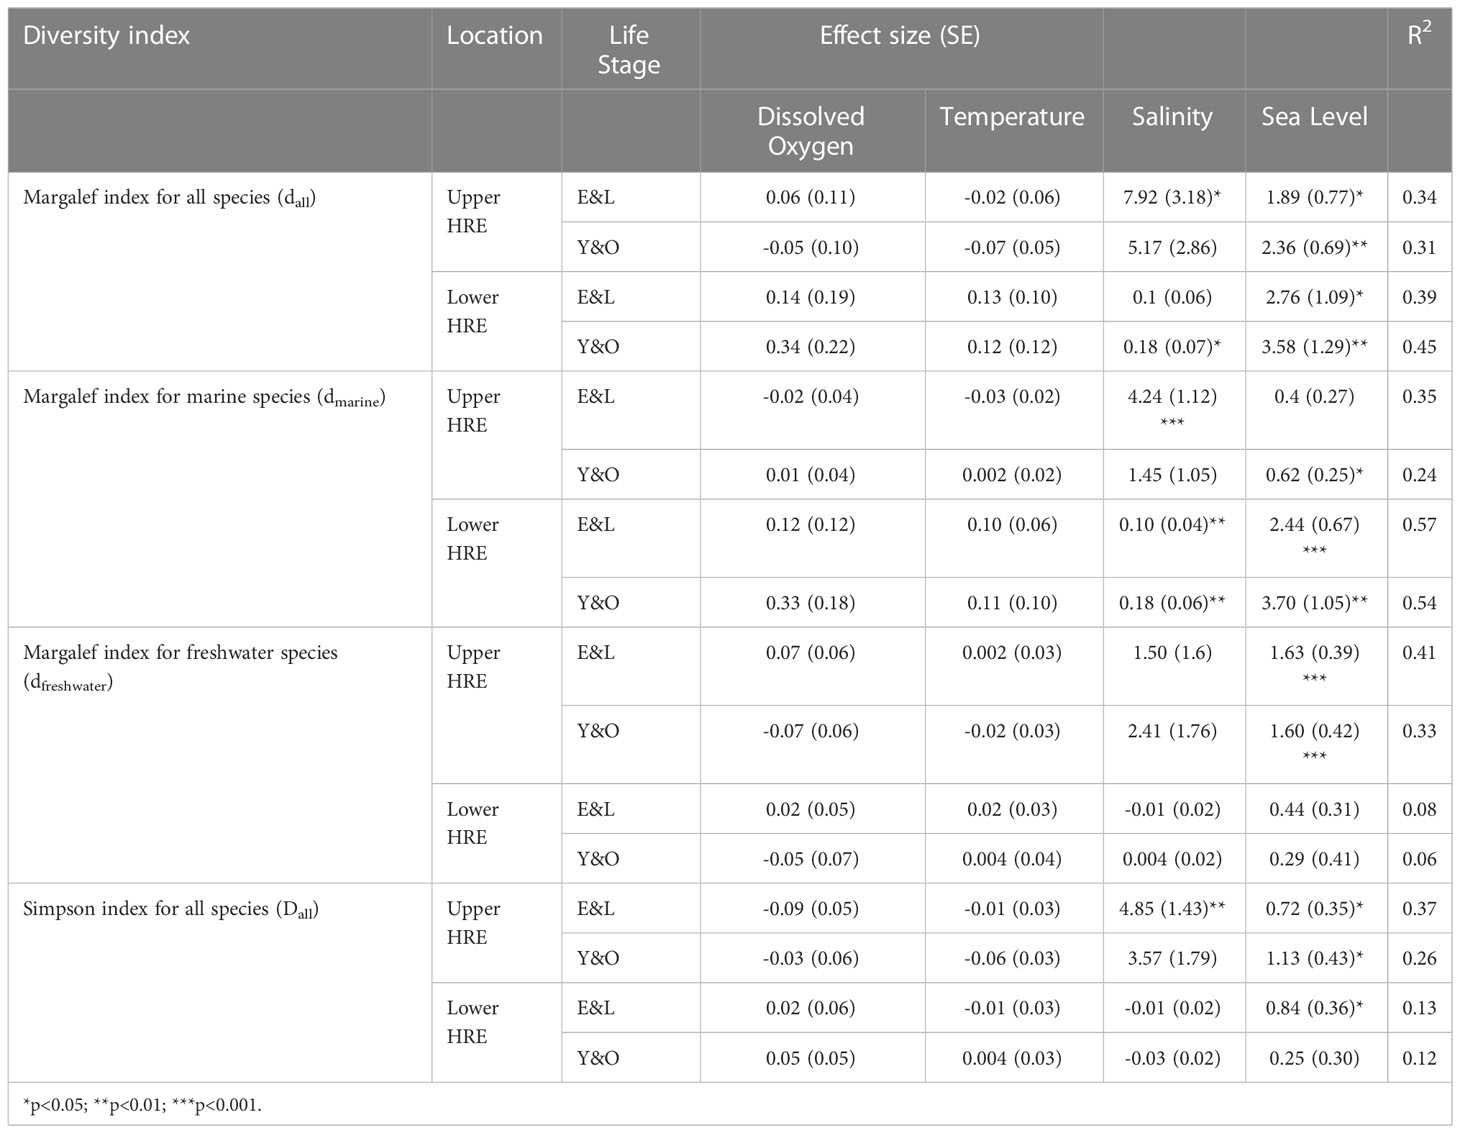
Table 2 Model statistics from the linear models for factors associated with Margalef and Simpson indices for the early (eggs and larva; E&L) and older (young-of-year [YOY] and older; Y&O) life stages in the lower and upper Hudson River Estuary (HRE) during May-July from 1974-2017.
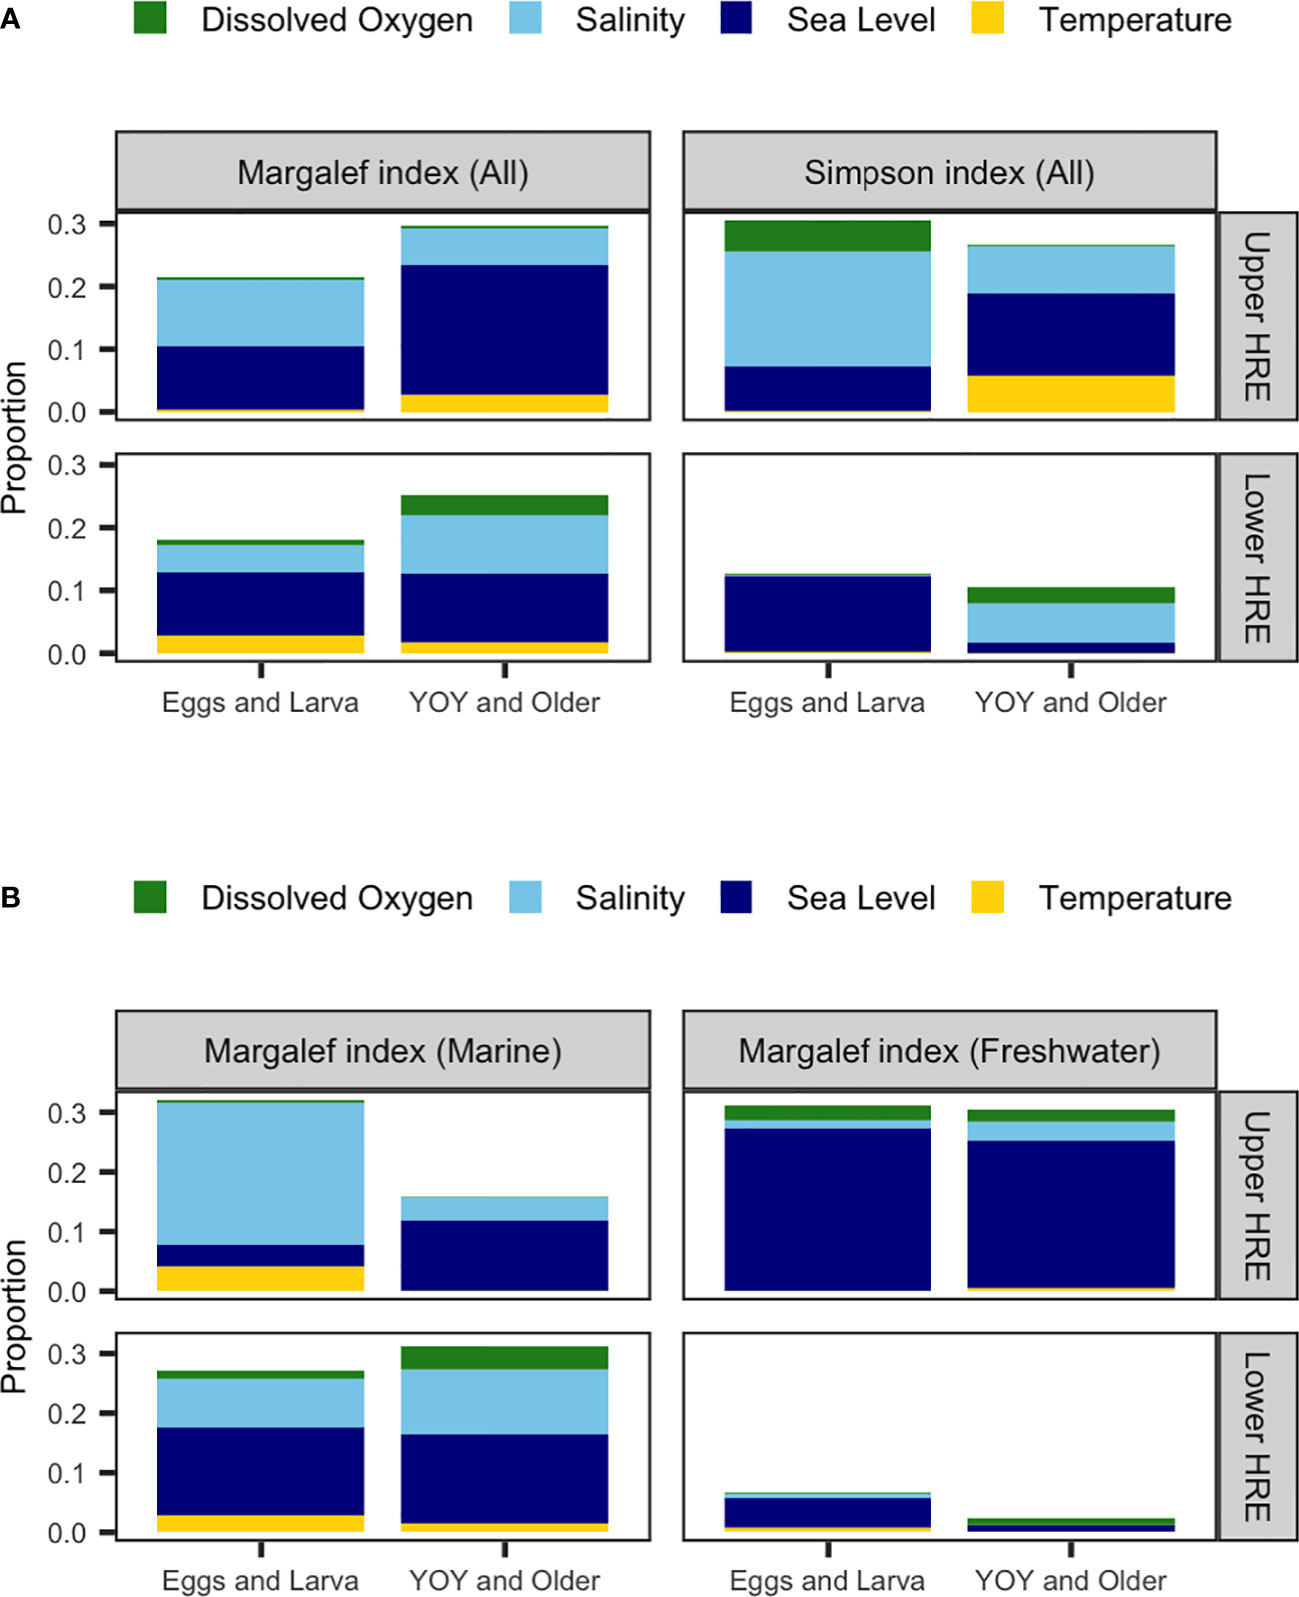
Figure 5 The relative importance of each variable (as indicated by color) in the models of (A) Margalef index (dall) and Simpson index (Dall) for all species, and (B) Margalef index for marine (dmarine) and freshwater (dfreshwater) species for early (eggs and larva) and older (young-of-year [YOY] and older) life stages in the upper and lower Hudson River Estuary (HRE).
The time series of dmarine also showed a 2-phase pattern, especially for the lower HRE groups (Figure 6A). The dmarine of both groups in the upper HRE was hypothesized to remain constant due to relatively stable saline environment. However, as in the lower HRE, a 2-phase pattern was also noted in the dmarine of both groups in the upper HRE (Figure 6A). The differences between the two phases were significant (2-sided t-test, df = 42, p<0.05) for both E&L and Y&O in the upper HRE. For dmarine in the lower HRE, the average dmarine in phase 2 was significantly greater than the average dmarine in phase 1 (1-sided t-test, df. = 42, p<0.05) for both E&L and Y&O.
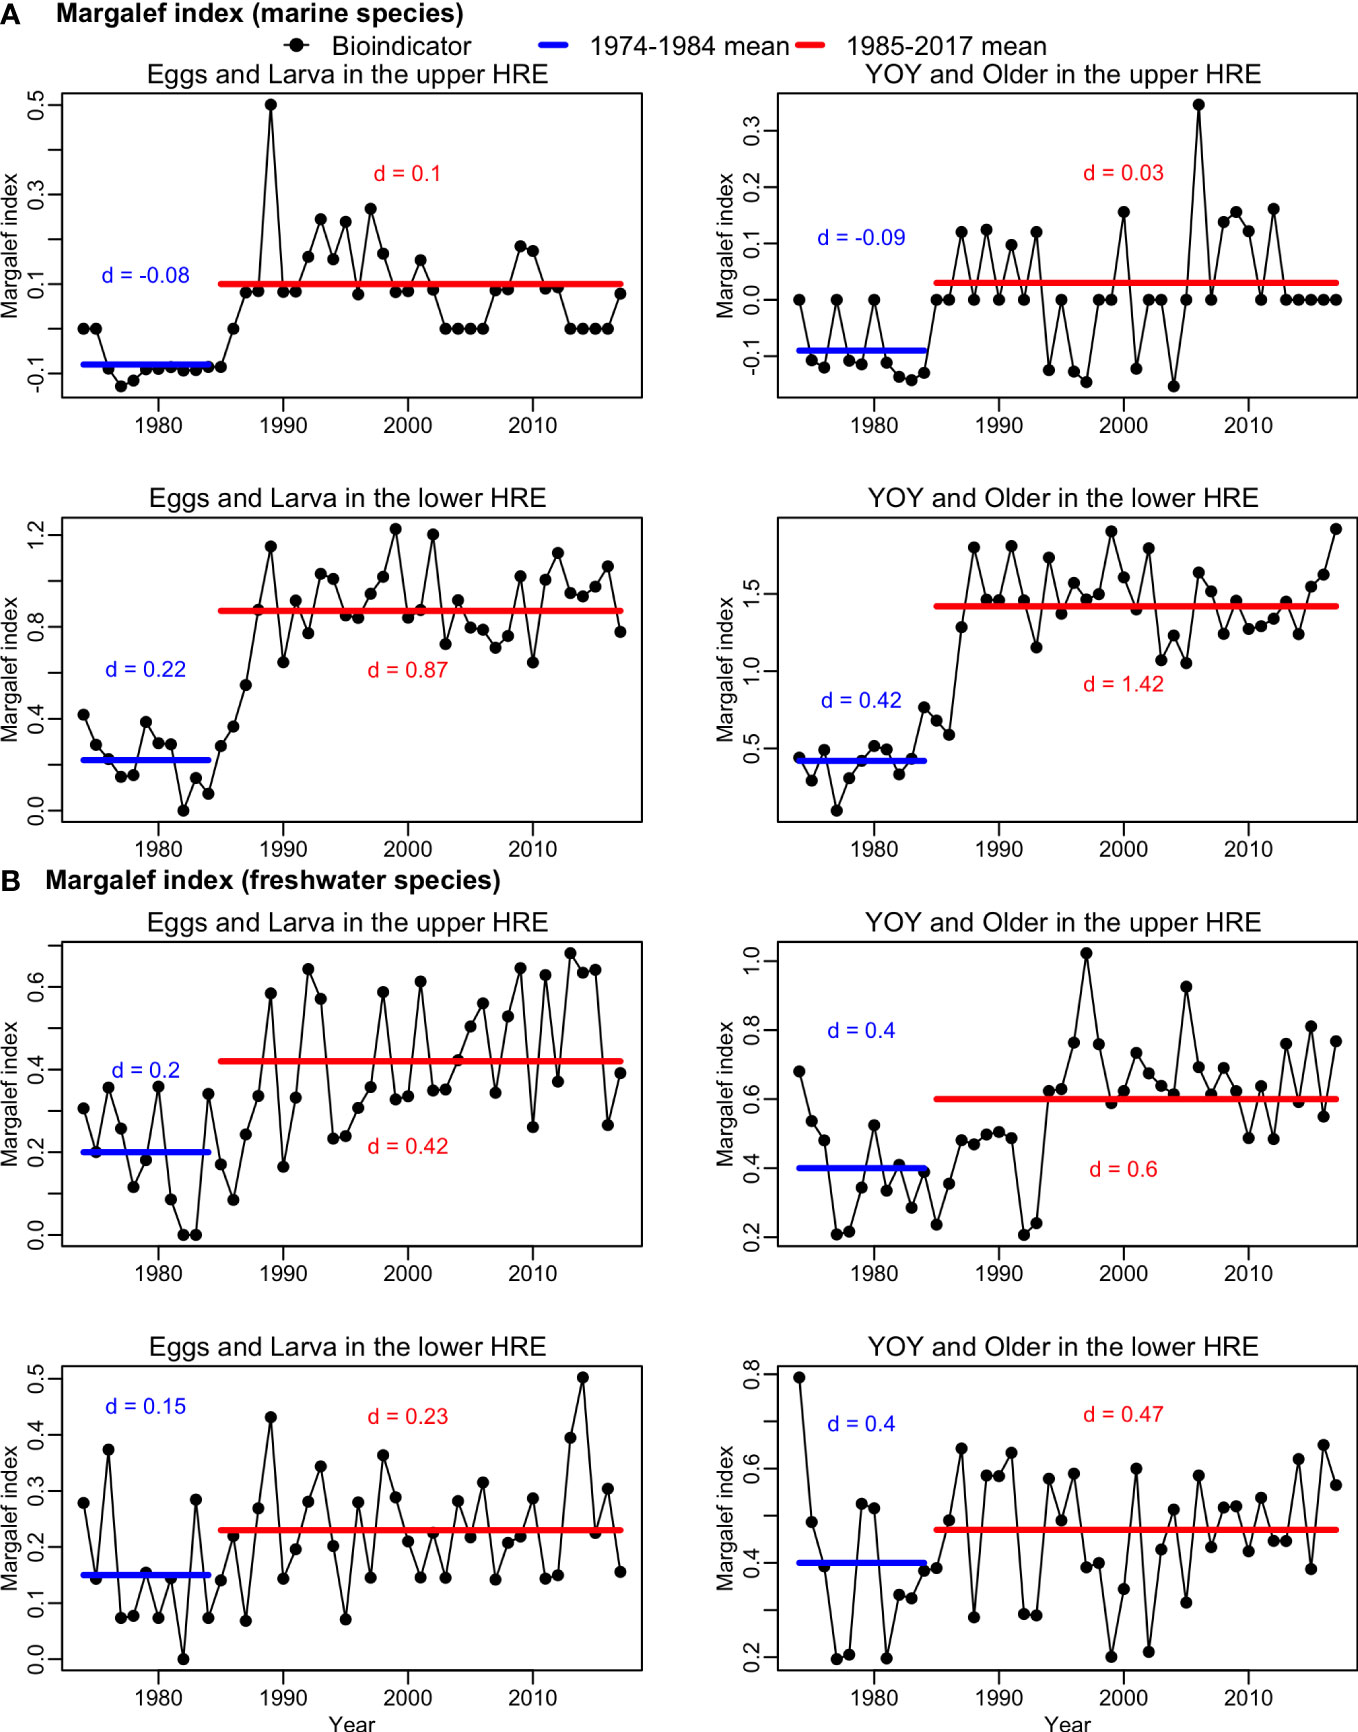
Figure 6 Time series of Margalef index for (A) marine species (dmarine) and (B) freshwater species (dfreshwater) of early (eggs and larva) and older (young-of-year [YOY] and older) life stages during May-July from 1974-2017 in the upper and lower Hudson River Estuary (HRE). The blue horizontal lines indicate the average numbers of species in phase 1 (1974-1984), and the red horizontal lines indicate the average numbers of species in phase 2 (1985-2017).
Sea level was positively associated with the dmarine in the lower HRE, which explained 14.8% and 14.9% of the variation for E&L and Y&O, respectively (Figure 5B). Salinity was also identified as an important factor in explaining the variation of dmarine (Table 2), it explained 8.23% and 10.9% of the variation for E&L and Y&O, respectively (Figure 5B). The models explained 56.7% and 53.5% of the variation for E&L and Y&O groups in the lower HRE, respectively. In the upper HRE, the dmarineof E&L was positively associated with salinity which explained 23.9% of the variation (Figure 5B). The dmarine of Y&O was positively associated with sea level which explained 11.9% of the variation (Figure 5B). The models explained 35.3% and 23.5% of the variation for E&L and Y&O groups in the upper HRE, respectively. The water temperature and dissolved oxygen effects were not significant on the dmarine for both E&L and Y&O in the lower and upper HRE. The distributions of residuals for dmarine models of E&L and Y&O in the lower HRE did not deviate from normal distribution (Shapiro-Wilk normality tests, p>0.05). While the dmarine models of both life stages in the upper HRE deviated from normal distribution (Shapiro-Wilk normality test, p<0.05) possibly due to an outlier in each model (Figure S4).
The dfreshwater in the upper HRE was significantly greater in phase 2 as hypothesized (1-sided t-test, df = 42, p<0.05), which indicating the freshwater species richness was higher in phase 2 for both E&L and Y&O in the upper HRE (Figure 6B). However, the average dfreshwater in the lower HRE was not significantly lower in phase 2 as hypothesized (1-sided t-test, df=42, p>0.05, Figure 6B). The mean of dfreshwater was larger in phase 2 than the mean of dfreshwater in phase 1 for both E&L and Y&O in the lower HRE.
Sea level was identified as an important factor which was positively associated with dfreshwater and explained 27.4% and 24.6% of the variation for E&L and Y&O groups in the upper HRE, respectively (Figure 5B). The effects of all other factors were not significant on dfreshwater (Table 2). The models explained 40.6% and 32.6% of the variation for E&L and Y&O groups in the upper HRE, respectively (Table 2). The dfreshwater for both E&L and Y&O in the lower HRE was not associated with any variables considered in this study, and only 7.7% and 6% of the variation were explained by the models for E&L and Y&O groups, respectively (Table 2). The distributions of residuals for all dfreshwater models did not deviate from normal distribution (Shapiro-Wilk normality tests, p>0.05) (Figure S5).
Species evenness (Simpson index)
The mean of Dall (Simpson index) was significantly higher in phase 2 than the mean of Dall in phase 1 for all groups except Y&O in the lower HRE (Figure 4B), indicating that the species evenness increased in phase 2 for the three groups. The Dall of Y&O in the lower HRE was not associated with any variables considered in this study (Table 2). Sea level was identified an important factor that had significant effect on Dall of both E&L and Y&O in the upper HRE and E&L in the lower HRE (Table 2). Sea level explained 7-13.1% of the variation of Dall for these three groups (Figure 5A). The salinity effect was positively associated with Dall of E&L in the upper HRE, but not in the lower HRE (Table 2). The changes in Dall were not associated with water temperature and dissolved oxygen for all groups (Table 2). The models explained 37.4% and 26.1% of the variation of Dall for E&L and Y&O in the upper HRE, respectively (Table 2). For the lower HRE groups, the model explained 12.6% and 11.7% of the variation for E&L and Y&O in the lower HRE, respectively (Table 2). The distributions of residuals for Dall of all groups did not deviate from normal distribution (Shapiro-Wilk normality tests, p>0.05) except for the Y&O in the upper HRE (Shapiro-Wilk normality test, p<0.05) due to a long tail on the left (Figure S6).
New species
In the lower HRE, a total of 39 species found in the LRS for the E&L group were observed only in phase 2 (“new species” hereafter). Of which, 64.1% of the new species were marine species, 23.1% were freshwater species (Figure 7). For the Y&O group, 48 new species were observed in phase 2, 62.5% of them were marine species, and 29.2% were freshwater species.
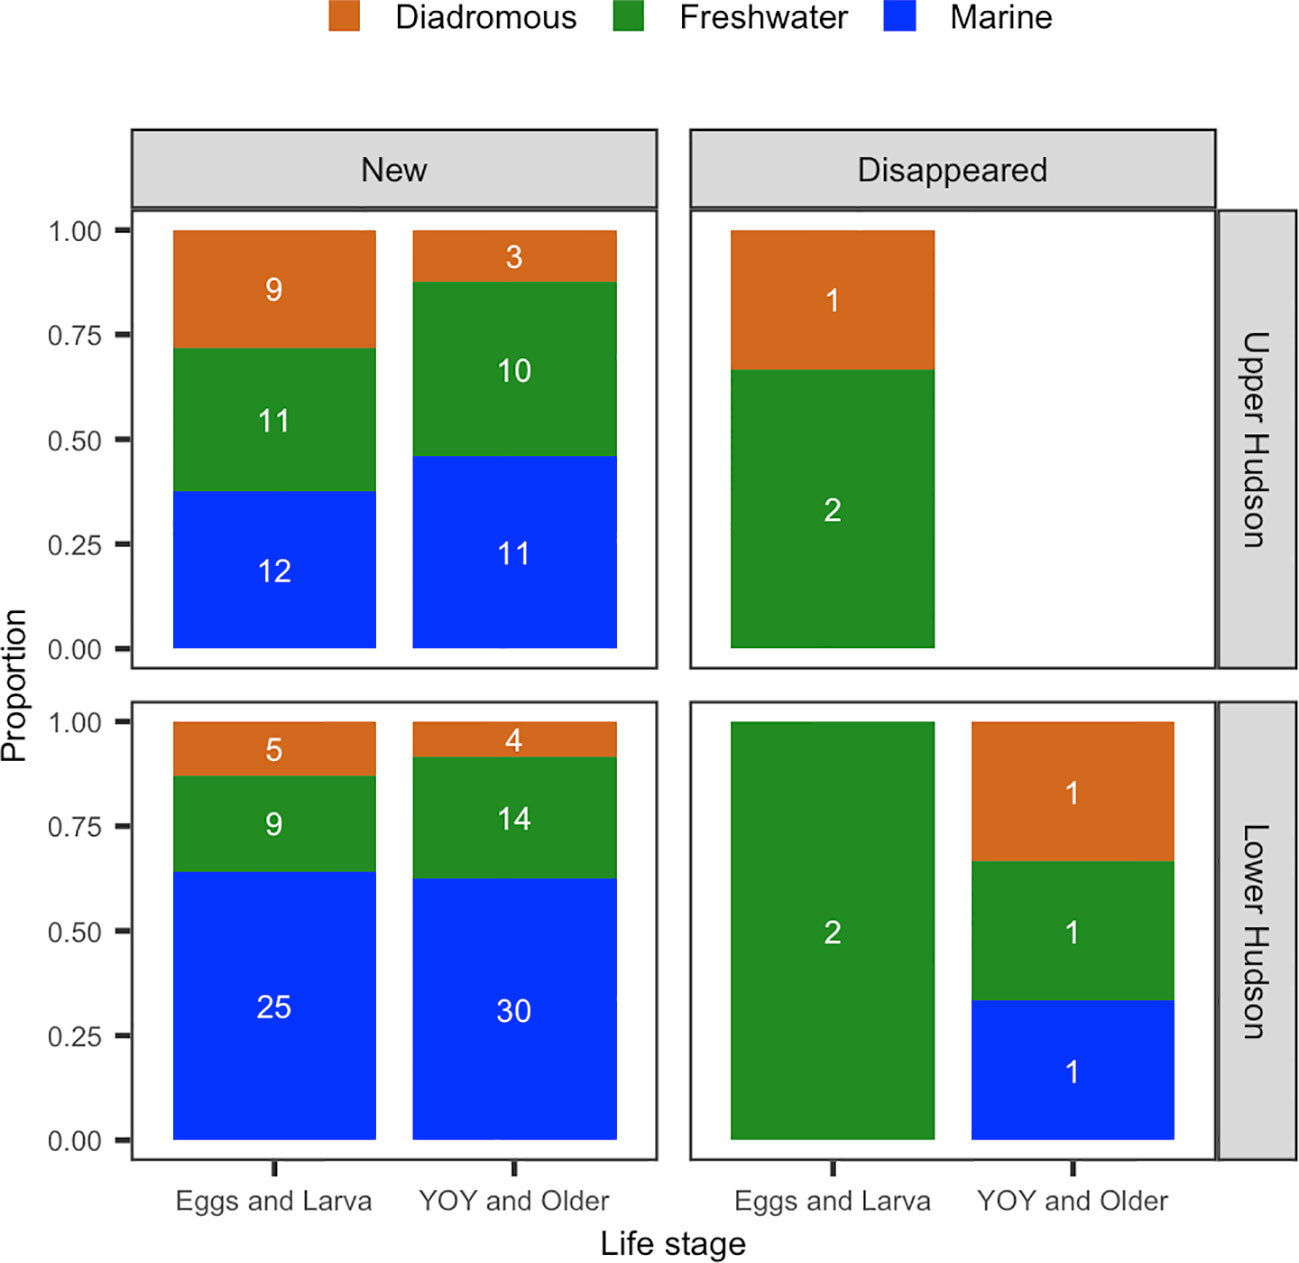
Figure 7 Numbers and proportions of new and disappeared species in phase 2 for E&L (eggs and larva) and Y&O (young-of-year and older) groups during May-July from 1974 to 2017 in the upper and lower Hudson.
In the upper HRE, a total of 32 new species were observed in the LRS for the E&L group. Of these new species, 37.5% were marine species and 34.4% were freshwater species (Figure 7). For the Y&O group, 24 new species were observed in phase 2, 45.8% were marine species and 41.7% were freshwater species.
Disappeared species
In the lower HRE, two species were no longer observed in the LRS in phase 2 (“disappeared species” hereafter) for the E&L group, and both are freshwater species. For the Y&O, three species disappeared in phase 2, one was marine species, and one was freshwater species (Figure 7).
In the upper HRE, three species for the E&L group were no longer observed in the LRS in phase 2, two of them were freshwater species (Figure 7). No disappeared species were observed for the Y&O group in the upper HRE. A list of the new and disappeared species for both life stages were provided in the Table S1.
Dominant species
The species dominance (number of species that compose at least 90% of the survey catch) for both E&L and Y&O in the lower and upper HRE are shown in Figure 8A. The species dominance remained relatively constant over the time series for each group in the lower and upper HRE except the Y&O group in the upper HRE which showed an upward increasing trend over time.
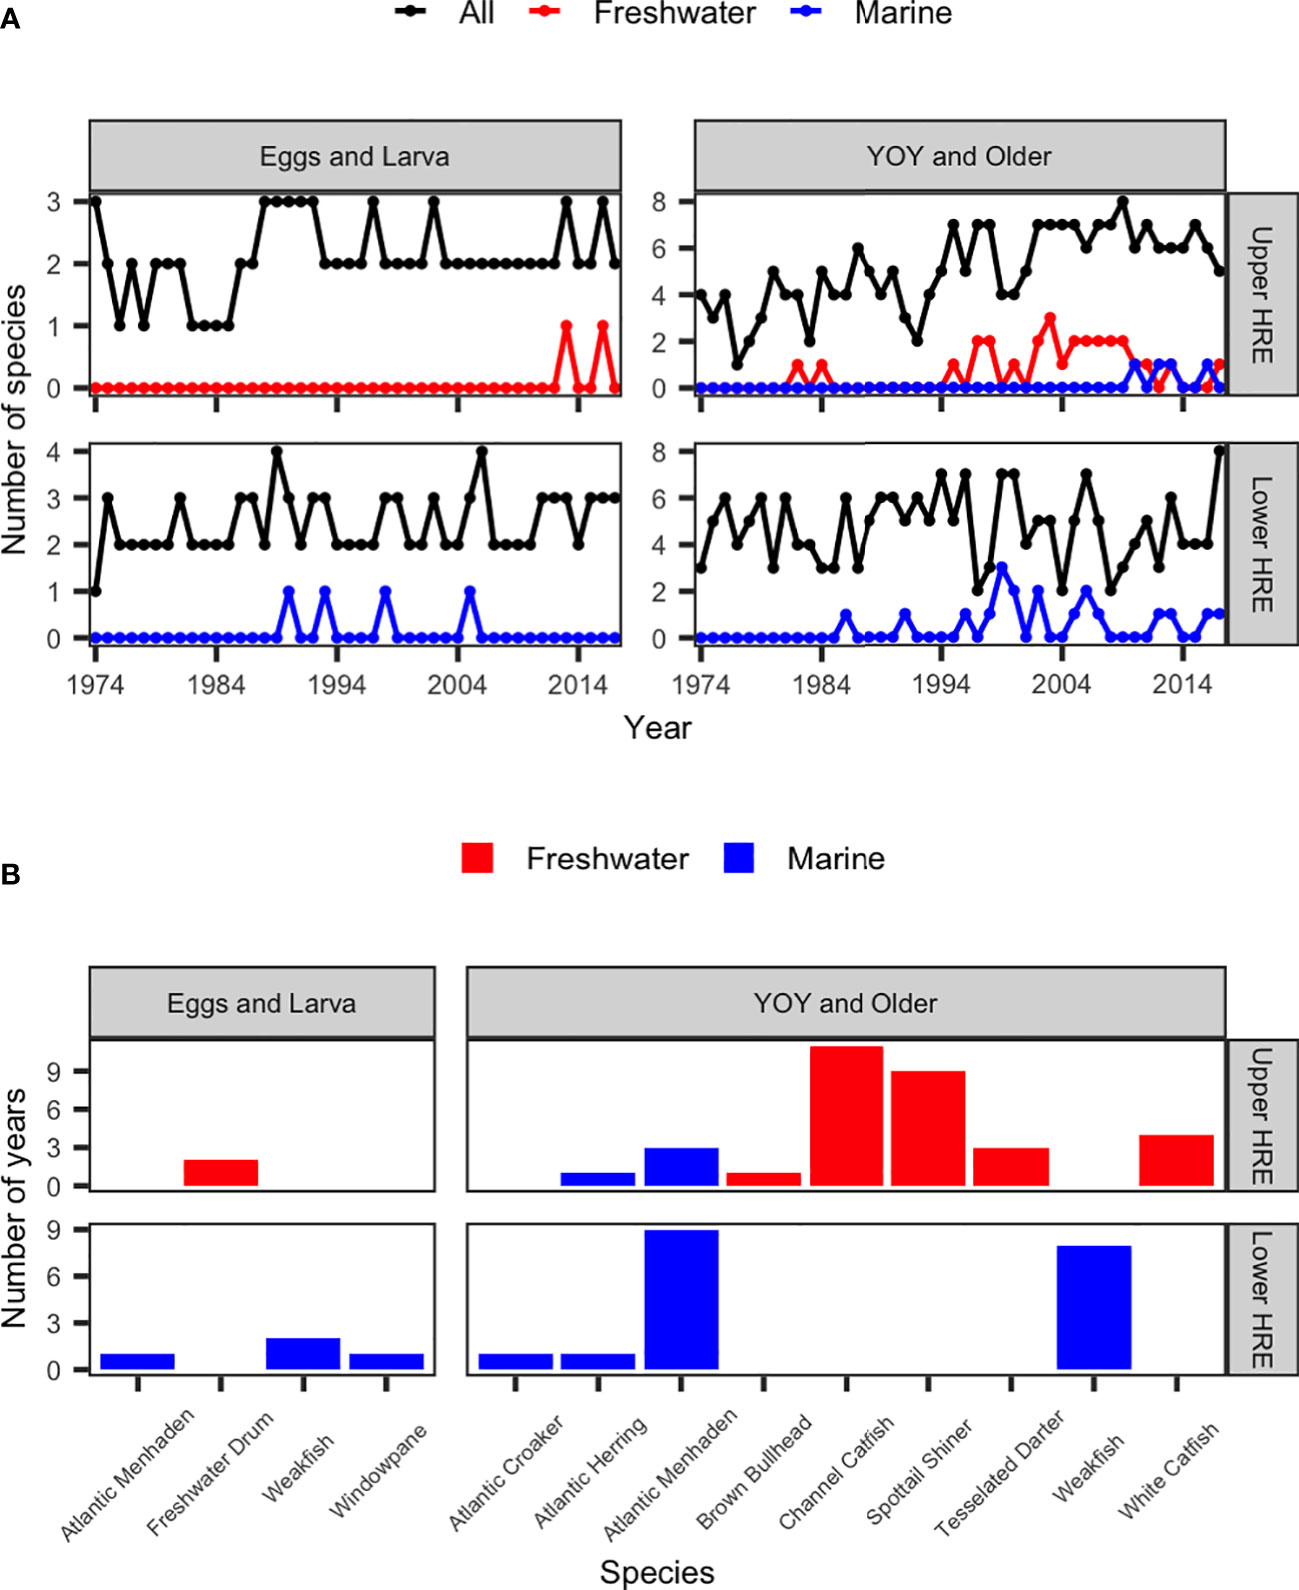
Figure 8 (A) Number of dominant species for early (eggs and larva) and older (young-of-year [YOY] and older) life stages of all, marine, and freshwater species; and (B) number of years observed for dominant marine and freshwater species, during May-July from 1974 to 2017 in the upper and lower Hudson River Estuary (HRE).
Of the dominant species, the numbers of marine and freshwater species observed in each year are shown in Figure 8A. In the lower HRE, no marine or freshwater species of the E&L group was considered dominant species until 1990. One marine species in the E&L group became a dominant species in the lower HRE, which was observed in 4 years. For the Y&O group, no marine or freshwater species was considered dominant species until 1986. One to three marine species became dominant species for the Y&O group in the lower HRE and they were frequently observed in several years after 1986.
In the upper HRE, no marine species was considered dominant species in the E&L group (Figure 8A). One freshwater species became dominant species in 2013 and 2016 (Figure 8A). For the Y&O group, no marine species was considered dominant species until 2010 (Figure 8A). One marine species was frequently observed in the dominant species in the 2010s (Figure 8A). Prior to 1985, only one freshwater species was considered dominant species in 1982 and 1984 (Figure 8A). However, 1-3 freshwater species observed becoming dominant species in most of the years since 1995 (Figure 8A).
Single species abundance
Number of years observed for dominant marine and freshwater species for both groups in the lower and upper HRE was shown in Figure 8B. Dominant marine and freshwater species that were observed in more than 5 years were selected for examining their abundance change over time. Two marine species were identified in the lower HRE: Atlantic Menhaden (Brevoortia tyrannus) and Weakfish (Cynoscion regalis), and two freshwater species were identified in the upper HRE: Channel Catfish (Ictalurus punctatus) and spottail shiner (Notropis hudsonius). All of the four species were in the Y&O group.
Atlantic Menhaden (marine species)
The survey abundance index (individual per m3) of Atlantic Menhaden in the lower and upper HRE was shown in Figure 9A. In the lower HRE, the Atlantic Menhaden was observed almost every year over the time series except 1978. It first became a dominant species in 1986 and was more frequently observed as a dominant species after 1999 with increasing abundance (Figure 9A). Prior to 1985, the Atlantic Menhaden was not observed in the upper HRE except in 1974. Since 1985, it was observed almost every year and the abundance increased in the 2010s (Figure 9A).
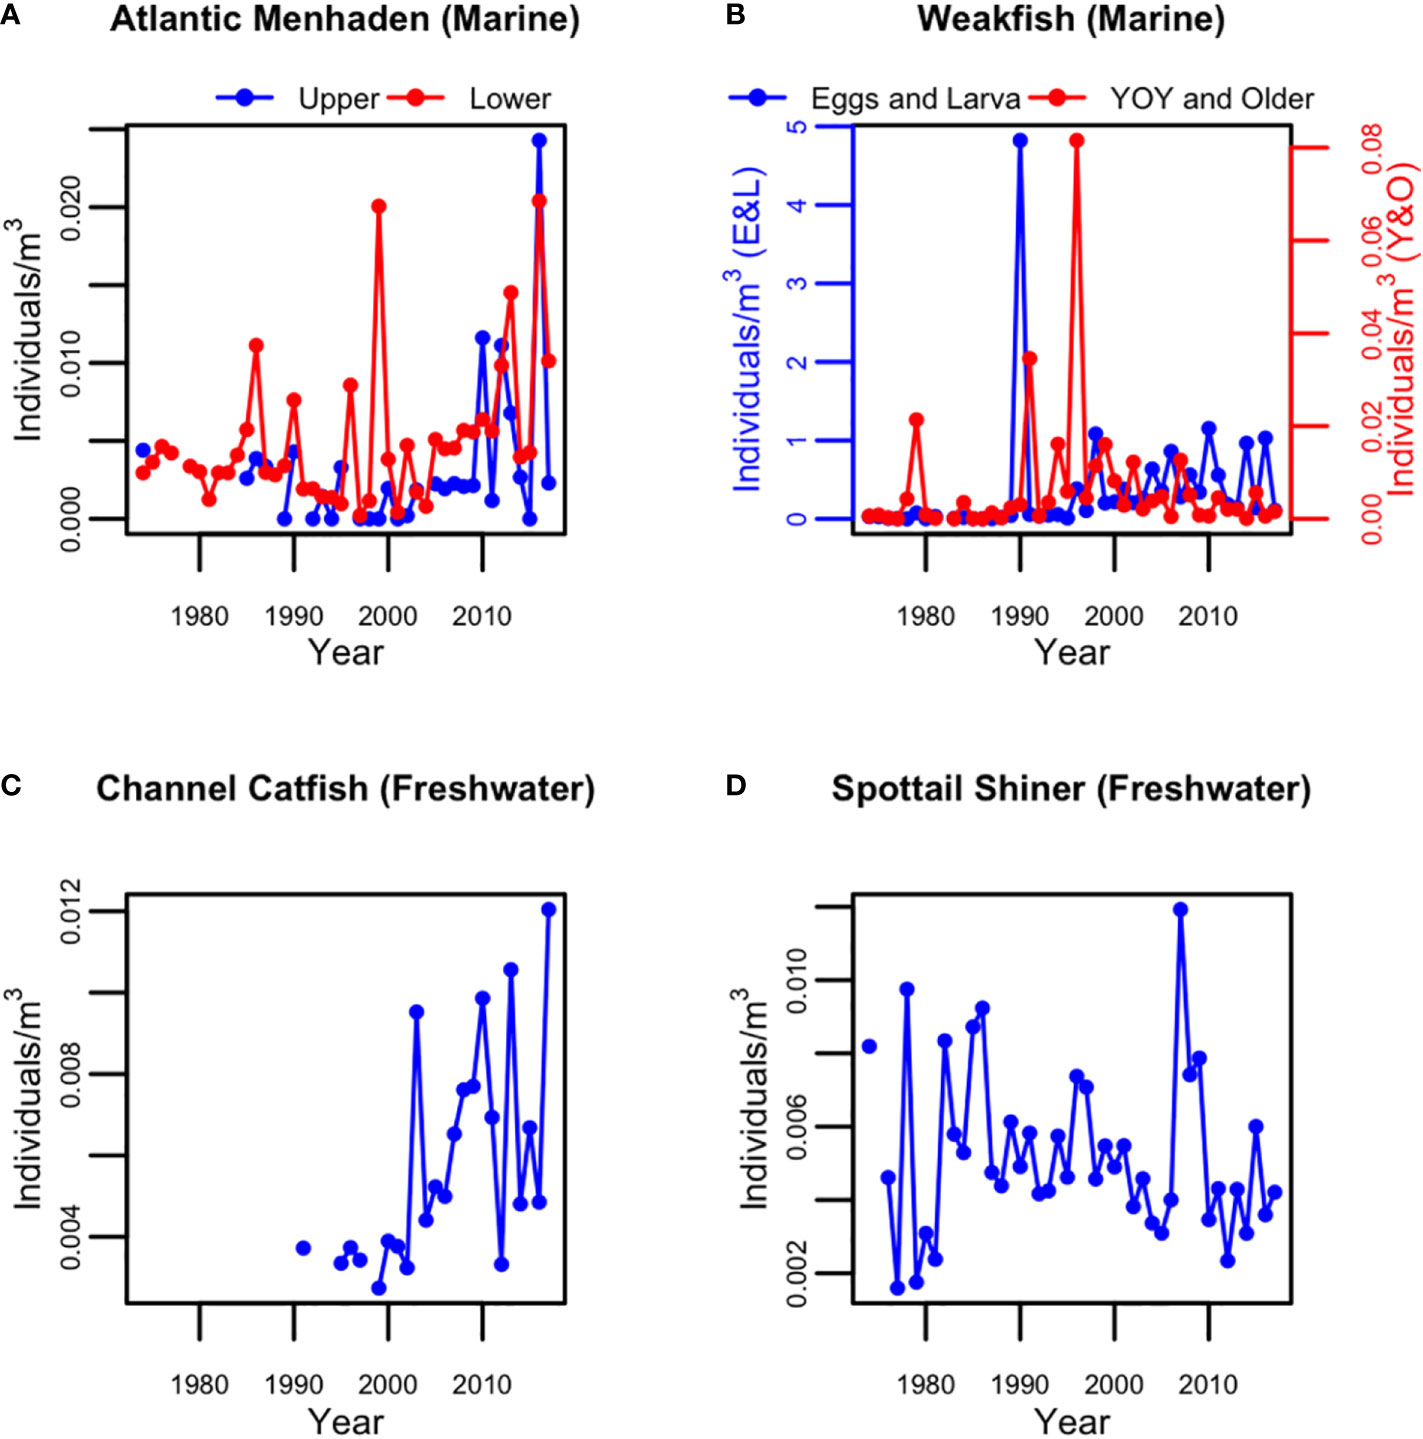
Figure 9 Abundance index for (A) Atlantic menhaden young-of-year (YOY) and older group in the upper and lower Hudson, (B) weakfish of the groups of Eggs and Larva and YOY and Older in the lower Hudson, (C) channel catfish YOY and older group in the upper Hudson, and (D) spottail shiner YOY and older in the upper Hudson during May-July from 197 to 2017.
Weakfish (marine species)
The weakfish were observed in the lower HRE at both life stages in all years except 1982. However, the weakfish eggs and larva were not considered dominant except in 1990 and 1998. For the Y&O group, the weakfish became a dominant species in 8 years in phase 2. For both groups, the abundances were at a low level prior to mid-1990s except a few spikes and increased to a higher level since mid-1990s (Figure 9B).
Channel catfish (freshwater species)
The Channel Catfish Y&O was observed for the first time in the upper HRE in 1991. They started to frequently become a dominant species in the upper HRE in 11 years (Figure 8) with increasing abundance since 2003 (Figure 9C).
Spottail shiner (freshwater species)
The spottail shiner Y&O were observed in the upper HRE for almost all years except 1975. It was a dominant species for the first time in 1982, and became a frequently observed dominant species in 8 years during 1997-2009. However, no clear pattern was noted in their abundance over time (Figure 9D).
Discussion
Species diversity
The Margalef index (d) is one of the simplest measures of biodiversity which accounts for sampling effects and emphasizes the component of species richness (Magurran and McGill, 2011; García-Seoane et al., 2016; Shaha et al., 2022). While the Simpson index (D) measures biodiversity with incorporation of species’ abundance, which gives more weight to the abundant species and is less sensitive to additional rare species and is independent of sample size (Magurran and McGill, 2011; García-Seoane et al., 2016; Tikadar et al., 2021). The increasing d is indicative of increases in species richness, and the increasing D is indicative of increases in species evenness in the fish assemblage (Tikadar et al., 2021). The results of this study showed that dall were significantly higher in phase 2 for all groups and its variation was positively associated with sea level, which indicated that climate-induced factors may play important roles in affecting species richness. Similar results of increased values in phase 2 and significant sea level effects were also found for Dall except for Y&O in the lower HRE, suggesting increased species richness and evenness in phase 2 for most groups.
The Margalef index for marine species (dmarine) was significantly higher in phase 2 for all groups, indicating increased marine species richness. Among the factors considered in this study, sea level and salinity stood out as most important factors in affecting the increase in dmarine. Although most of the increased dmarine may come from marine strayers which were not found in large abundances, some of them have become well established in the estuary such as the Atlantic Menhaden. Atlantic Menhaden use the tidal estuary as a nursery habitat and are considered long-term components of the fish community in the lower HRE (Stainbrook and Limburg, 2001). They were typically found in the southern brackish water of the estuary. However, their juveniles were observed as far north as Albany since the late 1990s (Stainbrook and Limburg, 2001). Furthermore, their abundance increased considerably since 2010 in both upper and lower reaches. Stainbrook and Limburg (2001) assumed that the amount of rainfall was responsible for the locations of Atlantic Menhaden YOY occurrence associated with salinity change. However, their observations did not support their assumption. We suggest that the locations of Atlantic Menhaden YOY occurrence be examined with salt front or salinity data which take multiple factors into account and may better describe or quantify the changes in salinity. Although increased abundance and distribution expansion were observed in the HRE, further analyses should be conducted to examine how much the Hudson River population can contribute to the menhaden populations and fisheries outside the HRE. Weakfish was also a common marine species in the lower HRE (Smith, 1985). Similar to the Atlantic Menhaden, their abundance increased to a higher level since the mid-1990s and became one of the dominant species in the lower HRE in phase 2. Previous studies suggested that the weakfish utilize habitats with higher salinity and temperature during summer in Great Bay, New Jersey (Turnure et al., 2015; Mathews et al., 2022) and the model estimated abundance was highly correlated with environmental and climatic processes, which may explain the increase in abundance for the weakfish in the HRE since the mid-1990s. Our results suggested that some of the marine species have expanded their geographic ranges into the HRE and established themselves in the system, which was likely correlated with increased salinity as well as sea level rise.
Our hypothesis on dfreshwater in the upper HRE was supported by the data – significantly higher dfreshwater were observed in phase 2 for both groups. The increases in the dfreshwater for both E&L and Y&O were associated with sea level. However, similar to what was observed for dmarine in the upper HRE, the variation explained by the model was substantially less for E&L compared to Y&O, implying that older life-stage fishes are able to select favored habitat or avoid unfavored environmental conditions (i.e., spatial avoidance, Venâncio et al., 2020; Venâncio et al., 2021). Of the freshwater species in the upper HRE, channel catfish was identified as one of the dominant species which was frequently observed since the late 1990s. The origin of the channel catfish was unclear. It was hypothesized to be illegally released into the Hudson River drainage (Daniels et al., 2005). An alternative hypothesis is that they moved from the Saint Lawrence River drainage through the Erie Canal into the Hudson River system (Daniels et al., 2005). Either explanation suggests that they are an exotic species to the HRE. The channel catfish have been well established in the upper HRE with increasing abundance in the past 20 years (Jordan et al., 2004; Daniels et al., 2005; this study). The channel catfish are perceived to have high adaptability and flexibility in habitat use, which makes them able to thrive in a wide range of environmental conditions (Hubert, 1999; Jordan et al., 2004). The establishment of channel catfish might have negative impacts on the native white catfish population and other benthic species (Jordan et al., 2004). Spottail shiner was another freshwater species that become frequently observed as a dominant species in phase 2. Unlike channel catfish, the spottail shiner is a long-term component in the upper HRE with no clear increasing or decreasing pattern in their abundance overtime (Daniels et al., 2005; this study). The observations of the spottail shiner became one of the dominant species in the past 25 years might be related to declines in major diadromous species such as American shad (Hurst et al., 2004; ASMFC (Atlantic States Marine Fisheries Commission), 2020) and blueback herring which could be associated with the zebra mussel (Dreissena polymorpha) invasion in 1991 (Strayer et al., 2004) and commercial fishing outside the HRE (Daniels et al., 2005). Daniels et al. (2005) indicated that although no change in spottail shiner abundance was observed, the age structure of the population might have changed.
Although our hypotheses on dmarine in the upper HRE and dfreshwater in the lower HRE were not supported by the t-test results, the observations of dominant marine and freshwater species reflected our hypotheses. In addition, it should be recognized that the statistical significance does not necessarily suggest biological relevance. Even if dmarine in the upper HRE significantly increased in phase 2, only one marine species was a dominant species, and only for four years. Furthermore, the models suggested that the increase in dmarine was associated with salinity for E&L and with sea level for Y&O. Our data implied that even slight changes in salinity might have impacts on species richness and the fish community, which was also observed in other water bodies (Franco et al., 2019). However, it should be noted that a lesser amount of variation was explained by the model for the E&L and Y&O in the upper HRE compared with those in the lower HRE, suggesting that dmarine for both life stages in the upper HRE may be affected by other factors that we did not consider in this study.
For both E&L and Y&O in the lower HRE, the average dfreshwater did not decrease in phase 2 as we expected. Instead, it slightly increased in phase 2 for both life stages in the lower HRE. Nevertheless, no freshwater species became dominant in the lower HRE. Furthermore, the changes in dfreshwater for both E&L and Y&O were not correlated with any variables considered in this study with only a small portion (<8%) of variation explained. It suggested that dfreshwater for both E&L and Y&O was not significantly affected by the changes in environmental factors considered in the models. Fishes were considered to have a higher tolerance to salinity increases compared to other taxa such as zooplankton and amphibians (Venâncio et al., 2021), and fishes that use the estuary are generally resilient given the natural variability and intensity of the estuarine environment. However, little is known about the impacts of increased salinity on survival of early life stages and spawners’ fitness of freshwater species in the lower HRE.
Although the dfreshwater slightly increased in phase 2 for both groups, two freshwater species of the E&L group in each of the lower and upper HRE and one freshwater species of the Y&O group in the lower HRE disappeared from phase 2. It implies that the sea level and the environment with increased salinity might still have a negative impact on freshwater species richness, especially for early life stages which do not have the mobility for spatial avoidance. Studies in other parts of the world suggest that the freshwater species extinction rates are among the highest worldwide (Heino et al., 2009; Pereira et al., 2010; Collen et al., 2014; Cañedo-Argüelles et al., 2019). Observed changing salinity habitat in the HRE may suggest an increasing risk freshwater fish species face in the HRE. Venâncio et al. (2019); Venâncio et al. (2020) indicated that slight increase in salinity may be sufficient to induce structural changes in freshwater communities. Observed changing salinity habitat in the HRE may suggest an increasing risk freshwater fish species face in the HRE.
Possible alternative hypotheses
The Margalef index incorporates sampling effects in the measure of diversity, it is reported to be sensitive to sample sizes and could deviate from the actual diversity value (Magurran, 2004; Tikadar et al., 2021). Nevertheless, the Simpson index which is robust and less sensitive to sample sizes (Magurran, 2004), also suggested very similar results as the Margalef index, further supporting the pattern of increasing fish species diversity in the HRE. The Margalef and Simpson indices (dall and Dall) suggest that the species richness and evenness increased over the two phases of the time series for both life stages (E&L and Y&O) in the upper HRE, and our observations of the number of dominant species showed similar results (Figures 4 and 8A). This suggests that the fish biodiversity with different aspects of species richness, evenness, and dominance increased over time in the upper HRE, especially for the Y&O group. Several reasons might contribute to the increased species diversity of the Y&O group in the upper HRE: (i) establishments of marine and freshwater species due to changes in the salinity gradient as the results of this study suggested; (ii) declined diadromous species populations (Hurst et al., 2004). The major components of dominant species in the HRE are diadromous species. Therefore, even if both marine and diadromous species populations may not be locally regulated, declined diadromous species populations might increase the relative abundances of marine and/or freshwater species, which made them become dominant species and increase the overall fish biodiversity; (iii) improved water quality (Hurst et al., 2004; Levinton and Waldman, 2006); (iv) rebounded populations that were once in decline (e.g. striped bass, Daniels et al., 2005), and (v) environmental condition and community structure altered by invasive species (e.g. zebra mussel invasion in 1991; Strayer et al., 2004); (vi) changes in land use and submerged aquatic vegetation: Strayer et al. (2012) suggested that exposure to human activity and shoreline complexity may have effects on species composition and diversity – engineered shore zones tended to have fewer fishes and native plant species. Findlay et al. (2014) also indicated that engineered shores might negatively affect submerged aquatic vegetation which is not only a significant resource of dissolved oxygen but also provide important habitat and food through primary productivity for invertebrate and fish species in the HRE (Hamberg et al., 2017). Accordingly, the changes in submerged aquatic vegetation may have impacts on species diversity; (vii) changes in nutrient loading: Howarth et al. (2000) indicated that the rates of primary production observed in the 1990s were substantially higher than those measured in the 1970s. Even though the relationship between nutrient loading and biodiversity has not been examined yet in the HRE, the susceptibility to eutrophication might be an alternative hypothesis of the changes in biodiversity.
The results of this study may provide an additional explanation for changes in biodiversity observed in the previous studies. Daniels et al. (2005) collected data from historical documents and various surveys conducted since the 1970s, reporting a 1.5-2 fold increase in the number of species observed in the Hudson River drainage since the 1930s due to increased number of non-native species as well as increased sampling and reporting effort. In addition, Hurst et al. (2004) observed a pronounced increased catch of Atlantic silversides (Menidia menidia) and declines in other estuarine species as well as declining CPUE (catch per unit effort) and diversity in freshwater species during a 21-year period (1980-2000) in the lower HRE (rkm 36-64), speculating on a long-term increase in estuarine salinity. The results of this study suggest that the overall increased number of species observed in Daniels et al. (2005), changes in abundance and CPUE for Atlantic silversides and other estuarine species, and decreased freshwater diversity observed in Hurst et al. (2004) may be related to habitat change (e.g. changes in salinity). Further investigation should be examined for these hypotheses.
In this study, changes in marine and freshwater species richness were hypothesized associated with sea level rise, especially in the lower HRE. In addition to sea level rise and changes in salinity, as we hypothesized in this study, several other factors could also contribute to the changes in species richness such as declines in diadromous species populations, presence of invasive species, changes in other water quality, river flow, land use, or nutrient loading, which could provide alternative hypotheses for the changes in biodiversity we observed in this study. These alternative hypotheses should be investigated in the future. Furthermore, only nighttime sampling data collected during summer were used in this study due to significant changes in the sampling in the LRS over the 44 years of time series in order to make the annual data consistent and comparable over time and space, which resulted in reduced data availability. Further analyses using data collected from other Hudson River Biological Monitoring Program surveys (e.g., Beach Seiner survey and Fall Juvenile Survey) in different seasons as well as water quality data from different resources should be considered in the future analyses.
In spite of the fact that increasing biodiversity is generally considered a good sign of ecological health, the new species that were observed in the survey or in the HRE might have unidentified functional consequences to the system (Pawluk et al., 2021). The results of this study suggested that most of them were likely seasonal marine visitors and did not establish their populations. Even though the impacts of the occurrence and establishment of marine species as well as the displacement of freshwater species on the community structure and species diversity seem subtle at this stage, in the long run it may put sensitive species at risk and more profound effects on the fish community in the HRE might be expected (Franco et al., 2019). Invasive species that have been becoming more abundant or have established breeding populations in the HRE system should be further investigated and monitored.
Impacts of salinity on physiology and spawning grounds
The sea level has been rising with a linear increasing trend in the time series (Figure 3A). However, the isohalines showed different patterns (2-phase pattern) over the time series. Several reasons could influence the variation of the locations of isohalines and salt front and saline gradient in the HRE, including tidal flow, freshwater discharge, and rainfall (Everly and Boreman, 1999; Daniels et al., 2005). It is still unclear what caused the 2-phase pattern in salinity observed in this study. Chant et al. (2018) indicated that channel dredging and deepening could result in changes in estuarine exchange flow and horizontal salinity gradient, as well as tidal current amplitude. Nevertheless, the dredging projects for PCBs cleanup and the New York Harbor Deepening project to deepen the harbor channels to 15 m for the larger Neo-Panamax ships did not occur until 2009. The dredging and deepening effects were therefore not able to explain the salinity change observed in this study. More study is needed to better understand the dynamics of salinity habitat and the factors that are important to regulate the dynamics of fish populations.
Seawater intrusion into estuaries is a natural phenomenon, which transports nutrient inputs, sediment delivery as well as contaminants into the estuarine system with tides and coastal currents (Sá et al., 2022). Seawater intrusion in conjunction with freshwater flow determines the salinity distribution and the stability of the saline environment of an estuarine system (Cao et al., 2021). With climate-induced sea level rise, seawater intrusion might not only impact surface and groundwater salinization, but can also be a cause of osmotic stress on plankton, fishes, and other aquatic organisms (Sá et al., 2022). Consequently, it could result in distribution change and/or interaction between species and communities (Venâncio et al., 2019; Sá et al., 2022). Venâncio et al. (2019) indicated that the development of some freshwater zooplankton embryos stopped at an increased salinity level before hatching, which could have an impact on the lower trophic level community. In comparison, many fishes are able to tolerate higher salinity increases (Venâncio et al., 2021). In this study, the marine and freshwater species richness for both E&L and Y&O life stages increased in phase 2 with higher salinity environment. The Y&O group is assumed to have sufficient mobility to select for preferred habitats or escape from unfavored environment. However, the location of occurrence of the E&L group was most likely determined by their spawners. Freshwater discharge has been considered an important factor in eggs and larval mortality for many fish species (Hurst et al., 2004), but little is known of the salinity impacts on eggs and larval survival and the fitness cost associated with the tolerance for the spawners for many marine and freshwater species. An improved understanding of this aspect is critically important for fish early life history mortality, which determines fish recruitment dynamics.
The increased salinity may impact spawning grounds and reproductive capacities and subsequently fish year classes and fisheries (Dasgupta et al., 2017; Shaha et al., 2022), especially for species that require specific environmental conditions for spawning activities. For example, the distribution of adult bay anchovy (Anchoa mitchilli) is positively associated with salinity (Schmidt, 1992), and they tend to spawn where salinity exceeds 10 psu (Schultz et al., 2005). The changes in salinity could alter their distribution and spawning grounds as well as larval survival and consequent recruitment. Conversely, Atlantic sturgeon, an endangered species in the HRE, spawn upstream from the tidal salt front as their spawning grounds (Van Eenennaam et al., 1996; Breece et al., 2021) and their early life stages are intolerant to saline conditions (Kazyak et al., 2020). Van Eenennaam et al. (1996) indicated that the eggs and larval dispersal strategy of Atlantic sturgeon may require the environmental conditions remain freshwater throughout the spawning season. This highlights the importance of monitoring the changing saline conditions and its impacts on the spawning grounds and fitness of the spawners in the HRE.
Conclusion
This study highlights the importance of long-term monitoring programs such as the LRS that allows us to evaluate and quantify changes in fish population and community in an ecosystem such as the HRE and identify possible environmental and anthropogenic drivers. The long time series data collected from the LRS were unique and valuable, providing an excellent opportunity to examine fish abundance, spatiotemporal distribution, as well as their relation to the environment. In spite of the changes and limitations in the sampling design and data collection, the data collected from the survey are sufficient to provide inferences on species richness, evenness, and dominance of the fish communities in the HRE. This study suggests that climate-induced salinity changes have occurred in the HRE over the last 40 years. These salinity changes have the potential to impact fish community structure in a variety of ways. We have shown that the diversity of early life stage fish assemblages in the HRE have changed during the same time period with an increasing occurrence, expansion and establishment of marine species as well as potential displacement of freshwater species. This study highlights a need for long-term monitoring and investigation for improved understanding of impacts of climate-induced environmental change on the biota in the HRE in order to enhance its management, conservation, and restoration plans.
Data availability statement
The original contributions presented in the study are included in the article/Supplementary Material. Further inquiries can be directed to the corresponding author.
Author contributions
H-YC led the project, including developing the design of this study, analyzing the data, writing most of the original manuscript, and generating majority of the tables and figures. KM participated in developing the research ideas and methodology, interpretation of the results, and assisting in editing the manuscript. YC supported the development of the study design, reviewed and suggested the data analysis and data interpretation, edited the manuscript, and secured the funding of the work. All authors contributed to the article and approved the submitted version.
Funding
This work is supported by a Stony Brook University research grant (SBU RF #245720).
Acknowledgments
We would like to thank Gregg Kenney, Richard Pendleton, and John Maniscalco of NYSDEC for the discussion and comments. The HRBMP data are gifted to the Stony Brook University by the Entergy Corporation. We thank all the people who have contributed to the HRBMP over the years.
Conflict of interest
The authors declare that the research was conducted in the absence of any commercial or financial relationships that could be construed as a potential conflict of interest.
Publisher’s note
All claims expressed in this article are solely those of the authors and do not necessarily represent those of their affiliated organizations, or those of the publisher, the editors and the reviewers. Any product that may be evaluated in this article, or claim that may be made by its manufacturer, is not guaranteed or endorsed by the publisher.
Supplementary material
The Supplementary Material for this article can be found online at: https://www.frontiersin.org/articles/10.3389/fmars.2022.1077997/full#supplementary-material
References
ASA Analysis & Communication (ASAAC) (2013). 2012 year class report for the Hudson river estuary monitoring program (Washingtonville, NY, USA: Prepared for Entergy Nuclear Operations, Inc).
ASA Analysis & Communication (ASAAC) (2016). 2016 year class report for the Hudson river estuary monitoring program (Marlboro, NY, USA: Prepared for Entergy Nuclear Operations, Inc).
ASMFC (Atlantic States Marine Fisheries Commission) (2020). American shad benchmark stock assessment and peer review report (Arlington, VA: ASMFC), 1208.
Aziz M. S. B., Hasan N. A., Mondol M. M. R., Alam M. M., Haque M. M. (2021). Decline in fish species diversity due to climatic and anthropogenic factors in hakaluki haor, an ecologically critical wetland in northeast Bangladesh. Heliyon 7 (1), e05861. doi: 10.1016/j.heliyon.2020.e05861
Breece M. W., Higgs A. L., Fox D. A. (2021). Spawning intervals, timing, and riverine use of adult Atlantic sturgeon in the Hudson river. Trans. Am. Fish. Soc 150, 528–537. doi: 10.1002/tafs.10304
Cañedo-Argüelles M., Kefford B., Schäfer R. (2019). Salt in freshwaters: causes, effects and prospects - introduction to the theme issue. Phil. Trans. R. Soc B 374, 20180002. doi: 10.1098/rstb.2018.0002
Cao T., Han D., Song X. (2021). Past, present, and future of global seawater intrusion research: A bibliometric analysis. J. Hydrol. 603 (Part A), 126844. doi: 10.1016/j.jhydrol.2021.126844
Chang H.-Y., Klose R., Chen Y. (2020). Possible climate-induced environmental impacts on parasite-infection rates of northern shrimp Pandalus borealis eggs in the gulf of Maine. Dis. Aquat Org. 140, 109–118. doi: 10.3354/dao03495
Chant R. J., Sommerfeld C. K., Talke S. A. (2018). Impact of channel deepening on tidal and gravitational circulation in a highly engineered estuarine basin. Estuaries Coast. 41 (6), 1587–1600. doi: 10.1007/s12237-018-0379-6
Collen B., Whitton F., Dyer E. E., Baillie J. E. M., Cumberlidge N., Darwall W. R. T., et al. (2014). Global patterns of freshwater species diversity, threat and endemism. Glob. Ecol. Biogeogr. 23, 40–51. doi: 10.1111/geb.12096
Daniels R. A., Limburg K. E., Schmidt R. E., Strayer D. L., Chambers R. C. (2005). “Changes in fish assemblages in the tidal Hudson River, New York”. In: Historical changes in large river fish assemblages of the Americas. Eds. Rinne J. N., Hughes R. M., Calamusso B. (Bethesda, Maryland: American Fisheries Society), 471–504.
Dasgupta S., Huq M., Mustafa M. G., Sobhan M. I., Wheeler D. (2017). The impact of aquatic salinization on fish habitats and poor communities in a changing climate: Evidence from southwest coastal Bangladesh. Ecol. Econ. 139, 128–139. doi: 10.1016/j.ecolecon.2017.04.009
de Vries M. P., Weiss L. A. (2001). Salt-front movement in the Hudson river estuary, new York–simulations by one-dimensional flow and solute-transport models. U.S. Geol. Surv. Water Resour. Invest. Rep. 99 (4024), 69.
Everly A. W., Boreman J. (1999). Habitat use and requirements of important fish species inhabiting the Hudson river estuary: availability of information. Woods Hole, MA, USA: NOAA Technical Memorandum NMFS-NE-121.
Findlay S. E. G., Strayer D. L., Smith S. D., Curri N. (2014). Magnitude and patterns of change in submerged aquatic vegetation of the tidal freshwater Hudson river. Estuaries Coast. 37, 1233–1242. doi: 10.1007/s12237-013-9758-1
Franco T. P., Neves L. M., Araújo F. G. (2019). Better with more or less salt? the association of fish assemblages in coastal lagoons with different salinity ranges. Hydrobiologia 828, 83–100. doi: 10.1007/s10750-018-3804-8
Gain A. K., Uddin M. N., Sana P. (2008). Impact of river salinity on fish diversity in the south-west coastal region of Bangladesh. Int. J. Ecol. Environ. Sci. 34 (1), 49–54.
García-Seoane E., Dolbeth M., Silva C. L., Abreu A., Rebelo J. E. (2016). Changes in the fish assemblages of a coastal lagoon subjected to gradual salinity increases. Mar. Environ. Res. 122, 178–187. doi: 10.1016/j.marenvres.2016.10.005
Hamberg J., Findlay S. E. G., Limburg K. E., Diemont S. A. W. (2017). Post-storm sediment burial and herbivory of vallisneria americana in the Hudson river estuary: mechanisms of loss and implications for restoration. Restor. Ecol. 25 (4), 629–639. doi: 10.1111/rec.12477
Heino J., Virkkala R., Toivonen H. (2009). Climate change and freshwater biodiversity: detected patterns, future trends and adaptations in northern regions. Biol. Rev. 84, 39–54. doi: 10.1111/j.1469-185X.2008.00060.x
Howarth R. W., Swaney D. P., Butler T. J., Marino R. (2000). Climatic control on eutrophication of the Hudson river estuary. Ecosystems 3, 210–215. doi: 10.1007/s100210000020
Hubert W. A. (1999). “Biology and management of channel catfish,” In Irwin E. R., Hubert W. A., Rabeni C. F., Schramm H. L. Jr., Coon T. editors. Catfish 2000: proceedings of the international ictalurid symposium, Bethesda, Maryland. Vol. 24. 3–22.
Hurst T. P., McKown K. A., Conover D. O. (2004). Interannual and long-term variation in the nearshore fish community of the mesohaline Hudson river estuary. Estuaries 27, 659–669. doi: 10.1007/BF02907651
Jordan S., Neumann R., Schultz E. (2004). Distribution, habitat use, growth, and condition of a native and an introduced catfish species in the Hudson river estuary J. Freshw. Ecol. 19, 59–67. doi: 10.1080/02705060.2004.9664513
Kazyak D. C., Flowers A. M., Hostetter N. J., Madsen J. A., Breece M. W., Higgs A., et al. (2020). Integrating side-scan sonar and acoustic telemetry to estimate the annual spawning run size of Atlantic sturgeon in the Hudson river. Can. J. Fish. Aquat. Sci. 77, 1038–1048. doi: 10.1139/cjfas-2019-0398
Kunda M., Ray D., Pandit D., Harun-Al-Rashid ,. A. (2022). Establishment of a fish sanctuary for conserving indigenous fishes in the largest freshwater swamp forest of Bangladesh: A community-based management approach. Heliyon 8, e09498. doi: 10.1016/j.heliyon.2022.e09498
Levinton J. S., Waldman J. R. (2006). The Hudson river estuary (Cambridge: Cambridge University Press).
Magurran A. E. (2004). Measuring biological diversity (Oxford: Blackwell Publishing; Wiley-Blackwell).
Magurran A. E., McGill B. J. (2011). Biological diversity: Frontiers in measurement and assessment (Oxford, UK: Oxford University Press).
Margalef R. (1968). Perspectives in ecological theory (Chicago: Chicago II. University of Chicago Press), 111p.
Mathews J. A., Hale E. A., Clark J. A., Park I. A., Greco M. J., Petrone C. J., et al. (2022). Exploring trends in abundance of Atlantic croaker (Micropogonias undulatus), black drum (Pogonias cromis), spot (Leiostomus xanthurus) and weakfish (Cynoscion regalis) in relation to large scale climatic signals in a mid-Atlantic estuary. Trans. Am. Fish. Soc 151, 150–171. doi: 10.1002/tafs.10332
Muggeo V. M. R. (2003). Estimating regression models with unknown breakpoints. Stat. Med. 22, 3055–3071. doi: 10.1002/sim.1545
Muggeo V. M. R. (2017). Interval estimation for the breakpoint in segmented regression: a smoothed score-based approach. Aust. N.Z. J. Stat. 59, 311–322. doi: 10.1111/anzs.12200
Nack C. C., Swaney D. P., Limburg K. E. (2019). Historical and projected changes in spawning phenologies of American shad and striped bass in the Hudson river estuary. Mar. Coast. Fish. 11 (3), 271–284. doi: 10.1002/mcf2.10076
Pawluk M., Fujiwara M., Martinez-Andrade F. (2021). Climate effects on fish diversity in the subtropical bays of Texas. Estuar. Coast. Shelf Sci. 249, 107121. doi: 10.1016/j.ecss.2020.107121
Pereira H. M., Leadley P. W., Proença V., Alkemade R., Scharlemann J. P. W., Fernandez-Manjarrés J. F., et al. (2010). Scenarios for global biodiversity in the 21st century. Science 330, 1496–1501. doi: 10.1126/science.1196624
R Core Team (2020). R: A language and environment for statistical computing (Vienna, Austria: R Foundation for Statistical Computing). Available at: https://www.R-project.org/.
Sá A. K. D. S., Feitosa F. A. N., Cutrim M. V. J., Flores-Montes M. J., Costa D. S., Cavalcanti L. F. (2022). Phytoplankton community dynamics in response to seawater intrusion in a tropical macrotidal river-estuary continuum. Hydrobiologia. doi: 10.1007/s10750-022-04851-7
Schmidt R. E. (1992). “Temporal and spatial distribution of bay anchovy eggs through adults in the Hudson river estuary. estuarine research in the 1980s,” in The Hudson River Environmental Society Seventh Symposium on Hudson River Ecology (Albany: State University of New York Press), 228–241.
Schultz E. T., Young J., Martin J. M., Lwiza K. M. (2005). Tracking cohorts: analysis of migration in the early life stages of an estuarine fish. Estuaries 28 (3), 394–405. doi: 10.1007/BF02693922
Shaha D. C., Ahmed S., Hasan J., Kundu S. R., Haque F., Rahman M. J., et al. (2022). Fish diversity in relation to salinity gradient in the meghna river estuary, Bangladesh. Conservation 2 (3), 414–434. doi: 10.3390/conservation2030028
Smith C. L. (1985). The inland fishes of new York state (Albany, NY: The New York State Department of Environmental Conservation).
Stainbrook K. M., Limburg K. E. (2001). “Preliminary studies of larval and juvenile gizzrd shad and Atlantic menhaden in the Hudson river. section V: 1-28,” in Final reports of the tibor t. polgar fellowship program 2000. Eds. Waldman I. J. R., Nieder W. C. (New York, USA: Hudson River Foundation).
Strayer D. L., Cole J. J., Findlay S. E. G., Fischer D. T., Gephart J. A., Malcom H. M., et al. (2014). Decadal-scale change in a large-river ecosystem. Bioscience 64, 496–510. doi: 10.1093/biosci/biu061
Strayer D. L., Findlay S. E., Miller D., Malcom H. M., Fischer D. T., Coote T. (2012). Biodiversity in Hudson river shore zones: Influence of shoreline type and physical structure. Aquat. Sci. 74, 597–610. doi: 10.1007/s00027-012-0252-9
Strayer D. L., Hattala K., Kahnle A. (2004). Effects of an invasive bivalve (Dreissena polymorpha) on fish populations in the Hudson river estuary. Can. J. Fish. Aquat. Sci. 61, 924–941. doi: 10.1139/f04-043
Tikadar K. K., Kunda M., Mazumder S. K. (2021). Diversity of fishery resources and catch efficiency of fishing gears in gorai river, Bangladesh. Heliyon 7, e08478. doi: 10.1016/j.heliyon.2021.e08478
Tu H.-M., Fan M.-W., Ko J. C.-J. (2020). Different habitat types affect bird richness and evenness. Sci. Rep. 10 (1), 1–10. doi: 10.1038/s41598-020-58202-4
Turnure J. T., Grothues T. M., Able K. W. (2015). Seasonal residency of adult weakfish (Cynoscion regalis) in a small temperate estuary based on acoustic telemetry: a local perspective of a coast wide phenomenon. Environ. Biol. Fishes 98, 1207–1221. doi: 10.1007/s10641-014-0353-5
Van Eenennaam J. P., Watson J. G., Doroshov S. I., Moore D. S., Moberg G. P., Linares J. (1996). Reproductive conditions of the Atlantic sturgeon (Acipenser oxyrinchus) in the Hudson river. Estuaries 19, 769–777. doi: 10.2307/1352296
Venâncio C., Castro B. B., Ribeiro R., Antunes S. C., Abrantes N., Soares A. M. V. M., et al. (2019). Sensitivity of freshwater species under single and multigenerational exposure to seawater intrusion. Phil. Trans. R. Soc B 374, 20180252. doi: 10.1098/rstb.2018.0252
Venâncio C., Ribeiro R., Lopes I. (2020). Active emigration from climate change-caused seawater into freshwater habitats. Environ. pollut. 258, 113805. doi: 10.1016/j.envpol.2019.113805
Venâncio C., Ribeiro R., Lopes I. (2021). Seawater intrusion: An appraisal of taxa at most risk and safe salinity levels. Biol. Rev. 97, 361–382. doi: 10.1111/brv.12803
Keywords: biodiversity, species richness, Hudson River Estuary (USA), fish communities indicators, climate change, ichthyoplankton, monitoring
Citation: Chang H-Y, McKown K and Chen Y (2023) A long-term ichthyoplankton monitoring program suggests climate-induced environmental variabilities changed fish communities in the Hudson River estuary. Front. Mar. Sci. 9:1077997. doi: 10.3389/fmars.2022.1077997
Received: 23 October 2022; Accepted: 12 December 2022;
Published: 04 January 2023.
Edited by:
Kenneth Alan Rose, University of Maryland, United StatesReviewed by:
Karin E. Limburg, SUNY College of Environmental Science and Forestry, United StatesChris Taylor, National Centers for Coastal Ocean Science (NOAA), United States
Copyright © 2023 Chang, McKown and Chen. This is an open-access article distributed under the terms of the Creative Commons Attribution License (CC BY). The use, distribution or reproduction in other forums is permitted, provided the original author(s) and the copyright owner(s) are credited and that the original publication in this journal is cited, in accordance with accepted academic practice. No use, distribution or reproduction is permitted which does not comply with these terms.
*Correspondence: Hsiao-Yun Chang, aHNpYW8teXVuLmNoYW5nQHN0b255YnJvb2suZWR1