 Yuanli Fang
 Daohua Chen2,3
 Yinan Deng
 Haocai Huang
94% of researchers rate our articles as excellent or good
Learn more about the work of our research integrity team to safeguard the quality of each article we publish.
Find out more
ORIGINAL RESEARCH article
Front. Mar. Sci., 12 December 2022
Sec. Ocean Observation
Volume 9 - 2022 | https://doi.org/10.3389/fmars.2022.1075446
This article is part of the Research TopicDeep-Sea Sampling TechnologyView all 10 articles
The collection and research of deep sea water has always been a hot and key topic in the field of marine research. Collecting seawater samples that can truly reflect the in-situ water composition information through a deep-sea sampler is an important technical means in the field of deep-sea exploration. The deep-sea water sampler designed in this subject samples deep-sea water by displacement sampling. According to the jet theory, the method of numerical calculation combined with experiment is adopted, the influence of indirect displacement, shape and diameter of sampling inlet, Coanda distance, sampling rate and other factors on the displacement effect is analyzed in this paper. The results of the study demonstrate that at low speed, multiple displacements can improve the displacement effect. In the high-speed sampling state, a single displacement method should be adopted. The design of making the sampling port as close as possible to the wall of the sampling cavity helps to strengthen the plane jet to improve the displacement efficiency. The displacement efficiency can be slightly improved by using the rectangular sampling inlet and outlet. As the extraction speed increases, the liquid mixing area becomes larger. Through discussion and comparison with similar research at home and abroad, the sampler has good performance and high sampling purity. The analysis of the effect of changes in sample temperature on the sampling displacement efficiency will be performed in the future. The research on the thermal insulation performance of the sampling channel will be put on the agenda.
At present, there are two main methods for the study of deep-sea hydrothermal fluids, cold springs and other bottom waters: the first is to measure the physical and chemical quantities in situ at the hydrothermal vent; the second is to obtain hydrothermal samples, analysis in the laboratory after return. Through in situ measurement, we can obtain long-term and continuous observation data so as to obtain the real dynamic data of seawater physical and chemical data. However, it is still not comparable to laboratory measurements in terms of measurement accuracy and detection parameter range. At present, the sampling of deep sea water is still irreplaceable (Edgcomb et al., 2016). Since the nineteenth century, various institutions at home and abroad have developed a variety of deep-sea water samplers with different functions. Especially in recent years, deep-sea water sampler technology has developed rapidly. ANEMONE-11 with 128 sampling channels was proposed by (Okamura et al., 2013). It is mainly carried on the AUV and used for monitoring the chemical and biological components of water. The WHATS series of three generations of water samplers has developed in Japan, and a new idea of sequence triggering is proposed. The blocking rod and the sheaves on the inlet valve and the outlet valve form a group Space sheave stepping transmission mechanism through a mechanical sliding arm with blocking rods installed at both ends (Saegusa et al., 2006; Junichi et al., 2017). An inexpensive and easy-to-use high-resolution water sampling device for ecological research and water quality analysis was developed at Indiana Wesleyan University (Sattley et al., 2017). A sediment pore water sampler that can prevent samples from being polluted by seawater was invented by Institute of Disaster Prevention, Langfang Hebei and tested in the northern part of the South China Sea (Liu et al., 2018). Compared with the previous water sampler, the displacement sampling method is used in this sampler to collect bottom water samples. The deep-sea water sampler developed in this study belongs to the pass-flow sampler, and the sampling chamber needs to be prefilled with deionized water. On the other hand, this design can equalize the pressure inside and outside of the water sampler during the descent process, so as to avoid leakage or rupture of the sampling chamber due to the huge pressure difference between inside and outside during the descent process. The pass-through structure can also use the sample water to scour the sampling channel to avoid pollution. At the beginning of sampling, the seawater from the outside is continuously sucked into the sampling chamber, and the deionized water is continuously discharged. The process in which the two fluids replace each other is called displacement process. The mixing of deionized water and water samples in the process of displacement affects the displacement effect and the purity of sample collection. It is very important to study the factors affecting the displacement process, optimize the related parameters, improve the displacement efficiency, shorten the necessary time of displacement, and improve the sampling reliability without affecting the sampling effect for the overall performance improvement of water sampler. However, there are few deep-sea samplers using displacement sampling principle at home and abroad. We intends to explore the influence of different parameters on sampling efficiency through numerical simulation and sea trials from the indirect displacement, shape and diameter of sampling inlet, Coanda distance and sampling rate in this paper. The full paper is mainly divided into the following parts: Materials and methods, Results, Discussion, and Conclusions. Jet theory, displacement theory and the design of the water sampler are introduced in Chapter 2. The numerical results of displacement efficiency corresponding to each parameter and the sea trial of the prototype are listed in Chapter 3. Other similar studies at home and abroad are discussed in Chapter 4. Finally, the comprehensive conclusion of the whole study is summarized in Chapter 5.
The displacement process is a very complex fluid motion process. It is the jet movement that has an important influence on the displacement process. The process of the sample from the relatively narrow sampling line into the relatively wide sampling cavity is a kind of jet movement. Jet refers to a moving fluid that is ejected from various discharge ports or mechanically propelled into another surrounding fluid domain. Usually the entire perimeter of the jet is fluid, which is the main difference between it and pipe flow and open channel flow. From the perspective of flow morphology, jets can be divided into laminar jets and turbulent jets, which can be distinguished by the Reynolds number. When Re > 30, the state of the jet can be considered as a turbulent jet (Yu, 1993). As the sampling speed increases, the jet motion also produces an evolution from laminar jet to turbulent jet, and the displacement motion is affected by the jet characteristics. In addition, there is a density difference between the external seawater sample and deionized water, so the displacement flow field between the seawater sample and the pre-charged deionized water is a kind of hyperpycnal flow. Depending on the size of the density difference, the inflow will experience greater or lesser buoyancy.
In the formula, b0is the outlet radius of the jet nozzle, u0is the outlet velocity, and v is the kinematic viscosity of the fluid.
The critical flow rate at a Reynolds number of 30 is:
The flow Q is:
In the formula, S is the cross-sectional area of the nozzle outlet, and it is assumed that the flow velocity on the cross-section is uniform. It can be known that when the kinematic viscosity of the fluid is constant, the critical flow rate is proportional to the radius of the nozzle outlet.
The overall structure of the turbulent jet is very complex. For the convenience of analysis, researchers usually divide the jet into several regions according to different flow characteristics, namely: the initial section, the transition section, and the main section. The shear flow area extending from the nozzle outlet boundary to the inside and outside is called the free shear layer area; the central part is not affected by turbulent mixing and the area where the nozzle velocity is maintained is called the jet core area; along the longitudinal direction The area from the nozzle outlet to the end of the core area is called the initial section of the jet; most of the downstream area of the initial section is a fully developed turbulent mixing area, which is called the main section of the jet; between the initial section and the main section The transition section is usually ignored in the gap because it is too short.
The movement of the buoyant jet is the result of the combined action of the initial momentum and the buoyancy. When the direction of the buoyancy is the same as the direction of the initial momentum, it is called a positive buoyant jet, and if it is the opposite, it is a negative buoyant jet. For the purpose of improving the displacement efficiency, it is desirable to reduce the mixing of incident samples with prefilled water. Preliminary analysis shows that if it is a positive buoyancy jet, the incident sample will enter the ambient fluid faster under the action of buoyancy, that is, pre-charged water. Pure water and intensify mixing. If it is a negatively buoyant jet, the direction of buoyancy is opposite to the direction of initial momentum, the velocity of the incident sample will be slowed down, and delamination may occur, thereby improving the displacement efficiency.
Compared to the previously discussed case, this jet will be subject to the buoyant force produced by the density difference, and the ratio of inertial force to buoyancy force plays a decisive role in the jet motion. The contrast of these two forces, their relative action, can be measured by the densimetric Froude number (Yu, 1993):
where u is the characteristic velocity of the jet; b0 is the characteristic length of the jet, which in this paper is the inlet radius of the jet; ρ is the density of the jet; ρa is the density of the surrounding fluid; g is the acceleration of gravity. When Fr is low, the sinking fluid in the negative buoyancy jet will gradually settle in the lower part of the sampling chamber and replace the ambient fluid near the inlet, and at the same time generate a certain amount of mixing with it. When Fr is high, it shows strong jet characteristics, The fluid may strike a reflection near the exit face.
Because the sampling cavity is a limited space and the density of the surrounding fluid changes in real time, it is difficult to describe the displacement process accurately in theory, so it needs to be further discussed through simulation and experiments.
In order to better describe the displacement effect, the indicator of displacement rate is proposed, which is defined as follows:
E(t) is the displacement rate, that is, the ratio of the cavity volume of the target sample station, t is the displacement time, Vvol is the cavity volume, and Vaim(t) is the volume of the sample in the cavity at t. The value of E(t) varies from 0 to 1, which is a function of t and describes the displacement completion degree in the sampling cavity at a certain time point.
Fluent was used for numerical analysis. To describe the flow characteristics of the near-wall flow field, the k-epsilon equation was chosen to solve the model. Enhanced wall treatments are used, and the full buoyancy effect is turned on to emphasize the role of buoyancy in the motion of the flow field. During the solution process, chemical reactions between the sample and the pre-filled water and metal precipitation were ignored. On the other hand, although there is a density difference between the sample and the prefilled water, this density difference is actually very small. In order to facilitate convergence, the Boussinesq assumption can be considered to hold, that is, the density variation due to the inhomogeneity of the substance concentration is small. When solving the N-S equations, the densities in terms other than the gravity term are treated as constants.
The sampling channel is arranged in a U shape, and the two sampling chambers are connected in series. The density of the pre-charged deionized water is 1000kg/m3 and the density of the sample is 1035kg/m3. The sampling cavity model is set to be cylindrical, the cavity height is 112.5mm, the diameter is 52mm, the wall thickness is 9mm, the outer diameter of the sampling inlet and outlet is 6.2mm, and the inner diameter is 4mm. The inflow velocity ranges from 0.044 to 0.2m/s, and the displacement time ranges from 500s to 1000s. The numerical calculation model is shown in Figure 1.
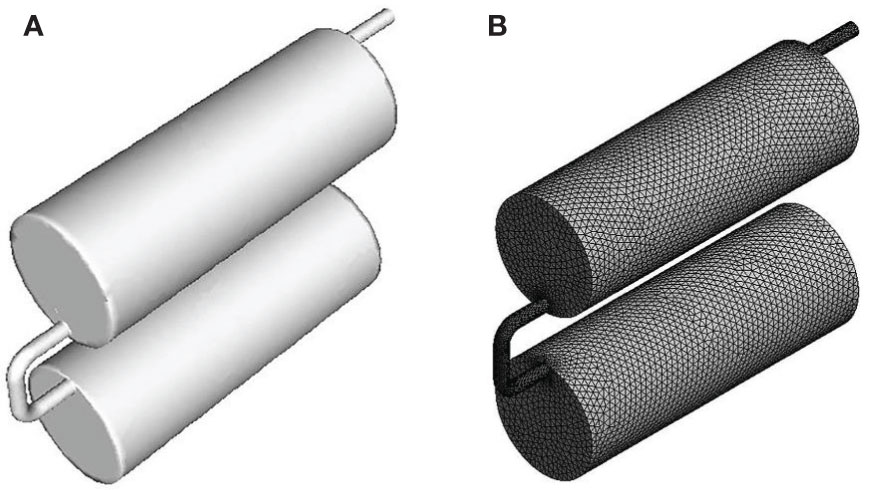
Figure 1 numerical calculation model, (A) The internal structure of the sampling channel, (B) CFD calculation mesh diagram.
According to the research of Imperial College London and University of Cambridge, under the same source conditions, the walled jet is stronger than the free jet (Burridge and Hunt, 2017).
We can assume that the force at the source is large enough that the inertial force dominates the buoyancy at the source. The established flow is turbulent and the viscous forces are much smaller than the inertial forces.
πM0 and πB0 are source fluxes of specific momentum and buoyancy. For the near-field region, the resulting dominant length scale (the jet length) and the dominant volume flux scale may be written respectively by (6). where the subscript M is used to convey that it is the source momentum flux that is dominant in this region of flow.
The dynamics of circular and rectangular jets in cross flow were studied at Louisiana State University and the Illinois Institute of Technology. Numerical methods of finite volume code in-house code chem3D are used to compute such problems (Pokharel and Acharya, 2021).
Where is the contravariant velocity components, is the associated metric terms, is the Jacobian of the transformation, is the magnitude of the strain rate tensor. (6) represents the conservation of mass, (7) represents the conservation of momentum. (8) and (9) represent the relationship of eddy viscosity to the strain rate tensor and Smagorinsky constant.
The jet is a flow with opposite momentum and buoyancy, and the vertical velocity of the jet gradually decreases and becomes zero at the maximum penetration height of the jet. After that, the jet reverses direction and forms a falling flow (OF – Out flow); the falling flow and the upward jet (IF – In flow) injected into the ambient fluid from the jet inlet are mixed with each other due to the viscosity and shear of the fluid., forming an entrainment phenomenon. At the same time, the falling flow also mixes with the adjacent ambient fluid (AF – Ambient flow), resulting in a decrease in its density and an increase in its volume. When the falling fluid descends to the bottom, it will form an intrusion that extends horizontally outward (Li, 2021). Therefore, how to minimize the entrainment and mixing between different fluid layers caused by the buoyant jet characteristics of the samples entering the sampling cavity during the sampling process is one of the key research contents.
When the environmental fluid is linearly stratified, the flow behavior of the negative buoyancy jet is not only controlled by Re and Fr, but also controlled by the stratification parameter Sp of the environmental fluid. The definition of Sp is: , ρa,0 and ρa,Z are respectively located in Initial density of ambient fluid at bottom Z=0 and height Z.
If the fluid load Boussinesq is approximated, Sp can also be replaced by the temperature stratification parameter S defined as follows, , where Ta,z is the initial temperature of the ambient fluid at height Z. If this formula is dimensionless, the dimensionless temperature layer S can be expressed as . Here, θa,z=(Ta,z−Ta,0)/(Ta,0−T0) , Ta,0 is the initial temperature of the ambient fluid at the bottom (Z=0) (Gao, 2018).
The deep-sea through-flow in-situ air-tight water sampler is mainly composed of a sampling channel, a trigger mechanism, a trigger drive system and an auxiliary mechanism. The sampling channel is mainly composed of sampling cavity, sampling inlet, sampling outlet, sampling valve, sampling pump, connecting pipe, etc., as shown in Figure 2.
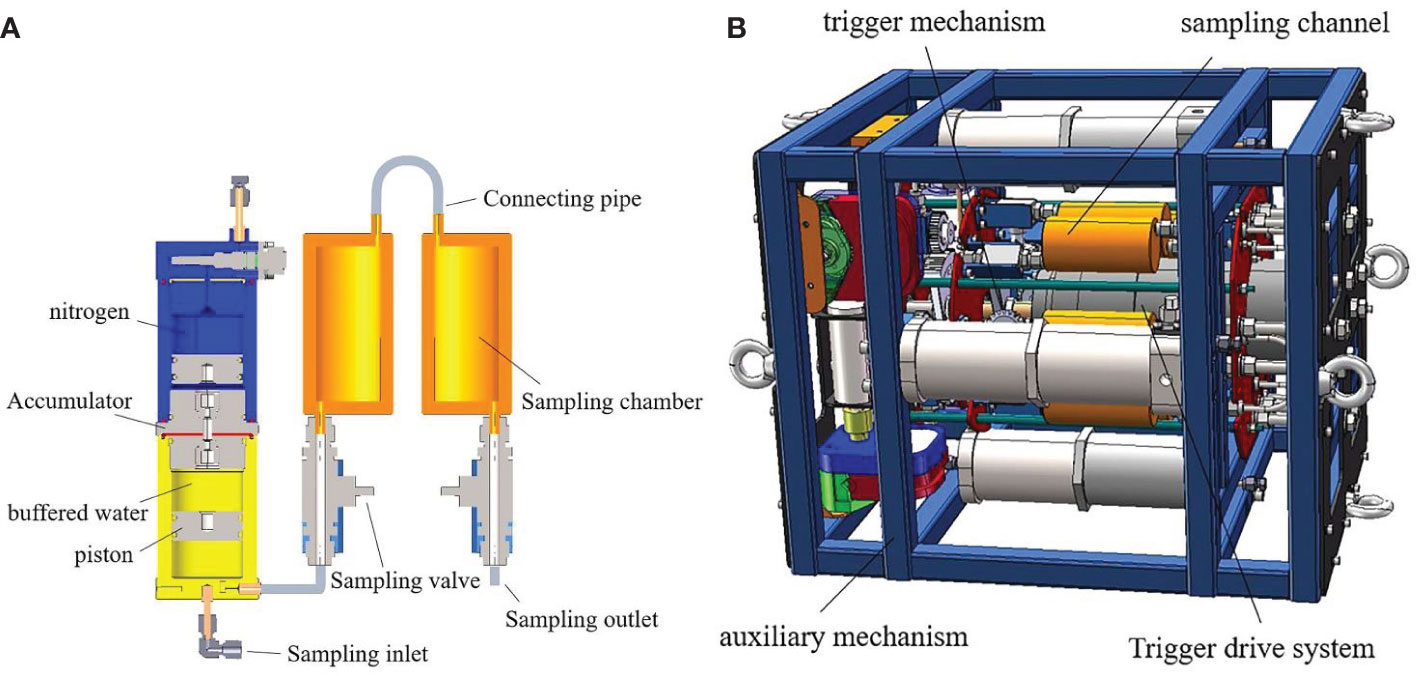
Figure 2 Model of the water sampler, (A) Sampling channel, (B) Overall design of the water sampler.
The structure of the sampling channel as a whole continues the U-shaped design features of the first generation of water samplers in this subject. In this way, the space is more effectively used, and the sampling inlet and the sampling outlet are located on the same side, which is convenient for operation.
As shown in Figure 3, when the sample inflow velocity is 0.1m/s, after the sample enters the sampling cavity from the sampling inlet located on the lower side of the cavity, the liquid front of the sample first sneaks along the wall to the left, and when it touches the left side A certain reverse flow is generated after the wall, and a certain layering phenomenon appears between the sample and the pre-filled deionized water.
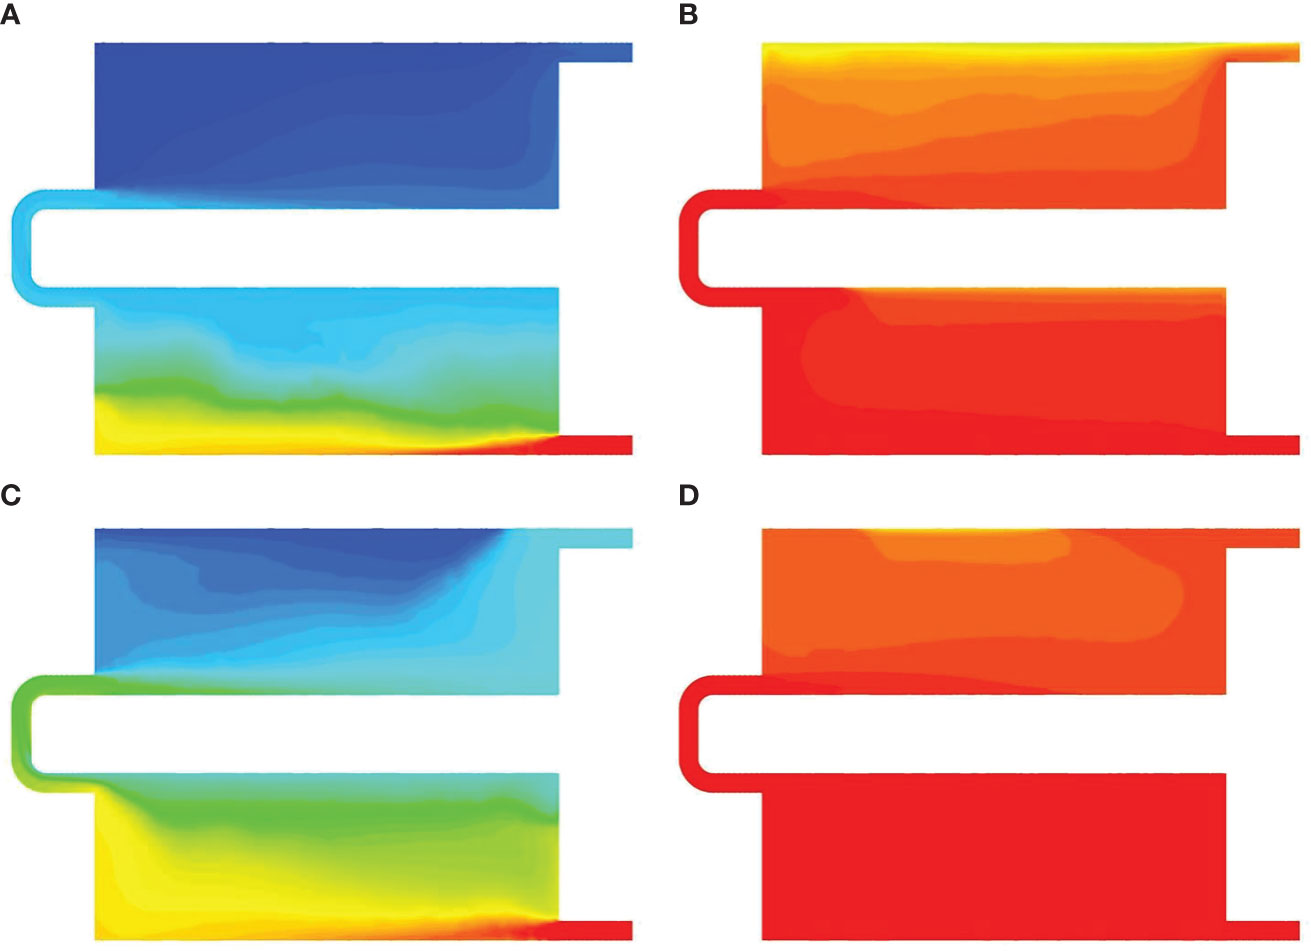
Figure 3 The concentration distribution of the two components in the sampling chamber, (A, B) The sample inflow velocity is 0.1m/s, (C, D) The sample inflow velocity is 0.2m/s.
When a portion of the sample begins to enter the upper sampling chamber, most of the sample in the lower sampling chamber continues to settle and raise the interface. Since the connecting channels between the sampling chambers are located on both sides of the sampling chamber, and the outlet of the sampling channel is located above the sampling chamber, the sample does not start to leave the sampling outlet until the deionized water in the lower sampling chamber is widely displaced, and the lower sampling chamber begins to leave. The deionized water in the lower sampling chamber can almost be successfully displaced.
After increasing the inlet flow rate, the displacement process in the sampling chamber presents different forms. After increasing the sample flow rate at the sampling inlet, the stratification between the sample and the pre-charged deionized water was less than before. The sample began to enter the upper sampling cavity from the lower sampling cavity very early, and the displacement rate was significantly improved, as shown in Figure 4.
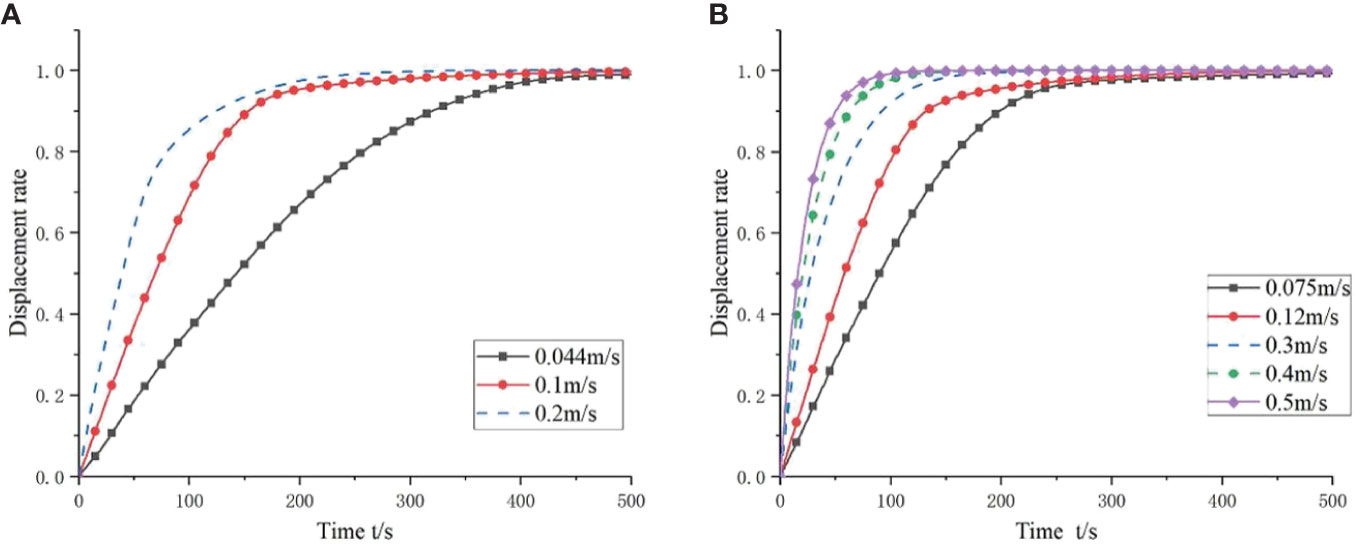
Figure 4 Displacement process diagram of each inflow rate, (A) Low speed, (B) High speed.
For different displacement methods, considering the mixing of solutions, the effects of multiple and single displacement on displacement efficiency are discussed, and the displacement ratios of 0.5 and 0.75 are set as nodes. The double displacement with the displacement rate of 0.5 as the node and the triple displacement with the displacement rate of 0.5 and 0.75 as the nodes were set separately and compared with the single displacement effect.
It can be seen from Figure 5 that when the displacement starts from the node with a displacement rate of 0.5 and a node with a displacement rate of 0.75, the mixed solution will still appear layered, but the layered effect is not as obvious as that of a single displacement.
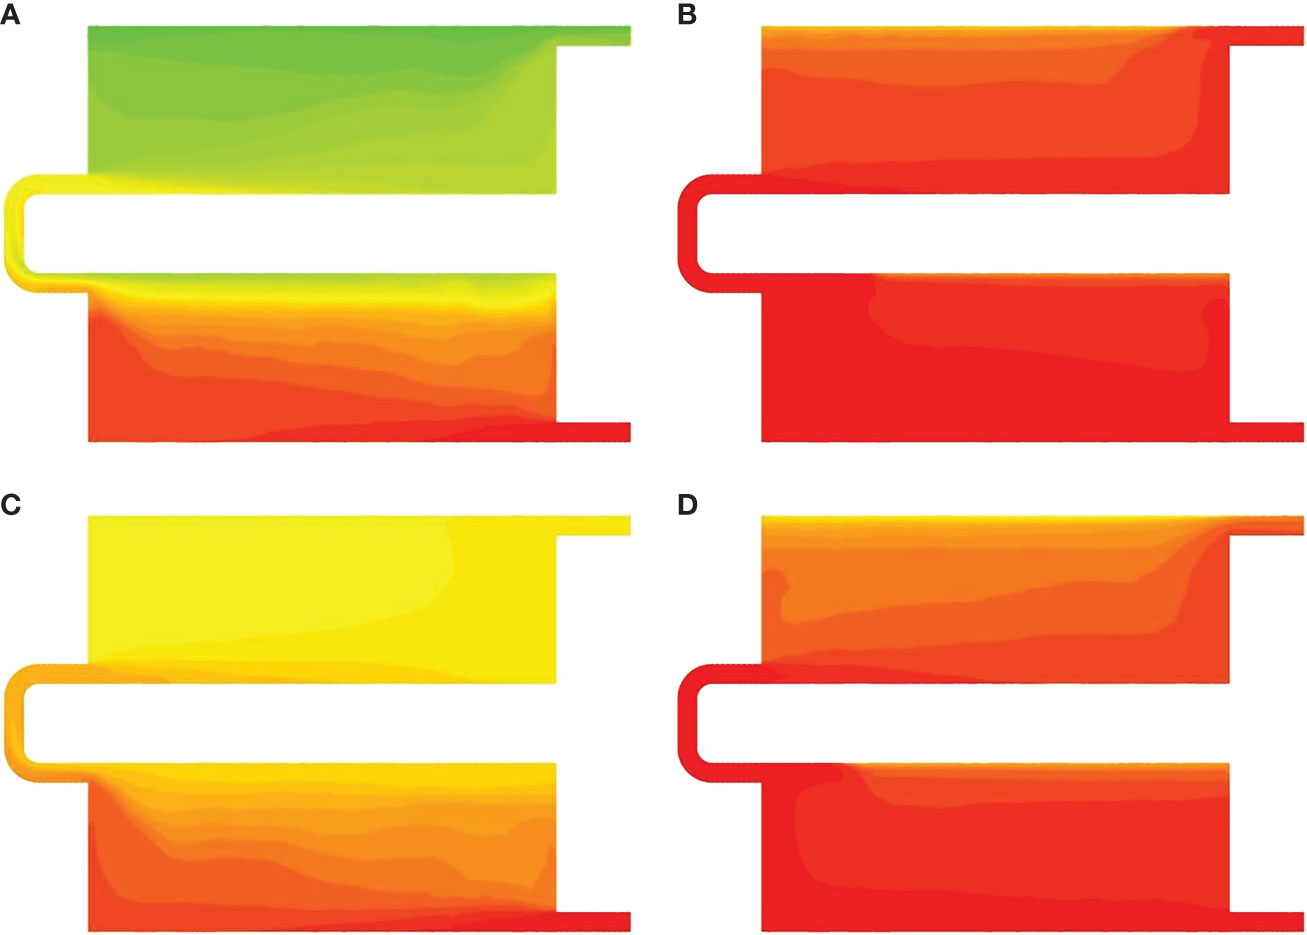
Figure 5 The concentration distribution of the solution when the sample inflow velocity is 0.1m/s, (A, B) The double displacement, (C, D) The triple displacement.
It can be seen from Figure 6 that the use of multiple displacement and single displacement will produce different displacement effects. When the inlet velocity of the sampling channel is 0.044m/s, the method of multiple displacement is adopted. At the middle and late stages of the displacement, the attenuation of the displacement curve is delayed, and the displacement effect is improved. When triple displacement is selected, the triple displacement will decrease relative to the double displacement after the start of the triple displacement, but it is still ahead of the single displacement.
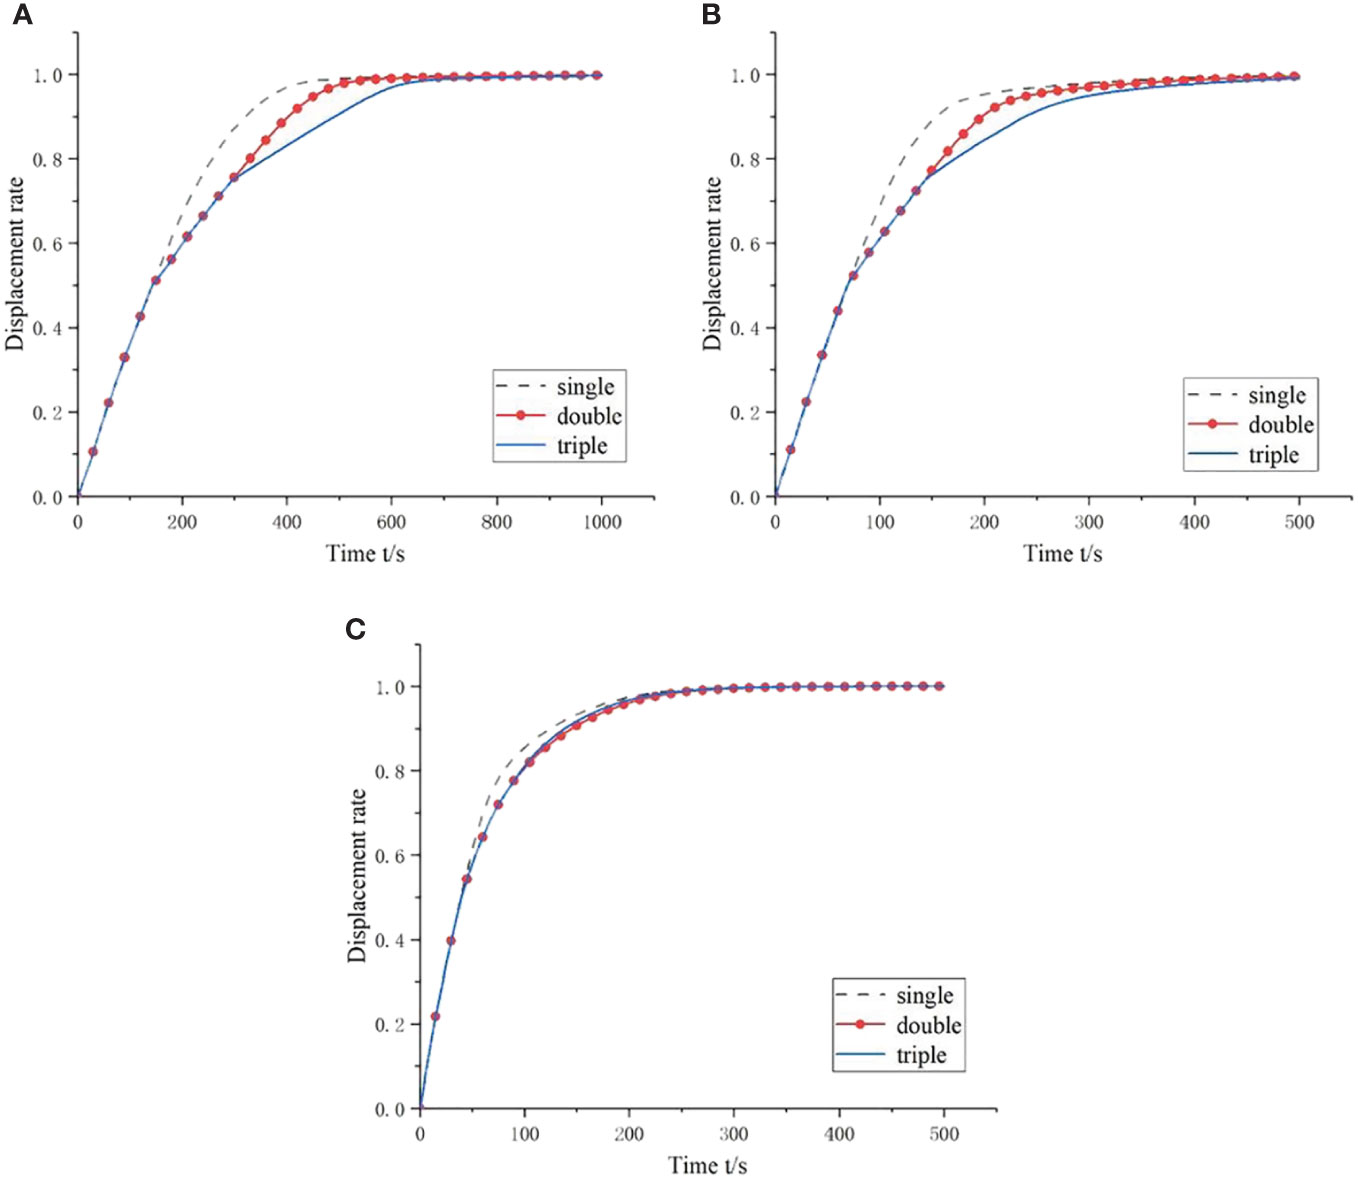
Figure 6 The diagram of the indirect displacement process, (A) 0.044m/s, (B) 0.1m/s, (C) 0.2m/s.
When the sample inlet flow rate is 0.1m/s, the situation is different from that at low flow rate. When multiple displacements are used, the displacement curve decays earlier, and when single displacement is used, the displacement maintains a linear increase for a longer time, and the displacement effect is better, and the displacement effect is the worst in triple displacements.
When the sampling inlet velocity is 0.2m/s, the difference between the displacement effects of single and multiple displacement is small, and the displacement effect of single displacement is slightly ahead of that of double and triple displacement.
It can be seen that at low speed, multiple displacements can improve the displacement effect, and the number of times is appropriate, and too many times will weaken the lifting effect to a certain extent. In the high-speed sampling state, a single displacement method should be adopted to avoid the occurrence of displacement discontinuities as much as possible to ensure the best displacement effect.
According to this characteristic, the displacement calculation of the sampling cavity with different distances between the sampling port and the upper and lower walls is carried out. According to Figure 7, The results confirm that the design of making the sampling port as close as possible to the wall of the sampling cavity helps to strengthen the plane jet to improve the displacement efficiency to a certain extent.
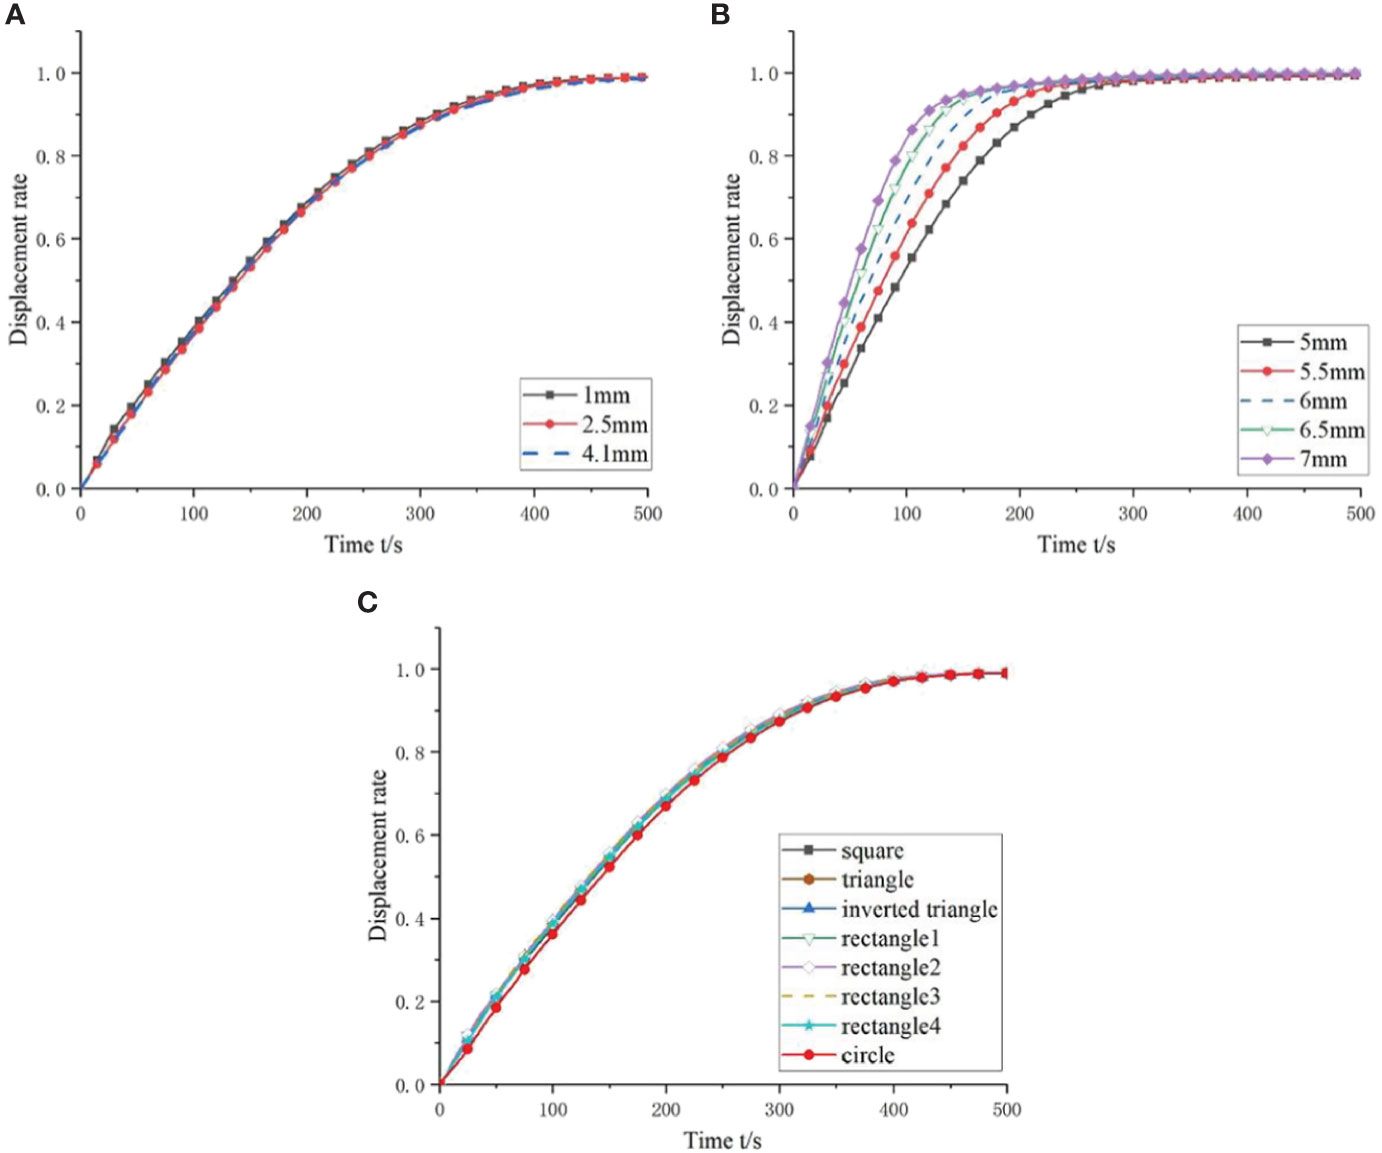
Figure 7 Displacement effect diagram of sampling cavity with different parameters, (A) Coanda distances, (B) Sampling chamber inlet diameters, (C) Sampling inlet shapes.
In addition, different jet inlet shapes and diameters are also calculated.
In the case of using a circular sampling inlet, 5 sampling inlet diameter parameters were set from 5 mm to 7 mm. The diameter of the sampling inlet is also considered. Rectangular, square, and triangular sampling inlets are used in contrast to circular inlets. Among them, the sampling inlets of triangle and rectangle are also set in different orientations.
It can be seen from Figure 7 that the influence of the diameter of the inlet and outlet of the sampling channel on the displacement rate is basically the same as that of the inlet flow rate.
The results in Figure 7 show that the displacement efficiency can be slightly improved by using the rectangular sampling inlet and outlet. Although the displacement efficiency of the circular sampling inlet and outlet is low, considering the sealing, fit and overall design, the circular inlet and outlet are usually still used in most cases.
As shown in Figures 8 and 9, when the low Reynolds number jet acts, the vertical mixing dominates. With the increase of the Reynolds number, the negatively buoyant jet increases, the lateral mixing gradually dominates, and the entrainment and mixing phenomena become more and more obvious. The area of mixing is getting larger, but in the stable displacement area and the non-displacement area, the streamlines are relatively regular, and the stratification of temperature and density is relatively uniform.
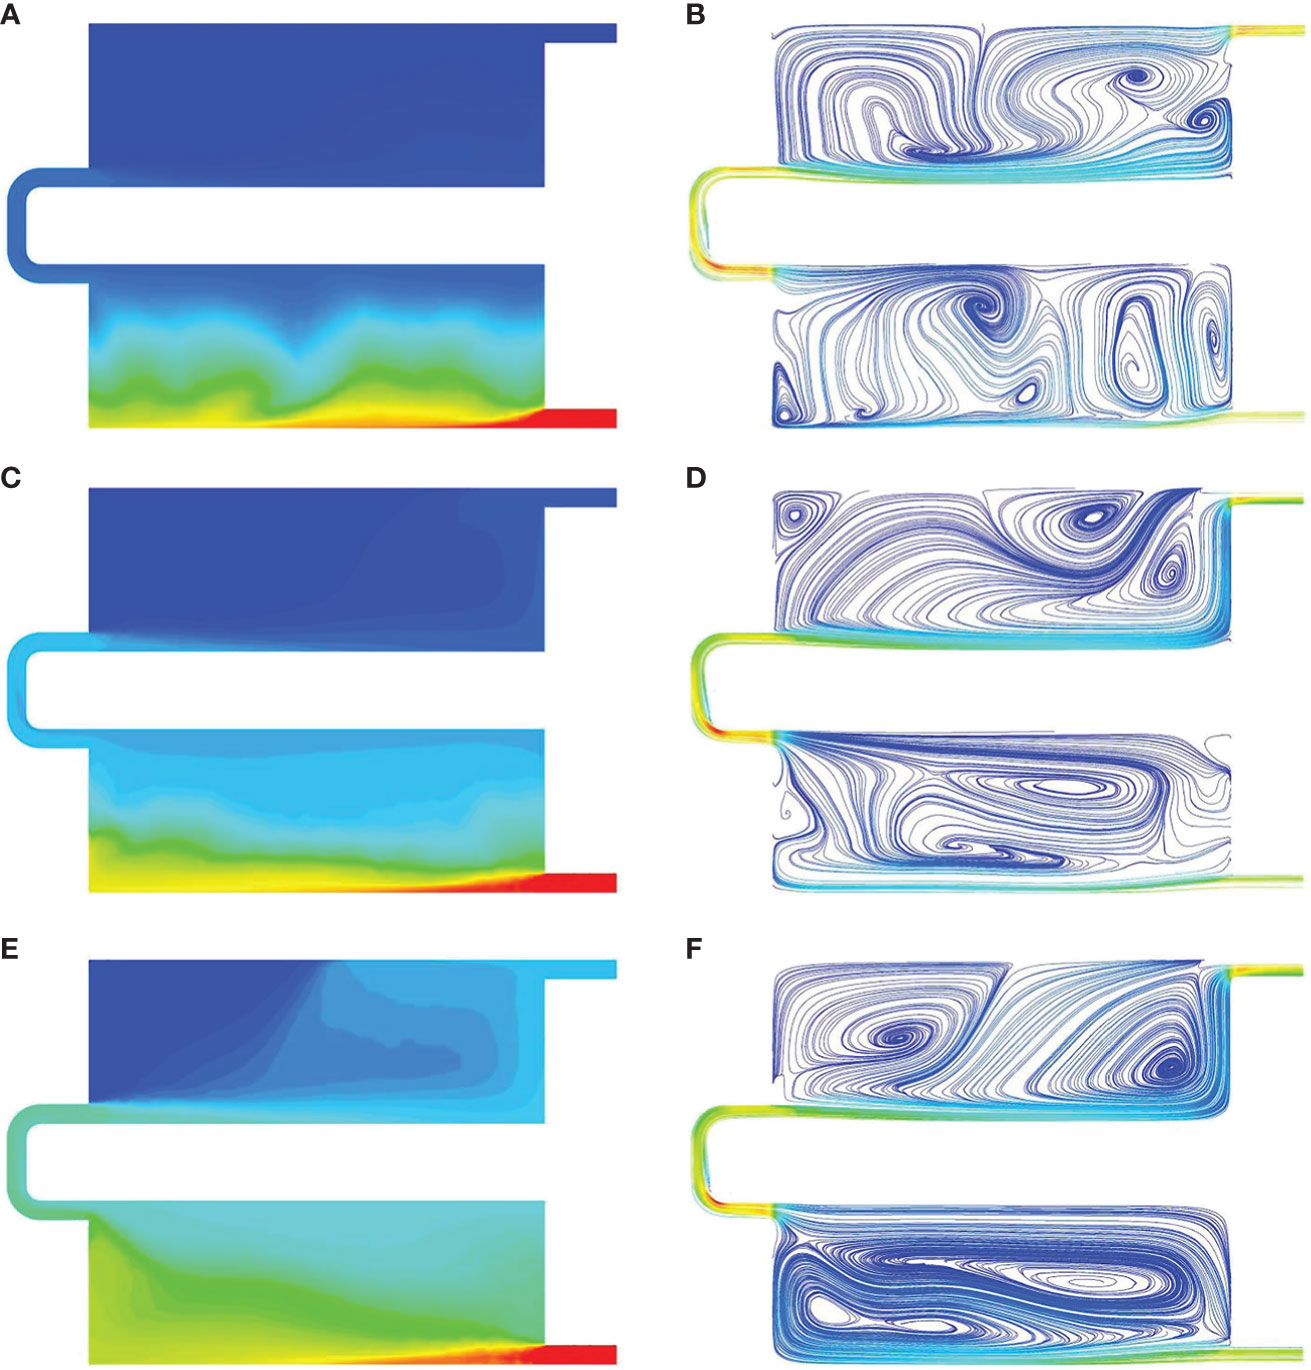
Figure 8 Density stratification and velocity distribution, (A) Density stratification at 0.044m/s, (B) Velocity distribution at 0.044m/s, (C) Density stratification at 0.1m/s, (D) Velocity distribution at 0.1m/s, (E) Density stratification at 0.2m/s, (F) Velocity distribution at 0.2m/s.
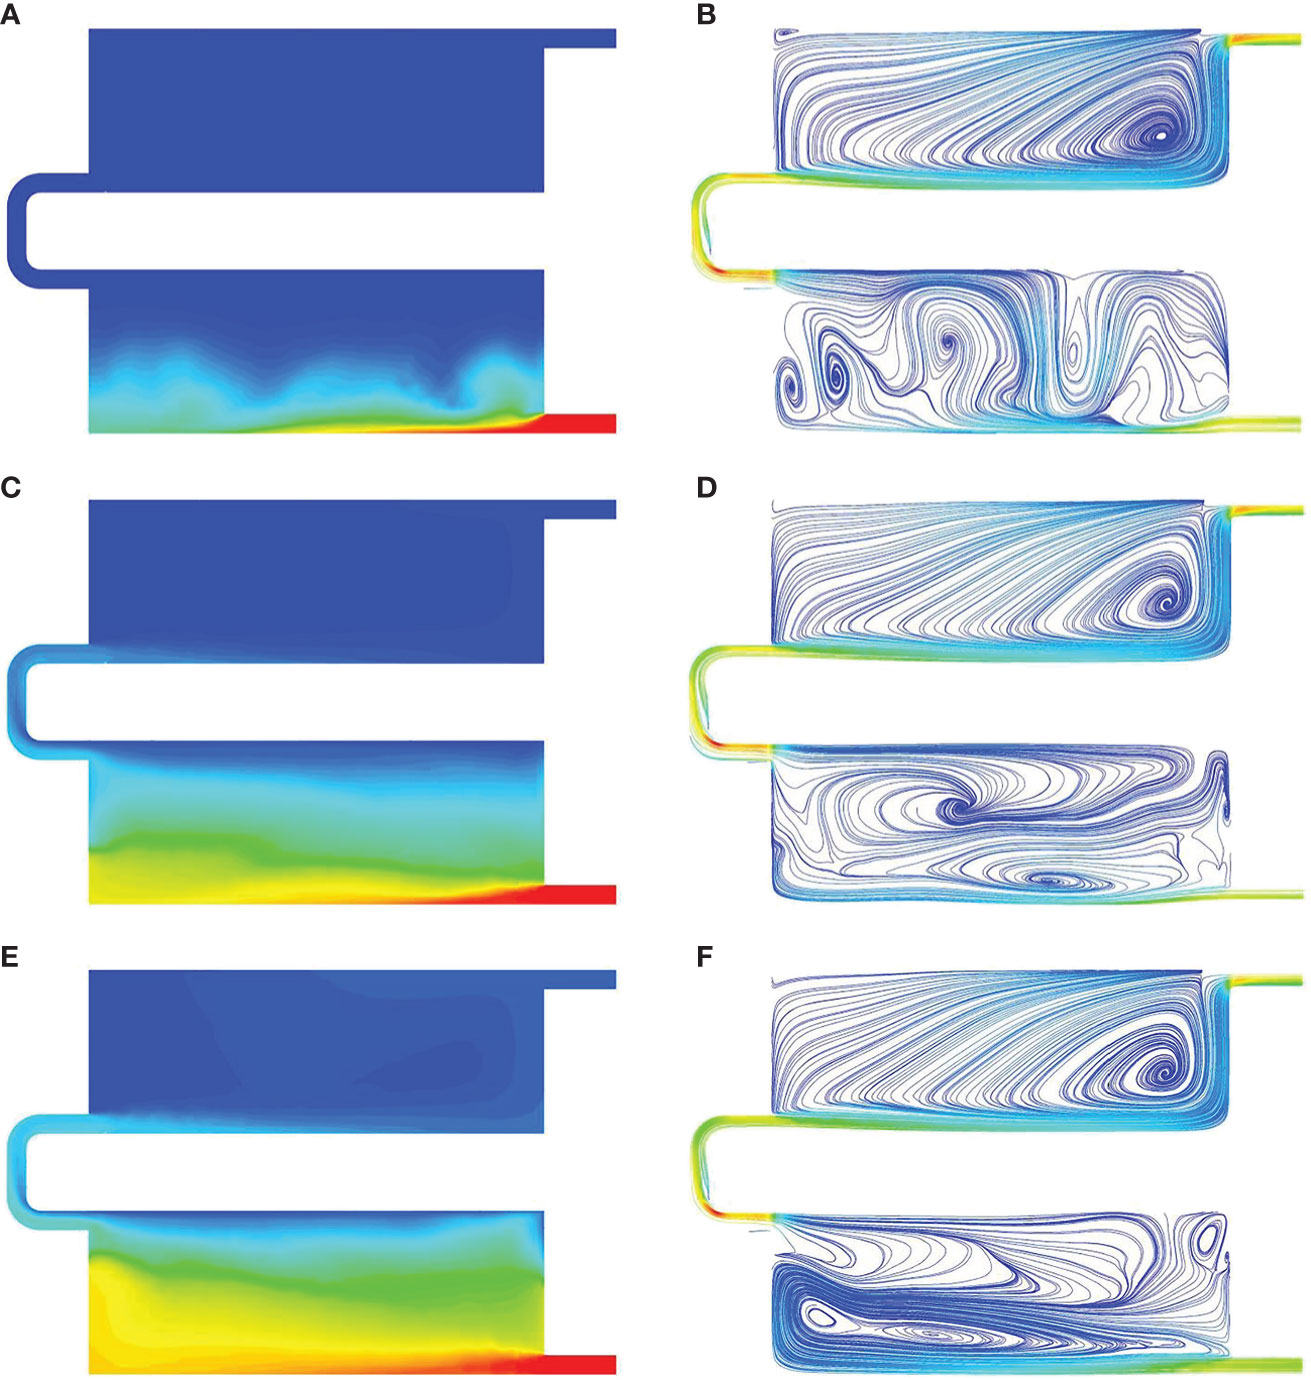
Figure 9 Temperature stratification and velocity distribution, (A) Temperature stratification at 0.044m/s, (B) Velocity distribution at 0.044m/s, (C) Temperature stratification at 0.1m/s, (D) Velocity distribution at 0.1m/s, (E) Temperature stratification at 0.2m/s, (F) Velocity distribution at 0.2m/s.
As shown in Figures 10 and 11, The samples are divided into light liquid layer, medium liquid layer, heavy liquid layer and low temperature layer, thermocline layer and high temperature layer according to the density and temperature. As the extraction speed increases, the jet becomes stronger with the increase of Reynolds number, the thickness of the thermocline and medium liquid layer gradually increase, and the liquid mixing area becomes larger.
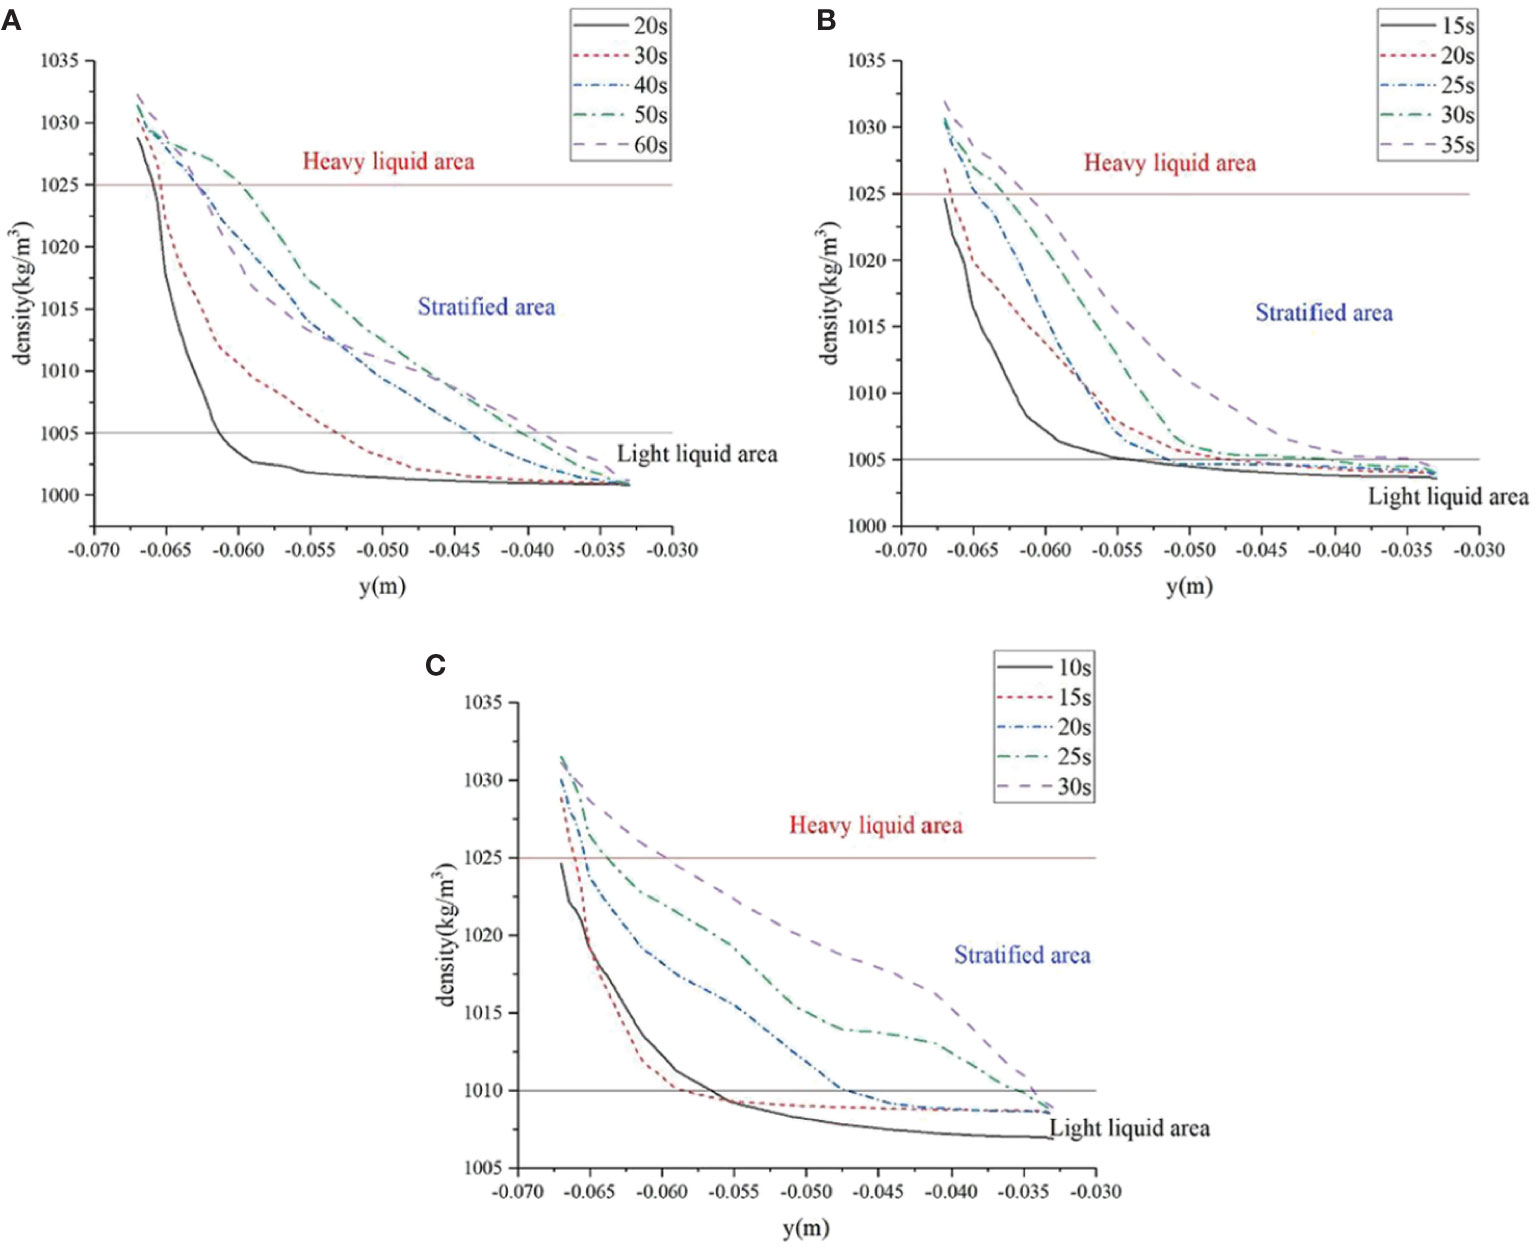
Figure 10 The density distribution curve of the central axis of the sampling cavity, (A) 0.044m/s, (B) 0.1m/s, (C) 0.2m/s.
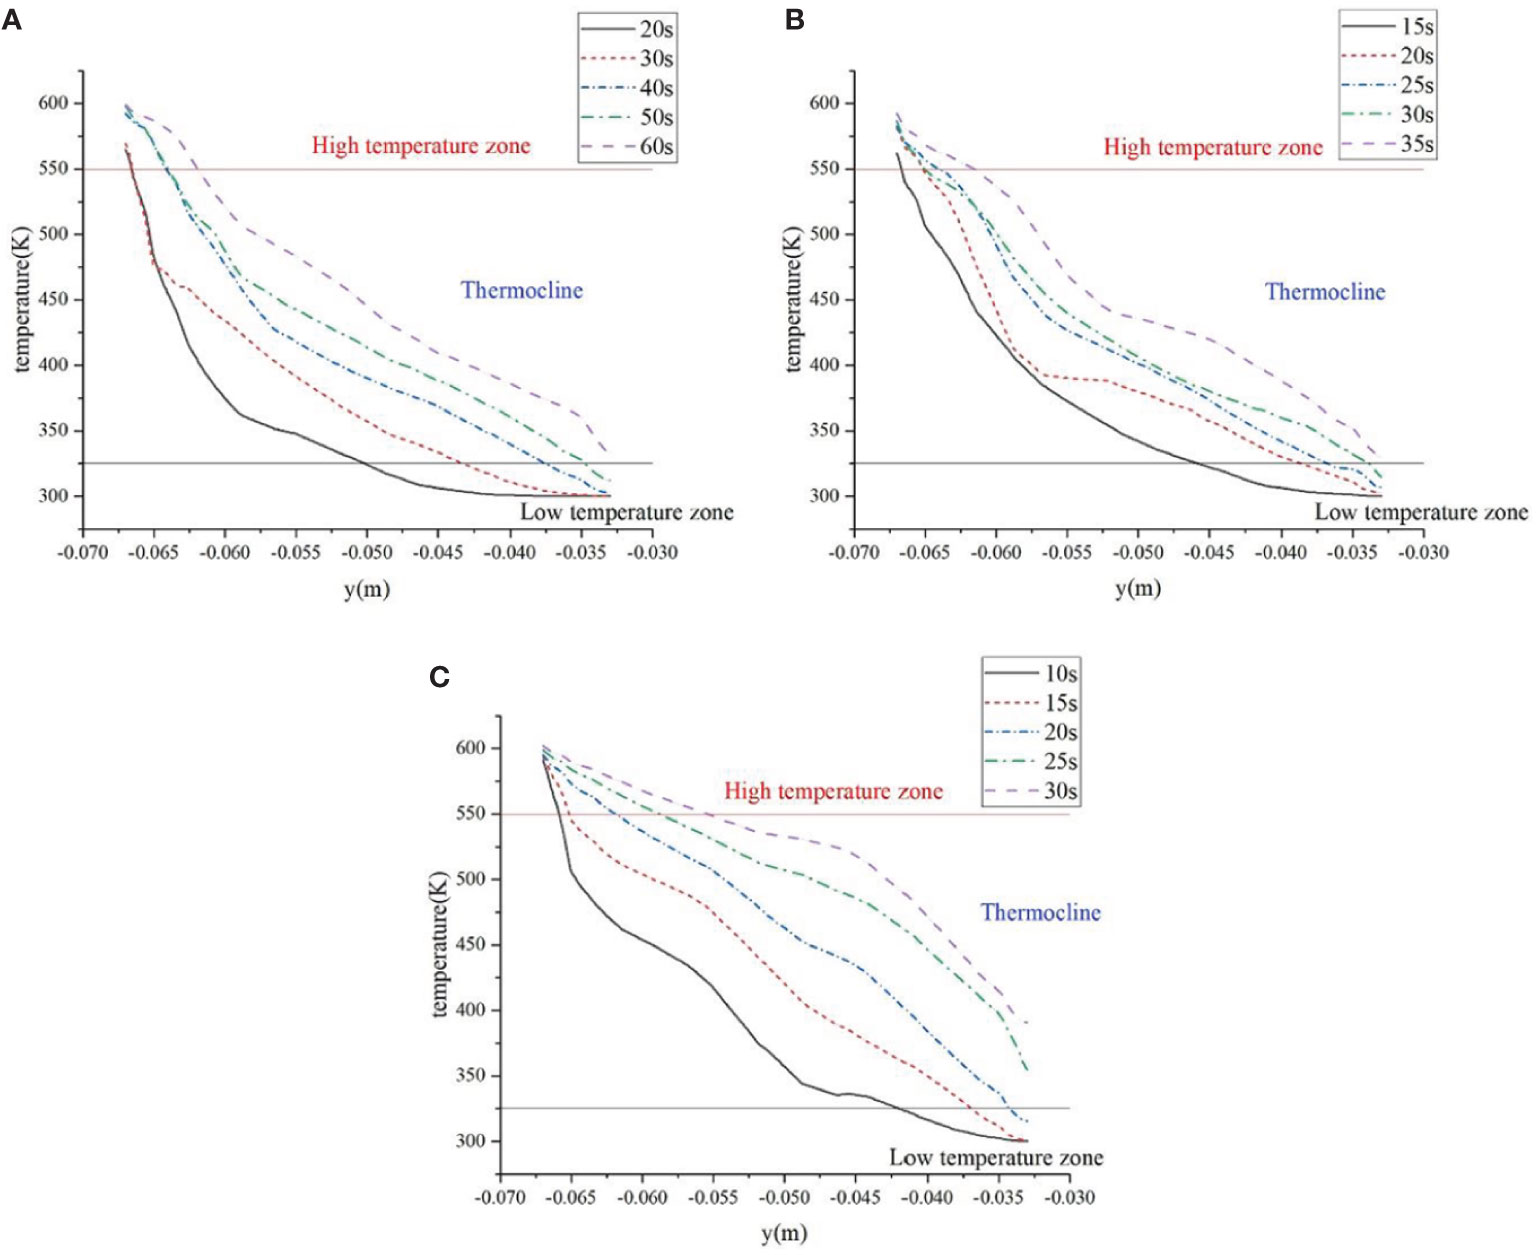
Figure 11 The temperature distribution curve of the central axis of the sampling chamber, (A) 0.044m/s, (B) 0.1m/s, (C) 0.2m/s.
We went to the South China Sea for sea trials in June 2022 with Southern Marine Science and Engineering Guangdong Laboratory (Guangzhou) and Guangzhou Marine Geological Survey (GMGS). The Ocean Geology No. 6 scientific research vessel of GMGS set off from Sanya on June 10, and ended its operation and docked in Dongguan on June 27. During this period, we went to the methane seepage area of the South China Sea and the 3,000-meter-deep waters. The actual operation depth was 1,399 meters in the methane seepage area and 3,021 meters in the 3,000-meter-deep waters.
During this sea trial, the water sampler was fixed to the rear of the deep-sea mobile platform. The water sampler is powered by the deep-sea mobile platform. The deep-sea mobile platform is controlled by the upper computer software on board. In addition to this water sampler, the sediment sampler and pore water sampler of the same project are also carried on the deep-sea mobile platform. The deep-sea mobile platform is hoisted from the rear deck by a winch and lowered to the deep sea for operation. At the end of the operation, it is winched from the seabed to the rear deck. as shown in Figure 12.
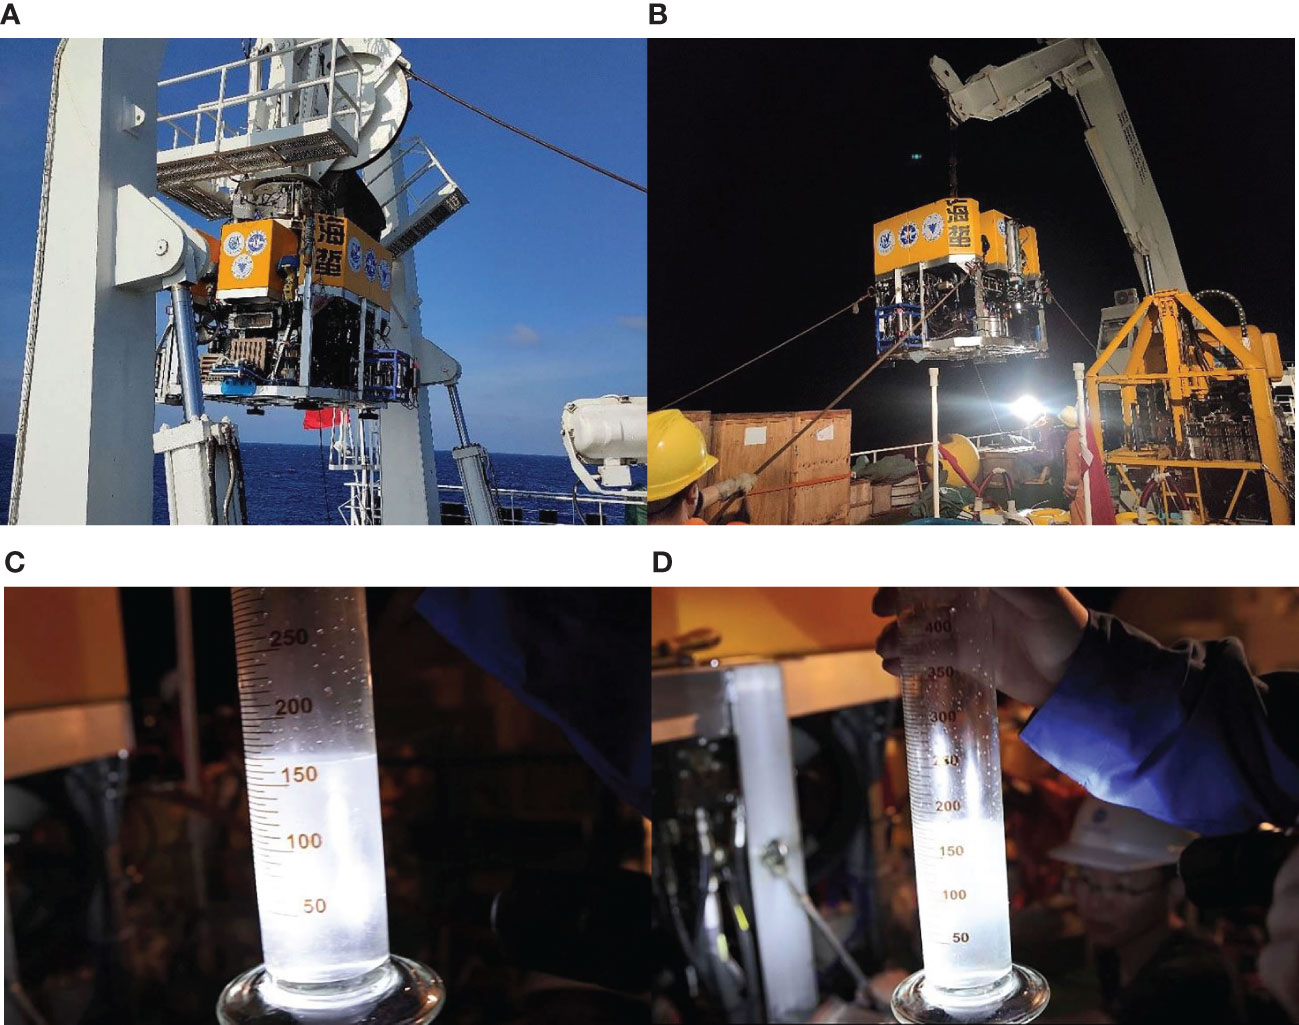
Figure 12 Prototype test and sampling process, (A) The arrangement of the water sampler, (B) The recovery of the water sampler, (C) Water extraction of channel 2, (D) Water extraction of channel 3.
The basic parameters of the work location visited this time are described in Table 1.
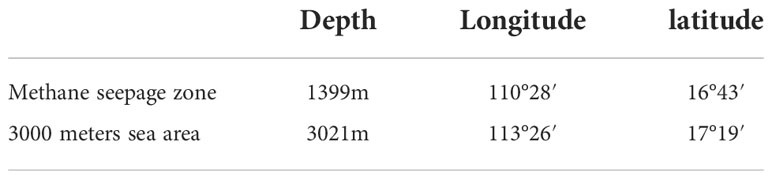
Table 1 Basic parameters of the work location.
At the end of the subsea operation, the deep-sea mobile platform was brought back on board, the sampling valve of the water sampler was opened, and the water samples in the sampling chamber was removed from the sampling chamber with the air compressor. In the 3000-meter sea area, the water extraction volumes of the four sampling channels are shown in Table 2, respectively.
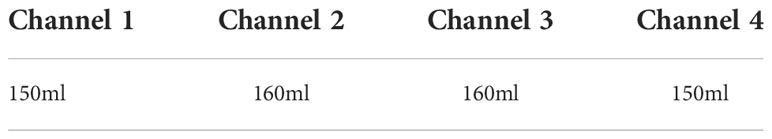
Table 2 The water extraction volumes of the four sampling channels.
We measured the bottom water sample from the 3000-meter seafloor with a refractometer, and the result showed a salinity of 34.8‰, which compared with the temperature salt deep sensor data carried by the deep sea mobile platform, and the sample purity reached 100%. The measurement results have been verified by experts on board and are accurate. In the end, the whole sea trial process passed the acceptance of experts in the industry, and the experts affirmed the whole sea trial process.
After a series of numerical simulation calculations, combined with sea test verification, we have achieved a lot of research results. In fact, the jet theory is closely related to the displacement results. The displacement process is actually a very complex fluid motion process. The displacement process is affected by many factors, and the unpredictability of the deep sea environment and the interference of other unknown factors have caused a lot of instability in the displacement sampling process. During the whole sea trial process, we went through hardships and finally succeeded in the methane leakage area and the 3000-meter area.
The CFD method is recognized as an effective method for calculating fluid motion in today’s academia. Through research, we found that if the sampling rate is low, an appropriate increase in the number of displacements can improve the displacement effect, but it should not be increased excessively. In high-speed sampling, a single displacement method should be used as much as possible. According to the theory of clinging wall jets, the inner wall of the sampling inlet and outlet is close to the inner wall of the sampling cavity, which helps to improve the sampling efficiency. The rectangular sampling inlet and outlet design helps to improve the displacement efficiency.
During jetting, a mixing phenomenon occurs during the injection of one stream into another and leads to stratification of the liquid in the cavity. With the increase of pumping speed and jet intensity, the mixing area of sample liquid and light liquid becomes larger.
Fan et al. (2010) designed a new type of deep-sea pH detection electrode cavity with a three-dimensional structure according to the principle of hyperpycnal flow. The upper and lower water outlets are arranged in the cavity, and the high-efficiency displacement between the heavy liquid and the light liquid in the detection electrode cavity is realized by gravity layering. The relationship between the displacement performance of the pH detection electrode cavity and the Reynolds number and density difference was analyzed. The displacement effect of the triangular prism structure is better than that of the cylindrical structure. Compared with the water sampler used in this project, the overall displacement efficiency of the equipment is not high. The equipment has not been tested in the deep sea environment, and the interference of the deep sea environment cannot be excluded. The sea trial results of this topic are more reliable. And the sea trial results of this topic show that the displacement effect is better. The research results of displacement efficiency in this topic are more in-depth. Only cylindrical and triangular prismatic sampling cavities have been compared in their study. The research on the relationship between cavity structure and displacement efficiency needs to be further deepened. More shape variable parameters can be set.
Many institutions have conducted research on the sealing performance of deep-sea water samplers, such as the work of Niu and Yang (2012). Their work proved that the airtight water sampler developed at Zhejiang University has good sealing performance. A new gas-tight isobaric sampler for the collection of hydrothermal fluids venting at the seafloor has been designed by Seewald et al. (2002). This adjustable fill rate design can effectively reduce the entry of external seawater. External seawater pollution can indeed be reduced by this design, but from the experimental results, compared with the water sampler in this topic, the displacement sampling mechanism adopted in this topic has a more thorough inhibition of pollution. And their electronic control parts are more complicated to design and more expensive to produce.
Zhejiang University is one of the earliest institutions to carry out deep-sea sampling technology research in China. Wang et al. (2010) studied the fatigue life of PEEK poppet of deep-sea hydrothermal fluid sampling valve. These studies provide a reference for the analysis of fatigue life of components of other materials under similar working conditions. A remotely operated serial sampler for collecting gas-tight fluid samples was developed at State Key Laboratory of Fluid Power Transmission and Control, Zhejiang University (Wu et al., 2015). The sampler has two modes of operation, either remotely controlled with equipment on the seafloor, or independently controlled as a stand-alone device. Afterwards, a new gas-tight pair sampler was designed by them for the collection of gas-tight fluid samples from the hadal zone (Wu et al., 2018). The water sampler was field tested in the Mariana Trench, and 3L of water samples were successfully obtained. Compared with the water sampler of this topic, the operation depth of their water sampler is deeper, the electric control system is designed to be more precise, sealing and pressure holding capacity is stronger. However, the flow-through structure similar to the water sampler in this project has not been used on their water sampler. The anti - pollution ability of the water sampler in this project is stronger.
Liu (2019) designed a driving device based on explosive bolts. An underwater anti-pollution isolation device is also designed. However, such a design method will result in a complex structure and high triggering cost. Jin (2019) proposed a sampling cylinder structure with sewage collection function, and the cylinder was divided into several parts with different pistons. However, the design still suffers from structural complexity. The anti-pollution ability of the water sampler in this project is better than that. A high-throughput deep-sea pressure-compensated sampling device was designed in Shandong Academy of Sciences (Li et al., 2018). This design is mainly for the sampling needs of deep-sea plankton. According to the results of numerical calculation, this device meets the needs of good sealing and pressure retention. The water sampler of our project is mainly designed for the sampling of chemical composition in seawater, and also for the analysis of microorganisms in seawater. A deep sea pressure compensator is designed in CRRC SMD (Shanghai) Ltd (Yu et al., 2020). They carried out the force analysis of the pressure compensator, and also designed a set of experimental test system. The structure of the sealing block is also an important factor affecting the sealing effect of the sampler. The China Ship Research Center has optimized the structure of the wedge block and simulated the sealing ring (Wu et al., 2021). However, their theoretical and simulation studies lack experimental support. And although this kind of sealing structure is simple, it lacks reliability in the deep sea environment. Their research mainly focuses on pollution prevention and sealing pressure preservation.
In addition to deep sea water, some institutions are also studying surface water sampling devices. An in-situ hydrophore for the bottom water oil sampler was designed in Shandong Key Laboratory of Marine Environment Monitoring Technology (Hou et al., 2015). But this kind of water collector can only operate in the water environment of 0~100 meters. Its operating environment is relatively limited, and it is difficult to adapt to deep-sea sampling. Some organizations also analyze the water flow inside the water sampler to improve the water collector. Xin et al. (2018) from Dalian University of Technology used CFD to simulate the internal water flow in a stratified water sampler under ice. On this basis, the analysis and calculation are carried out, and the theoretical basis for improving the sub-ice water sampler is obtained. It can be seen that CFD has become an important method to study the water flow inside the water sampler. From a marine biology and chemistry perspective, trace elements in seawater are critical to our understanding of marine life and the environment. Merwe et al. (2019) from the University of Tasmania have developed a water sampler that can observe the concentration of Fe in seawater throughout the seasonal cycle. However, this kind of water collector has only been tested in seawater with a depth of 100 meters, and its operating ability in the deep sea cannot be guaranteed. In the later stage, we can try to design a water sampler with similar functions that can operate in the deep sea. The current deep-sea samplers often have a single function defect. In this regard, Li et al. (2019) of Yantai University designed a modular deep-sea sampling equipment, which uses the combination of a manipulator and a modular tool library to switch sampling tools. Such a design greatly improves the sampling efficiency, but tends to increase the cumbersomeness of deep-sea operations.
At present, there are few studies on the thermal insulation of deep-sea samplers. Insulation is also a topic that cannot be ignored for deep-sea sampling. Changes in water temperature have an effect on the flow characteristics of water samples, especially on the mixing characteristics between liquids. In the field of biochemistry, water temperature also affects the activity of microorganisms in a sample. In the future, the research on underwater insulation is likely to become an important direction in the field of deep-sea sampling.
In order to explore the influence of factors such as indirect displacement, shape and diameter of sampling inlet, Coanda distance, sampling rate and other factors on the displacement effect, the method of numerical simulation combined with synthesis was adopted. In addition, the stratification of the liquid density and temperature in the cavity with different sampling rates is also discussed. Based on the above theoretical research combined with the sea trials in the South China Sea, the following conclusions are drawn.
(1) The displacement phenomenon is mainly affected by the jet flow. The main factors affecting the jet phenomenon are the Reynolds number and the density Froude number. When the sample enters the sampling chamber from the inlet on the lower side of the sampling chamber, when the liquid front of the sample contacts the inner wall of the chamber, a reverse flow occurs, and a layering phenomenon occurs with the pre-filled water. During the displacement process, the liquid interface continued to rise, until the pre-stored water in the lower sampling chamber was widely displaced, and the sample began to leave the sampling outlet, and the pre-filled water in the lower sampling chamber could basically be successfully displaced. After increasing the sampling inlet flow rate, the sample water began to enter the upper sampling cavity from the lower sampling cavity very early, and the displacement rate was significantly improved.
(2) With the displacement rate of 0.5 and 0.75 bit nodes, compared with single displacement, when the inlet velocity of the sampling channel is 0.044m/s, using the method of multiple displacement, the attenuation of the displacement curve is delayed, and the displacement effect improve. When the sampling inlet velocity is 0.1m/s and 0.2m/s, the effect of single flooding is ahead of that of multiple flooding. Therefore, in low-speed sampling, multiple displacements can improve the displacement effect. In high-speed sampling, single displacement is appropriate, and the occurrence of displacement discontinuities should be avoided.
(3) The displacement calculation is carried out for different distances between the sampling inlet and the upper and lower walls of the sampling cavity. The results show that, according to the principle of clinging wall jets, making the sampling inlet as close as possible to and close to the inner wall of the sampling cavity can strengthen the jet to improve the displacement efficiency.
(4) The influence of sampling inlet and outlet diameter on displacement efficiency is basically consistent with the trend of inlet flow rate. The rectangular sampling inlet and outlet can slightly improve the displacement efficiency. In comparison, the circular sampling inlet and outlet have the lowest displacement efficiency. However, considering the overall design, sealing and coordination of the mechanism, the circular sampling inlet and outlet are still the choice in most cases.
(5) When the sample enters the sampling chamber, it will be entrained and mixed with the pre-filled water. Impairing the entrainment and mixing of the liquid in the sampling cavity during the sampling process is the focus of displacement. The velocity of the liquid in the cavity on the vertical section is semi-Gaussian distribution. In low Reynolds number jets, vertical admixture dominates. With the increase of the Reynolds number, the negatively buoyant jet becomes stronger, the lateral mixing begins to dominate, the entrainment and mixing phenomena increase, and the mixing area increases. But in the displacement stable zone, the stratification is relatively uniform. With the increase of the sampling inlet velocity, the jet flow becomes stronger with the increase of the Reynolds number, the thickness of the mid-liquid layer and the thermocline gradually increases, and the liquid mixing area increases.
The original contributions presented in the study are included in the article/supplementary material. Further inquiries can be directed to the corresponding author.
HH was in charge of the whole project. YF wrote the manuscript and participated in the sea trials. DC and YD provided the platform and support for the sea trial. All authors contributed to the article and approved the submitted version.
Key Special Project for Introduced Talents Team of Southern Marine Science and Engineering Guangdong Laboratory (Guangzhou) (GML2019ZD0506) from Southern Marine Science and Engineering Guangdong Laboratory (Guangzhou), 511458; Research on Integrated Technology of Deep-sea in-situ Filtration and Fidelity Sampling (2021Szvup013) from Shenzhen Research Institute of Dalian Maritime University
We are grateful to Professor Jiawang Chen and his students for their help in the experiment. I would also like to thank Guangzhou Marine Geological Survey (GMGS) for their help, and the support of Key Special Project for Introduced Talents Team of Southern Marine Science and Engineering Guangdong Laboratory (Guangzhou) (GML2019ZD0506) from Southern Marine Science and Engineering Guangdong Laboratory (Guangzhou), 511458, and Research on Integrated Technology of Deep-sea in-situ Filtration and Fidelity Sampling (2021Szvup013) from Shenzhen Research Institute of Dalian Maritime University.
The authors declare that the research was conducted in the absence of any commercial or financial relationships that could be construed as a potential conflict of interest.
All claims expressed in this article are solely those of the authors and do not necessarily represent those of their affiliated organizations, or those of the publisher, the editors and the reviewers. Any product that may be evaluated in this article, or claim that may be made by its manufacturer, is not guaranteed or endorsed by the publisher.
Burridge H. C., Hunt G. R., He Z. (2017). From free jets to clinging wall jets: The influence of a horizontal boundary on a horizontally forced buoyant jet. Phys. Rev. Fluids 2 (2), 1–20. doi: 10.1103/PhysRevFluids.2.023501
Edgcomb V. P., Taylor C., Pachiadaki M. G., Honjo S., Engstrom I., Yakimov M. (2016). Comparison of niskin vs. in situ approaches for analysis of gene expression in deep Mediterranean Sea water samples. Deep Sea Res. Part II. 129, 213–222. doi: 10.1016/J.DSR2.2014.10.020
Fan W., Pan H. C., Chen Y. (2010). Mechanism of high-performance liquid-liquid displacement for deep-sea sensor chamber. J. Mech. Eng. 46 (4), 143–149. doi: 10.3901/JME.2010.04.143
Gao W. F. (2018). A study on the turbulence generation mechanism of transitional fountains in linearly stratified fluid and its application. [dissertation/doctoral thesis] (Kunming: Yunnan Normal University).
Hou G. L., Wu B. W., Chu D. Z., He J., Wang X. P., Liu Y. (2015). Design of the in-situ hydrophore for the bottom water oil samples. Ocean Technol. 34 (5), 53–57. doi: CNKI:SUN:HYJS.0.2015-05-010
Jin H. J. (2019). Design and research of pressure-retaining pollution-preventing sampler at deep-sea. [dissertation/master’s thesis] (Zhoushan: Zhejiang University).
Junichi M., Akiko M., Yohei M., Naoya E., Saki T., Jun-Ichiro I., et al. (2017). WHATS-3: An improved flow-through multi-bottle fluid sampler for deep-Sea geofluid research. Front. Earth Sci. 5. doi: 10.3389/feart.2017.00045
Li Q. (2021). Study on the flow behavior of fountains and the mixing characteristics in a thermally stratified water tank. [dissertation/doctoral thesis] (Kunming: Yunnan Normal University).
Li L., Chai Y. S., Yin S. M., Liu X. K., Wang Q., Liu Y. H., et al. (2019). Structural design and analysis of a modular deep-sea sampling device. J. Yantai Univ. (Natural Sci. Eng. Edition) 32 (4), 357–361. doi: 10.13951/j.cnki.37-1213/n.2019.04.010
Li X. F., Jiang Q. L., Gai Z. P., Wang L., Song W. J., Wang J. Y. (2018). Design and performance research on deep-sea plankton sampler with concentrated and gas-tight function. Chin. Hydraulics Pneumatics 8, 27–32. doi: 10.11832/j.issn.1000-4858.2018.08.006
Liu H. (2019). Research on structure design and sealing technology of full-ocean-depth pressure-retaining water sampler. [dissertation/master’s thesis] (Zhoushan: Zhejiang University).
Liu G. H., Lu C., Zhao H. Y., Liu J. Y., Liu Z. R., He Z., et al. (2018). Design improvement and Sea test about In situ pore water sampler system for deep-Sea sediments. Adv. Geosci. 8 (1), 141–151. doi: 10.12677/ag.2018.81015
Merwe P., Trull T. W., Goodwin T., Jansn P., Bowie A. (2019). The autonomous clean environmental (ACE) sampler: A trace-metal clean seawater sampler suitable for open-ocean time-series applications. Limnol. Oceanogr. Methods 17 (9), 490–504. doi: 10.1002/lom3.10327
Niu W. D., Yang F. (2012). Experimental research on the tightness of a gas-tight sampler in high-pressure chamber. Dev. Innovation Machinery Electrical. 25 (3), 132–134. doi: 10.3969/j.issn.1002-6673.2012.03.053
Okamura K., Noguchi T., Hatta M., Sunamura M., Suzue T., Kimoto H., et al. (2013). Development of a 128-channel multi-water-sampling system for underwater platforms and its application to chemical and biological monitoring. Methods Oceanogr. 8, 75–90. doi: 10.1016/j.mio.2014.02.001
Pokharel P., Acharya S. (2021). Dynamics of circular and rectangular jets in crossflow. Comput. Fluids 230, 105111. doi: 10.1016/j.compfluid.2021.105111
Saegusa S., Tsunogai U., Nakagawa F., Kaneko S. (2006). Development of a multibottle gas-tight fluid sampler WHATS II for Japanese submersibles/ROVs. Geofluids 6 (3), 234–240. doi: 10.1111/j.1468-8123.2006.00143.x
Sattley W. M., Burchell B. M., Conrad S. D., Madigan M. T. (2017). Design, construction, and application of an inexpensive, high-resolution water sampler. Water 9 (8), 578. doi: 10.3390/w9080578
Seewald J. S., Doherty K. W., Hammar T. R., Liberatore S. P. (2002). A new gas-tight isobaric sampler for hydrothermal fluids. Deep Sea Res. Part I. 49 (1), 189–196. doi: 10.1016/S0967-0637(01)00046-2
Wang H. Z., Qin H. W., Yang C. J., Chen Y. (2010). Fatigue life of PEEK poppet for deep-sea hydrothermal fluid sampling valve. J. Zhejiang Univ. (Eng. Sci.) 44 (1), 14–18. doi: 10.3785/j.issn.1008-973X.2010.01.003
Wu S. H., Liu T. Q., Bian R. G., Zhang Z. (2021). Research on the form of wedge seals of deep-sea sediment samplers. J. Ship Mechanics 25 (5), 652–658. doi: 10.3969/j.issn.1007-7294.2021.05.014
Wu S. J., Wang S., Yang C. J. (2018). Collection of gas-tight water samples from the bottom of the challenger deep. J. Atmos. Oceanic Technol. 35 (4), 837–844. doi: 10.1175/JTECH-D-17-0170.1
Wu S. J., Yang C. J., Ding K., Tan C. Y. (2015). A remotely operated serial sampler for collecting gas-tight fluid samples. China Ocean Eng. 29 (5), 783–792. doi: 10.1007/s13344-015-0055-6
Xin Y. J., Guo L., Guo T., Di Y. J., Li Z. J. (2018). Numerical simulation and optimum design of stratified water harvester under ice. J. Eng. Heilongjiang University 9 (1), 78–83. doi: 10.13524/j.2095-008x.2018.01.014
Keywords: deep sea, marine, seawater sample, displacement4, jet
Citation: Fang Y, Chen D, Deng Y and Huang H (2022) Analysis of influencing factors on displacement sampling performance of deep-sea gas-tight sampler. Front. Mar. Sci. 9:1075446. doi: 10.3389/fmars.2022.1075446
Received: 20 October 2022; Accepted: 22 November 2022;
Published: 12 December 2022.
Edited by:
Zhilei Sun, Qingdao Institute of Marine Geology (QIMG), ChinaReviewed by:
Yongping Jin, Hunan University of Science and Technology, ChinaCopyright © 2022 Fang, Chen, Deng and Huang. This is an open-access article distributed under the terms of the Creative Commons Attribution License (CC BY). The use, distribution or reproduction in other forums is permitted, provided the original author(s) and the copyright owner(s) are credited and that the original publication in this journal is cited, in accordance with accepted academic practice. No use, distribution or reproduction is permitted which does not comply with these terms.
*Correspondence: Haocai Huang, aGNodWFuZ0B6anUuZWR1LmNu
Disclaimer: All claims expressed in this article are solely those of the authors and do not necessarily represent those of their affiliated organizations, or those of the publisher, the editors and the reviewers. Any product that may be evaluated in this article or claim that may be made by its manufacturer is not guaranteed or endorsed by the publisher.
Research integrity at Frontiers
Learn more about the work of our research integrity team to safeguard the quality of each article we publish.