 Yebao Wang
 Peipei Du2
- 1School of Ocean, Yantai University, Yantai, China
- 2Weifang University, Weifang, China
- 3The College of Chinese and Law, Yantai Institute of Technology, Yantai, China
Due to their position at the land–sea interface, coastal wetlands are extremely vulnerable to oil spills. However, few studies have focused on the vulnerability of coastal wetlands to oil spill hazards. In this study, we developed a spatial vulnerability approach and assessment based on the vulnerability scoping diagram in the Chinese Bohai Sea, where oil spill events are serious and frequent, and aimed to assess the spatial heterogeneity of the vulnerability of coastal wetlands under oil spill stress by integrating various indicators for exposure, sensitivity, and adaptive capacity into a composite index. This study normalized and aggregated data across sub-indices and combined related information with a geographic information system (GIS) model. The weighted results indicated that oil spill sources, as well as the natural environment in which the wetlands were located, dominated the degree of vulnerability of various coastal wetlands. The vulnerability assessment results suggest that there are obvious spatial variations among the different wetlands surrounding the Bohai Sea and each wetland had a different level of vulnerability, and highlights the need to enhance adaptive capacity to reduce vulnerability. This paper provides a quantitative assessment method for determining the spatial variation of coastal wetland vulnerability under oil spill stress, which can be used to better understand potential oil spill risks in coastal wetlands to support spill prevention and improve response readiness in the future.
1. Introduction
Coastal wetlands commonly include mangroves, salt marshes, seagrass, coral reefs, estuaries, and coastal water bodies with depths of 6 m or less (Ramsar Convention Secretariat, 2010). They play an irreplaceable role in supporting bioproductivity, habitat provision, carbon sequestration, coastal protection (Li et al., 2018), climate regulation (Crooks et al., 2011), the promotion of siltation (Yuan et al., 2022), and preventing damage caused by coastal disasters, such as floods and tropical cyclones (Narayan et al., 2017; Sun and Carson, 2020). However, due to strong sea–land interactions, coastal wetland environments are suffering from unprecedented levels of disturbance. In China, coastal wetlands lost 8.01 × 10⁶ ha from 1950 to 2014, with a total loss rate of 58.00% (Sun et al., 2015), which could cause a series of problems such as flooding and storm damage, fishery structure change, and biodiversity loss (Li et al., 2018). It is particularly noteworthy that the frequent occurrence of marine oil spill accidents has caused coastal wetlands to be under enormous ecological pressure, leading to reduced biodiversity and habitat degradation, resulting in long-term toxic effects, and posing a serious threat to wetland ecosystems (Mendelssohn et al., 2012).
Understanding the vulnerability of coastal wetlands under oil spill stress is of great significance for wetland ecosystem conservation. Over the past few decades, various ecological vulnerability assessment frameworks have been proposed, such as the oil vulnerability index (OVI), environmental sensitivity index (ESI), vulnerability of marine ecosystems (VME), regional vulnerability assessment (ReVA), ecological vulnerability analysis (EVA), and vulnerability scoping diagram (VSD). Extensive research focusing on the vulnerability assessment has been conducted using the above framework (Bhowmik, 2022), especially in the areas of global warming and sea level rise impact on coastal wetlands (Thorne et al., 2018; Kåresdotter et al., 2021). By contrast, relatively fewer studies have been conducted on the vulnerability of coastal wetlands under oil spill stress. Nonetheless, this problem also needs attention for the following reasons (Nelson and Grubesic, 2018): (1) offshore oil transportation and mining activities are becoming increasingly frequent, and the amount of oil used for production and transportation is increasing; (2) oil and gas operations are high-risk industries, and the uncertainty of marine environments will greatly increase such risks; (3) once a marine oil spill occurs, it is difficult to control and will obviously aggravate the ecological pressure on adjacent wetland systems; and (4) oil spill disasters occur frequently all over the world, and their destructiveness is difficult to predict. Hence, it is necessary to assess the potential impact of oil spills on coastal wetlands and formulate reasonable emergency strategies in advance.
Vulnerability assessment aims to use composite indices to provide critical information for policymakers as to why certain regions are more vulnerable to disturbance than others (Jha and Gundimeda, 2019), indicating that the spatial characteristics of vulnerability for different wetlands under oil spill stress are not spatially homogeneous. The Chinese Bohai Sea is one of the busiest sea areas in China, with frequent oil spill accidents (Liu et al., 2015; Wang et al., 2018a), resulting in coastal wetland exposure to large oil spill risks, and its vulnerability is particularly worthy of attention. Therefore, from the perspective of spatial pattern differentiation, this paper took the Bohai Sea as a case study, focused on the spatial heterogeneity of coastal wetland vulnerability under oil spill stress to understand the spatial variation of coastal wetland vulnerability once spills occur, and put forward practical and effective countermeasures, which will help ensure the ecological security of coastal wetlands and provide a scientific basis for wetland conservation, as well as support for policymakers in drafting coastal wetland protection laws.
2. Data and methods
2.1. Study area
Geographically, the Bohai Sea consists of Liaodong Bay, Bohai Bay, Laizhou Bay, and the central part of the Bohai Sea, and it is connected to the outer sea through the Bohai Strait (Figure 1A). There are multiple contiguous coastal wetlands along the Bohai Sea coasts, including coastal swamp, coastal marsh, lagoon, estuarine water, tidal flat, and shallow marine water. Recently, researchers have obtained the spatial distribution of these wetlands through remote sensing (Mao et al., 2020; Sun et al., 2020a). There are only a few differences in details. In this study, the wetland data provided by Sun (Sun et al., 2020a) were used, which included the Liaohe estuary wetlands in the north of Liaodong Bay and its nearby areas, the northern Bohai Bay wetlands, the western Bohai Bay wetlands, the southern Bohai Bay wetlands, the western Laizhou Bay wetlands, the southern Laizhou Bay wetlands, and the Yellow River Delta wetlands (Figure 1B). There is also a small patch of wetland in the southwest of the Liaodong Peninsula, but due to its small area, this study does not consider it. As a high-risk area for oil spills, this sea area is densely covered with various risk sources, including oil tanks in ports, oil pipelines, oil platforms, and channels for ships (Figure 1C).
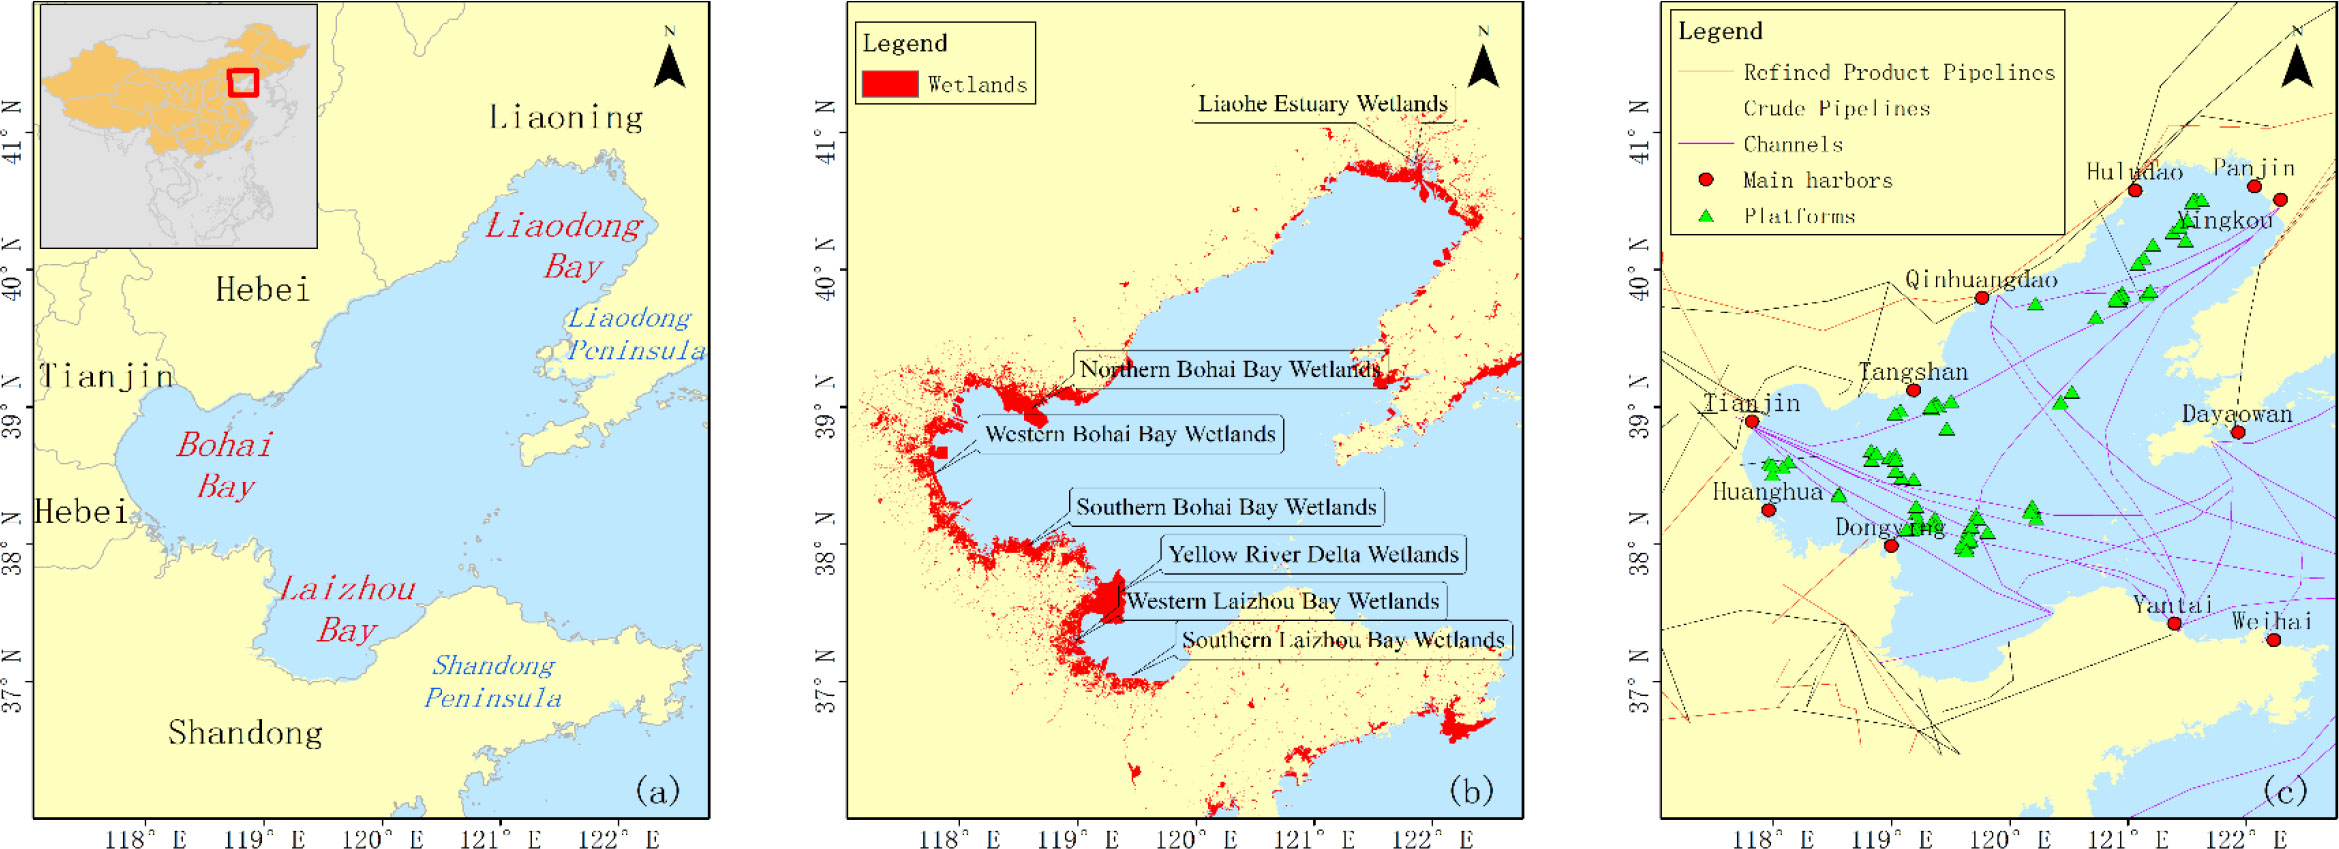
Figure 1 (A) Location of the Chinese Bohai Sea. (B) Wetlands surrounding the Bohai Sea. (C) Oil spill risk sources surrounding the Bohai Sea.
2.2. Assessment indices
VSD is the most commonly used vulnerability assessment framework, which is composed of three elements: exposure, sensitivity, and adaptive capability (Polsky et al., 2007). Based on the VSD vulnerability assessment framework, the vulnerability assessment indicators of coastal wetlands under oil spill stress were systematically decomposed into exposure indices, sensitivity indices, and adaptive capacity indices. The detailed indices are listed and described in Tables 1–3. (1) In this study, the exposure of coastal wetlands under oil spill stress was reflected by the spatial characteristics of various oil spill risk sources. As mentioned above, multiple risk sources are densely distributed in the Bohai Sea (Figure 1C), which greatly increases the risk of coastal wetlands being exposed to oil spills. Five indices that represented oil spill risk sources were included: oil storage tanks built in coastal ports, oil pipelines, offshore oil production platforms, ships, and channels. (2) The sensitivity of coastal wetlands under oil spill stress was reflected by the environmental self-purification capability, which was mainly represented by the natural environment in which the wetlands were located, including the substrate, slope degree, and shoreline tortuosity. (3) The adaptive capacity of coastal wetlands under oil spill stress was reflected by the oil spill response capability, which was represented by the quantity of the corresponding oil spill response equipment stored in harbors. The data were obtained and renewed from a survey for the Maritime Safety Administration (MSA) (Wang et al., 2018a).
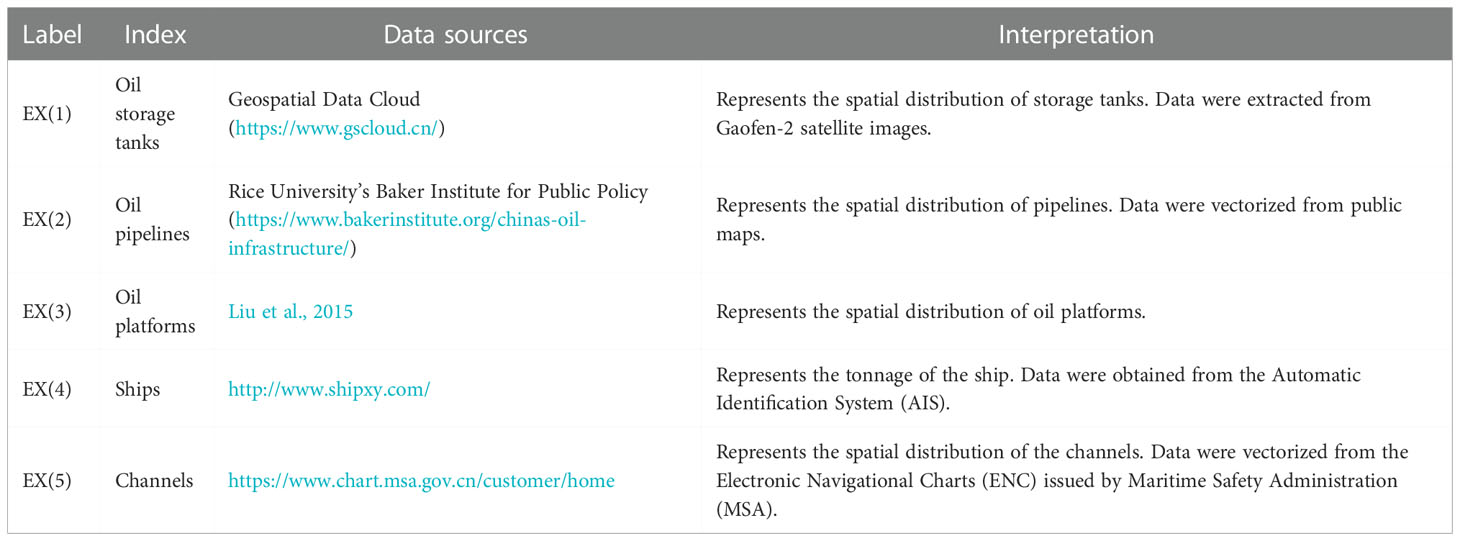
Table 1 Coast wetland oil spill risk exposure indicators.
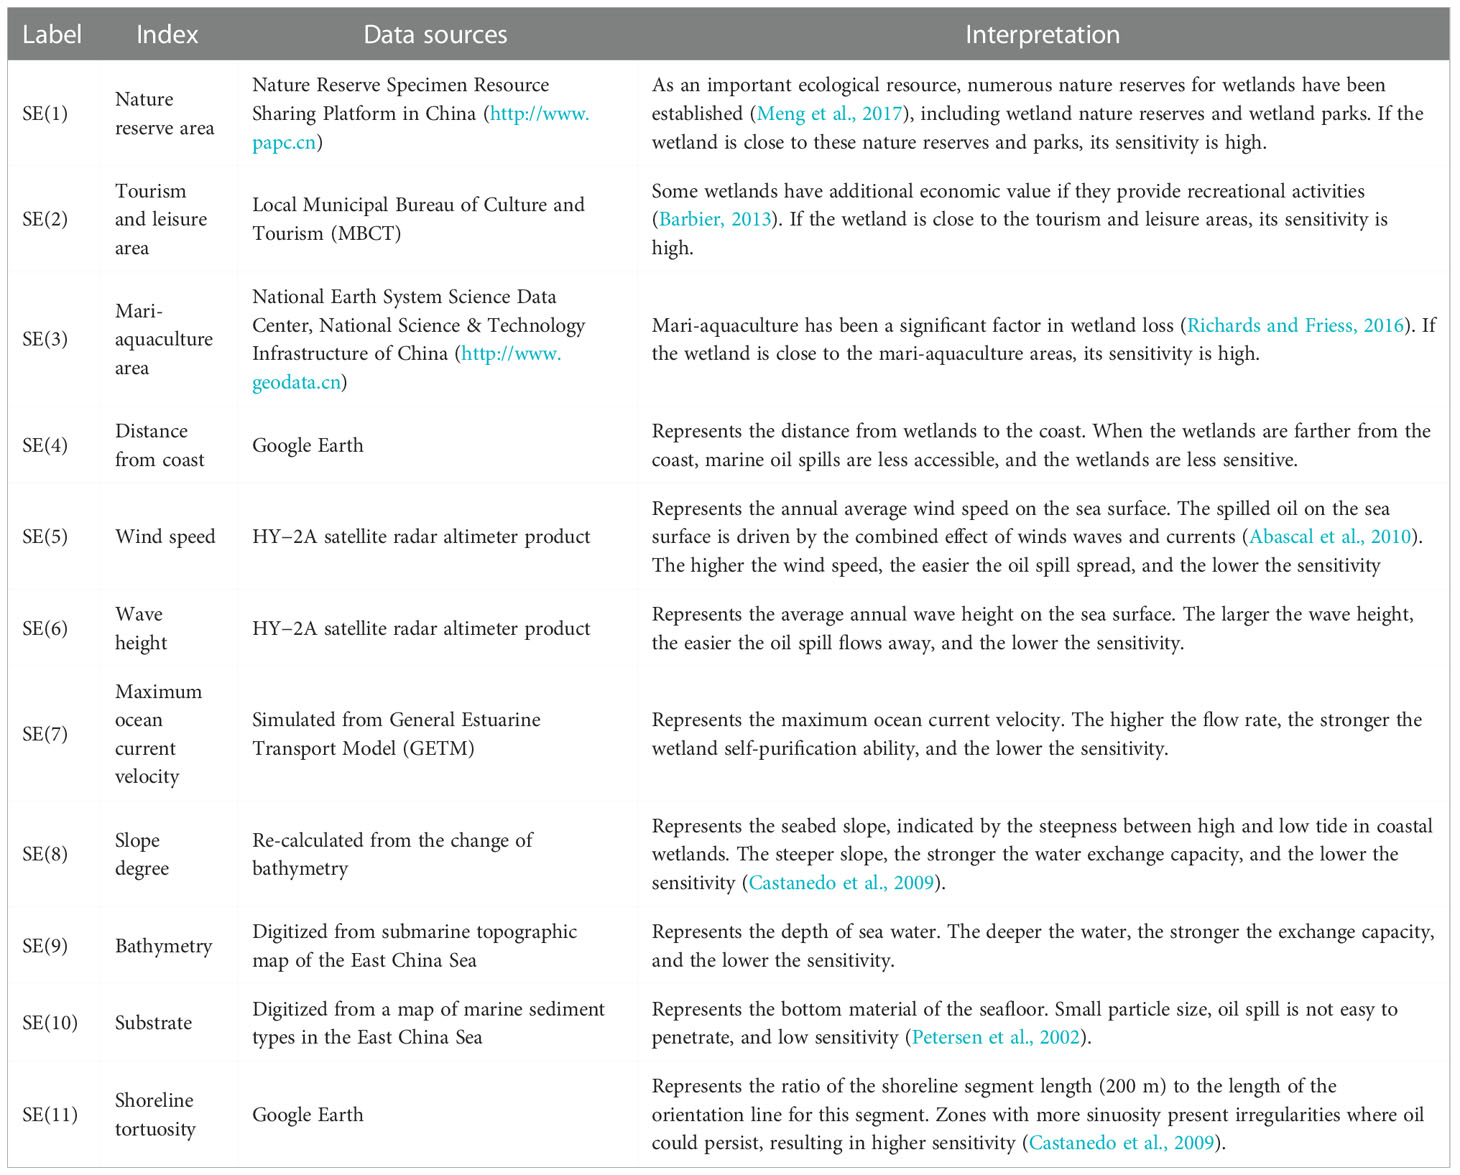
Table 2 Coastal wetland sensitivity indicators.
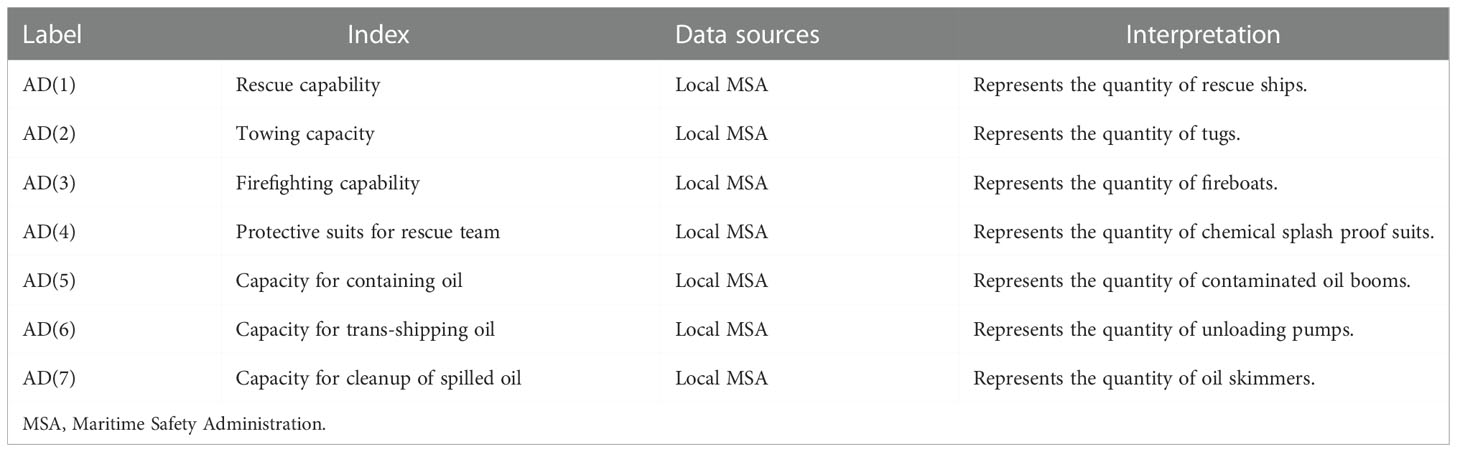
Table 3 Coastal wetland adaptive capacity indicators (renewed from published studies (Wang et al., 2018a; Wang et al., 2018b).
2.3. Assessment methods
2.3.1. Data processing
The influence scope of exposure indicators was determined through buffer analysis in ArcGIS 10.5 software. By referring to the scope of the influence of several past oil spill accidents (the 2010 Dalian Xingang Port oil spill, the 2011 Penglai 19-3 oil spill, and the 2018 Sanchi oil tanker collision), this study took a distance of 35 km as the area affected by oil spills from oil pipelines and oil tanks, took 29 km as the threshold of the area affected by oil spills from platforms, and took 27 km as a rough buffer distance for channel oil spills, with the impact range decreasing gradually from the oil spill site to the periphery. The buffered file was rasterized after buffer analysis. This paper used the uniform sampling method to preprocess the AIS data to ensure maximum data representativeness after sampling for the Bohai Sea in 2018. In view of the large AIS data volume, the data for the first minute of each hour of each day were selected for analysis. Thus, on each day, vessel distributions over a total of 24 min were sampled and documented in a shapefile. Furthermore, the shapefile was rasterized, and the average tonnage value of the ship in each grid was calculated.
For sensitivity indicators, this study assumed a buffer distance of 20 nautical miles, which was the distance from the nature reserve areas, tourism and leisure areas, and mari-aquaculture areas that could be influenced by the spilled oil (Wang et al., 2018b). The distance from the coast, wind speed, wave height, maximum ocean current velocity, slope degree, bathymetry and substrate were stored in point shapefiles, which were directly converted to raster data. For the substrate, this study assumed that the normalized value of clay was 100, the normalized value of silt was 70, the normalized value of fine sand was 50, the normalized value of coarse sand was 20, and the normalized value of sand with gravel was 10 (Wang et al., 2018b). Various buffer distances from 0 to 20 nautical miles were assumed, according to the value of shoreline tortuosity for the coastlines.
For adaptability indicators, each emergency capability was represented by the quantity of the corresponding emergency equipment. To convert spatially discrete data (the distribution of emergency facilities) to spatially continuous data, the inverse distance weighting (IDW) interpolation was used, which assumes that each input point has a local influence that diminishes with distance, and it assigns greater weights to the points closer to the processing cell compared with those farther away.
Rasterized rectilinear grids were constructed using GIS for all indices. Subsequently, to eliminate cross-disciplinarity, the spatially continuous data of all indices were first normalized to prevent dimension and the order of magnitude from affecting the comparison between different indices. The whole domain of the Bohai Sea was overlaid with a raster grid for the convenience of display (Figure 2). For individual indexes, each grid cell in the mesh was 1000 m × 1000 m, and the normalized value for every cell was calculated according to the following equation:
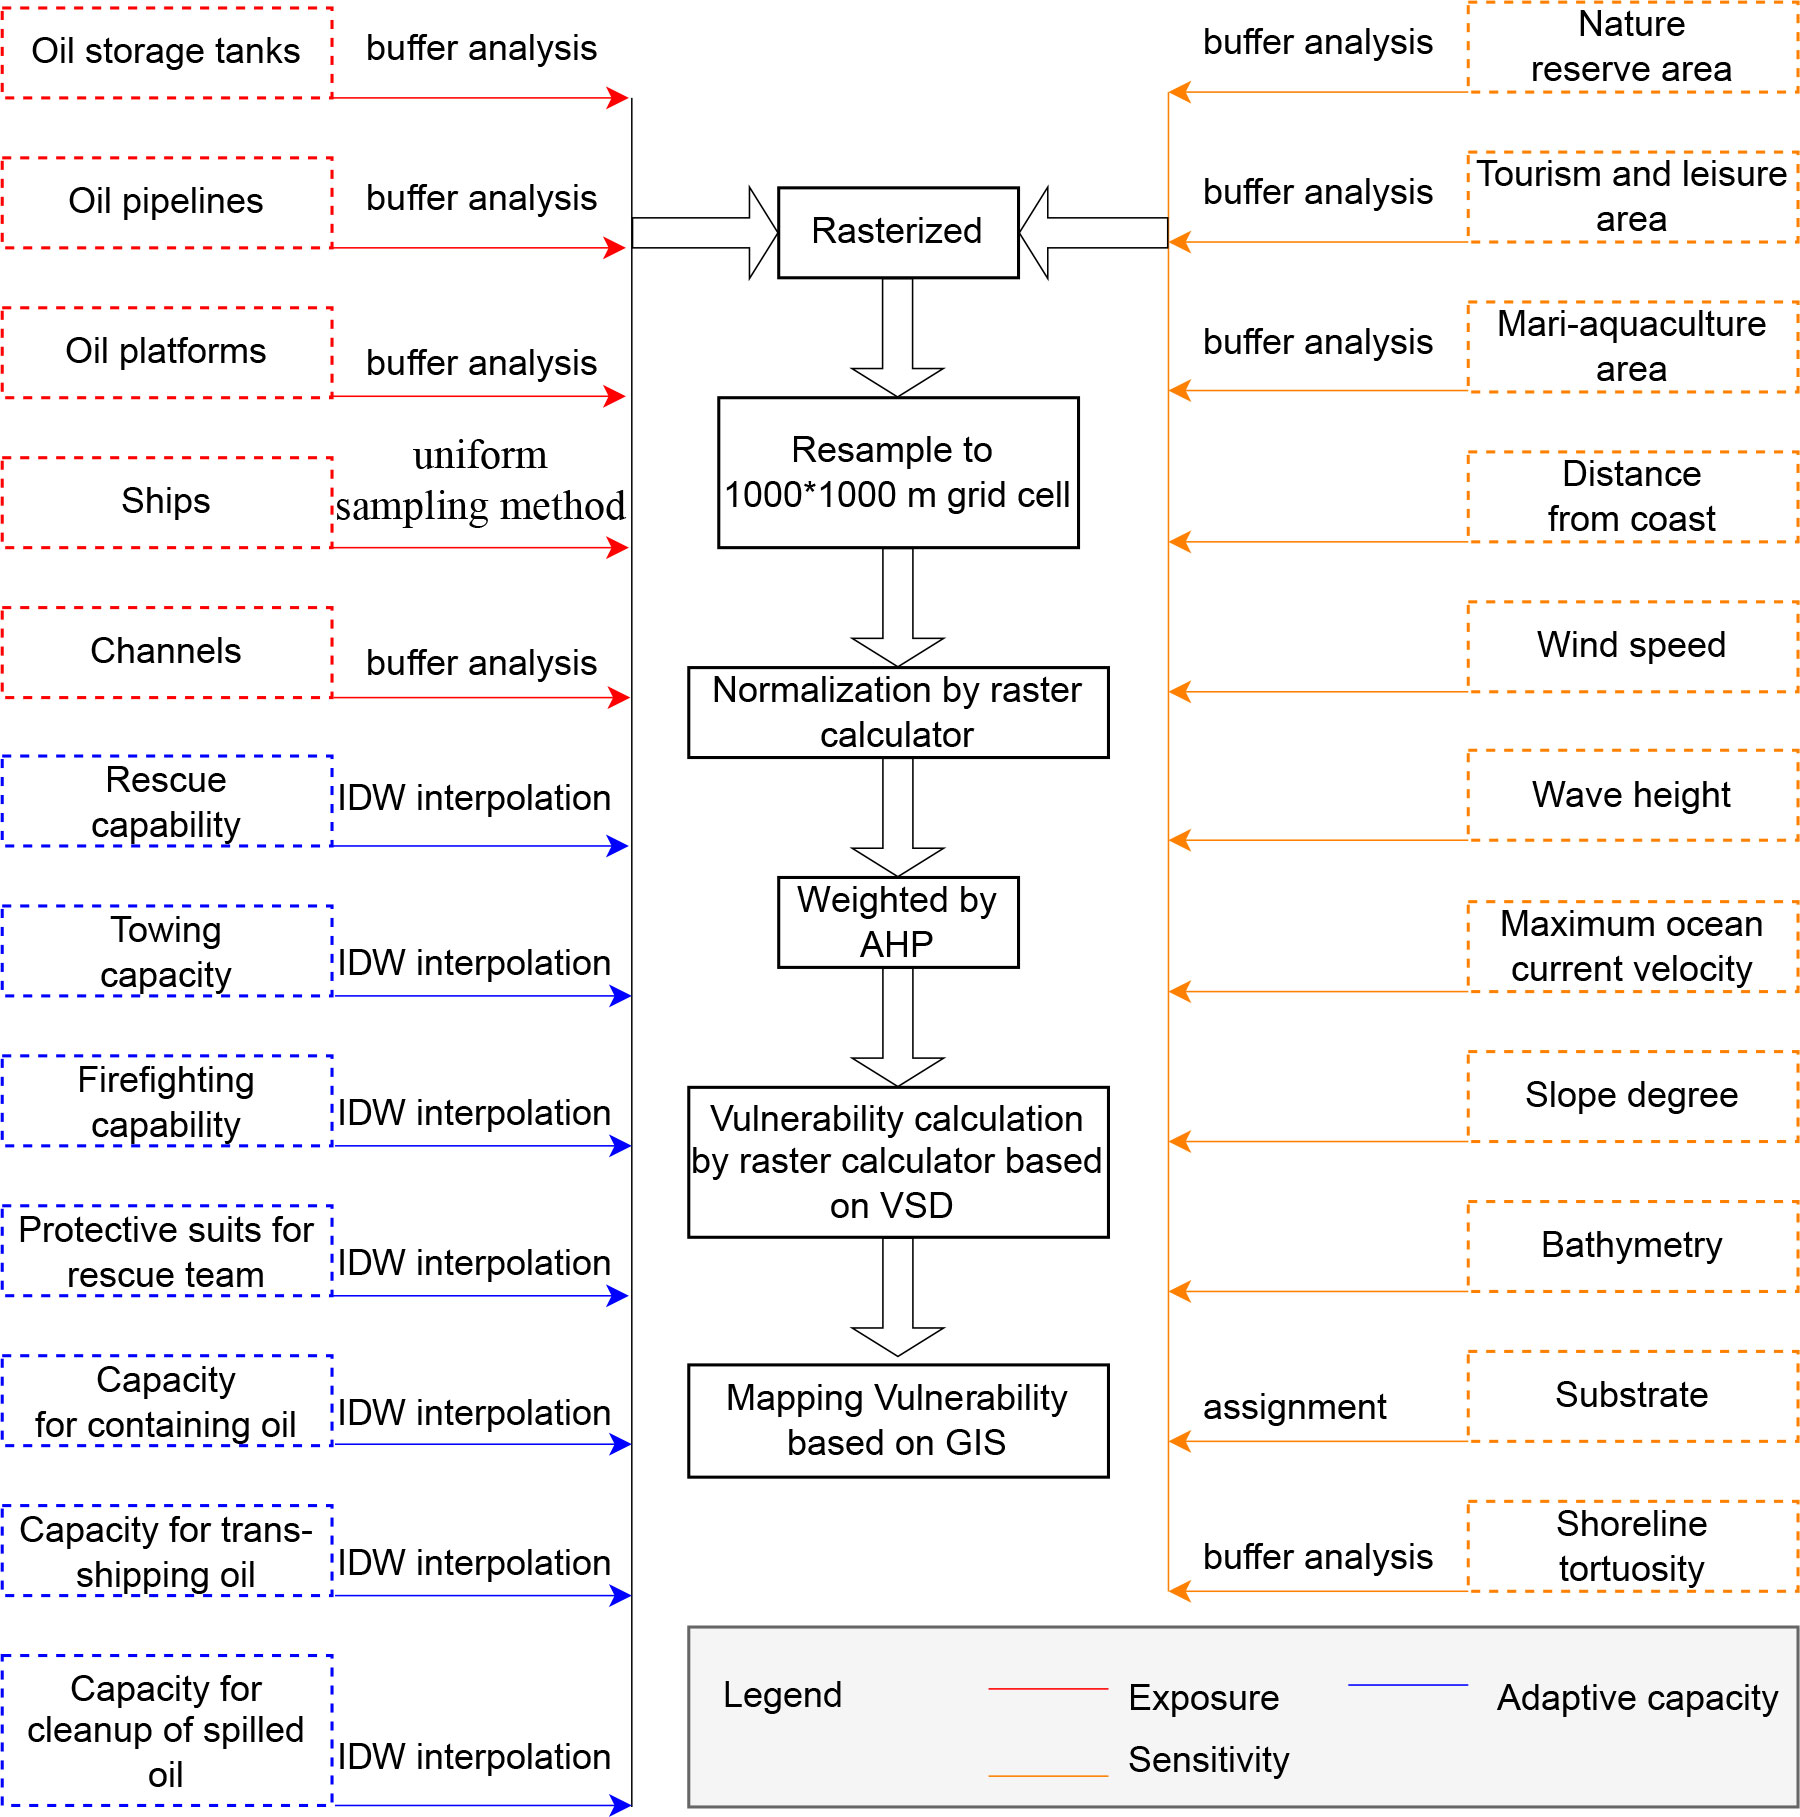
Figure 2 Technology roadmap.
where K is the normalized value, x is the true value of the cell, i represents the identifier of a cell, Min is the minimum value in terms of a specific index, and Max is the maximum value in terms of a specific index.
2.3.2. Weight determination
The weight of each index determined its contribution to the vulnerability of coastal wetlands under oil spill stress. Because of its great flexibility and wide applicability, the analytic hierarchy process (AHP), a weight determination method that has been applied widely and studied extensively over the past 40 years was used to analyze multi-target, multi-criteria complex decisions. Hence, the AHP was used to determine the weight of the indices in this study. The AHP generally includes the establishment of a hierarchical structure, expert evaluation with the purpose of constructing a judgment matrix, a consistency inspection, and the determination of weights at all levels (Zhong et al., 2010; Shabbir and Ahmad, 2016; Song et al., 2017). The main steps in this study are as follows: (1) Classifying the vulnerability analysis problem into three hierarchies; the target layer comprises vulnerability assessment, the criterion layer includes exposure, sensitivity and adaptability, and the index layer contains 23 indicators. (2) An importance comparison is made between every two indices on the same hierarchy through experts’ experiences, and the inverse scaling method is used to create judgment matrices. The maximum eigenvalue of the judgment matrix was determined by the following formula:
where λmax indicates the maximum eigenvalue, A indicates the judgment matrix, W indicates the eigenvector, which represents the needed weights, and n indicates the dimension of the matrix.
(3) Assessing the judgment matrix’s departure from uniformity by using the value of the consistency index (CI):
(4) Consistency inspection for judgment matrix, in order to ensure the consistency of the pairwise comparison matrix.
where RI indicates the random consistency index (Table 4), CR indicates the consistency ratio.
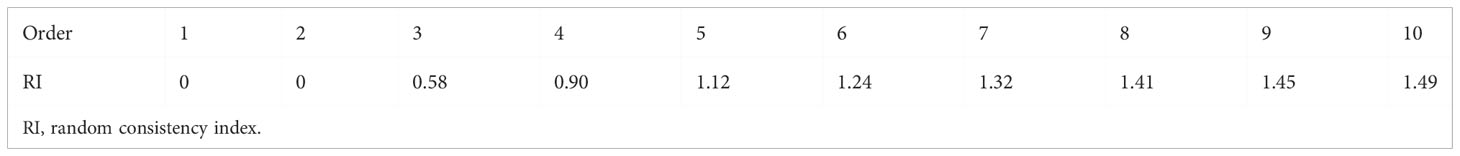
Table 4 RI table values. (Source: Saaty, 1980).
2.3.3. Vulnerability assessment model
An integrated vulnerability assessment model for coastal wetlands under oil spill stress was built based on the gridding technology established above, and in accordance with various index grading criteria and corresponding weights.
where ESA is the value of exposure, sensitivity, or adaptive capacity; n is the number of indices for exposure, sensitivity, or adaptive capacity; Ki is the normalized value of index i; and is the weight of index i. Vulnerability is calculated by the following formula:
where V is vulnerability, E is exposure, S is sensitivity, and A is adaptive capacity.
There is no unified standard for the division of vulnerability. This study divided vulnerability into six grades using the quantile method (Gilchrist, 2000) to facilitate the clear representation of the spatial differentiation of wetlands, as shown in Table 5.

Table 5 Vulnerability spatial variation grading standard.
3. Results
3.1. Synthetic weight
On the basis of the wetland vulnerability assessment indicator system for oil spill stress, three criterion layers and 23 indicators were defined according to AHP. The relationships among the indicators and layers were determined, and were comprised of ratios of the comparative importance of each pair of factors. Judgment matrices were constructed, and consistency inspection was implemented. Finally, the relative weights of all indices were obtained. The calculation results of each index weight are shown in Table 6. The weight results showed that maximum ocean current velocity had the largest contribution to vulnerability, followed by ships and platforms, and firefighting capability had the smallest contribution to vulnerability.
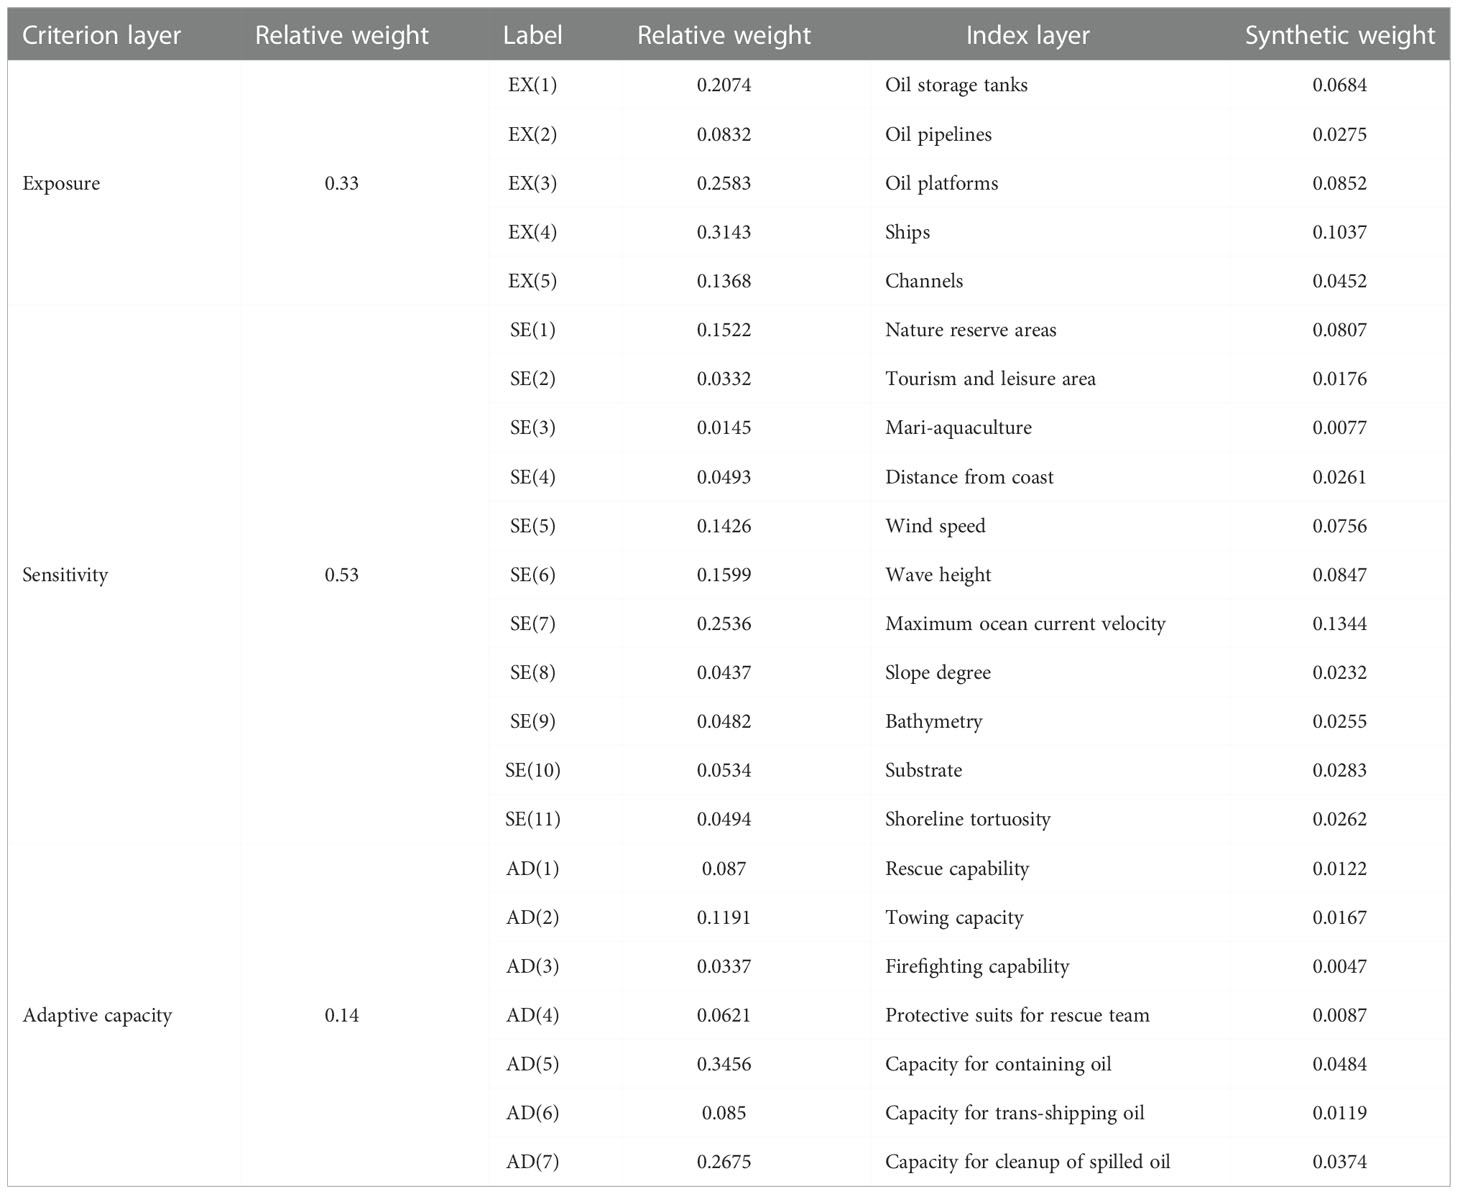
Table 6 Weight distribution of each index.
3.2. Spatial variation of vulnerability
To clearly visualize spatial differences in exposure, sensitivity, and adaptive capacity, this study divided their integrated values into five grades using the quantile method.
3.2.1. Exposure
The spatial patterns of individual indexes for exposure are shown in Figure 3. Based on the integrated spatial pattern of exposure (Figure 4), it was found that most part of Liaohe Estuary wetlands exhibited low exposure; the surrounding area of the northern Bohai Bay wetlands had medium exposure; the western Bohai Bay wetlands had medium exposure; and the southern Bohai Bay wetlands had high expose and extremely high exposure. Overall, the exposure values of the Yellow River Delta wetlands and almost all Laizhou Bay wetlands were extremely low.
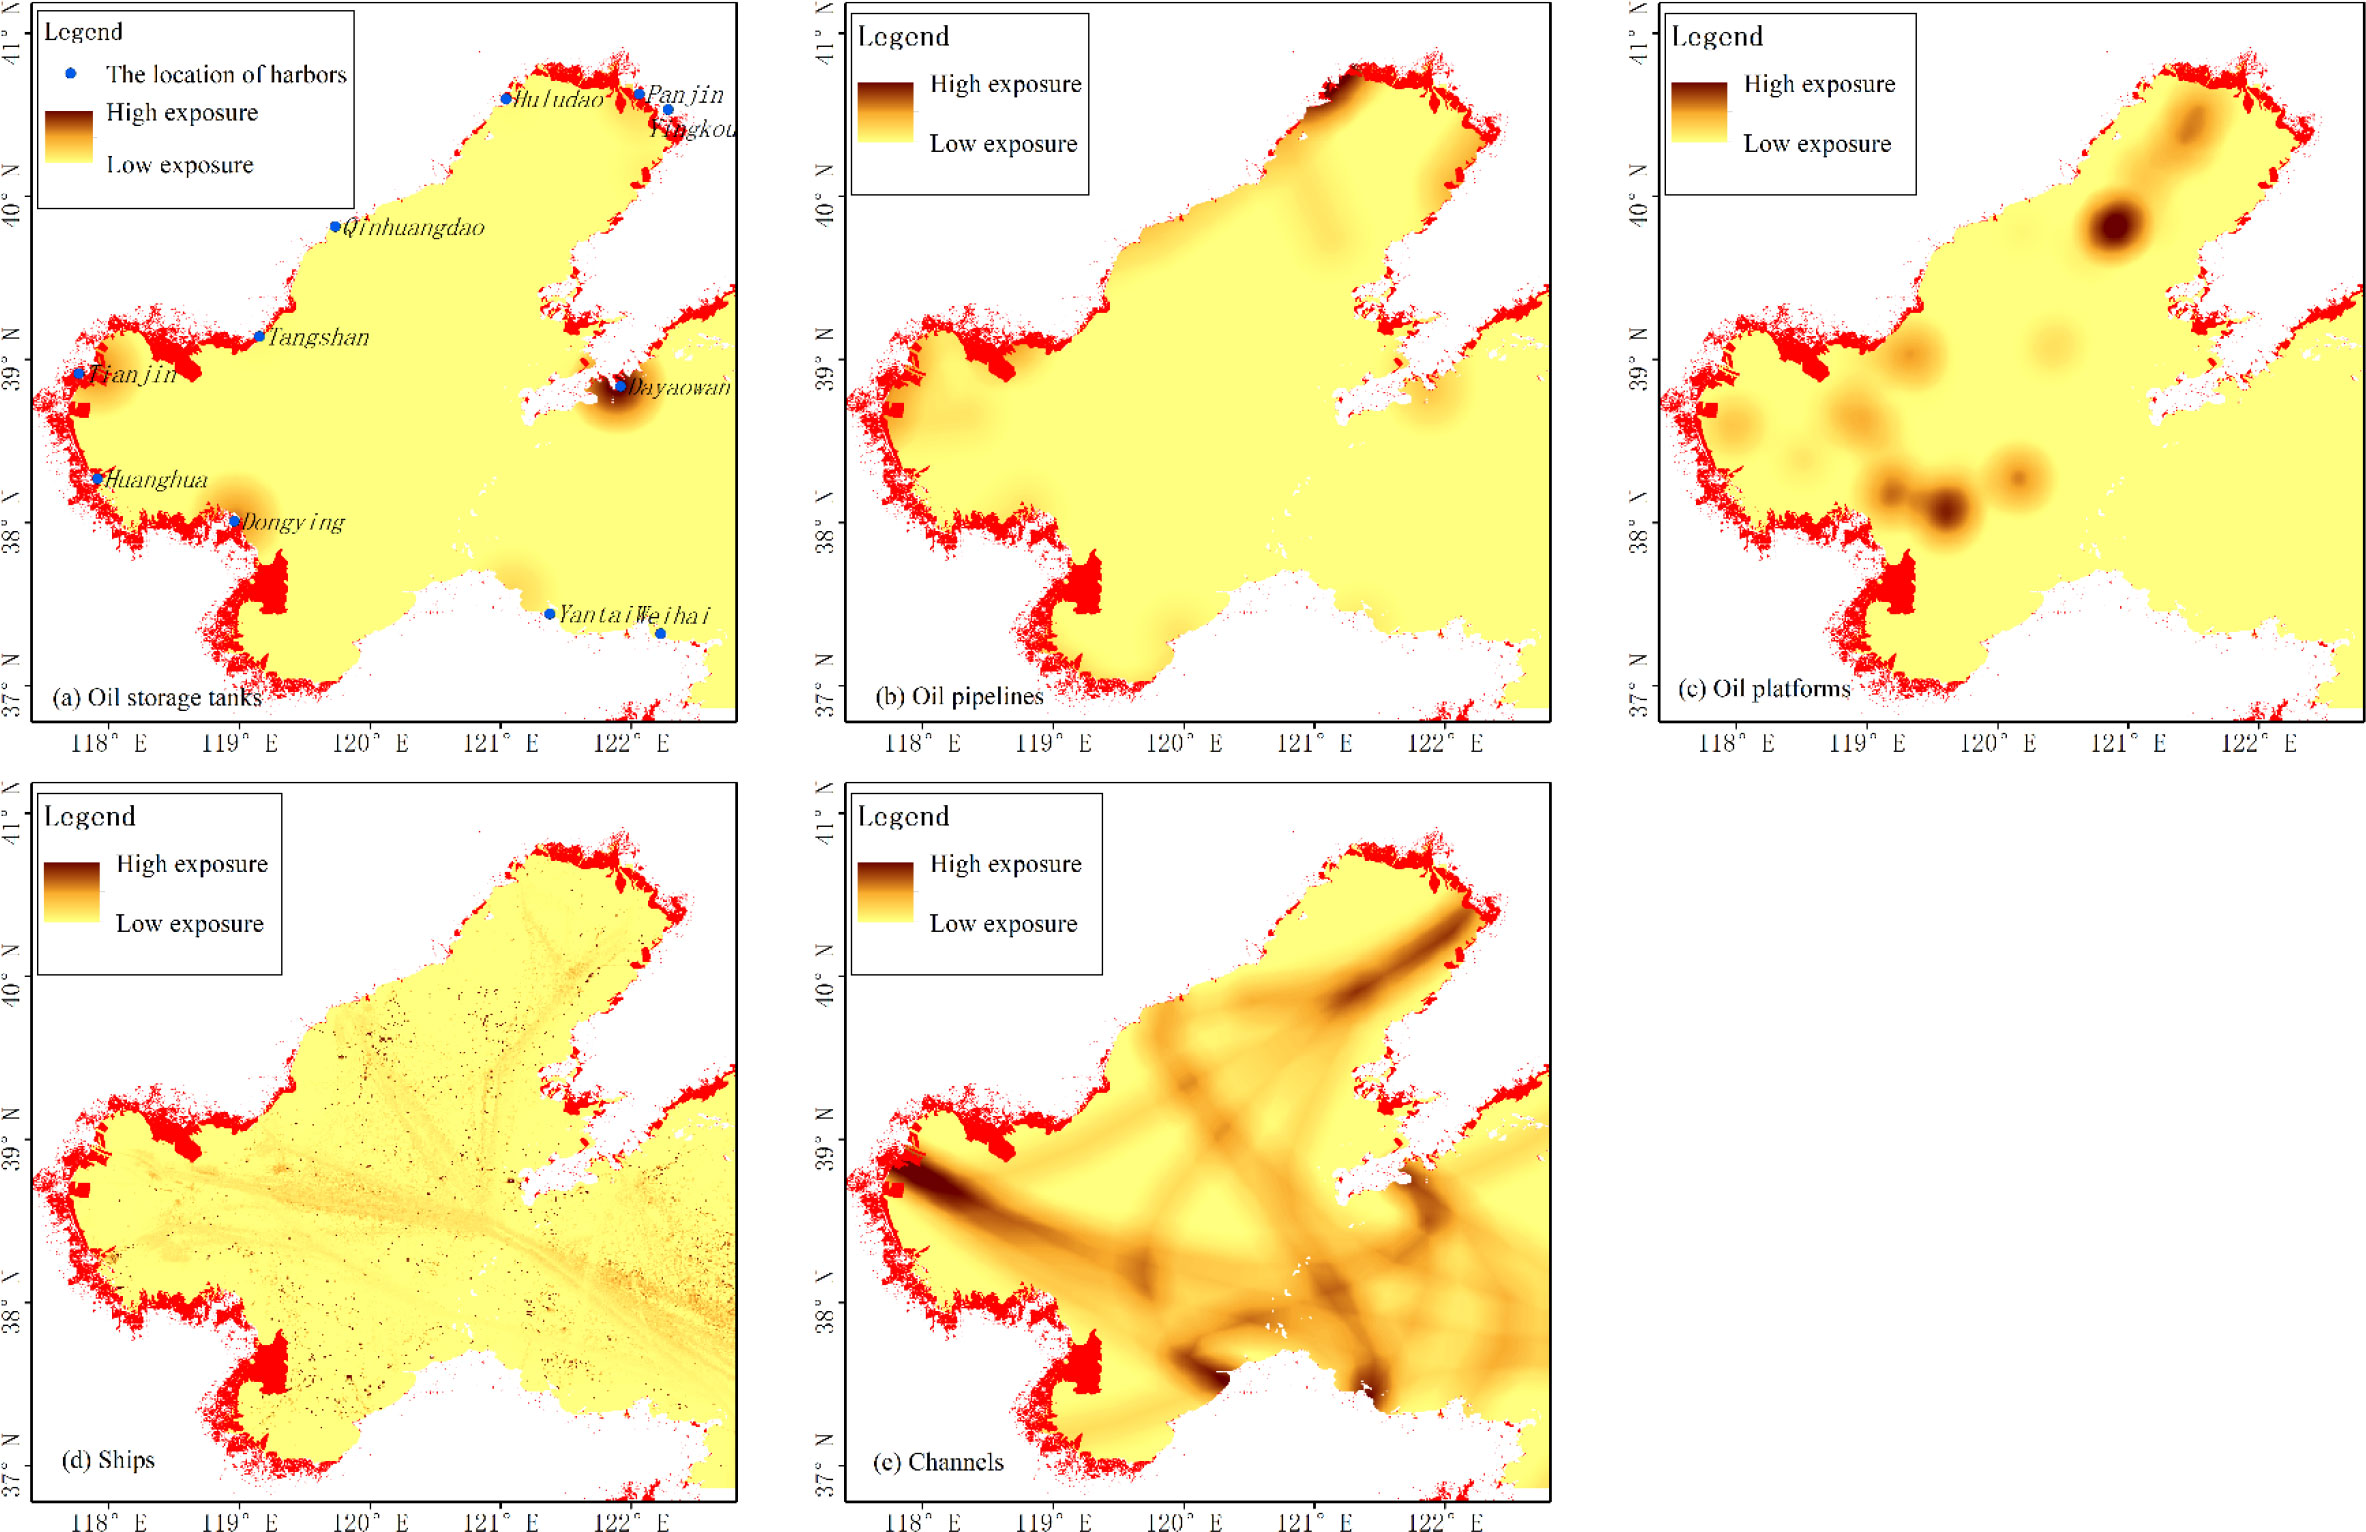
Figure 3 Visualization of exposure indices. The light-toned areas indicate low exposure, while the dark-toned areas indicate high exposure.
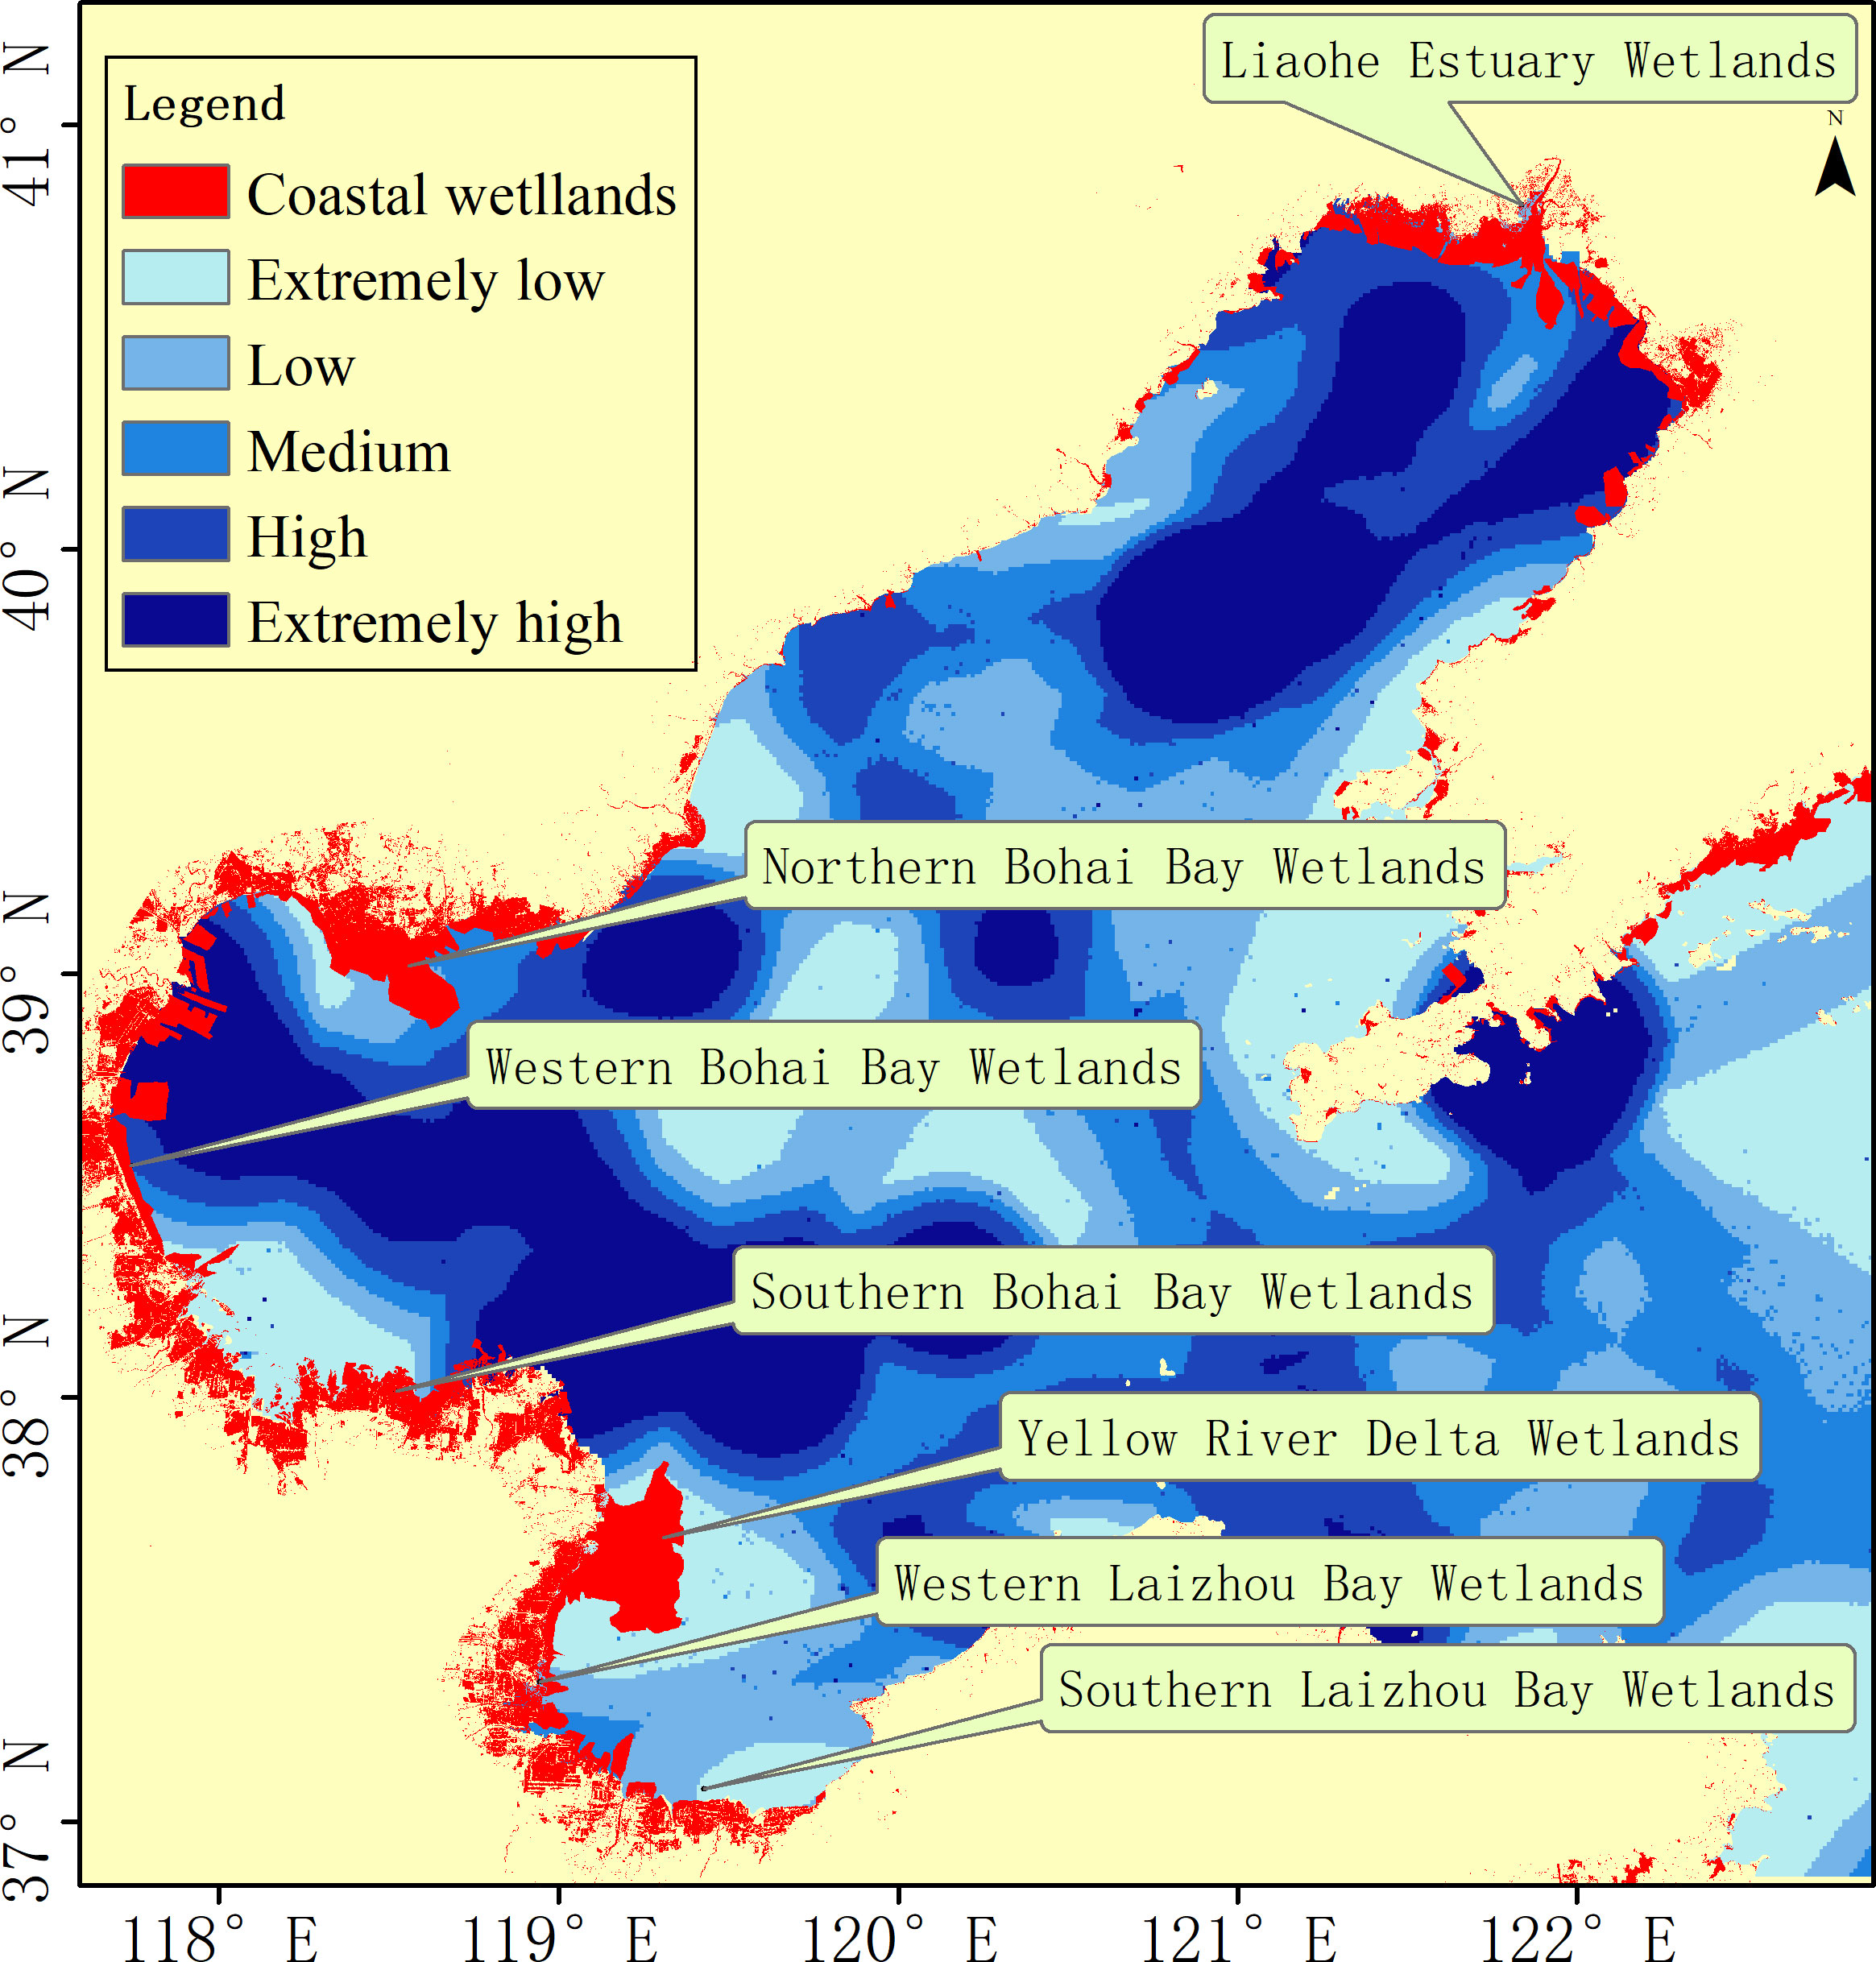
Figure 4 Spatial variation of integrated exposure of coastal wetlands.
3.2.2. Sensitivity
After GIS spatial analysis and visual expression, the sensitivity of coastal wetlands for each individual index was identified based on variations in color tone (Figure 5). Using weighted calculation and spatial overlaying analysis, the sensitivity from the comprehensive action of multiple indices was obtained, and the integrated sensitivity spatial pattern of coastal wetlands under oil spill stress was found (Figure 6), which was represented through the hue of sea area near the coastal wetlands. From the spatial pattern of integrated sensitivity, it was found that the Liaohe Estuary wetlands, the wetlands in the northern part of Bohai Bay, and the northern Yellow River Delta wetlands showed extremely high sensitivity. Comparatively, the southern Yellow River Delta wetlands, the southern and western Bohai Bay wetlands, and the wetlands around the Laizhou Bay showed high sensitivity.
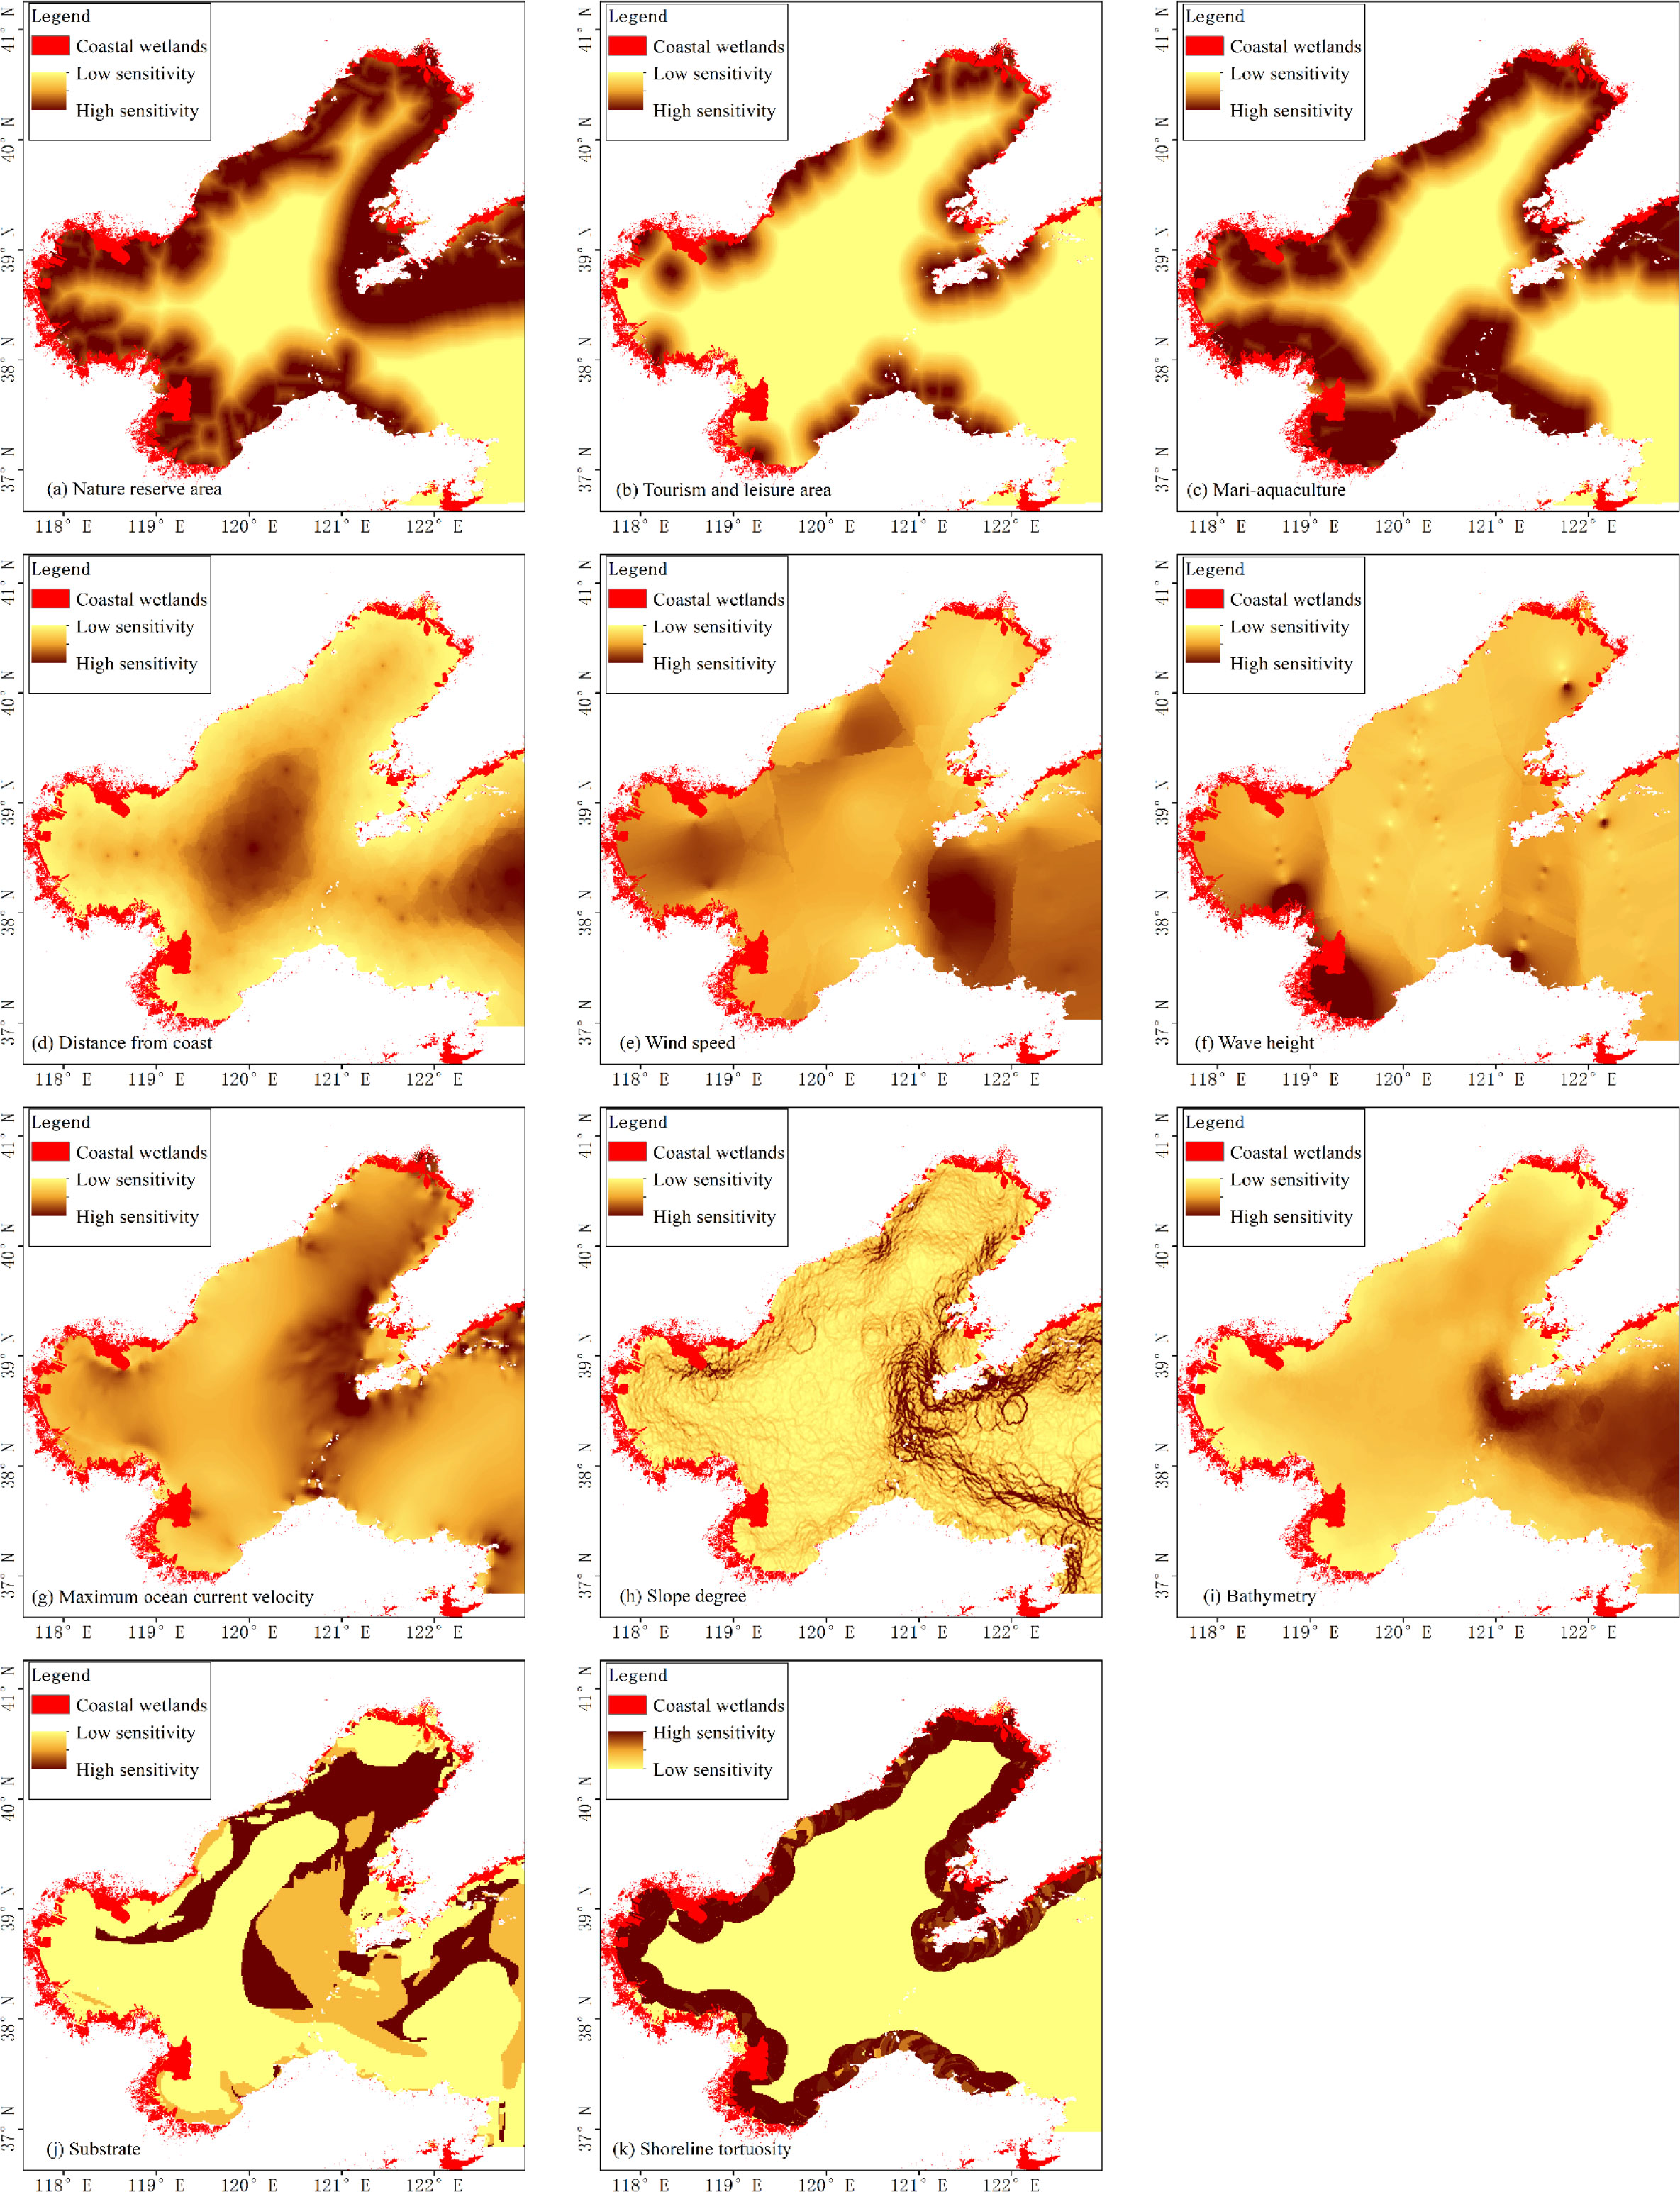
Figure 5 Visualization of sensitivity of indices.
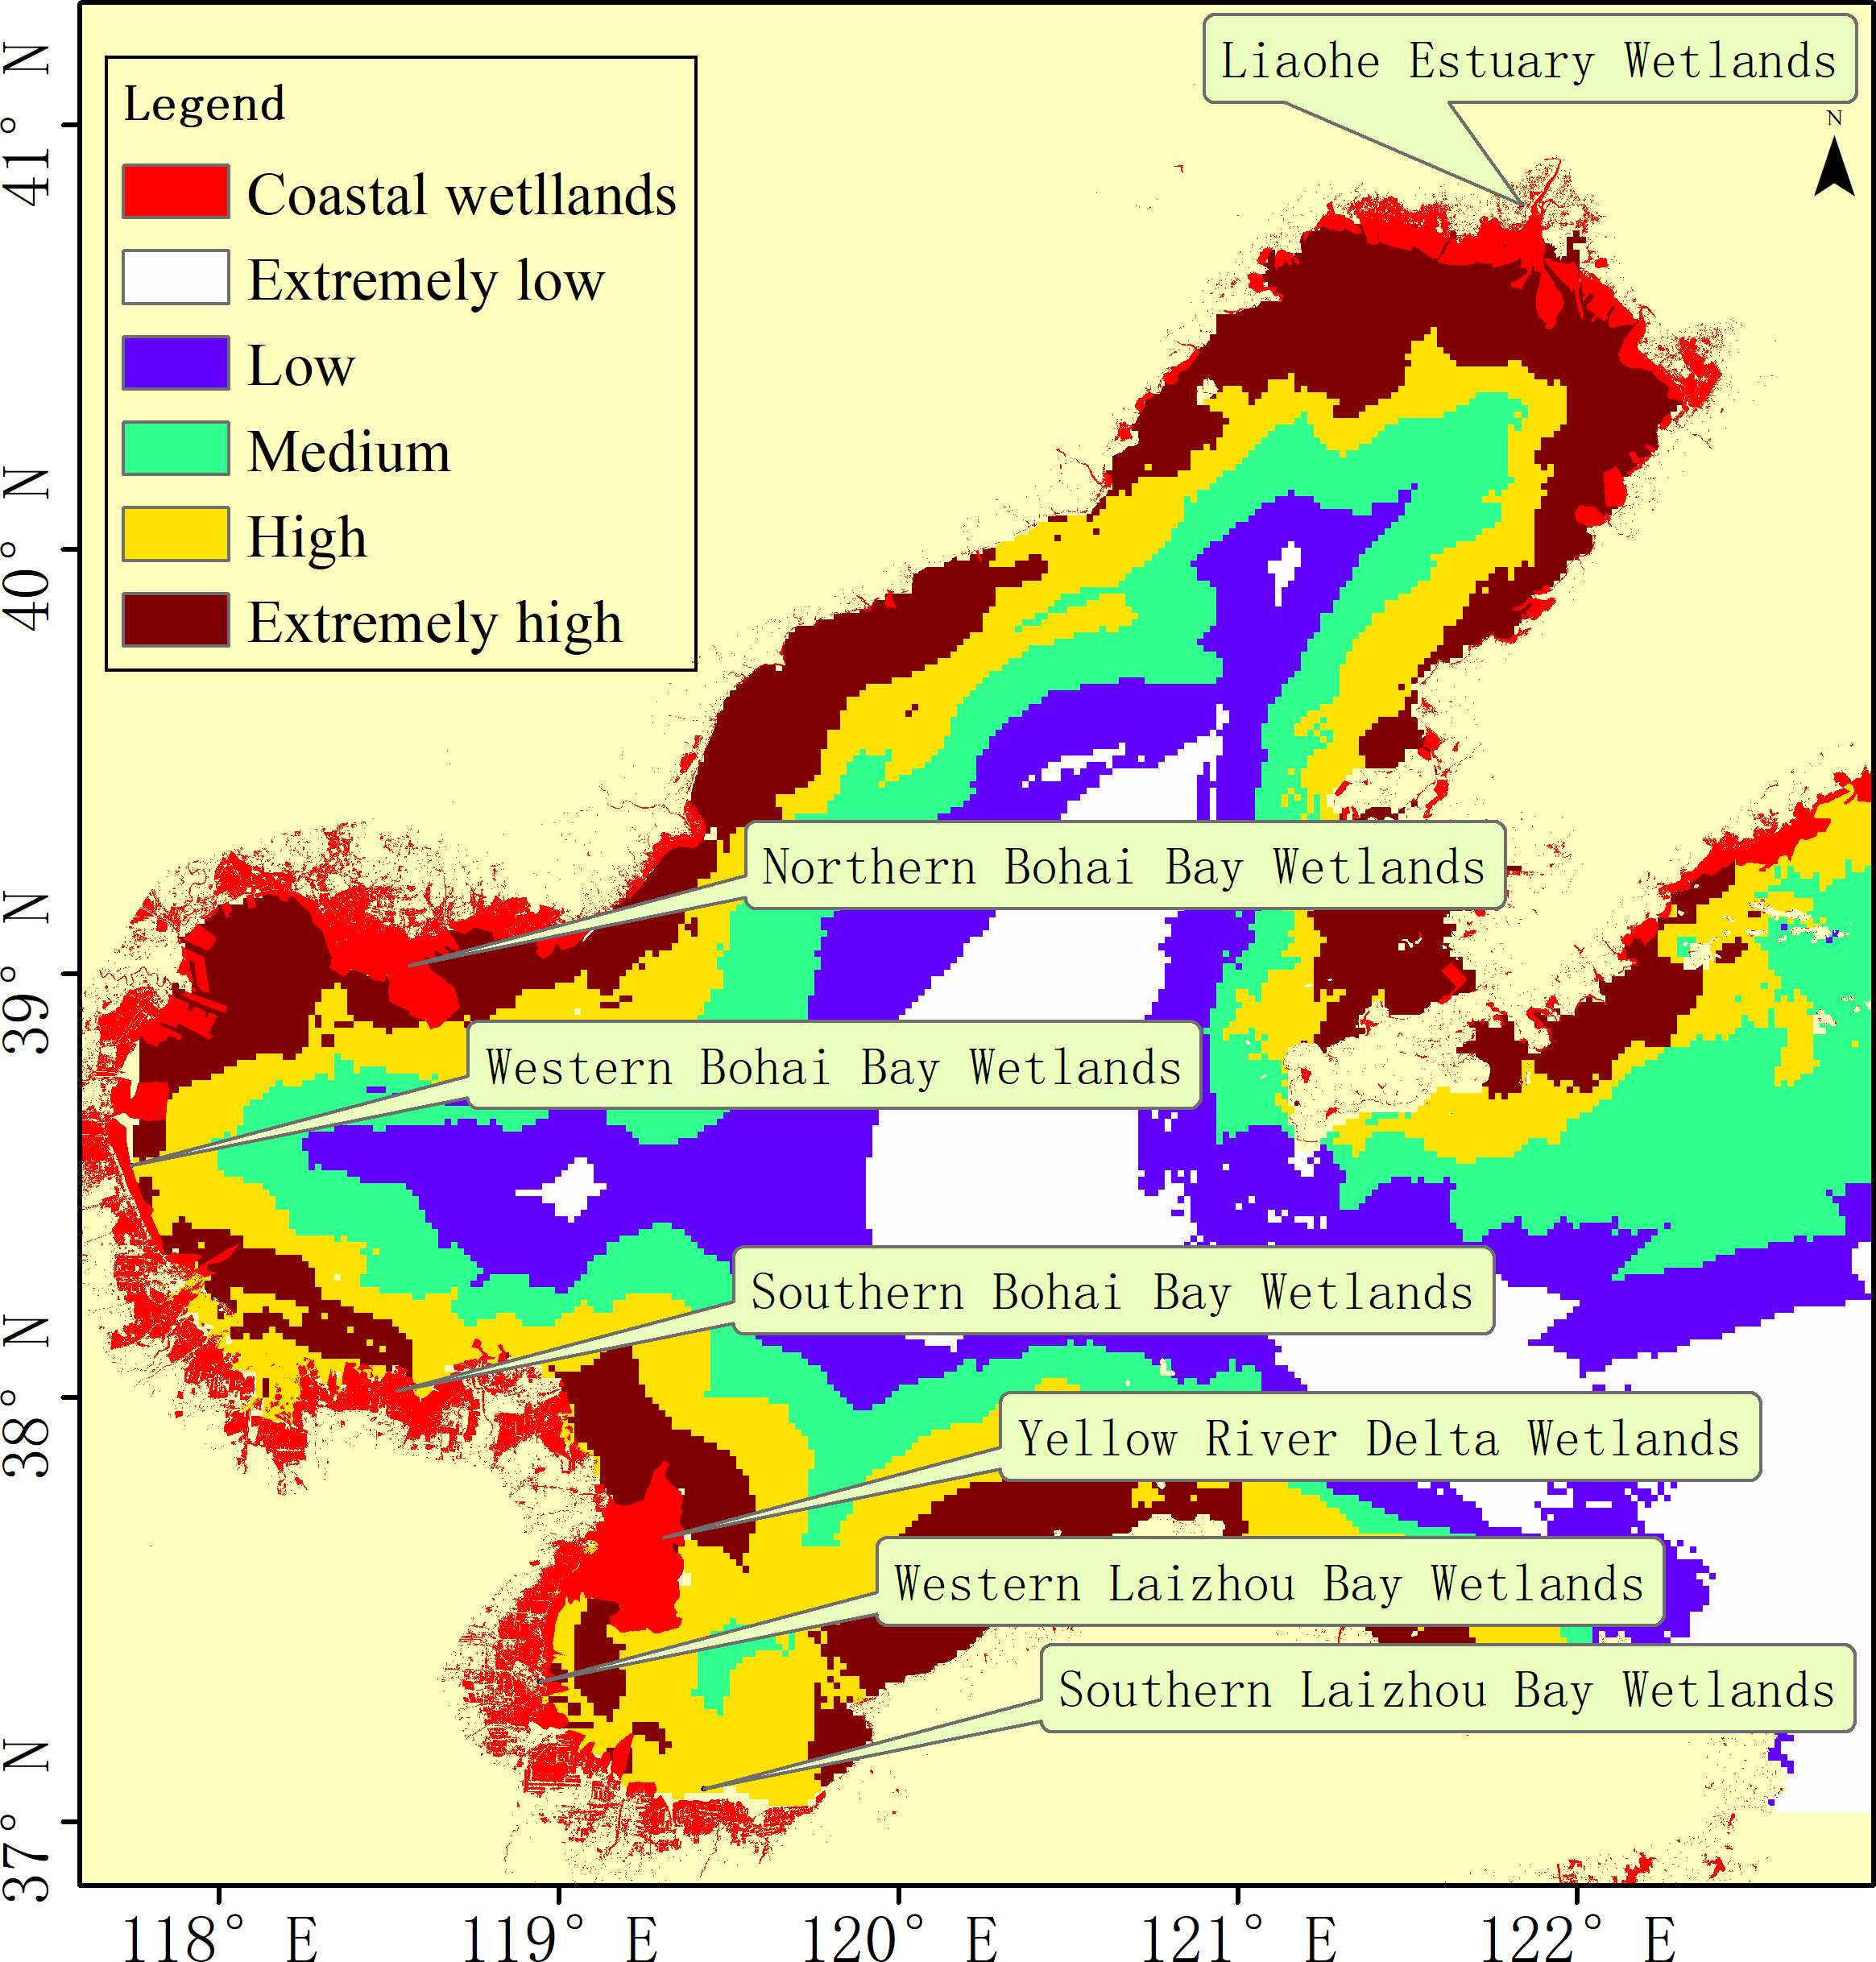
Figure 6 Spatial variation of integrated sensitivity of coastal wetlands.
3.2.3. Adaptive capacity
The adaptive capacity of each individual index was represented by gradient tones (Figure 7). Spatial overlaying analysis was also used for weighted calculation to obtain the integrated adaptive capacity. The spatial patterns in integrated adaptive capacity (Figure 8) showed that the Liaohe Estuary wetlands, the southern Bohai Bay wetlands, the Yellow River Delta wetlands, and the western and southern Laizhou Bay wetlands were all near sea areas with low adaptive capacity. The most adaptable wetlands were found on the north and west of Bohai Bay.
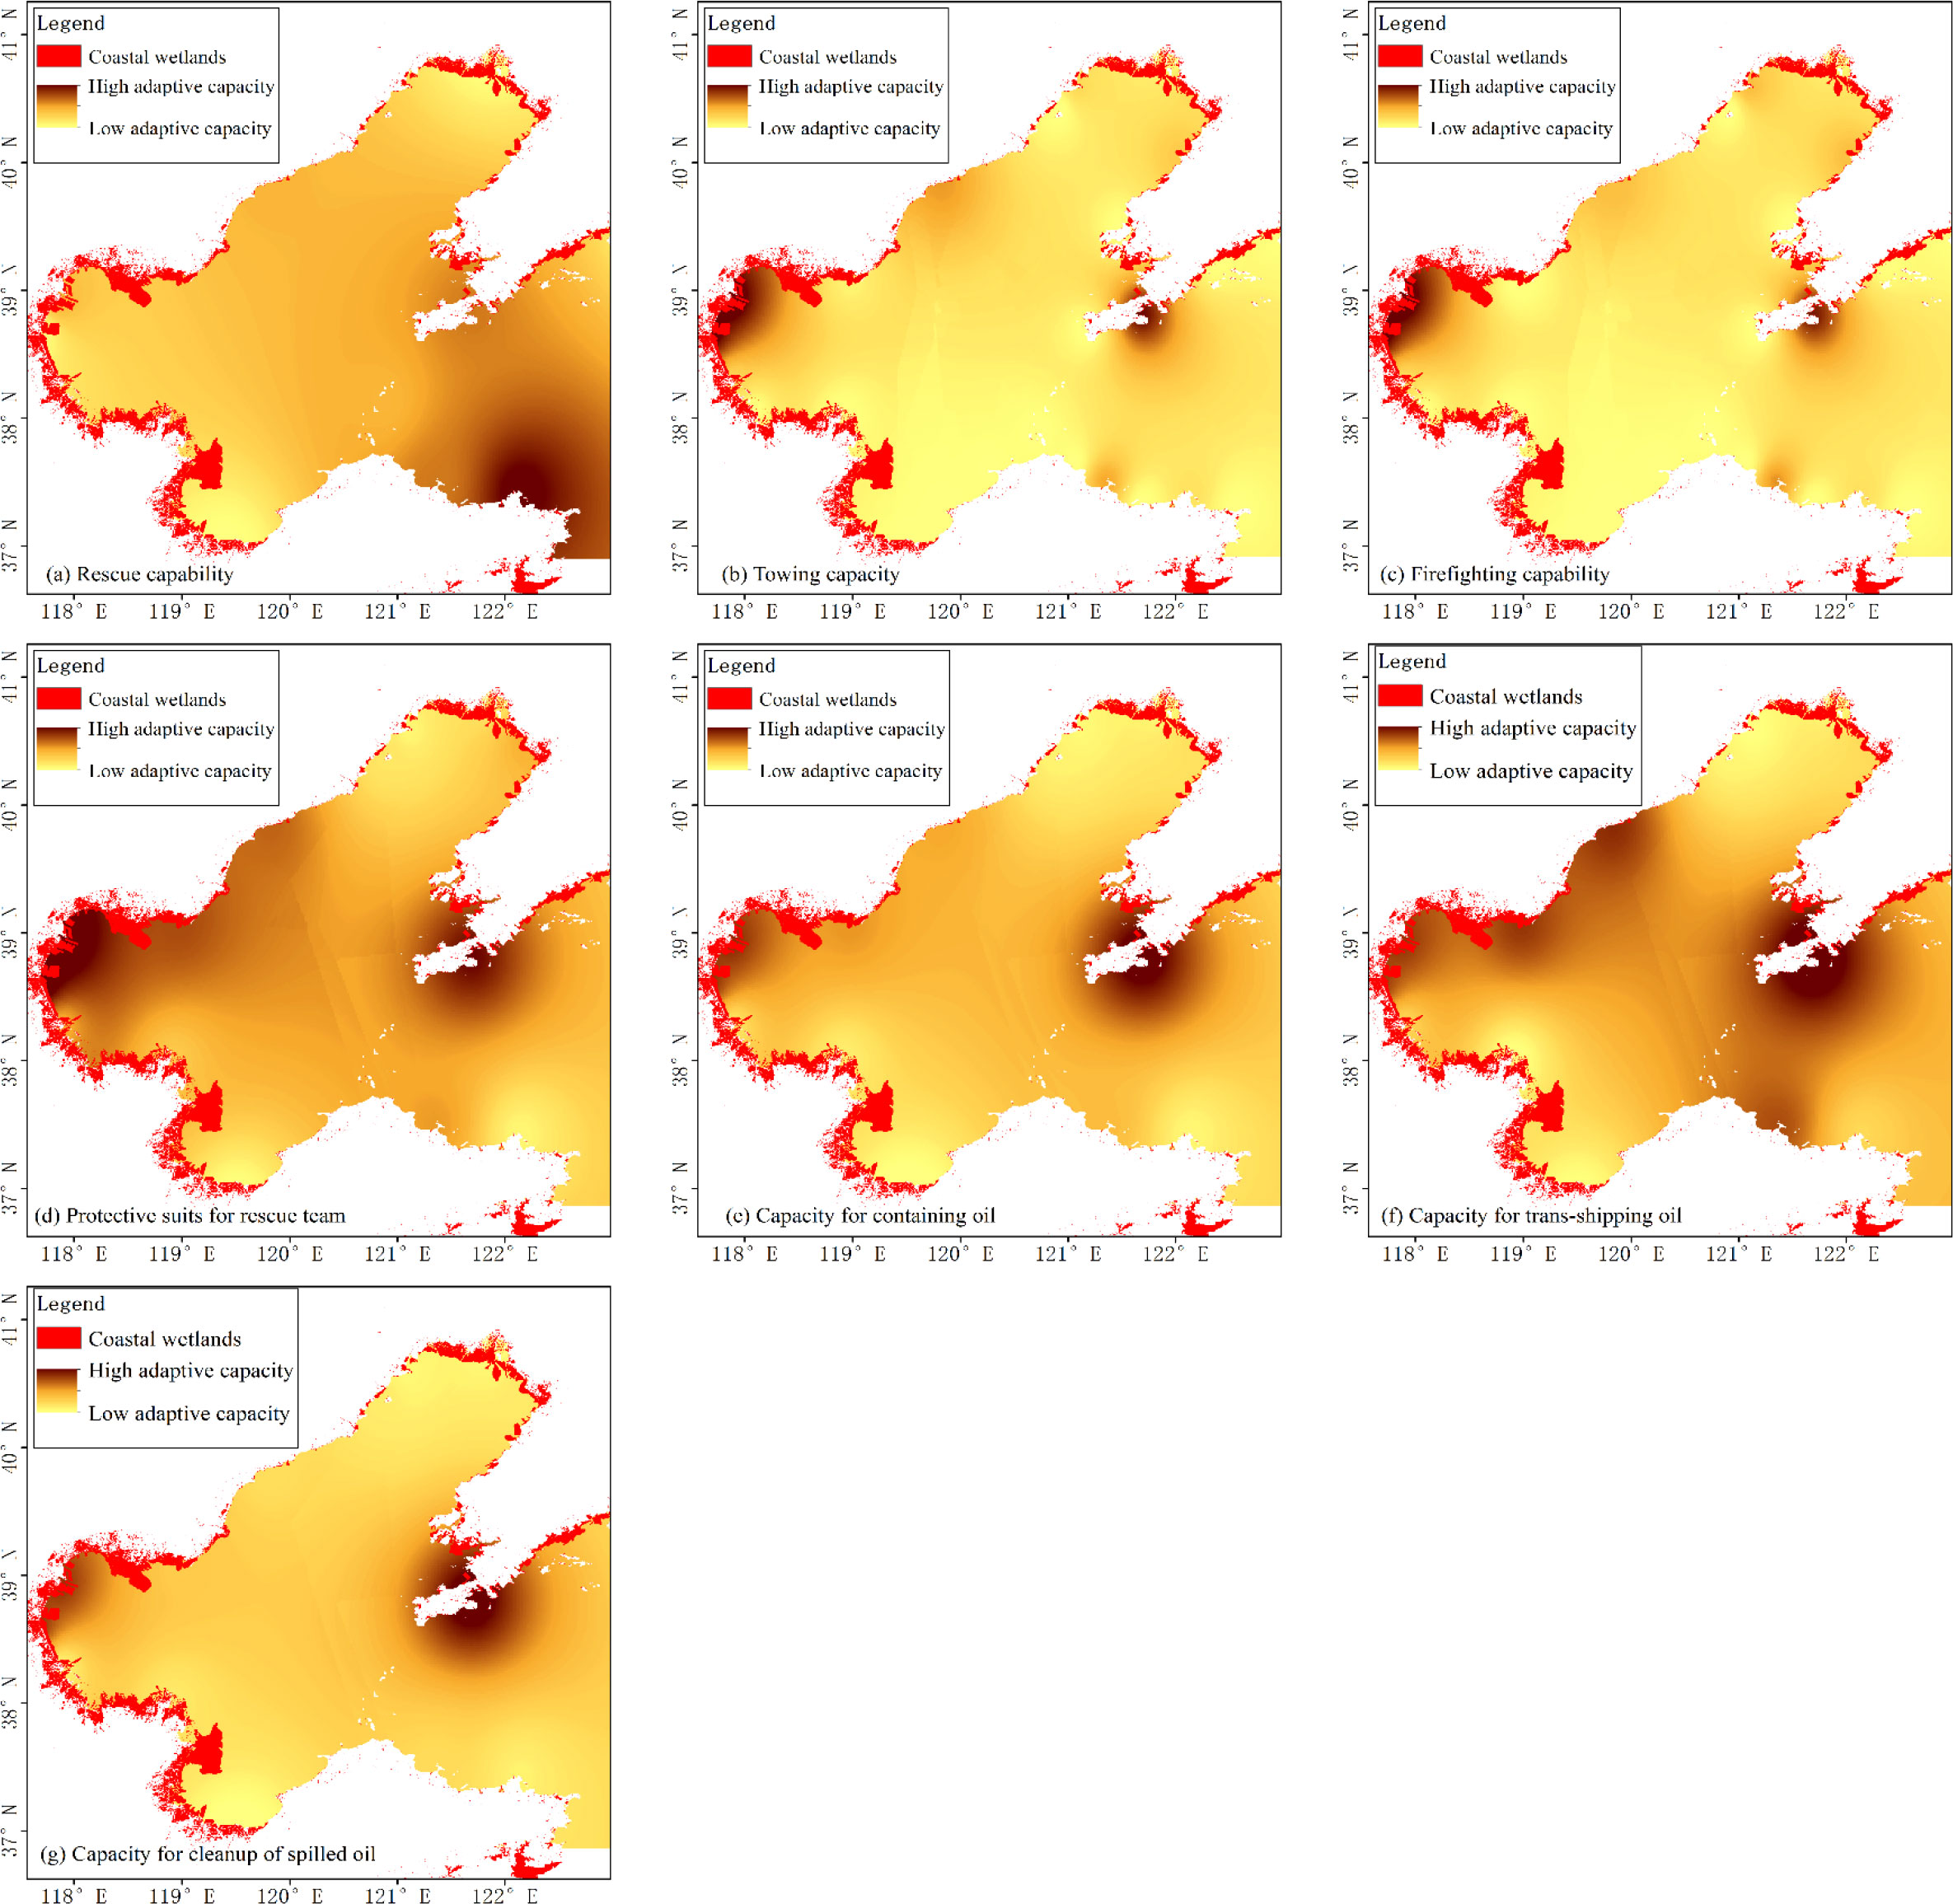
Figure 7 Visualization of the adaptive capacity of indices. The dark-toned areas indicate that oil spill response capability is strong, and these areas exhibit high adaptive capacity, while the light-toned areas indicate that the oil spill response capability is weak, and these areas exhibit low adaptive capacity.
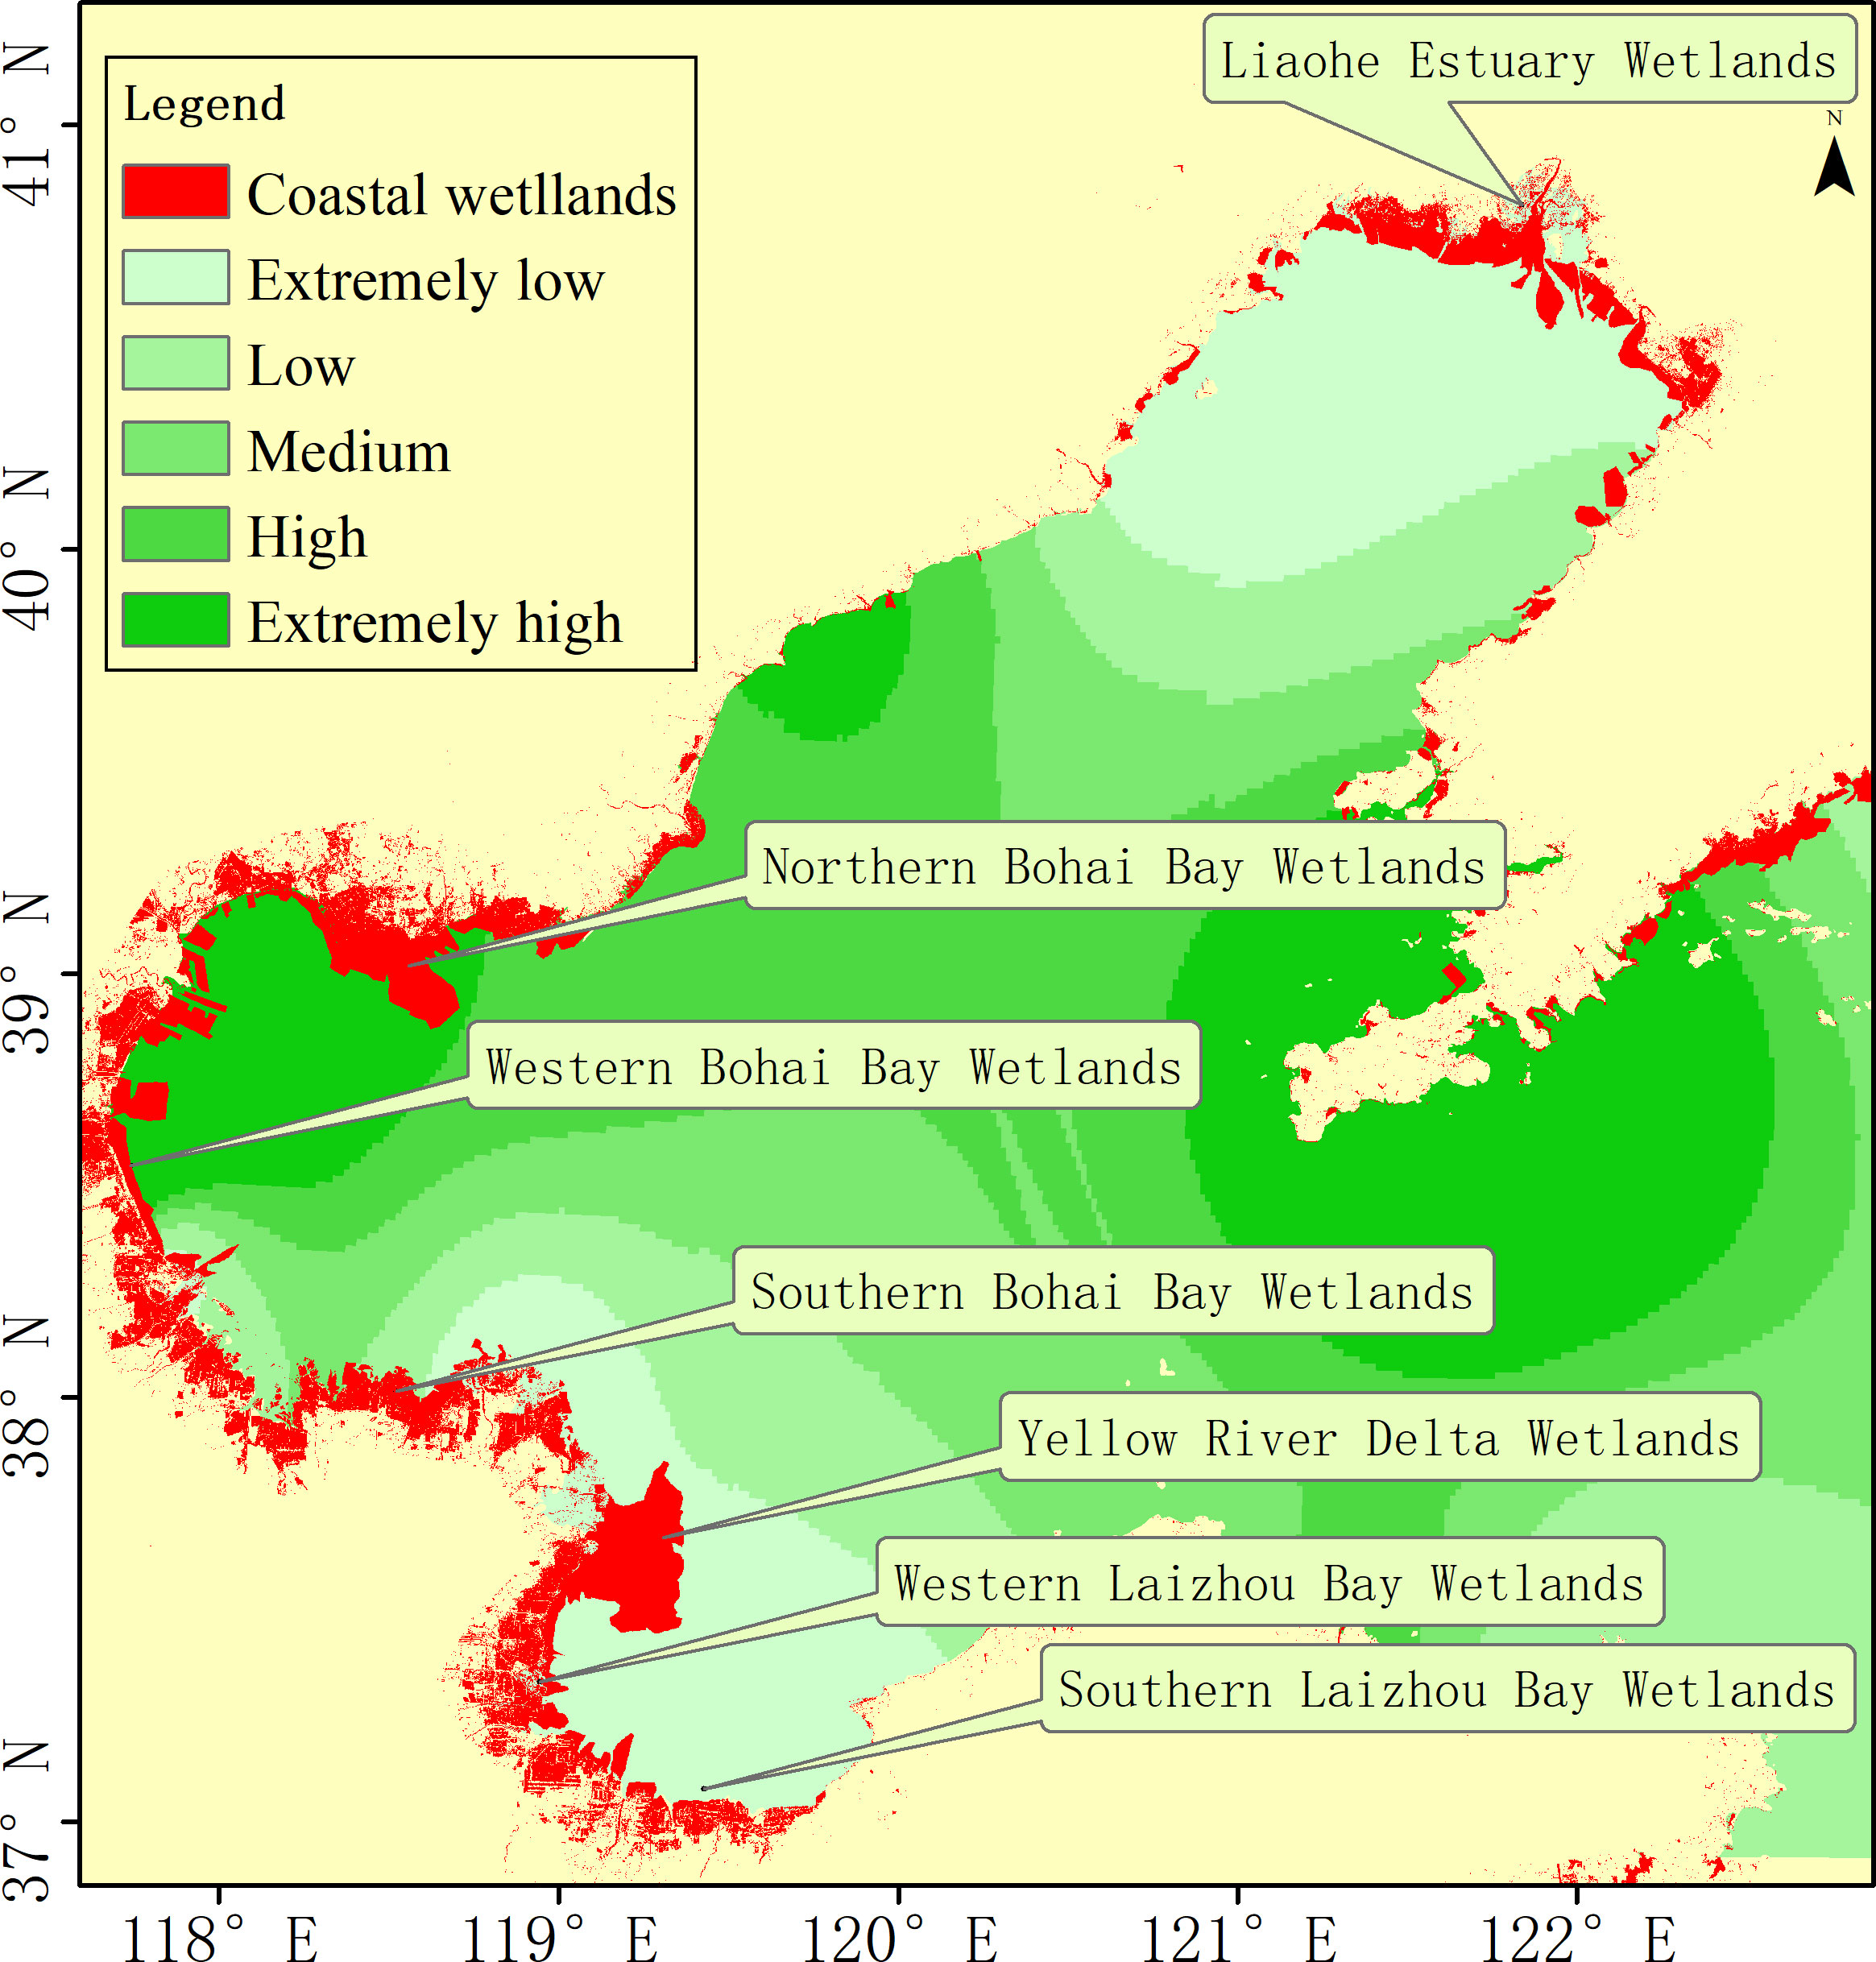
Figure 8 Spatial variation of the integrated adaptive capacity of coastal wetlands.
3.2.4. Vulnerability
As shown in Figure 9, the vulnerability of the Liaohe Estuary wetlands, the southern Laizhou Bay wetlands, the northern part of the Yellow River Delta wetlands, and the eastern part of Southern Bohai Bay Wetlands was extremely high; the western Laizhou Bay wetlands and the southern part of the Yellow River Delta wetlands was relatively high; and most of the northern and western Bohai Bay wetlands was medium high or medium low. Overall, coastal wetlands in different regions exhibited various levels of vulnerability to oil spill stress.
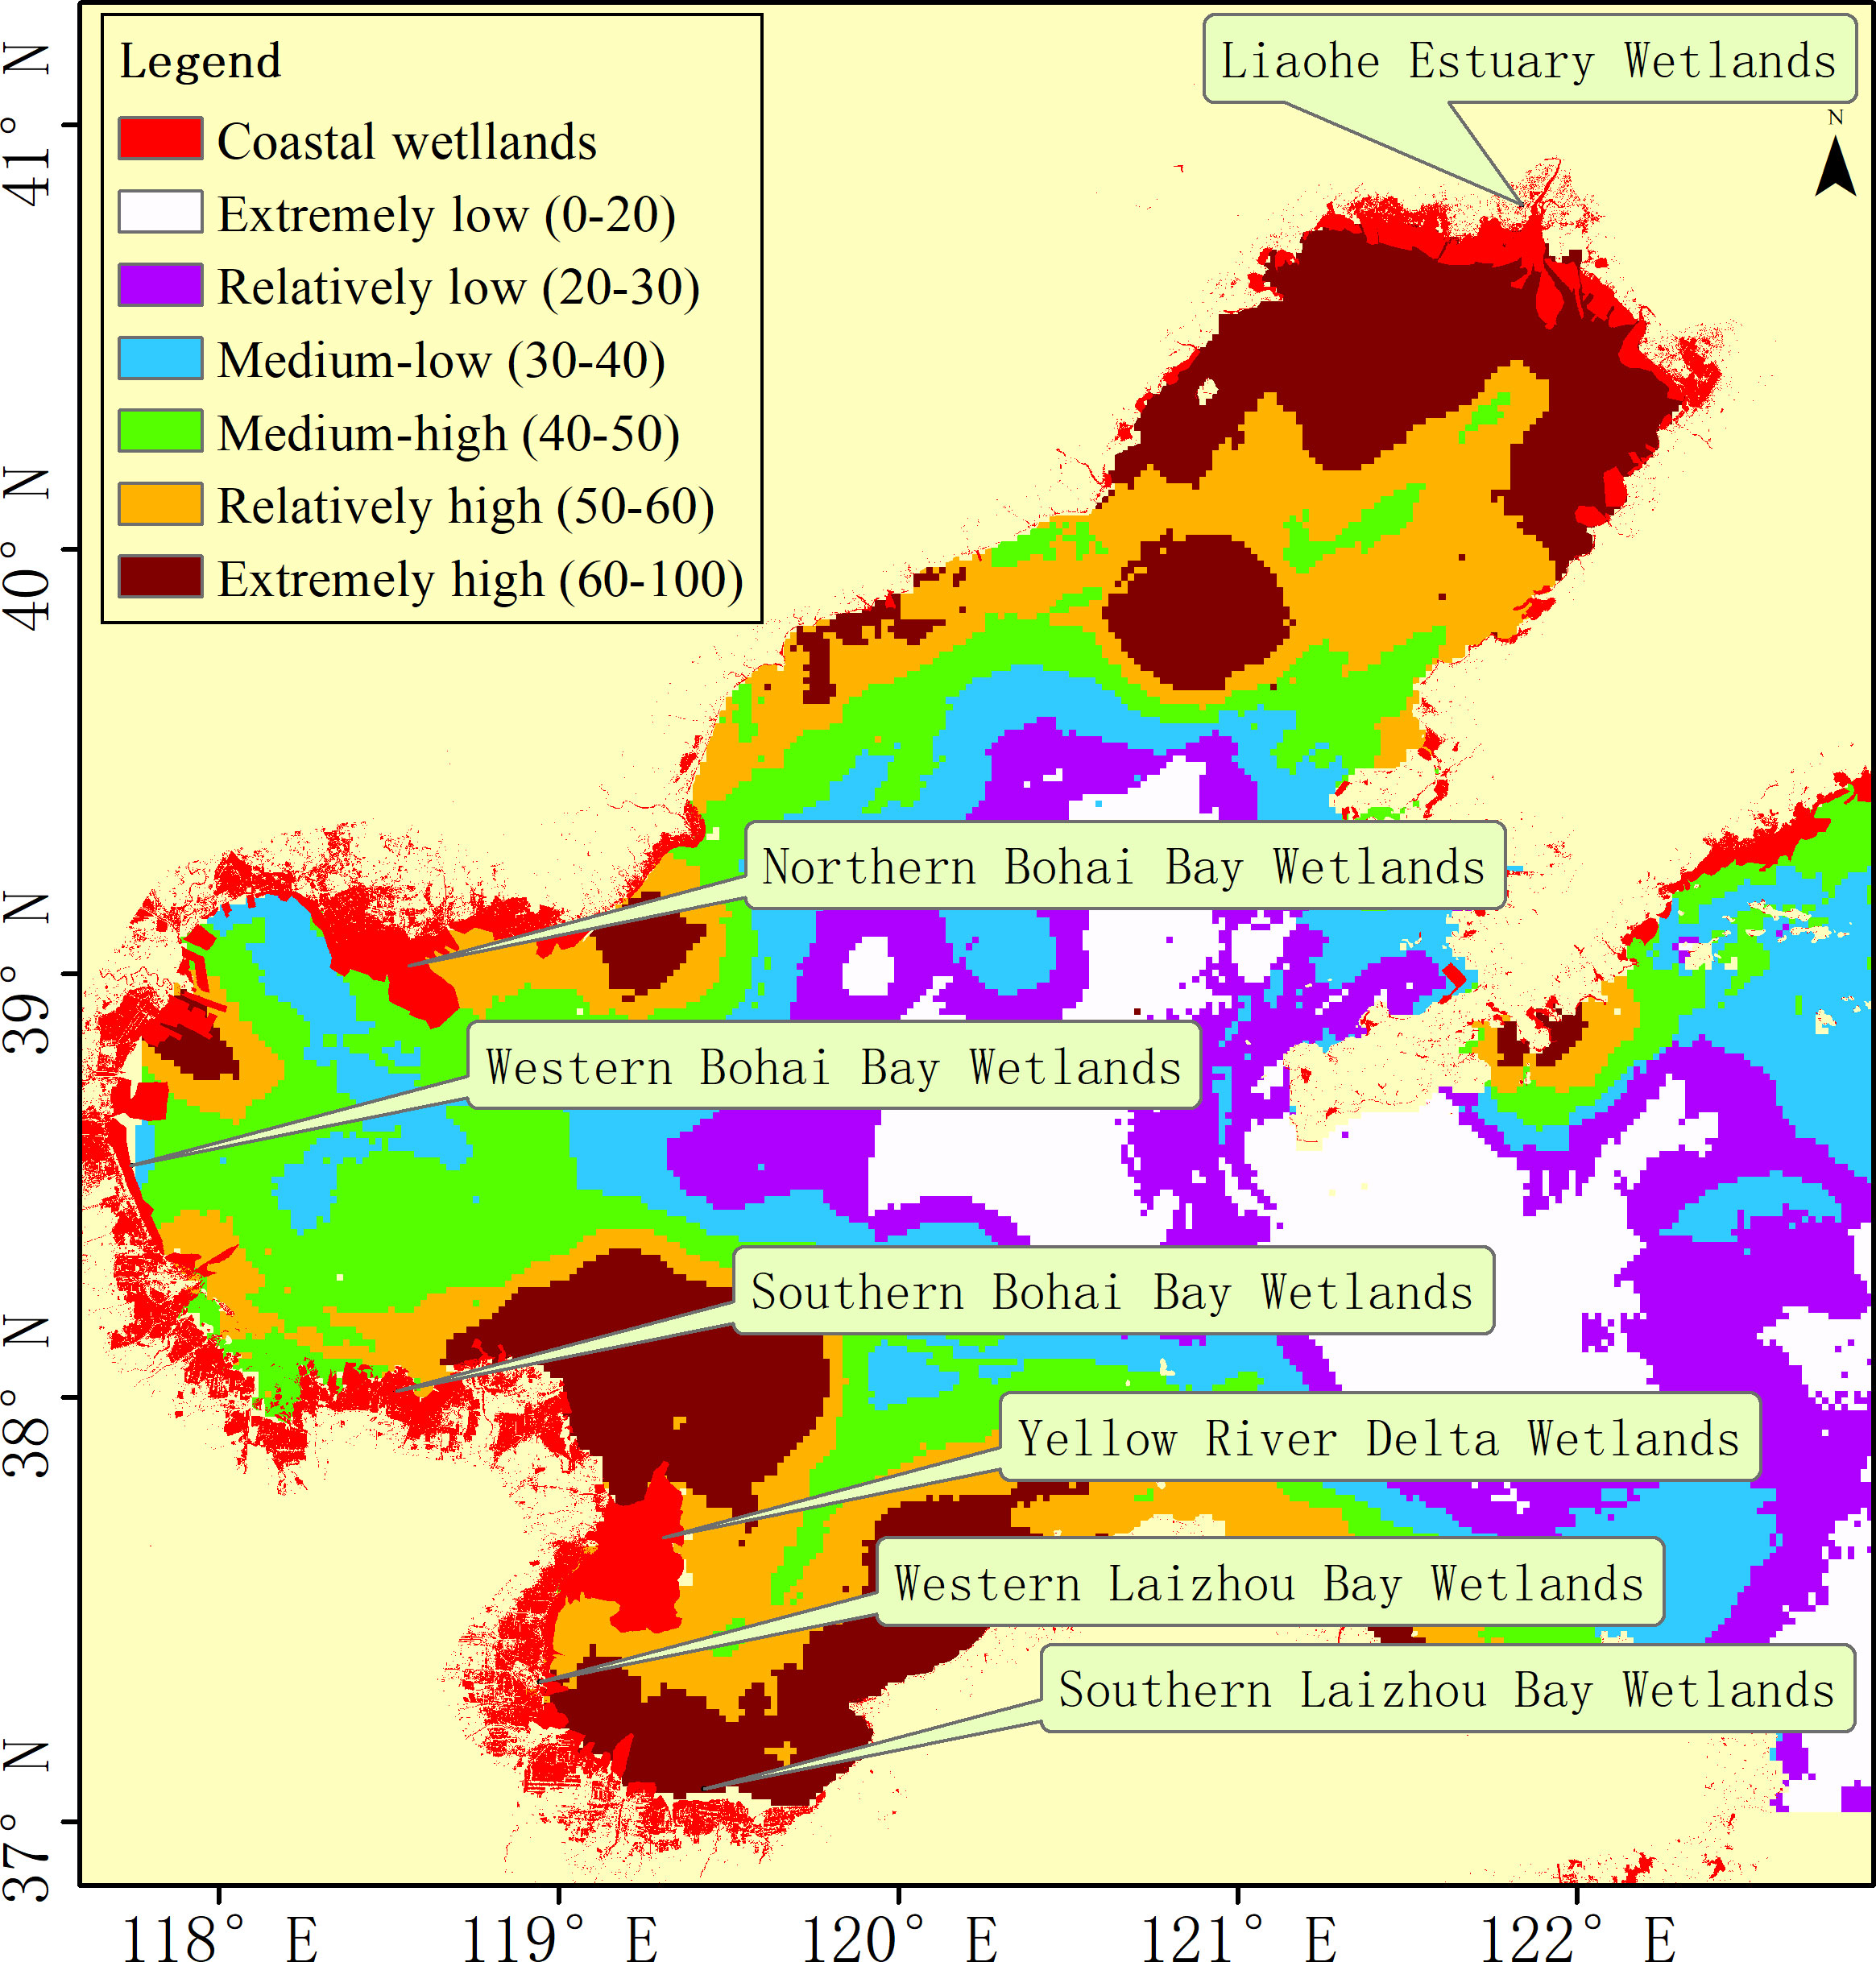
Figure 9 Spatial variation of the integrated vulnerability of coastal wetlands.
4. Discussion
4.1. Spatial variation of vulnerability
Vulnerability assessment is a broad topic. The methods currently used for the vulnerability assessment of natural hazards mainly include the following categories (Sun et al., 2020b): (1) the statistical analysis method, (2) the vulnerability curve method, and (3) the evaluation of multiple indicators. Compared with natural disasters such as floods, the probability of oil spill occurrence is relatively random, and the recorded statistical samples are not sufficient for statistical analysis. Therefore, it is difficult to obtain effective information from statistical data, and it is also difficult to construct a vulnerability curve based on statistical data. Generally, in vulnerability assessments for oil spills, the evaluation of multiple indicators is relatively common. A commonly used technique is to combine an oil spill simulation model with GIS (Balogun et al., 2021; O'Brien-Delpesh et al., 2022). The simulation model randomly simulates the assumed accidents, and GIS comprehensively analyzes a wide range of related information. Since this study focuses on the spatial variation of coastal wetland vulnerability under oil spill stress, the advantages of GIS in spatial analysis can be fully utilized. In view of this, the evaluation of multiple indicators combined with GIS is currently the most suitable method for this study.
According to the weighted results obtained using the AHP, sensitivity had the greatest impact on the vulnerability of coastal wetlands under oil spill stress, followed by exposure, and adaptive capacity had the least impact on vulnerability.
Exposure could reflect the potential loss of wetlands under the influence of oil spills. Exposure is related to the oil spill frequency, oil slick spatial position, oil slick thickness, exposure duration of floating oil slick (Wang et al., 2020), and the proximity to the point where the oil spill occurs. Although vulnerability assessments typically combine sets of index values related to historical data and contextual information (such as site, situation, and time) (Nelson and Grubesic, 2017), and the frequency, intensity, and duration can be calculated based on historical statistics, historical situations may not be relevant to oil spill accidents that have not yet occurred, which results in difficulties in determining the real exposure of coastal wetlands by relying on historical data. Therefore, analyzing the spatial pattern of oil spill sources is the most effective way to determine and visually represent the exposure of coastal wetlands. The closer the wetlands to a risk source, the higher the exposure. Ships have always been considered to be an important source of marine oil spills and are also the focus of oil spill risks (Xiong et al., 2015). In this study, ship factors accounted for the greatest proportion of exposure risk in determining the exposure of coastal wetlands. Once an oil platform leaks, it will cause great harm (Yu et al., 2018), and the exposure due to oil platforms is second only to ship exposure. Due to the low density of submarine pipelines in the Bohai Sea, they are considered to cause the lowest exposure risk to coastal wetlands. Spatially, the exposure of wetlands under oil spill stress showed significant differences.
Sensitivity assessment is critical for developing an integrated coastal management framework (de Andrade et al., 2010). Sensitivity assessment is often influenced by biological, physical, and socioeconomic factors (Rustemovich and Alexeevich, 2017; Mamede da Silva et al., 2018; Li and Johnson, 2019). Therefore, the selection of coastal wetland sensitivity indices under oil spill stress referred to these factors. The results showed that sensitivity contributed more than half of the weight in the vulnerability assessment. Among the indices that determined the sensitivity, ocean currents played the most important role in reducing the sensitivity of coastal wetlands.
The adaptive capacity of coastal wetlands to oil spills is mainly determined by local oil spill prevention and mitigation capabilities (Wang et al., 2018a). By enhancing these capabilities, the adaptive capacity to oil spill disasters can be significantly improved. Based on the weighted results, increasing the capacity for containing oil is considered to be the most effective way to enhance the adaptive capacity, while firefighting capability has the least effect on enhancing the adaptive capacity. In general, with the exception of the cleanup capacity and oil spill containment capacity, there was little difference in the role of other capabilities. Overall, most coastal wetlands showed extremely low adaptive capacity to oil spills, with the reason that the port emergency equipment stores were not located near coastal wetlands with high ecological value, resulting in the poor adaptive capacity of each wetland to oil spill stress. In contrast, the wetlands located between Tianjin Port and Tangshan Port showed extremely high adaptive capacity because the emergency equipment stored in the two ports can ensure that the surrounding waters have sufficient emergency response forces when oil spills occur.
The seven coastal wetlands around the Bohai Sea discussed in this study showed obvious spatial variation of vulnerability under oil spill stress. In view of these findings, local governments need to formulate conservation strategies in line with the vulnerability of local wetlands, and departments need to coordinate and establish effective vulnerability response mechanisms. The responses of the Chinese government to the threat of oil spills are described in the following sections.
4.2. Management of marine oil spills in China
Generally, increases in the exposure and sensitivity will increase the system vulnerability, and the increase in adaptive capacity will decrease system vulnerability. For the oil-spill-related vulnerability of coastal wetlands determined by the VSD framework, sensitivity is determined based on the environmental self-purification capability, which is impossible to enhance. As exposure depends on the distance from risk sources to wetlands, exposure is also difficult to change. Therefore, to reduce the vulnerability of coastal wetlands, the most effective short-term method is to enhance adaptive capacity through strengthening the ability to prevent and mitigate oil spill disasters. In this respect, the Chinese government has taken multiple measures, although some problems remain (Xiong et al., 2015).
4.2.1. Improving wetland protection laws related to oil spills
In response to the continued degradation of Chinese wetlands due to multiple factors, the Chinese government has made wetland protection a national priority (Jiang and Xu, 2019) and has issued a series of laws and regulations related to water pollution prevention (Sun et al., 2015), including the Maritime Traffic Safety Law of the People’s Republic of China (promulgated in 1983, and revised in 2016 and 2021) and the Marine Environmental Protection Law of the People’s Republic of China (promulgated in 1982, and revised in 1999 and 2017). It is particularly worth mentioning that on December 24, 2021, the 32nd meeting of the Standing Committee of the 13th National People’s Congress issued the “Wetland Protection Law of the People’s Republic of China.” This law provides an important basis for the protection of coastal wetlands and has been a key milestone for wetland protection in China. Regrettably, the law does not clearly define the issue of wetland protection related to oil spill pollution, and the compensation mechanism for oil spill pollution damage is incomplete. To address this shortcoming, it is necessary to establish a complete compensation mechanism for oil pollution damage and carry out research and the formulation of regulations specifically for the prevention and control of oil spill pollution. By improving the environmental legal system, the adaptive capacity of coastal wetlands to oil spills will be continuously improved at the legal level.
4.2.2. Enhancing the coordination capabilities of various departments
Coastal wetland management related to oil spills involves multiple government departments in China, including the Ministry of Ecology and Environment, the State Oceanic Administration, and the MSA. The responsibilities of the abovementioned agencies are not clear, and coordination mechanisms for management are lacking, resulting in difficulties in the effective protection of wetlands (Meng et al., 2017). To improve this system, management should consist of integrated governance rather than a loose combination of various departments (Tait and Brunson, 2022). In 2016, the “National Major Offshore Oil Spill Emergency Capability Building Plan” was issued by the State Council of China. This is the first special plan dedicated to improving oil spill emergency response capability that can integrate central government and local government forces, government and enterprise forces, and various department forces. The issuance of this plan marked the transformation of China’s oil spill response capacity from single-department projects to multi-department coordination. The “Wetland Protection Law of the People’s Republic of China” (2021) stipulates that “The competent department of forestry and grassland under the State Council shall, in conjunction with the competent departments of natural resources, water administration, housing and urban-rural development, ecological environment, agriculture and rural areas of the State Council, establish a wetland protection collaboration and information reporting mechanism.” It can be seen that the Chinese government has paid attention to the benefits of systematic management. Departments can now jointly formulate emergency plans to establish efficient and scientific management systems, which can be regarded as an effective form of system management organization for coastal wetland protection.
4.2.3. Intensifying technical support for oil spill prevention and control
Establishing an early warning decision support system is essential to oil spill pollution prevention. At present, the world’s commonly used oil spill prediction and early warning systems include GNOME (United States), COZOIL (United States), OILMAP (United States), ADIOS (United States), SINTEF OSCAR (Norway), MOTHY (France), and MOHID (Portugal). China’s oil spill prediction systems include the China Marine Oil Spill Integrated Multi-Node Collaborative Prediction and Early Warning System (National Marine Information Center), the China Offshore Oil Spill Prediction and Emergency Decision Support System (Environmental Protection Service Co., Ltd. of the China National Petroleum Corporation), the Marine Oil Spill Emergency and Forecast Response Information System (Dalian Maritime University), and the Bohai Oil Spill Emergency Forecast System (National Marine Environment Forecast Center). Commercial systems (such as OILMAP) and open-source systems (such as GNOME) can theoretically be used in any sea area if the corresponding basic geographic information is provided. However, most non-commercial and non-open source systems are only applicable to the specific sea area for which the system is developed. Therefore, further research should be conducted on the background data of the marine environment in the Bohai Sea to provide accurate basic information on local marine environmental elements. In addition, improving the oil spill trajectory prediction model on the surface of the Bohai Sea, developing a dynamic change model for underwater oil spills, and using simulation models for submerged oil spills would also be significant.
4.2.4. Strengthening the construction of oil spill emergency equipment warehouses
In 2016, the MSA issued “Guiding Opinions on Strengthening the Operation and Management of the National Ship Oil Spill Response Equipment Depot,” which proposes to strengthen the management of the national ship oil spill emergency equipment warehouse and optimize the allocation of emergency equipment, with the aim of ensuring that the stored equipment can be used when oil spills occur. However, because the construction of equipment warehouses remains in the initial stage in China, there are still some problems (Li, 2020), such as unbalanced site selection and layout, heavy reliance on government financial investment, and imperfect sharing mechanisms. Faced with the abovementioned problems, it is necessary to take targeted measures. For example, for areas with high oil spill risk exposure in coastal wetlands, the existing equipment warehouses should be appropriately renovated and expanded, and new emergency equipment bases for coastal wetland protection should be built. The government should be encouraged to purchase services from social emergency forces to participate in equipment maintenance, and promote the professional, market-oriented, and large-scale development of oil spill emergency services. Finally, a regional cooperation mechanism for oil spill emergency equipment depots should be established, resource sharing should be promoted, and the ability to coordinate responses to oil spill pollution should be enhanced.
4.3. Potential issues and future prospects
There are still some limitations of this study that need to be further discussed. First, when it comes to applying the method to other similar areas in the world, the consideration of additional indicators to local conditions are unavoidable in light of the complexity of the topic. Second, in this study, the weights of each indicator were determined by AHP, which requires an intuitive expression of the percentage of damage from experts (Subramanian and Ramanathan, 2012); thus, this method still cannot achieve a completely objective analysis of the weights. Third, in reality, the weights of the involved factors should depend on the immediate environment in which the accident occurs. In order to represent the general situation, some indicators (such as wind speed and wave height) are replaced by annual average data in this study. Hence, further work should be conducted to support this study incorporating more indicator-related and weight-related factors.
5. Conclusion
This study attempted to assess the spatial variation of vulnerability for coastal wetlands under oil spill stress in the Chinese Bohai Sea. Multiple sources of data including exposure, sensitivity, and adaptive capacity were involved in this work. For each individual index, a mesh of 1000 m × 1000 m grid cells was generated and normalized, and weighted using the AHP. In addition, maps of exposure, sensitivity, adaptive capacity, and vulnerability were created based on a GIS. Subsequently, the spatial variation of coastal wetland vulnerability was analyzed and discussed. In conclusion, (1) the study developed a GIS-based assessment method for the spatial variation of coastal wetland vulnerability under oil spill stress and applied this approach to the Chinese Bohai Sea. (2) The vulnerability of spatially differentiated features was revealed, and the study provided a basis for the development of an appropriate coastal wetland conservation decision-making system related to oil spills in this area. (3) Although the Chinese government has made progress in developing oil spill prevention and response capabilities, some problems remain. The government needs to further improve its oil spill prevention and response capabilities.
Data availability statement
The original contributions presented in the study are included in the article/Supplementary Material. Further inquiries can be directed to the corresponding author.
Author contributions
YW designed and performed the research, analyzed the data, and wrote the paper. PD, JL, and CC collected the data. All authors contributed to the article and approved the submitted version.
Funding
This work was financially supported by the Natural Science Foundation of Shandong Province (Youth Program) (grant number: ZR2022QD020).
Acknowledgments
We would like to express our gratitude to the editors and reviewers for their helpful comments.
Conflict of interest
The authors declare that the research was conducted in the absence of any commercial or financial relationships that could be construed as a potential conflict of interest.
Publisher’s note
All claims expressed in this article are solely those of the authors and do not necessarily represent those of their affiliated organizations, or those of the publisher, the editors and the reviewers. Any product that may be evaluated in this article, or claim that may be made by its manufacturer, is not guaranteed or endorsed by the publisher.
Supplementary material
The Supplementary Material for this article can be found online at: https://www.frontiersin.org/articles/10.3389/fmars.2022.1073906/full#supplementary-material
References
Abascal A. J., Castanedo S., Medina R., Liste M. (2010). Analysis of the reliability of a statistical oil spill response model. Mar. pollut. Bull. 60 (11), 2099–2110. doi: 10.1016/j.marpolbul.2010.07.008
Balogun A. L., Yekeen S. T., Pradhan B., Yusof K. B. W. (2021). Oil spill trajectory modelling and environmental vulnerability mapping using GNOME model and GIS. Environ. pollut. 268, 115812. doi: 10.1016/j.envpol.2020.115812
Barbier E. B. (2013). Valuing ecosystem services for coastal wetland protection and restoration: Progress and challenges. Resources 2 (3), 213–230. doi: 10.3390/resources2030213
Bhowmik S. (2022). Ecological and economic importance of wetlands and their vulnerability: a review. Research Anthology on Ecosystem Conservation and Preserving Biodiversity, 11–27. doi: 10.4018/978-1-6684-5678-1.ch002
Castanedo S., Juanes J. A., Medina R., Puente A., Fernandez F., Olabarrieta M., et al. (2009). Oil spill vulnerability assessment integrating physical, biological and socio-economical aspects: Application to the cantabrian coast (Bay of Biscay, Spain). J. Environ. Manage. 91 (1), 149–159. doi: 10.1016/j.jenvman.2009.07.013
Crooks S., Herr D., Tamelander J., et al. (2011) Mitigating climate change through restoration and management of coastal wetlands and near-shore marine ecosystems: Challenges and opportunities. Available at: http://hdl.handle.net/10986/18318.
de Andrade M. M. N., Szlafsztein C. F., Souza-Filho P. W. M., Araújo A. R., Gomesc M. K. T. (2010). A socioeconomic and natural vulnerability index for oil spills in an Amazonian harbor: A case study using GIS and remote sensing. J. Environ. management. J. Environ. Manage. 91 (10), 1972–1980. doi: 10.1016/j.jenvman.2010.04.016
Gilchrist W. (2000). Statistical modelling with quantile functions (New York: Chapman and Hall/CRC). doi: 10.1201/9781420035919
Jha R. K., Gundimeda H. (2019). An integrated assessment of vulnerability to floods using composite index–a district level analysis for bihar, India. Int. J. Disaster Risk Reduction 35, 101074. doi: 10.1016/j.ijdrr.2019.101074
Jiang B., Xu X. (2019). China Needs to incorporate ecosystem services into wetland conservation policies. Ecosystem Serv. 37, 100941. doi: 10.1016/j.ecoser.2019.100941
Kåresdotter E., Destouni G., Ghajarnia N., Hugelius G., Kalantari Z. (2021). Mapping the vulnerability of Arctic wetlands to global warming. Earth's Future 9 (5), e2020EF001858. doi: 10.1029/2020EF001858
Li S. (2020). The capabilities for prevention and control of marine pollution by ships: China’s construction experiences and future Perspectives//IOP conf. ser. Earth Environ. Sci. 435 (1), 12005. doi: 10.1088/1755-1315/435/1/012005
Li X., Bellerby R., Craft C., Widney S. E. (2018). Coastal wetland loss, consequences, and challenges for restoration. Anthropocene Coasts 1 (1), 1–15. doi: 10.1139/anc-2017-000
Li Z., Johnson W. (2019). An improved method to estimate the probability of oil spill contact to environmental resources in the gulf of Mexico. J. Mar. Sci. Eng. 7 (2), 41. doi: 10.3390/jmse7020041
Liu X., Meng R., Xing Q., Lou M., Chao H., Bing L. (2015). Assessing oil spill risk in the Chinese bohai Sea: A case study for both ship and platform related oil spills. Ocean Coast. Manage. 108, 140–146. doi: 10.1016/j.ocecoaman.2014.08.016
Mamede da Silva P., de Miranda F. P., Landau L. (2018). Mapping the Brazilian Amazon fluvial sensitivity index to oil spills with shuttle radar topography mission (SRTM) data. Geocarto Int. 33 (6), 555–572. doi: 10.1080/10106049.2016.1273399
Mao D., Wang Z., Du B., Li L., Tian Y., Jia M., et al. (2020). National wetland mapping in China: A new product resulting from object-based and hierarchical classification of landsat 8 OLI images. ISPRS J. Photogrammetry Remote Sens. 164, 11–25. doi: 10.1016/j.isprsjprs.2020.03.020
Mendelssohn I. A., Andersen G. L., Baltz D. M., Caffey R. H., Carman K. R., Fleeger J. W., et al. (2012). Oil impacts on coastal wetlands: implications for the Mississippi river delta ecosystem after the deepwater horizon oil spill. BioScience 62 (6), 562–574. doi: 10.1525/bio.2012.62.6.7
Meng W., He M., Hu B., Mo X., Li H., Liu B., et al. (2017). Status of wetlands in China: A review of extent, degradation, issues and recommendations for improvement. Ocean Coast. Manage. 146, 50–59. doi: 10.1016/j.ocecoaman.2017.06.003
Narayan S., Beck M. W., Wilson P., Thomas C. J., Guerrero A., Shepard C. C., et al. (2017). The value of coastal wetlands for flood damage reduction in the northeastern USA. Sci. Rep. 7 (1), 1–12. doi: 10.1038/s41598-017-09269-z
Nelson J. R., Grubesic T. H. (2017). A repeated sampling method for oil spill impact uncertainty and interpolation. Int. J. Disaster Risk Reduction 22, 420–430. doi: 10.1016/j.ijdrr.2017.01.014
Nelson J. R., Grubesic T. H. (2018). Oil spill modeling: Risk, spatial vulnerability, and impact assessment. Prog. Phys. geography: Earth Environ. 42 (1), 112–127. doi: 10.1177/0309133317744
O'Brien-Delpesh C., Sinanan N., Martin H., Chadee A. (2022). Preserving fragile ecosystems from oil spills–an environmental sensitivity assessment of the east coast of Trinidad. Ocean Coast. Manage. 230, 106374. doi: 10.1016/j.ocecoaman.2022.106374
Petersen J., Michel J., Zengel S. (2002). Environmental sensitivity index guidelines. version 3.0. NOAA Tech. Memorandum NOS OR&R 11, 192.
Polsky C., Neff R., Yarnal B. (2007). Building comparable global change vulnerability assessments: The vulnerability scoping diagram. Global Environ. Change 17 (3-4), 472–485. doi: 10.1016/j.gloenvcha.2007.01.005
Ramsar Convention Secretariat (2010). “Coastal management: wetland issues in integrated coastal zone management,” in Ramsar handbooks for the wise use of wetlands. 4th ed, vol. 12. (Gland, Switzerland: Ramsar Convention Secretariat).
Richards D. R., Friess D. A. (2016). Rates and drivers of mangrove deforestation in southeast Asia 2000–2012. Proc. Natl. Acad. Sci. 113 (2), 344–349. doi: 10.1073/pnas.151027211
Rustemovich A. R., Alexeevich K. S. (2017). Oil spills from offshore drilling and development: Causes and effects on plants and animals. Eur. Sci. 8 (30), 16–21.
Saaty T. L. (1980). The analytic hierarchy process: Planning, priority setting, resources allocation (New York: Mcgraw-Hill).
Shabbir R., Ahmad S. S. (2016). Water resource vulnerability assessment in rawalpindi and Islamabad, Pakistan using analytic hierarchy process (AHP). J. King Saud University-Science 28 (4), 293–299. doi: 10.1016/j.jksus.2015.09.007
Song D., Gao Z., Zhang H., Xu F., Zheng X., Ai J., et al. (2017). GIS-based health assessment of the marine ecosystem in laizhou bay, China. Mar. pollut. Bull. 125 (1-2), 242–249. doi: 10.1016/j.marpolbul.2017.08.027
Subramanian N., Ramanathan R. (2012). A review of applications of analytic hierarchy process in operations management. Int. J. Production Economics 138 (2), 215–241. doi: 10.1016/j.ijpe.2012.03.036
Sun F., Carson R. T. (2020). Coastal wetlands reduce property damage during tropical cyclones. Proc. Natl. Acad. Sci. 117 (11), 5719–5725. doi: 10.1073/pnas.1915169117
Sun R., Gao G., Gong Z., Wu J. (2020b). A review of risk analysis methods for natural disasters. Natural Hazards 100 (2), 571–593. doi: 10.1007/s11069-019-03826-7
Sun Z., Sun W., Tong C., Zeng C., Yu X., Mou X, et al. (2015). China's coastal wetlands: conservation history, implementation efforts, existing issues and strategies for future improvement. Environ. Int. 79, 25–41. doi: 10.1016/j.envint.2015.02.017
Sun S., Zhang Y., Song Z., Chen B., Zhang Y., Yuan W., et al (2020a). Mapping coastal wetlands of the bohai rim at a spatial resolution of 10 m using multiple open-access satellite data and terrain indices. Remote Sens. 12 (24), 4114. doi: 10.3390/rs12244114
Tait M. K., Brunson M. W. (2022). Barriers and opportunities for cooperative wetland management: a case study in the greater rocky mountain national park ecosystem. Wetlands Ecol. Manage. 30 (2), 257–272. doi: 10.1007/s11273-021-09849-x
Thorne K., MacDonald G., Guntenspergen G., Ambrose R., Buffington K., Dugger B., et al. (2018). US Pacific coastal wetland resilience and vulnerability to sea-level rise. Sci. Adv. 4 (2), eaao3270. doi: 10.1126/sciadv.aao327
Wang D., Guo W., Kong S., Xu T. (2020). Estimating offshore exposure to oil spill impacts based on a statistical forecast model. Mar. pollut. Bull. 156, 111213. doi: 10.1016/j.marpolbul.2020.111213
Wang Y., Liu X., Yu X., Zheng X. (2018a). Assessing response capabilities for responding to ship-related oil spills in the Chinese bohai Sea. Int. J. Disaster Risk Reduction 28, 251–257. doi: 10.1016/j.ijdrr.2018.02.040
Wang Y., Zhang C., Feng L., Tang C., Yu X., Zheng X., et al. (2018b). Determination of refuge places for oil tankers in emergencies in the Chinese bohai Sea. Mar. Policy 90, 95–104. doi: 10.1016/j.marpol.2018.01.002
Xiong S., Long H., Tang G., Wan J., Li H. (2015). The management in response to marine oil spill from ships in China: A systematic review. Mar. pollut. Bull. 96 (1-2), 7–17. doi: 10.1016/j.marpolbul.2015.05.027
Yuan L., Liu D., Tian B., Yuan X., Bo S., Ma Q., et al. (2022). A solution for restoration of critical wetlands and waterbird habitats in coastal deltaic systems. J. Environ. Manage. 302, 113996. doi: 10.1016/j.jenvman.2021.113996
Yu F., Xue S., Zhao Y., Chen G. (2018). Risk assessment of oil spills in the Chinese bohai Sea for prevention and readiness. Mar. pollut. Bull. 135, 915–922. doi: 10.1016/j.marpolbul.2018.07.029
Zhong Z. Y., Chai L. Y., Liu Y. G., Chen C. (2010). Ecological security evaluation based on AHP of lake dongting. China Environ. Sci. 30 (Suppl.), 41–45. http://www.zghjkx.com.cn.
Keywords: coastal wetlands, the Chinese Bohai Sea, spatial variation of vulnerability, oil spill, GIS
Citation: Wang Y, Du P, Liu J and Chen C (2022) Spatial variation of coastal wetland vulnerability to oil spill stress in the Bohai Sea. Front. Mar. Sci. 9:1073906. doi: 10.3389/fmars.2022.1073906
Received: 19 October 2022; Accepted: 05 December 2022;
Published: 23 December 2022.
Edited by:
Patrick Reis-Santos, University of Adelaide, AustraliaReviewed by:
Shenliang Chen, East China Normal University, ChinaSalvador García-Ayllón Veintimilla, Technical University of Cartagena, Spain
Copyright © 2022 Wang, Du, Liu and Chen. This is an open-access article distributed under the terms of the Creative Commons Attribution License (CC BY). The use, distribution or reproduction in other forums is permitted, provided the original author(s) and the copyright owner(s) are credited and that the original publication in this journal is cited, in accordance with accepted academic practice. No use, distribution or reproduction is permitted which does not comply with these terms.
*Correspondence: Yebao Wang, MTMwMzE2MTM0MDlAMTYzLmNvbQ==