 Zijun Zhou1,2*
 Zhongbing Sun1,2
 Yiren Zhou1,2Qihua Zuo1,2Hongchuan Wang1,2Yongping Chen1,3Feiyang Huang1,3
- 1State Key Laboratory of Hydrology-Water Resources and Hydraulic Engineering, Nanjing Hydraulic Research Institute, Nanjing, China
- 2Nanjing Hydraulic Research Institute, Nanjing, China
- 3College of Harbor, Coastal and Offshore Engineering, Hohai University, Nanjing, China
Normal stress on dikes is one of the most critical parameters for a sound dike design. With more rapidly rising sea levels due to global warming, dikes are seriously threatened by overtopping induced by the combination of wave and storm surge. Compared with wave overtopping on positive freeboard, the curling breaking wave on dikes induced by the combined wave and surge overtopping may destroy the weakly protected dike crest and landward slope. Thus, in order to prevent severe damage to dikes, it is necessary to fully understand the normal stress induced by the combined wave and surge overtopping. In this paper, physical model tests were carried out to study the normal stress on dike induced by the combined wave and surge overtopping. Two characteristics of normal stress on dike were observed. The spatial distribution of normal stress on dike was also analyzed. It was found that the Weibull distribution can be used to effectively describe the statistical distribution of peak normal stresses. Furthermore, by curve fitting of the laboratory measured data, the Weibull factors on the part of the crest and the upper part of the landward slope were obtained.
1. Introduction
The normal stress on dikes is one of the most critical parameters in their design. In conventional dikes, the dike crest is normally higher than the sea level (positive freeboard), and the seaward slope is also well protected with an armor layer and is able to withstand strong wave impacts. Several previous studies have focused on the normal stress (wave pressure) induced by waves on the seaward slope under positive freeboard (e.g., Hattori et al., 1994; Jensen et al., 2014; Zhou et al., 2020; Celi et al., 2021; Pan et al., 2022; Raby et al., 2022). These studies found that the large value of normal stress often occurs when the breaking wave swashes directly against the seaward slope (Hattori et al., 1994).
With more rapidly rising sea levels due to global warming (IPCC, 2012), there is a serious threat to dikes induced by the combined wave and surge overtopping (i.e., wave overtopping under negative freeboard) (Hughes, 2008). For example, during Hurricane Katrina in 2005, the combined wave and surge overtopping caused more than 50 breaches of dikes in New Orleans (ASCE Hurricane Katrina External Review Panel, 2007). Compared with the threat induced by wave overtopping on positive freeboard, the curling breaking wave on dikes induced by the combined wave and surge overtopping may cause more severe damage on the less protected, vulnerable dike crest and landward slope, although they are paved with grass or gravel.
After Hurricane Katrina, many hydraulic parameters, such as the average overtopping discharge, the individual wave overtopping volumes, flow velocity, flow thickness, turbulent kinetic energy, and the shear stress of the combined wave and surge overtopping, have been investigated and thoroughly studied (e.g., Reeve et al., 2008; Hughes and Nadal, 2009; Hughes and Nadal, 2009; Hughes et al., 2011; Li et al., 2012; Pan et al., 2012; Pan et al., 2013a; Pan et al., 2013b; Yuan et al., 2014; Pan et al., 2015; EurOtop, 2017; Pan et al., 2020). Despite this, the normal stress on the dike crest and the landward slope has been seldom discussed and is still not well understood. This is because, under a high value of negative freeboard, the overtopping flow of the combined wave and surge is similar to the surge-only overflow, which passes the dike crest smoothly and causes high shear stress along the dike, the normal stress being small enough to be neglected. However, under a lower value of negative freeboard (Pan et al., 2020), the overtopping flow of the combined wave and surge is similar to the wave-only overtopping flow. The curling breaking wave may be generated and swashed downward directly against the dike crest or on the landward slope. In this case, a large normal stress is exerted on the dike crest or on the landward slope. Consequently, neglecting this extra normal stress in the design of dikes may potentially compromise the dike stability or cause dike breaching. Therefore, the study of the normal stress on dikes induced by the combined wave and surge overtopping is essential.
In this paper, physical model tests were conducted to investigate the normal stress on dike induced by the combined wave and surge overtopping. At the same time, the average overtopping discharges were accurately measured and compared with those from several existing theoretical and experimental formulas. From the measured time series of the normal stresses on dike, two characteristics (i.e., abrupt and gradual change) were observed. These were consonant with the two wave passing patterns (i.e., breaking or smooth passing). Furthermore, the spatial distribution of the normal stress on dike was analyzed. The statistical distribution of the peak normal stress was effectively expressed by the Weibull distribution. Additionally, the Weibull factors, respectively on the dike crest and on the upper part of the landward slope, were calculated by curve fitting of the laboratory measured data.
2. Laboratory experiment setup
Physical model tests were carried out in the wave flume (175 m long, 1.8 m wide, and 1.8 m deep) at the River and Harbor Engineering Department of Nanjing Hydraulic Research Institute, China (Figure 1). The wave flume was equipped with a blade-type wave maker.
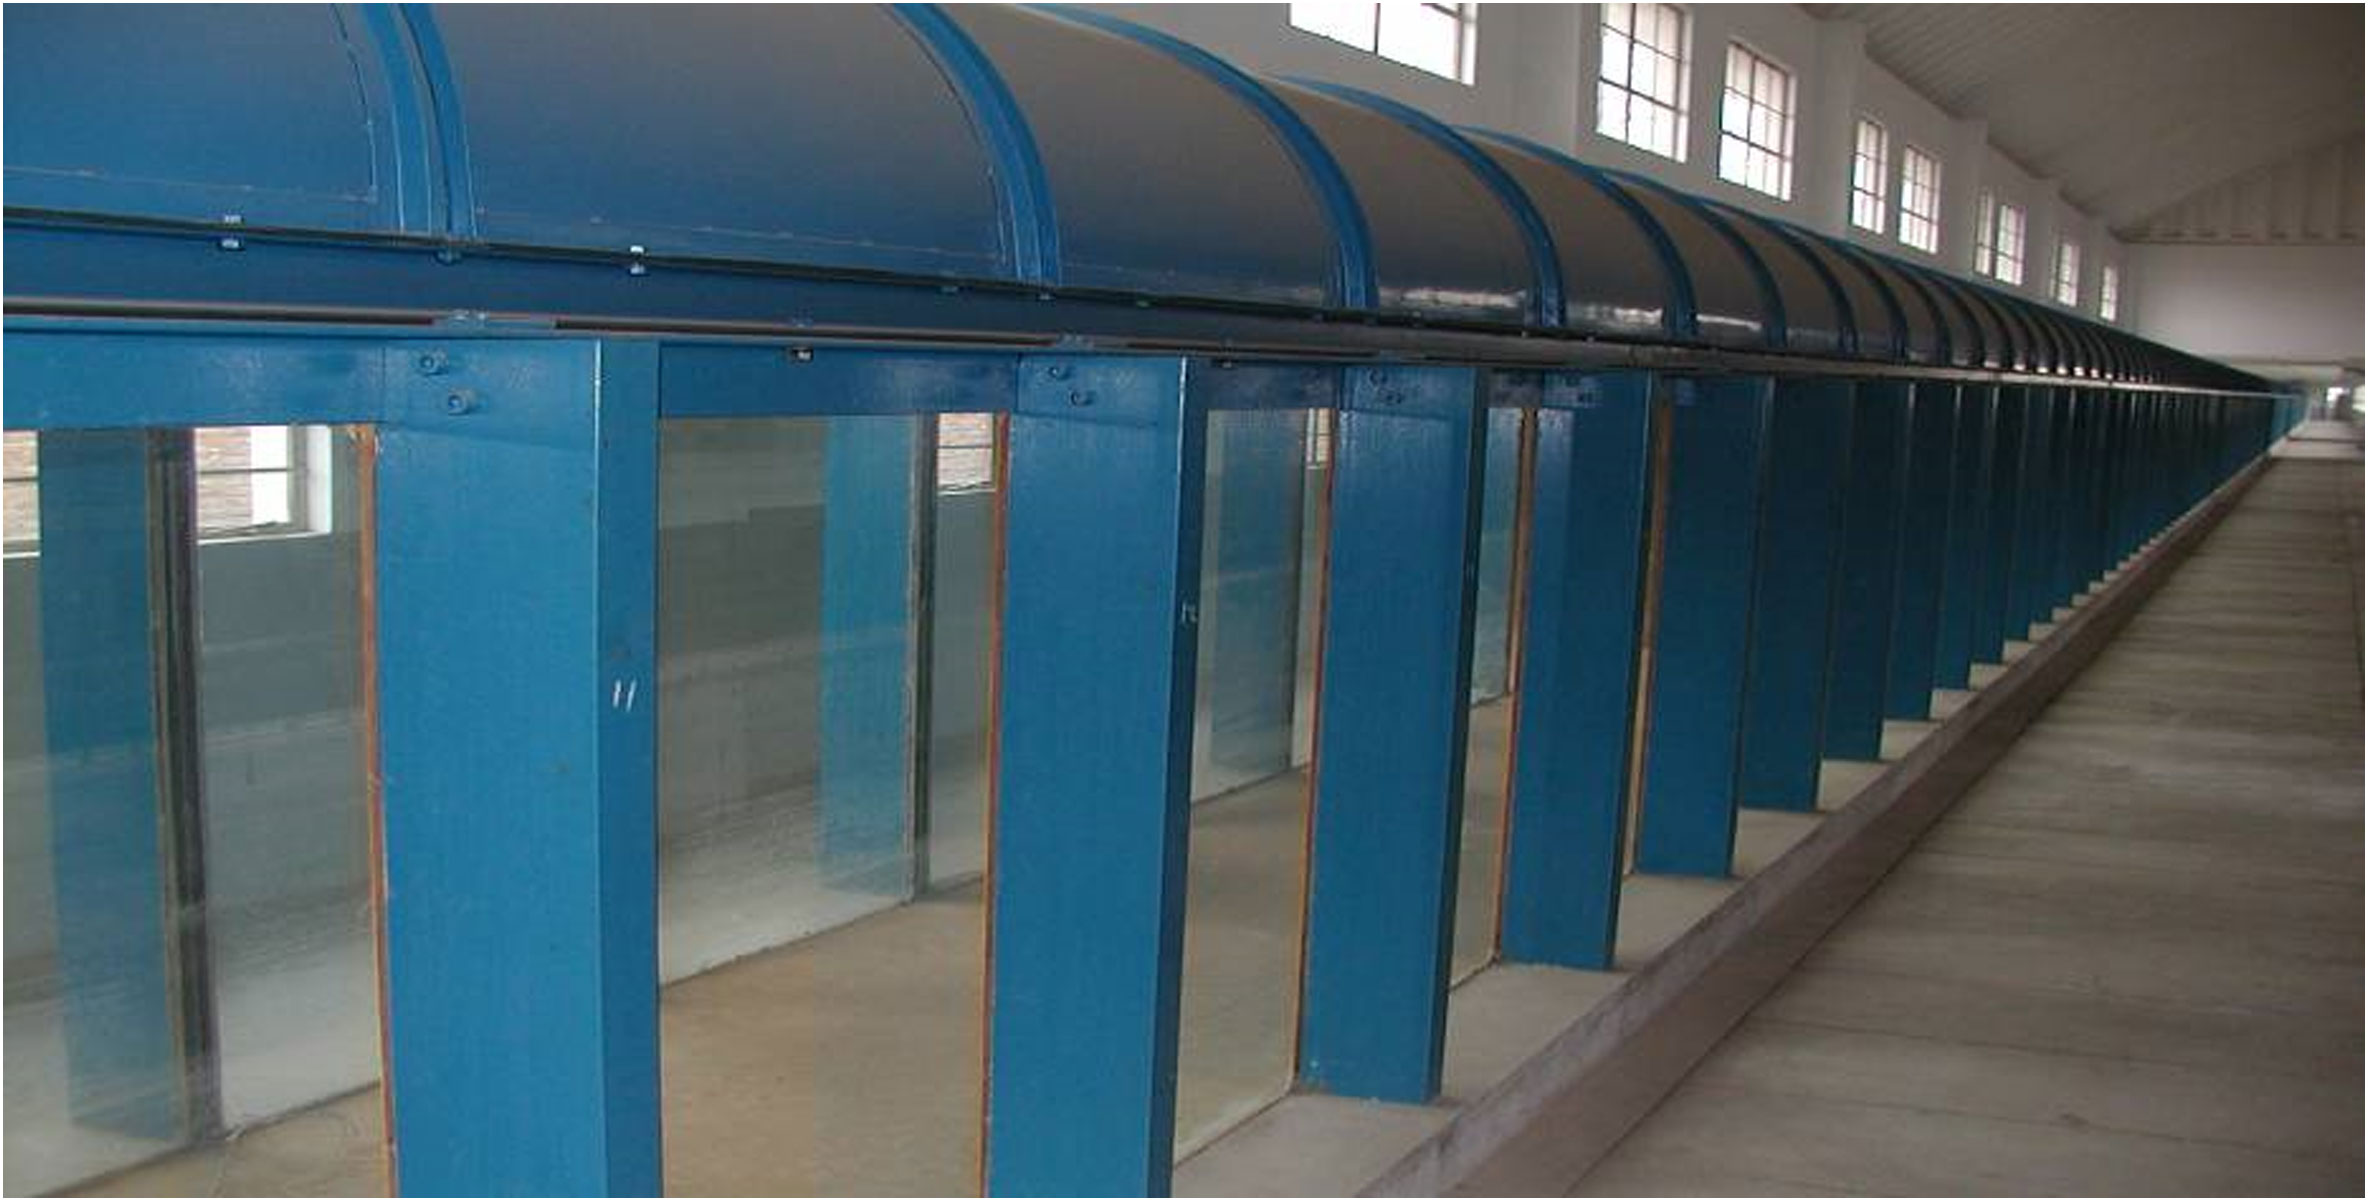
Figure 1 Photo of the wave flume.
A trapezoidal dike cross-section was designed with a geometry scale of 1:10 normal model. The whole layout of the experiment is shown in Figure 2. A long 1:100 approach slope, following a 1:10 transition slope, was connected to the bottom of the flume in the front of the model. The distance between the tested dike cross-section to the wave maker was 42.0 m. The crest of the tested dike cross-section was 0.925 m above the bottom of the wave flume (0.325 m above the top of the 1:10 slope), while the width of the dike crest was 0.257 m in model scale. The seaward slope of the dike model section was 1:4.25, while the landward slope was 1:3. Three plastic plates were respectively installed on the seaward slope, the crest, and the landward slope. The bottom of the flume was equipped with a bidirectional circulating pump, which was used to provide a return flow in order to counterbalance the mean overtopping due to the combined wave and surge, as shown in Figure 2.
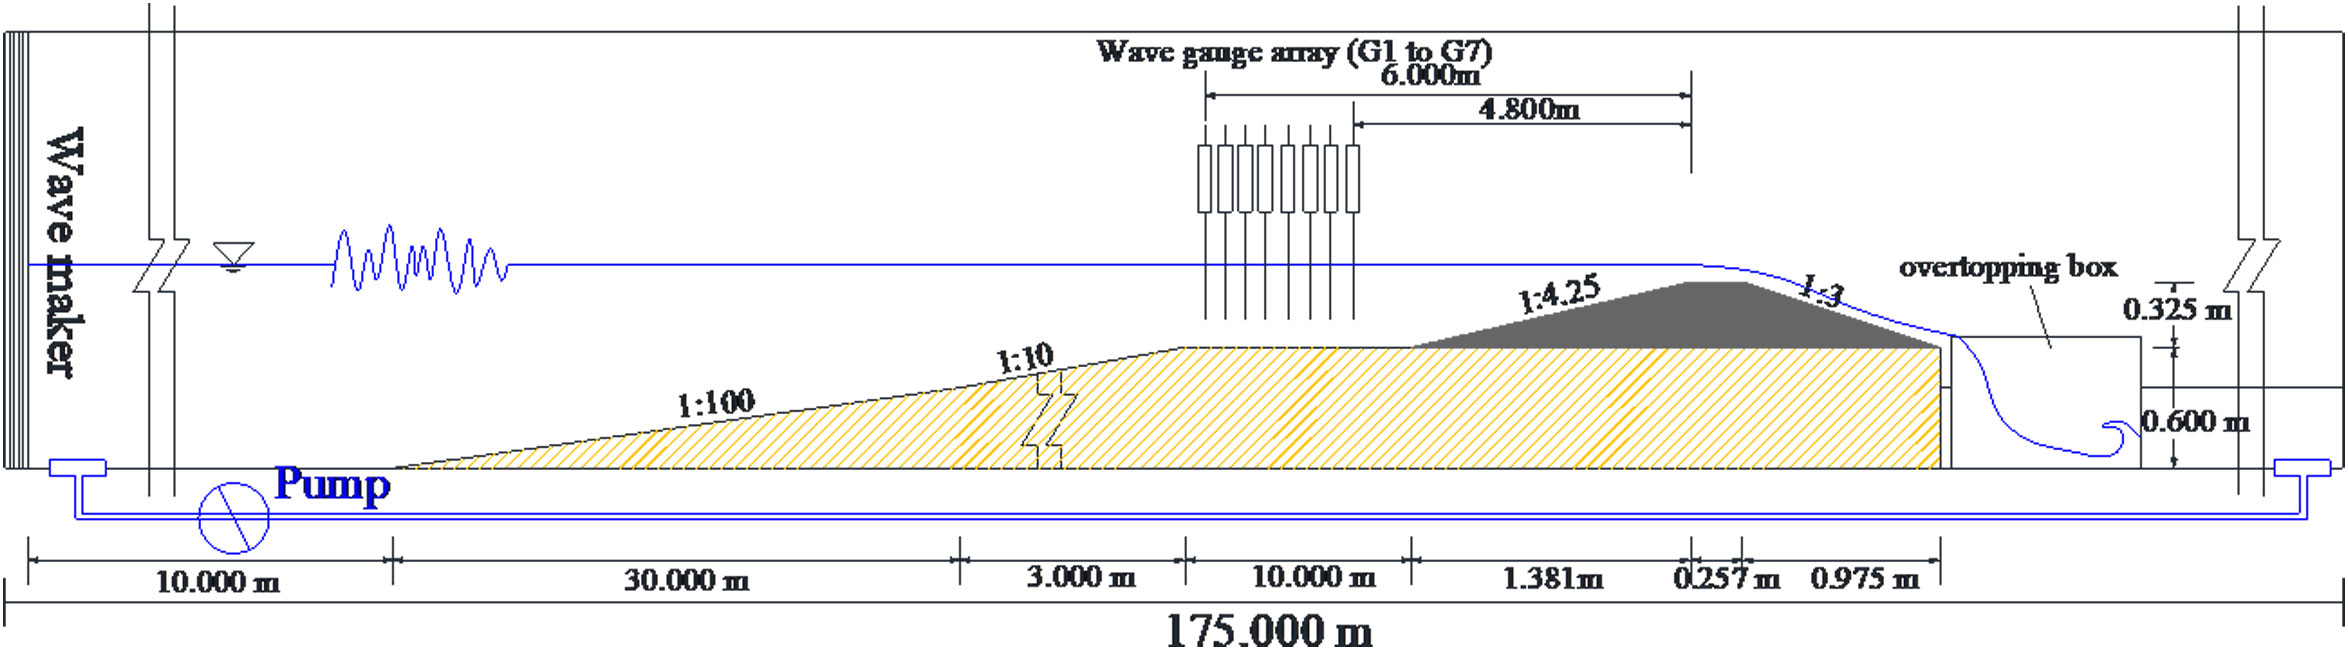
Figure 2 Profile view of the wave flume.
Seven wave gauges, G1–G7, were placed near the toe of the seaward slope (Figure 2). From the measured time series of wave heights, the incident and reflected wave heights were calculated via a three-point method. The measuring frequency of the wave gauge was 100 Hz.
The average overtopping discharge was measured at the inside of the tested section by collecting the overtopping water (over a width of 0.1 m) via an overtopping chute (a lifting device was installed in the front of the chute, which enables placing and removing the chute from the dike crest quickly) into the overtopping box (equipped with two large pumps). A larger pump (pump A) was connected with a Φ10-cm steel pipe to the back of the wave flume, and a flow meter was placed on the steel pipe. A smaller pump (pump B) was connected with a plastic pipe to a bucket that is constantly weighed on a balance. Pump C was used to pump the water from the bucket to the wave flume in order to keep the water level unchanged in the wave flume during the test (see Figure 3).
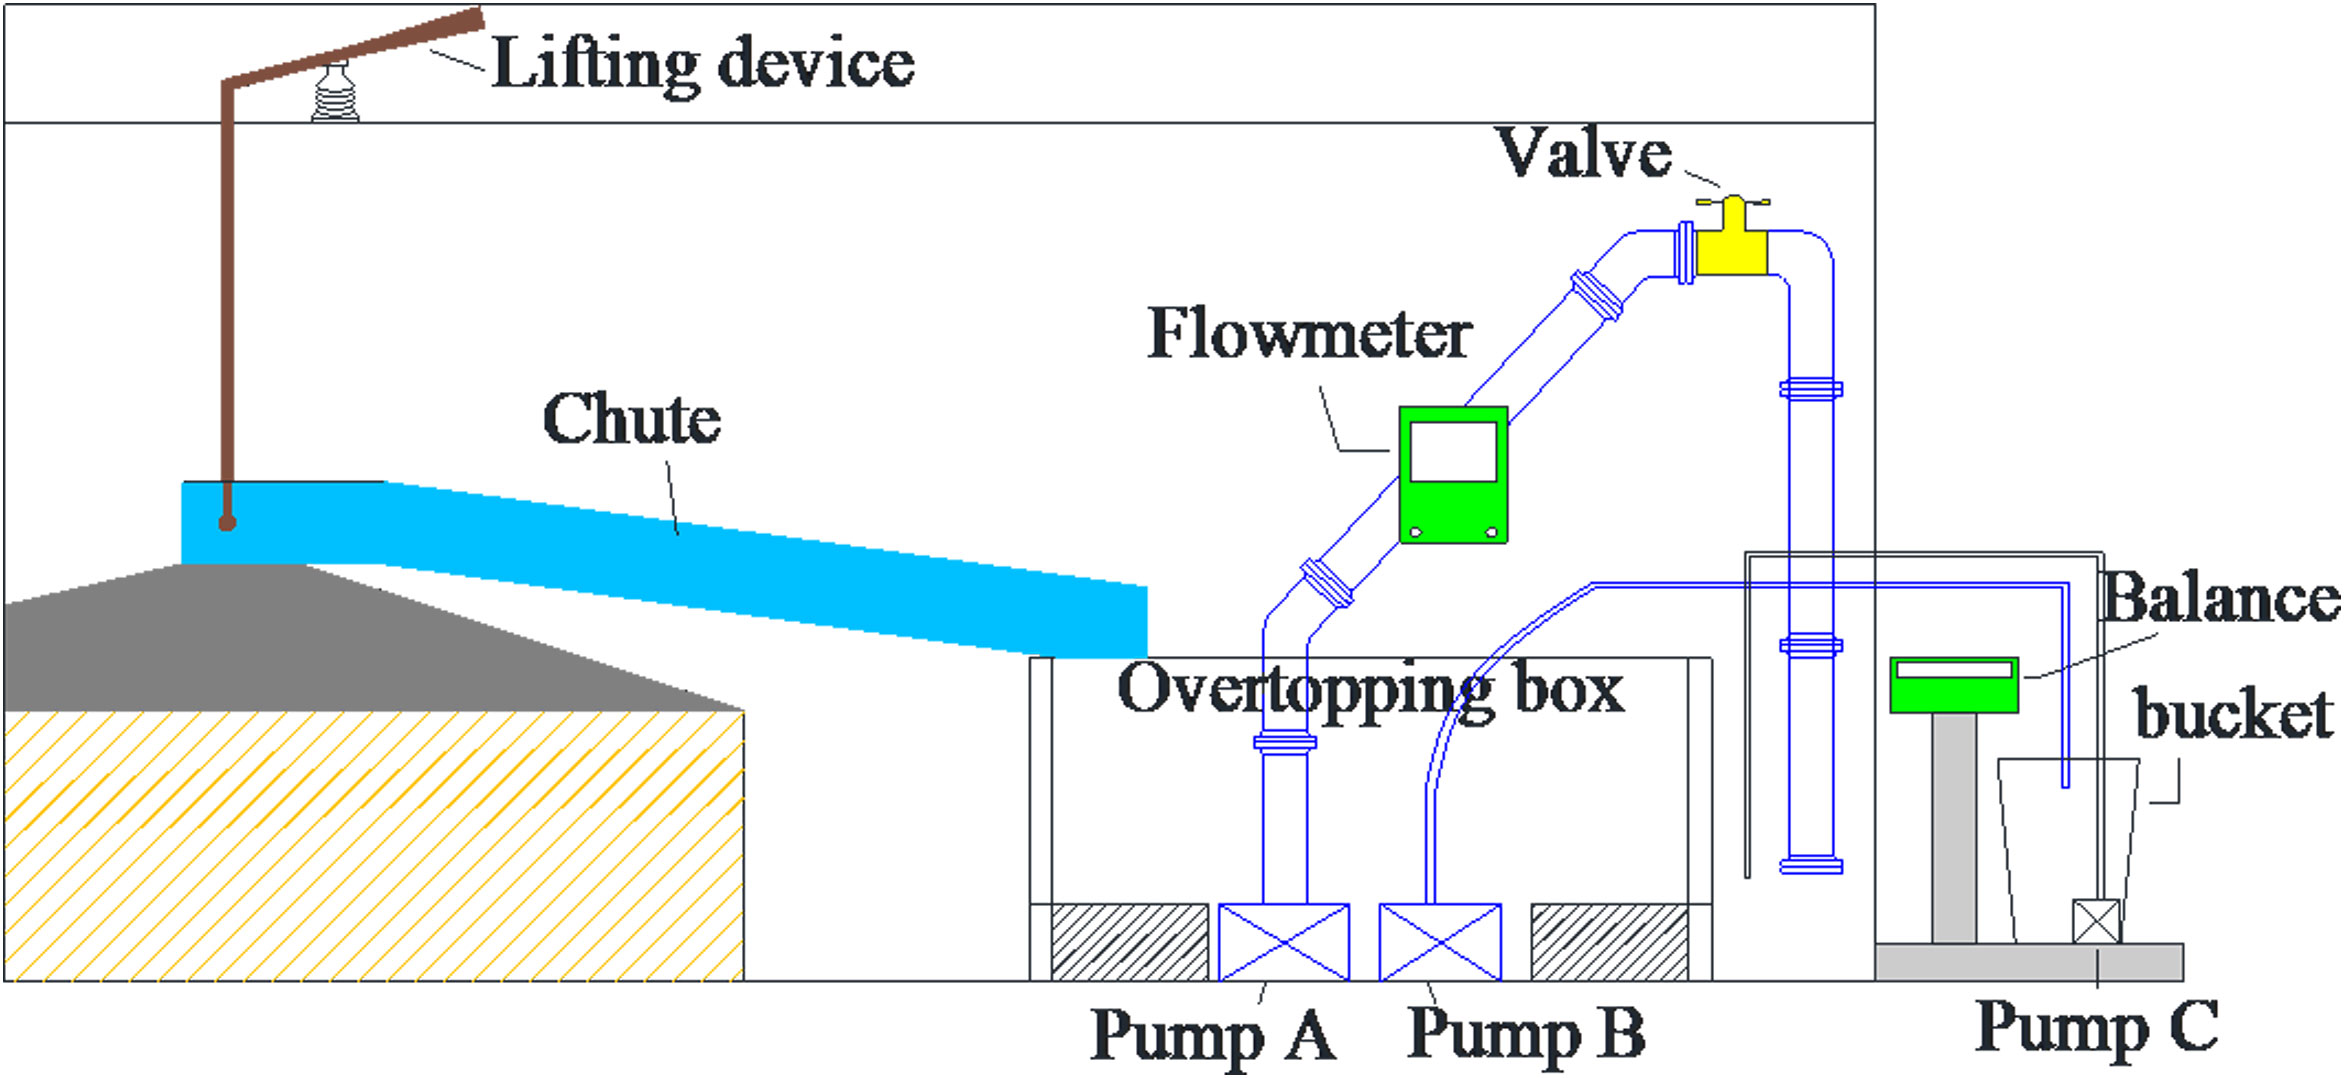
Figure 3 Overtopping collection system.
At the beginning of the test, the chute was lifted under the surge-only overflow condition. When the wave reached the dike, the chute was placed down on the dike crest and timing was started. In smaller discharge test cases (Rc > −0.06 m), pump B was used to pump the water from the overtopping box into the bucket and then a balance was used to weigh the water. In larger discharge test cases (Rc ≤ −0.06 m), pump A was opened and a flow meter was used to measure the discharge. At the end of wave making, we lifted the chute and stopped timing to measure the total water volume or the discharge during this period. Using this process, the average discharge was obtained.
As shown in Figure 4, the normal stress on the dike was measured by 15 pressure gauges, P1–P15, of which five were evenly distributed on the dike crest (the interval was 0.043 m in model scale) and 10 were located on the landward slope (the interval was 0.075 m in model scale). The measuring frequency of the pressure gauge was 100 Hz. The collected pressure data were filtered to remove unwanted higher- or lower-frequency oscillations.
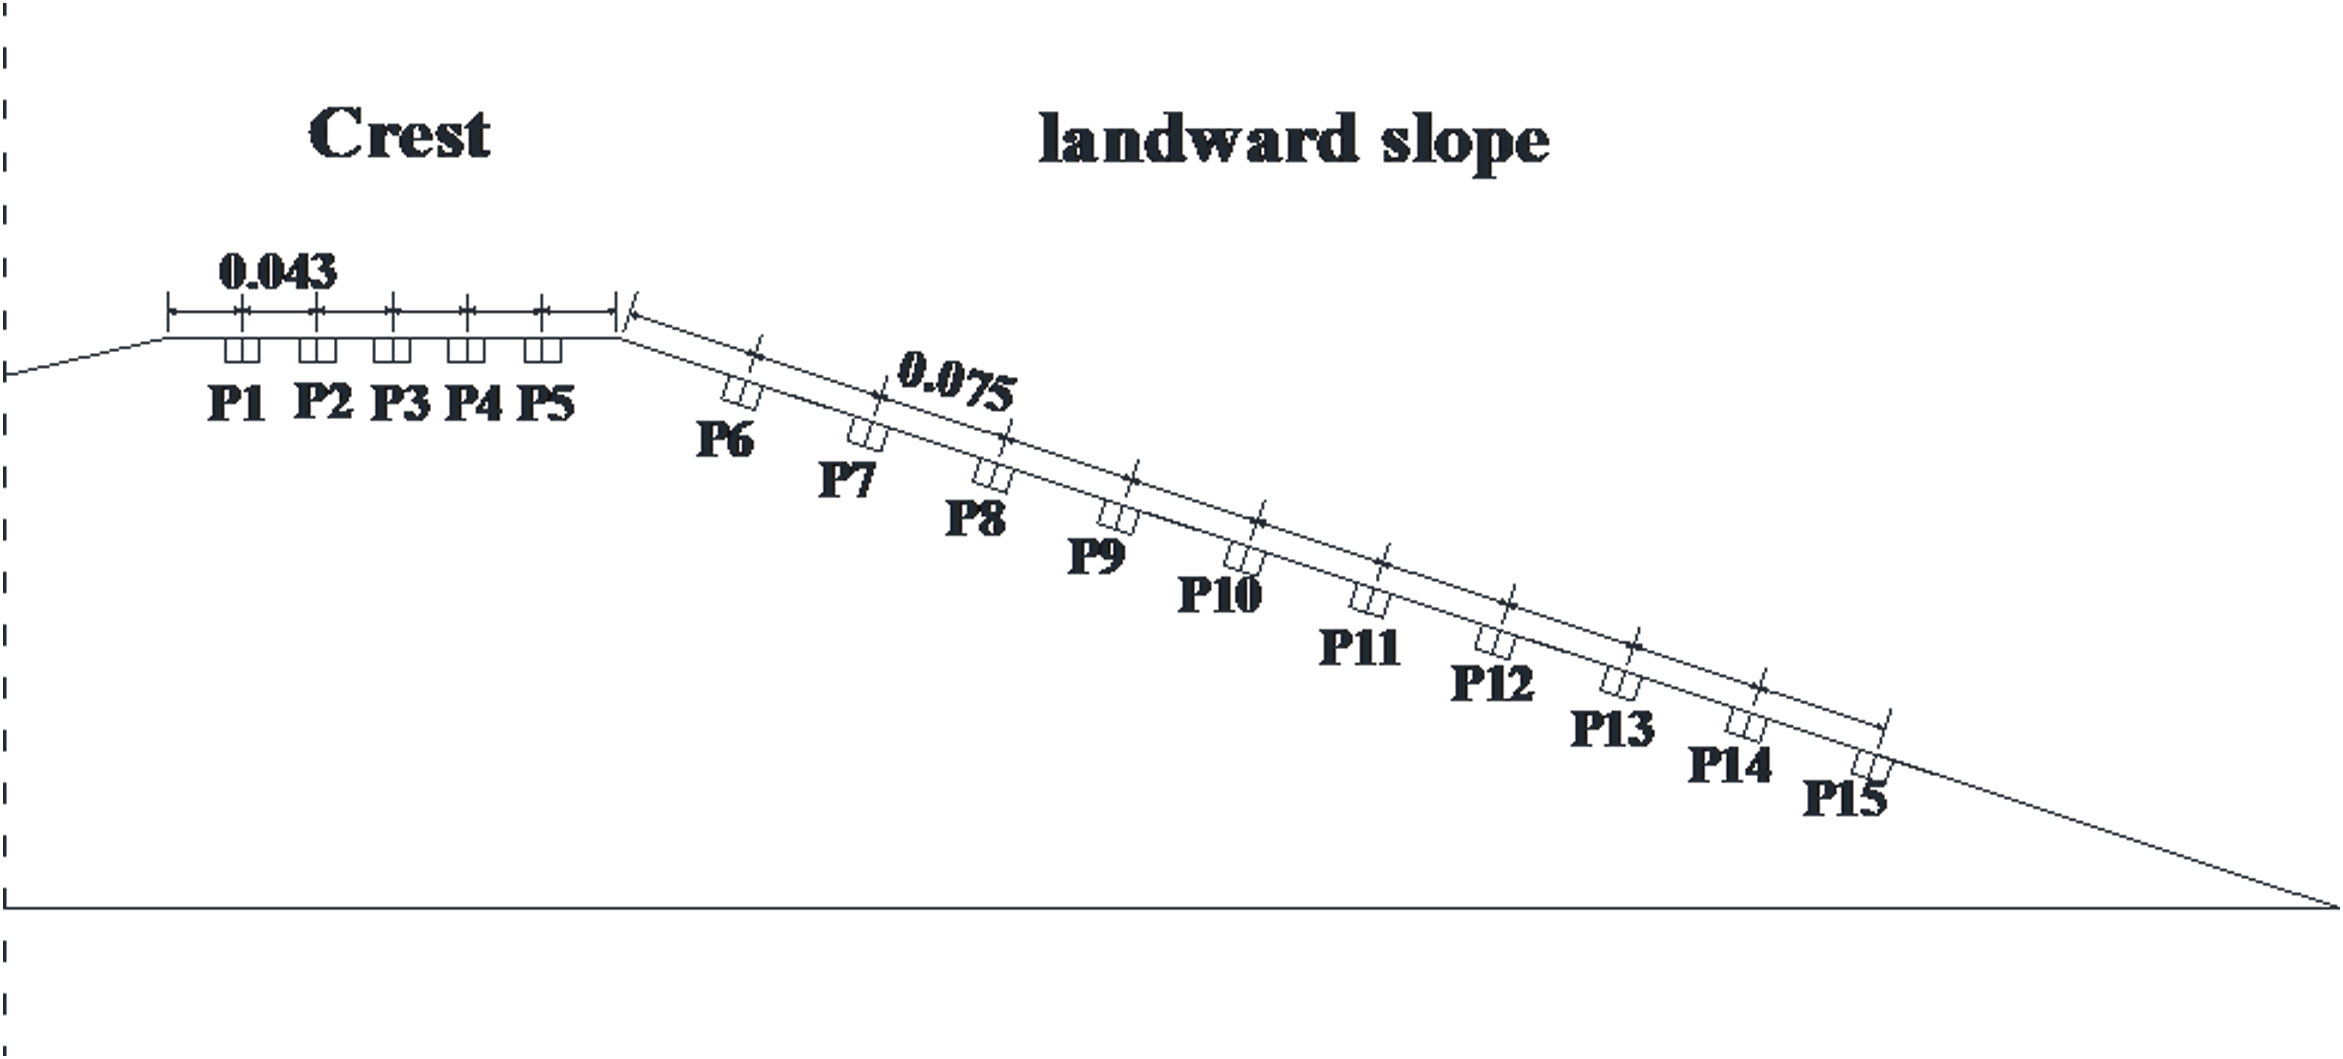
Figure 4 Layout of the pressure gauges.
In this test, the incident waves were generated according to the JONSWAP (Joint North Sea Wave Project) spectrum. A total of 15 unique wave conditions are listed in Table 1. Each test lasted for 480 s. This gave about 140 waves for tests with the longest peak wave periods.
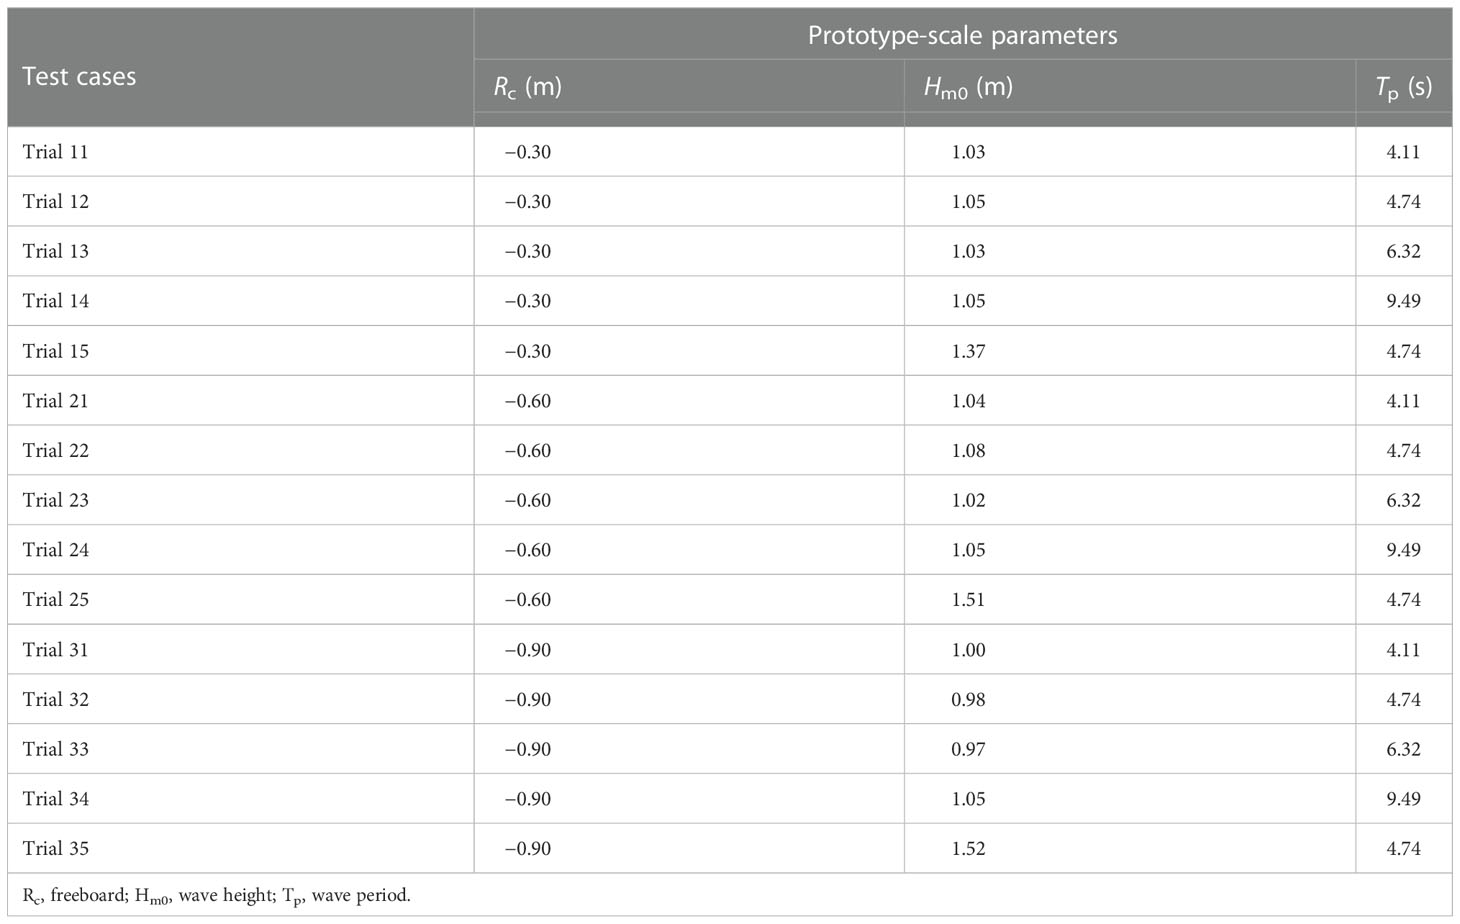
Table 1 Test cases of the physical model tests.
3. Average discharge of the combination of wave and surge
Understanding the average discharge is the first step to understanding the normal stresses on dikes induced by the combined wave and surge overtopping. In this section, the measured average discharge in the test was compared with those of the existing average discharge formulas.
3.1. Existing average discharge formulas of the combination of wave and surge
Several formulas had been obtained from previous studies to estimate the average discharge of the combined wave and surge overtopping (e.g., Reeve et al., 2008; Hughes and Nadal, 2009; EurOtop, 2017).
In EurOtop (2017), the average overtopping discharge of the combined wave and surge overtopping can be calculated as:
The average discharge was divided into two parts: surge-only overflow (qs) and wave overtopping (qw) with zero freeboard. The surge-only overflow (qs) part was calculated as follows (e.g., Henderson, 1966):
where g is the gravity acceleration and h1 (−Rc) is the upstream head.
The wave overtopping (qw) part was calculated as follows (e.g., Schüttrumpf et al., 2001):
where Hm0 is the significant wave height based on the wave spectrum and ξm-1,0 is the breaking parameter based on the deepwater wavelength and mean energy period. It should be noted that Eqs. 3, 4 show no relationship with relative freeboard because they are only applicable for cases with zero freeboard.
In Reeve et al. (2008), the average overtopping discharge formula was obtained using a numerical wave flume model, which can be calculated as:
where ξp is the breaking parameter based on the deep-water wavelength and peak energy period. The value of freeboard (Rc) should be entered as a negative number.
In Hughes and Nadal (2009), the average overtopping discharge formula was obtained by a laboratory study on a wave flume with a prototype-to-model length scale of 25:1. The formula related to the dimensionless overtopping discharge and the relative freeboard can be described as:
It should be noted that the wave period is not related to the average overtopping discharge, according to the conclusion of Hughes and Nadal (2009).
3.2. Analysis of the average overtopping discharge
Table 2 lists the average overtopping discharge values measured in this test. Figure 5 shows the dimensionless average discharge versus the relative freeboard for all 15 tests. The calculation results using the formulas of EurOtop (2017), Reeve et al. (2008), and Hughes and Nadal (2009) are also compared in Figure 5. The fitting curve of the Hughes and Nadal (2009) formula (Eq. 7) is shown in Figure 5. The data points calculated using the formulas of EurOtop (2017) (Eq. 1) and Reeve et al. (2008) (Eqs. 5, 6) were based on the wave conditions in this test.
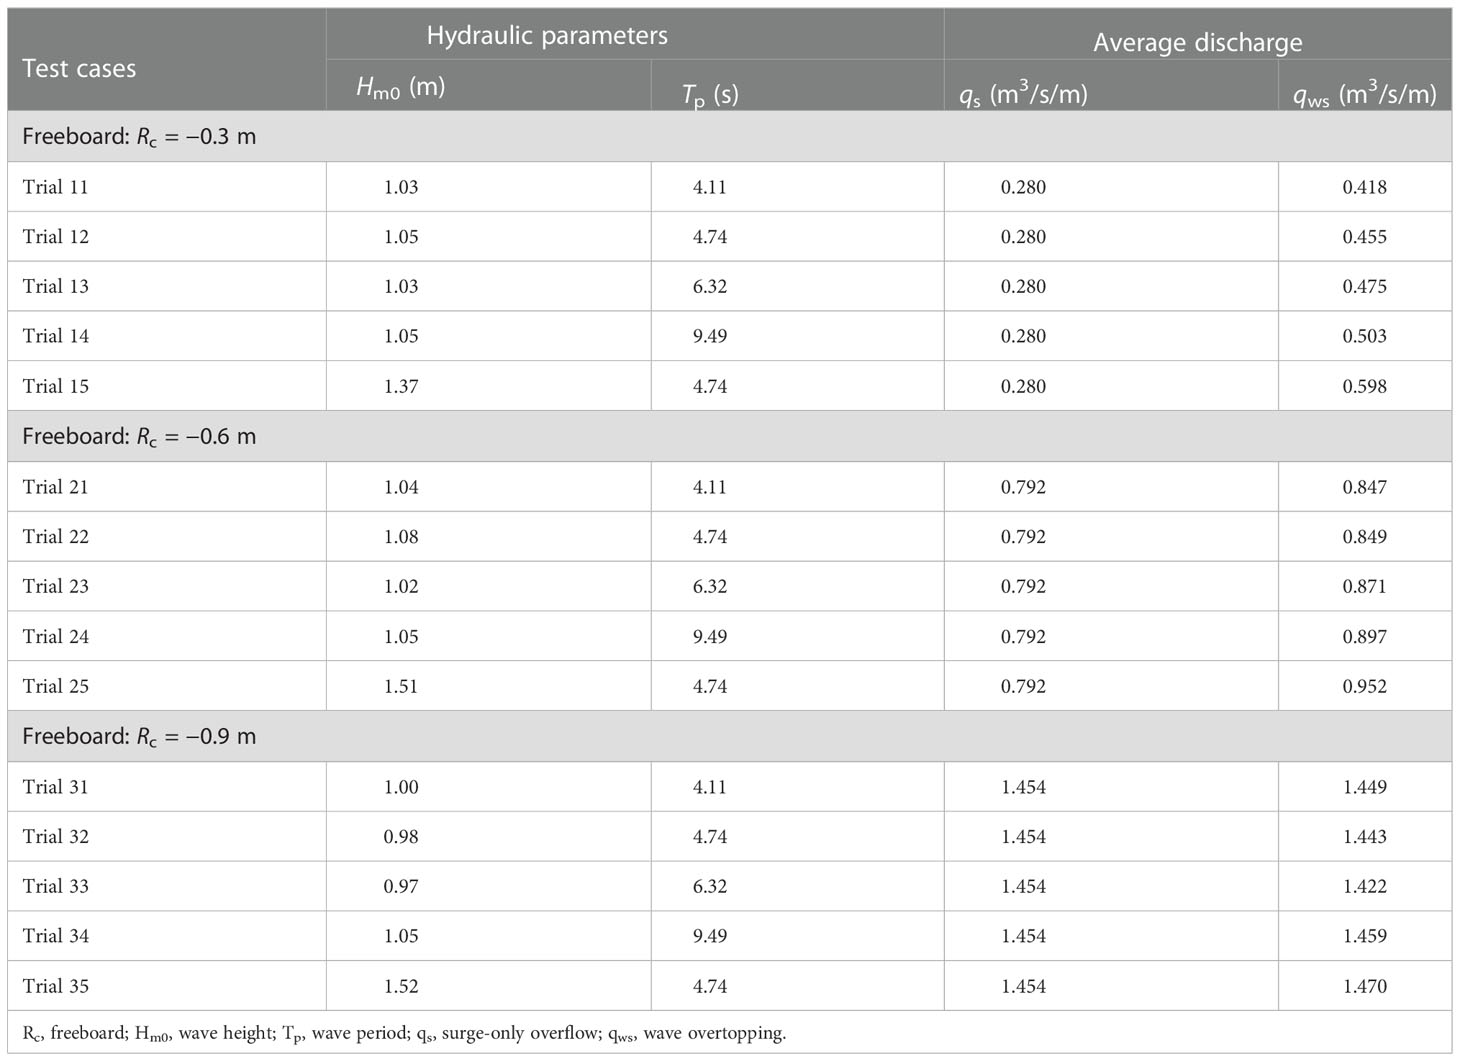
Table 2 Measured average overtopping discharge.
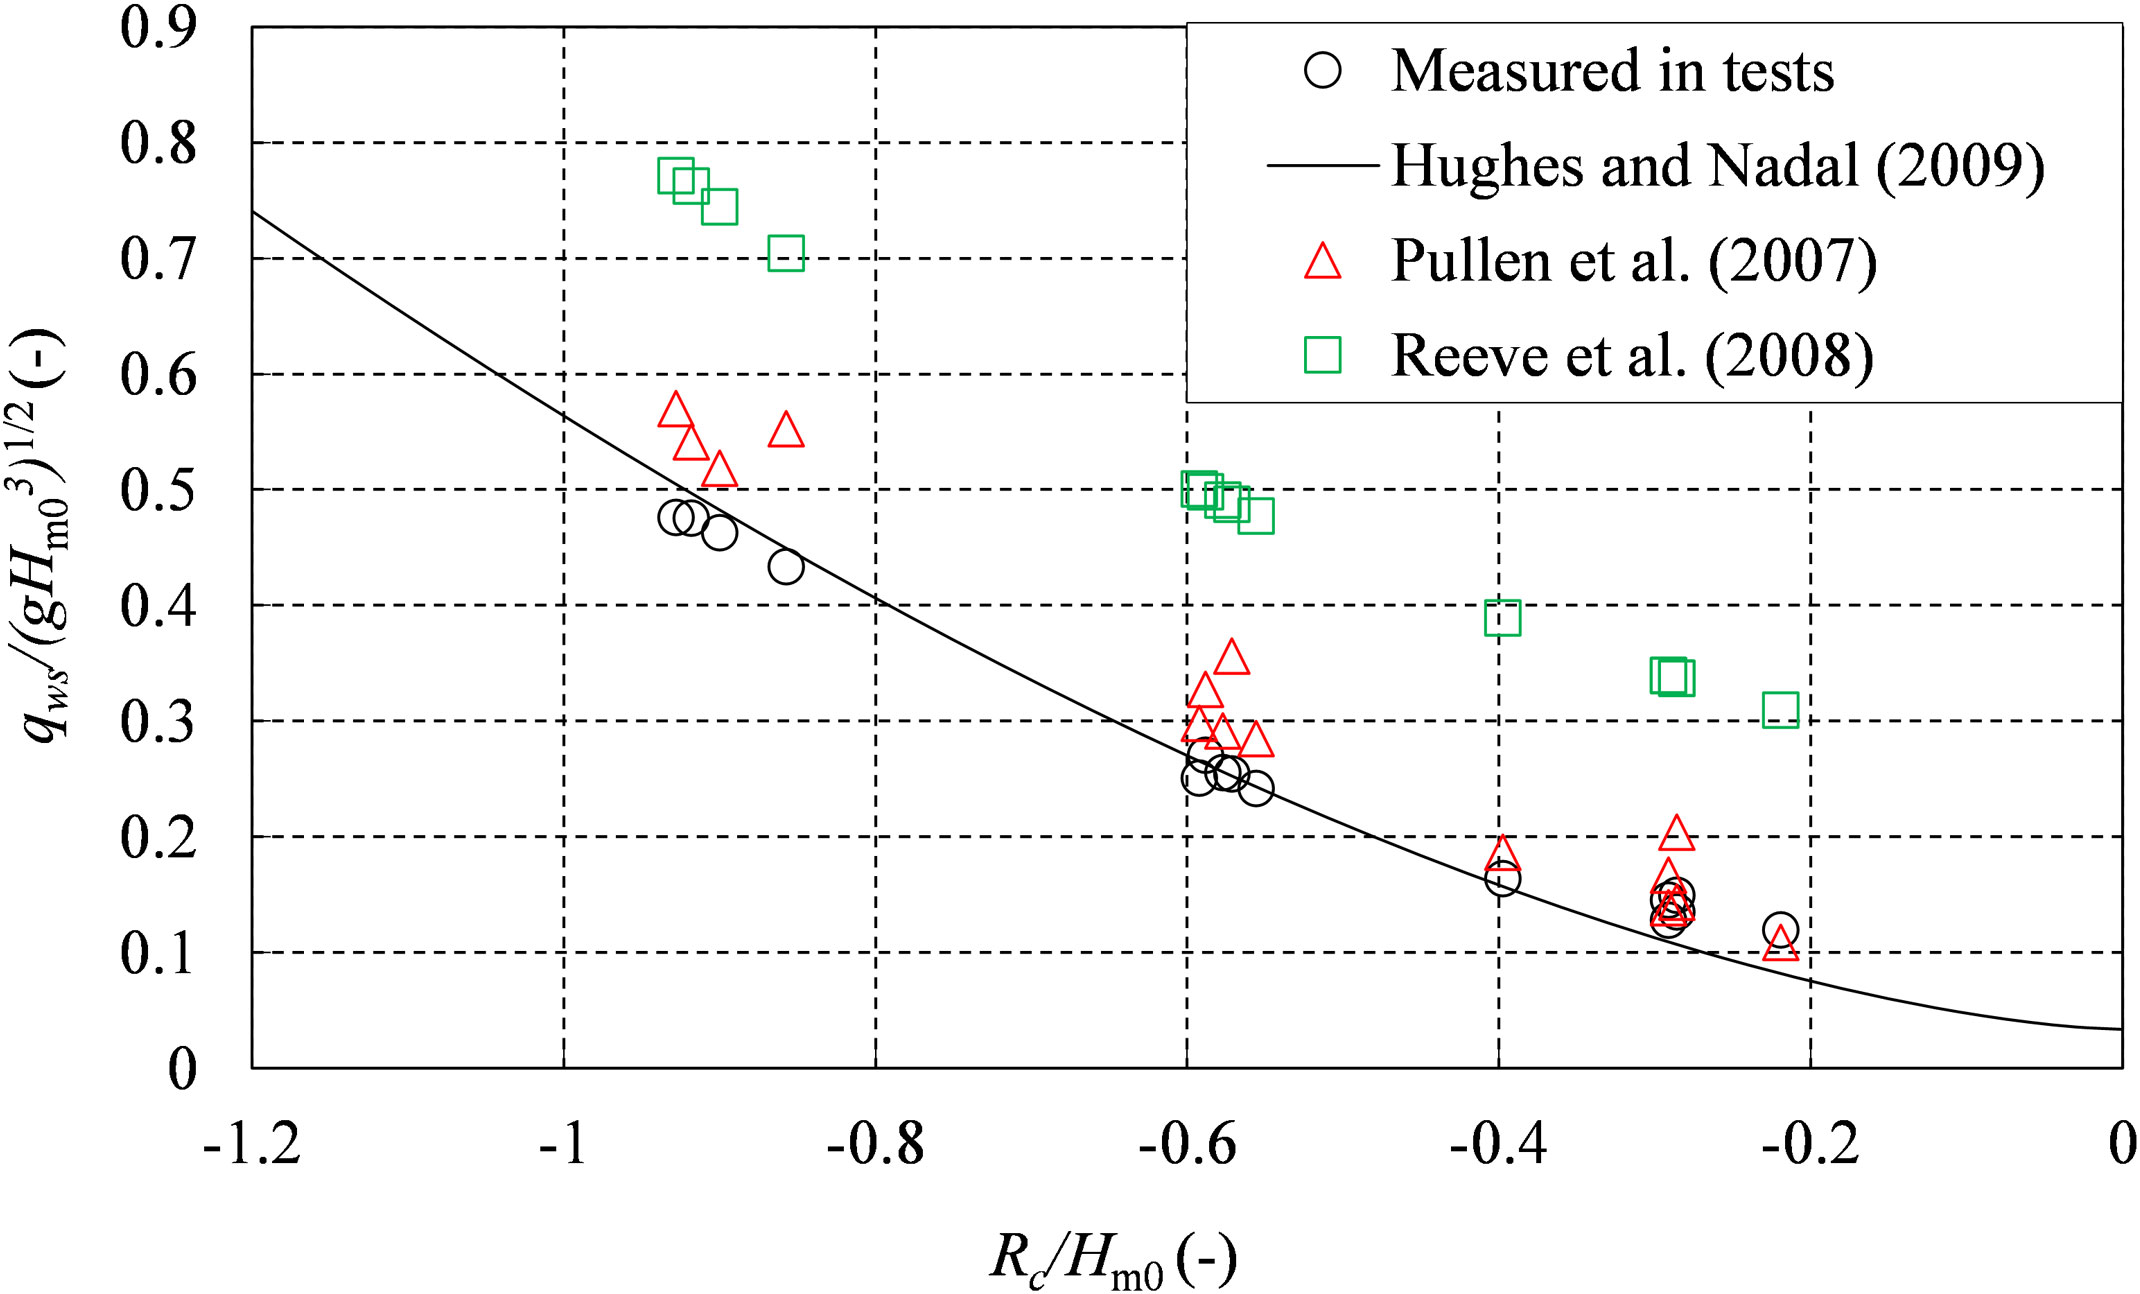
Figure 5 Dimensionless average discharge versus relative freeboard.
As shown in Figure 5, the data points from the tests were consistent with the calculation results of the formula of EurOtop (2017) in cases of very low absolute values of negative relative freeboard (−0.4 ≤ Rc/Hm0< 0) and showed good fit with the formula of Hughes and Nadal (2009) in cases of higher absolute values of negative relative freeboard (Rc/Hm0< −0.4). However, all of the data points from the tests were smaller than those of the method of Reeve et al. (2008).
Li et al., 2012 concluded that the relative freeboard reflects the proportional relationship between the surge-only overflow and the wave-only overtopping in the combination of surge and wave. Figure 6 shows the ratio of qws/qs versus the relative negative freeboard. For higher absolute values of relative freeboard, the average discharge of the combined wave and surge overtopping (qws) was almost equal to the discharge of the surge-only overflow (qs). This indicates that the hydraulic parameters such as wave period and gradient of seaward slope may not be related to the average overtopping discharge under higher absolute values of negative relative freeboard. However, these hydraulic parameters were still considered in Eq. 1 EurOtop, 2017), whose estimates were larger under higher absolute values of relative freeboard.
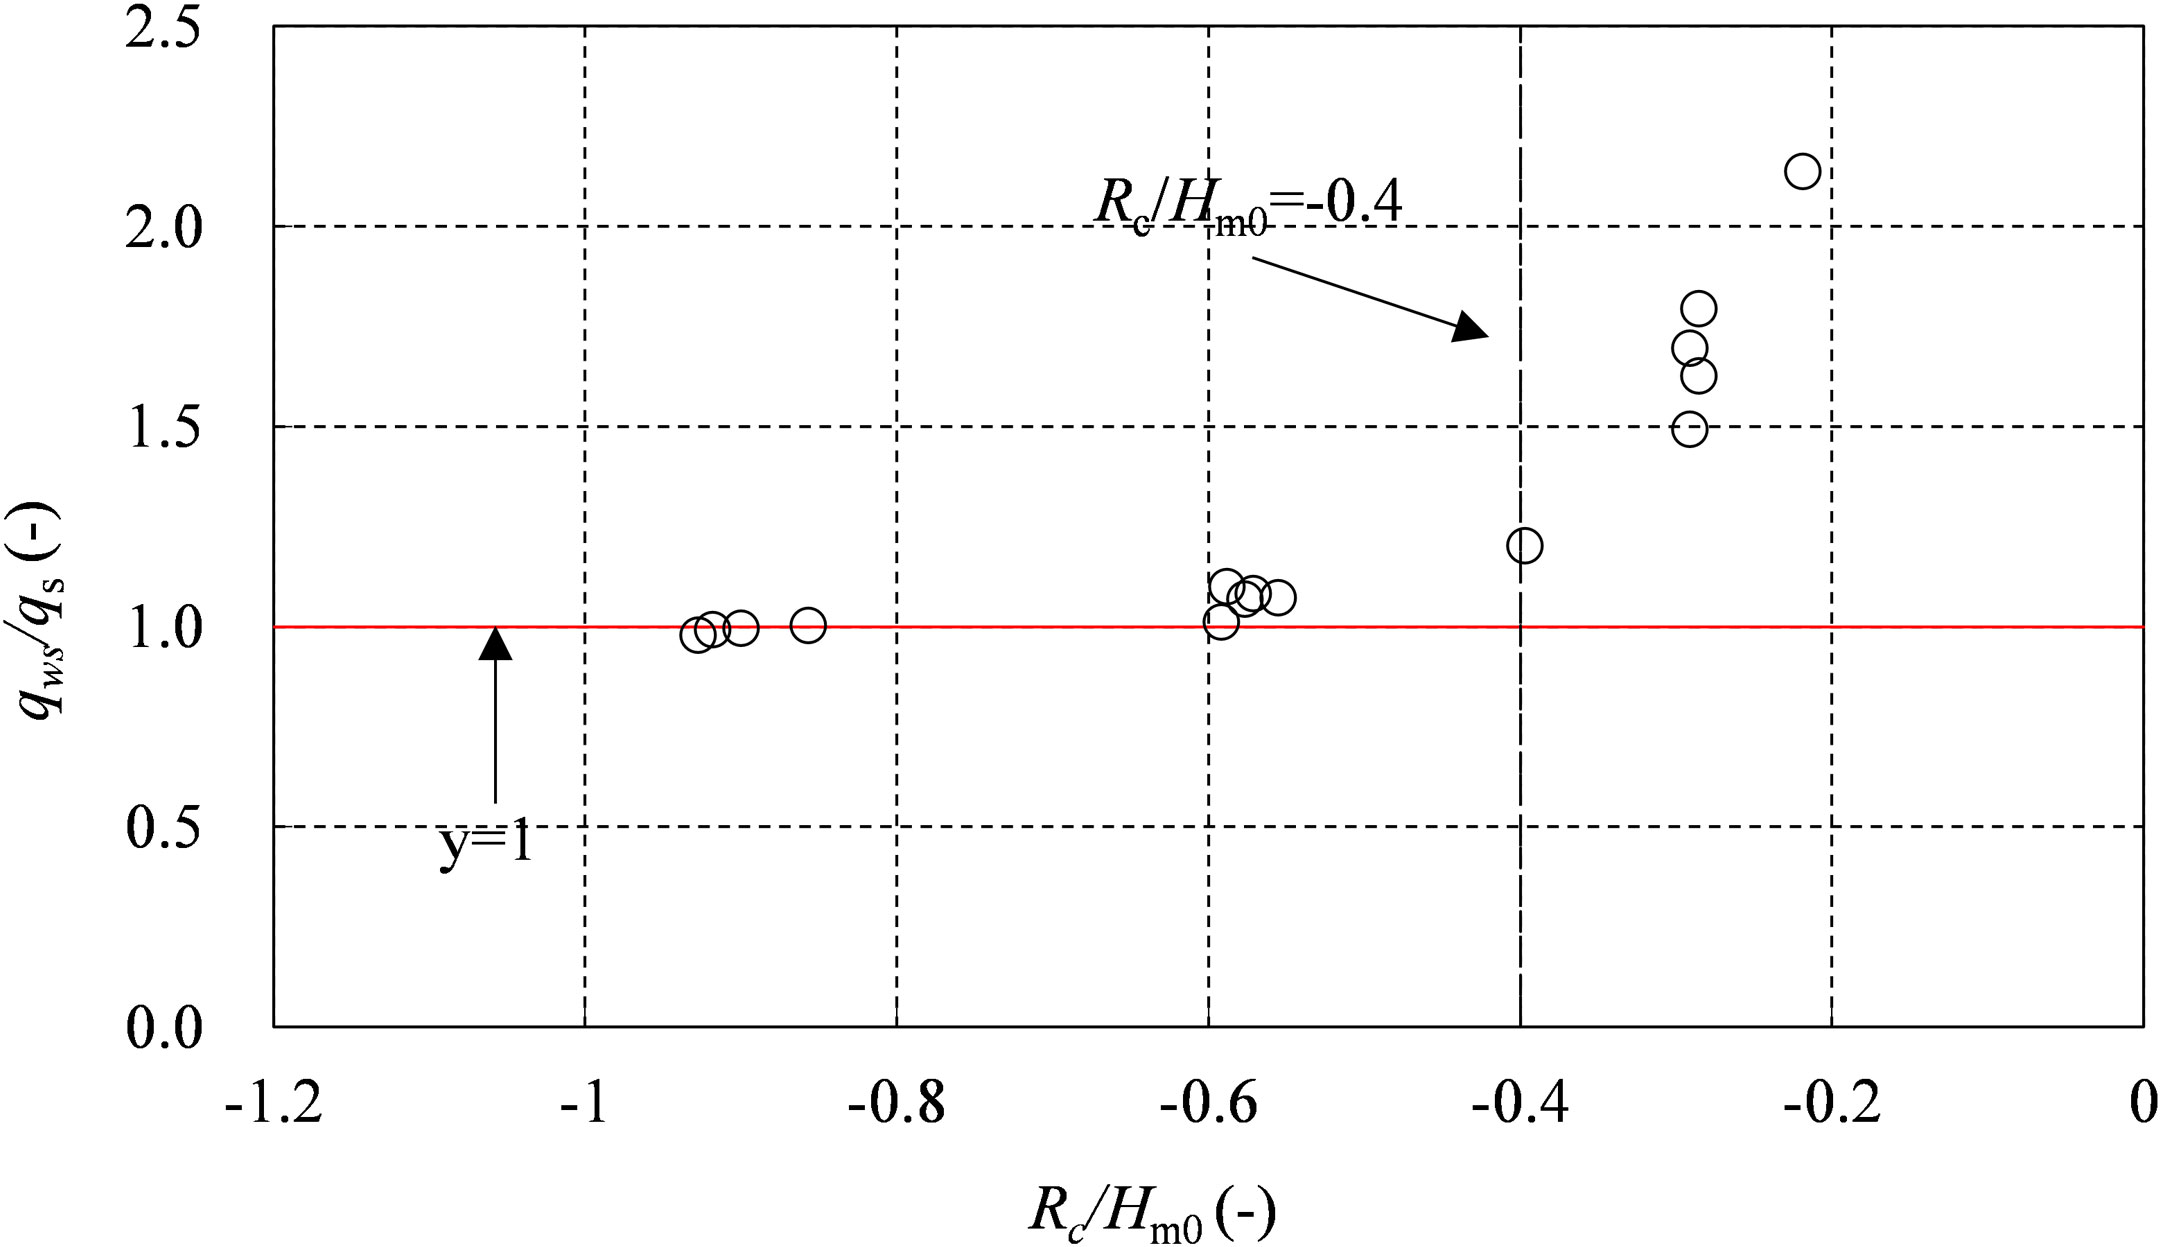
Figure 6 qws/qs versus the relative negative freeboard.
On the other hand, for lower absolute values of relative freeboard, the average overtopping discharge of the combined wave and surge overtopping (qws) was slightly bigger than that of the surge-only overflow discharge (qs). This indicates that, when the relative freeboard approaches zero, the wave is more influential in the average discharge of the combined wave and surge overtopping. Thus, the hydraulic parameters such as wave period and gradient of seaward slope still have obvious influences on the discharge under lower absolute values of negative relative freeboard. However, these hydraulic parameters were neglected in the formula of Hughes and Nadal (2009), which led to the unsatisfactory performance of Eq. 7 (Hughes and Nadal, 2009) in cases of lower absolute values of negative relative freeboard (−0.4 ≤ Rc/Hm0< 0).
Therefore, Eq. 7 (Hughes and Nadal, 2009) can be used to calculate the average discharge of the combined wave and surge overtopping in cases of higher absolute values of negative relative freeboard (Rc/Hm0< −0.4), while Eq. 1 (EurOtop, 2017) can be used to calculate the average discharge of the combined wave and surge overtopping in cases of lower absolute values of negative relative freeboard (−0.4 ≤ Rc/Hm0< 0).
4. Normal stress
This section analyzes the characteristic and spatial distributions of normal stress on the dike induced by the combined wave and surge overtopping. The Weibull distribution was used to represent the statistical distribution of peak normal stress.
4.1. Time series analysis
The time series of normal stress measured using a pressure gauge was used to analyze the characteristics of normal stress along the dike. Figure 7 gives two examples of the time series of normal stress measured by pressure gauge P1 on the front of the dike crest from trial 13 (Rc = −0.3 m, Hm0 = 1.03 m, Tp = 6.32 s) and trial 33 (Rc = −0.9 m, Hm0 = 0.97 m, Tp = 6.32 s). The values have been converted to the prototype scale according to a length scale of 10. Figure 7A displays the sharp increase of the normal stress at about 709, 734, and 742 s (as circled in Figure 8A), and much greater than that induced by the surge-only overflow (blue line). The sharp increase of normal stress (referred to as abrupt change) indicates that the dike withstands an impulsive downward-flushing flow directly. As shown in Figure 7B, the normal stress increased slowly (referred to as gradual change), which is the order of the static pressure due to the wave elevation. As Pan et al. (2015) pointed out, breaking passing (plunging breaks on the crest or the landward slope) and smooth passing (waves passing without a breaker) of waves are the two passing patterns in the combination of wave and surge. In cases of lower absolute values of negative freeboard (Rc = −0.3 m), the main wave passing pattern is breaking passing, with the downward-flushing flow directly impacting the dike crest and the upper part of the landward slope and the normal stress characterized by abrupt change. In cases of medium absolute values of negative freeboard (Rc = −0.6m), both wave passing patterns are possible, with the downward-flushing flow mainly impacting the upper part of the landward slope, the normal stress on the dike crest characterized by gradual change, and the normal stress on the upper part of the landward slope characterized by abrupt change. In cases of higher absolute values of negative freeboard (Rc = −0.9m), the main wave passing pattern was smooth passing, and the normal stress on the dike was characterized by gradual change.
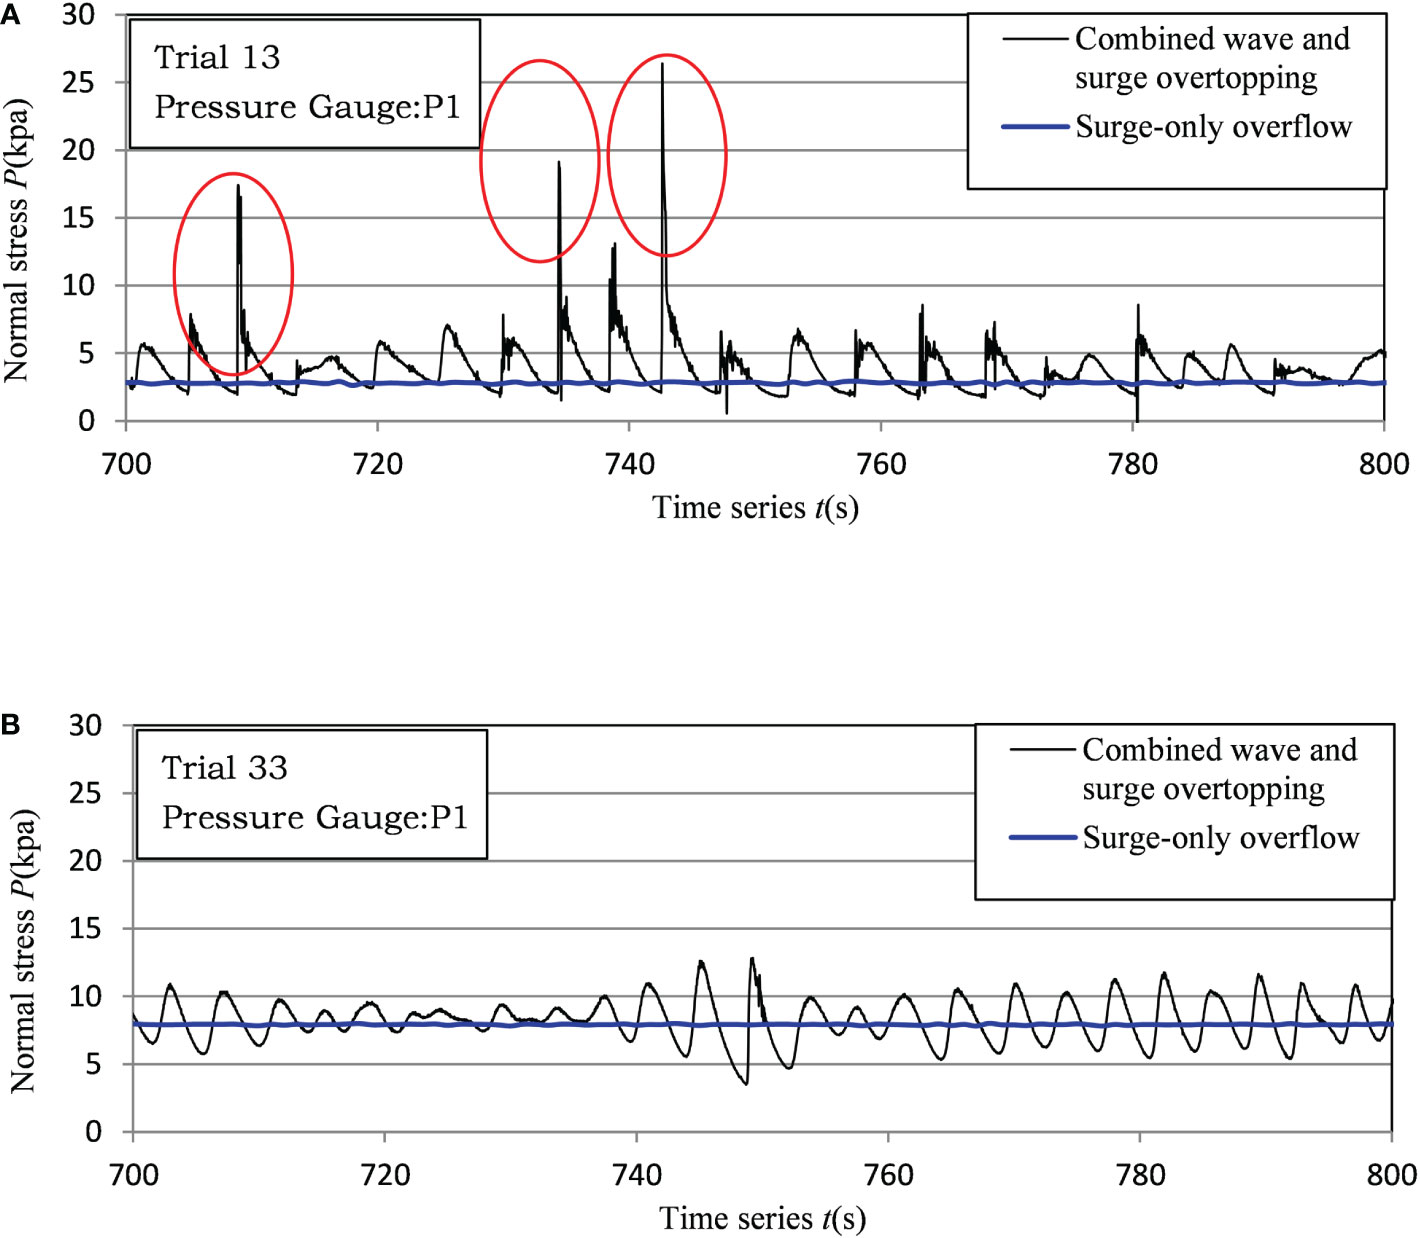
Figure 7 Samples of normal stresses time series at P1 on the dike crest: (A) abruptly change; (B) gradually change.
4.2. Spatial distribution of normal stress
Figure 8 shows six examples of the spatial distribution of 1% relative normal stress, p1%* (since the number of waves in this test was about 140, 1% normal stress can be regarded as the maximum value), along the dike with different values of freeboard (Rc), wave height (Hm0), and wave period (Tp). The dimensionless parameter 1% relative normal stress, p1%* (p1% denotes that the normal stress level exceeds by 1% of the measured normal stress time series), in this figure is defined as p1%* = p1%/γHm0, where γ is the water-specific weight, B is the width of the dike crest, and x is the projection length of the measuring point on the horizontal line (see Figure 9).
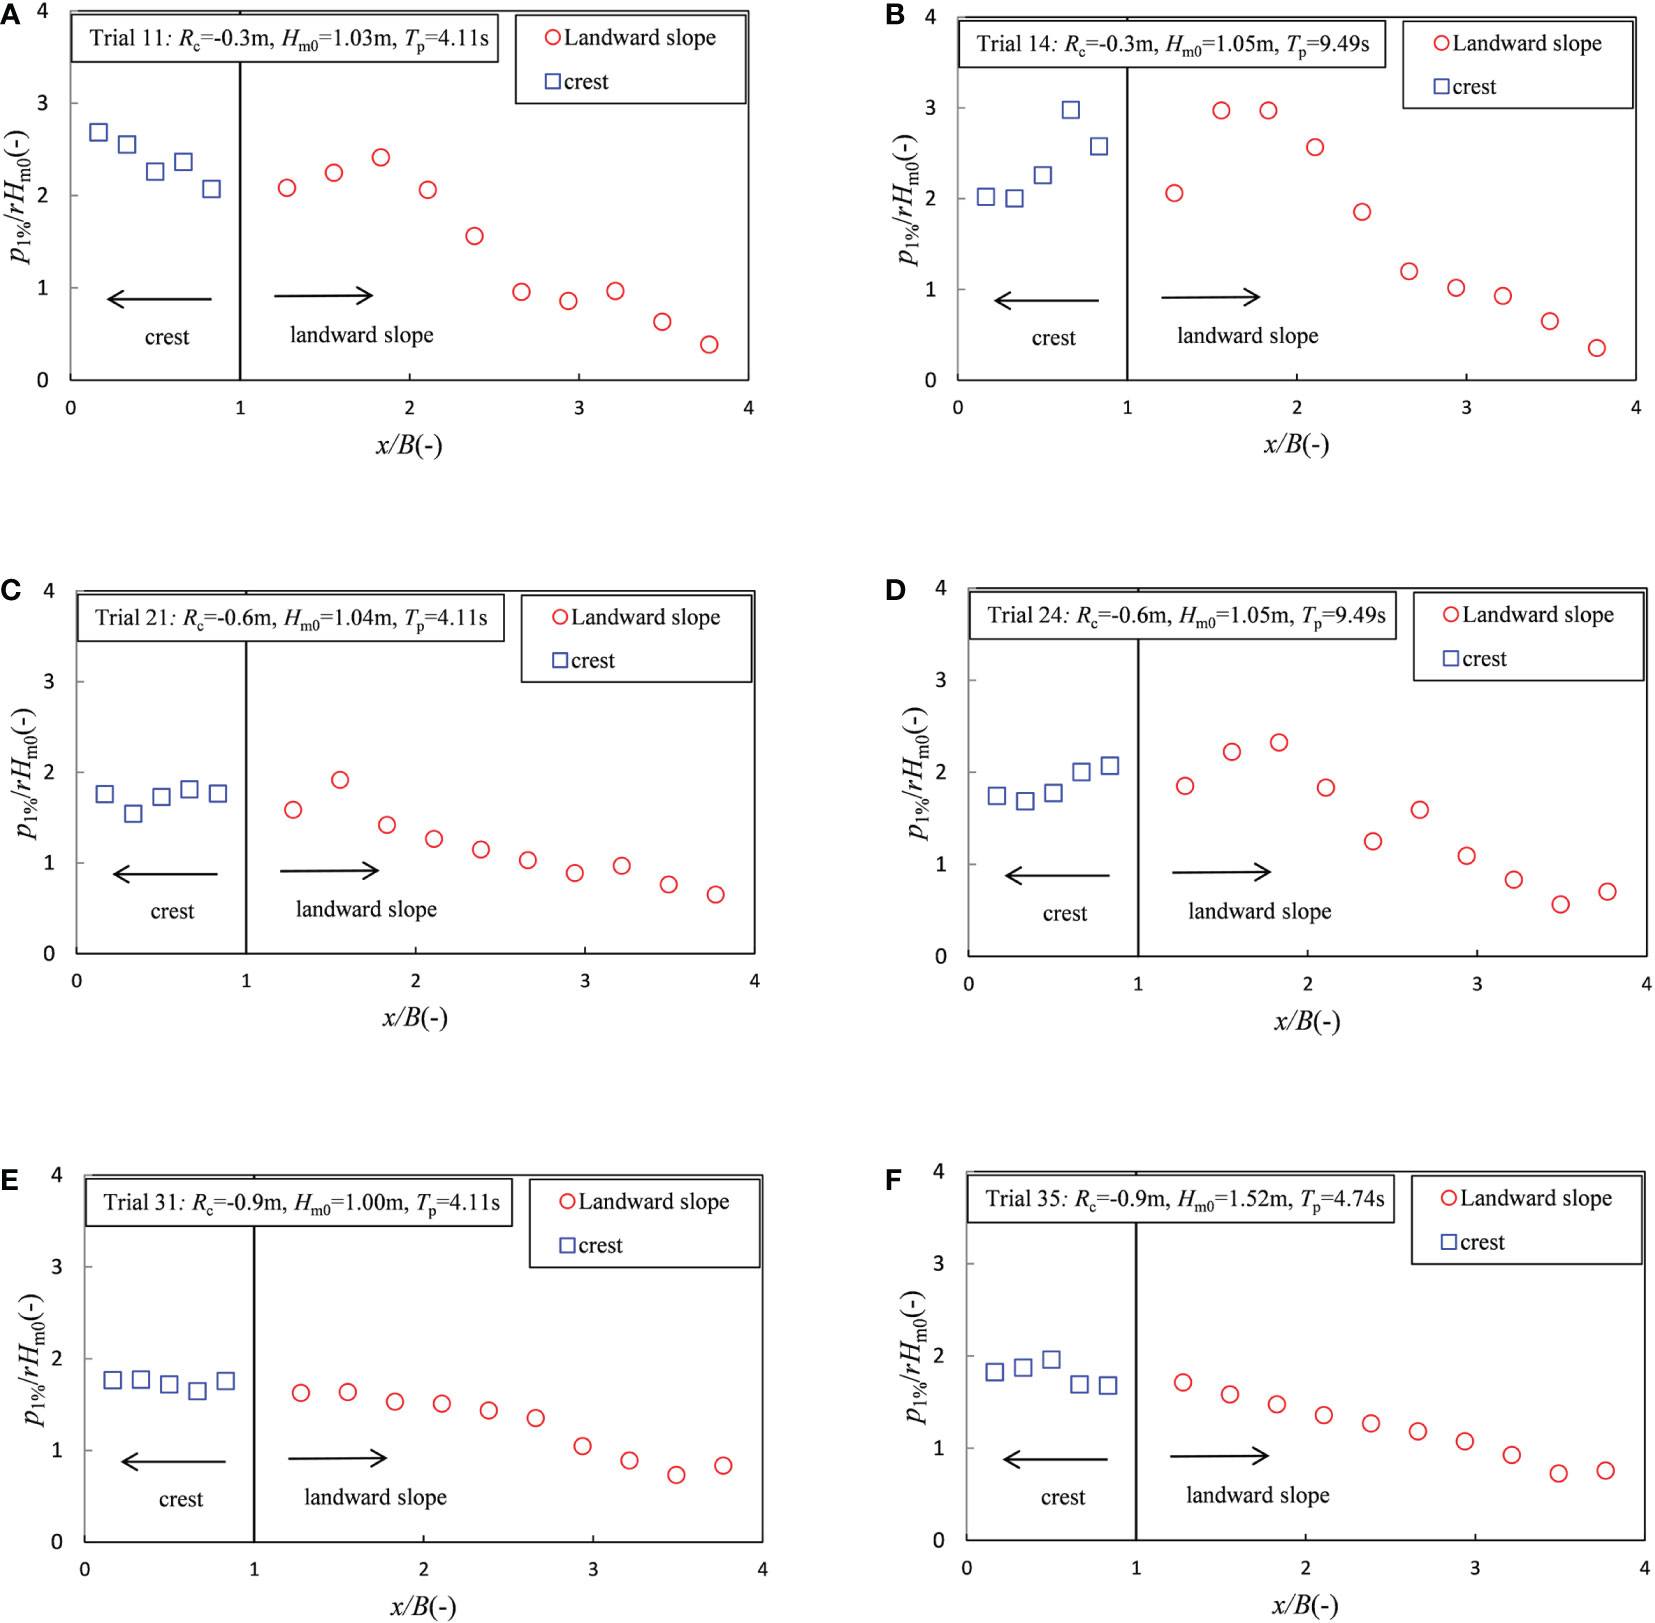
Figure 8 Spatial distribution of the relative normal stress along the dike. (A) Small wave period (Rc = −0.3m). (B) Large wave period (Rc = −0.3m). (C) Small wave period (Rc = −0.6m). (D) Large wave period (Rc = −0.6m). (E) Small wave height (Rc = −0.9m). (F) Large wave height (Rc = −0.9m).
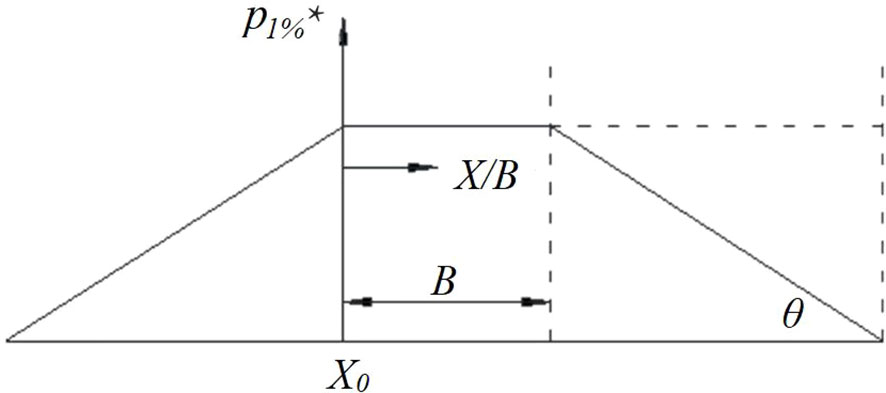
Figure 9 Coordinates of the relative normal stress variation along the dike.
It can be seen from Figures 8A, B that, under cases of lower absolute values of negative freeboard (Rc = −0.3 m), the 1% relative normal stress (p1%*) on the dike crest (0 ≤ x/B< 1) was large (p1%* was approximately 3). The maximum normal stress at different measurement points changed significantly, and the location where the maximum normal stress occurred moved back along the dike crest with the wave period increase. Obviously, the p1%* on the upper part of the landward slope (1 ≤ x/B< 2.1) was large (p1%* was approximately 2–3), with the maximum normal stress increasing significantly with the increase of the wave period and the location where the maximum normal stress generally occurring at pressure gauges P7–P9 (1.5< x/B< 2.1). The p1%* on the lower part of the landward slope (x/B ≥ 2.1) was smaller and gradually decreased along the landward slope.
It is also apparent from Figures 8C, D that, in cases of medium absolute values of negative freeboard (Rc = −0.6m), the p1%* on the dike crest (0 ≤ x/B< 1) was relatively small (p1%* was approximately 2). The maximum normal stress at different measurement points changed little. The p1%* on the upper part of the landward slope (1 ≤ x/B< 2.1) was larger than that on the dike crest (p1%* was approximately 2.5), with the maximum normal stress increasing slightly with the increase of the wave period and the location where the maximum normal stress generally occurring at pressure gauges P7–P9 (1.5< x/B< 2.1). The p1%* on the lower part of the landward slope (x/B ≥ 2.1) was smaller and gradually decreased along the landward slope.
Finally, Figures 8E, F show that, in cases of higher absolute values of negative freeboard (Rc = −0.9 m), the spatial distribution trend of the normal stress along the dike was similar to that of the surge-only overflow, the p1%* being relatively small and the maximum normal stress occurring at the dike crest. According to the findings detailed in Section 4.1, normal stress was caused by the static pressure under higher absolute values of negative freeboard; thus, the normal stress on the dike crest increased slightly due to the larger wave height (Figure 8F), and there was no obvious correspondence with the wave period.
In summary, in the combined wave and surge overtopping, the normal stress caused by the downward-flushing flow impact under lower absolute values of negative freeboard was larger than that caused by the static pressure along the dike due to the wave elevation under higher absolute values of negative freeboard. Moreover, the normal stress occurring at the dike crest (0 ≤ x/B< 1) and the upper part of the landward slope (1 ≤ x/B< 2.1) was larger than that at the lower part of the landward slope (x/B ≥ 2.1).
4.3. Statistical distribution of normal stress
The values obtained from statistical distribution can be used for the probabilistic calculations of structures. In the present analysis, the two-parameter Weibull distribution was proposed to represent the statistical distribution of the peak value of relative normal stress (p* = p/γHm0) measured by all the pressure gauges (P1–P15). The distribution can be written as follows:
where Pp* is the probability of the peak value of the relative normal stress per wave pi* being less than or equal to p*, ap is the scale factor, and bp is the shape factor.
The findings in Sections 4.1 and 4.2 indicate that the normal stress induced by the combination of wave and surge overtopping expresses different characteristics (an abrupt or gradual change) on the dike crest and the upper and lower parts of the landward slope, thus, three examples of the Weibull distribution of the peak relative normal stress (semi-logarithmic ordinate) on the dike crest. The upper and lower parts of the landward slope are shown in Figure 10. Figure 10A shows an example of a mediocre fit from trial 21 (Rc = −0.6 m, Hm0 = 1.05 m, Tp = 9.49 s) measured by pressure gauge P2 on the dike crest. Figure 10B shows an example of a good fit from trial 11 (Rc = −0.3 m, Hm0 = 1.00 m, Tp = 4.11 s) measured by pressure gauge P7 on the upper part of the landward slope. Figure 10C shows an example of a poor fit from trial 21 (Rc = −0.6 m, Hm0 = 1.04 m, Tp = 4.11 s) measured by pressure gauge P14 on the lower part of the landward slope.
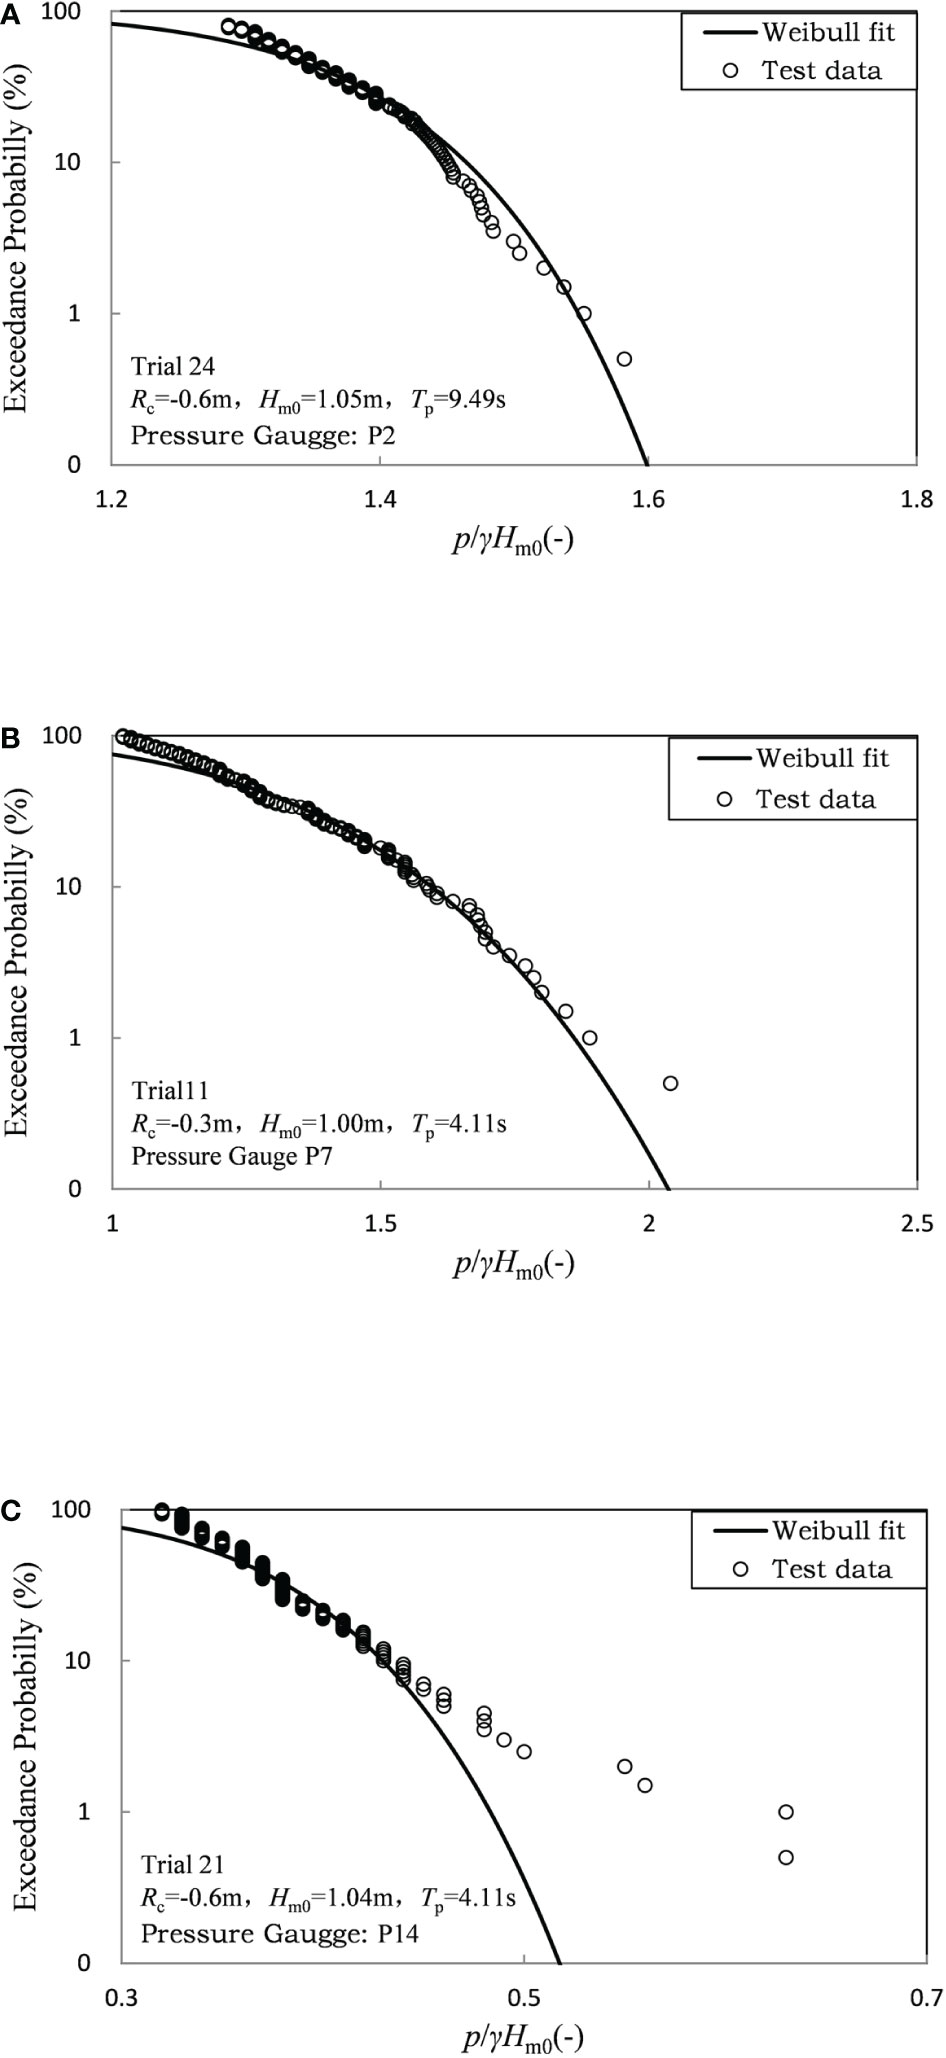
Figure 10 Example of the best fits of the Weibull distribution to the peak value of normal stress. (A) Example of a mediocre fit from trial 21 (pressure gauge P2). (B) Example of a good fit from trial 11 (pressure gauge P7). (C) Example of a poor fit from trial 21 (pressure gauge P14).
In general, the fitting degrees between the test data measured by pressure gauges P1–P9 (dike crest and upper part of the landward slope) and the Weibull distribution were between the two cases shown in Figures 10A, B. Figure 10C shows that the fitting degrees between the test data measured by pressure gauges P10–P15 (lower part of the landward slope) and the Weibull distribution were poor. This is due to the fact that the flow thickness along the lower part of the landward slope was very small, and the normal stress caused by the static pressure was also very small. When the peak relative normal stress (pi*) becomes too small, the Weibull distribution may no longer be applicable. It should be mentioned that the determination of the maximum value of normal stress required for the stability of the structure is key to the dike design. The findings in Section 4.2 show that the normal stress occurring at the dike crest and the upper part of landward slope was obviously larger than that at the lower part of the landward slope; thus, this paper mainly focused on the normal stress on the dike crest and the upper part of the landward slope induced by the combined wave and surge overtopping.
The plots revealed that the freeboard (Rc), wave height (Hm0), and the wave period (Tp) closely controlled the scale of the cumulative probability distribution and were also closely related to the average overtopping discharge (qws). Figure 11 plots the scale factors apc on the dike crest and aps on the upper part of the landward slope versus the dimensionless overtopping discharge [qws/0.5].
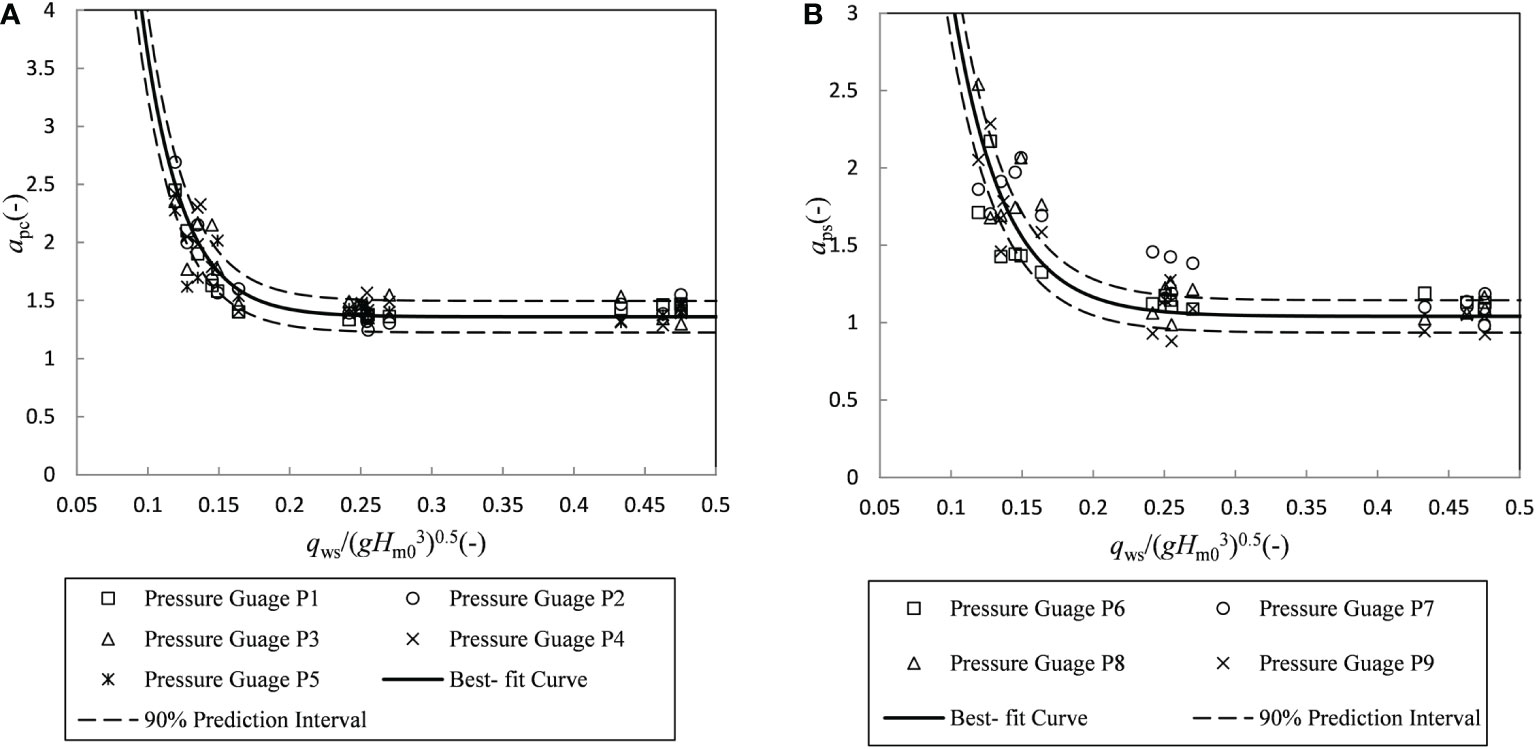
Figure 11 Best-fit equations for Weibull factor ap: (A) on the crest; (B) on the upper part of landward slope.
It can be seen from Figure 11A that, with the increase of qws/0.5, the scale factor apc on the dike crest first decreased slightly and then remained stable. This may be explained by the fact that the scale factor apc reflects the values of the average peak relative normal stress; when the qws/0.5 is relatively small, with most of the waves passing the dike crest with a breaking passing pattern, the average peak normal stress is relatively large, which gives larger apc values. A comparison of pressure gauges P1–P5 indicated that the values of apc had no apparent regularity during each test case. The solid line is a best-fit empirical equation for the datasets given by the following equation:
It can be seen from Figure 11B that, with the increase of qws/0.5, the scale factor aps on the upper part of the landward slope first decreased slightly and then remained stable. The three points at pressure gauge P7 from trial 22, trial 23, and trial 24 with a freeboard of −0.6 m tended to be greater than the average trend. Such deviation might be due to the effect of the combination of the downward-flushing flow impact and static pressure. A comparison of pressure gauges P6–P9 indicated that the values of aps had no apparent regularity during each test. The solid line is a best-fit empirical equation for the datasets given by the following equation:
Figure 12 plots the shape factors bpc on the dike crest and bps on the upper part of the landward slope versus the dimensionless overtopping discharge [qws/0.5].It can be seen from Figure 12A that the shape factor bpc on the dike crest increased with increasing qws/0.5. A comparison of pressure gauges P1–P5 indicated that the values of bpc were nearly the same at these pressure gauges during each test. One data point at pressure gauge P3 from trial 25 tended to be greater than the average trend. Such deviation might be due to the Hm0 (Hm0 = 1.51m) being relatively large in this test case. The solid line is the best-fit empirical equation for the datasets given by the following equation:
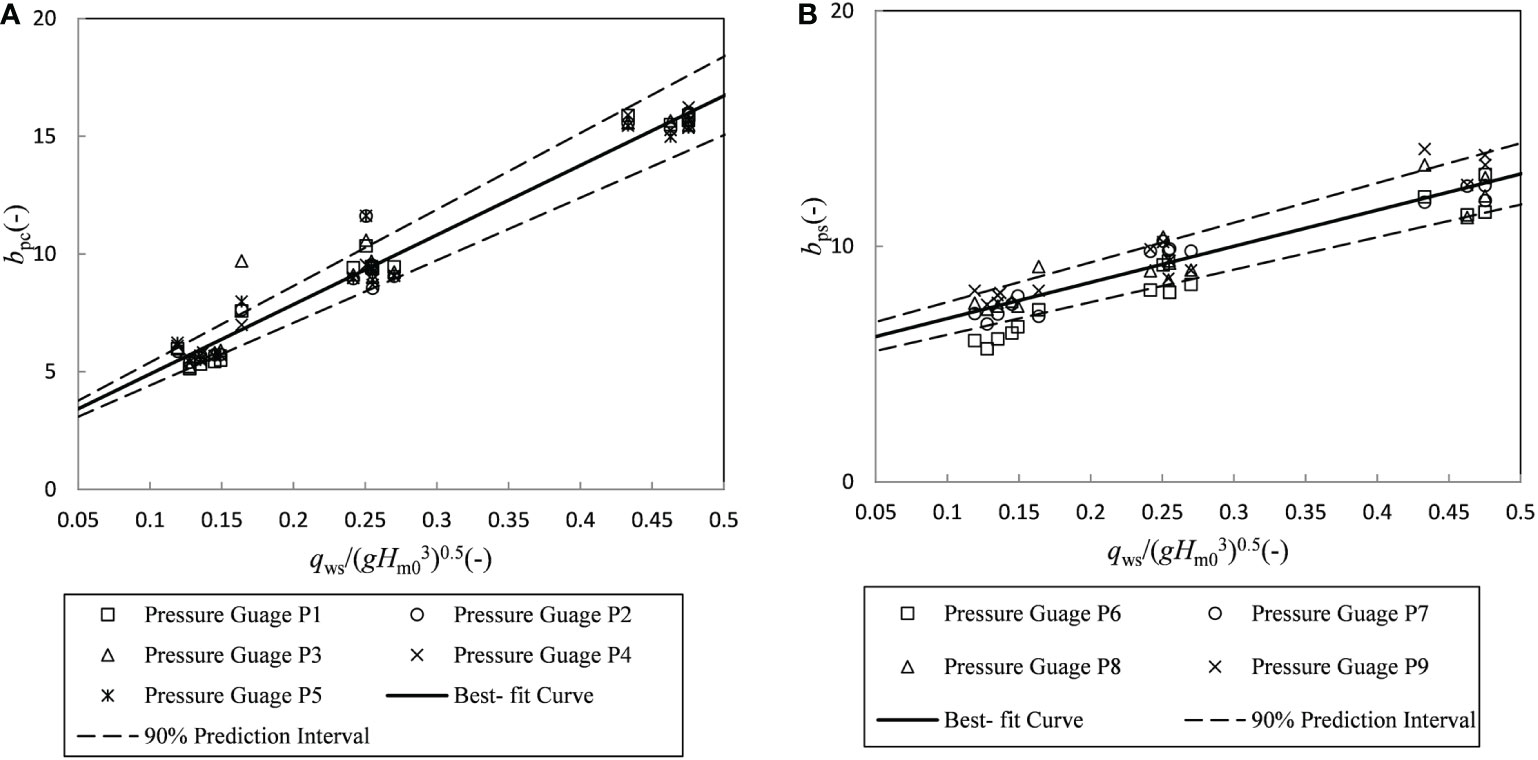
Figure 12 Best-fit equations for Weibull factor bp: (A) on the crest; (B) on the upper part of landward slope.
It can be seen from Figure 12B that the shape factor bps on the upper part of the landward slope increased with increasing qws/ 3)0.5. A comparison of pressure gauges P6–P9 indicated that the values of bps were nearly the same at these pressure gauges during each test case. The solid line is the best-fit empirical equation for the datasets given by the following equation:
The values of the scale factor ap and the shape factor bp can be used to calculate the maximum value of the Weibull distribution as (Pan et al., 2015):
where N is the peak normal stress number. From Eqs. 9–12, the scale factor ap and the shape factor bp were calculated for all test cases. Then, Eq. 13 was used to estimate the maximum normal stress. Comparisons between the estimated and measured values for the maximum normal stress on the dike crest and upper part of the landward slope are shown in Figure 13. A better prediction can be found for the maximum normal stress on the dike crest, as shown in Figure 13A. The estimation of maximum normal stress on the upper part of the landward slope was mediocre, but reasonable, as shown in Figure 13B. The data showed a good trend, but the data points were scattered because of the limited wave numbers and the randomness of the maximum value in limited cases.
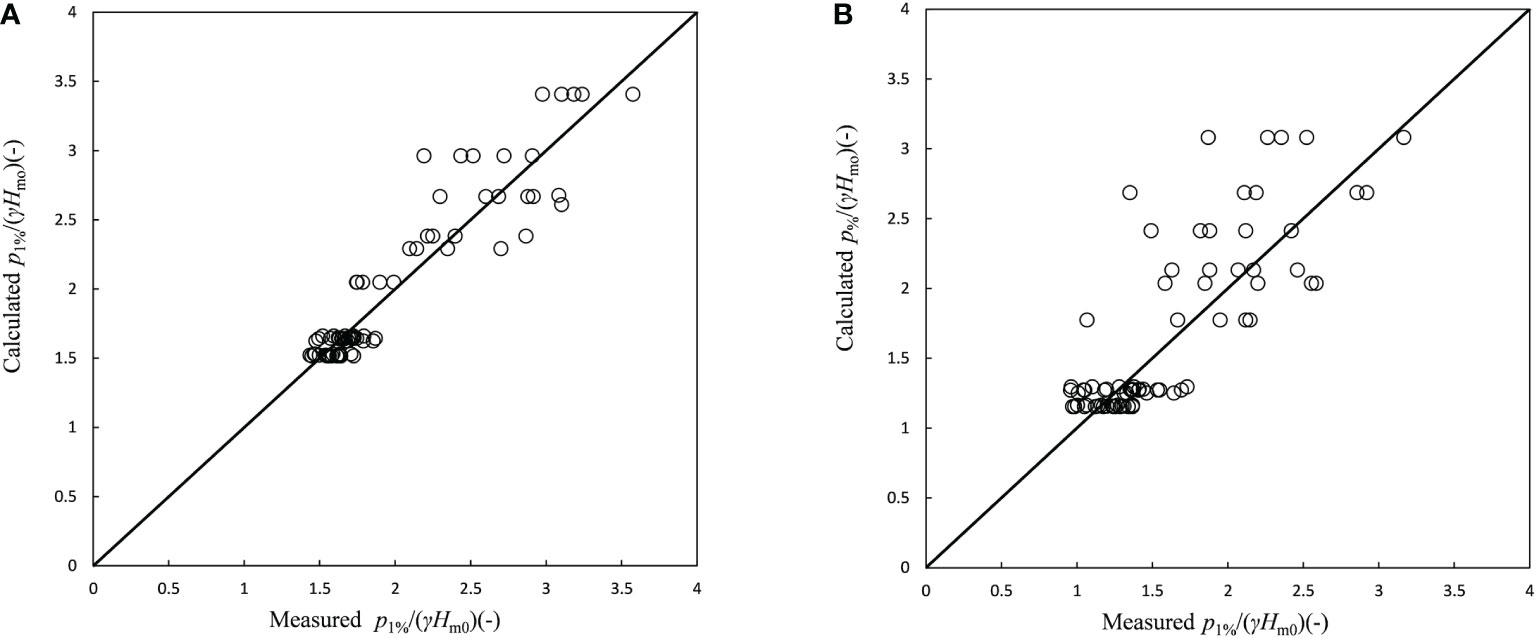
Figure 13 Comparison of measured and calculated maximum normal stress: (A) on the dike crest; (B) on the upper part of landward slope.
5. Conclusions
this paper, the normal stress on a trapezoidal dike cross-section induced by the combined wave and surge overtopping was analyzed using laboratory measurements. The existing average overtopping discharge formulas were compared. The characteristics of normal stress on the dike were obtained based on the analyses of the time series and spatial distribution of normal stress. Two empirical equations were proposed to represent the statistical distribution of peak normal stress. The main conclusions are discussed below.
For higher absolute values of relative freeboard (Rc/Hm0< −0.4), the average overtopping discharge of the combined wave and surge overtopping was close to the surge-only overflow discharge. For lower absolute values of relative freeboard, the average overtopping discharge of the combined wave and surge overtopping (qws) was slightly higher than the surge-only overflow discharge (qs). Equation 7 (Hughes and Nadal, 2009) can be used to calculate the average discharge of the combined wave and surge overtopping in cases of higher absolute values of negative relative freeboard (Rc/Hm0< −0.4), while Eq. 1 (EurOtop, 2017) can be used to calculate the average discharge of the combined wave and surge overtopping in cases of lower absolute values of negative relative freeboard (−0.4 ≤ Rc/Hm0< 0).
Two characteristics of normal stress can be observed during the tests: a) the abrupt change caused by the downward-flushing flow directly impacting the dike and b) the gradual change caused by the static pressure. In cases of lower absolute values of negative freeboard (Rc = −0.3 m), the normal stress on the dike was characterized by abrupt change. In cases of medium absolute values of negative freeboard (Rc = −0.6 m), the normal stress on dike crest (0 ≤ x/B< 1) was characterized by gradual change, while the normal stress on the upper part of the landward slope (1 ≤ x/B< 2.1) was characterized by abrupt change. Under higher absolute values of negative freeboard (Rc = −0.9 m), the normal stress on the dike was characterized by gradual change. Moreover, analysis of the spatial distribution of normal stress on the dike revealed that the normal stress occurring at the dike crest (0 ≤ x/B< 1) and the upper part of the landward slope (1 ≤ x/B< 2.1) was apparently larger than that occurring at the lower part of the landward slope (x/B ≥ 2.1).
The two-parameter Weibull distribution shown by Eq. 8 was used to represent the statistical distribution of the peak normal stress. Equations 9, 11 described the calculations used to estimate the scale factor apc and the shape factor bpc on the part of the dike crest. On the other hand, the calculations given in Eqs. 10, 12 were used to estimate the scale factor aps and the shape factor bps on the upper part of the landward slope. The maximum normal stress can be estimated using the calculated Weibull factors ap and bp. The calculated maximum normal stress on the dike crest fitted the measurements well, while that on the upper part of the landward slope was mediocre, but was acceptable.
This paper provided better knowledge on the normal stress on dike induced by the combination of wave and surge overtopping. The conclusions presented in this paper are only suitable for dikes with a slope gradient of 1:4.25, and the equations may not be applicable for dikes with a different slope gradient.
Data availability statement
The original contributions presented in the study are included in the article/Supplementary Material. Further inquiries can be directed to the corresponding author.
Author contributions
ZZ: Conceptualization, methodology, software, writing—original draft, and writing—review and editing. ZS: Formal analysis, validation, visualization, and data curation. YZ: Writing—review and editing, and methodology. QZ and YC: Methodology. HW: Software. FH: Data curation. All authors contributed to the article and approved the submitted version.
Funding
We sincerely thank the fundings support from the National Natural Science Foundation of China (no. 51979098) and Fundamental Research Funds for Central Public Welfare Research Institutes (no. Y222010) and Jiangsu Funding Program for Excellent Postdoctoral Talent (no. 2022ZB10).
Conflict of interest
The authors declare that the research was conducted in the absence of any commercial or financial relationships that could be construed as a potential conflict of interest.
Publisher’s note
All claims expressed in this article are solely those of the authors and do not necessarily represent those of their affiliated organizations, or those of the publisher, the editors and the reviewers. Any product that may be evaluated in this article, or claim that may be made by its manufacturer, is not guaranteed or endorsed by the publisher.
Supplementary material
The Supplementary Material for this article can be found online at: https://www.frontiersin.org/articles/10.3389/fmars.2022.1073345/full#supplementary-material
References
ASCE Hurricane Katrina External Review Panel (2007). The new Orleans hurricane protection system: What went wrong and why? (Reston, Virginia: American Society of Civil Engineers), 92.
Celi D., Pasquali D., Fischione P., Nucci C., Rision M. (2021). Wave-induced dynamic pressure under rubble mound breakwaters with submerged berm: An experimental and numerical study. Coast. Eng. 170, 104014. doi: 10.1016/j.coastaleng.2021.104014
EurOtop (2017). Manual on wave overtopping of sea defences and related structure. An overtopping manual largely based on European research, but for worldwide application. Van der Meer J. W., Allsop N. W.H., Bruce T., De Rouck J., Kortenhaus A., Pullen T., et al. Available at: www.overtopping-manual.com.
Hattori M., , Arami A., , Yui T. (1994). Wave impact pressure on vertical walls under breaking waves of various types. Coast. Eng. 22, 79–114. doi: 10.1016/0378-3839(94)90049-3
Hughes S. A. (2008). “Levee overtopping design guidance: what we know and what we need,” in Proceedings of the solutions to coastal disasters congress (Turtle Bay, Oahu, Hawaii: ASCE), 867–880.
Hughes S. A., Nadal N. C. (2009). Laboratory study of combined wave overtopping and storm surge overflow of a levee. Coast. Eng. 56 (2009), 244–259. doi: 10.1016/j.coastaleng.2008.09.005
Hughes S. A., Shaw J. M., Howard I. L. (2011). Earthen levee shear stress estimates for combined wave overtopping and surge overflow. J. Wat Port Coast. Ocean Eng. ASCE 138 (3), 267–273. doi: 10.13140/RG.2.2.21298.63681
IPCC (2012). “Managing the risks of extreme events and disasters to advance climate change adaptation,” in A special report of working GroupsⅠand Ⅱ of the intergovernmental panel on climate Chang (Cambridge, UK, and New York, NY, USA: Cambridge University Press), 582p.
Jensen B., Christensen E. D., , Mutlu Sumer B. (2014). Pressure-induced forces and shear stresses on rubble mound breakwater armour layers in regular waves. Coast. Eng. 91, 60–75. doi: 10.1016/j.coastaleng.2014.05.003
Li L., Pan Y., Amini F., Kuang C. P. (2012). Full scale laboratory study of combined wave and surge overtopping of a levee with RCC strengthening system. Ocean Eng. 54 (1), 70–86. doi: 10.1016/j.oceaneng.2012.07.021
Pan Y., Kuang C. P., Li L., Amini F. (2015). Full-scale laboratory study on distribution of individual wave overtopping volumes over a levee under negative freeboard. Coast. Eng. 97, 11–20. doi: 10.1016/j.coastaleng.2014.12.007
Pan Y., Li L., Amini F., Kuang C. (2012). Full scale HPTRM strengthened levee testing under combined wave and surge overtopping conditions: Overtopping hydraulics, shear stress and erosion analysis. J. Coast. Res 29 (1), 182–200. doi: 10.2112/JCOASTRES-D-12-00010.1
Pan Y., Li L., Amini F., Kuang C. P. (2013a). Full-scale HPTRM-strengthened levee testing under combined wave and surge overtopping conditions: overtopping hydraulics, shear stress, and erosion analysis. J. Coast. Res. 29 (1), 182–200. doi: 10.2112/JCOASTRES-D-12-00010.1
Pan Y., Li L., Amini F., Kuang C. P. (2013b). Influence of three levee-strengthening systems on overtopping hydraulic parameters and hydraulic equivalency analysis between steady and intermittent overtopping. J. Wat Port Coast. Ocean Eng. 139 (4), 256–266. doi: 10.1061/(ASCE)WW.1943-5460.0000179
Pan Y., Yin S., Chen Y. P., Yang Y. B., Xu C. Y., Xu Z. S. (2022). An experimental study on the evolution of a shoreface nourishment under the effects of regular waves in low-energy conditions. Coast. Eng. 176, 104169. doi: 10.1016/j.coastaleng.2022.104169
Pan Y., Zhou Z. J., Chen Y. P. (2020). An analysis of the downward-flushing flow on the crest of a levee under combined wave and surge overtopping. Coast. Eng. 158, 103701. doi: 10.1016/j.coastaleng.2020.103701
Raby A., Bullock G., Jonathan P., Randell D., Whittaker C. (2022). On wave impact pressure variability. Coast. Eng 177104168 doi: 10.1016/j.coastaleng.2022.104168
Reeve D. E., Soliman A., Lin P. Z. (2008). Numerical study of combined overflow and wave overtopping over a smooth impermeable seawall. Coast. Eng. 55 (2), 155–166. doi: 10.1016/j.coastaleng.2007.09.008
Schüttrumpf H., Möller J., Oumeraci H., Grüne J., Weissmann R. (2005). Effects of natural sea states on wave overtopping of seadikes [C]. Proceedings Waves 2001, Conference, 1565–1574.
Yuan S. Y., Li L., Amini F., Tang H. W. (2014). Turbulence measurement of combined wave and surge overtopping over a full scale HPTRM strengthened levee. J. Wat Coast. Ocean Eng. 140, 04014014. doi: 10.1061/(ASCE)WW.1943-5460.0000230
Keywords: dike, combined wave and surge overtopping, normal stress, weibull distribution, physical model
Citation: Zhou Z, Sun Z, Zhou Y, Zuo Q, Wang H, Chen Y and Huang F (2023) Laboratory study of the combined wave and surge overtopping-induced normal stress on dike. Front. Mar. Sci. 9:1073345. doi: 10.3389/fmars.2022.1073345
Received: 18 October 2022; Accepted: 09 December 2022;
Published: 12 January 2023.
Edited by:
Yi Pan, Hohai University, ChinaReviewed by:
Shuxue Liu, Dalian University of Technology, ChinaZhiyao Song, Nanjing Normal University, China
Gang Wang, Hohai University, China
Copyright © 2023 Zhou, Sun, Zhou, Zuo, Wang, Chen and Huang. This is an open-access article distributed under the terms of the Creative Commons Attribution License (CC BY). The use, distribution or reproduction in other forums is permitted, provided the original author(s) and the copyright owner(s) are credited and that the original publication in this journal is cited, in accordance with accepted academic practice. No use, distribution or reproduction is permitted which does not comply with these terms.
*Correspondence: Zijun Zhou, Y2hhcmxlYmlsbHlAMTYzLmNvbQ==