
94% of researchers rate our articles as excellent or good
Learn more about the work of our research integrity team to safeguard the quality of each article we publish.
Find out more
ORIGINAL RESEARCH article
Front. Mar. Sci., 22 December 2022
Sec. Marine Biology
Volume 9 - 2022 | https://doi.org/10.3389/fmars.2022.1072068
This article is part of the Research TopicSharing Technical Knowledge to Understand the Distribution Patterns and Migration History of Marine OrganismsView all 11 articles
 Yuxiao Gou1*
 Tomihiko Higuchi2
 Yuki Iino1
 Tsuyoshi Nagasaka3Yuichi Shimizu3Kotaro Shirai2
 Takashi Kitagawa1
Reconstruction of water temperatures experienced by marine fishes using otolith oxygen stable isotopes (δ18O) as natural thermometers has been proven to be a useful approach for estimating migration routes or movement patterns. This method is based on the mechanism that the equilibrium fractionation of δ18Ootolith against ambient water exhibits a species-specific thermal sensitivity during the process of otolith aragonitic CaCO3 precipitation. In this study, a laboratory-controlled rearing experiment was conducted to determine the temperature dependency of δ18O fractionation on the anadromous fish species, chum salmon (Oncorhynchus keta), of which the detailed migration routes have not been elucidated yet. To test that temperature was the only factor affecting δ18Ootolith fractionation, this study ensured a relatively stable rearing condition, evaluated the isotope composition of the rearing water, and analyzed carbon isotope (δ13Cotolith) to examine the potential effect of kinetic and metabolic isotopic fractionations. The δ18Ootolith fractionation equation on chum salmon was thereby determined within a temperature range of 9–20°C and was indistinguishable from the equation of synthetic aragonite; The δ13Cotolith was affected by both physiological processes and δ13CDIC; In lower temperatures settings, both oxygen and carbon isotopes depleted simultaneously. This study suggests that the chum salmon species-specific oxygen isotope fractionation equation could be used on reconstruction of temperature history and also throw insights into understanding the incorporation of oxygen and carbon sources during calcification process for otoliths.
Chum salmon Oncorhynchus keta is one of the most abundant species in the North Pacific, and its overall population has increased dramatically due to the success of hatchery programs (Ruggerone and Irvine, 2018). However, in many areas, especially in the southern stocks, the population of chum salmon has decreased sharply over the last few decades, though the continuance of hatchery enhancement programs (Irvine et al., 2009; Abdul-Aziz et al., 2011; Healey, 2011; Irvine and Fukuwaka, 2011; Ruggerone and Irvine, 2018). The productivity of chum salmon is correlated with the capacity of the North Pacific (Sanger, 1972), which can be affected by climate change and high-density hatchery enhancement (Beamish and Mahnken, 2001; Ruggerone and Nielsen, 2004; Beamish, 2017; Schoen et al., 2017; Connors et al., 2020). Furthermore, the mortality rates of juvenile chum salmon are the highest after release (Fukuwaka and Suzuki, 2002), which may be caused by the sharp decrease in available feed mass evolved with the residence with high density of juvenile chum salmon in the coastal area, modified by the limited utilization of migration routes (Sanger, 1962). Thus, studies on chum salmon’s early life migration ecology are required for the management of artificial hatchery enhancement (Iino et al., 2022).
As an anadromous fish species, chum salmon migrate to the sea after their emergence from gravel beds in spawning rivers and spend most of their life in the ocean (Perry et al., 1996). This suggests that growth and survival depend more on the littoral zone in estuaries than on the freshwater habitat (Seki, 1978; Johnson et al., 1997). In Honshu, Japan, there are many small coastal rivers that produce chum salmon, and the juveniles enter the estuary within 24 h after release (Iwata, 1995). Generally, Japanese juvenile chum salmon species migrate toward the Okhotsk Sea after leaving coastal areas (Irie, 1990; Urawa et al., 2004; Shubin and Akinicheva, 2016; Urawa et al., 2018), and were expected to habitat at Sanriku coastal areas in Japan within sea surface temperature (SST) of 9–13°C (Irie, 1990), although detailed migration routes and actual temperature histories have not yet been identified.
Electronic tagging technology is commonly used in fish behavioral ecology studies (e.g. Tanaka et al., 2000; Kitagawa et al., 2000; Kitagawa et al., 2004; Kitagawa et al., 2009). The method has also been applied to adult chum salmon by using an acoustic transmitter system to investigate natal homing behavior on the Sanriku coast in North Japan (e.g. Tanaka et al., 2000; Nobata et al., 2019). However, the methodology described above is not suitable for juvenile chum salmon because the tagging devices are too heavy for small juveniles to carry. Recently, the implementation of methods to estimate fish movement in oceans from biogeochemical information stored in fish otoliths (such as water temperature and seawater stable oxygen isotope values, Patterson, 1999; Høie et al., 2004a; Walther and Thorrold, 2009) has proven to be a useful indirect approach for describing the thermal and geochemical conditions experienced by fish (Campana, 1999; Campana and Thorrold, 2001; Høie et al., 2004b; Tanner et al., 2013). It has been over half a century since the precursory works of Urey (1947) and Epstein et al. (1951) suggested that accurate determination of the oxygen stable isotope (δ18O) composition in mineral carbonates is a powerful indicator of the ambient temperature at which the carbonates formed, since the thermodynamic mechanisms of the isotopic composition of minerals is reflected by both mineralization temperature and ambient water isotopic composition. A temperature dependence response also occurs in carbonates, as they discriminate relatively lighter 16O from ambient water at higher temperatures during the mineralization process (Kim and O'Neil, 1997). Similarly, fish otoliths which are metabolically inert acellular aragonite compounds in the inner ear (Campana, 1999; Grønkjær, 2016), have proven to be effective for reconstructing temperatures experienced by fish (Jones and Campana, 2009; West et al., 2012; Willmes et al., 2019; Hane et al., 2020). Using the daily deposition pattern of otoliths, the temperature and water-δ18O-isoscape allows otoliths to be applied to fish migration and behavioral studies (e.g., Sakamoto et al., 2019). Furthermore, since the dissolved carbon in fish blood is physiologically controlled to regulate the fluid pH, which fluctuate with diet digestion and metabolic activities (Solomon et al., 2006), the carbon isotope composition in fish otoliths can therefore be applied to estimate individual field metabolic rate (Chung et al., 2019).
To utilize the otolith δ18O composition as a thermometer, the species-specific temperature dependent equation representing the negative relationship of otolith isotopic fractionation against ambient water temperature should be initially identified (Darnaude et al., 2014). Previous studies with several fish species used laboratory-controlled rearing experiments under gradient temperatures to ensure that temperature was the only factor influencing the deposition of otolith δ18O (δ18Ootolith, e.g. Kitagawa et al., 2013; Sakamoto et al., 2017). The relationships between fractionation of δ18Ootolith against water and temperature could then be quantified based on well-established thermodynamic equations (Kim and O'Neil, 1997) under the assumption that δ18O in mineral aragonite is precipitated in, or near, equilibrium; however, it is still controversial that the temperature dependency is species-specific or purely under thermodynamic control (Patterson et al., 1993; Radtke et al., 1996; Thorrold et al., 1997; Høie et al., 2004b; Walther and Thorrold, 2009; Kitagawa et al., 2013; Sakamoto et al., 2017; Shirai et al., 2018b).
Several methods have been employed to reduce systematic errors and evaluate the results in previous studies with otoliths, including isotopic distinction of intra-fish paired sagittal otoliths (Thorrold et al., 1997), high-precision otolith extraction procedures (Sakamoto et al., 2017), isotope mass spectrometry instrument calibration (von Leesen et al., 2021) and back-calculated temperature and in situ temperature correlation (Willmes et al., 2019). The chum salmon Oncorhynchus keta, as an anadromous fish, shift the habitat from freshwater to seawater in early life stages (Salo, 1991; Johnson et al., 1997; Beamish, 2017), indicating the shift between isotopically distinct environments (LeGrande and Schmidt, 2006; Oppo et al., 2007). Thus, to accurately determine the relationship between otolith isotopic fractionation and seawater, otolith portions reflecting the freshwater life stages should be restricted from the extraction. This study aims to determine the temperature dependence of otolith oxygen isotopic fractionation against seawater on anadromous chum salmon by adopting a laboratory-controlled gradient-temperature rearing experiment. The accuracy of the results will be promoted by the high precision extraction of otolith portions, excluding the low δ18Ootolith values during the freshwater period induced by the uneven morphological structures, as well as by testing for the attribution of the isotopic composition in seawater on δ18Ootolith.
Juvenile chum salmon were obtained and reared at the Touni Salmon Masu Hatchery Enhancement Station, Iwate Fishery Technology Center, Kamaishi, Japan. Individuals (300; 40–50 mm FL) hatched between March 1 and April 1, 2020 were selected and transported into two 100 L tanks filled with freshwater. On May 20, the otoliths of the juveniles were marked with 10 ppm Alizarin Complexone solution (ALC) at 10.1–10.7°C for 1 d to record the start of the experiment (Saito et al., 2007; Kasugai et al., 2013). After 1 week of temporary rearing in freshwater, juveniles were transported to the International Coastal Research Center (Current name: Otsuchi Coastal Research Center), Atmosphere and Ocean Research Institute, The University of Tokyo, Otsuchi Bay, Japan, and reared for another 3 d at 12°C in a 500 L freshwater tank to ensure recovery from transportation stress. The procedure above produced a mortality rate of 8.3% with the cost of 15 individuals during ALC dyeing and 10 individuals during transportation.
After acclimation, another 500 L tank at 12°C was filled with filtered seawater (salinity = 33.5) pumped from Otsuchi Bay for 1d seawater domestication. While the experienced temperatures for wild individuals were 9–13°C (Irie, 1990) and the significant lethality from constant exposure to 22°C (Hicks, 2000), the following gradient-temperature acclimation was conducted within a temperature range of 9–20°C (uppermost temperature treatment was 2°C below upper incipient lethal temperature to permit a high survival rate), and the temperature treatments were arranged as 9, 12, 15, 18 and 20°C, implemented in five tanks (2 in 150L and 3 in 80L because tanks in the same size were unavailable). On June 1, 50 individuals each were randomly selected and transferred into two 150 L (9 and 12°C) and three 80 L (15, 18, and 20°C) temperature gradient rearing tanks, respectively (Figure 1). Water temperatures were elevated or depressed by automatic heater-cooler units (AQUA Co., Ltd, Tokyo, Japan, ARK802-301A-5) within 3.5 h after the juveniles were transferred. The juvenile were then acclimated in 5 temperature groups for three months, a timescale represents the approximate migration period from coastal zones to Okhotsk Sea for wild juvenile chum salmon spawned in Iwate prefecture (Urawa et al., 2018). Juvenile chum salmon were fed twice a day with 4% body weight of formula pellets (Marubeni Nissin Feed Co., Ltd, Tokyo, Japan; EPC4: water 12.7%, protein 42.6%, fat 6.9%, fiber 1.0%, ash 12.6%, nitrogen-free extract 24.2%, particle size 1.5 mm) and maintained under artificial light with a 12:12 h light/dark regime. The seawater was aerated and refreshed daily with an exchange rate of 10% tank volume of fresh seawater during the 90 d experimental period (except for the 18°C group that ended on the 83rd day evolved by instrumental trouble of pump, and the fish were then sacrificed, somatically measured and frozen at –20°C). Tanks were capped with transparent covers to prevent evaporation of seawater (80L tanks with original packing covers while 150L tanks with hand-made PVC plate caps) and were sanitized at the end of the 3rd, 7th, and 11th weeks with 100% seawater exchange to reduce the isotopic effect of background respiration (e.g., bacterial oxygen consumption and algal photosynthesis). The rearing experiment ended on August 30, and the sampling strategies for seawater and fish were followed.
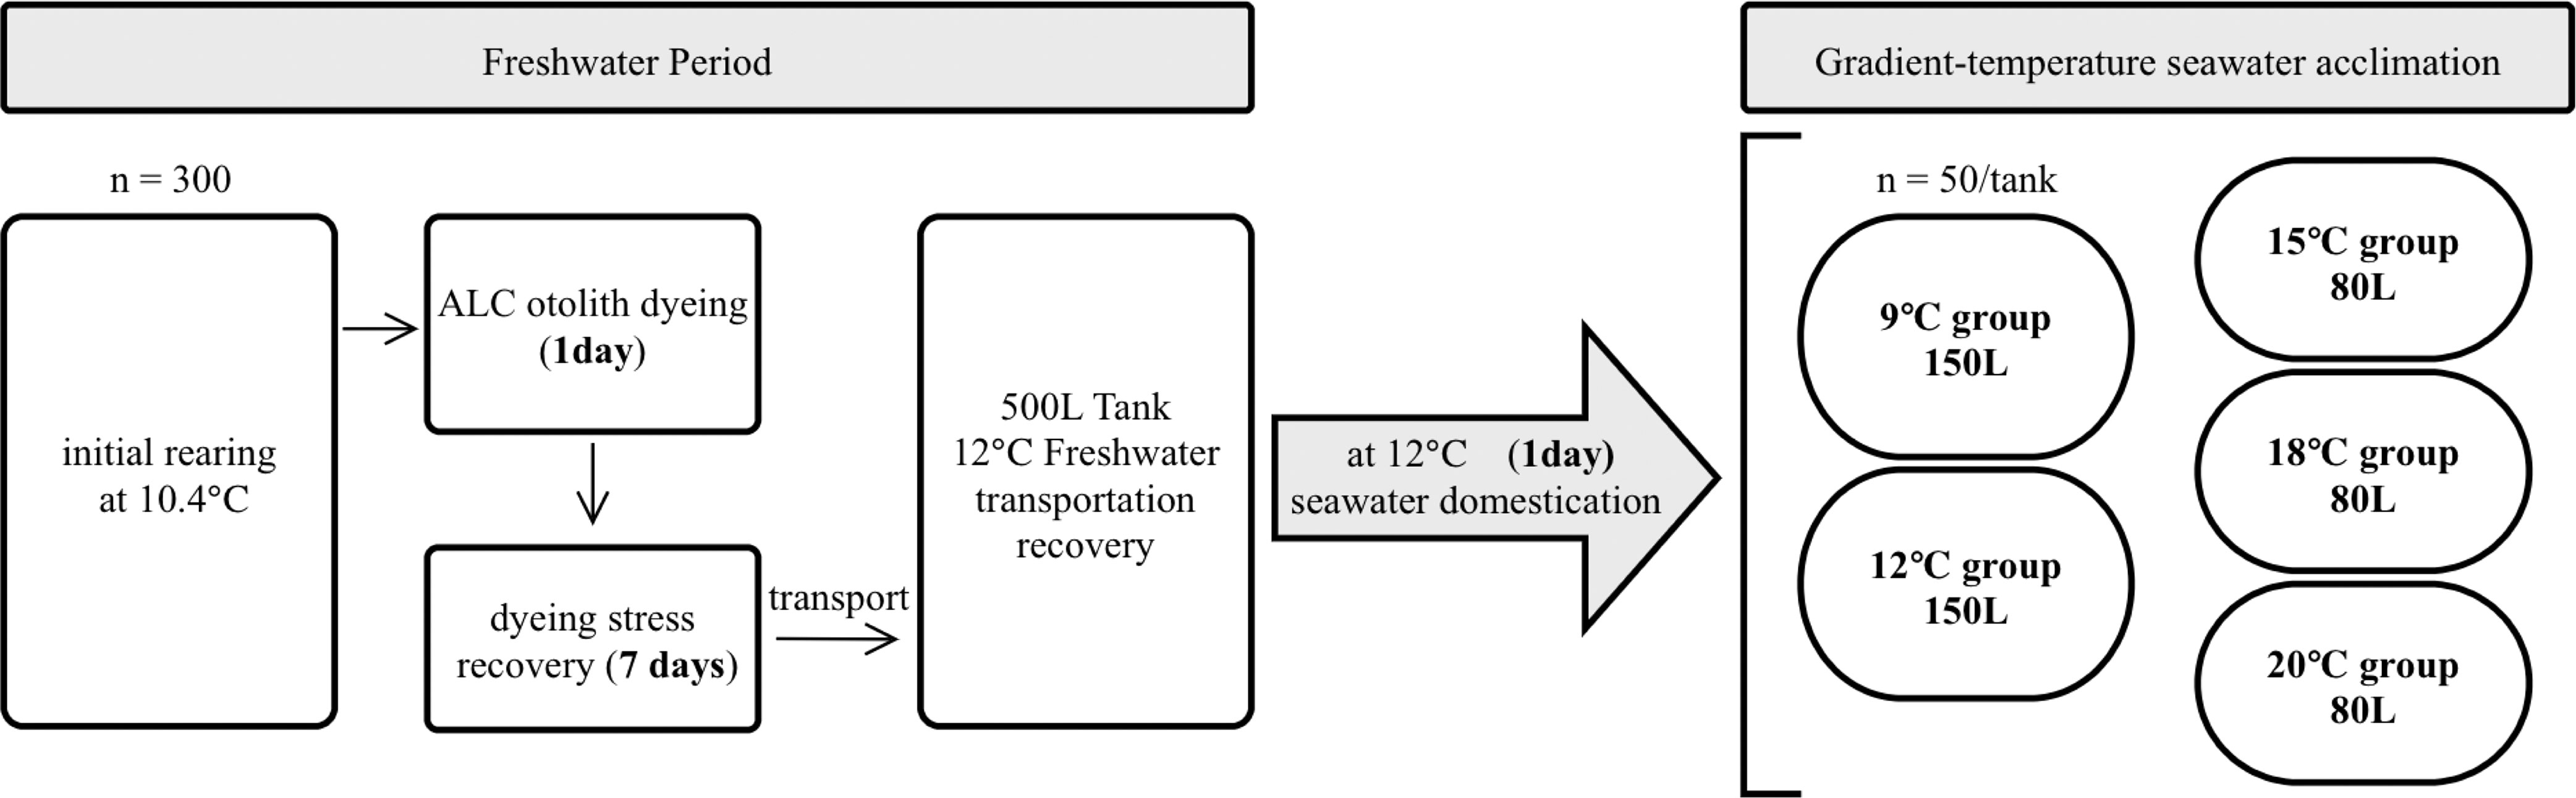
Figure 1 Flowchart of the rearing experiment in respective freshwater and seawater period. n: juvenile chum salmon individual number; ALC, alizarin complexone.
Rearing seawater samples for isotopic analysis were collected weekly from the first day of the gradient-temperature rearing experiment. After recording the salinity and instant water temperature, the seawater from each temperature group was filtered with a 0.45 μm syringe filter and transferred into separate 50 mL plastic vials. The water samples were then stored at 4°C until oxygen isotopic analysis. Filtered seawater for carbon isotopic analysis of dissolved inorganic carbon (DIC) in each group was injected into 20 mL septum-sealed glass vials to prevent air contamination. After samplings, the seawater samples were sent by refrigerated courier to Atmosphere Ocean Research Institute, The University of Tokyo, and the oxygen and carbon isotopic analysis were conducted soon after.
Juveniles at the end of the rearing were used for determination of δ18Ootolith fractionation equation, but 6 individuals were randomly sampled from each tank every two weeks (once a week at the beginning and the end of the experiment) to record the somatic and otolith growth. The fork length and body weight of individuals were measured to calculate the feed pellet mass. Juveniles sampled at the end of the rearing experiment were frozen at −20°C and defrosted for sagittal otolith extraction using a lateral extraction method (Wakefield et al., 2016) and nylon brushes were used to remove any adhered material, whereby 42 otoliths in total: 11 at 9°C, 8 at 12°C, 9 at 15°C, 8 at 18°C, 6 at 20°C and one random otolith, either left or right, from one individual were selected. The otoliths were then maintained in an ultrasonic Milli-Q water bath and dried at room temperature (23°C). Cleaned otoliths were attached to glass slides with epoxy resin (Burnham Petrographics LLC) and ground with 15 μm sandpaper followed by a polishing procedure with 10 μm diamond films until the otolith cores were observed clearly under a microscope (10×). The ALC marks of the polished otoliths were identified under a fluorescence microscope (30×, Olympus BX63 coupled with a U-RFL-T fluorescence light source, Olympus, Tokyo, Japan). Based on the fluorescence results, daily rings corresponding to ALC marks were identified on the light microscopic results using an otolith measurement system (Ratoc System Engineering Co. Ltd., Tokyo, Japan) (Figures 2A, B). To extract the newly deposited portion on the otolith that reflected the seawater rearing period at respective temperature group for isotope analysis, the growth ring representing the day on which the temperature gradient introduced was also identified on the light microscopic results by counting 11 daily rings from the ALC mark to the otolith margin (7 d assimilating rearing after ALC treatment in freshwater, 3 d stabilization rearing after transportation, and 1 d domestication rearing before seawater temperature gradients were introduced, Figure 2C).
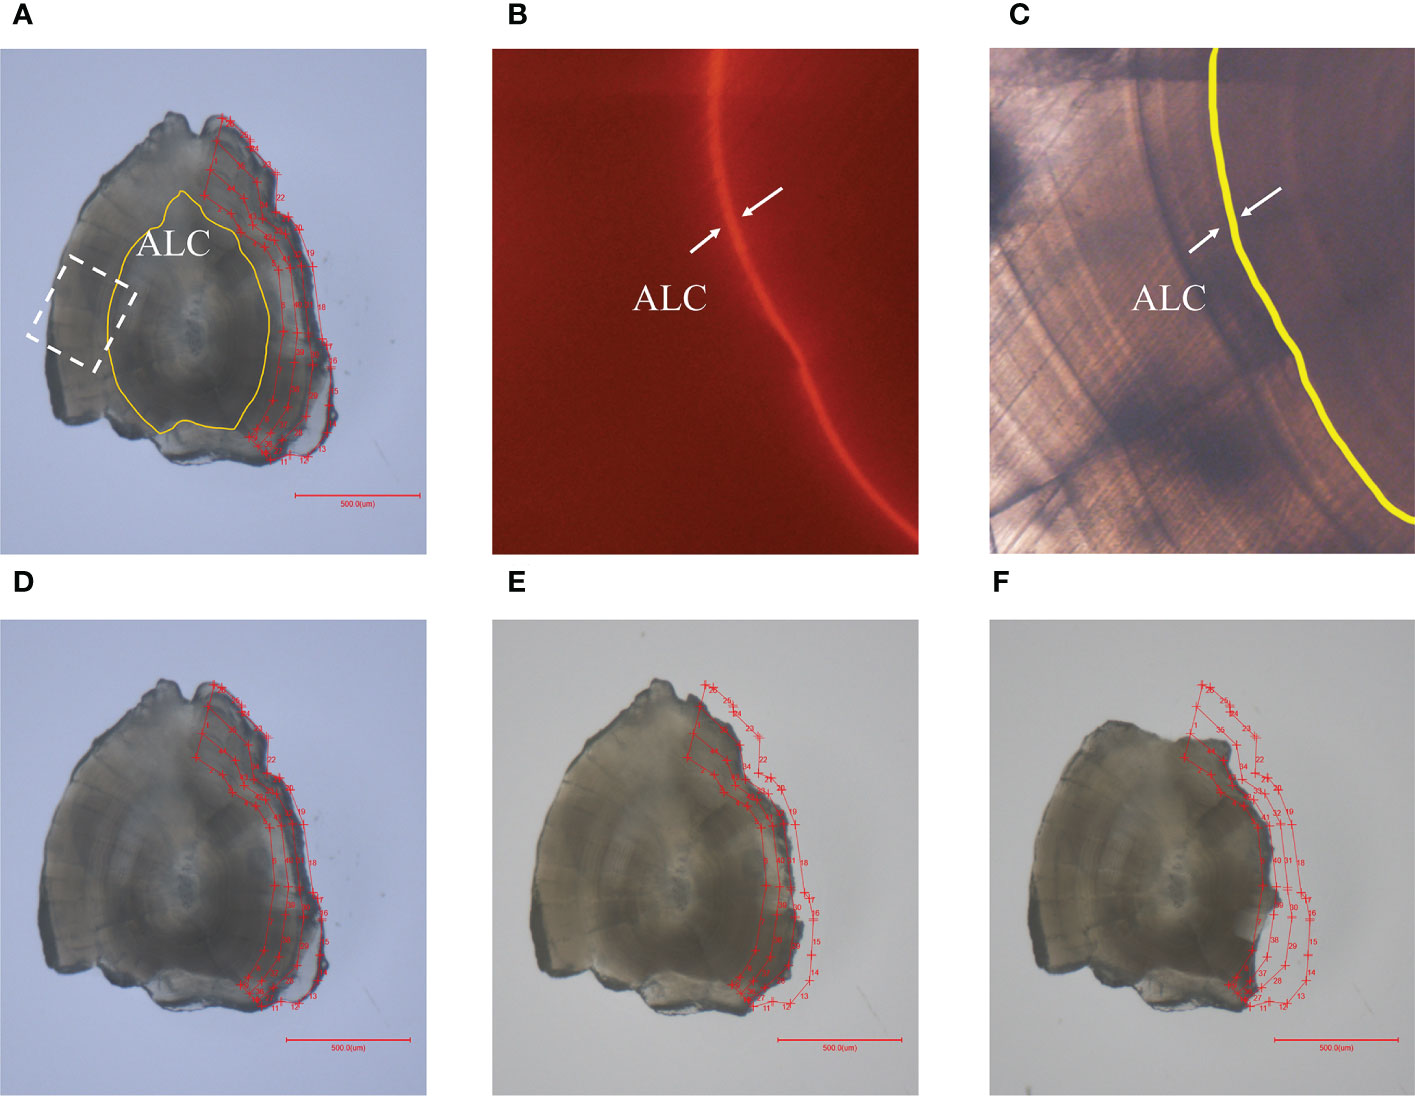
Figure 2 (A) Extraction portions surrounded by several red line segments out of the yellow ALC mark to the edge, and labeled as inner, middle, and edge from the core to the edge of an alternative otolith used in this study. The white dotted square shows the images of the ALC mark correlated to (B) and (C); (B) Orange ALC mark was observed under fluorescence microscope (× 20); (C) ALC mark was identified by a yellow line using light microscopy at the same field of (B); (D–F) show the otoliths after the extraction procedure for edge, middle and inner portions, respectively, for isotope analysis.
Otolith powder for isotope analysis was sampled using a high-precision micro-drilling system (QuickPro, MicroSupport, Shizuoka, Japan) coupled with video monitoring and analysis software. Considering the variance of δ18Oseawatervalues during 3 months rearing and the mix of the otolith powder representing the freshwater rearing period, the newly deposited proportion on the otolith was divided into three equivalent samples (hereafter inner, middle, and edge) to improve the accuracy of the estimation on δ18O fractionation (Figures 2D–F). Another sample was examined for alternatively selected otoliths from each temperature group by drilling from the ALC mark to the core (freshwater period), and the δ18Ootolith values were compared with those of the three samples collected from the same otolith, to evaluate the effect of contamination from freshwater period. To satisfy the instrumental detection limit of the following isotope analysis, > 8 μg powder for each otolith portion was collected into cleaned glass vials. This approach allows for a reduction of the operation error by adjusting the ALC mark, and the influence of freshwater can also be excluded based on the three equivalent extractions method. Otolith powder samples were then used for isotope analysis. The carbon isotope values were also analyzed to examine the potential effect of kinetic and metabolic isotopic fractionations.
The δ18O and δ13C values of otolith powder samples and δ13C values of DIC (δ13CDIC) in rearing seawater were measured using an isotope ratio mass spectrometer (Delta V plus, Thermo Fisher Scientific, Waltham, Massachusetts) equipped with an automated carbonate reaction device (GasBench II, Thermo Fisher Scientific) installed at the Atmosphere and Ocean Research Institute, University of Tokyo. The traditional CO2 conversion technique was used, whereby the otolith powder and DIC in seawater were extracted to CO2 by reacting with 100% phosphoric acid at 72°C for carbonate and 25°C for DIC, after flushing with pure helium. Equilibrated gaseous CO2 was then transported with the helium flow to the mass spectrometer for δ18O-CO2 and δ13C-CO2 determination. The detailed analytical conditions for otoliths and DIC in seawater samples have been reported previously (e.g., Shirai et al., 2018b; Zhao et al., 2019), with modifications for small quantity of samples (see Breitenbach and Bernasconi, 2011). The isotopic results used delta notation standardized to the Vienna Pee Dee Belemnite (V-PDB) scale based on NBS-19 values of −2.20‰ and 1.95‰ for δ18O and δ13C, respectively. No correction was applied for the acid fractionation factor between calcite and aragonite at the phosphoric acid-calcium carbonate reaction temperature of 72°C (Kim et al., 2007; Shirai et al., 2018a). The standard deviation of the external reproducibility of δ18O and δ13C analysis for otoliths and δ13C of DIC were better than 0.15‰, 0.12‰ and 0.14‰, respectively, based on the reproducibility of NBS-19.
The δ18O values of the rearing seawater samples were determined using a Picarro L2120-i analyzer at the Atmosphere and Ocean Research Institute, University of Tokyo. Before introduction into the analyzer, samples were filtered using a membrane filter (φ = 0.45μm) to reduce suspended particles and prevent blocking of the sampling line. Data are reported in delta notation and standardized against Vienna Standard Mean Ocean Water (VSMOW). The long-term instrument reproducibility was ±0.08‰.
Two-factor permutational univariate analysis of variance (ANOVA) was used to determine the differences in δ18Ootolithor δ13Cotolith values among otolith portions and temperature treatments. Two-sample t-test was used to evaluate the means differences of otolith radius, somatic and otolith growth rate, body mass among temperature treatments. Linear regression analysis were used to assess the relationship between otolith isotopes and temperatures, and non-linear regression analysis was used to describe the best-fitted curve for somatic growth. Analysis of covariance (ANCOVA) was used to compare the slopes and intercepts calculated in this study against synthetic aragonite. Partial correlation analysis was used to determine whether the correlation between carbon and oxygen fractionation remained after removing the effect of temperature. All the statistical analysis and graphical plotting were performed in OriginPro (ver. 2022, OriginLab Corporation, USA).
Variations in δ18Oseawater, δ13Cseawater, water temperature, and seawater salinity during the rearing experiment are shown in Figure 3. Covariation among the parameters was not evident. Average salinity among 5 groups was 33.20 ± 0.17, and the large fluctuation occurred in the inner otolith deposition period for 9 and 20°C groups, with standard deviations of 1.10 and 0.79, respectively. In general, the rearing water of the 9 and 12°C groups showed greater δ18O depletion compared to the other three groups. The 9°C group presented δ18Oseawater fluctuations fueled by standard deviations during the period at which the inner and edge otolith portions deposited were larger than the middle portion, with values of −0.56 ± 0.17‰ for the inner and −0.70 ± 0.31‰ for the edge regions, compared with −0.67 ± 0.004‰ for the middle portion. Therefore, the middle portion of otoliths reflected the most stable rearing period.
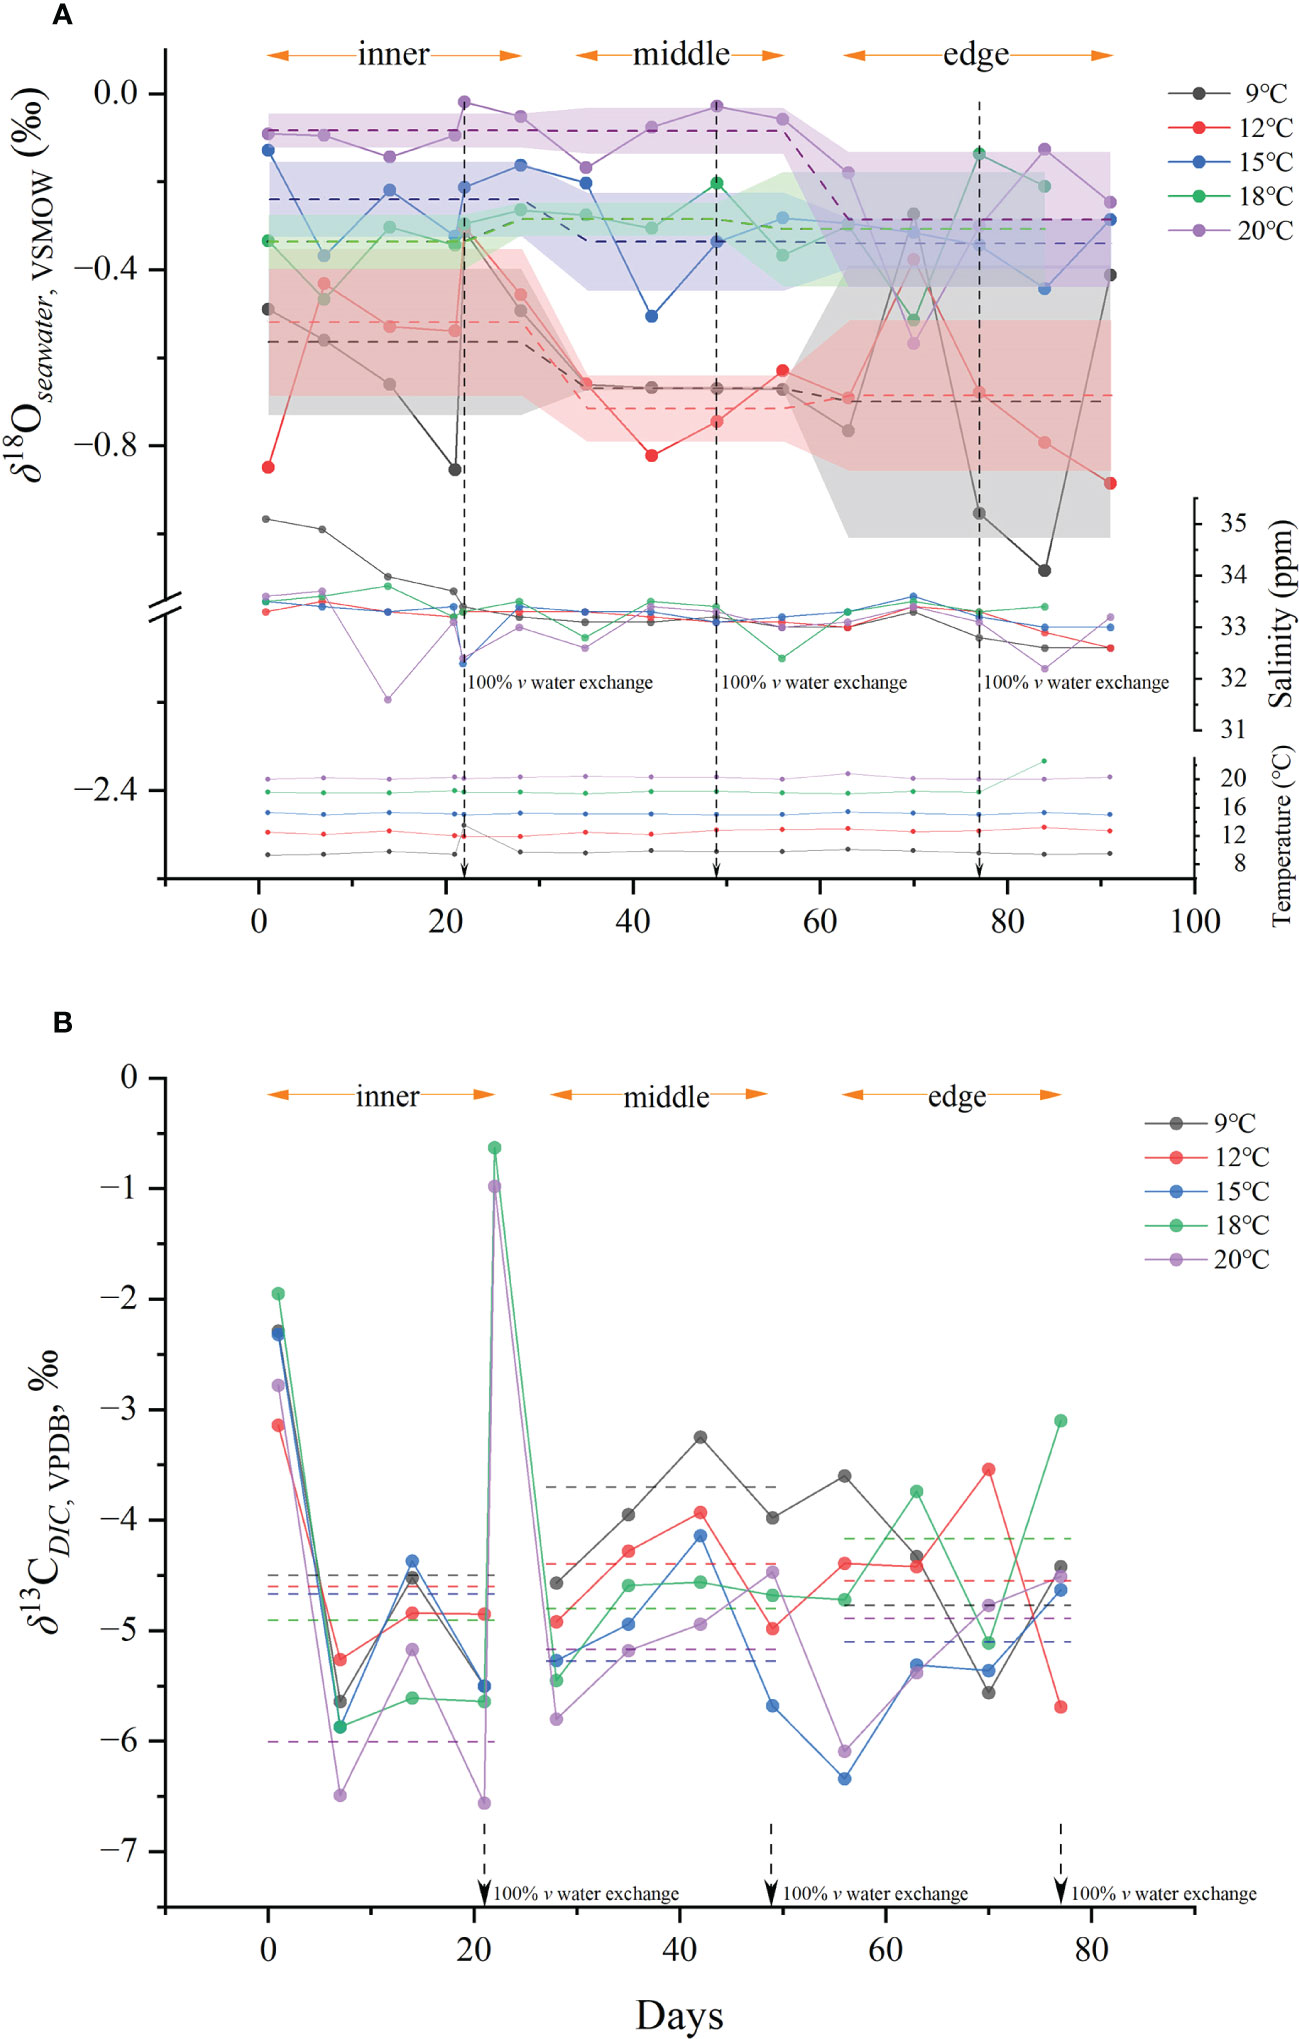
Figure 3 (A) Variation of δ18Oseawater values, salinity and temperatures of rearing water of five temperature groups during rearing experiment; (B) variation of δ13Cseawater values during rearing experiment. The dashed lines represent the average isotope values used in fractionation calculation.
Juvenile chum salmon had an average primary weight of 1.69 g and the general somatic growth patterns for individuals in the five temperature groups are shown in Figure 4. The final weights at the end of the rearing experiment for juveniles at 9°C were significantly lower than those for the other four groups (two-sample t-test, p< 0.001). The average otolith radius was 539.81 ± 38.47, 658.66 ± 54.45, 630.8 ± 55.34, 617.34 ± 62.52, and 741.11 ± 56.76 μm, and otolith growth rate was 1.02 ± 0.42, 2.32 ± 0.60, 2.02 ± 0.61, 1.87 ± 0.69, and 3.23 ± 0.62 μm/d for the 9, 12, 15, 18 and 20°C groups, respectively. The average otolith radius and precipitation rate for individuals in the 9°C group were less than those of the other 4 groups (significant at 0.001 level for the 12, 15, and 20°C groups, two-sample t-test, p< 0.001; significant at 0.05 level for the 18°C group, two-sample t-test, 0.05< p< 0.01).
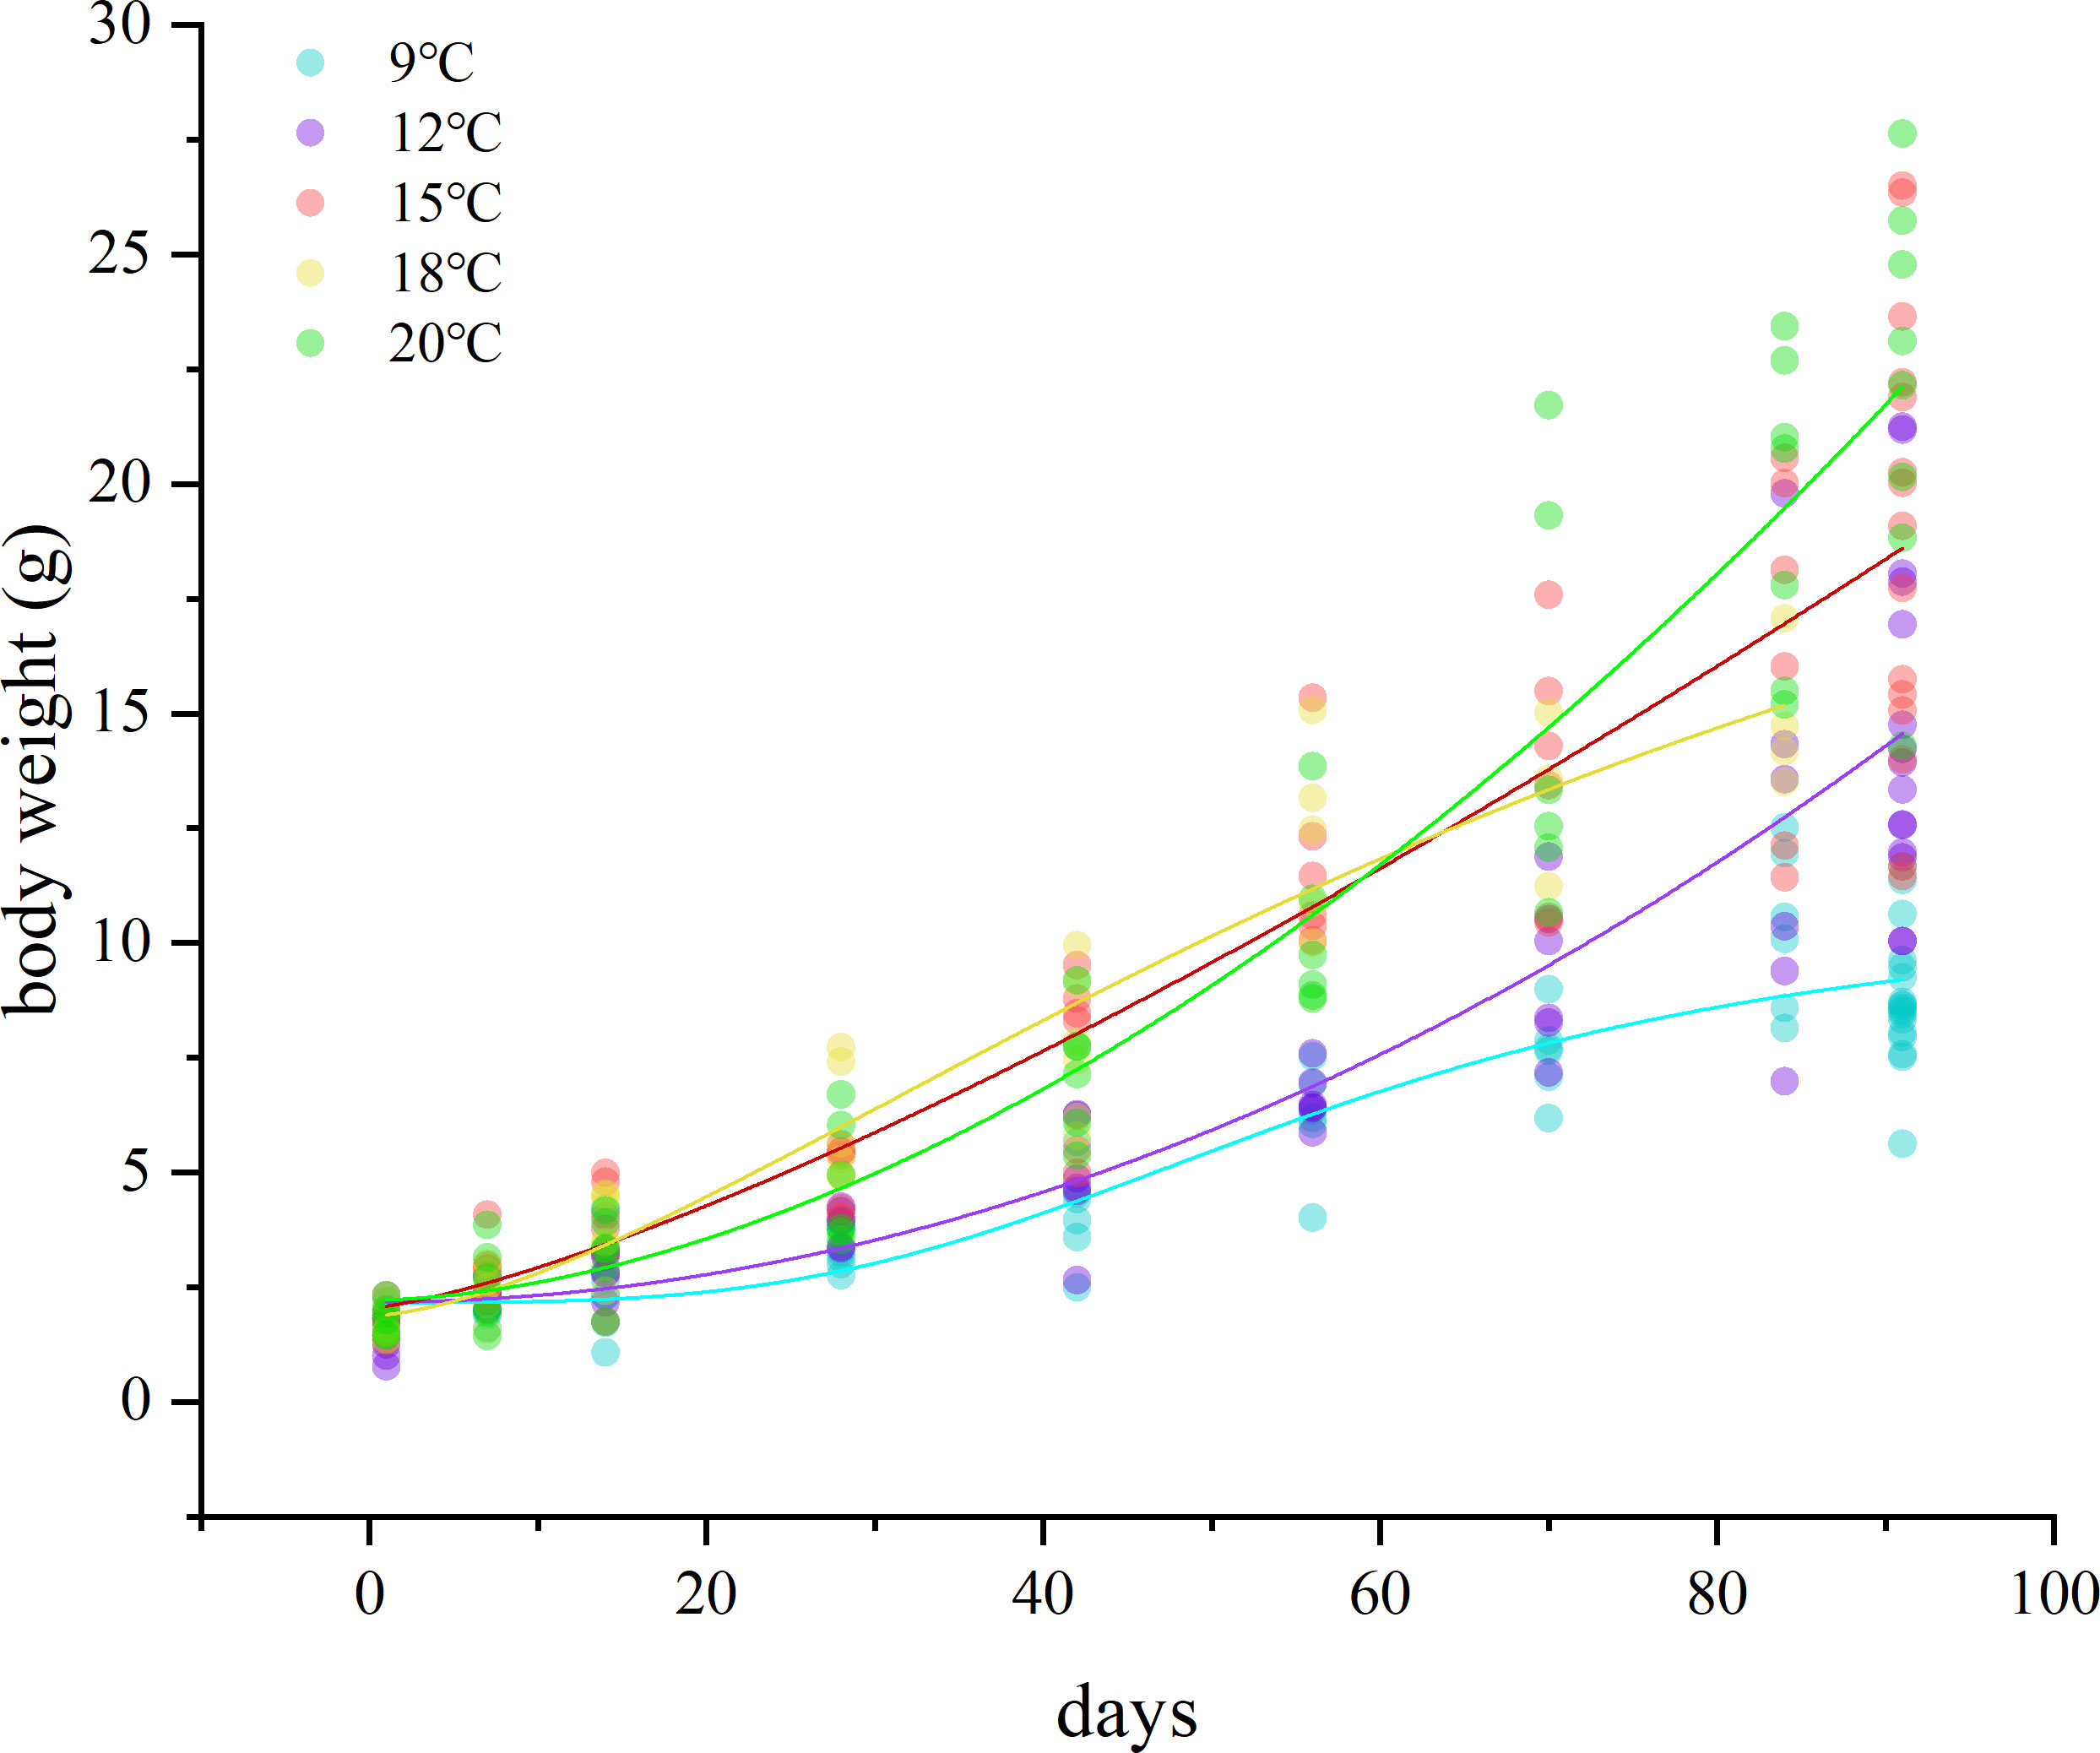
Figure 4 Potential variation of body mass of juvenile chum salmon during rearing experiment of five temperature groups. An alternate solid point represents the body weight (g) of an individual sampled randomly at the specified date.
The mean oxygen isotope value of otoliths (δ18Ootolith) from each temperature treatment varied from −0.91 ± 0.30 to 0.57 ± 0.46‰ (Table 1), and there was a significant difference among the five temperature groups (one-way ANOVA, p< 0.001). The δ18Ootolith values of the inner otolith portions differed from those of the middle portions (one-way ANOVA, p = 0.0012), and differed significantly from those of the edge portions (one-way ANOVA, p = 0.0009). There was no difference between the δ18O values of the middle and edge otolith portions (one-way ANOVA, p = 0.919), indicating a mix of otolith portions deposited in the freshwater period in the inner otolith samples. The δ18Ootolith and δ13Cotolith values for extra otolith represented the freshwater period was –3.65 ± 0.49 and –11.00 ± 0.35‰. By comparing the isotope values of inner portions with middle, it was indicated that only 4 out of 42 otolith samples were not mixed with otolith portions formed during freshwater period. The mix proportions ranged from 0.3% to 47.7% with an average value of 15.1% for all the samples. The proportions calculated by respective δ18O and δ13C were not statistically different (one-way ANOVA, p = 0.73). Thus, the mix of otolith portions deposited at freshwater period was assignable and the data of the inner portion were excluded from the following analysis. The δ18O values of the middle and edge portions of the otoliths among the five temperatures remained significantly different after the exclusion (one-way ANOVA, p< 0.001). Detailed otolith isotope values of individuals can be found in Table S1. The δ18Ootolith values of the edge and middle otolith portions are shown in Figure 5. In the 9°C group, δ18Ootolith values ranged from −0.64 to 1.23‰, with the δ18Ootolith edge values generally lower than those of the middle portions (one-way ANOVA, p< 0.05). The linear relationship between δ18Ootolith values of the five groups and water temperature can be generally described as:
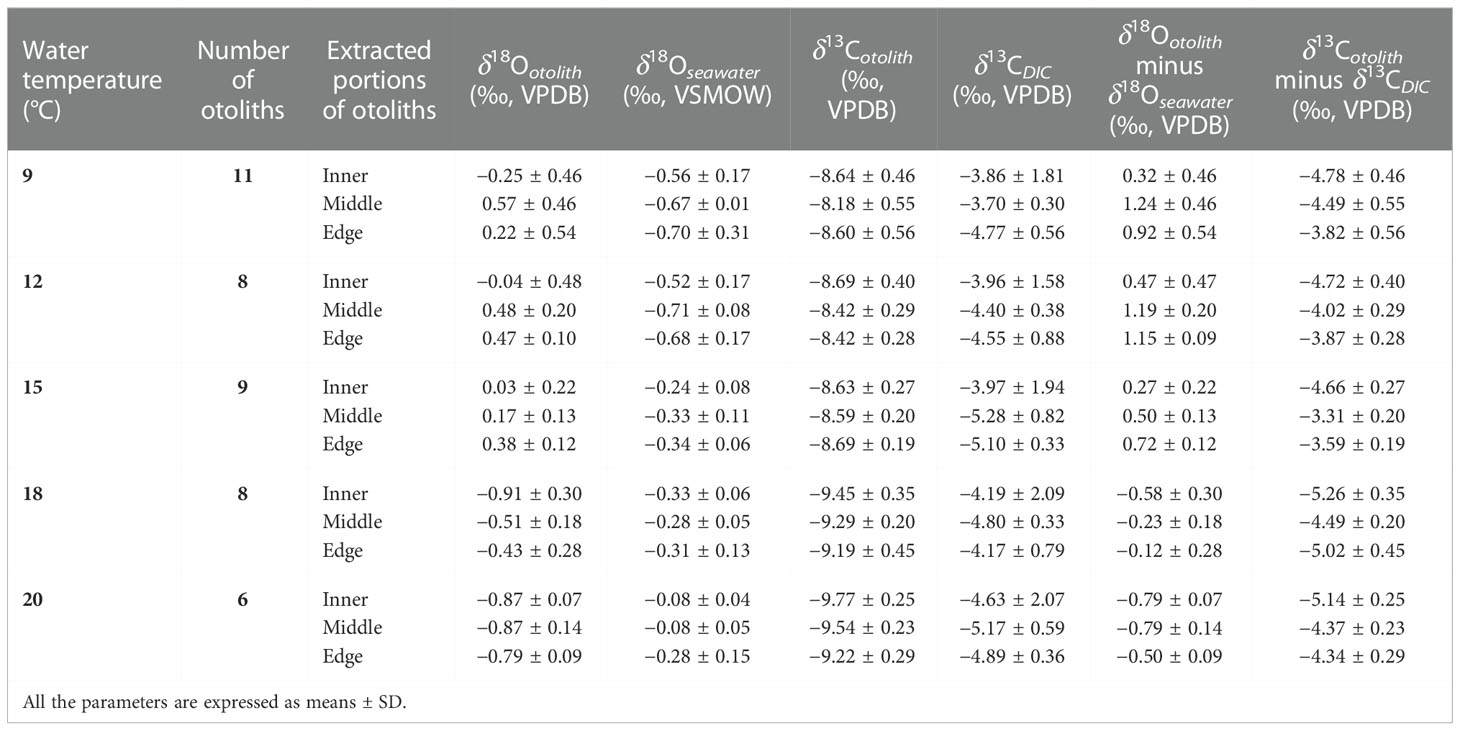
Table 1 Summary of oxygen and carbon isotope analysis results, including the numbers of otoliths used for isotopic analysis, mean δ18O and δ13C values of each extracted portion of otoliths, mean δ18Oseawater and δ13CDIC values of rearing water and DIC corresponding to the period of otolith precipitation, the oxygen isotope fractionation of otolith against rearing seawater and the carbon isotope fractionation of otolith against DIC.
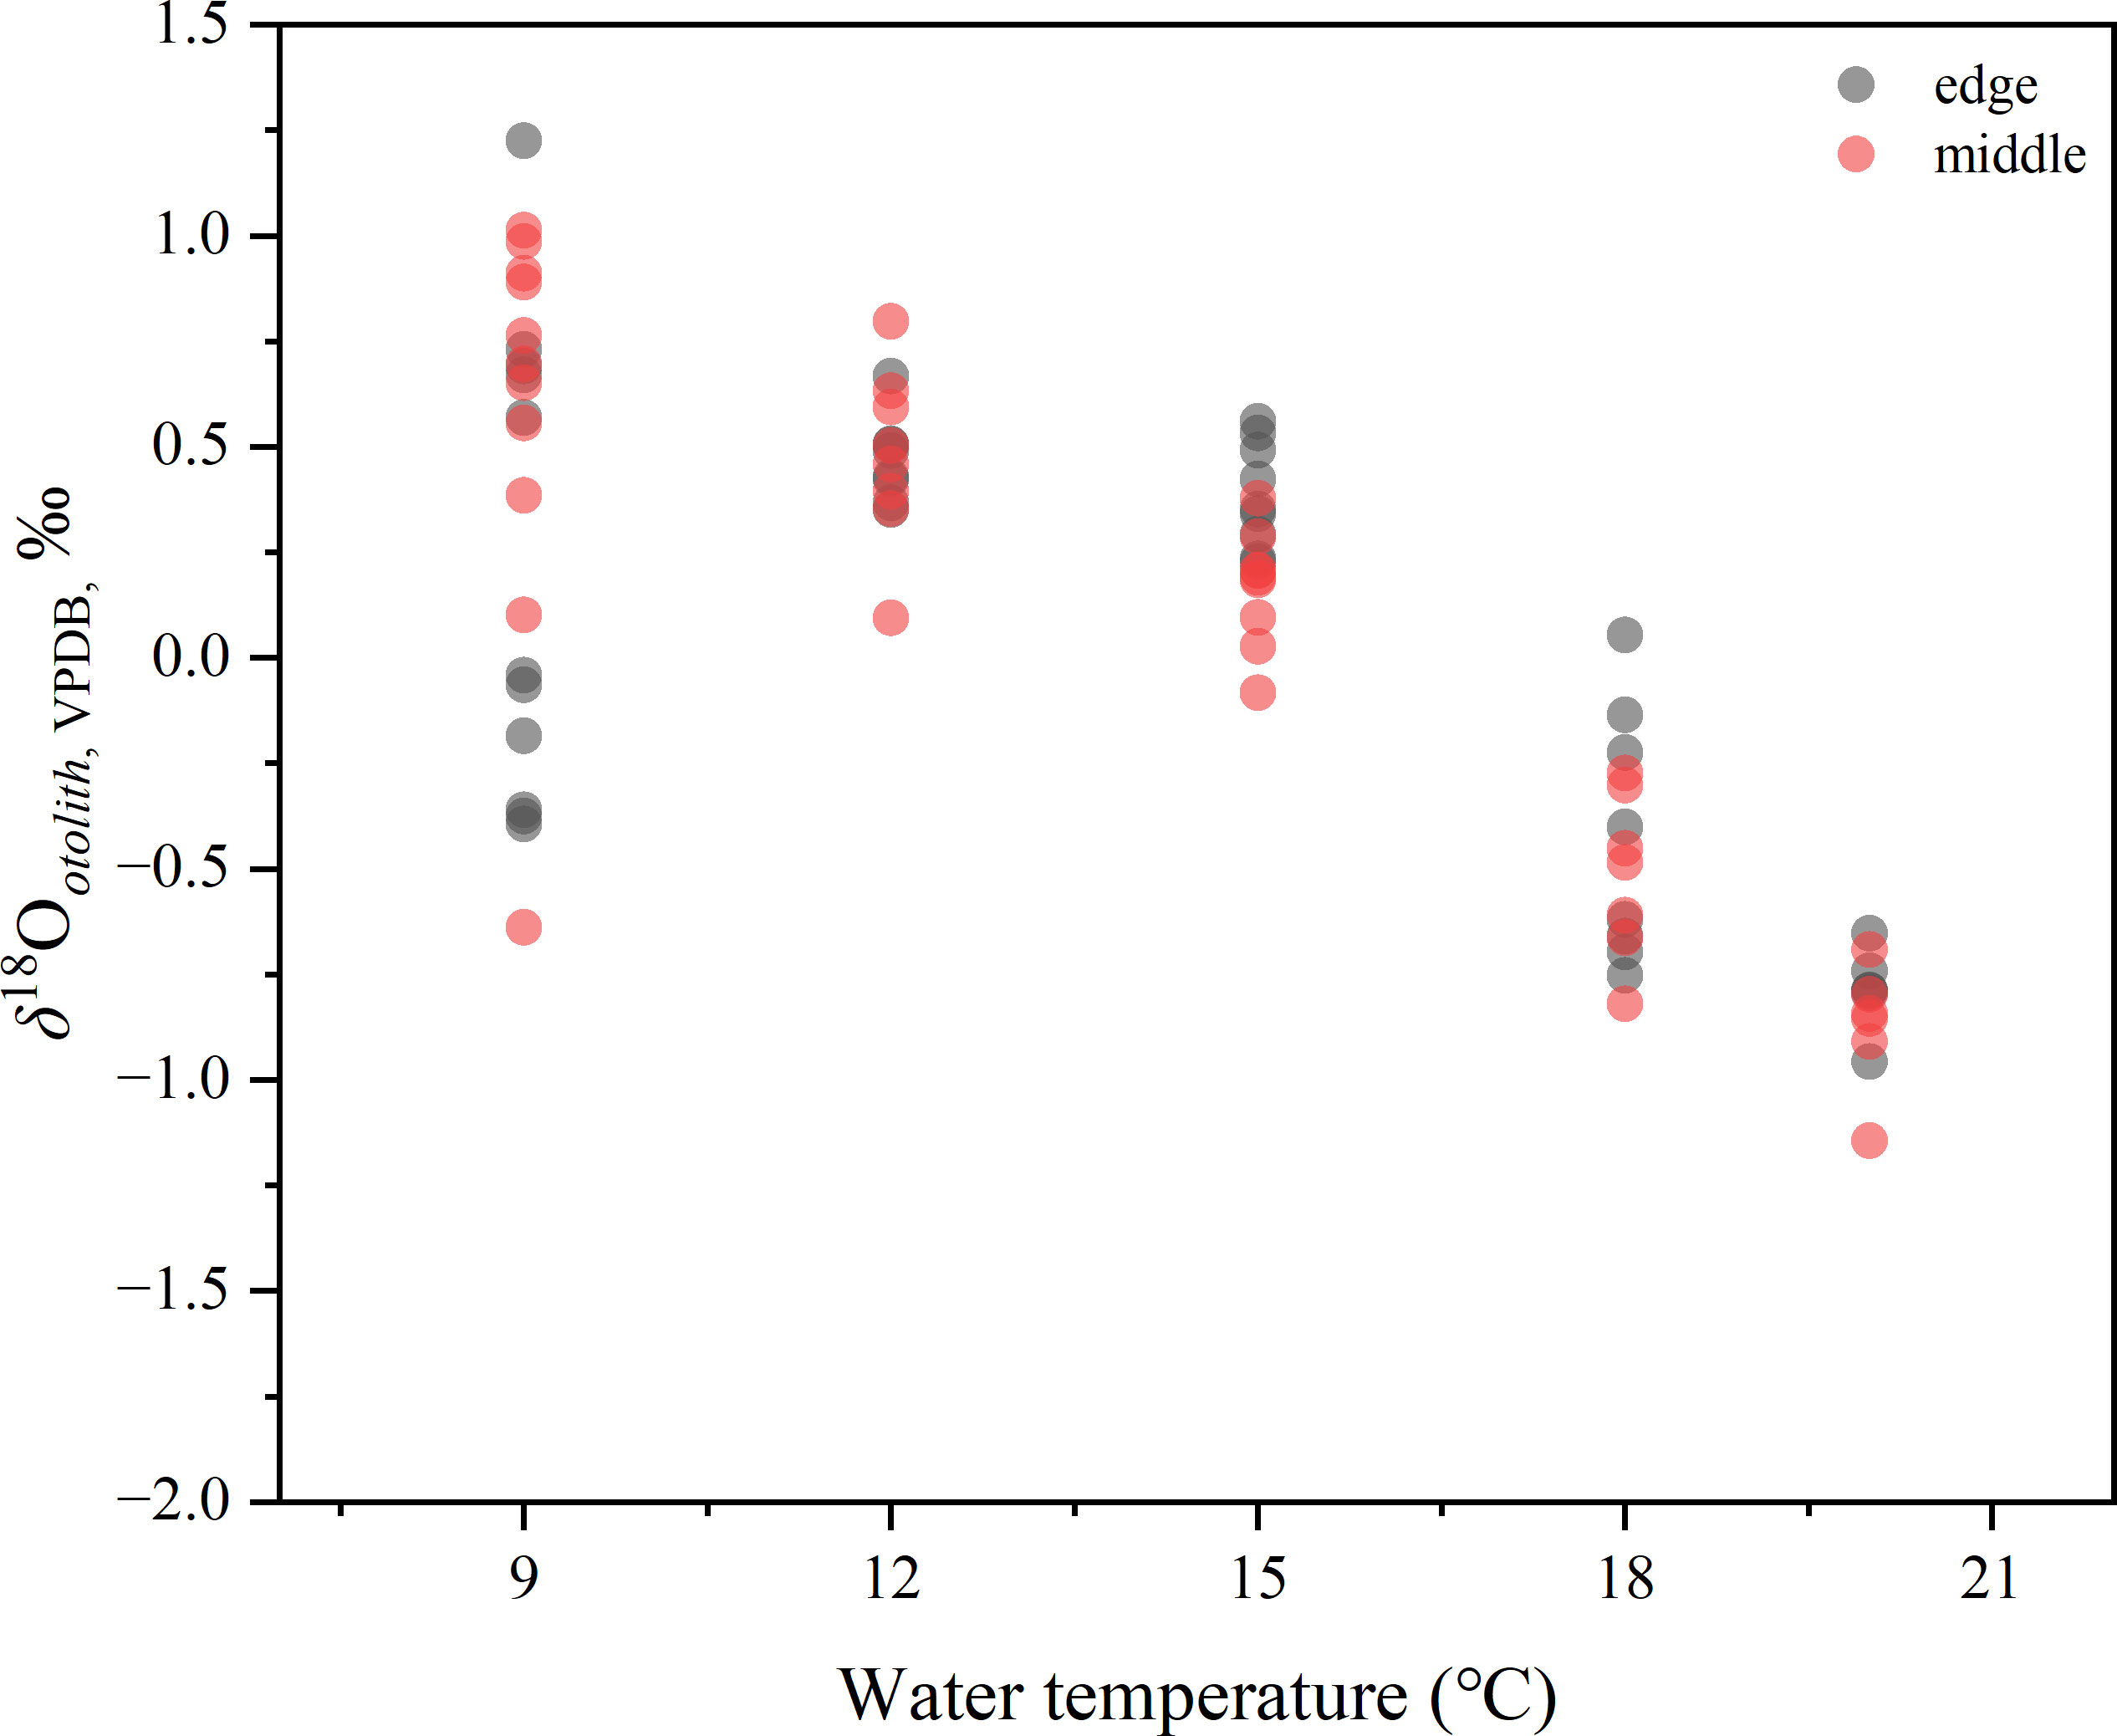
Figure 5 Distribution of middle and edge portions of five temperature groups. Solid circle represents one isotope value of otolith powder sample.
The mean δ13Cotolith values of each temperature group ranged from –9.77 ± 0.25 to –8.18 ± 0.55‰, with significant differences among the five groups (one-way ANOVA, p< 0.001). Similarly, the δ13Cotolith values of the inner portions were significantly lower than those of the middle (paired-sample t-test, p< 0.001), while the difference with the δ13Cotolith values of the edge portions was not significant (paired-sample t-test, p = 0.06). Paired δ13Cotolith and δ18Ootolithvalues were used in the following analysis; therefore, the δ13Cotolith values of the inner portions were not included.
The δ13Cotolith values of the middle and edge regions were significantly different among the five temperature groups (one-way ANOVA, p< 0.001). A plot of carbon isotopes versus temperature showed a decrease in δ13C with increasing temperature (Figure 6), indicating a negative weak correlation (Pearson’s r = −0.692, r2 = 0.472, p< 0.001). The deviations of δ13Cotolith from the DIC of seawater were also plotted against temperature and little correlation identified (r2 = 0.05, Figure S1).
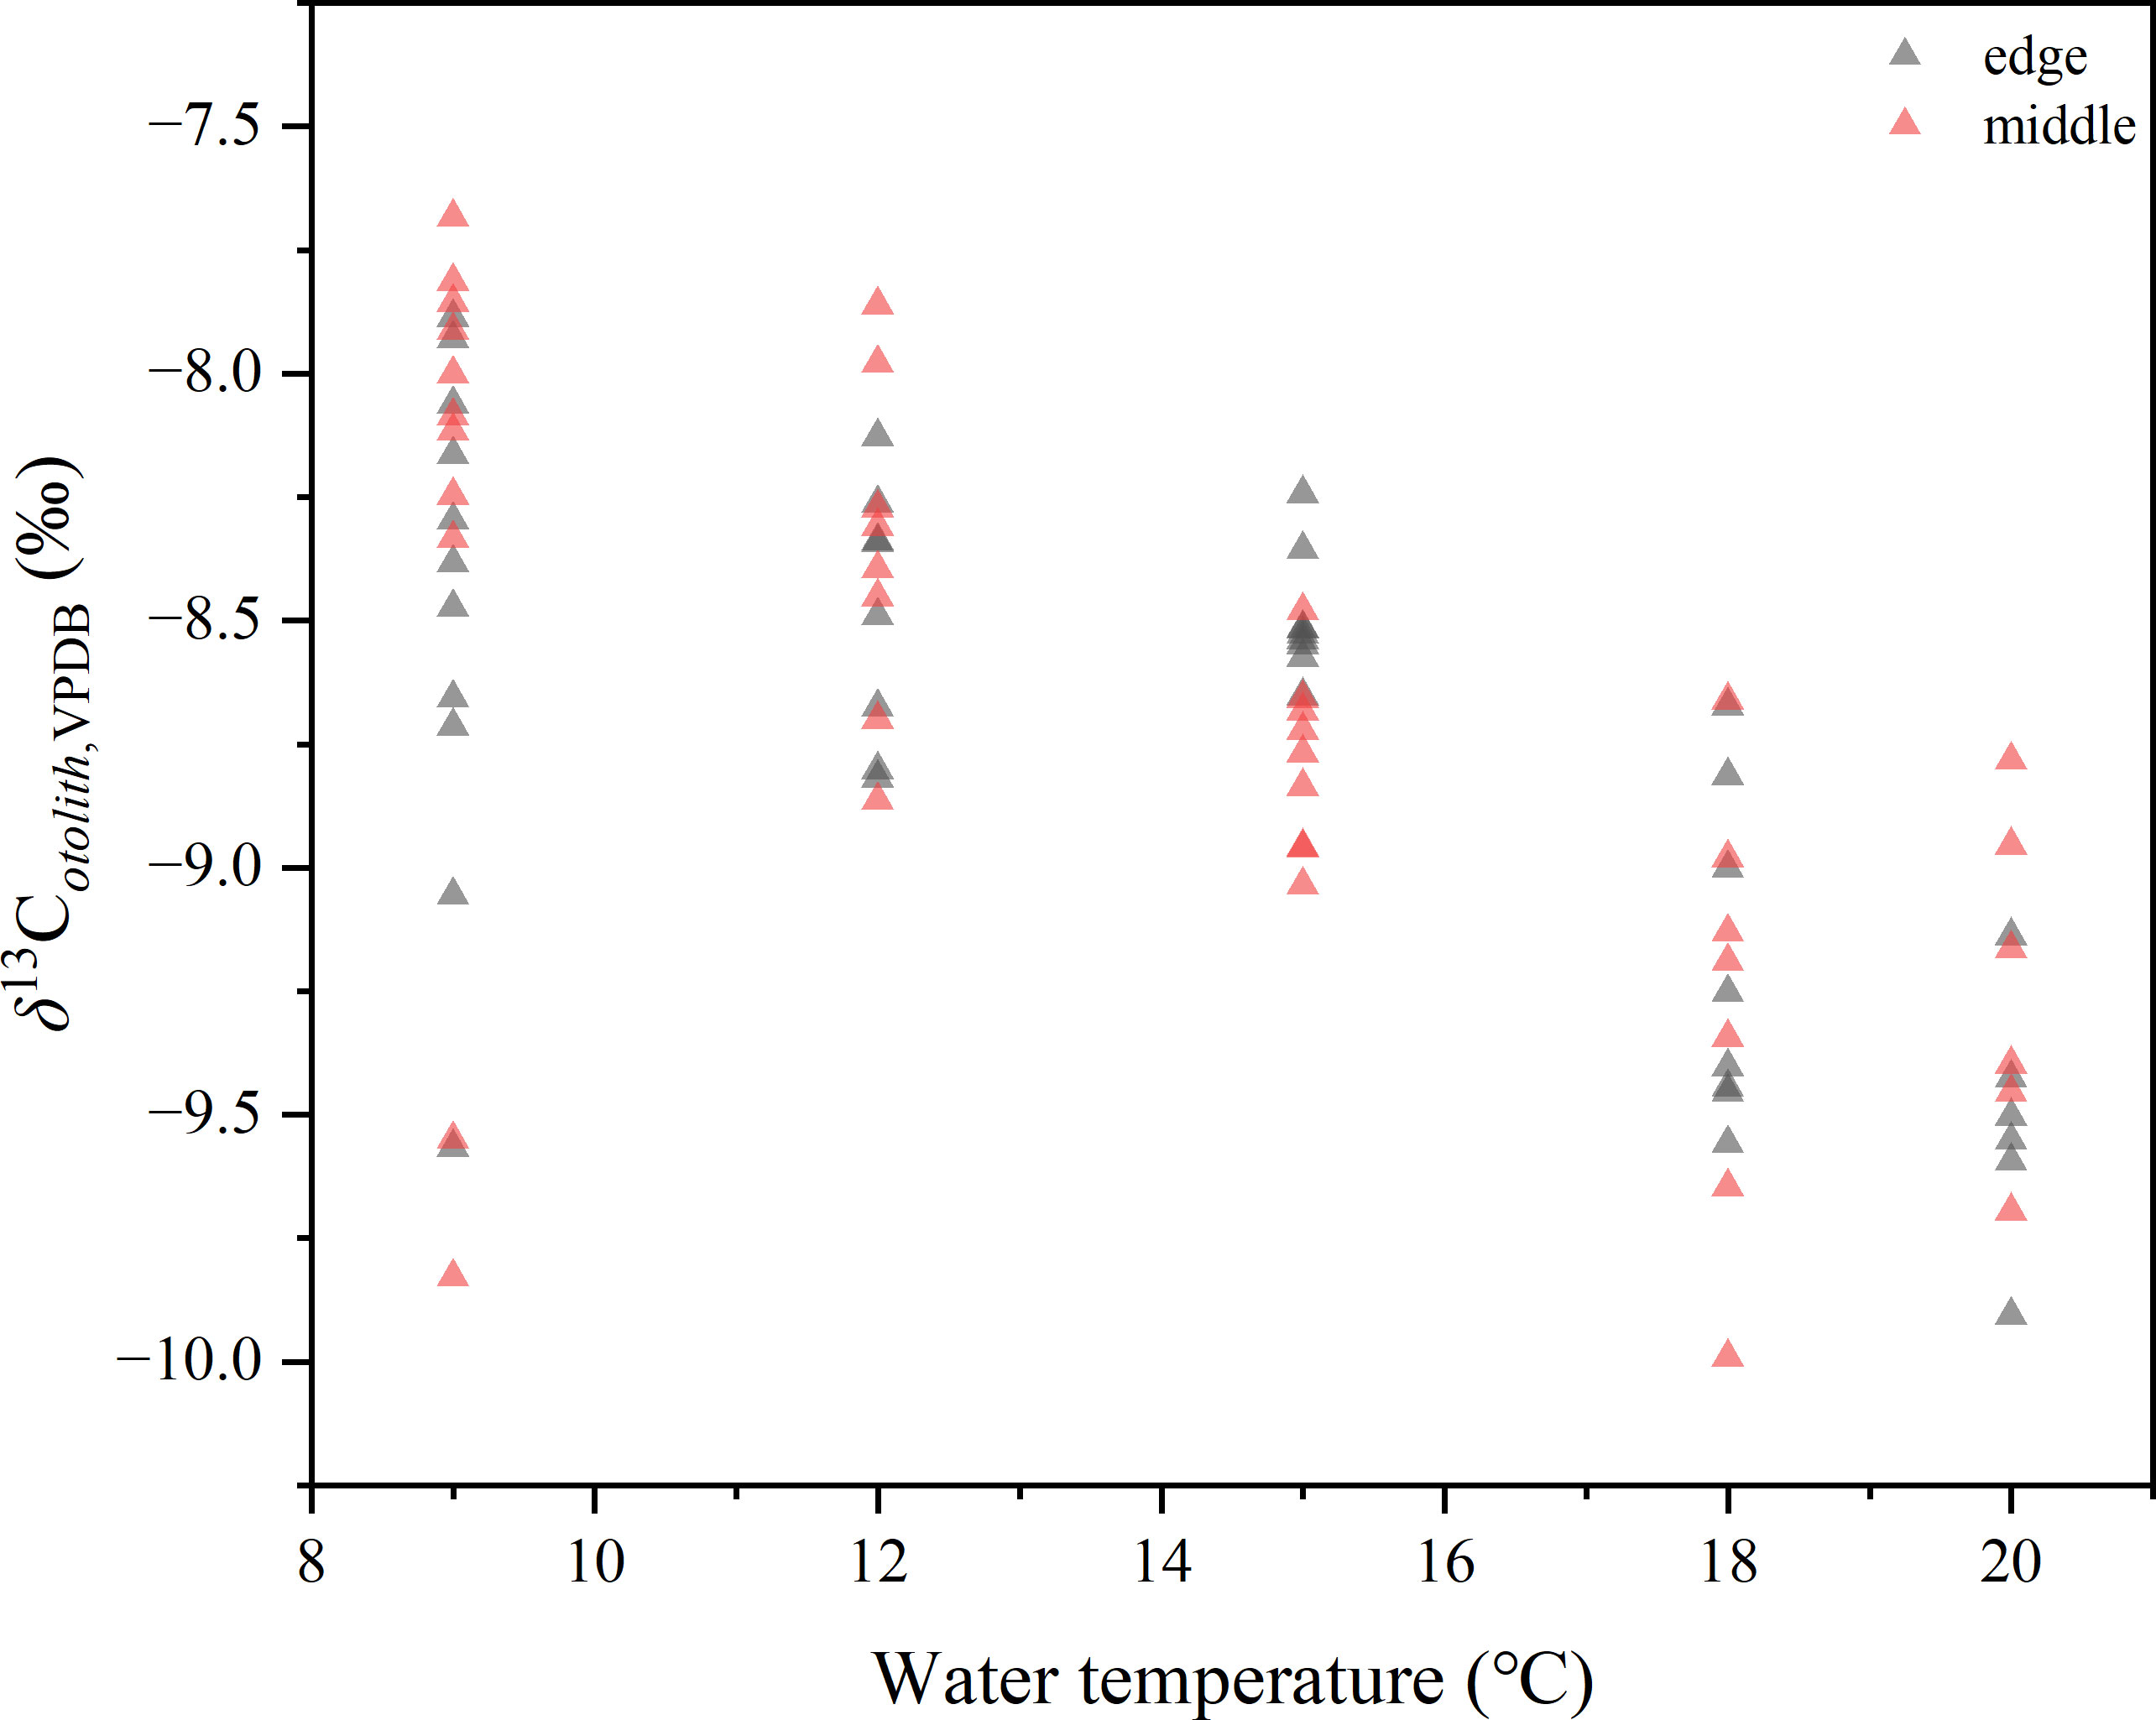
Figure 6 Distribution of δ13Cotolith values of middle and edge portions of five temperature groups. Each isotopic value of otolith powder sample is represented by a triangle.
The mean δ18Oseawater values during each deposition period were used to calculate the otolith oxygen isotope fractionation for the middle and edge otolith portions. To achieve the difference between otolith and seawater isotope values as accurately as possible, the deviations of the δ18Oseawater mean values should be restrained within a relatively small range to narrow the impact of seawater isotopic fluctuation. As described above, the δ18Oseawater mean value during the edge otolith portion deposited in the 9°C group fluctuated with a large standard deviation, which may impact the accuracy of the calculation. Therefore, the fractionation values of the edge portions were treated separately for the equation determination. Detailed δ18Oseawater and δ13CDIC values can be found in Table S2.
The oxygen isotope fractionation between otolith and rearing seawater was expressed as approximately δ18Ootolith,VPDB − δ18Oseawater, VSMOW (‰), or as 103 ln α converted by
The conversion of δ18Oseawater from V-SMOW to V-PDB according to Coplen et al. (1983) was
The oxygen isotope fractionation was calculated based on the δ18Ootolith values of middle otolith portions in the 9°C group and both the middle and edge portions in the 12, 15, 18, and 20°C groups, and the mean δ18Oseawater values during the period in which the otolith portions precipitated (Figure 7). The relationship between oxygen isotope fractionation of otoliths and water temperature was fitted with the linear regression model, resulting in a slope of −0.186 ± 0.010 and an intercept of 3.219 ± 0.155 (Pearson’s r = −0.846, r2 = 0.713). Although the slope did not differ (ANCOVA, p< 0.01), the intercept was significantly different from that of the synthetic aragonite determined by Kim et al. (2007) (ANCOVA, p > 0.05). However, within the temperature scale of this study (1000/T (K) = 3.41–3.544), the difference in the reflected 103 lnα value calculated by these two equations was not more than 0.292.
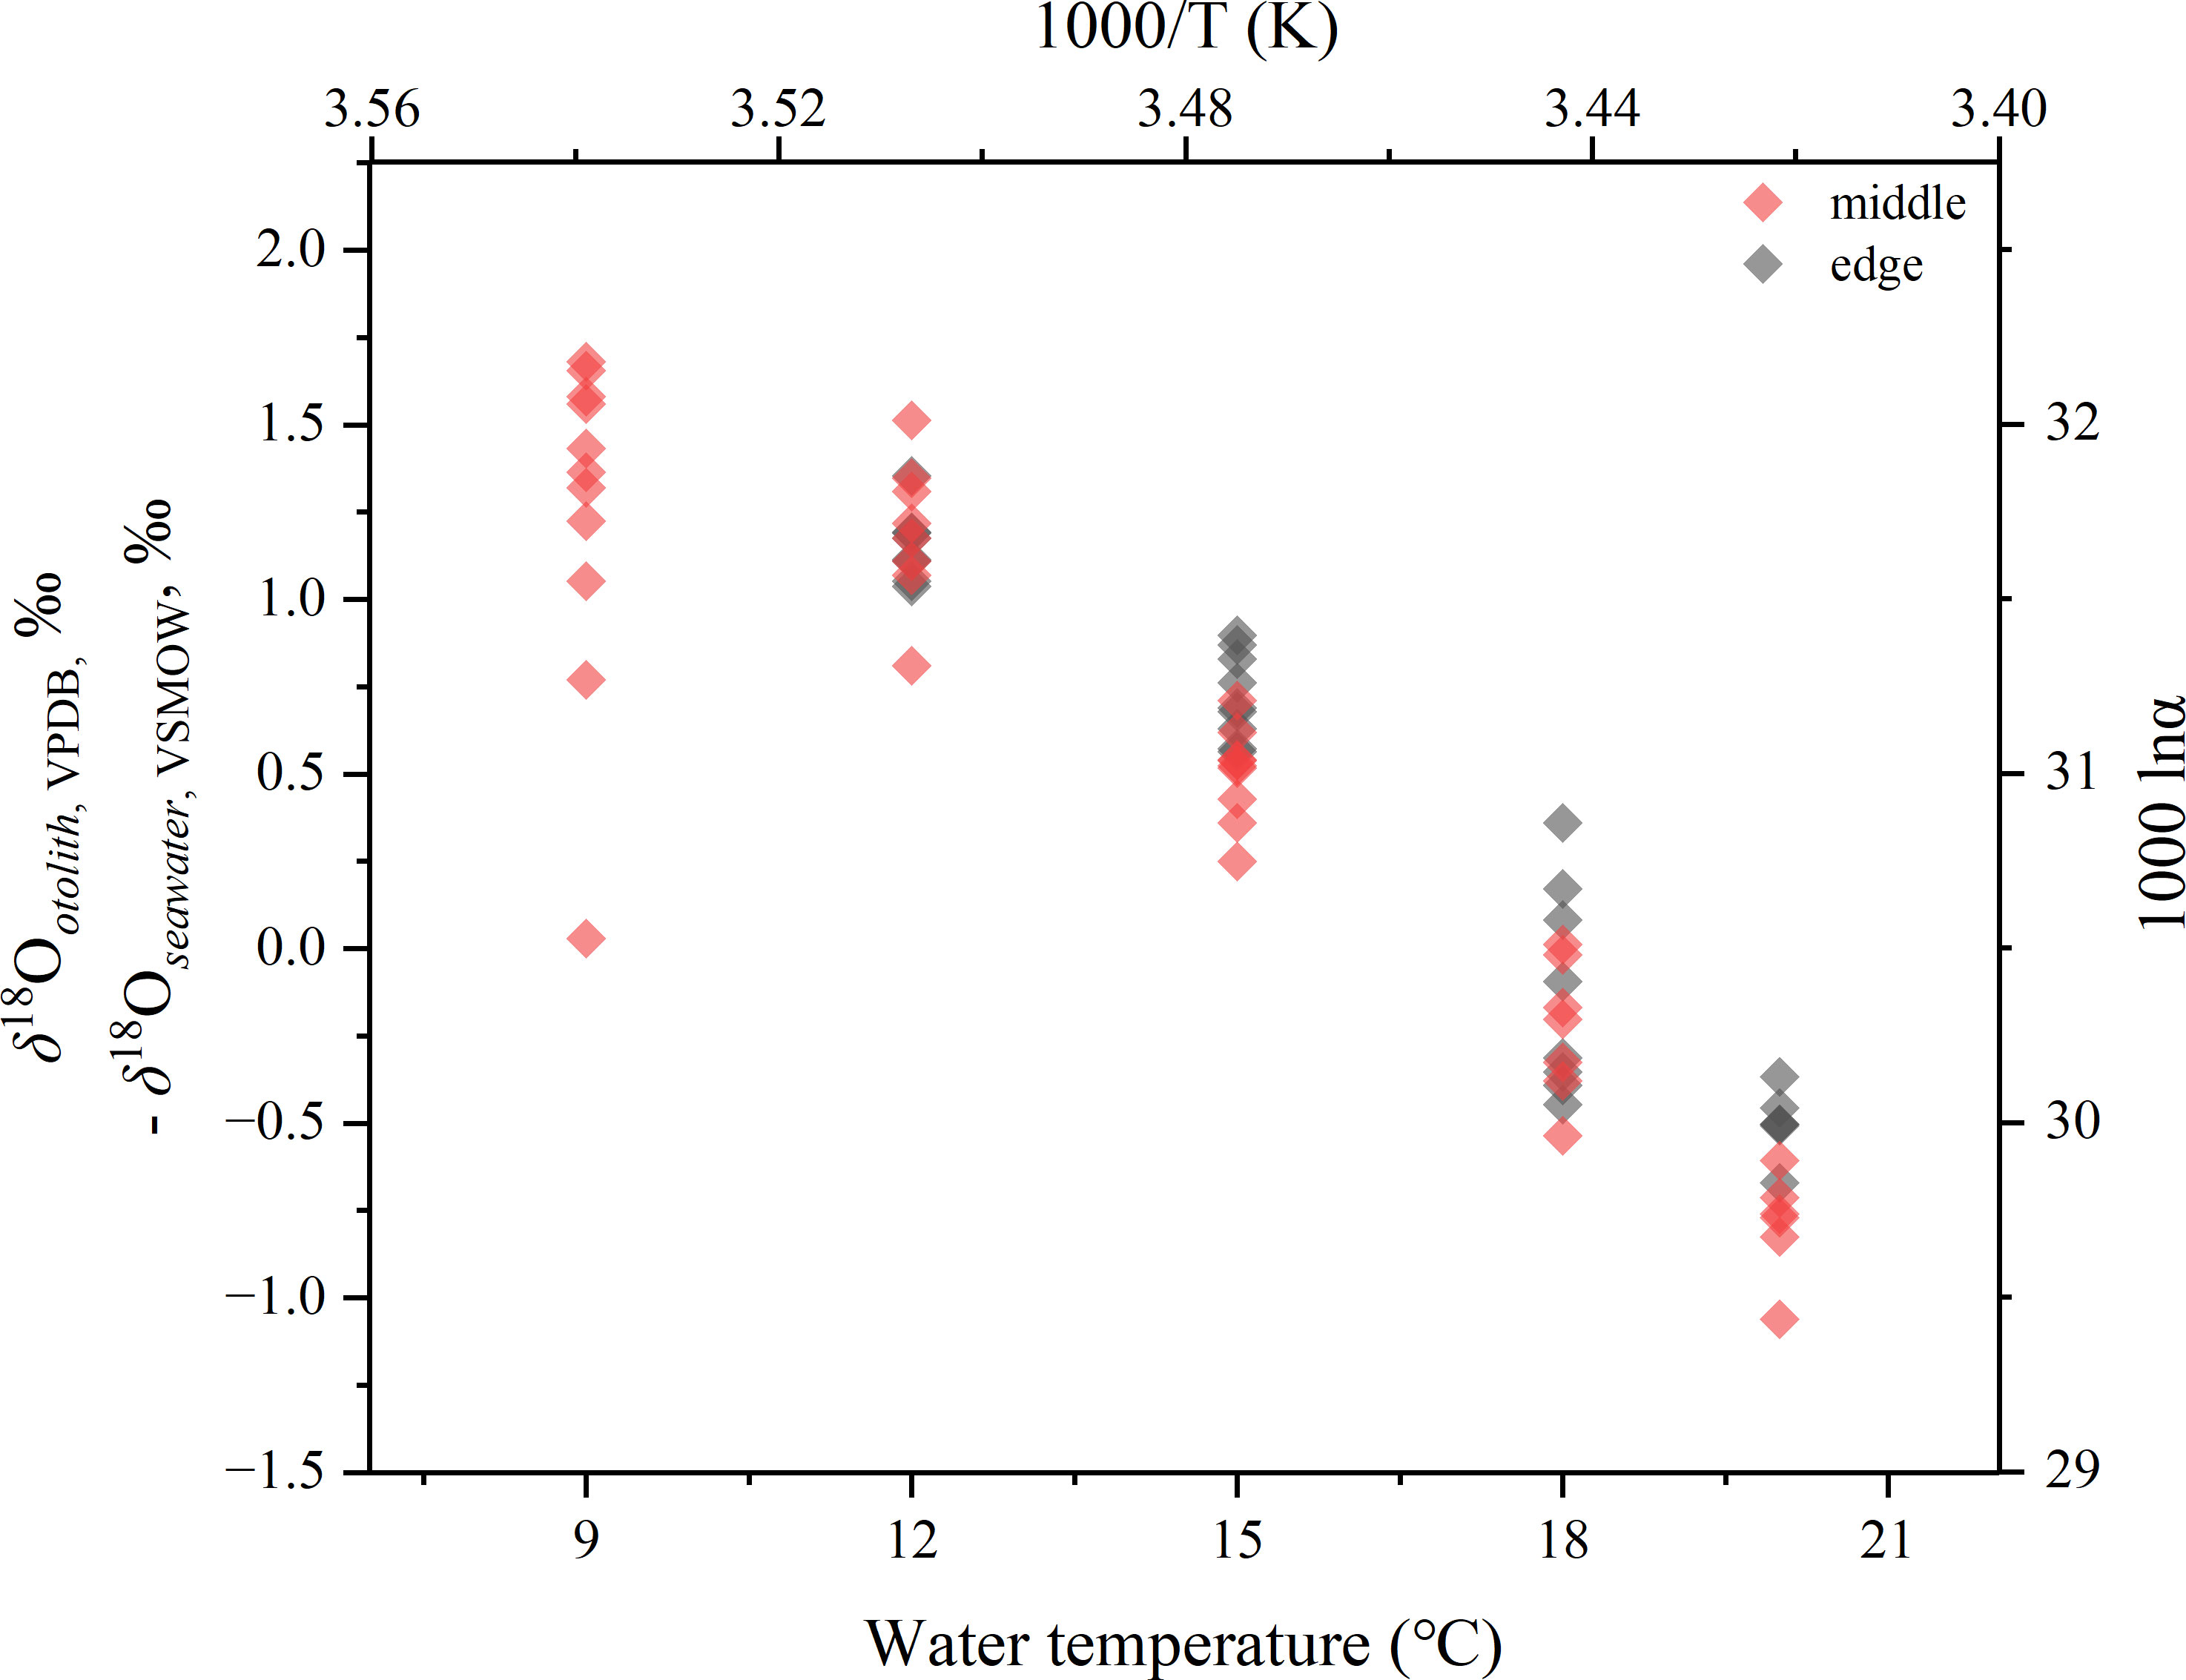
Figure 7 Plot of otolith oxygen isotope fractionation values versus water temperature. Open diamonds represent the fractionation values, expressed in both δ-T and lnα-Kelvin T scales.
Overall, the relationship between oxygen isotope fractionation and water temperature at the 9–20°C scale for the middle otoliths portion of juvenile chum salmon Oncorhynchus keta, can be described as a linear regression equation:
or expressed as a fractionation factor:
Based on the δ18Ootolith values including middle and edge otolith portions but only from the 12, 15, 18, and 20°C groups, the fractionation equation was also calculated as
or
There were no significant differences between these two equations.
To determine the involvement of kinetic and metabolic fractionation, the fractionation of oxygen and carbon calculated by middle and edge otolith portions for each group was bi-plotted, as shown in Figure 8. No correlation was found in 15, 18 and 20°C group (r2< 0.06), while weak correlation was found in 9 and 12°C group (r2 = 0.25 and 0.43). And the fractionation values variated in a wide range among the 5 groups.
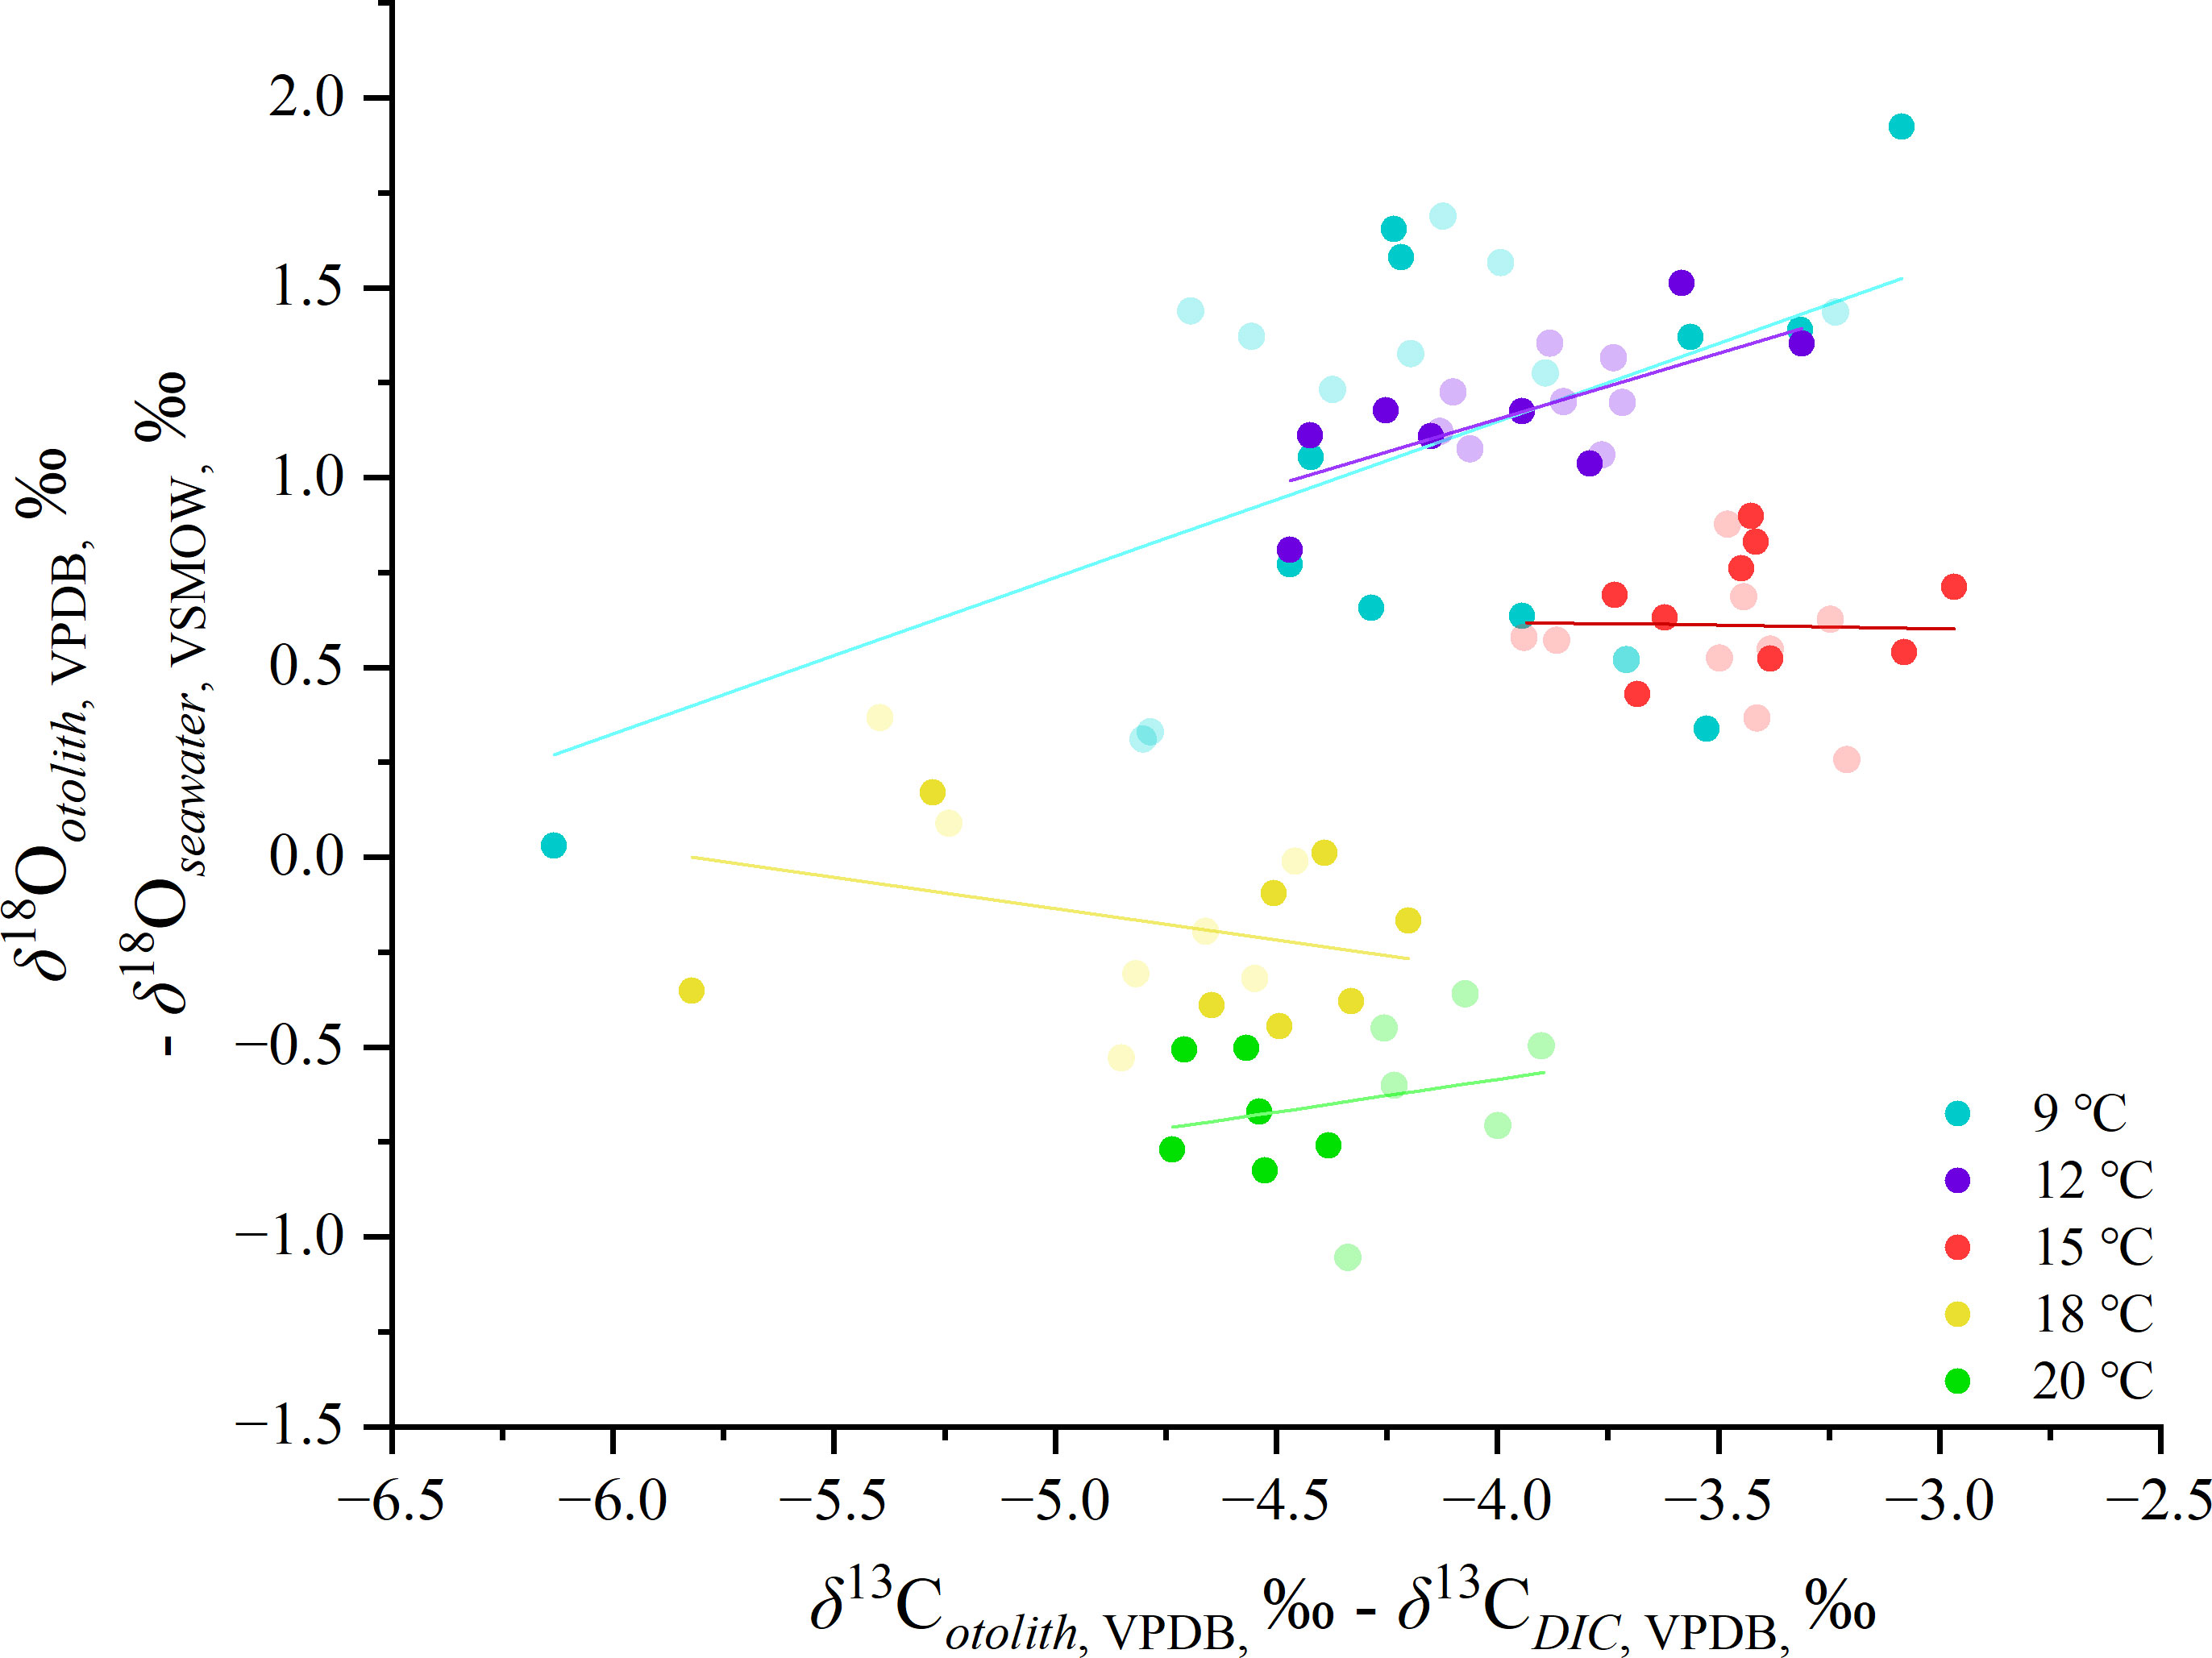
Figure 8 Plot of otolith isotope fractionation of δ18O and δ13C versus seawater and DIC of five temperature groups, respectively. Shallow spots represent the middle otolith portions.
The analytical result between the partial correlation of oxygen isotope fractionation and carbon isotopes (txy,z = –25.600) indicated that the carbon isotopes in the otoliths were not strongly controlled by temperature. However, the depleted values of δ13C in the edge otolith portions of the 9°C group showed co-variation with δ18O, indicating that the carbon isotopes could be used as indicators of the appearance of outliers.
In this study, to evaluate the accuracy of the relationship between otolith oxygen isotope fractionation and water temperature using a rearing method, three parameters potentially responsible were considered: operation error during otolith sample extraction, invasion into freshwater deposition period for inner extraction portions, and correlation with the carbon isotopes. The mix of otolith proportions deposited during the freshwater period was responsible for the depleted δ18Ootolith values in the inner otolith portions. In contrast to the period during which middle otolith portions were deposited, the δ18Oseawaterresults indicated that the edge otolith portions were deposited under a relatively unstable rearing environment; thus, the middle otolith δ18Ootolith values showed a strong correlation with temperature within a narrow δ18O range, except for the data from the 9°C group.
There were no significant differences between the temperature-dependent oxygen isotope fractionation equations calculated from the middle and edge otolith δ18Ootolith values of the 9–20°C groups (Equation 3, 4) and 12–20°C groups (Equation 5, 6). The calculated slopes were not significantly different from those of the synthetic aragonite determined by Kim et al. (2007), and there was a low deviation in the intercepts. The difference between middle and edge otolith fractionation values was not significant in the 9°C group, and the general variation range within the group (1.652‰) was below or near the index of other fish species (Godiksen et al., 2010; Kitagawa et al., 2013; Sakamoto et al., 2017). Overall, the fractionation equation for chum salmon was identified based on the δ18Ootolith values of the 9–20°C groups. The regression line of chum salmon and inorganic aragonite intersects at the temperature of 16.7°C. At temperature range of 16.7–20°C, for the same isotope fractionation value, the difference of deduced temperatures by these two equations would differ not more than 0.5°C. Similarly, at temperature range of 9–16.7°C, the deduced temperatures differs within 1°C. The calculated slope was lower than that of Atlantic cod Gadus morhua (18.70 and 16.75, Radtke et al., 1996; Høie et al., 2004b) and Atlantic croaker Micropogonias undulatus (18.56, Thorrold et al., 1997), and considerably lower than that of bluefin tuna Thunnus orientalis (24.28, Kitagawa et al., 2013) (Figure 9). The difference in slopes between the other salmonoids species Arctic char Salvelinus alpinus (20.43, Godiksen et al., 2010) indicated the importance to determine the otolith oxygen isotope fractionation equation species-specifically.
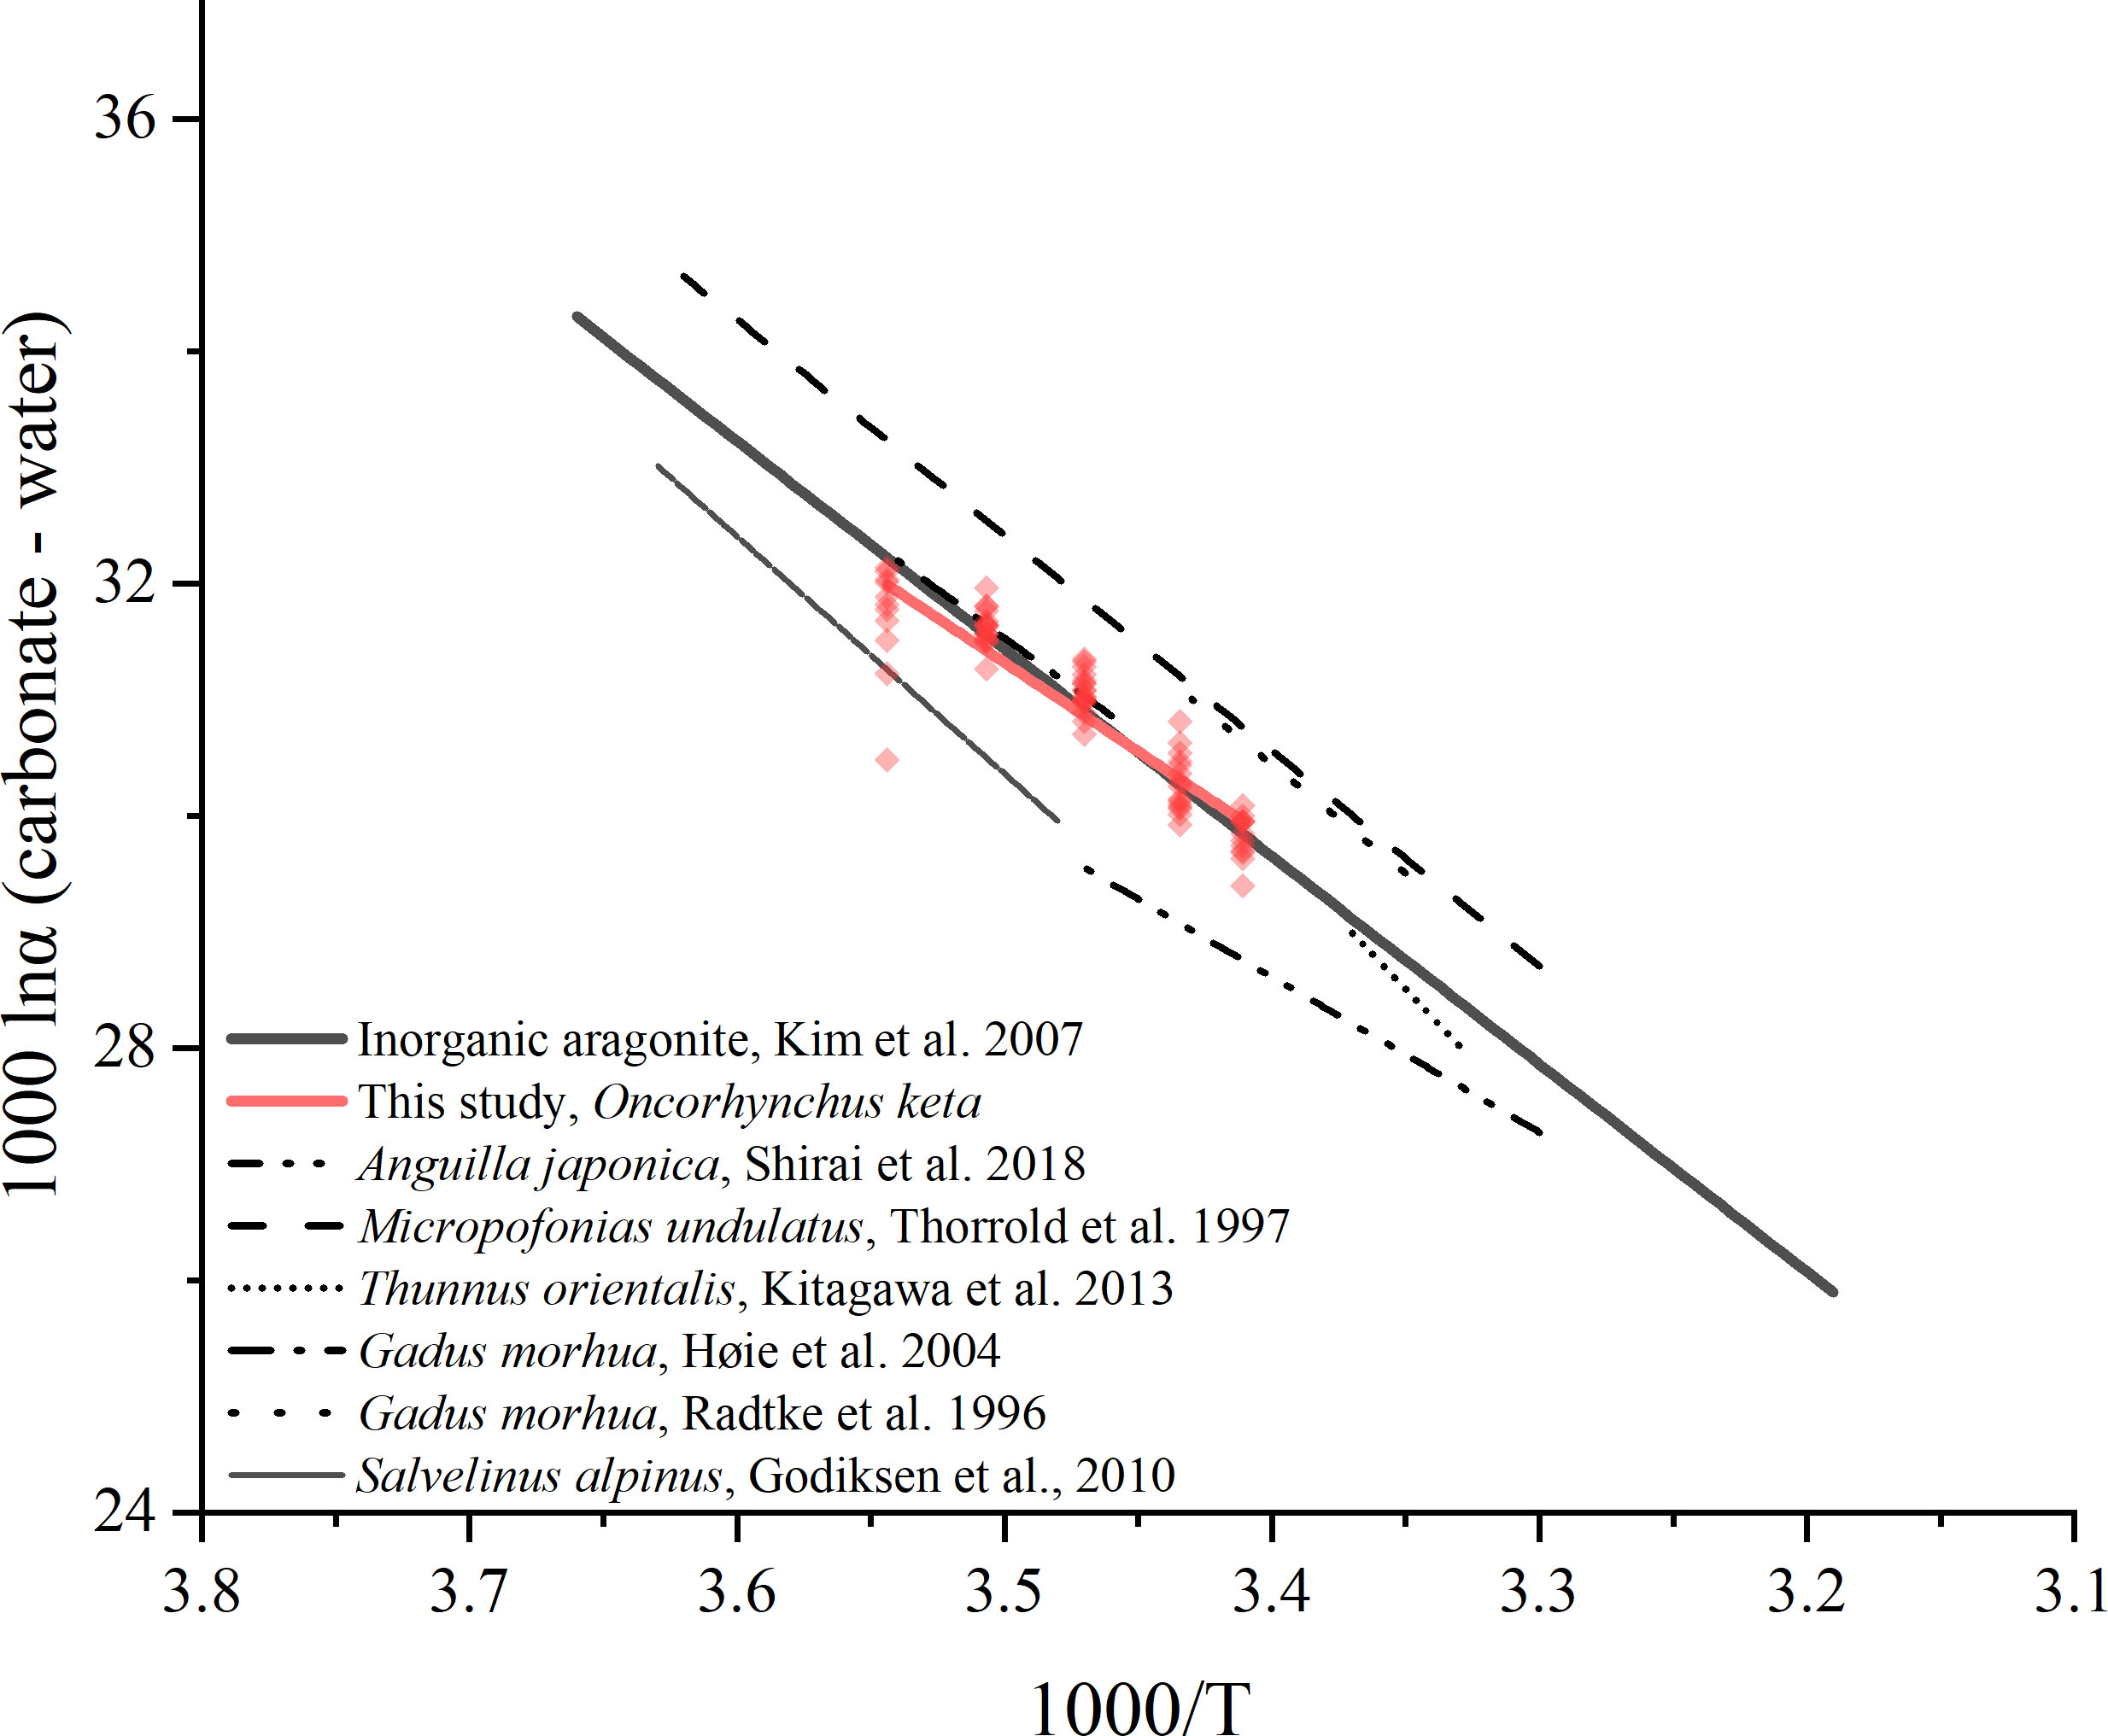
Figure 9 Comparison of temperature-dependent oxygen stable isotope fractionation equation calculated in this study with the published equations for several fish otoliths and inorganic aragonite. The length of each regression line represents the range of applicable temperature.
For δ18Oseawater in the 9 and 12°C groups in this study, the values were significantly lower than the other three groups, which is considered to be attributed to the effect of condensation. Although 10% of the volume of the rearing seawater was exchanged every day, set seawater temperatures that were considerably lower than the set room temperature (23°C), were susceptible to condensation (the 9 and 12°C groups). In addition, the bigger tanks (150L) with larger water surface had a higher risk of exposure to condensation, facilitating the mix of condensation from the room atmosphere with low δ18O values. And cooler temperature of 9°C was considered to be influenced by heavier condensation than 12°C group. Therefore, otolith isotopic composition is susceptible to produce lower and unstable values resulting in an underestimation of the isotopic fractionation for these two groups. However, though the potential fluctuation of δ18Oseawater could be determined (Figure 3), the depletion of δ18Ootolith values for edge otolith portions in 9°C group (Figure 5) may be contributed by the occasional condensation with lower δ18Oseawater values, which was not captured by weekly seawater sampling.
Extremely low isotope fractionation values in some individuals from the 9°C group were observed. Given that the condensation likely affects all individuals in the same tank, in the same manner, the variability at an individual level should be attributed to other controlling factors. The microscopic observation indicated that there were no irregular morphological characteristics, for example, the prevalence of vaterite on the otolith, discolorations, or wrinkled structures (Figure S2). It should be noted that a weak correlation between the oxygen and carbon fractionation was observed for the 9°C group (see Figure 8), with a wide fluctuation of the oxygen isotopes. In biogenetic carbonates, isotopic disequilibrium is mainly attributed to metabolic and kinetic isotope effects (McConnaughey, 1989a; Cohen and McConnaughey, 2003; Daëron et al., 2019; Prada et al., 2019; Huyghe et al., 2020), and it is difficult to discriminate between them. Kinetic effects are more significant, resulting in the depletion of heavier 13C and 18O simultaneously, rather than the incorporation of metabolic CO2 alone. The lower δ18O data in the 9°C group was largely associated with lower δ13C values, of which pattern is similar to the typical fractionation pattern of kinetic isotope fractionation (Kalish, 1991b; McConnaughey, 1989b), namely a positive correlation between δ18O and δ13C (Figure S3). Regardless of the fractionation mechanism, the simultaneous depletion remained in both oxygen and carbon isotope fractionation in lower temperature settings indicated that incorporating carbon and oxygen compounds originated from other alternative sources that were isotopically different from seawater, e.g. metabolically derived carbon (Kalish, 1991a; Chung et al., 2019). Unfortunately, the data obtained in this study was not enough to identify the ultimate mechanism of isotopic heterogeneity between individuals from the same tank.
It is reported that when ambient water was colder than preferred temperatures, endothermic fish species may conserve heat by thermal inertia to maintain their body and brain temperatures above the ambient temperature (Carey et al., 1984), e.g. Pacific bluefin tuna (Kitagawa et al., 2001; Kitagawa et al., 2006; Kitagawa et al., 2022). Then, the δ18Ootolith may therefore reflect the temperature of brain rather than the ambient water (Radtke et al., 1996). Whereas chum salmon is an ectothermic fish species, of which the somatic temperatures vary with ambient temperatures, and the thermoregulation for wild individuals depends on behavioral locomotion but physiological processes (Tanaka et al., 2000; Azumaya and Ishida, 2005). Furthermore, 9 and 12°C treatments in this study were located within the preferred temperature scale of chum salmon (7–14.8°C, Hicks, 2000; Nagata et al., 2007). Hence, the δ18Ootolith values of chum salmon reflect temperatures of ambient water, and physiological thermoregulation processes were not susceptible for depleting the δ18Ootolith in the cold water treatments in this study. To discriminate the relevant mechanisms, further studies under chemical scopes are needed, as for physiological scopes, the preferred temperatures are expected to be context-dependent (Clark et al., 2013; Norin et al., 2014).
Irrespective of the vital effects might be evolved, by discriminating the factors in spite of temperature that affect the isotope precipitation on otolith, the determined equation in this study was applicable for thermal history reconstruction on chum salmon.
The temperature dependency of otolith oxygen isotope fractionation in chum salmon was assessed based on a temperature gradient rearing experiment. The isotopic analysis results of the three equivalent otolith samples and rearing seawater suggested that the inner otolith portions were mixed with proportions deposited during the freshwater life stages; the edge otolith portions were deposited from an isotopically unstable environment and middle otolith portions were deposited from relatively stable seawater, thus providing more convincing data. The δ18Ootolith values of middle otolith portions showed a strong correlation with temperature within a narrow value scale, except that the δ18Ootolith values from 9°C group were distributed over a wide range. The otolith oxygen isotope fractionation equations based on the 9–20°C and 12–20°C groups were not statistically different from each other, and there was no significant difference with synthetic inorganic aragonite determined by Kim et al. (2007). The correlation between the oxygen and carbon isotope fractionation and the widely distributed δ18Ootolith values in the 9°C group were speculated to be the effect of humid condensation (lower δ18Oseawatervalues) or the kinetic isotope effect (lower δ18Ootolith values) alone or combined. The δ18Ootolith values in the 9°C group had a relatively wide range compared with the other four groups, but the variation range was near or below the indexes in the studies on other species. Therefore, it was concluded that the chum salmon otoliths in this study were deposited under an isotopic quasi-equilibrium and the chum salmon species-specific otolith oxygen isotope fractionation equation could be used on reconstruction of temperature history.
The original contributions presented in the study are included in the article/Supplementary Material. Further inquiries can be directed to the corresponding author.
The animal study was reviewed and approved by the Animal Ethics Committee of the University of Tokyo, Japan.
Conceptualization: KS and TK. Rearing experiment: YG, YI, TN, and YS. Sample analysis: TH and KS. Writing (original draft): YG. All the authors read article critically and gave approval for publication.
This work was supported by the Research Fund KAKENHI Grants from the Japan Society for the Promotion of Science (JSPS), Grant Number JP22H05026, JP22H05028 (KS), 20H00428, 22H05027 (TK), and JST SPRING JAPAN, Grant Number JPMJSP2018 (YG).
We owe thanks to the Iwate Fisheries Technology Center for providing the juvenile chum salmon and feed pellets. Special thanks to Noriko Izumoto (Atmosphere and Ocean Research Institute, The University of Tokyo) for her support with the IRMS measurements and initial statistical analysis.
The authors declare that the research was conducted in the absence of any commercial or financial relationships that could be construed as a potential conflict of interest.
All claims expressed in this article are solely those of the authors and do not necessarily represent those of their affiliated organizations, or those of the publisher, the editors and the reviewers. Any product that may be evaluated in this article, or claim that may be made by its manufacturer, is not guaranteed or endorsed by the publisher.
The Supplementary Material for this article can be found online at: https://www.frontiersin.org/articles/10.3389/fmars.2022.1072068/full#supplementary-material
Abdul-Aziz O. I., Mantua N. J., Myers K. W. (2011). Potential climate change impacts on thermal habitats of pacific salmon (Oncorhynchus spp.) in the north pacific ocean and adjacent seas. Can. J. Fisheries Aquat. Sci. 68 (9), 1660–1680. doi: 10.1139/F2011-079
Azumaya T., Ishida Y. (2005). Mechanism of body cavity temperature regulation of chum salmon (Oncorhynchus keta) during homing migration in the north pacific ocean. Fisheries Oceanogr. 14 (2), 81–96. doi: 10.1111/j.1365-2419.2004.00323.x
Beamish R. J. (2017). What the past tells us about the future of pacific salmon research. Fish Fisheries 18 (6), 1161–1175. doi: 10.1111/faf.12231
Beamish R. J., Mahnken C. (2001). A critical size and period hypothesis to explain natural regulation of salmon abundance and the linkage to climate and climate change. Prog. Oceanogr. 49 (1-4), 423–437. doi: 10.1016/S0079-6611(01)00034-9
Breitenbach S. F., Bernasconi S. M. (2011). Carbon and oxygen isotope analysis of small carbonate samples (20 to 100 µg) with a GasBench II preparation device. Rapid Commun. Mass Spectrometry 25 (13), 1910–1914. doi: 10.1002/rcm.5052
Campana S. E. (1999). Chemistry and composition of fish otoliths: pathways, mechanisms and applications. Mar. Ecol. Prog. Ser. 188, 263–297. doi: 10.3354/meps188263
Campana S. E., Thorrold S. R. (2001). Otoliths, increments, and elements: keys to a comprehensive understanding of fish populations? Can. J. Fisheries Aquat. Sci. 58 (1), 30–38. doi: 10.1139/f00-177
Carey F. G., Kanwisher J. W., Stevens E. D. (1984). Bluefin tuna warm their viscera during digestion. J. Exp. Biol. 109 (1), 1–20. doi: 10.1242/jeb.109.1.1
Chung M. T., Trueman C. N., Godiksen J. A., Holmstrup M. E., Grønkjær P. (2019). Field metabolic rates of teleost fishes are recorded in otolith carbonate. Commun. Biol. 2 (1), 1–10. doi: 10.1038/s42003-018-0266-5
Clark T. D., Sandblom E., Jutfelt F. (2013). Aerobic scope measurements of fishes in an era of climate change: respirometry, relevance and recommendations. J. Exp. Biol. 216 (15), 2771–2782. doi: 10.1242/jeb.084251
Cohen A. L., McConnaughey T. A. (2003). Geochemical perspectives on coral mineralization. Rev. mineral. geochem. 54 (1), 151–187. doi: 10.2113/0540151
Connors B., Malick M. J., Ruggerone G. T., Rand P., Adkison M., Irvine J. R., et al. (2020). Climate and competition influence sockeye salmon population dynamics across the northeast pacific ocean. Can. J. Fisheries Aquat. Sci. 77 (6), 943–949. doi: 10.1139/cjfas-2019-0422
Coplen T. B., Kendall C., Hopple J. (1983). Comparison of stable isotope reference samples. Nature 302 (5905), 236–238. doi: 10.1038/302236a0
Daëron M., Drysdale R. N., Peral M., Huyghe D., Blamart D., Coplen T. B., et al. (2019). Most earth-surface calcites precipitate out of isotopic equilibrium. Nat. Commun. 10 (1), 1–7. doi: 10.1038/s41467-019-08336-5
Darnaude A. M., Sturrock A., Trueman C. N., Mouillot D., Campana S. E., Hunter E. (2014). Listening in on the past: what can otolith δ18O values really tell us about the environmental history of fishes? PloS One 9 (10), e108539. doi: 10.1371/journal.pone.0108539
Epstein S., Buchsbaum R., Lowenstam H., Urey H. C. (1951). Carbonate-water isotopic temperature scale. Geol. Soc. America Bull. 62 (4), 417–426. doi: 10.1130/0016-7606(1951)62[417:CITS]2.0.CO;2
Fukuwaka M., Suzuki T. (2002). Early sea mortality of mark-recaptured juvenile chum salmon in open coastal waters. J. Fish Biol. 60 (1), 3–12. doi: 10.1111/j.1095-8649.2002.tb02384.x
Godiksen J. A., Svenning M. A., Dempson J. B., Marttila M., Storm-Suke A., Power M. (2010). Development of a species-specific fractionation equation for Arctic charr (Salvelinus alpinus (L.)): an experimental approach. Hydrobiologia 650 (1), 67–77. doi: 10.1007/s10750-009-0056-7
Grønkjær P. (2016). Otoliths as individual indicators: a reappraisal of the link between fish physiology and otolith characteristics. Mar. Freshw. Res. 67 (7), 881–888. doi: 10.1071/MF15155
Høie H., Andersson C., Folkvord A., Karlsen Ø. (2004a). Precision and accuracy of stable isotope signals in otoliths of pen-reared cod (Gadus morhua) when sampled with a high-resolution micromill. Mar. Biol. 144 (6), 1039–1049. doi: 10.1007/s00227-003-1275-5
Høie H., Otterlei E., Folkvord A. (2004b). Temperature-dependent fractionation of stable oxygen isotopes in otoliths of juvenile cod (Gadus morhua l.). ICES J. Mar. Sci. 61 (2), 243–251. doi: 10.1016/j.icesjms.2003.11.006
Hane Y., Kimura S., Yokoyama Y., Miyairi Y., Ushikubo T., Ishimura T., et al. (2020). Reconstruction of temperature experienced by pacific bluefin tuna Thunnus orientalis larvae using SIMS and microvolume CF-IRMS otolith oxygen isotope analyses. Mar. Ecol. Prog. Ser. 649, 175–188. doi: 10.3354/meps13451
Healey M. (2011). The cumulative impacts of climate change on Fraser river sockeye salmon (Oncorhynchus nerka) and implications for management. Can. J. Fisheries Aquat. Sci. 68 (4), 718–737. doi: 10.1139/F2011-010
Hicks M. (2000). “Evaluating standards for protecting aquatic life in washington’s surface water quality standards,” in Draft discussion paper and literature summary. revised 2002, vol. 1. (Olympia, WA: Washington State Department of Ecology), 97. Available at: https://apps.ecology.wa.gov/publications/documents/0010070.pdf.
Huyghe D., Emmanuel L., de Rafélis M., Renard M., Ropert M., Labourdette N., et al. (2020). Oxygen isotope disequilibrium in the juvenile portion of oyster shells biases seawater temperature reconstructions. Estuarine Coast. Shelf Sci. 240, 106777. doi: 10.1016/j.ecss.2020.106777
Iino Y., Kitagawa T., Abe T. K., Nagasaka T., Shimizu Y., Ota K., et al. (2022). Effect of food amount and temperature on growth rate and aerobic scope of juvenile chum salmon. Fisheries Sci. 88 (3), 397–409. doi: 10.1007/s12562-022-01599-w
Irie T. (1990). Ecological studies on the migration of juvenile chum salmon, Oncorhynchus keta, during early ocean life. Bull. Seikai Natl. Fish. Res. Inst. 68, 1–142.
Irvine J. R., Fukuwaka M. A. (2011). Pacific salmon abundance trends and climate change. ICES J. Mar. Sci. 68 (6), 1122–1130. doi: 10.1093/icesjms/fsq199
Irvine J. R., Macdonald R. W., Brown R. J., Godbout L., Reist J. D., Carmack E. C. (2009). Salmon in the Arctic and how they avoid lethal low temperatures. N. Pac. Anadr. Fish Commun. Bull. 5, 39–50. doi: 10.1002/mcf2.10023
Iwata M. (1995). Downstream migratory behavior of salmonids and its relationship with cortisol and thyroid hormones: a review. Aquaculture 135 (1-3), 131–139. doi: 10.1016/0044-8486(95)01000-9
Johnson O. W., Grant W. S., Kope R. G., Neely K. G., Waknitz F. W., Waples R. S. (1997) Status review of chum salmon from Washington, Oregon, and California. Available at: https://repository.library.noaa.gov/view/noaa/3029.
Jones J. B., Campana S. E. (2009). ). stable oxygen isotope reconstruction of ambient temperature during the collapse of a cod (Gadus morhua) fishery. Ecol. Appl. 19 (6), 1500–1514. doi: 10.1890/07-2002.1
Kalish J. M. (1991a). 13C and 18O isotopic disequilibria in fish otoliths: metabolic and kinetic effects. Mar. Ecol. Prog. Ser. 75 (2-3), 191–203. doi: 10.3354/meps075191
Kalish J. M. (1991b). Oxygen and carbon stable isotopes in the otoliths of wild and laboratory-reared Australian salmon (Arripis trutta). Mar. Biol. 110 (1), 37–47. doi: 10.1007/BF01313090
Kasugai K., Torao M., Nagata M., Irvine J. R. (2013). The relationship between migration speed and release date for chum salmon Oncorhynchus keta fry exiting a 110-km northern Japanese river. Fisheries Sci. 79 (4), 569–577. doi: 10.1007/s12562-013-0615-8
Kim S. T., O'Neil J. R. (1997). Equilibrium and nonequilibrium oxygen isotope effects in synthetic carbonates. Geochim. cosmochim. Acta 61 (16), 3461–3475. doi: 10.1016/S0016-7037(97)00169-5
Kim S. T., O’Neil J. R., Hillaire-Marcel C., Mucci A. (2007). Oxygen isotope fractionation between synthetic aragonite and water: Influence of temperature and Mg2+ concentration. Geochim. Cosmochim. Acta 71 (19), 4704–4715. doi: 10.1016/j.gca.2007.04.019
Kitagawa T., Abe T. K., Kubo K., Fujioka K., Fukuda H., Tanaka Y. (2022). Rapid endothermal development of juvenile pacific bluefin tuna. Front. Physiol. 13, 968468. doi: 10.3389/fphys.2022.968468
Kitagawa T., Ishimura T., Uozato R., Shirai K., Amano Y., Shinoda A., et al. (2013). Otolith δ18O of pacific bluefin tuna Thunnus orientalis as an indicator of ambient water temperature. Mar. Ecol. Prog. Ser. 481, 199–209. doi: 10.3354/meps10202
Kitagawa T., Kimura S., Nakata H., Yamada H. (2004). Diving behavior of immature, feeding pacific bluefin tuna (Thunnus thynnus orientalis) in relation to season and area: the East China Sea and the kuroshio–oyashio transition region. Fisheries Oceanogr. 13 (3), 161–180. doi: 10.1111/j.1365-2419.2004.00282.x
Kitagawa T., Kimura S., Nakata H., Yamada H. (2006). Thermal adaptation of pacific bluefin tuna Thunnus orientalis to temperate waters. Fisheries Sci. 72 (1), 149–156. doi: 10.1111/j.1444-2906.2006.01129.x
Kitagawa T., Kimura S., Nakata H., Yamada H., Nitta A., Sasai Y., et al. (2009). Immature pacific bluefin tuna, Thunnus orientalis, utilizes cold waters in the subarctic frontal zone for trans-pacific migration. Environ. Biol. fishes 84 (2), 193–196. doi: 10.1007/s10641-008-9409-8
Kitagawa T., Nakata H., Kimura S., Itoh T., Tsuji S., Nitta A. (2000). Effect of ambient temperature on the vertical distribution and movement of pacific bluefin tuna Thunnus thynnus orientalis. Mar. Ecol. Prog. Ser. 206, 251–260. doi: 10.3354/meps206251
Kitagawa T., Nakata H., Kimura S., Tsuji S. (2001). Thermoconservation mechanisms inferred from peritoneal cavity temperature in free-swimming pacific bluefin tuna Thunnus thynnus orientalis. Mar. Ecol. Prog. Ser. 220, 253–263. doi: 10.3354/meps220253
LeGrande A. N., Schmidt G. A. (2006). Global gridded data set of the oxygen isotopic composition in seawater. Geophys. Res. Lett. 33 (12). doi: 10.1029/2006GL026011
McConnaughey T. (1989a). 13C and 18O isotopic disequilibrium in biological carbonates: I. patterns. Geochim. Cosmochim. Acta 53 (1), 151–162. doi: 10.1016/0016-7037(89)90282-2
McConnaughey T. (1989b). 13C and 18O isotopic disequilibrium in biological carbonates: II. In vitro simulation of kinetic isotope effects. Geochim. Cosmochim. Acta 53 (1), 163–171. doi: 10.1016/0016-7037(89)90283-4
Nagata M., Miyakoshi Y., Ando D., Fujiwara M., Sawada M., Shimada H., et al. (2007). Influence of coastal seawater temperature on the distribution and growth of juvenile chum salmon, with recommendations for altered release strategies. N. Pac. Anadr. Fish Commun. Bull. 4, 223–235.
Nobata S., Kitagawa T., Tanaka K., Komatsu K., Aoki Y., Sato K., et al. (2019). Spreading of river water guides migratory behavior of homing chum salmon Oncorhynchus keta in otsuchi bay, a narrow inlet with multiple river flows. Zool. Sci. 36 (6), 449–457. doi: 10.2108/zs190026
Norin T., Malte H., Clark T. D. (2014). Aerobic scope does not predict the performance of a tropical eurythermal fish at elevated temperatures. J. Exp. Biol. 217 (2), 244–251. doi: 10.1242/jeb.089755
Oppo D. W., Schmidt G. A., LeGrande A. N. (2007). Seawater isotope constraints on tropical hydrology during the Holocene. Geophys. Res. Lett. 34 (13). doi: 10.1029/2007GL030017
Patterson W. P. (1999). Oldest isotopically characterized fish otoliths provide insight to Jurassic continental climate of Europe. Geology 27 (3), 199–202. doi: 10.1130/0091-7613(1999)027<0199:OICFOP>2.3.CO;2
Patterson W. P., Smith G. R., Lohmann K. C. (1993). Continental paleothermometry and seasonality using the isotopic composition of aragonitic otoliths of freshwater fishes. Washington DC Am. Geophys. Union Geophys. Monograph Ser. 78, 191–202. doi: 10.1029/GM078p0191
Perry R. I., Hargreaves N. B., Waddell B. J., Mackas D. L. (1996). Spatial variations in feeding and condition of juvenile pink and chum salmon off Vancouver island, British Columbia. Fisheries Oceanogr. 5 (2), 73–88. doi: 10.1111/j.1365-2419.1996.tb00107.x
Prada F., Yam R., Levy O., Caroselli E., Falini G., Dubinsky Z., et al. (2019). Kinetic and metabolic isotope effects in zooxanthellate and non-zooxanthellate Mediterranean corals along a wide latitudinal gradient. Front. Mar. Sci. 6. doi: 10.3389/fmars.2019.00522
Radtke R. L., Lenz P., Showers W., Moksness E. (1996). Environmental information stored in otoliths: insights from stable isotopes. Mar. Biol. 127 (1), 161–170. doi: 10.1007/BF00993656
Ruggerone G. T., Irvine J. R. (2018). Numbers and biomass of natural-and hatchery-origin pink salmon, chum salmon, and sockeye salmon in the north pacific ocean 1925–2015. Mar. Coast. Fisheries 10 (2), 152–168. doi: 10.1002/mcf2.10023152
Ruggerone G. T., Nielsen J. L. (2004). Evidence for competitive dominance of pink salmon (Oncorhynchus gorbuscha) over other salmonids in the north pacific ocean. Rev. Fish Biol. Fisheries 14 (3), 371–390. doi: 10.1007/s11160-004-6927-0
Saito T., Kaga T., Seki J., Otake T. (2007). Otolith microstructure of chum salmon Oncorhynchus keta: formation of sea entry check and daily deposition of otolith increments in seawater conditions. Fisheries Sci. 73 (1), 27–37. doi: 10.1111/j.1444-2906.2007.01298.x
Sakamoto T., Komatsu K., Shirai K., Higuchi T., Ishimura T., Setou T., et al. (2019). Combining microvolume isotope analysis and numerical simulation to reproduce fish migration history. Methods Ecol. Evol. 10 (1), 59–69. doi: 10.1111/2041-210X.13098
Sakamoto T., Komatsu K., Yoneda M., Ishimura T., Higuchi T., Shirai K., et al. (2017). Temperature dependence of δ18O in otolith of juvenile Japanese sardine: Laboratory rearing experiment with micro-scale analysis. Fisheries Res. 194, 55–59. doi: 10.1016/j.fishres.2017.05.004
Salo E. O. (1991). “Life history of chum salmon (Oncorhynchus keta),” in Pacific salmon life histories. (Vancouver: UBC press) Groot G., Margolis L. (eds.) p. 231–310. Available at: http://jeffersonco-treis.info/PDF%20Files/3.04%20Water%20References/Healey,%20M.C.%201991%20Life%20History%20of%20Chinook%20Salmon.pdf.
Sanger D. (1962). The archaeology of EeQw: 1: a burial site near chase, British Columbia. (Vancouver: University of British Columbia Library). doi: 10.14288/1.0105730
Sanger G. A. (1972). “Fishery potentials and estimated biological productivity of the subarctic pacific region,” in Biological oceanography of the northern pacific ocean. (Tokyo: Idemitsu Shoten: A.Y. Takenouti (ed)) 561–574. Available at: https://cir.nii.ac.jp/crid/1570291225693426432.
Schoen E. R., Wipfli M. S., Trammell E. J., Rinella D. J., Floyd A. L., Grunblatt J., et al. (2017). Future of pacific salmon in the face of environmental change: Lessons from one of the world's remaining productive salmon regions. Fisheries 42 (10), 538–553. doi: 10.1080/03632415.2017.1374251
Seki J. (1978). An ecological study on the chum salmon juveniles in kesennuma–i. prey animals and growth of juvenile chum salmon in the estuarine waters. Sci. Rep. Kesennuma Fisheries Exp. Station 4, 10–18.
Shirai K., Koyama F., Murakami-Sugihara N., Nanjo K., Higuchi T., Kohno H., et al. (2018a). Reconstruction of the salinity history associated with movements of mangrove fishes using otolith oxygen isotopic analysis. Mar. Ecol. Prog. Ser. 593, 127–139. doi: 10.3354/meps12514
Shirai K., Otake T., Amano Y., Kuroki M., Ushikubo T., Kita N. T., et al. (2018b). Temperature and depth distribution of Japanese eel eggs estimated using otolith oxygen stable isotopes. Geochim. Cosmochim. Acta 236, 373–383. doi: 10.1016/j.gca.2018.03.006
Shubin A. O., Akinicheva E. G. (2016). Origin of juvenile chum salmon Oncorhynchus keta (Salmonidae) in the Sea of Okhotsk coastal waters off south Sakhalin. J. ichthyol. 56 (5), 728–737. doi: 10.1134/S0032945216050131
Solomon C. T., Weber P. K., Ingram B. L., Conrad M. E., Machavaram M. V., Franklin R. L., et al. (2006). Experimental determination of the sources of otolith carbon and associated isotopic fractionation. Can. J. Fisheries Aquat. Sci. 63 (1), 79–89. doi: 10.1139/f05-20
Tanaka H., Takagi Y., Naito Y. (2000). Behavioural thermoregulation of chum salmon during homing migration in coastal waters. J. Exp. Biol. 203 (12), 1825–1833. doi: 10.1242/jeb.203.12.1825
Tanner S. E., Reis-Santos P., Vasconcelos R. P., Fonseca V. F., França S., Cabral H. N., et al. (2013). Does otolith geochemistry record ambient environmental conditions in a temperate tidal estuary? J. Exp. Mar. Biol. Ecol. 441, 7–15. doi: 10.1016/j.jembe.2013.01.009
Thorrold S. R., Campana S. E., Jones C. M., Swart P. K. (1997). Factors determining δ13C and δ18O fractionation in aragonitic otoliths of marine fish. Geochim. Cosmochim. Acta 61 (14), 2909–2919. doi: 10.1016/S0016-7037(97)00141-5
Urawa S., Beacham T. D., Fukuwaka M. A., Kaeriyama M. (2018). “Ocean ecology of chum salmon,” in The ocean ecology of pacific salmon and trout (Bethesda: American Fisheries Society), 161–318. Available at: https://www.researchgate.net/publication/326381529.
Urawa S., Seki J., Kawana M., Saito T., Crane P. A., Seeb L., et al. (2004). Juvenile chum salmon in the Okhotsk Sea: their origins estimated by genetic and otolith marks. N. Pac. Anadr. Fish Commun. Tech. Rep. 5, 87–88.
Urey H. C. (1947). The thermodynamic properties of isotopic substances. J. Chem. Soc. (Resumed), 562–581. doi: 10.1039/JR9470000562
von Leesen G., Bardarson H., Halldorsson S. A., Whitehouse M. J., Campana S. E. (2021). Accuracy of otolith oxygen isotope records analyzed by SIMS as an index of temperature exposure of wild icelandic cod (Gadus morhua). Front. Mar. Sci. 8, 698908. doi: 10.3389/fmars.2021.698908
Wakefield C. B., Boddington D. K., Newman S. J. (2016). Rapid lateral extraction of otoliths that maintains the integrity of fish product to improve access to catches and reduce potential sampling biases. Open Fish Sci. J. 9 (1), 26–28. doi: 10.2174/1874401X01609010026
Walther B. D., Thorrold S. R. (2009). Inter-annual variability in isotope and elemental ratios recorded in otoliths of an anadromous fish. J. Geochem. Explor. 102 (3), 181–186. doi: 10.1016/j.gexplo.2008.10.001
West C. F., Wischniowski S., Johnston C. (2012). Pacific cod (Gadus macrocephalus) as a paleothermometer: otolith oxygen isotope reconstruction. J. Archaeol. Sci. 39 (10), 3277–3283. doi: 10.1016/j.jas.2012.05.009
Willmes M., Lewis L. S., Davis B. E., Loiselle L., James H. F., Denny C., et al. (2019). Calibrating temperature reconstructions from fish otolith oxygen isotope analysis for california's critically endangered delta smelt. Rapid Commun. Mass Spectrometry 33 (14), 1207–1220. doi: 10.1002/rcm.8464
Zhao L., Zuykov M., Tanaka K., Shirai K., Anderson J., McKindsey C. W., et al. (2019). New insight into light-enhanced calcification in mytilid mussels, mytilus sp., infected with photosynthetic algae coccomyxa sp.: δ13C value and metabolic carbon record in shells. J. Exp. Mar. Biol. Ecol. 520, 151211. doi: 10.1016/j.jembe.2019.151211
Keywords: chum salmon, otolith, stable oxygen isotope, oxygen isotope fractionation, temperature-dependence
Citation: Gou Y, Higuchi T, Iino Y, Nagasaka T, Shimizu Y, Shirai K and Kitagawa T (2022) Determination of temperature-dependent otolith oxygen stable isotope fractionation on chum salmon Oncorhynchus keta based on rearing experiment. Front. Mar. Sci. 9:1072068. doi: 10.3389/fmars.2022.1072068
Received: 17 October 2022; Accepted: 05 December 2022;
Published: 22 December 2022.
Edited by:
Pedro Morais, Florida International University, United StatesReviewed by:
Patricia Lastra Luque, Technological Center Expert in Marine and Food Innovation (AZTI), SpainCopyright © 2022 Gou, Higuchi, Iino, Nagasaka, Shimizu, Shirai and Kitagawa. This is an open-access article distributed under the terms of the Creative Commons Attribution License (CC BY). The use, distribution or reproduction in other forums is permitted, provided the original author(s) and the copyright owner(s) are credited and that the original publication in this journal is cited, in accordance with accepted academic practice. No use, distribution or reproduction is permitted which does not comply with these terms.
*Correspondence: Yuxiao Gou, Z291eXV4aWFvQGFvcmkudS10b2t5by5hYy5qcA==
Disclaimer: All claims expressed in this article are solely those of the authors and do not necessarily represent those of their affiliated organizations, or those of the publisher, the editors and the reviewers. Any product that may be evaluated in this article or claim that may be made by its manufacturer is not guaranteed or endorsed by the publisher.
Research integrity at Frontiers
Learn more about the work of our research integrity team to safeguard the quality of each article we publish.