 Nora Hanson
 James Ounsley
 Stuart J. Middlemas1
94% of researchers rate our articles as excellent or good
Learn more about the work of our research integrity team to safeguard the quality of each article we publish.
Find out more
ORIGINAL RESEARCH article
Front. Mar. Sci., 14 December 2022
Sec. Marine Biology
Volume 9 - 2022 | https://doi.org/10.3389/fmars.2022.1071081
This article is part of the Research TopicSharing Technical Knowledge to Understand the Distribution Patterns and Migration History of Marine OrganismsView all 11 articles
Despite technical advances in archival tag attachment and functional longevity, long-term tracking of individuals of some fish species remains prohibitively difficult. Here we combined high resolution stable isotope sampling of otoliths, genetic assignment, growth increment analyses and a simple movement model to inform a hidden Markov model of the location of individual wild Atlantic salmon (Salmo salar L.) at sea. The model provided a reconstruction of North Atlantic migration for a species which is extremely difficult to track throughout its marine life-stage. We show that plausible emigration and return migration patterns can be achieved from wild fish. Simulations of simplified northward and westward movement patterns in the North Atlantic were used to quantify precision and accuracy of the model which differed between these two directional scenarios. Because otolith-derived migratory information does not rely on capture, release and subsequent recapture of the individual, this can be retrieved from any fish. Thus these techniques offer a powerful tool for improving our understanding of the processes that govern movement and survival of individual fish during a protracted and largely unobservable life-stage in the oceanic environment.
Migratory species are subject to diverse anthropogenic and ecological pressures because of their movement across broad spatial scales. Full characterization of the factors affecting different life-stages therefore is contingent on knowledge of their migratory behavior and space-use (Tamario et al., 2019). Such information is particularly difficult to derive for highly mobile species such as anadromous salmon, which emigrate from freshwater as juvenile smolts and can migrate over large distances in the marine environment prior to their coastal return as mature adults after one or more years at sea (Thorstad et al., 2010).
An understanding of the distribution, migration and behavior of wild Atlantic salmon, Salmo salar L., at sea is of particular importance due to recent multi-decadal and geographically broad-scale declines in survival and growth during the marine phase, often linked to a changing ocean environment (Todd et al., 2008; Chaput, 2012; Friedland and Todd, 2012; Todd et al., 2012; Olmos et al., 2020). Spatial and temporal analyses of the impact of changing ocean conditions are hampered by our limited knowledge of the migratory routes and destinations of Atlantic salmon stocks in the open ocean, how they get there, and the extent to which individuals or populations vary in their movement trajectories. These questions need to be addressed as a priority in disentangling the multiple factors affecting survival and growth of salmon at sea.
Historically, the marine migration routes and destinations of salmon have been elucidated using conventional tagging data, based on known release and recapture points (Drenner et al., 2012; Ó Maoiléidigh et al., 2018). More recently, technological advances in how electronic tag data are stored and/or transmitted have allowed anadromous species to be fitted with environment-sensing archival data storage tags (DST) commonly recording temperature and depth. Concurrent with increased use of archival tags to recover detailed information about the abiotic environment experienced by fish, has been the development and proliferation of statistical approaches to infer movement, and especially those utilizing hidden Markov models (HMMs) (Pedersen et al., 2008; Thygesen et al., 2009; Guðjónsson et al., 2015; Strøm et al., 2018).
Whilst archival tag development is providing valuable insights into the behavior of individual fish at particular life-stages, there remain some significant challenges to their application across the whole life history of wide-ranging species exploiting both freshwater and marine environments. For some species successful retrieval of archival DST is extremely difficult and/or unlikely due to low numbers of tagged individuals and/or the difficulty in targeting sufficient sampling effort to have a high probability of successful recapture. The tags often are costly, especially when only a small proportion of those deployed may be retrieved. Pop-off satellite tag data are retrievable from satellite transmissions but typical tag durations are approximately months rather than years. Finally, internally fitted tags capable of long-term (e.g. >12 months) battery life may be prohibitively large for use on smaller fish, including juvenile wild salmon. In cases where tracking of small fish, or mapping of complete life history stages, is required traditional bio-telemetry may not be an effective way of addressing broad-scale environmental questions. Advances in our understanding of stock-specific spatial exploitation and migration patterns have also recently been made using genetic stock identification. This is reliant upon commercial trawls and/or research surveys to obtain the empirical samples but does provide invaluable information on stock locations at specific times (Beacham et al., 2006; Jeffery et al., 2018; Bradbury et al., 2021; Gilbey et al., 2021).
An alternative, and often complimentary, approach to the deployment of animal-borne tags or sensors in the study of fish movement is the use of natural ecogeochemical markers (McMahon et al., 2013). Such elemental or isotopic marks are created by environmental properties and recorded within biological tissues or structures of the individual; animals residing within a particular environment are thus “tagged” with some indication of its properties, and changes therein over time. As noted by McMahon et al. (2013), the ecogeochemical approach has proven particularly useful in interrogating diadromous species which move through distinct geochemical environments. These species often are difficult to access during large portions of their life history, making natural tags a useful source of information during those times. Furthermore, the continuous accretion of calcium carbonate by skeletal components such as the sagittal otoliths (‘ear bones’) of teleost fish throughout the lifetime of the individual yields a structure which can be sequentially sub-sampled to reveal chronological change (Campana and Thorrold, 2001; Hanson et al., 2013; Sakamoto et al., 2019; Matsubayashi et al., 2020). Provided that the environmental parameters recorded by the natural tag can be related spatially and temporally to those available within the species’ habitat, ecogeochemical markers can be utilized as natural DST to infer likely movement paths (e.g. Sakamoto et al., 2019; Matsubayashi et al., 2020).
Otoliths are biomineralized structures of the inner ear that function in hearing and balance which record various ecogeochemical markers of water chemistry encountered by the fish (Reis-Santos et al., 2022). One such marker is the stable oxygen isotope value (δ18O), which relates to water temperature (Campana, 1999). Water temperatures can be estimated from otolith oxygen stable isotope values because the partitioning of the stable isotopes 16O and 18O between otolith aragonite and ambient water is temperature-dependent (Degens et al., 1969; Kalish, 1991; Thorrold et al., 1997). Otolith growth is continuous, often displaying annual (macroscopic) or even daily (microscropic) banding; for this reason, they are commonly used in fish ageing. However, in Atlantic salmon, growth rings formed on the scale are commonly used to derive freshwater and sea ages through the demarcation of annular growth patterns (Shearer, 1992), and also to provide detailed growth histories through measurement of ring spacing (e.g. Todd et al., 2021).
Here we present a new method to infer two-dimensional movement of individual fish at sea based upon limited one-dimensional ecogeochemical data. The method was applied to two wild Atlantic salmon as a case study to examine the feasibility of using otolith oxygen stable isotope ratios as a natural migratory tag. Specifically, we inferred ambient sea surface temperature (SST) time series for individual salmon by using, as a proxy, oxygen stable isotope ratios retrieved from otoliths by means of high resolution secondary ion mass spectrometry (SIMS). We inferred time series of likely North Atlantic locations using a body length-related model of salmon swim speed and movement applied to high resolution gridded SST data within a discrete-time, discrete-space HMM accounting for individual growth patterns. To explore the sensitivity of this approach, we simulated simplified marine migration trajectories with known thermal profiles and compared the estimated paths to true locations.
Two adult wild Atlantic salmon were obtained in June-July 2009 from commercial coastal nets located on the north coast of Scotland (58.56°N 03.92°W). Fish body fork length (rounded down to the nearest 0.5 cm) was recorded, scales were sampled and 1 cm3 of white muscle was excised and stored at -20°C. Sagittal otoliths were removed, cleaned of organic material and rinsed thoroughly in deionized water. Observations of the scale growth confirmed that one of the fish had spent just one winter at sea (one sea-winter; 1SW adult), and the other had spent two winters at sea (2SW adult).
To model individual salmon movement throughout the marine migration, it was necessary to define a start and end location for the marine phase. The end location was defined as the netting station site where fish were sampled; but, because coastal net fisheries may exploit multiple river stocks (Downie et al., 2018), natal origin was determined for each fish from genetic analyses of scale samples (Table 1; see Gilbey et al., 2016 for details of methods).
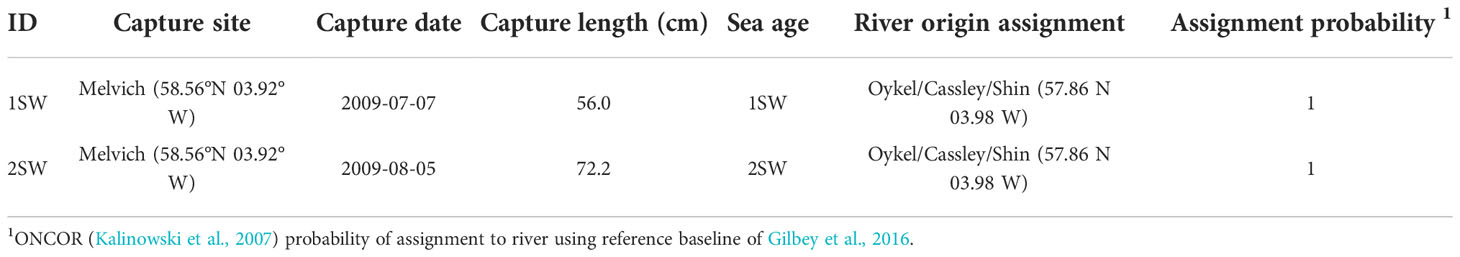
Table 1 Capture details and genetic assignment of river or region of origin for individual wild Atlantic salmon used in the analysis.
To extract time-resolved otolith oxygen stable isotope values (δ18O) for use as a proxy for seawater temperature, otoliths were prepared for SIMS analyses as reported in Hanson et al. (2013). Oxygen isotope ratios were measured with a Cameca IMS-1270 ion microprobe (#309) (Edinburgh Ion Microprobe Facility) using a ~ 5 nA primary 133Cs+ beam focused to 15 μm diameter. Step sizes between sample spots averaged 63 μm and spot depth was 2 - 3 μm. Secondary ions were extracted at -10 kV, and 16O and 18O were monitored simultaneously on dual Faraday cups (L’2 and H’2) at intensities of 3 x 10⁹ and 4 x 10⁶ cps, respectively. Mass resolution was 2600 for oxygen to remove 16O2H and 17O1H on 18O. Each analysis involved a pre-sputtering period of 40 s, followed by automatic secondary beam and entrance slit centering, and finally data collection in two blocks of ten cycles. Mean external precision based on daily analysis of an inorganic carbonate standard (University of Wisconsin Calcite, UWC) was ± 0.19SD. Otolith oxygen isotope values are reported in per mil (‰) notation relative to Vienna Pee Dee Belemnite (VPDB) (Coplen, 1996), according to the equation δ18Osample = [(Rsample/Rstandard) – 1] × 1000, where R is equal to . Each sampling transect originated at the outer margin of the otolith and was terminated once a freshwater isotope signal was recorded (when values dropped to< -4 ‰). To compare isotope profiles between individual salmon, and to estimate a chronology for the sample spots, the transect was re-scaled to relative distance from the transition between freshwater and marine residency of the juvenile fish (i.e. smolt emigration from the river).
The isotope fractionation equation, 1000lnα = a + b(103T-1) (Kim et al., 2007) was used to estimate seawater temperature values at each SIMS sample spot, where and temperature T is in Kelvin. For the present analysis, the value of a was estimated from similar data from 1SW Atlantic salmon (-33.43, Hanson et al., 2013), and assuming a slope b = 17.88 ± 0.13 derived using synthetic aragonite (Kim et al., 2007). δ18Owater was set to 0, which is a reasonable average across the North Atlantic (LeGrande and Schmidt, 2006). VPDB values were converted to the Vienna standard mean ocean water (VSMOW) scale using the Coplen et al. (1983) equation for temperature calculations. Estimated temperatures were converted to degrees Celsius (°C) by subtracting 273.15.
Detailed investigation of scale growth was necessary for the present analysis for two reasons; first, in the absence of an otolith growth model for adult Atlantic salmon, scale growth was used as a proxy with which to anchor δ18O values in time (Hanson et al., 2013). As salmon grow their scales increase in size, but not number, and growth of the scale radius is directly linked to growth in body length of the fish. It is unlikely that the relative distances along the otolith and scale growth axes would be exactly equivalent but we considered this assumption to be justified given that growth of both structures is linked to somatic growth (Degens et al., 1969; Campana and Thorrold, 2001) and is correlated in this species (Wells et al., 2003). Our second objective here was to include, as observational data in the movement model, the body length of the individual (and thence an estimate of swim speed) at each δ18O spot back-calculated using the incremental measurements of the scale circuli (see below).
Details of Atlantic salmon scale increment analysis, and the method for assigning calendar dates to each growth ring for an individual fish, are reported by Todd et al. (2013). This method requires information on three recognizable scale features. Emigration of the juvenile smolt from freshwater was assumed to be April 27 2007, or May 7 2008 based on median smolt emigration dates for those calendar years taken from the only available Scottish monitoring archive (for River North Esk, E Scotland; Marine Scotland Science, unpublished data). The midpoint growth circulus of the winter annulus (1SW adult), or both winter annuli (2SW adult) was assumed to be set at the winter solstice (December 21), and the final capture date (= scale edge) was known. This method allowed the date of each growth ring to be expressed as the relative distance from smolt emigration.
We back-calculated body length increment throughout the marine phase from scale circuli measurements. Smolt length at emigration was back-calculated using a modification of the Dahl-Lea method (see Hanson et al., 2019 for details), and all subsequent growth in body length during the marine phase was assuming to be isometric with scale radius increment. Finally, back-calculated body lengths at each observed δ18O otolith value were assigned by matching to the nearest calendar date.
Given the series of otolith-derived water temperature time series (TO), we used a state space model to estimate progressive changes in the geographic location of the sampled salmon throughout their marine phase. Our modelling of Atlantic salmon movement assumed otolith TO are predominantly reflective of ocean surface temperature which is justified by archival DST data having confirmed that these fish forage predominantly within the top 10m of the water column, whilst also undertaking occasional intermittent deep dives (Guðjónsson et al., 2015; Hedger et al., 2017).
We adapted the methodology of Thygesen et al. (2009) who present an HMM for the geolocation of fish, in discrete space, using DST data. In this approach, the true location of the fish at a given time-step was modelled as an unobserved state in a Markov process. The state transition probabilities were determined by a movement model, with the DST data providing observations on the hidden states.
We used a 0.25° regular grid between -75.125 and 25.125o longitude and 45.125 and 80.125o latitude to define the state space, Z, of the HMM. The resolution of the state space was aligned to available SST data (NOAA OISST v2; https://www.esrl.noaa.gov/psd/data/gridded/data.noaa.oisst.v2.highres.html ), with an associated land-sea mask. States that were designated as land in the NOAA SST data had a likelihood of zero for all time-steps. Transitions between states occurred at weekly time intervals (modelled as the first day in each 7-day period since the date of river emigration).
Following Thygesen et al. (2009), let p(τ|τ) denote the discrete probability distribution of the location of the fish, i.e. over Z, given all observations taken at, or before, time τ and p(τ + 1|τ) be the predicted distribution at time τ + 1 given all observations strictly before time τ + 1. Applying the movement model then corresponds to the update:
where H defines the transition probabilities between states as determined by the movement model, and ∗ denotes convolution over the state space (i.e. all locations), such that for state s ∈ Z we have:
where Hs,t is the probability of moving to state s from state t and pt is the value of p(τ|τ) at t.
Previous HMMs of fish behavior have modelled movement as a diffusion process resulting from an assumed unbiased random walk at a finer temporal resolution than that of the HMM (Thygesen et al., 2009; Guðjónsson et al., 2015; Strøm et al., 2017; Strøm et al., 2018). Unbiased random walk models do not appropriately capture persistence (i.e. directional correlation) in animal movement and therefore may not always be suitable for application to migratory data such as those of the present study (Codling et al., 2008); this is particularly relevant when the data are sparse and have high uncertainty. Random walk models, usually modelled with a Gaussian distribution, also have the disadvantage of allowing for a non-zero probability at large distances in finite time. As a simple alternative we used a uniform circular movement model, with radius dependent on the swim speed estimated from back-calculated body length of the fish in meters, l (Andersen et al., 2007). Thus the probability of moving to location s given starting location t and body length lτ at time-step τ is
where Δxs,t, Δys,t are the x and y components of the horizontal distance in meters between the two locations s and t, calculated as:
where λz, ϕz are the longitude and latitude of state z in radians, and an equirectangular projection is used to approximate distance. Given that our state space was defined over a regular longitudinal and latitudinal grid, the movement model results in an ellipse with its extent dependent on the latitude of the location at which it was applied. V is the progression rate in a time interval of one week,
assuming a migration speed, b, of 1.25 body lengths per second (BLs-1; Drenner et al., 2012; Thorstad et al., 2012). As a consequence of using a body length-dependent progression rate, the number of non-zero values in H increases as l increases over time.
Next, the predicted distribution at time τ + 1, p(τ + 1|τ) is updated to the estimate p(τ + 1|τ + 1) by taking into account the data at time τ + 1. For the present application, in the absence of DST data, we treat the series of otolith-derived SST values (TO) as observations of the sea surface temperature (TSST) at the unobserved location.
Given an observation of otolith-derived SST, , the likelihood of the fish being at location, s, at time τ + 1 is
where is the OISST at location s at time τ + 1. The error in the observations, σ, was set to 1°C to account for variability in TO - TSST from various sources such as the precision of the SIMS analyses (Hanson et al., 2013), spatial variability in δ18O seawater (LeGrande and Schmidt, 2006), and the accuracy and precision of the applied thermometry equation.
The above defines a discrete likelihood function L(τ + 1) over all states, and the updated estimate of the location conditional on the new observation is given by:
By iterating through all time-steps, τ = 1 … N - 1, applying Equations 1 and 2, a series of probability distributions over the state space for the location of the fish was generated, with the distribution at each step conditional on all prior observations. The initial and final locations were known, so L (1) and L (N) were set to 1 at the location of the assigned river of origin (northeast Scotland) and north Scotland capture point respectively, and 0 at all other locations.
Weekly time-steps were used in the model, but time assignments of the available otolith sample spots did not result in a data point for each time-step for each fish. Accordingly, there were numerous time-steps for which there were no data with which to apply Equation 2. In this case no observation update was performed, or equivalently:
In the absence of conditionality on observations, the resulting distributions were more diffuse than time-steps with associated observation data (Figure S1).
Finally, a backward smoothing recursion was performed such that the probability distributions at each time-step were conditional not only on all prior observations but also all subsequent observations. Specifically, the smoothed probability distribution over the state space at time-step τ, given all observations, was calculated by iterating from τ = N … 1 applying the calculation:
resulting in the final series of smoothed probability distributions, p(τ|∞) defined over Z.
For visualization, we also derived the mean latitude and longitude at each time-step as follows:
where p(τ|∞)λ,ϕ is the value of p(τ|∞) at the state with latitude and longitude λ,ϕ.
We simulated simplified migration trajectories, and associated SST observations, to better understand the limitations of the HMM. Body length, otolith sampling frequency and origin locations were all taken from the 1SW salmon used in the study to mimic the data obtained by means of SIMS sampling. Trajectories were constructed by simulating movement from the genetically assigned origin (NE Scotland) with fixed orientation, but with distance travelled between time-steps drawn from a uniform distribution between 0 and Vlτ. Two orientation profiles were used, either northward to the Norwegian Sea or westward toward the mid-Atlantic ridge then moving longitudinally or latitudinally, respectively, before returning to the origin travelling backward along the same vector as the outward migration. These orientation profiles represented simplified migration trajectories which were not strictly biologically plausible (e.g. fish would not travel in a straight line) but which captured the major axes of movement for this species emigrating from southern Europe within the North Atlantic (e.g. Rikardsen et al., 2021) in a way that allowed some isolation of model performance with respect to movement trajectory. was extracted from simulated locations and uncertainty added by sampling from a normal distribution with and σ = 1°C. Sampled was then thinned to reflect the sampling frequency achieved by means of SIMS.
The HMM was applied to the simulated values allowing a direct comparison of the inferred location of the HMM against true values. The performance of the HMM was qualitatively evaluated by visualizing the true and mean inferred locations and quantitatively evaluated by calculating the absolute error (in km) between true and inferred locations over the time series, using the equirectangular projection approximation. For the latter, values were weighted by the likelihood of each inferred location. Specifically, at time-step τ the error in the location estimate, eτ was calculated by
where
and
where are the true latitude and longitude of the simulated migration at time τ and R is an approximation of the Earth’s radius set to 6378.1 km.
As an additional comparison, we visualise the inferred locations from the HMM against SST thermal bands encompassed by C. This provides an indication of the impact of the movement model in reducing the uncertainty of the location estimates relative to a naïve estimate using only to infer location (e.g. Hanson et al., 2010).
All data analyses and plotting was performed in the statistical package R (R Core Team, 2022).
In both simulation scenarios, the thermal profiles retrieved from the mean path closely mirrored the pattern of SST along the true simulated path (Figure 1A). However, the mean migratory path inferred from the northward simulation more closely represented the true path than that fitted to the westward migratory scenario (Figure 1B), indicating the paucity of information within thermal gradients in the westward (longitudinal) direction with which to inform the movement model.
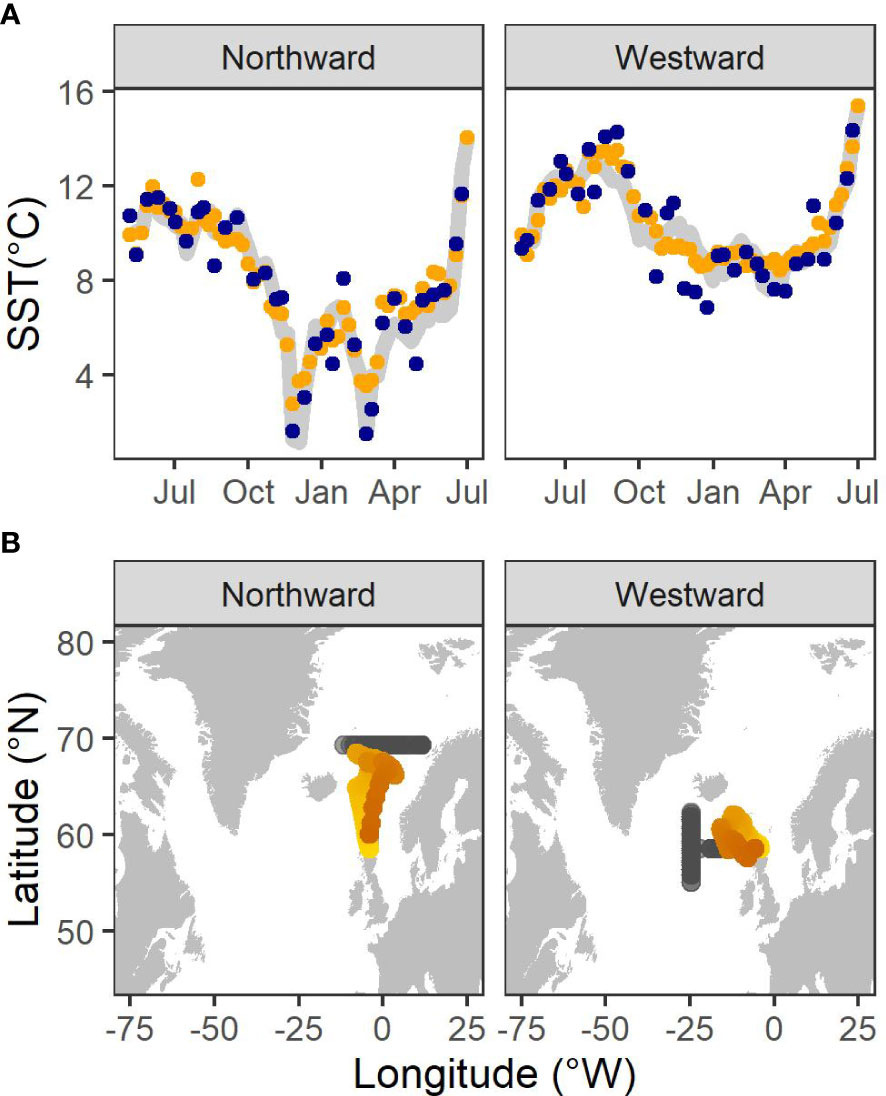
Figure 1 (A) SST values sampled from a normal distribution centered on SST values extracted from the true simulated location (grey line) with σ = 1°C (blue points), thinned to the SIMS sampling frequency of a 1SW fish and used as data in the hidden Markov Model to infer locations. SST values extracted from the mean inferred location (orange points) also are presented. (B) The mean locations (orange points) inferred from the hidden Markov model together with the true simulated locations (grey points) for each simulation. Lighter colour indicates the beginning of the migration.
A subset of individual time-steps of the posterior likelihood of locations for the two migratory scenarios are illustrated in Figure 2 together with locations within σ = 1°C of that measured along the true simulated path. Using the HMM to infer location, conditional both on irregular observations of SST and a movement model constrained by fish size, improved the precision of inferred locations relative to estimates based on SST alone – and most especially on the longitudinal axis. The true simulated location was contained within the 90% confidence intervals of the posterior distribution of inferred locations in 76% of the time-steps for the northward simulation and in 56% of time-steps for the westward simulation (Figure 2; Figures S2 & S3).
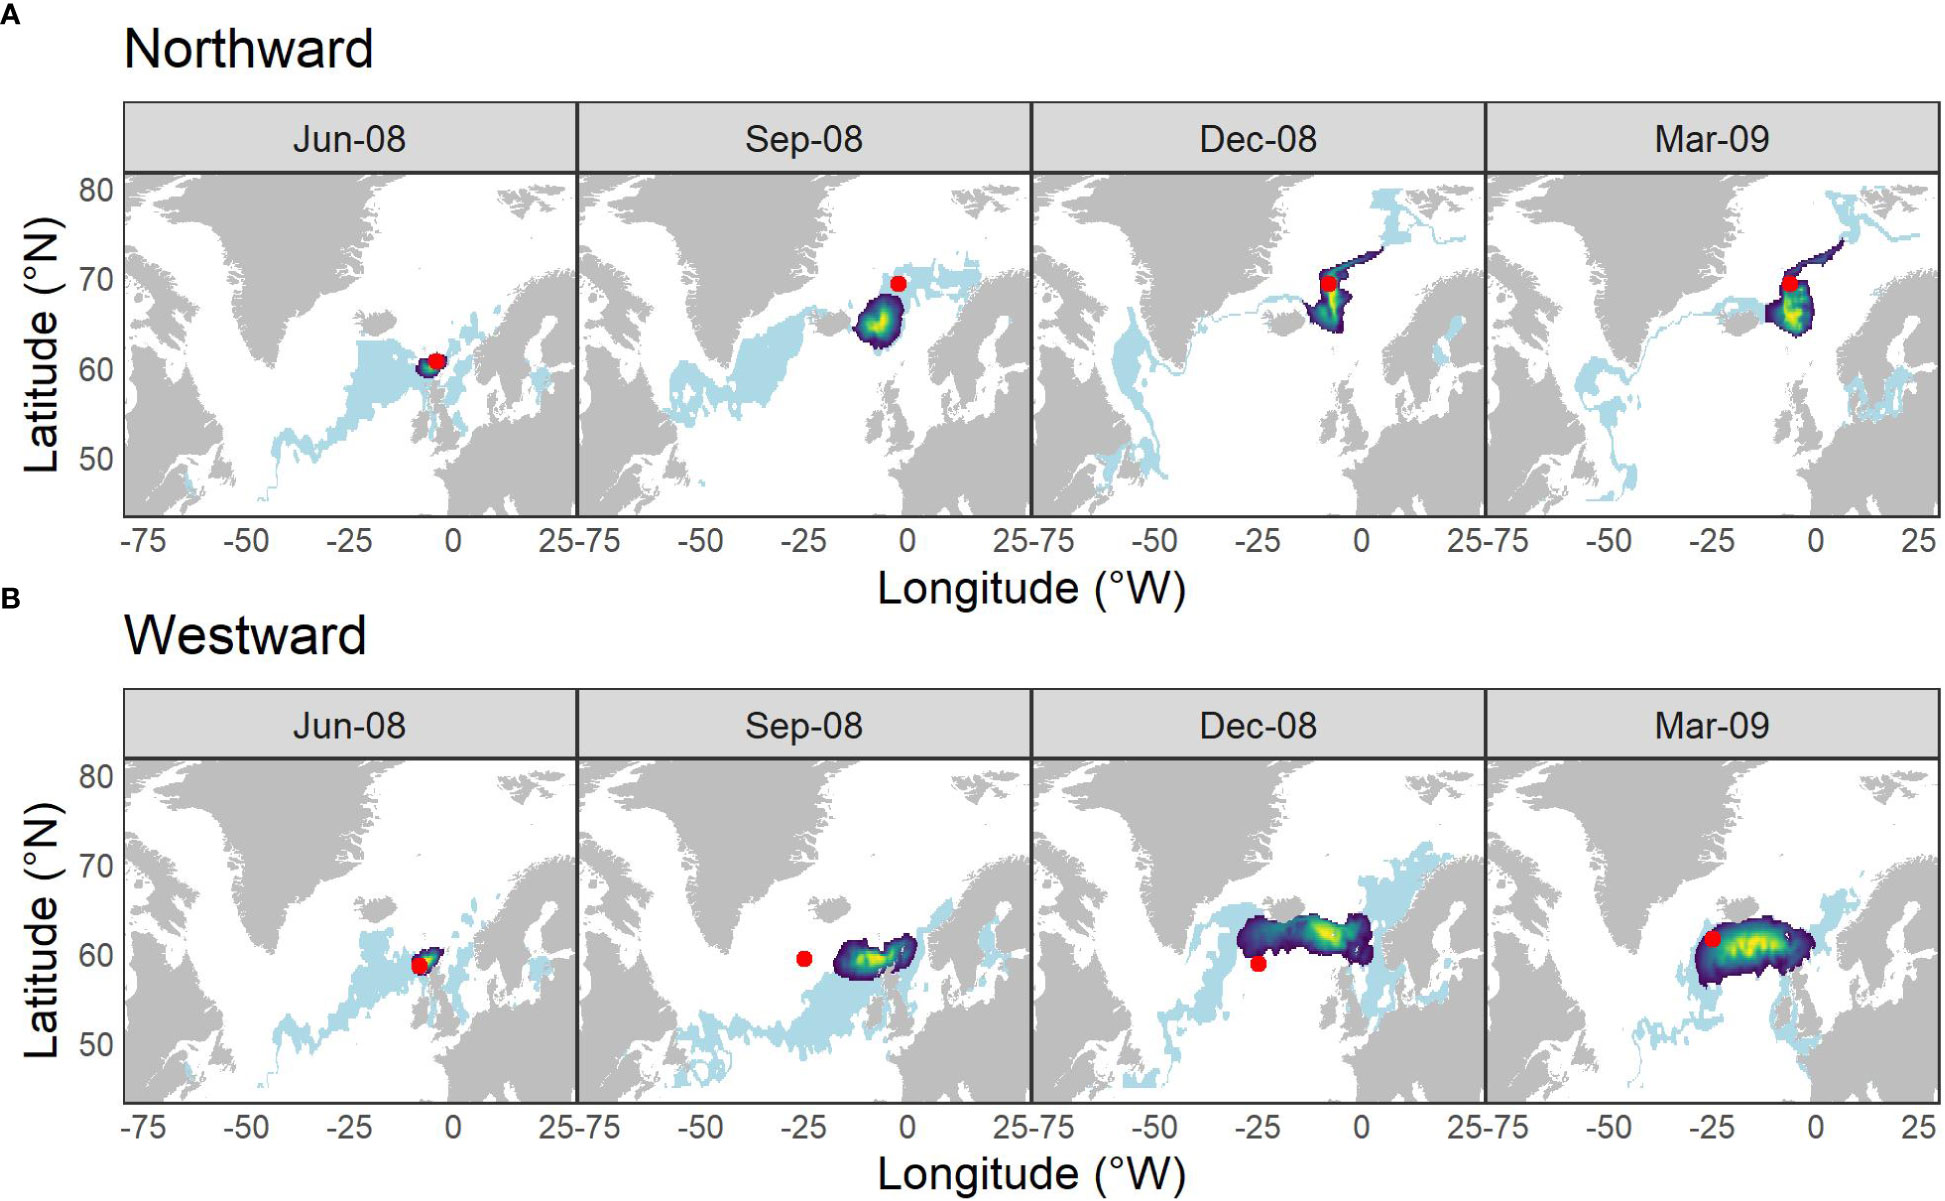
Figure 2 Locations inferred from SST at various time points along the (A) northward and (B) westward simulated simplified migration paths. Light blue banding illustrates the distribution of all locations within σ = 1°C of the SST at the true location (red spot); heatmap area indicates 90% C.I. of the density distribution of locations derived from the hidden Markov movement model. Time-steps were restricted to those with TO values.
The absolute error (in km) between the true location and all inferred locations (including those time-steps with no associated data), weighted by their probability, varied between 0 and 2070 km. The HMM was more accurate and precise in reconstructing predominantly northward movement than predominantly westward movement. Median error was 519 km [IQR = 326] for the northward simulation and 1321 km [IQR = 871] for the westward simulation.
Figure 3A shows the δ18O profiles from the two salmon examined in the present study. The SIMS sampling transects yielded 34 and 38 δ18O values over 59 (1SW fish) to 112 (2SW fish) sea weeks. Profiles indicated a pattern of peaks and troughs in δ18O values, associated with colder months (Figure 3B). SST values extracted from the mean inferred location were consistent with, but less variable than, the otolith-derived estimates.
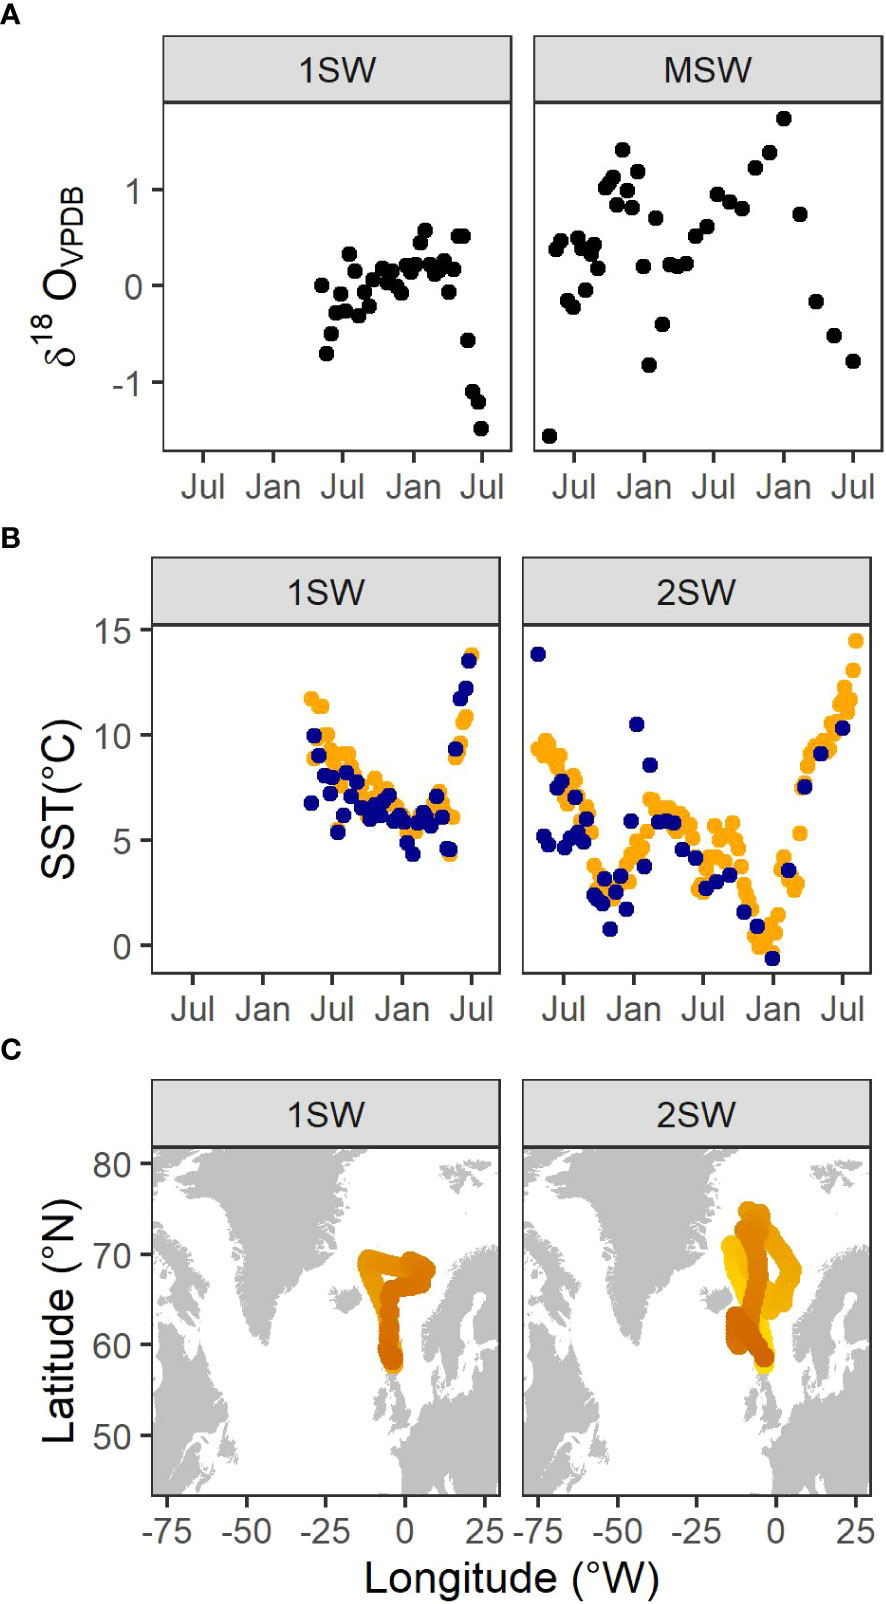
Figure 3 (A) Otolith δ18O values along transects of wild Atlantic salmon (Salmo salar, L.) returning to Scotland. Profiles start at the transition to the marine phase and end at capture one or two sea-winters (1SW, 2SW, respectively) later. (B) SST values estimated from otolith δ18O values (blue points) together with SST values extracted from the mean inferred location (orange points). (C) Mean locations inferred from the hidden Markov model. Lighter colour indicates the beginning of the migration.
Both fish were genetically allocated with high confidence (p = 1) to an assignment unit comprising the rivers Oykel/Cassley/Shin in north Scotland. Within the Scottish baseline, this assignment unit has high assignment accuracy (p > 0.89; Gilbey et al., 2016). These three rivers share a common catchment, and are confluent at the Kyle of Sutherland which itself drains to the northern North Sea (57.86 N 03.98 W). Metadata for each fish can be found in Table 1. Length profiles and emigration/capture locations are shown in Supplementary Material Figures S4 & S5.
The long-distance out-and-back migration patterns estimated by the HMM were broadly consistent with available information on the migration routes for this species (Figure 3C) (Gilbey et al., 2021; Maoiléidigh et al., 2018; Rikardsen et al., 2021).
Individual time-steps of the posterior likelihood of migratory locations for the two wild Atlantic salmon are illustrated in Figure 4, together with locations within σ = 1°C of that measured in the otolith. The inferred migratory locations of the 1SW individual (Figure 4A) were characterized by northward travel past the Faroe Islands into the Norwegian Sea, over-wintering around the Iceland-Faroes Ridge and the Vøring Plateau (67˚N, 04˚E), before return migration to the Scottish coast. The inferred migratory locations for the 2SW salmon (Figure 4B) also were characterized by northward travel to the northeast of Iceland, with seasonal transitions between the polar front zone and the Norwegian Sea. By spring of its second year at the sea the positions were located near the Faroe Islands prior to return migration to the Scottish coast. Full outputs can be seen in Figures S6, S7.
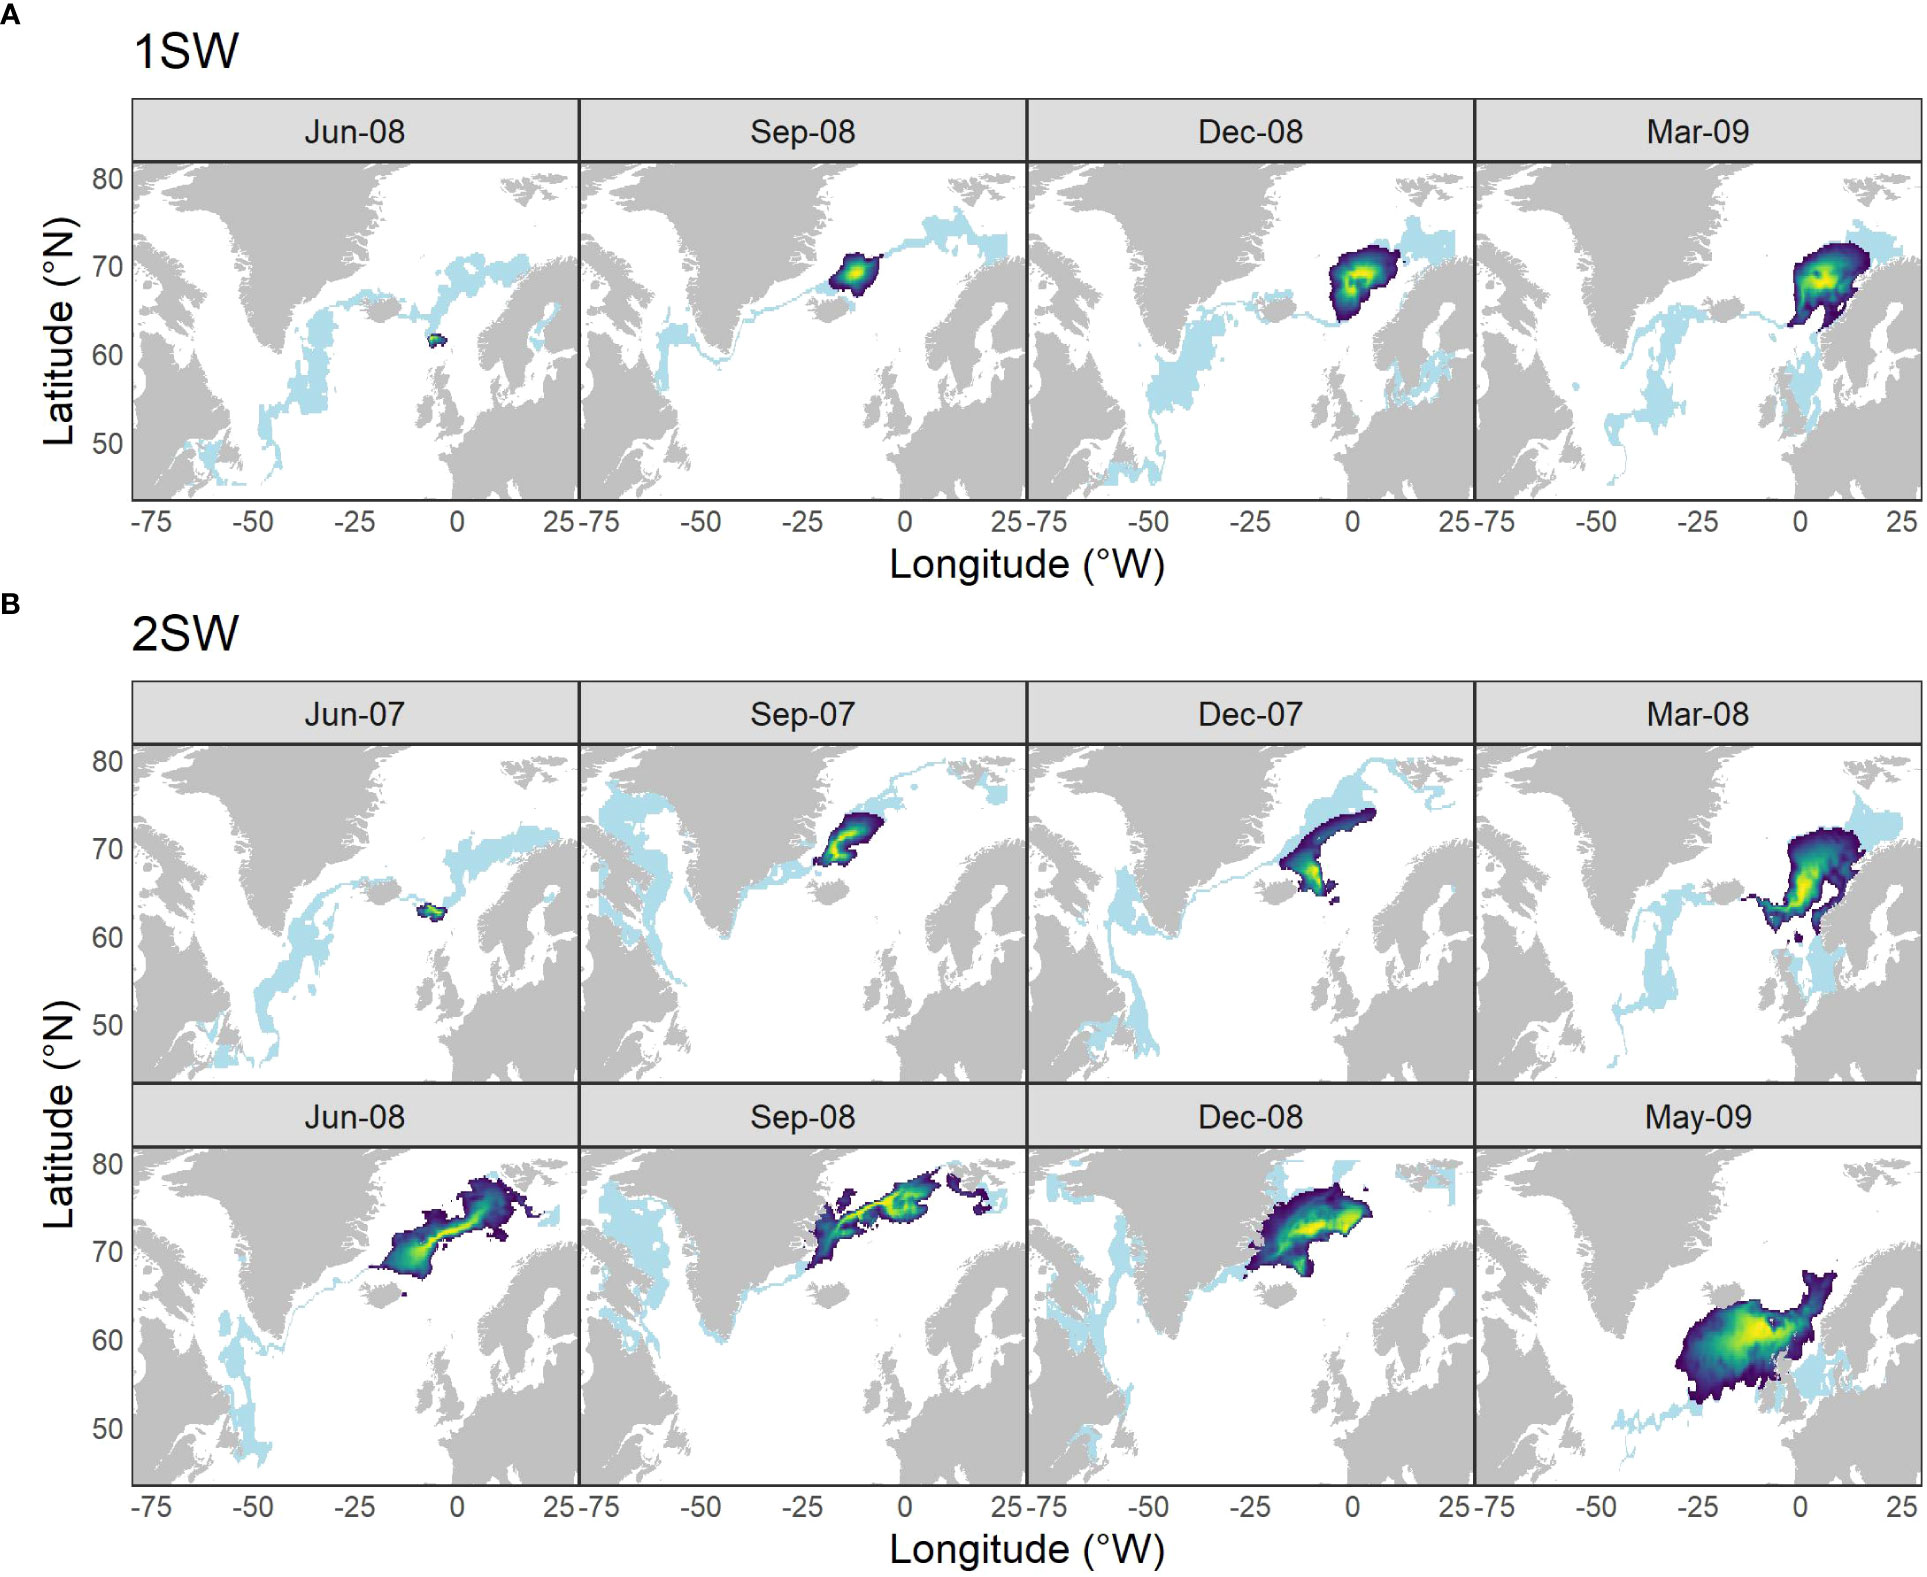
Figure 4 Locations of two wild Atlantic salmon at various time points during the marine migration inferred from otolith δ18O derived water temperatures. The model was applied to one (A) 1SW and one (B) 2SW adult salmon for illustrative purposes. Light blue banding illustrates the distribution of all locations within σ = 1°C of the SST measured within the otolith; heatmap area indicates 90% C.I. of the density distribution of locations derived from the hidden Markov movement model. Time-steps were restricted to those with TO values.
We present a method for inferring the full oceanic migration of a wide-ranging anadromous fish species, using data from high resolution stable isotope sampling of individual otoliths analyzed within a hidden Markov model framework. High resolution SIMS sampling of each otolith provided a time series of individual δ18O values from which we could reconstruct estimates of the experienced sea surface thermal profiles for the individual fish. The model was constrained using potential migration distance steps based upon body length estimates (and thence swim speeds) derived from scale increment analysis. We explored the precision and accuracy of the HMM using simulations of simple migratory paths within the North Atlantic and originating from NE Scotland. The model was most accurate when reconstructing primarily northward movement and less accurate when reconstructing a westward trajectory. We interpret these results to suggest that the present method of inferring movement from temperature histories may be most accurate when applied to species or demographic groups with primarily north - south migration trajectories in the North Atlantic.
In the present analysis, we explore an approach to inferring movement of individual fish within the marine environment from stable isotope data, which can be applied to basin-scale marine migration. Sequential sampling of ecogeochemical markers derived from biogenic structures, coupled with movement modelling techniques, provides a potentially powerful new method to track migratory animals through time and space. This general approach has been successfully applied to, among others, sub-stock movement of plaice (Darnaude and Hunter, 2018), point-to-point movement of Japanese sardine (Sakamoto et al., 2019) and chum salmon (Matsubayashi et al., 2020). Importantly, our approach allows inference on complex out-and-back migratory patterns over the time period encapsulated in the otolith (in this case, a period of one to two years from juvenile emigrant to return adult stages).
At a basic level, the temperatures estimated from Atlantic salmon otolith δ18O can be used to infer broadscale movement patterns on the basis of seasonal temperature variation within the North Atlantic (Figure 4). Darnaude et al. (2014) demonstrated strong concordance between otolith δ18O values and environmental conditions (temperature and salinity) for wild free-ranging plaice, while von Leesen et al. (2021) showed that SIMS-measured mean otolith δ18O values were well correlated with predicted otolith δ18O values based on temperature and salinity derived from DST-tagged free-swimming cod. However, such inferences would necessarily be poorly defined in the longitudinal direction because thermal gradients are predominantly latitudinal within the migratory range of this species in the eastern North Atlantic (see Reynolds et al., 2007); they would also be restricted to specific time points measured on the otolith. By using a state-space hidden Markov model we found it possible to account for the unobserved fish movement between otolith δ18O observations, and to constrain progression between observation steps using a priori assumptions about salmon movement thereby markedly increasing precision of location estimates in the longitudinal direction and providing inferences of location at all time-steps (Figures 2, 4).
The available information regarding at-sea distribution of wild Atlantic salmon with which to evaluate the plausibility of our modelled migration distributions is limited both in time and space. Recent analyses of available research and fisheries cruise data found Atlantic salmon postsmolt aggregations concentrated within the North Atlantic Current (April-June), around the Vøring Plateau (June-July), further north off the Barents Sea Plateau (August) and along the Iceland-Faroes Ridge (October) (Gilbey et al., 2021). From tag recaptures and, more recently, genetic screening of fisheries samples, it is apparent that Scottish salmon returning as 1SW and 2SW adults are present around the Faroe Islands at least during November – May. Some 2SW salmon of Scottish origin do latterly migrate westwards to spend their second summer in the western North Atlantic and have been captured in Greenlandic fisheries during August – October prior to their return migration (Bradbury et al., 2016; Ó Gilbey et al., 2017; Maoiléidigh et al., 2018). Our modelled locations in the eastern North Atlantic (Figures 4, S6, S7 & S8) therefore broadly conform with available fishery and survey-derived capture data. Marine migratory tracks of individual salmon tagged with archival DST are not available for Scottish salmon but such information is available for adult salmon originating from other European countries which had previously spawned, been tagged, and returned to sea. Whilst those data for spawned kelts are not directly comparable to the paths we infer here for maiden salmon undertaking marine migration for the first time, there are remarkable similarities between the tracks inferred here and those derived for salmon migrating especially from Denmark and southern Norway (Figure S8; Rikardsen et al., 2021).
Notwithstanding the fact that migratory inferences derived from our HMM were broadly plausible, it was important to test the limitations of the underlying model and to be mindful of its assumptions. While Darnaude et al. (2014) were able to validate movement inferences from otolith δ18O for plaice using DST, such data are not available for many fish species due to size and/or recapture probability limitations. In the absence of such validation data, we explored simple simulations of movements to test the limitations of our approach.
The performance of the HMM on simulated data highlighted some of the difficulties in recovering location from SST observations alone. In general the inferred temperature profiles were close to the true simulated values (Figure 1A); however the HMM had high error when predicting the most extreme longitudinal locations visited by the simulation. Temperature gradients are primarily north-south rather than east-west in the eastern North Atlantic (Reynolds et al., 2007), and consequently, in the presence of the uncertainty in the observation step, there is a lower signal-to-noise ratio contained within a thermal profile extracted from east-west movement. This resulted in the HMM over-smoothing the location estimates, and remaining close to the center of mass during the extremes of the migration.
For simplicity, and to test extreme scenarios, the simulated trajectories included persistent straight line migration over multiple time-steps. However, the uniform circular movement assumption gives equal probability to continue in the same direction as to move in any other direction, making it a sub-optimal movement model for the simulated scenarios. This also impacts the ability of the HMM to infer extreme locations.
Overall, the precision of our method was comparable to other studies using temperature or stable isotope data to infer marine animal distribution (MacKenzie et al., 2011; Chittenden et al., 2013; Guðjónsson et al., 2015; Trueman et al., 2017; Sakamoto et al., 2019; Matsubayashi et al., 2020). We are not aware of other attempts to quantify accuracy of movement inferences based on indirect observations using simulated data. Methods that are GPS or DST-based will be more accurate given the amount and accuracy of data that can now be stored in tags (e.g. Rikardsen et al., 2021). However, it is important to recognize that inferring movement from these data sources also requires assumptions about fish behavior and physiology that are not frequently explored. Whilst a stable isotope-based method of geolocating aquatic animals may be less accurate than more traditional telemetry approaches, it does allow lower resolution data to be readily obtained from a larger number of individuals (Table 2). In the specific case of otolith-derived information, a major advantage is that the method may be applied retrospectively to any fish.
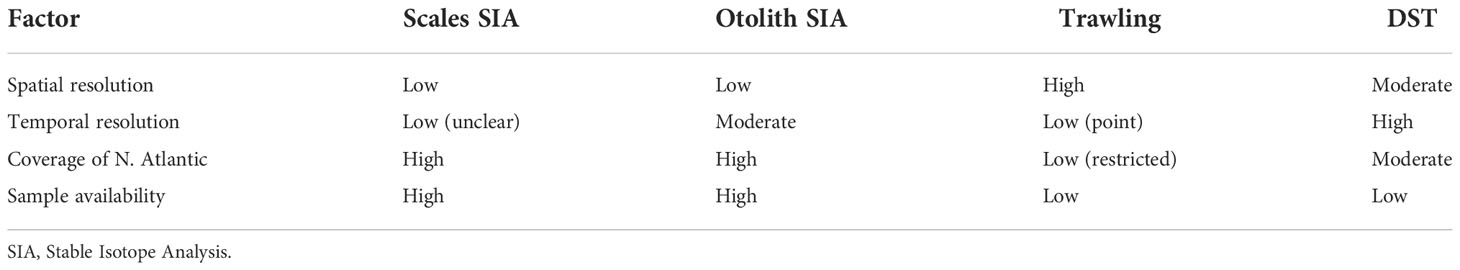
Table 2 Comparison of various aspects of common methods used for tracking wild Atlantic salmon in the North Atlantic.
The accuracy and precision of our modelled movement inferences for individual fish appear limited by the predominant direction of travel within the North Atlantic, with constraints on inference regarding longitudinal (east-west) movement. However, there are several avenues which have the potential to improve the accuracy of inferences. A ‘center of attraction’ within the migratory domain could be included as a prior within the model if there is good information on the likely distribution of animals at a particular time (e.g. McClintock et al., 2012). Information derived from, for example, capture-mark-release-recapture studies (Ó Maoiléidigh et al., 2018), research trawls (Gilbey et al., 2021), or even isoscape-based foraging location assignments from scale stable isotope analyses (MacKenzie et al., 2011) may help to parameterize a center of attraction. The failure of the HMM to recover extreme longitudinal locations during simulated migrations suggests that a more sophisticated movement model may improve performance. Specifically, directional persistence and/or variable migration speed in combination with assumptions about stage of migration (e.g. ‘traveling’, ‘searching’, or ‘foraging’) might provide better results (e.g. Michelot et al., 2017). However, parameterizing such behaviors in the HMM would require additional data or strong prior information; we purposefully did not take that approach here due to the datasets being sparse and a lack of robust priors. For some species analysis of otoliths retrieved from individuals fitted with archival DST for the duration of their migration would permit cross-validation of different model formulations, including sensitivity to error in smolt emigration timing. However, for Atlantic salmon, this validation step is not readily available because of the present lack of sufficiently small DST for most juvenile smolts at river emigration. None the less, the use of downstream-migrating smolts that had been uniquely tagged (or recorded telemetrically) near the head of tide would offer the model advantage of confidence in the individual’s date of river emigration.
Some assumptions implicit within our approach may warrant closer consideration. Perhaps the foremost of these is that the error in SST values derived from otolith δ18O values is spatially random. Spatial variation in seawater δ18O values (LeGrande and Schmidt, 2006) must be incorporated into future iterations of the approach, and experimental determination of an Atlantic salmon-specific δ18O fractionation equation may also improve predictions for this species.
With respect to wild anadromous salmonids, the stable isotopic approach presented here has the potential to provide insight into large-scale movements of individual salmon to complement the fine-scale movements derivable for a restricted number of individuals bearing DST, and the snapshots of distribution at a given time and location provided by capture-tag-recapture and genetic stock identification data (Strøm et al., 2018; Maoiléidigh et al., 2018; Rikardsen et al., 2021; Gilbey et al., 2021).
The present combined application of ecogeochemical markers and fish movement modelling provides an analytical framework for the estimation of ocean migratory trajectories based upon a natural data storage morphological structure intrinsic to each individual. The power of this approach is especially apparent in revealing the movement history of highly migratory or anadromous species, for which traditional capture-tag-recapture techniques are difficult to implement due to the small size of the emigrant juvenile fish and their low survival to adulthood and probability of recapture. Because otolith-derived migratory information does not rely on recapturing known individual fish, and can be retrieved from any salmon, the technique represents a powerful tool for improving our understanding of the processes that govern survival during this extensive and largely unobservable lifestage.
The datasets presented in this study can be found in online repositories. The names of the repository/repositories and accession number(s) can be found below: https://github.com/MarineScotlandScience/salmon-otolith-hmm.
NH, conceptualization. NH and JO, formal analysis and writing – original draft. NH and CT, funding acquisition for isotope analysis. NH, JO, SM, and JG, investigation. NH, JO, SM, JG, and CT, writing – review and editing. All authors contributed to the article and approved the submitted version.
This study was supported by funding from the Scottish Government. Access to the EIMF instruments was supported by grant numbers 383/1109 and 415/1010 from the Natural Environment Research Council.
The authors thank the staff at the Edinburgh Ion Microprobe Facility. Proprietors and staff of various commercial netting operations were instrumental in providing access to samples for this study (John Salkeld and the Strath Halladale Partnership; James Mackay, Armadale Salmon Fishing). The authors are grateful to J. Sampayo for genotyping of scale samples and to previous reviewers for their constructive comments on how the manuscript could be improved, including the use of a simulation study.
The authors declare that the research was conducted in the absence of any commercial or financial relationships that could be construed as a potential conflict of interest.
All claims expressed in this article are solely those of the authors and do not necessarily represent those of their affiliated organizations, or those of the publisher, the editors and the reviewers. Any product that may be evaluated in this article, or claim that may be made by its manufacturer, is not guaranteed or endorsed by the publisher.
The Supplementary Material for this article can be found online at: https://www.frontiersin.org/articles/10.3389/fmars.2022.1071081/full#supplementary-material
Andersen K. H., Nielsen A., Thygesen U. H., Hinrichsen H.-H., Neuenfeldt S. (2007). Using the particle filter to geolocate Atlantic cod (Gadus morhua) in the Baltic sea, with special emphasis on determining uncertainty. Can. J. Fish. Aquat. Sci. 64, 618–627. doi: 10.1139/f07-037
Beacham T. D., McIntosh B., MacConnachie C., Miller K. M., Withler R. E., Varnavskaya N. (2006). Pacific rim population structure of sockeye salmon as determined from microsatellite analysis. Trans. Am. Fish. Soc. 135, 174–187. doi: 10.1577/T05-149.1
Bradbury I. R., Hamilton L. C., Sheehan T. F., Chaput G., Robertson M. J., Dempson J. B., et al. (2016). Genetic mixed-stock analysis disentangles spatial and temporal variation in composition of the West Greenland Atlantic salmon fishery. ICES J. Mar. Sci. 73, 2311–2321. doi: 10.1093/icesjms/fsw072
Bradbury I. R., Lehnert S. J., Messmer A., Duffy S. J., Verspoor E., Kess T., et al. (2021). Range-wide genetic assignment confirms long-distance oceanic migration in atlantic salmon over half a century. ICES J. Mar. Sci. 78, 1434–1443. doi: 10.1093/icesjms/fsaa152
Campana S. E. (1999). Chemistry and composition of fish otoliths: pathways, mechanisms and applications. Mar. Ecol. Prog. Ser. 188, 263–297. doi: 10.3354/meps188263
Campana S. E., Thorrold S. R. (2001). Otoliths, increments, and elements: keys to a comprehensive understanding of fish populations? Can. J. Fish. Aquat. Sci. 58, 30–38. doi: 10.1139/f00-177
Chaput G. (2012). Overview of the status of Atlantic salmon (Salmo salar) in the north Atlantic and trends in marine mortality. ICES J. Mar. Sci. 69, 1538–1548. doi: 10.1093/icesjms/fss013
Chittenden C. M., Fauchald P., Rikardsen A. H. (2013). Important open-ocean areas for northern Atlantic salmon (Salmo salar) — as estimated using a simple ambient-temperature approach. Can. J. Fish. Aquat. Sci. 70, 101–104. doi: 10.1139/cjfas-2012-0215
Codling E. A., Plank M. J., Benhamou S. (2008). Random walk models in biology. J. R. Soc. Interface 5, 813–834. doi: 10.1098/rsif.2008.0014
Coplen T. B. (1996). New guidelines for reporting stable hydrogen, carbon, and oxygen isotope-ratio data. Geochim. Cosmochim. Acta 60, 3359–3360. doi: 10.1016/0016-7037(96)00263-3
Coplen T. B., Kendall C., Hopple J. (1983). Comparison of stable isotope reference samples. Nature 302, 236–238. doi: 10.1038/302236a0
Darnaude A. M., Hunter E. (2018). Validation of otolith δ18O values as effective natural tags for shelf-scale geolocation of migrating fish. Mar. Ecol. Prog. Ser. 598, 167–185. doi: 10.3354/meps12302
Darnaude A. M., Sturrock A., Trueman C. N., Mouillot D., EIMF, Campana S. E., et al. (2014). Listening in on the past: what can otolith δ18O values really tell us about the environmental history of fishes? PloS One 9, e108539. doi: 10.1371/journal.pone.0108539
Degens E. T., Deuser W. G., Haedrich R. L. (1969). Molecular structure and composition of fish otoliths. Mar. Biol. 2, 105–113. doi: 10.1007/BF00347005
Downie H., Hanson N., Smith G. W., Middlemas S. J., Anderson J., Tulett D., et al. (2018). Using historic tag data to infer the geographic range of salmon river stocks likely to be taken by a coastal fishery. Scottish Mar. Freshw. Sci. Rep. 9, 23 doi: 10.7489/12905-1.
Drenner S. M., Clark T. D., Whitney C. K., Martins E. G., Cooke S. J., Hinch S. G. (2012). A synthesis of tagging studies examining the behaviour and survival of anadromous salmonids in marine environments. PloS One 7, e31311. doi: 10.1371/journal.pone.0031311
Friedland K. D., Todd C. D. (2012). Changes in Northwest Atlantic Arctic and subarctic conditions and the growth response of Atlantic salmon. Polar Biol. 35, 593–609. doi: 10.1007/s00300-011-1105-z
Gilbey J., Cauwelier E., Coulson M. W., Stradmeyer L., Sampayo J. N., Armstrong A., et al. (2016). Accuracy of assignment of Atlantic salmon (Salmo salar, l.) to rivers and regions in Scotland and northeast England based on single nucleotide polymorphism (SNP) markers. PloS One 11, e0164327. doi: 10.1371/journal.pone.0164327
Gilbey J., Utne K. R., Wennevik V., Beck A. C., Kausrud K., Hindar K., et al. (2021). The early marine distribution of Atlantic salmon in the north-east Atlantic: A genetically informed stock-specific synthesis. Fish. Fish., 1-33. doi: 10.1111/faf.12587
Gilbey J., Wennevik V., Bradbury I. R., Fiske P., Hansen L. P., Jacobsen J. A., et al. (2017). Genetic stock identification of Atlantic salmon caught in the faroese fishery. Fish. Res. 187, 110–119. doi: 10.1016/j.fishres.2016.11.020
Guðjónsson S., Einarsson S. M., Jónsson I. R., Guðbrandsson J. (2015). Marine feeding areas and vertical movements of Atlantic salmon (Salmo salar) as inferred from recoveries of data storage tags. Can. J. Fish. Aquat. Sci. 72, 1087–1098. doi: 10.1139/cjfas-2014-0562
Hanson N. N., Smith G. W., Middlemas S. J., Todd C. D. (2019). Precision and accuracy of Dahl-lea back-calculated smolt lengths from adult scales of Atlantic salmon Salmo salar. J. Fish. Biol. 94, 183–186. doi: 10.1111/jfb.13863
Hanson N. N., Wurster C. M., EIMF, Todd C. D. (2013). Reconstructing marine life-history strategies of wild Atlantic salmon from the stable isotope composition of otoliths. Mar. Ecol. Prog. Ser. 475, 249–266. doi: 10.3354/meps10066
Hanson N. N., Wurster C. M., Todd C. D. (2010). Comparison of secondary ion mass spectrometry and micromilling/continuous flow isotope ratio mass spectrometry techniques used to acquire intra-otolith δ18O values of wild atlantic salmon (salmo salar). Rapid Commun. Mass Spectrom. 24, 2491–2498. doi: 10.1002/rcm.4646
Hedger R. D., Rikardsen A. H., Strøm J. F., Righton D. A., Thorstad E. B., Næsje T. F. (2017). Diving behaviour of Atlantic salmon at sea: effects of light regimes and temperature stratification. Mar. Ecol. Prog. Ser. 574, 127–140. doi: 10.3354/meps12180
Jeffery N. W., Wringe B. F., McBride M. C., Hamilton L. C., Stanley R. R. E., Bernatchez L., et al. (2018). Range-wide regional assignment of atlantic salmon (salmo salar) using genome wide single-nucleotide polymorphisms. Fish. Res. 206, 163–175. doi: 10.1016/j.fishres.2018.05.017
Kalinowski S. T., Manlove K. R., Taper M. L. (2007). ONCOR: A computer program for genetic stock identification (Montana State University: Department of Ecology). Available at: http://www.montana.edu/kalinowski/Software/ONCOR.htm.
Kalish J. M. (1991). Oxygen and carbon stable isotopes in the otoliths of wild and laboratory-reared Australian salmon (Arripis trutta). Mar. Biol. 110, 37–47. doi: 10.1007/BF01313090
Kim S.-T., O’Neil J. R., Hillaire-Marcel C., Mucci A. (2007). Oxygen isotope fractionation between synthetic aragonite and water: influence of temperature and Mg2+ concentration. Geochim. Cosmochim. Acta 71, 4704–4715. doi: 10.1016/j.gca.2007.04.019
Leesen G., Bardarson H., Halldórsson S. A., Whitehouse M. J., Campana S. E. (2021). Accuracy of otolith oxygen isotope records analyzed by SIMS as an index of temperature exposure of wild icelandic cod (Gadus morhua). Front. Mar. Sci. 8. doi: 10.3389/fmars.2021.698908
LeGrande A. N., Schmidt G. A. (2006). Global gridded data set of the oxygen isotopic composition in seawater. Geophys. Res. Lett. 33, L12604. doi: 10.1029/2006GL026011
MacKenzie K. M., Palmer M. R., Moore A., Ibbotson A. T., Beaumont W. R. C., Poulter D. J. S., et al. (2011). Locations of marine animals revealed by carbon isotopes. Sci. Rep. 1, 21. doi: 10.1038/srep00021
Maoiléidigh N. Ó, White J., Hansen L. P., Jacobsen J. A., Potter T., Russell I., et al. (2018). Fifty years of marine tag recoveries from atlantic salmon. ICES Cooperative Res. Rep. 343, 121. doi: 10.17895/ices.pub.4542
Matsubayashi J., Osada Y., Tadokoro K., Abe Y., Yamaguchi A., Shirai K., et al. (2020). Tracking long-distance migration of marine fishes using compound-specific stable isotope analysis of amino acids. Ecol. Lett. 23, 881–890. doi: 10.1111/ele.13496
McClintock B. T., King R., Thomas L., Matthiopoulos J., McConnell B. J., Morales J. M. (2012). A general discrete-time modeling framework for animal movement using multistate random walks. Ecol. Monogr. 82, 335–349. doi: 10.1890/11-0326.1
McMahon K. W., Hamady L. L., Thorrold S. R. (2013). A review of ecogeochemistry approaches to estimating movements of marine animals. Limnol. Oceanogr. 58, 697–714. doi: 10.4319/lo.2013.58.2.0697
Michelot T., Langrock R., Bestley S., Jonsen I. D., Photopoulou T., Patterson T. A. (2017). Estimation and simulation of foraging trips in land-based marine predators. Ecology 98, 1932–1944. doi: 10.1002/ecy.1880
Olmos M., Payne M. R., Nevoux M., Prévost E., Chaput G., Du Pontavice H., et al. (2020). Spatial synchrony in the response of a long range migratory species (Salmo salar) to climate change in the north Atlantic ocean. Glob. Change Biol., 26 1319–1337. doi: 10.1111/gcb.14913
Pedersen M. W., Righton D., Thygesen U. H., Andersen K. H., Madsen H. (2008). Geolocation of north Sea cod (Gadus morhua) using hidden Markov models and behavioural switching. Can. J. Fish. Aquat. Sci. 65, 2367–2377. doi: 10.1139/F08-144
R Core Team (2022). R: A language and environment for statistical computing (Vienna, Austria: R Foundation for Statistical Computing). Available at: https://www.R-project.org/.
Reis-Santos P., Gillanders B. M., Sturrock A. M., Izzo C., Oxman D. S., Lueders-Dumont J. A., et al (2022). Reading the biomineralized book of life: expanding otolith biogeochemical research and applications for fisheries and ecosystem-based management Rev. Fish. Biol. Fish. doi: 10.1007/s11160-022-09720-z
Reynolds R. W., Smith T. M., Liu C., Chelton D. B., Casey K. S., Schlax M. G. (2007). Daily high-Resolution-Blended analyses for Sea surface temperature. J. Climate 20, 5473–5496. doi: 10.1175/2007JCLI1824.1
Rikardsen A. H., Righton D., Strøm J. F., Thorstad E. B., Gargan P., Sheehan T., et al. (2021). Redefining the oceanic distribution of Atlantic salmon. Sci. Rep. 11, 12266. doi: 10.1038/s41598-021-91137-y
Sakamoto T., Komatsu K., Shirai K., Higuchi T., Ishimura T., Setou T., et al. (2019). Combining microvolume isotope analysis and numerical simulation to reproduce fish migration history. Methods Ecol. Evol. 10, 59–69. doi: 10.1111/2041-210X.13098
Shearer W. M. (1992). Atlantic Salmon scale reading guidelines (Copenhagen: International Council for the Exploration of the Seas). Available at: http://www.nefsc.noaa.gov/sos/spsyn/af/salmon/ICES_AtlanticSalmonScaleReadingGuidlines.pdf.
Strøm J. F., Thorstad E. B., Chafe G., Sørbye S. H., Righton D., Rikardsen A. H., et al. (2017). Ocean migration of pop-up satellite archival tagged Atlantic salmon from the miramichi river in Canada. ICES J. Mar. Sci. 74, 1356–1370. doi: 10.1093/icesjms/fsw220
Strøm J. F., Thorstad E. B., Hedger R. D., Rikardsen A. H. (2018). Revealing the full ocean migration of individual Atlantic salmon. Anim. Biotelemetry 6, 2. doi: 10.1186/s40317-018-0146-2
Tamario C., Sunde J., Petersson E., Tibblin P., Forsman A. (2019). Ecological and evolutionary consequences of environmental change and management actions for migrating fish. Front. Ecol. Evol. 7. doi: 10.3389/fevo.2019.00271
Thorrold S. R., Campana S. E., Jones C. M., Swart P. K. (1997). Factors determining δ13 and δ18 fractionation in aragonitic otoliths of marine fish. Geochim. Cosmochim. Acta 61, 2909–2919. doi: 10.1016/S0016-7037(97)00141-5
Thorstad E. B., Whoriskey F., Rikardsen A. H., Aarestrup K. (2010). “Aquatic nomads: The life and migrations of the Atlantic salmon,” in Atlantic Salmon ecology (Wiley-Blackwell, U.K.), 1–32. doi: 10.1002/9781444327755.ch1
Thorstad E. B., Whoriskey F., Uglem I., Moore A., Rikardsen A. H., Finstad B. (2012). A critical life stage of the Atlantic salmon Salmo salar: behaviour and survival during the smolt and initial post-smolt migration. J. Fish. Biol. 81, 500–542. doi: 10.1111/j.1095-8649.2012.03370.x
Thygesen U. H., Pedersen M. W., Madsen H. (2009). “Geolocating fish using hidden Markov models and data storage tags,” in Tagging and tracking of marine animals with electronic devices reviews: Methods and technologies in fish biology and fisheries. Eds. Nielsen J. L., Arrizabalaga H., Fragoso N., Hobday A., Lutcavage M., Sibert J. (Dordrecht: Springer Netherlands), 277–293. doi: 10.1007/978-1-4020-9640-2_17
Todd C. D., Friedland K. D., MacLean J. C., Whyte B. D., Russell I. C., Lonergan M. E., et al. (2012). Phenological and phenotypic changes in Atlantic salmon populations in response to a changing climate. ICES J. Mar. Sci. 69, 1686–1698. doi: 10.1093/icesjms/fss151
Todd C. D., Hanson N. N., Boehme L., Revie C. W., Marques A. R. (2021). Variation in the post-smolt growth pattern of wild one sea-winter salmon (Salmo salar l.), and its linkage to surface warming in the eastern north Atlantic ocean. J. Fish. Biol. 98, 6–16. doi: 10.1111/jfb.14552
Todd C. D., Hughes S. L., Marshall C. T., MacLean J. C., Lonergan M. E., Biuw E. M. (2008). Detrimental effects of recent ocean surface warming on growth condition of Atlantic salmon. Global Change Biol. 14, 958–970. doi: 10.1111/j.1365-2486.2007.01522.x
Todd C. D., Whyte B. D. M., MacLean J. C., Revie C. W., Lonergan M. E., Hanson N. N. (2013). A simple method of dating marine growth circuli on scales of wild one sea-winter and two sea-winter Atlantic salmon (Salmo salar). Can. J. Fish. Aquat. Sci. 71, 645–655. doi: 10.1139/cjfas-2013-0359
Trueman C. N., MacKenzie K. M., Glew K. S. J. (2017). Stable isotope-based location in a shelf sea setting: Accuracy and precision are comparable to light-based location methods. Methods Ecol. Evol. 8, 232–240. doi: 10.1111/2041-210X.12651
Keywords: otolith, isotope, hidden Markov model, salmon, migration, sea surface temperature
Citation: Hanson N, Ounsley J, Middlemas SJ, Gilbey J and Todd CD (2022) Inferring individual marine migration from otolith ecogeochemical signatures of a wide-ranging fish. Front. Mar. Sci. 9:1071081. doi: 10.3389/fmars.2022.1071081
Received: 15 October 2022; Accepted: 28 November 2022;
Published: 14 December 2022.
Edited by:
Tomihiko Higuchi, The University of Tokyo, JapanReviewed by:
Gotje von Leesen, Aarhus University, DenmarkCopyright © 2022 Hanson, Ounsley, Middlemas, Gilbey and Todd. This is an open-access article distributed under the terms of the Creative Commons Attribution License (CC BY). The use, distribution or reproduction in other forums is permitted, provided the original author(s) and the copyright owner(s) are credited and that the original publication in this journal is cited, in accordance with accepted academic practice. No use, distribution or reproduction is permitted which does not comply with these terms.
*Correspondence: Nora Hanson, bm9yYS5oYW5zb25AZ292LnNjb3Q=
Disclaimer: All claims expressed in this article are solely those of the authors and do not necessarily represent those of their affiliated organizations, or those of the publisher, the editors and the reviewers. Any product that may be evaluated in this article or claim that may be made by its manufacturer is not guaranteed or endorsed by the publisher.
Research integrity at Frontiers
Learn more about the work of our research integrity team to safeguard the quality of each article we publish.