 GuoWei Fu1
 Chao Cao2,3,4*
 KaiZhe Fu1*YanWei Song1Kun Yuan1XiaoMing Wan1ZiAng Zhu1ZhaoFan Wang1ZanHui Huang1
- 1Haikou Research Center of Marine Geology, China Geological Survey, Haikou, China
- 2Third Institute of Oceanography, Ministry of Natural Resources, Xiamen, China
- 3Fujian Provincial Key Laboratory of Marine Ecological Conservation and Restoration, Xiamen, China
- 4Key Laboratory of Marine Ecological Conservation and Restoration, Ministry of Natural Resources, Xiamen, China
Coastal erosion vulnerability assessment is widely used to assess the loss degree of coastal zone caused by erosion, and plays an important role in coastal natural resources protection, planning, management and decision-making. Based on the natural and social characteristics of the east coast of Qiongdong and the coastal erosion vulnerability index (CVI) method, this study selected 8 assessment indicators, such as shoreline change rate (U1). The Delphi method and the entropy weight method were used to calculate the comprehensive index weight, combined with CVI method and geographic information system (GIS) technology, to quantitatively evaluate the temporal and spatial distribution characteristics of typical coastal erosion vulnerability such as coral reefs in the east of Hainan Island. The study area was divided into 5 grades: very low (31%), low (10%), moderate (28%), high (24%) and high vulnerability (7%), and the overall performance was moderate erosion vulnerability. The research showed that the interannual downward rate erosion of beach (U3) and the rate of change of the isobath (U2) of the beach were the main controlling factors affecting the vulnerability of coastal erosion in the study area, and the coastal dynamic factor had a greater impact than the other two factors. As a natural barrier, the coral reefs in the study area had good wave absorption and energy reduction, and the coral reef coasts showed low coastal erosion vulnerability, due to the complex hydrodynamic characteristics, estuary coasts is the most vulnerable areas. The verification results of the ROC-AUC method showed that the accuracy of erosion vulnerability was 68.9%, which provided an important reference for the ecological restoration of tropical coral reef biological coasts and the development and management of the Hainan Qiongdong coastal zone.
1. Introduction
The coastal zone is the interaction zone between the ocean and land, and it is also the zone where human activities are concentrated (Barragan and Andreis, 2015). In recent years, with global warming, rapid sea level rise, frequent extreme climate events and intensified human production activities, the coastal zone has been experiencing increasingly serious coastal erosion risks, posing a very large threat to coastal zone engineering, natural ecological coastlines and ecosystems. (Jones and Phillips, 2011; Shi and Kasperson, 2015). Coastal erosion is a process of loss caused by the imbalance of sediments in a certain bank section. The main manifestations include shoreline retreat, downward erosion of beaches, high beach stability and low beach erosion, sediment coarsening, etc. (Mangor et al., 2017). Many scholars have studied coastal erosion processes and mechanisms (Bruun, 1962; Chen et al., 1988; Chen et al., 2004; Thampanya et al., 2006), erosion methods (Cai et al., 2008; Cai et al., 2022) and model research (Mohamed et al., 2021), erosion hazard evaluation (Liu, 2015), erosion protection management (Pan et al., 2022), and the quantitative relationship between economics and erosion has been systematically studied (Annelies et al., 2021; Hagedoorn et al., 2021).
With the in-depth study of coastal erosion, coastal erosion vulnerability assessment is widely used to assess the degree of loss caused by coastal erosion, and it plays an important role in coastal natural resource protection, planning and management decision-making (Kumar and Kunte, 2012; Andrade et al., 2019). There are certain differences in the scope, indicators and methods selected by different scholars in the assessment of coastal erosion vulnerability due to differences in coastal regional characteristics. Among them, the evaluation methods include the index method, numerical model method, fuzzy decision method, etc. (Chu et al., 2005). The earliest and most widely used is the coastal vulnerability index (CVI) method proposed by Gronitz (Gornitz, 1991), which comprehensively considers the risk levels of multiple factors, The evaluation index system is established from the aspects of vulnerability characteristics and causes, and the vulnerability index is formed by using mathematical methods to represent the vulnerability degree of the evaluation unit, compared with other methods, This method is simple and easy to operate, and it considers the superposition effect of different index factors, so it is highly scientific. Many scholars use CVI to conduct evaluation research at different levels and scales (Thieler and Hammar-Klose, 2000; Boruff et al., 2005; Dominguez et al., 2005).
In recent years, scholars have used various additional means to carry out coastal erosion vulnerability assessments, and thus, there has been rapid development and application of coastal erosion vulnerability assessments. Wang et al. (2021) used the percentile ranking method to comprehensively evaluate the physical and social vulnerability of the urban scale in the Yangtze River Delta region, and used bathymetric changes and independent evaluation to verify the reliability of the evaluation results. This method of verifying the results of the assessment is more credible and scientific, and is also the most commonly used method for vulnerability assessments at this stage. Yoo et al. (2014) proposed the environmental vulnerability index (EVI) to evaluate the coastal vulnerability of Jakarta, Indonesia, based on historical disasters and socioeconomic statistics, which were more affected by the vulnerability caused by land-based factors than was the CVI. In addition, some scholars have combined vulnerability, exposure, adaptability and hazard to assess coastal erosion risk (Merlotto et al., 2016; Narra et al., 2017; Roy et al., 2021; Swami and Parthasarathy, 2021). Based on vulnerability research, Swami and Parthasarathy proposed that system vulnerability includes three main factors: exposure, sensitivity and adaptability, which can comprehensively explain and evaluate the inherent characteristics of various coasts. Roy et al. (2021) and others selected 19 indicators, such as physical, environmental and socioeconomic geography, in the Mekhna River estuary area in Bangladesh and used the analytic hierarchy process (AHP) to evaluate the hazard, vulnerability and exposure indices. The area under the curve (AUC) has been used to verify the reliability of evaluating the degree of erosion risk. This research covers 19 index factors and considers almost all the influencing factors that can be involved, making it a more comprehensive assessment of the vulnerability of the Meghna Estuary. Cao Chao (Cao et al., 2022a; Cao et al., 2022b) used different methods to assess the vulnerability of coastal erosion from two scales, the national scale and the small scale of the Pearl River Estuary Greater Bay Area. Furthermore, the innovative introduction of cloud model theory at the national scale to construct a coastal erosion vulnerability assessment system for a comprehensive assessment of vulnerability showed that the cloud model theoretical index system and method were suitable for the assessment of coastal erosion vulnerability in mainland China. Second, on the small scale, a PRE - PRE coastal erosion vulnerability assessment system was established by comprehensively using the AHP, ideal solution similarity ranking technology (TOPSIS), independent weight method, Jenks natural discontinuity method (Jenks), exposure-sensitivity-adaptation (ESA) model and obstacle degree methods. Different evaluation methods were used at two different scales, and good research results were obtained, which made improved the development of research on coastal erosion vulnerability.
At present, scholars have made more assessments of coastal erosion vulnerability, and the vulnerability index factors have mainly selected generalized influencing factors. There is little research on regional typical shore sections, and the individualized and refined considerations of influencing factors are also relatively limited. The differences in the erosion vulnerability of different types of shore sections have not been studied and analyzed. For example, the typical tropical coral reef-type coast, cape bay coast, et al. has not been evaluated for coastal erosion vulnerability, and the difference between different types of coastal erosion vulnerability has not been studied. Based on the tropical coral reef coast, cape bay coast and estuary coast et al. of Hainan Qiongdong, this paper selected the typical coast of Qionghai-Wanning in Hainan Qiongdong. Eight small-scale and typical influencing factors, such as shoreline change rate and shoreline erosion rate, were comprehensively selected from the aspects of coastal morphological characteristics, coastal dynamic characteristics, and socioeconomic and human activities, such as coastline change rate and interannual downward rate erosion. The weight of each evaluation index was determined by the AHP method, Delphi method (DM) and entropy method (TEM). The CVI of the study area was calculated, and the coastal erosion was divided by the vulnerability rating, and a comprehensive assessment of the vulnerability of typical coastal erosion was conducted.
2. Study area
The Qionghai-Wanning coast is located on eastern Hainan Island, China Figure 1A, and is one of the most important coastal development zones for tropical coral reef organisms in China (110°00′~110°40′E, 18°35′~19°29′N) (Figure 1B). Its coral reefs are mainly distributed in the nearshore sea area north of Qionghai Tanmen Port, and the type of reefs is fringing reef parallel to the coast. The length of the fringing reef is about 15km from south to north, and the width of the reef flat is about 2km, water depth is about 2m (Figure 1C). Quaternary and Cambrian strata are mainly exposed in the coastal zone of the study area (Tian et al., 2016). The climate type is a tropical marine monsoon climate, the tide is an irregular diurnal tide, the wind direction is mainly southerly wind in summer and northeasterly wind in winter, and the waves are mainly mixed waves, among which the mixed waves dominated by swell have the highest frequency, followed by the wind waves, and the pure swell has the lowest frequency. Marine disasters are mainly storm surges caused by tropical cyclones. From 1964 to 2018, a total of 34 typhoons made landfall in the study area, accounting for 35.4% of the total, making the area have the most landed typhoons in Hainan (Tropical et al., 2021).
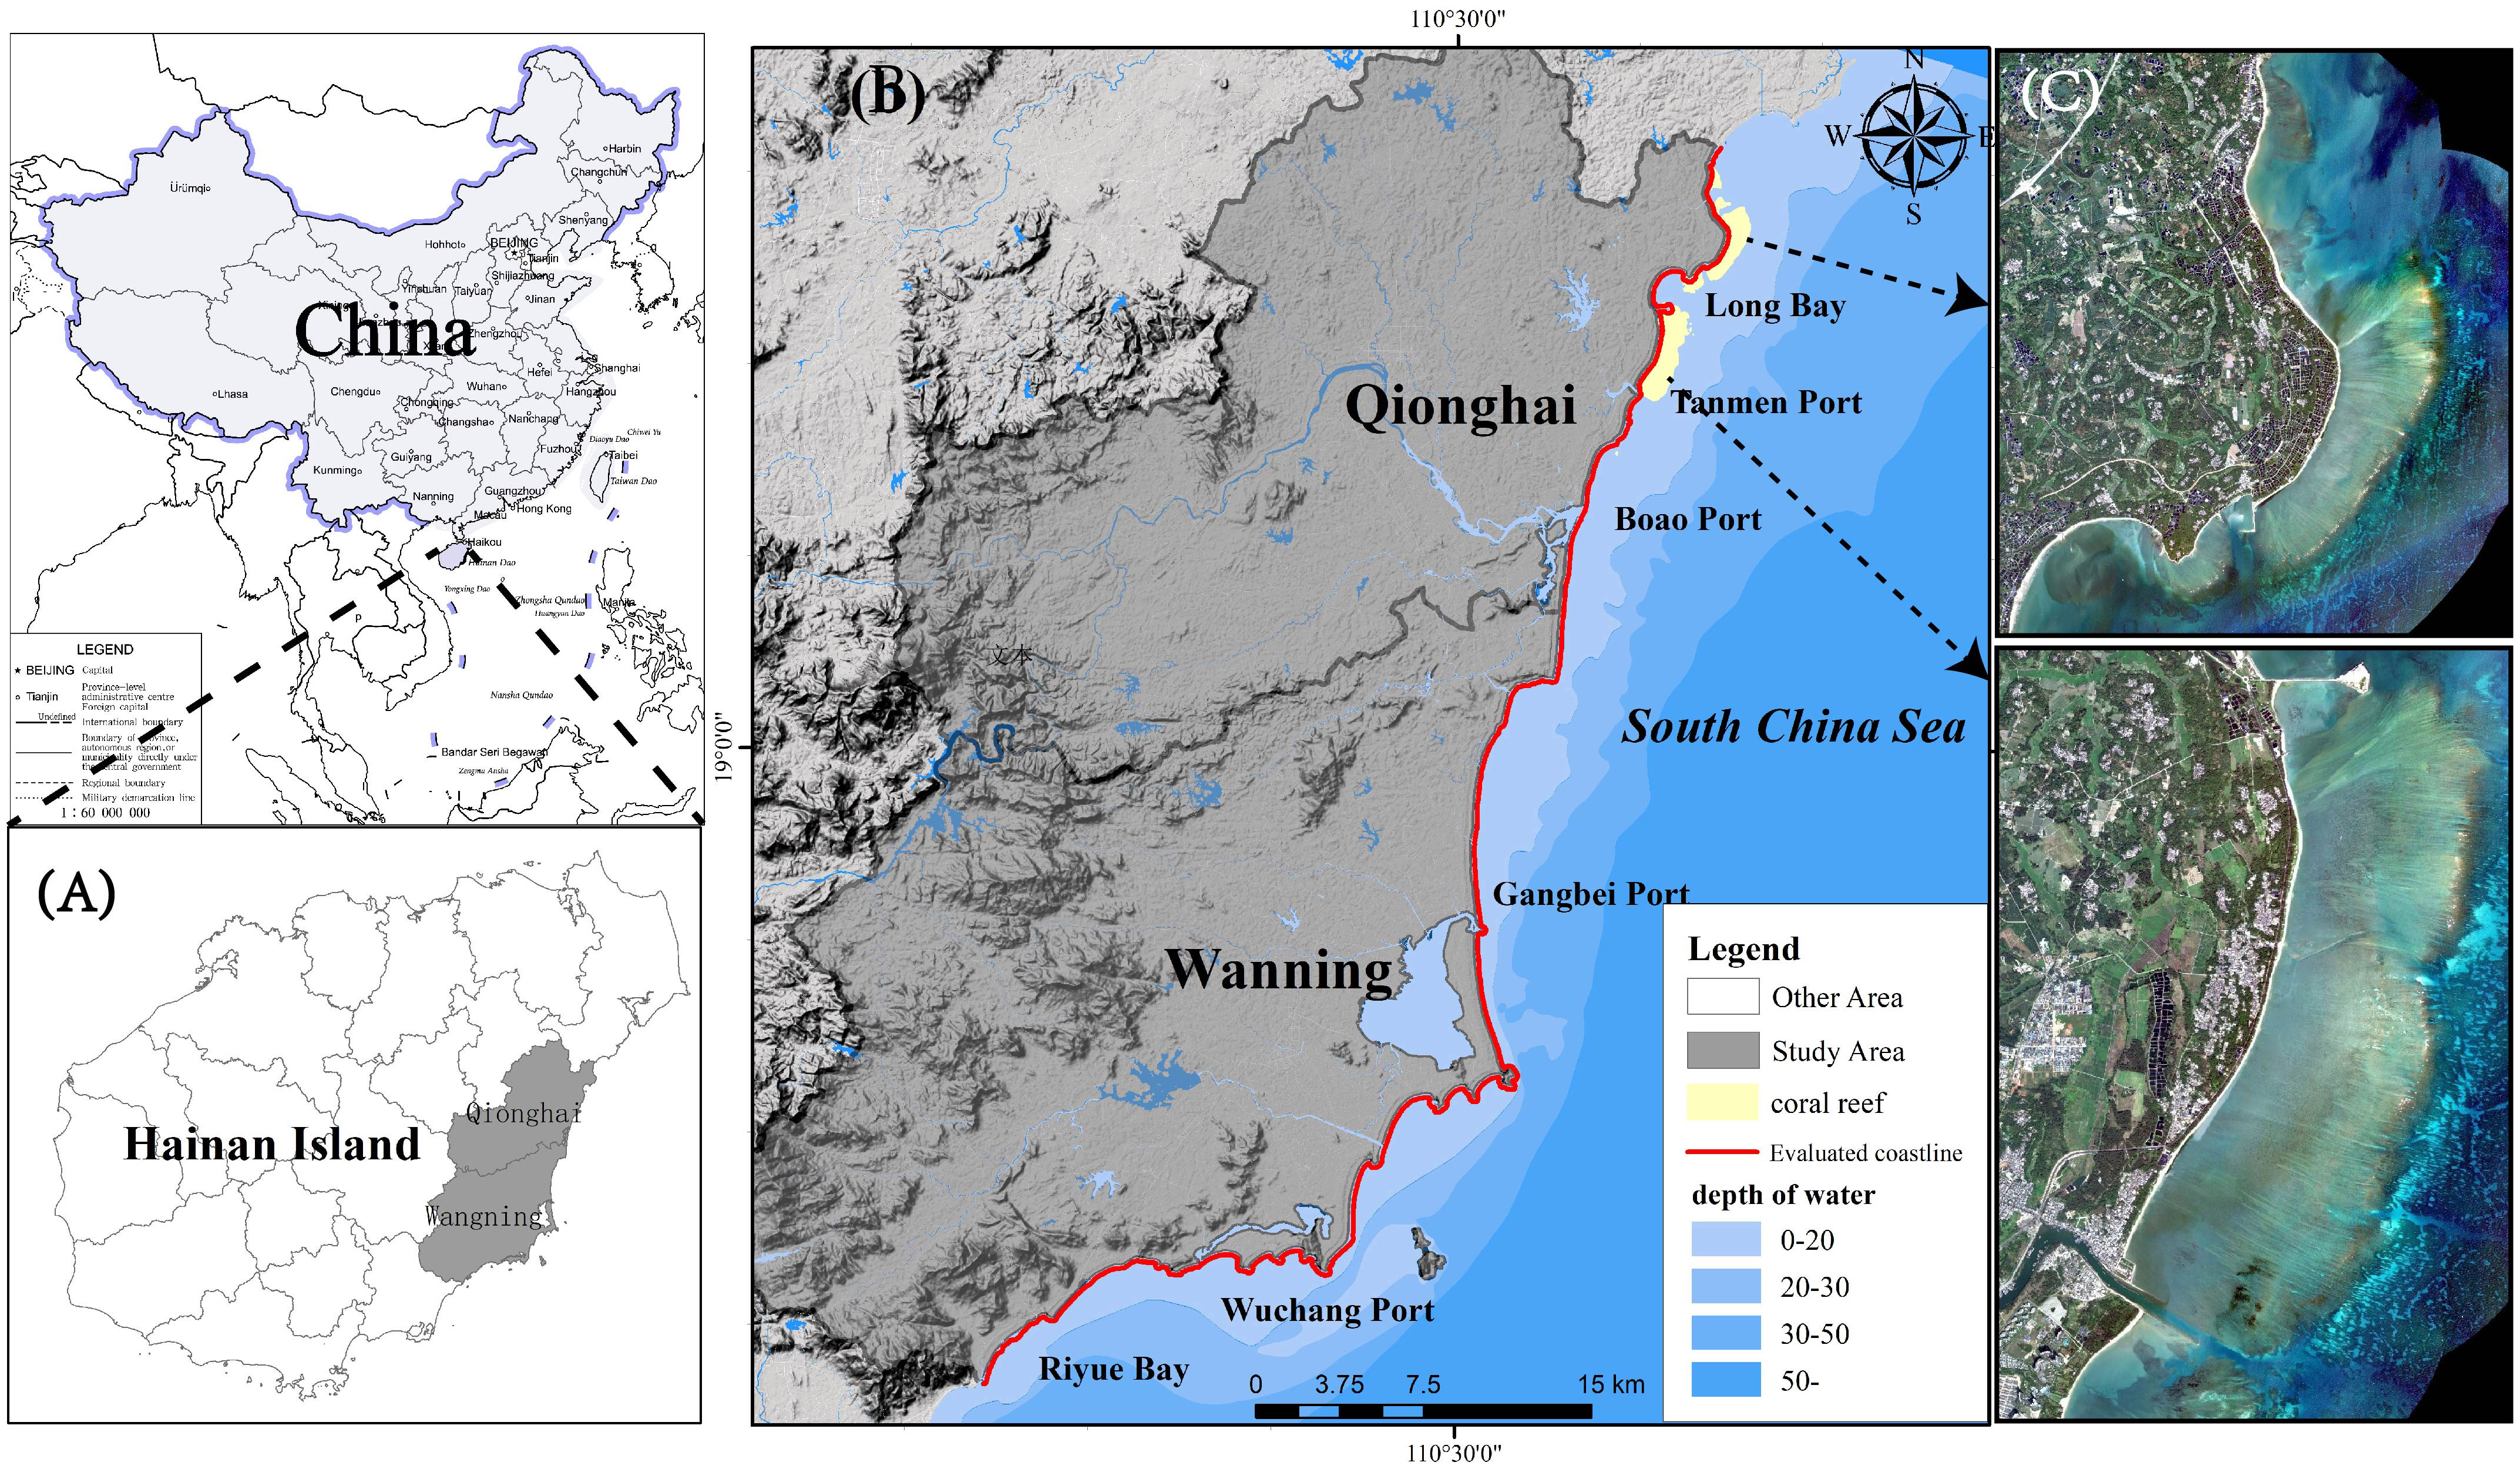
Figure 1 (A) Study area located on the Qionghai-Wanning coast of eastern Hainan (B) Images based on satellite images from China, The assessed coastline is the outer coastline of Qionghai-Wanning. (C) High-resolution remote sensing images of coral fringing reef with a resolution of 0.68 m.
In the 1970s and 1980s, the coastal erosion of Hainan Island already affected approximately 53% of the coastline (Xia et al., 1993), and in the 1990s, the eroded coast of Hainan increased to 71.9%, and there were 64 eroded coasts on the whole island, and erosion was strong. There were 7 shore sections, of which 3 were located in the strongly eroded section of the study area, accounting for approximately 42.8%. Coastal erosion has become the most important disaster problem on the coast of Hainan Island, and the study area is the hardest hit area of coastal erosion (Chen et al., 2010b). Research analysis has shown that intensified human activities, such as the construction of reservoirs in the upper reaches of the river, the dredging of riverbeds and coasts, the mining of coral reefs and beach rocks, and various coastal projects, combined with frequent typhoons and other severe marine weather scouring the coast, are the main reasons causing the increasing coastal erosion on Hainan Island (Ji et al., 2007). According to the survey and statistics, the coverage rate of live coral in the study area declined from 32.2% in 2004 to 6.67% in 2018 (Huang et al., 2019), resulting in a great change in the structure of the biological community. Thus, the coast of Qiongdong, Hainan, is suffering from severe coastal erosion.
3. Materials and methods
3.1. Establishment of the evaluation index system
The construction of the evaluation index system comprehensively considers the principles of special regionality, coastal erosion correlation and data extractability and is mainly selected from coastal morphology, coastal dynamics, and socioeconomic and human activity factors. Coastal morphology is the direct bearer of the impact of erosion and is an internal characteristic of the coast, while the dynamic changes in the ocean are the direct external manifestation of the impact of erosion, which is an external featureMattei (Mattei et al., 2018), and socioeconomic and human activities are the driving factors for the occurrence of erosion.
The coastal dynamic characteristics of the coast are reflected from the beach in the supratidal zone, the shoreline in the intertidal zone, and the nearshore waters in the subtidal zone. Intuitive factors, such as the change rate of the shoreline (U1) and the interannual downward rate erosion of the beach (U3), are the most intuitive factors that can be used to characterize the dynamic evolution of the coast. Additionally, the construction of breakwaters, ports and erosion protection walls have prevented the further erosion and retreat of the shoreline to a certain extent, and coastal erosion has shifted into the downward erosion of the underwater bank slope, causing the erosion of the isobath line to approach the shore. Therefore, the rate of change of the isobath (U2) can be used to characterize the erosion of the underwater bank slope. Coastal morphological characteristics are the characteristics of the current state of the coast. Different coastal morphological characteristics bear different degrees of coastal erosion. Coast type (U4), beach width (U5), and beach slope (U6) are the basic components of coastal morphology. Socioeconomic and human activities have a greater impact on the change in coastal appearance, which in turn affects the degree of coastal erosion. Coastal socioeconomics is directly reflected by the degree of coastal development (U7), and the density of human activities (U8), which can indirectly indicate human activities. The evaluation system was constructed by obtaining the index values of each factor from each evaluation unit c1-c29 (Figure 2A) (Cai et al., 2019).
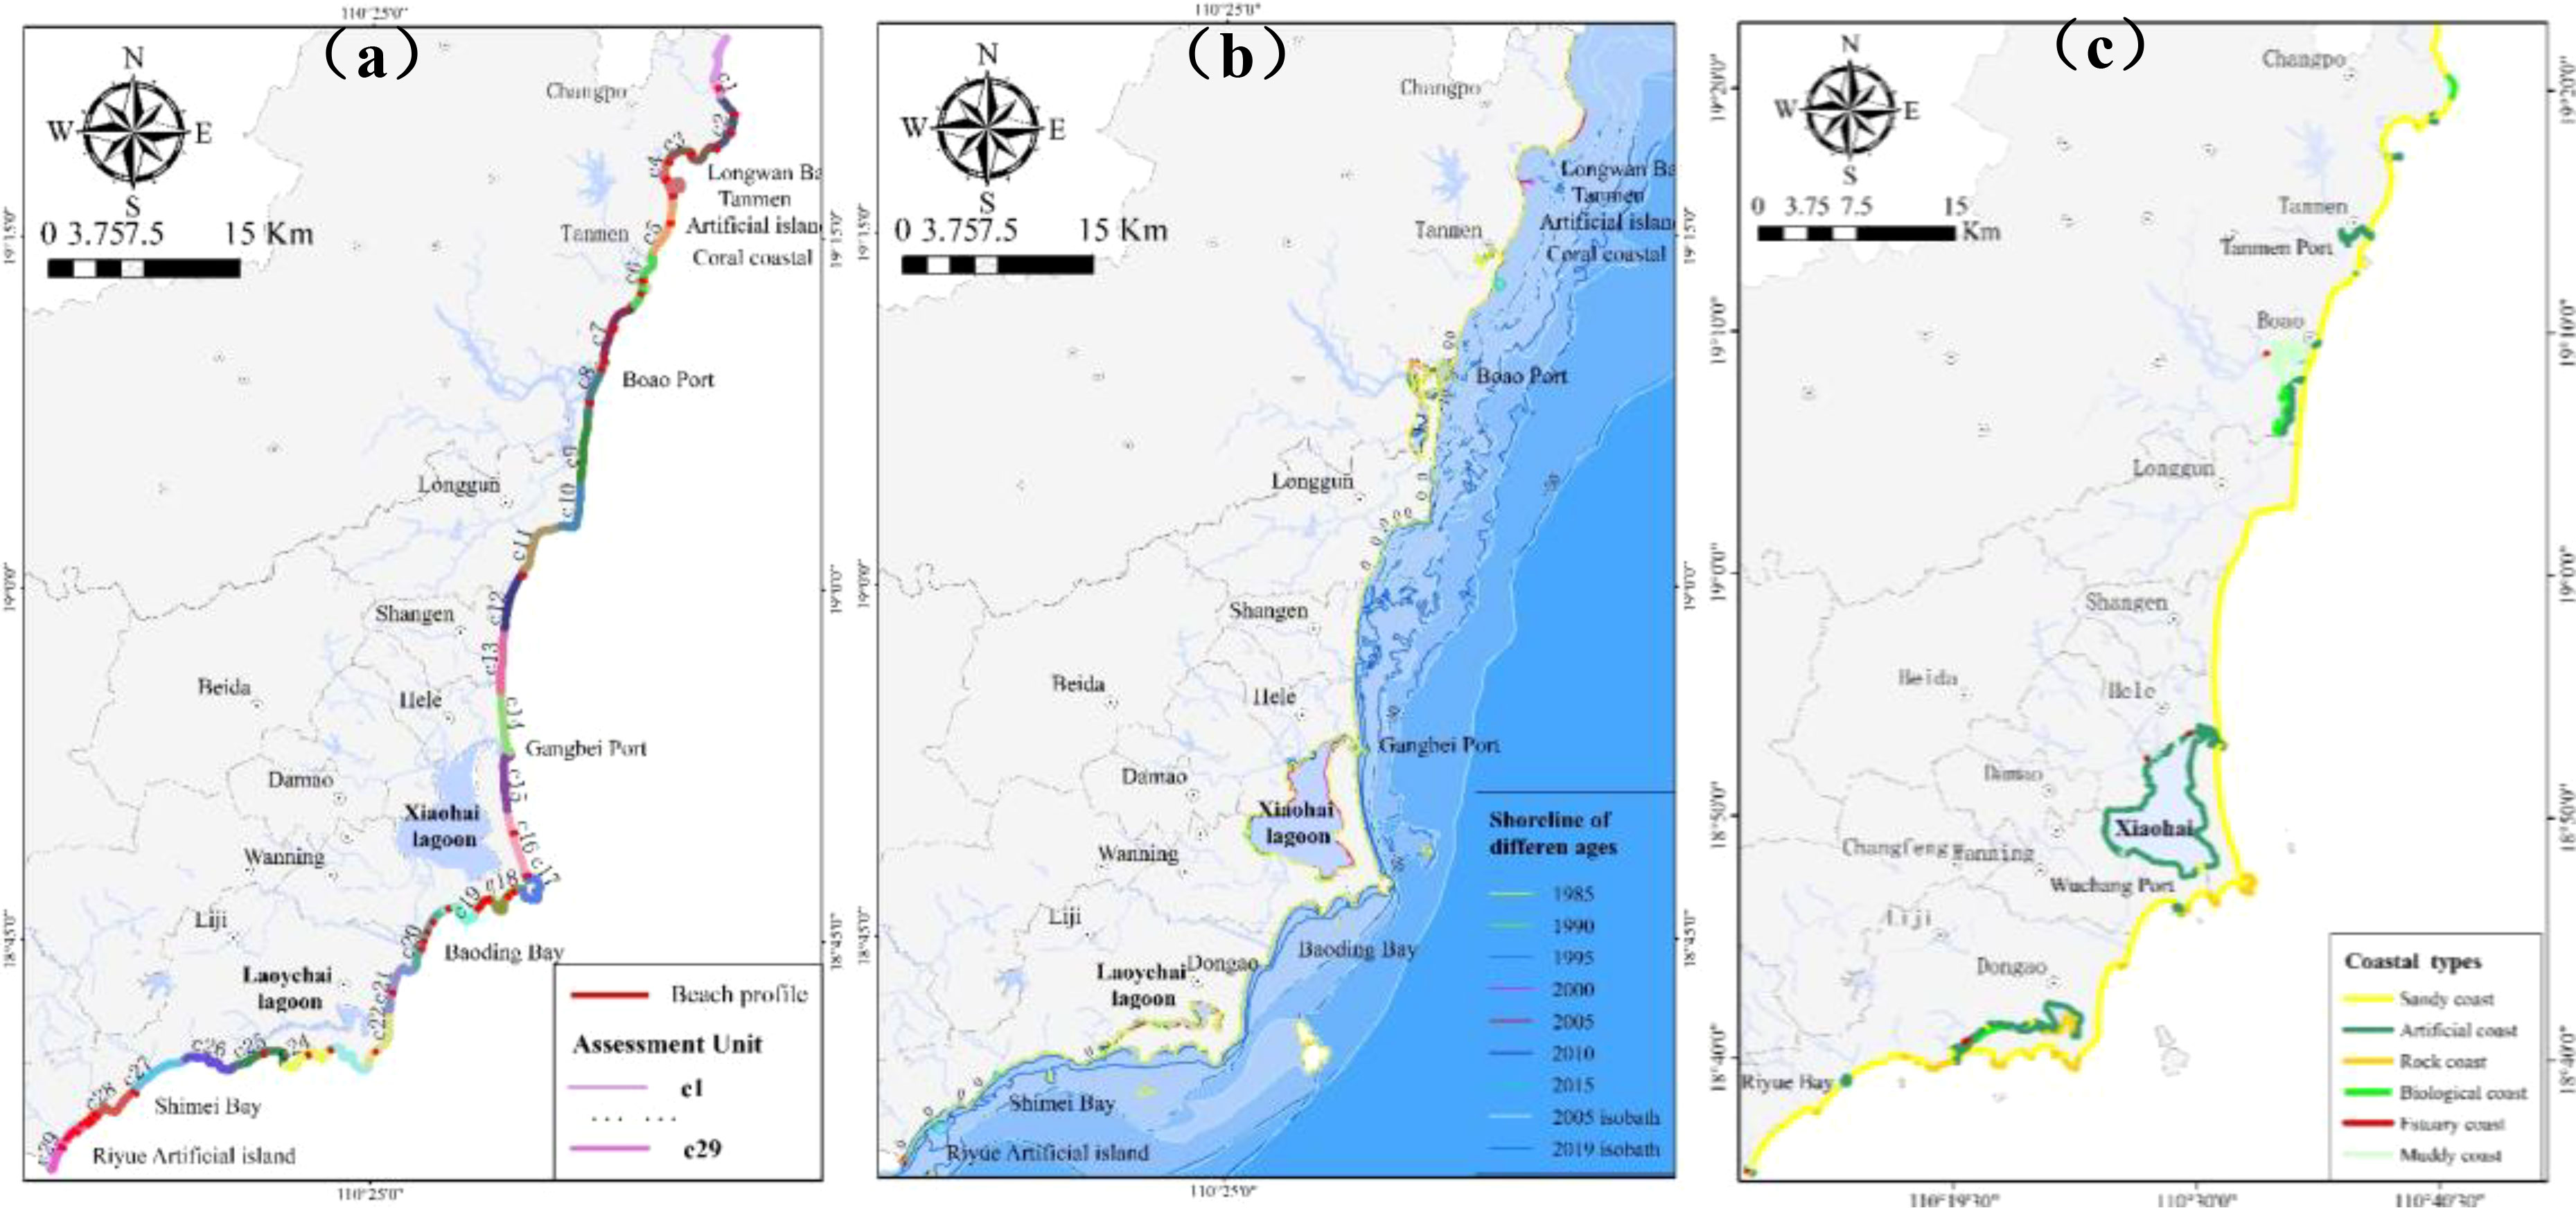
Figure 2 Evaluation factor index element distribution map. (A) Qionghai-Wanning vulnerability assessment unit division map. (B) Distribution map of coastlines in 7 periods from 1985 to 2015 and isobath distribution map from 2005-2019. (C) Qionghai-Wanning 2021 coastline type.
(1) U1
Multispectral remote sensing images are widely used in coastal resource surveys and dynamic evolution studies, and for coastline extraction, they have the advantages of large-scale and rich spectral features (Boak and Turner, 2005). To reduce the interpretation errors caused by remote sensing images of different resolutions and different time periods, this paper adopted Google Earth satellite images with the same resolution and the same season and selected the years 1985, 1990, 1995, 2000, 2005, 2010 and 2015, for a total of 7 time periods of remote sensing image data (Figure 2B), with a resolution of 16.8 m. Visual interpretation was used to extract the coastlines of each year based on the waterline (Alberico et al., 2012; Yang, 2013). The shoreline change rate adopted the LRR method provided by the digital coastline analysis system DSAS4.3 (http://woodshole.er.usgs.gov/project-pages/dsas/) (Deepika et al., 2013), starting from the northernmost part of the Qionghai administrative boundary. At the starting point (110°40’15” E, 19°21’32” N), a section was generated every 50 m, and a total of 2,910 cross-sections were used to analyze the changes in the Qionghai-Wanning coastline. The calculated value was negative, indicating that the coast was eroded, while a positive value would indicate that the coast was silted up (Table 1).
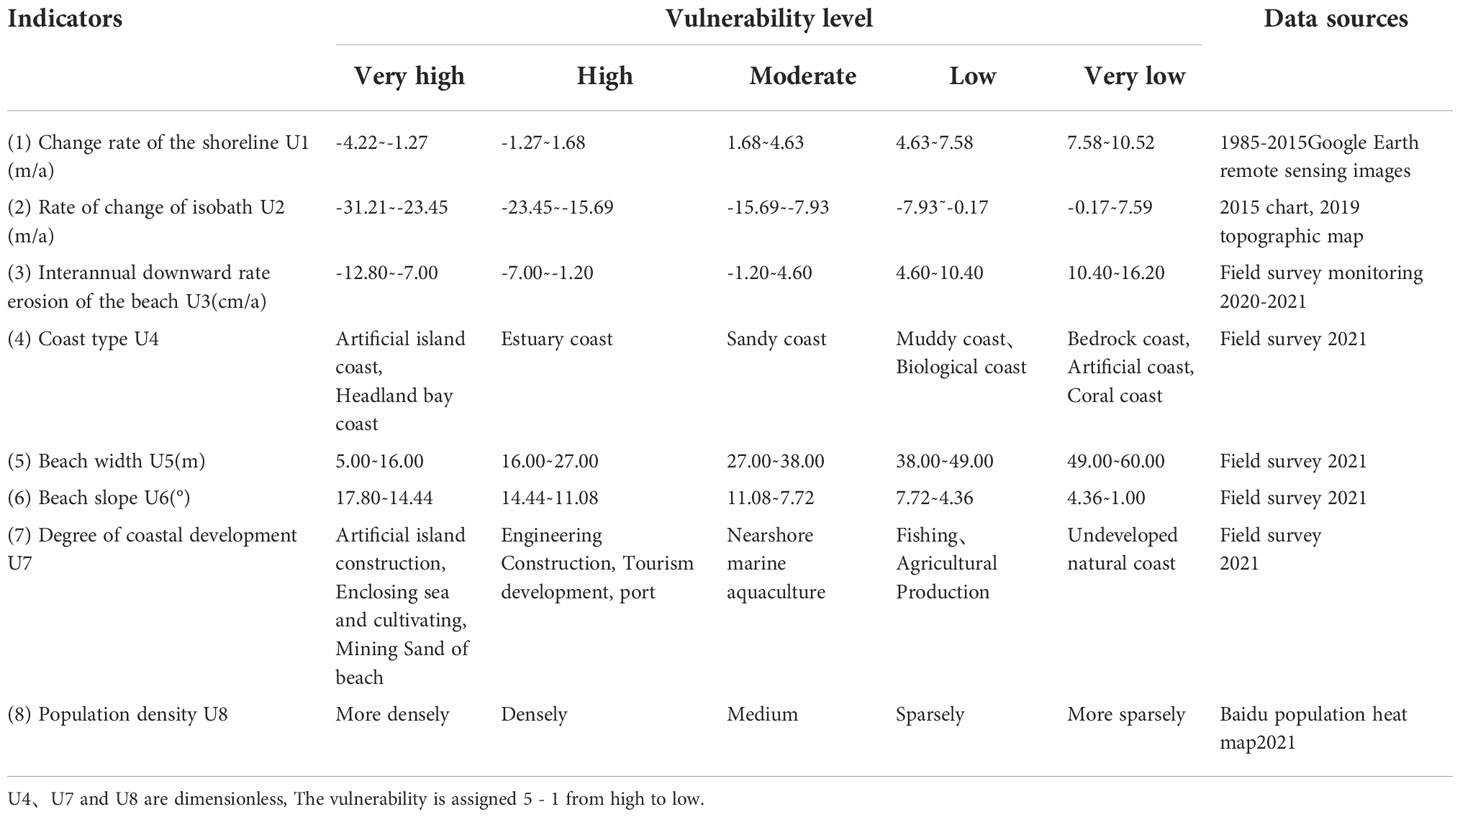
Table 1 Assessment indicator vulnerability grading scale.
(2) U2
We compared and analyzed the erosion and deposition of the shallow seabed by collecting multiple periods of charts or isobath data in topographic maps. This paper used the 2005 nautical chart and the 2019 1:50,000 topographic map isobath 2 data (Figure 2B), additionally, the LRR method in the DSAS plug-in was used to calculate the 20-m isobath changes from 2005-2019 (Table 1).
(3) U3
The direct manifestation of coastal erosion is that in addition to shoreline retreat, downward rate erosion of beaches is an important manifestation and a critical factor in vulnerability assessment. However, at present, many scholars have not considered and analyzed the vertical erosion and siltation changes of the beach due to the large assessment scope and the lack of long-term continuous monitoring, which makes the vulnerability assessment results unrepresentative. In this paper, the monitoring data of 44 beaches in the Qionghai-Wanning coastal zone were used to calculate the interannual erosion and silting rate of each beach through interannual monitoring. If there was no beach, such as bedrock and artificial shoreline, the erosion rate of the beach was 0. This is the first assessment to incorporate the interannual downward rate erosion of beaches into the vulnerability assessment system, making the assessment results more scientific and representative (Table 1).
(4) U4
The coast itself is the direct bearer of coastal erosion, the study area has typical coral reef coast, cape bay coast, estuary coast, artificial island coast, etc. and different coast types have different degrees of erosion vulnerability. Such as coral reef coast, A large amount of coral reef debris is washed and deposited on the bank by the tide to form a coral reef beach (Figure 3A), which can dissipate wave energy and protect the beach from erosion. At the same time, the length, width, coarse rate and water depth of the fringing reef also have a great effect on wave energy dissipation, therefore, the coral reef coast has a low degree of vulnerability. In addition, the corresponding erosion vulnerability of coastal types, such as estuaries, artificial islands, and ports, presents different states (Figures 3B, C). The coast type data come from the field survey measurement data of the study area in 2021 (Figure 2C). Since the coastline type is dimensionless, the weights of erosion and siltation effects are assigned according to different coastline types (Table 1).
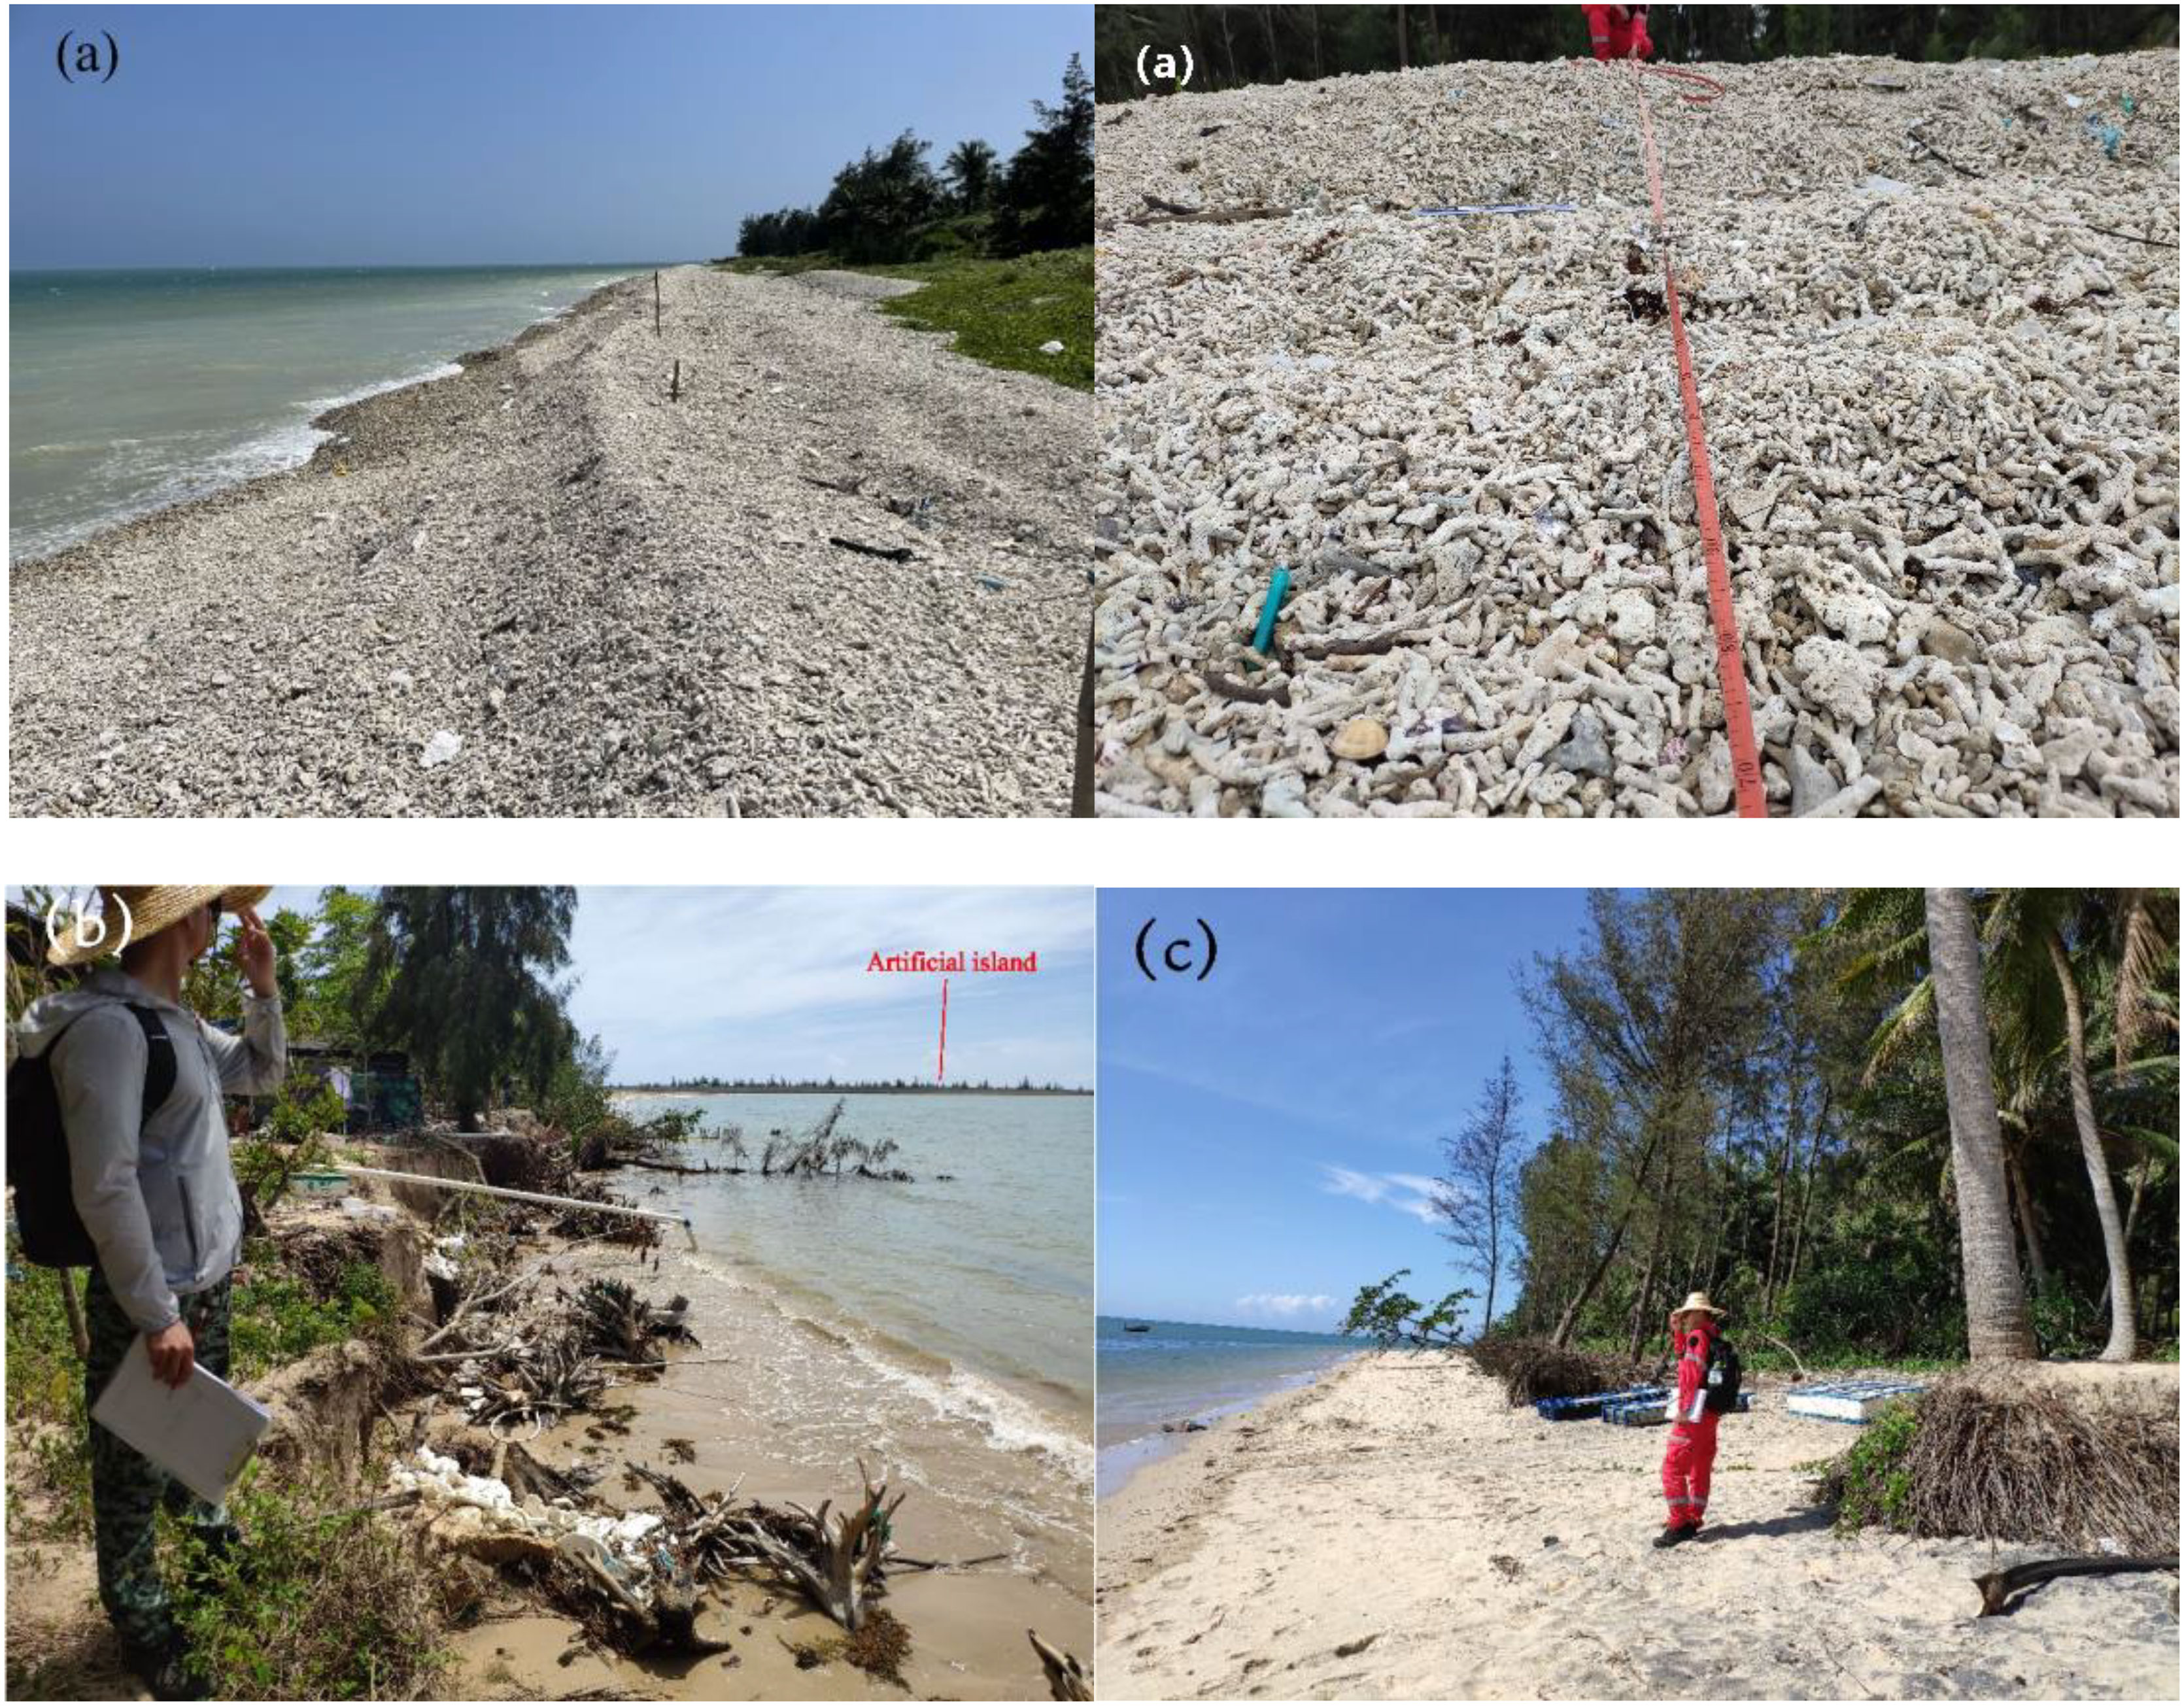
Figure 3 (A) In coral reef shores, coral detritus is washed ashore and deposited to form a reef beach. (B) Coastal erosion scarps on artificial island coast. (C) Straight shore erosion.
(5) U5
The beach width is characterized by the distance between the water edge and the grass edge or the shelterbelt; the smaller the width of the beach is, the greater the energy of tidal water scouring the beach, the higher the degree of erosion and retreat of the corresponding shoreline, and the higher the vulnerability. Wider beaches often fail to scour vegetation slopes and have a larger distance for buffering and releasing energy, so their vulnerability is relatively low. The beach width data in this paper were obtained from a field survey of the field research area in 2021 (Table 1).
(6) U6
The greater the slope value of the beach is, the stronger the scouring ability of the waves to increase water and climb the slope, and the corresponding erosion vulnerability is larger and vice versa. The beach slope data were derived from field survey measurement data in the study area in 2021. If there were several survey points in a unit, the average value of the beach slope recorded at each survey point was taken as the slope value of the section (Table 1).
(7) U7
The socioeconomic development and construction of coastal areas also enhances the degree of vulnerability to coastal disasters, making the degree of coastal development an indispensable factor in vulnerability assessment (Dolan and Walker, 2006; Bathi and Das, 2016; Hoque et al., 2019; Alam et al., 2020). The degree of coastal development mainly refers to the status quo of coastal utilization and development, including tourism development, aquaculture development, port and dam construction, man-made engineering construction and development. The higher the degree of development is, the higher the corresponding vulnerability index (Table 1).
(8) U8
The density of human activities is represented by the density of human activities on different coasts in the same time period or in a specific time period. The rapid growth of coastal populations and changes in natural habitats have brought greater pressure on coastal land, and the degree of vulnerability has gradually increased; in contrast, natural coasts with less human activities have better coastal beaches and environments, and their vulnerability is lower (Parvin et al., 2008; Appeaning, 2013; Narra et al., 2019). There are different anthropogenic activities, such as fishing activities, tourism, and resident population activities, along the coast of the study area. The data were obtained through the Baidu population heatmap to obtain the relative activity data of the Qionghai-Wanning coastal population in the same time period to characterize the anthropogenic activity density (accuracy is 1 km) and assign values to different personnel densities (Table 1).
3.2. Index weights and evaluation methods
In a multi-indicator evaluation decision, it is necessary to prioritize indicators and find the advantage or weight level of each indicator relative to other indicators to achieve a more accurate evaluation goal. Various commonly used methods in verifying effectiveness include the AHP (Mosadeghi et al., 2015; Cabrera and Lee, 2019; Saffaria et al., 2020), maximum entropy model (MAXENT) (Cabrera and Lee, 2020), rank weight method (Alam et al., 2020), proportional weight method (Dou et al., 2017), fuzzy analytic hierarchy process method (Wijitkosum and Sriburi, 2019), and fuzzy logic method (Hoque et al., 2021a), and Cabrera and Lee showed that the AHP method was a reliable method in vulnerability assessment research based on multiple indicators. In this study, a combination of DM and TEM methods was used to analyze and calculate the index weights.
(i) In the DM method, the consistency ratio (CR) was introduced as a reliable index for judging the consistency of the matrix to overcome the randomness in the index judgment process (Saaty, 1980). The CR represents the comparison between the consistency index (CI) and the random consistency index (RI). When CR<0.1, the corresponding judgment matrix is acceptable for the AHP method, and if CR>0.1, the judgment matrix is readjusted.
The calculation formula of DM is as follows:
(1) where λmax is the largest eigenvalue of the n-order judgment matrix, n is the number of evaluation indicators. (2) where is the average value of the maximum eigenvalues of the n-order random positive and negative square matrix.
The TEM calculation formula is as follows:
Where constant k=1/ln(n) in (4), m is the number of factor indicators, n is the number of evaluation units. 0≤ai ≤ 1, =1.
The comprehensive weight values of the indicators calculated based on the DM and TEM are shown in Table 2.
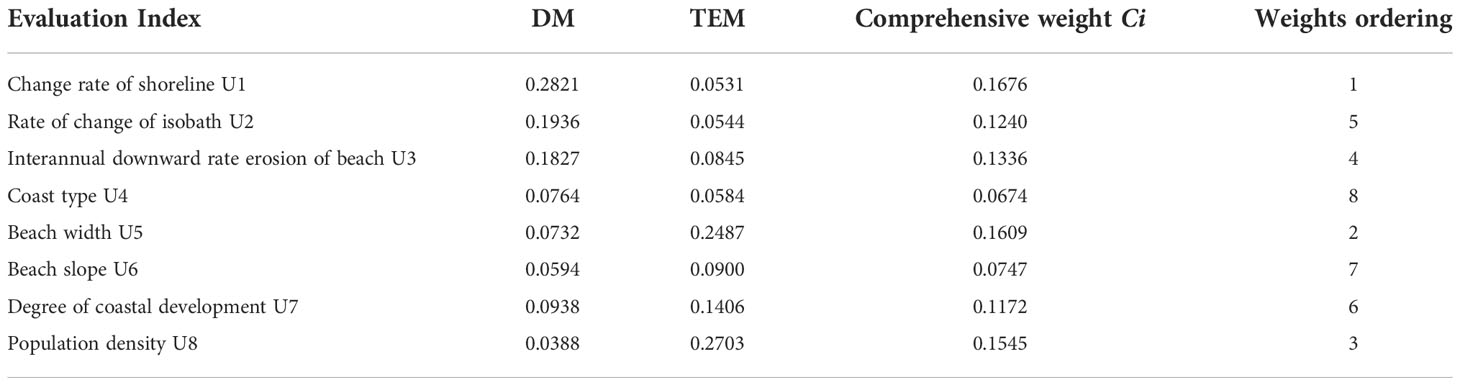
Table 2 Index weight value of coastal erosion vulnerability assessment.
The CVI has two mathematical calculation methods: one is to find the square root of the “product”, and the other is to weight the “sum”. When the weight of each indicator can be determined, the weighted summation method is adopted (Liu et al., 2013), and the formula is as follows:
In the (7), Pi is the quantitative grading value of each evaluation index, and Ci is the weight value corresponding to the index.
4. Results
4.1. Temporal and spatial distribution characteristics of erosion and siltation
4.1.1. Spatial distribution characteristics of erosion and siltation
In 2021, there were 37 eroded shore sections and 5 silted shore sections in the study area. The longest eroded section was located in Baoding Bay, south of Wanning Wuchang Port, with a length of 3.5 km, and the shortest was 37 m (Figure 4). The cumulative length of the eroded section in Qionghai-Wanning was approximately 26.12 km, accounting for approximately 17.96% of the total shore section. The accumulative length of the silted section was approximately 4.95 km, accounting for approximately 3.40% of the total shore section, and the stable section accounted for approximately 78.64% of the total shore section. The eroded shores were widely distributed and mostly occurred on the northern and southern coasts of the artificial island, as well as in headland bays, both sides of the estuary, and seaward protruding shores. Among them, erosion must occur on the coasts of headlands and artificial islands, and the degree of erosion was significantly stronger than that of the straight coast. The siltation section was less distributed and occurred in the inner side of artificial islands, in the angle between the harbor and the dam, and on the floodplain position of the estuary.
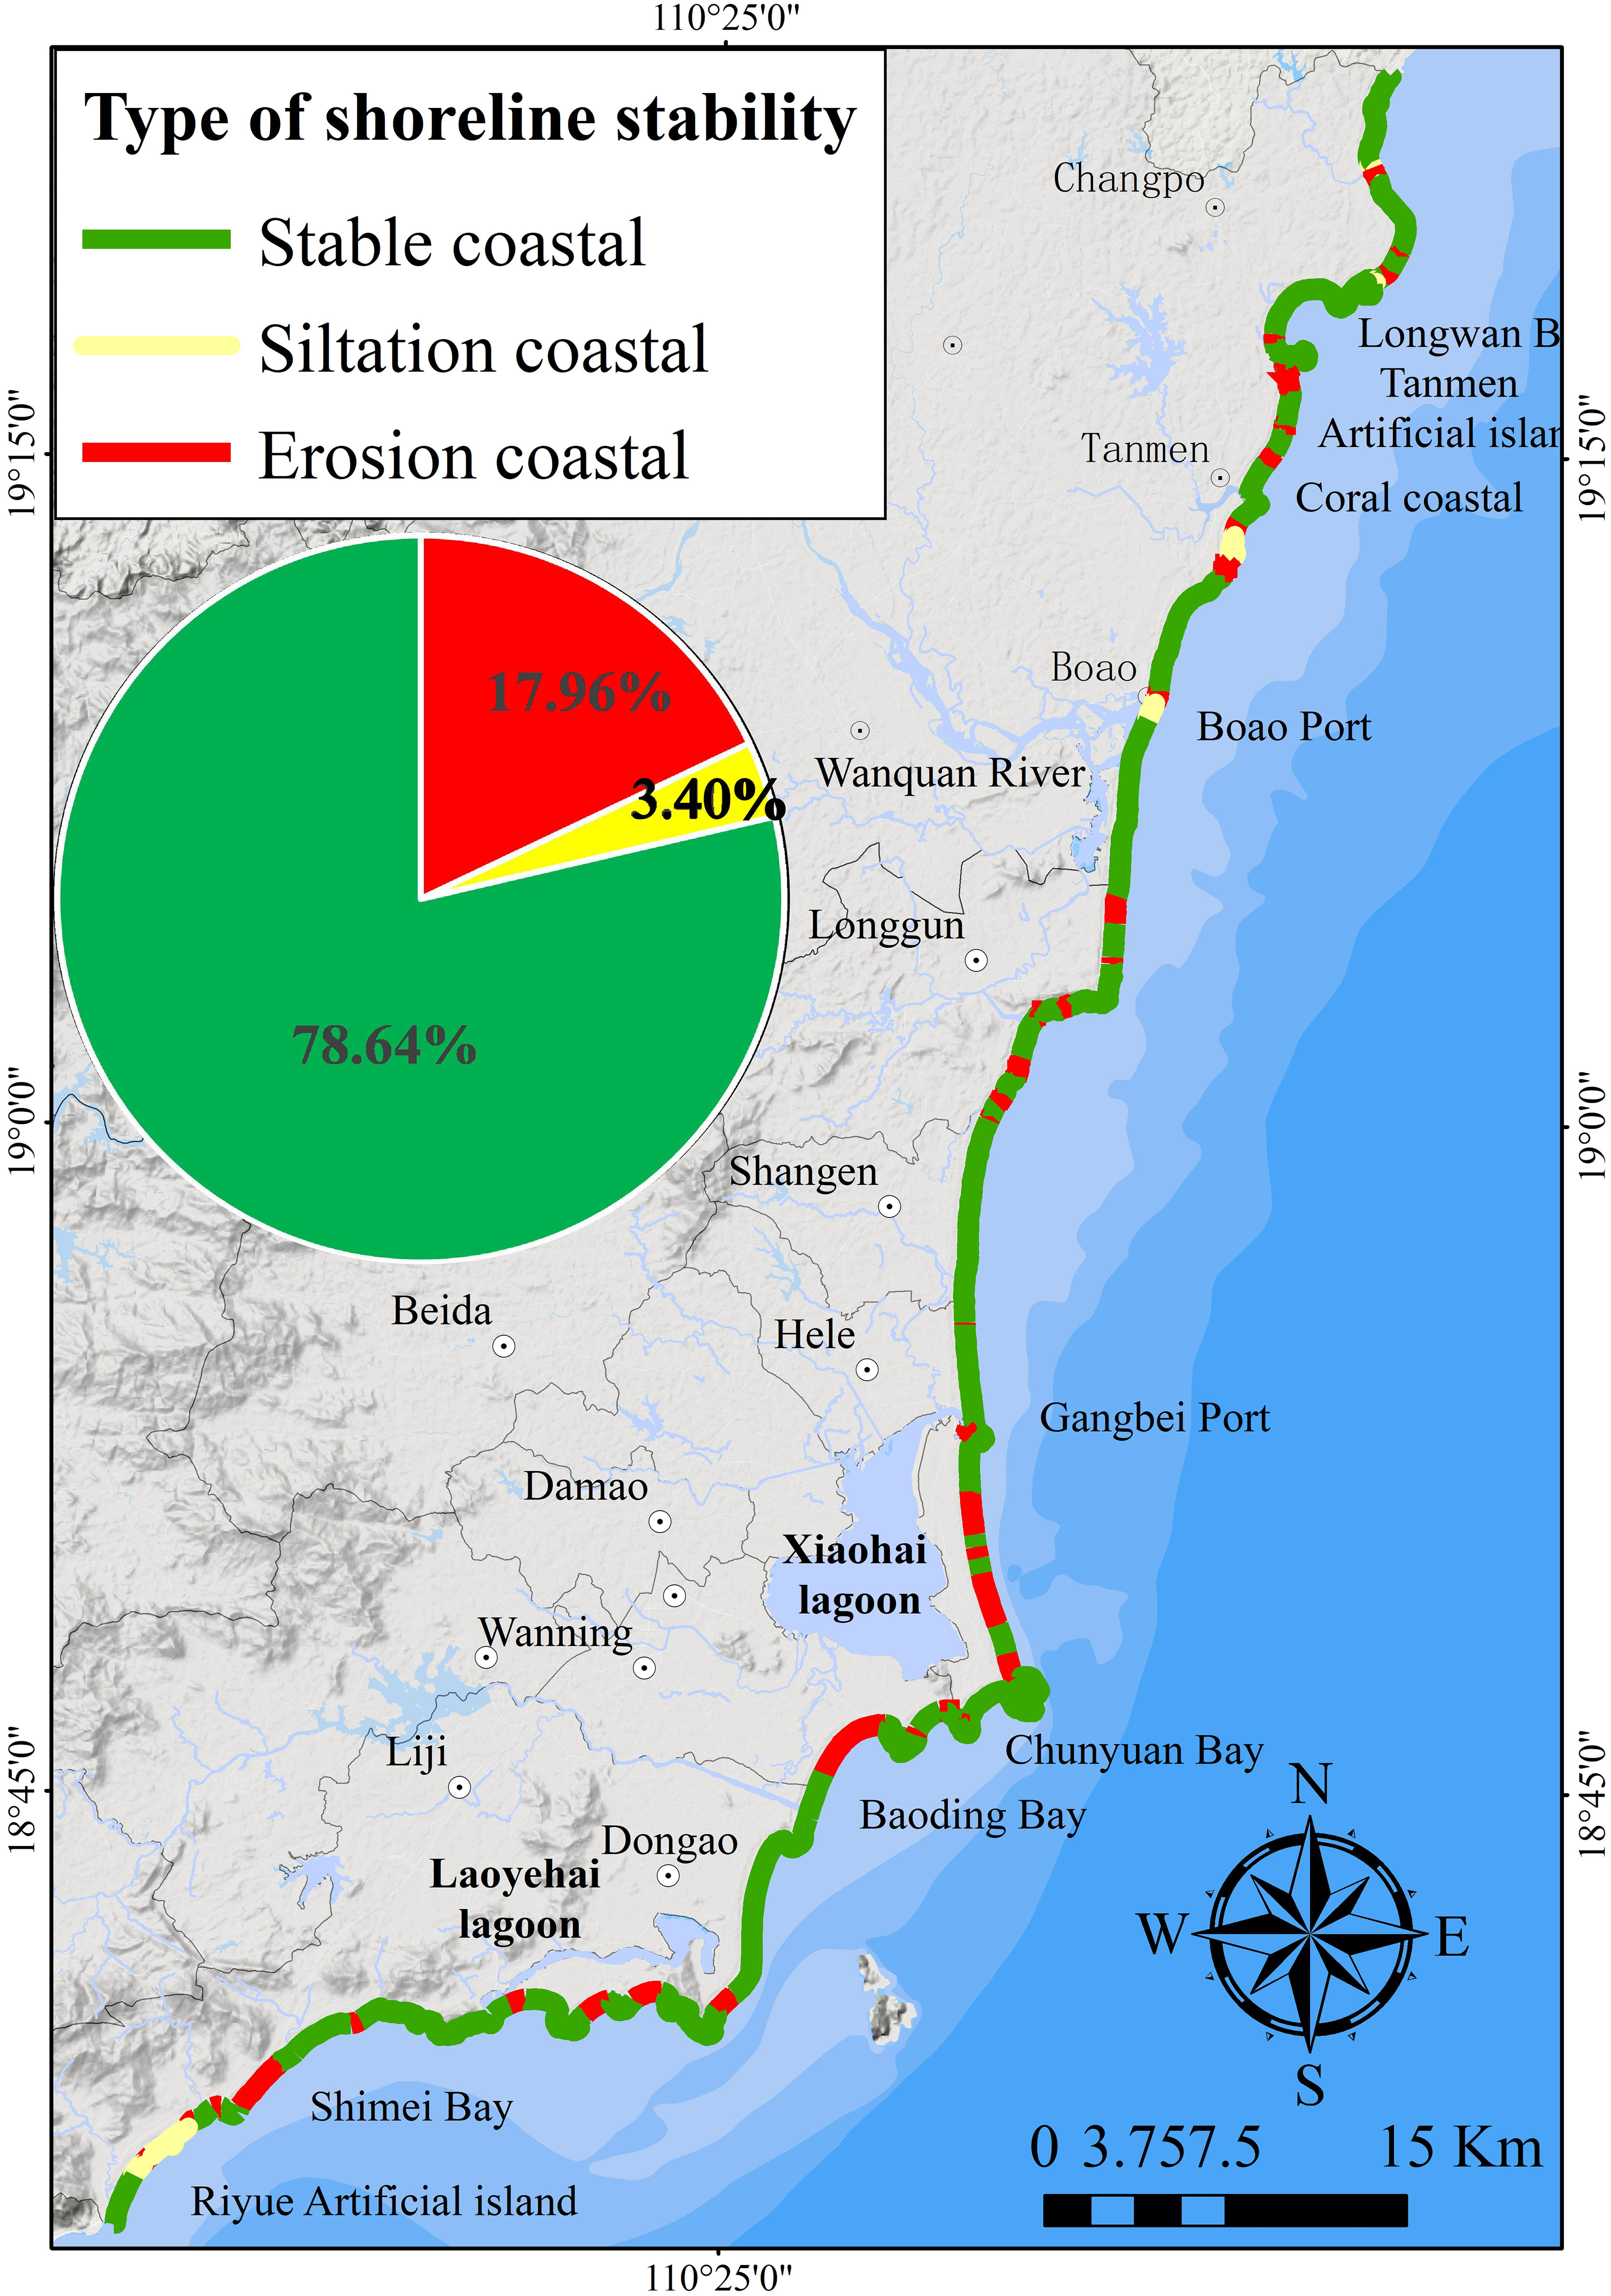
Figure 4 Spatial distribution map of coastal erosion and deposition in Qionghai-Wanning in 2021.
The monitoring results of the beach profile showed that most of the beaches are in a state of erosion, and the shore sections with relatively large downward erosion were mainly distributed in artificial islands, headlands and estuaries, such as Qionghai Longwan, Tanmen Artificial Island, Coral Island, and Riyue Island in Wanning. The maximum downward erosion rate was located at the jade belt beach of Wanquan Estuary, with a value of approximately -12.8 cm/a, followed by that in Riyue Bay in Wanning, showing a rate of decline of -10 cm/a.
4.1.2. Temporal distribution characteristics of erosion and siltation
The most direct characterization of coastal erosion and siltation is the advance and retreat of the coastline. From 1985 to 2015, 7 periods of remote sensing images were used to monitor the rate of change of the coastline and showed that (Figure 5), the Qionghai-Wanning coastal was in a state of weak siltation and erosion as a whole, and it was distributed throughout the northern and southern coasts of Qionghai-Wanning. Among them, the siltation rate of 0-6.29 m/a accounted for the largest proportion, approximately 50.15%, and was mainly distributed in the relatively straight sandy section, such as Gangbei port in the north section and the Wanquan River mouth in the north and south sections. Second, the weakest erosion rate was -0.99-0 m/a, accounting for approximately 39.54%, and these areas were mainly distributed along the coast of Shimei Bay, Riyue Bay and other cape bays in Wanning. The maximum erosion rate was -1.00~-7.58 m/a, accounting for approximately 6.77%, and these areas were mainly distributed in the Wanquan River estuary and the Tanmen artificial island section. The maximum rate of siltation on the coastline was 20.74-39.49 m/a, accounting for approximately 0.65%, and these sites were mainly north of Longwan Port. From the 1990s to the early 2000s, villagers reclaimed and built ponds in the shallow coral reef area and continuously reclaimed them to the sea, making the coastline advance to the sea at an increasing rate. Moreover, the construction of impervious roads connecting the artificial islands to the islands increased the artificial coastline, which also had a significant impact on coastal erosion and siltation.
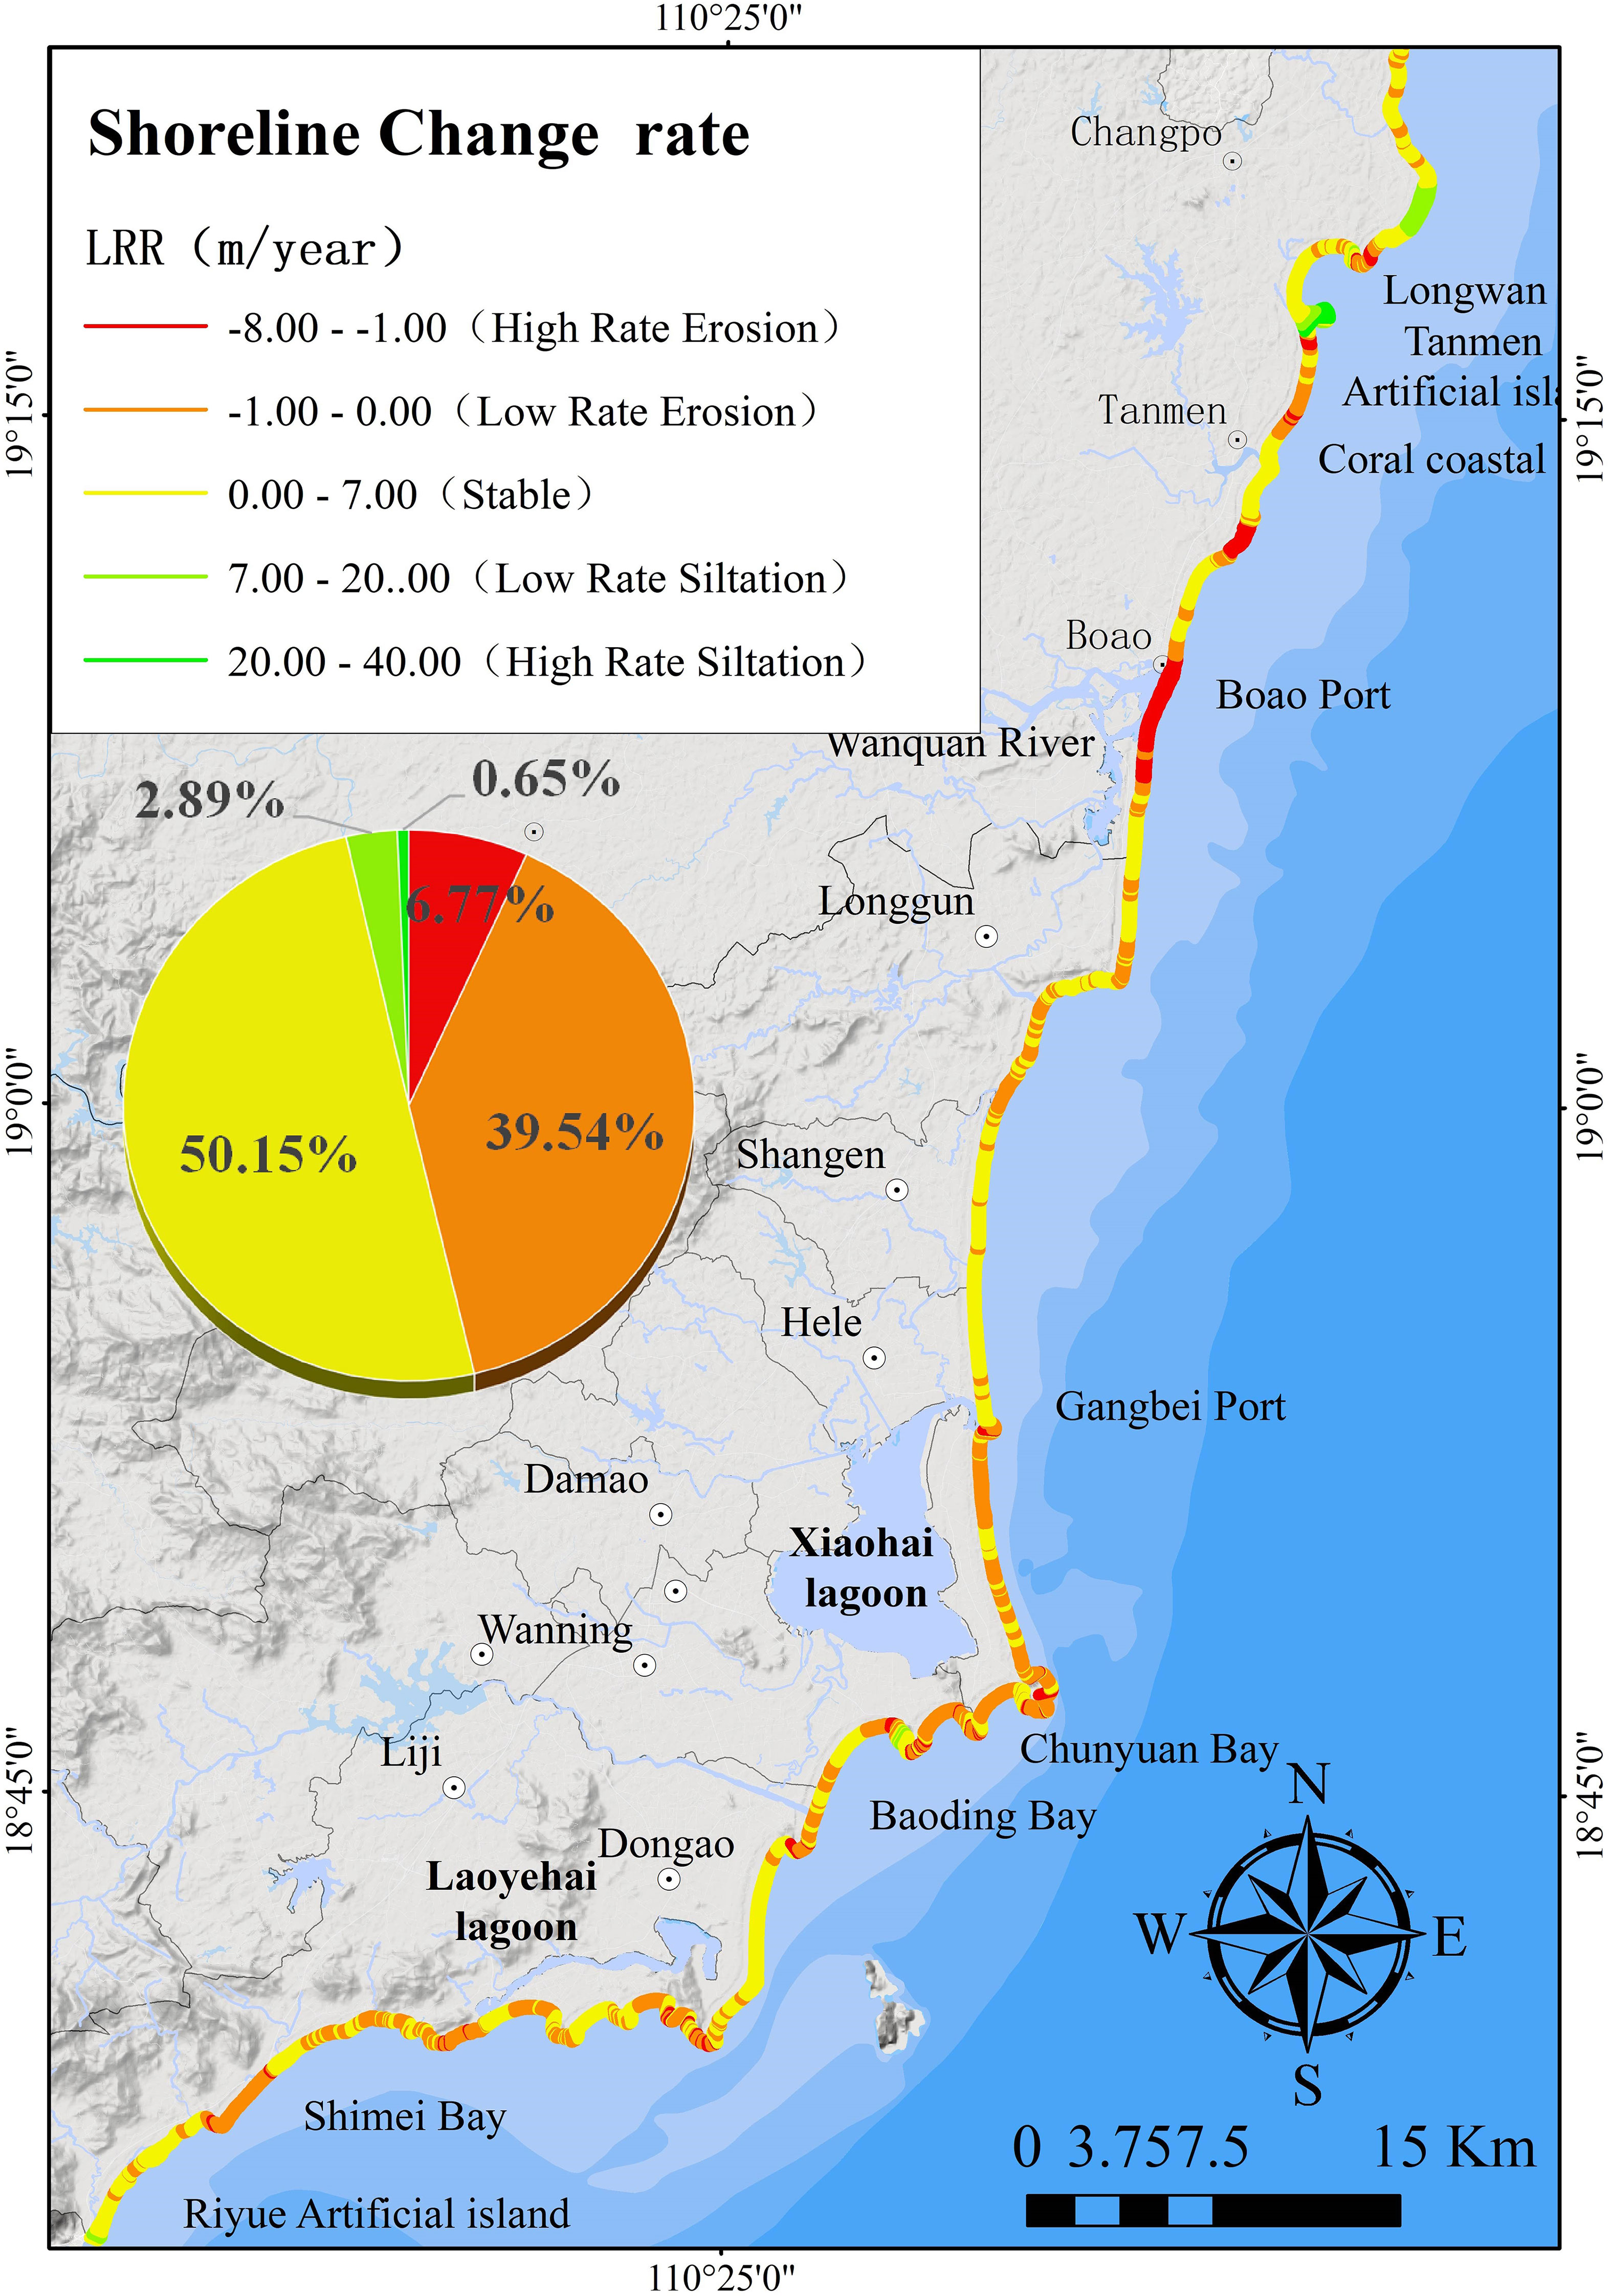
Figure 5 Distribution characteristics and proportion of Qionghai-Wanning coastline change rate from 1985 to 2015.
4.2. Characteristics of coastal erosion vulnerability
4.2.1. Spatial distribution characteristics of coastal erosion vulnerability
The erosion vulnerability assessment results are shown in Figure 6. Most of the coastal erosion in Qionghai-Wanning is in a state of moderate vulnerability or above, accounting for approximately 59% of the total shore section, of which the vulnerability of high and above exceeds 31%, including 2 with very high vulnerability and 7 with high vulnerability. The very high vulnerability was distributed in the Wanquan Estuary of Qionghai and the nearby coasts to the south. The high vulnerability was distributed in some capes and estuaries, such as to the south of the Wanquan estuary and on the nearby shores of Wanning Shimei Bay, while a small part of the straight coasts had a higher vulnerability status. 8 locations had moderate vulnerability, accounting for approximately 28%, and the sites were relatively scattered, mainly distributed in some inner bays of the headlands, such as Wanning Dongwo Bay and Shimei Bay. There were 12 places with low vulnerability and below, including 3 places with low vulnerability and 9 places with very low vulnerability, accounting for approximately 41% of the Qionghai-Wanning coast, and these sites were mainly distributed in the coral reef area to the north of Tanmen Port, the headlands formed by various bedrocks, such as Wanning Dahuajiao, Shimeiwan headland, and the coasts where bedrock and sand alternately appear. Areas with hard engineering, such as port terminals and damp-proof gates also had a lower vulnerability.
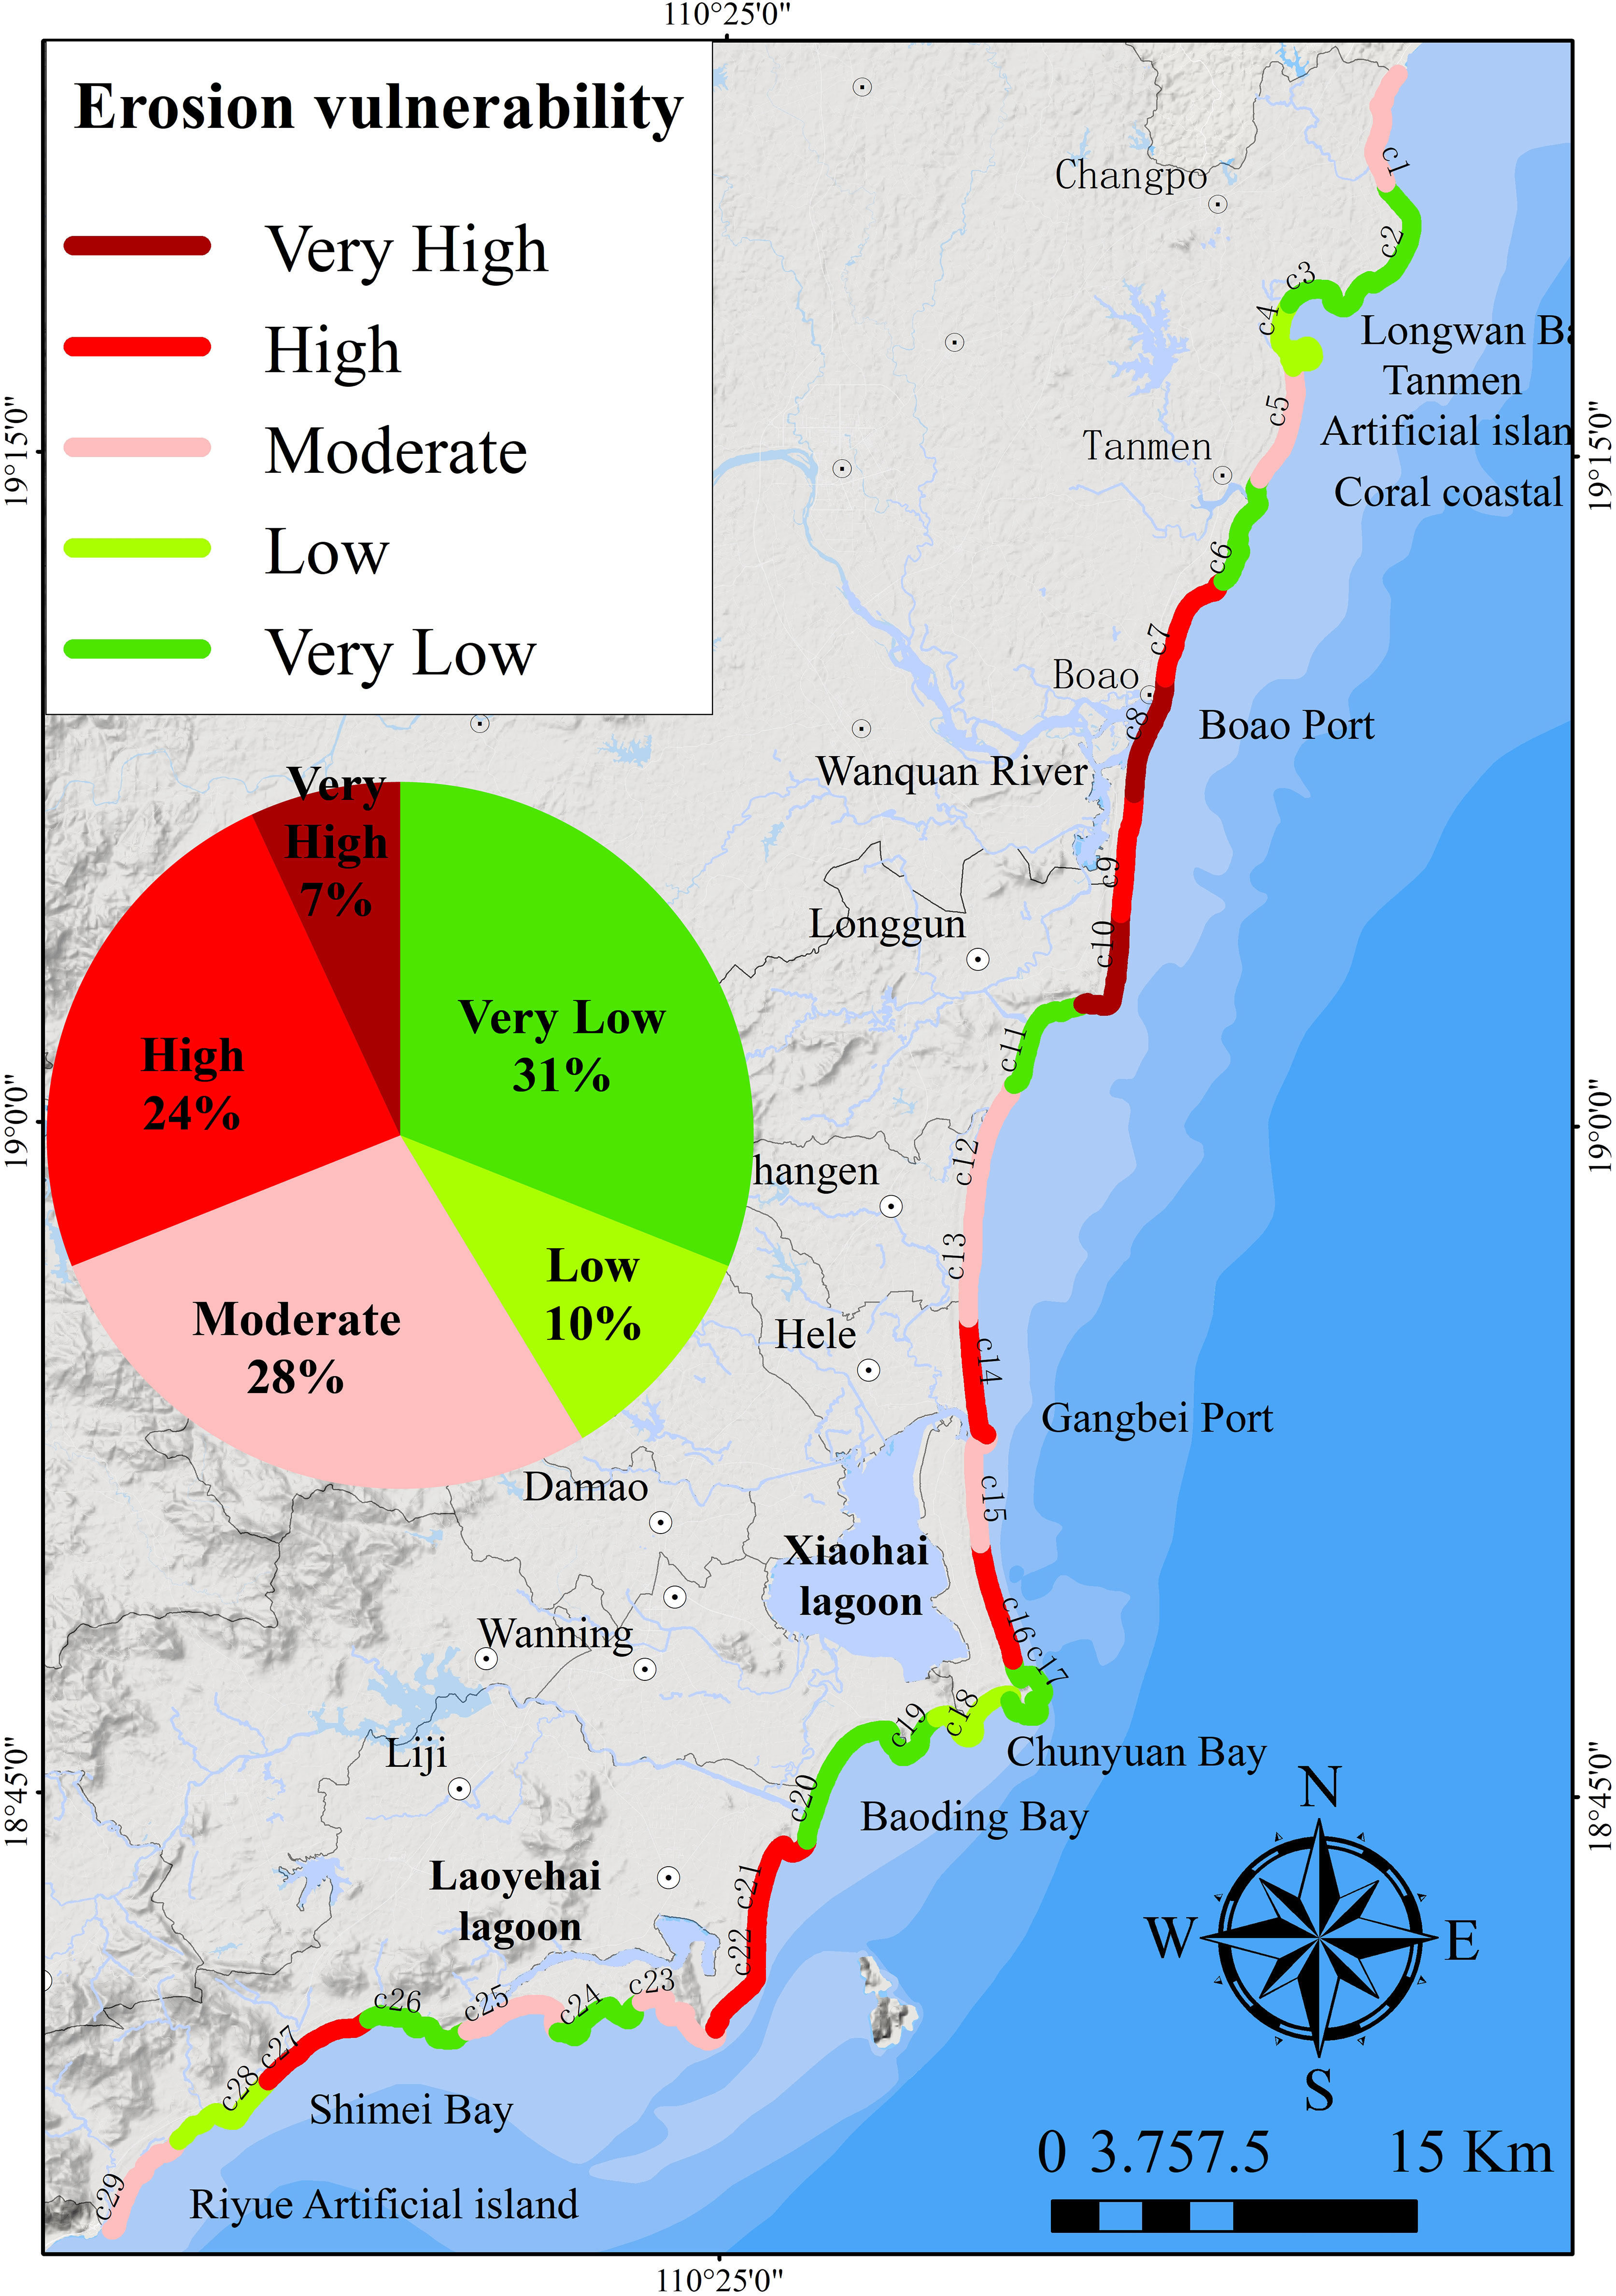
Figure 6 Spatial distribution characteristics and proportion of coastal erosion vulnerability in Qionghai-Wanning.
4.2.2. Vulnerability level characteristics
4.2.2.1. Very high vulnerability
The very high vulnerability of Qionghai-Wanning coastal erosion occurred in the C8 and C10 sections, located in the Wanquan River mouth and adjacent coasts, which corresponded to the erosion intensity of the Wanquan Estuary. The interannual downward erosion rate U3 of the beach in this section was approximately -12.8 cm/a, which was the maximum value in the study area (Figure 7A. U3). This was related to the complex and strong hydrodynamic effects of the estuary. In addition, the beach slope (U6) of this section was generally higher than that of the other sections, and anthropogenic activity (U8) had a higher value due to the influence of intensive human activities such as Boao tourism and boat navigation. In general, the very high vulnerability was due to the dominant influence of a higher interannual downward erosion rate, steeper beach slope and denser anthropogenic activities.
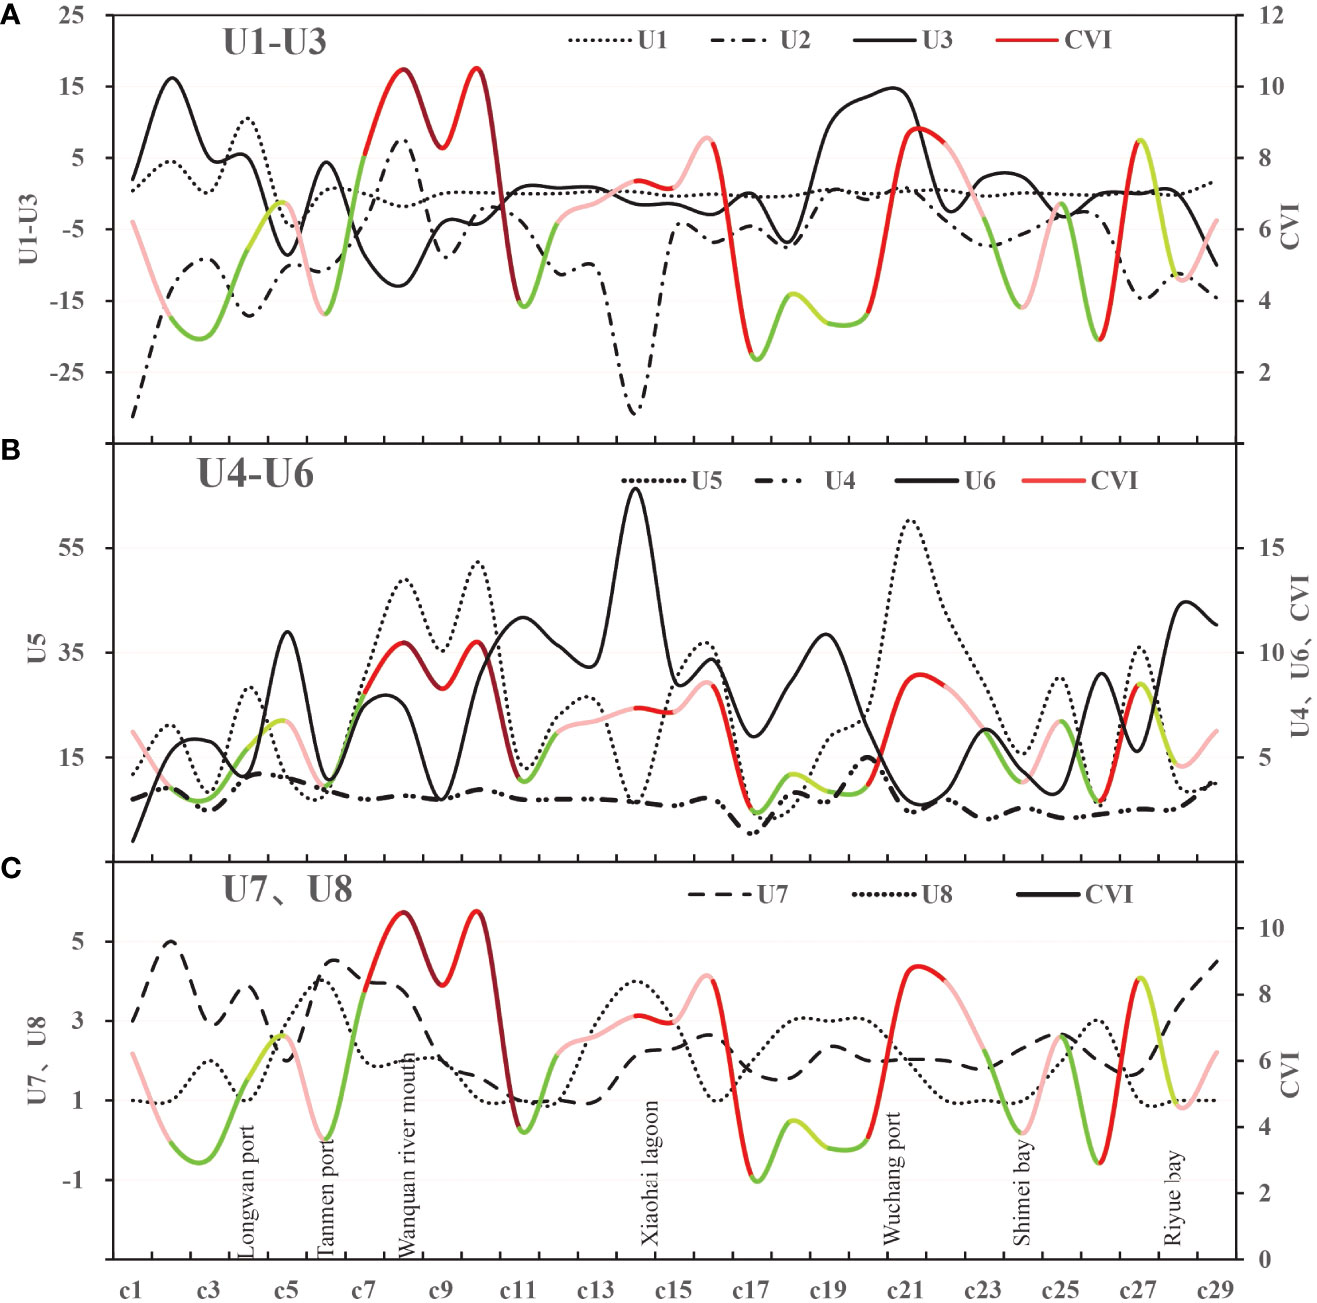
Figure 7 Vulnerability index and evaluation factor curve (The color of CVI curve corresponds to its vulnerability degree). (A) The relationship between U1-U3 index and CVI curve. (B) The relationship between U4-U6 index and CVI curve. (C) The relationship between U7, U8 index and CVI curve.
4.2.2.2. High vulnerability
The areas with higher vulnerability were mainly distributed along some coasts, such as the headland bays and estuaries of northern and southern Wanquan estuary (C7) and the coastal sections near Shimei Bay (C27) in Wanning. The section with a high vulnerability distribution was accompanied by an obvious erosion phenomenon, and the beach slope (U6) of the high vulnerability c14 section had a maximum slope of approximately 65° (Figure 7B. U6). The overall slope range was generally 7-11°, and the interannual downward erosion rate (U3) of the beach was between 0 and 1.2 cm. It had obvious characteristics, such as more human activities; in addition, the coasts with high vulnerability had the characteristics of wider beaches, and the other factors had no obvious common characteristics. In summary, high vulnerability was characterized by a certain width of beach, and the slope and human activities had a greater impact.
4.2.2.3. Moderate vulnerability
The Qionghai-Wanning moderate vulnerability distribution was relatively scattered, and it was moderately vulnerable in the straight shore section, some headland coasts, and coral reef coasts. Additionally, we found that under the protection of coral reefs, the degree of vulnerability was generally low, but under the combined influence of artificial islands and coral reefs, the degree of vulnerability increased on artificial island coasts. For example, section c5 in the Tanmen artificial island area was moderately vulnerable. The common feature of moderate vulnerability was that the isobath change rate (U2) was between -15.69 and -7.93 m/a, and the rest had no obvious features.
4.2.2.4. Low and very low vulnerability
Except for the low vulnerability of some coral reef shore sections, bedrock shorelines, hard artificial shorelines, etc., the remaining low-vulnerability sections had obvious common characteristics, such as relatively gentle bank slopes, lower shoreline change rates, smaller isobath change rates, and interannual siltation states of beaches (Figure 7). Furthermore, some beaches had better protection under the action of alternate bedrocks and showed lower vulnerability; therefore, the hard coast type played a leading role in lower vulnerability.
5. Discussion
5.1. Variation in coastal erosion vulnerability
Through the Spearman correlation coefficient method (Rodgers and Nicewander, 1988), statistical analysis was carried out on the correlation between the raw data of each evaluation factor and the vulnerability index, and the results are shown in Table 3.
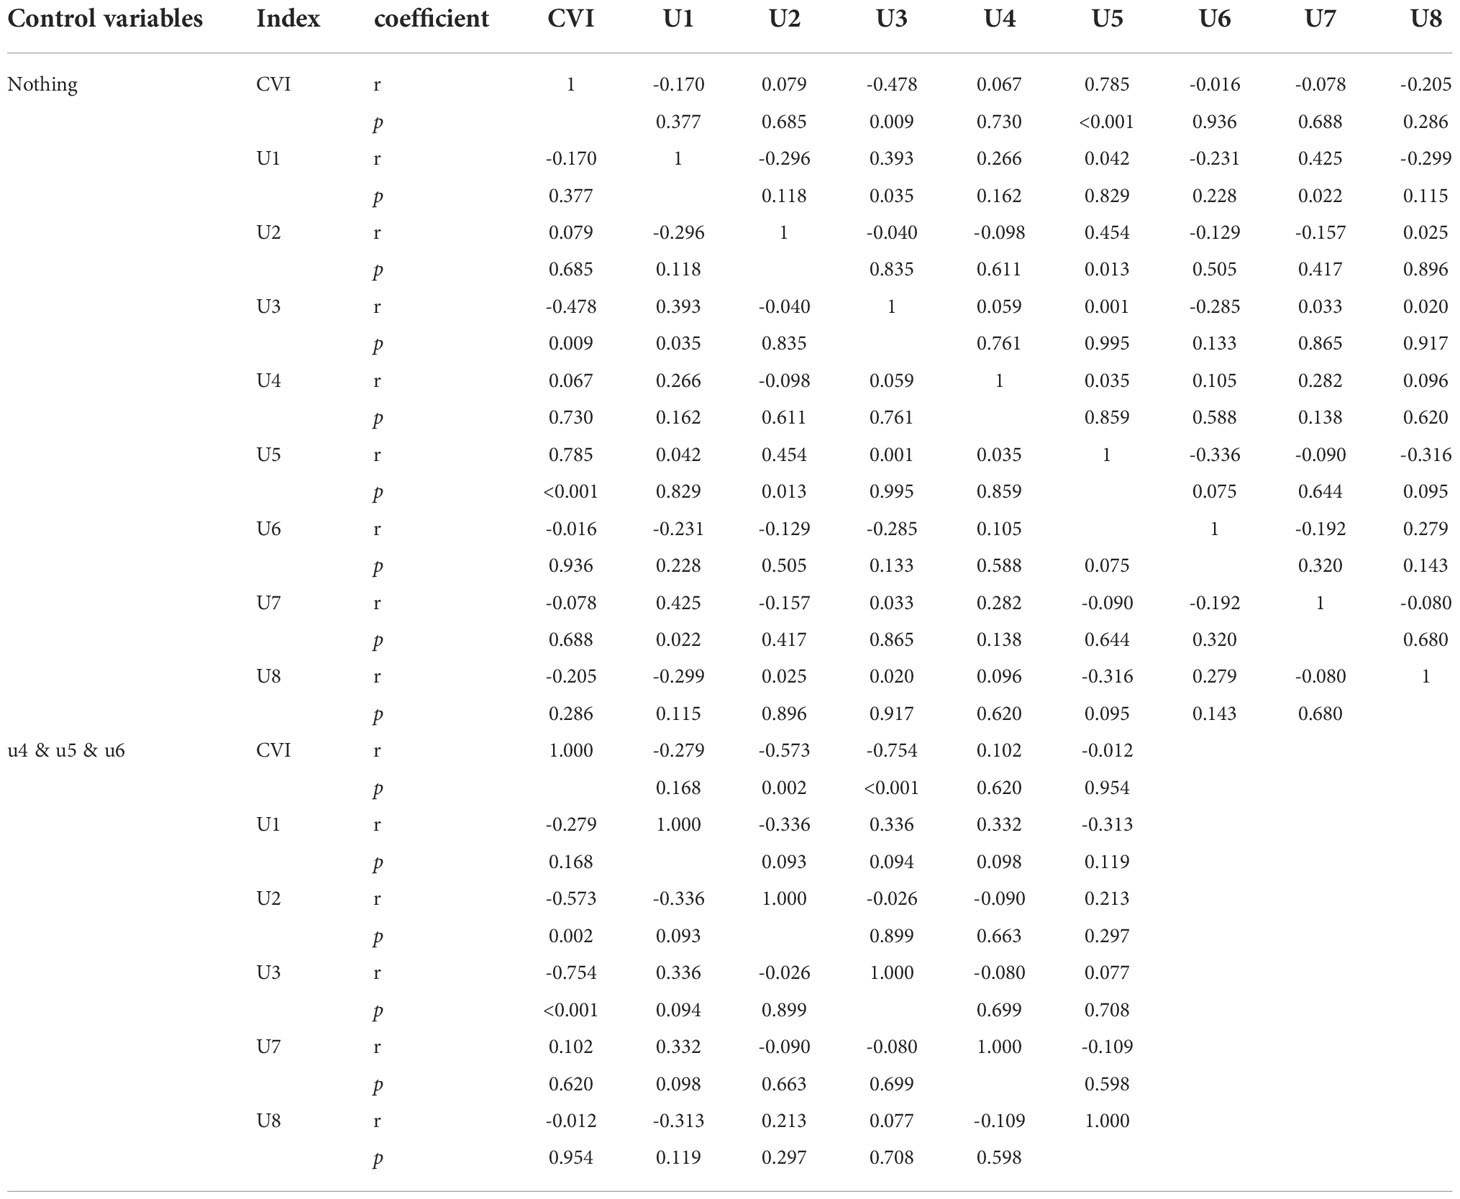
Table 3 Correlation between CVI and each evaluation factor based on Spearson method.
It was assumed that there was no mutual influence between the indicators; that is, in the absence of control variables, the interannual downward rate of erosion of beaches (U3) was moderately negatively correlated with the CVI (r=-0.48, p<0.01), which showed that the greater the rate of downward erosion was, the greater the degree of vulnerability. The beach width (U5) was strongly correlated with the CVI (r=0.79, p<0.01) (Figure 8), which indicated that the beach wider had a greater degree of vulnerability. The other indicators were not significantly correlated with the CVI (|r|<0.3, p>0.05).
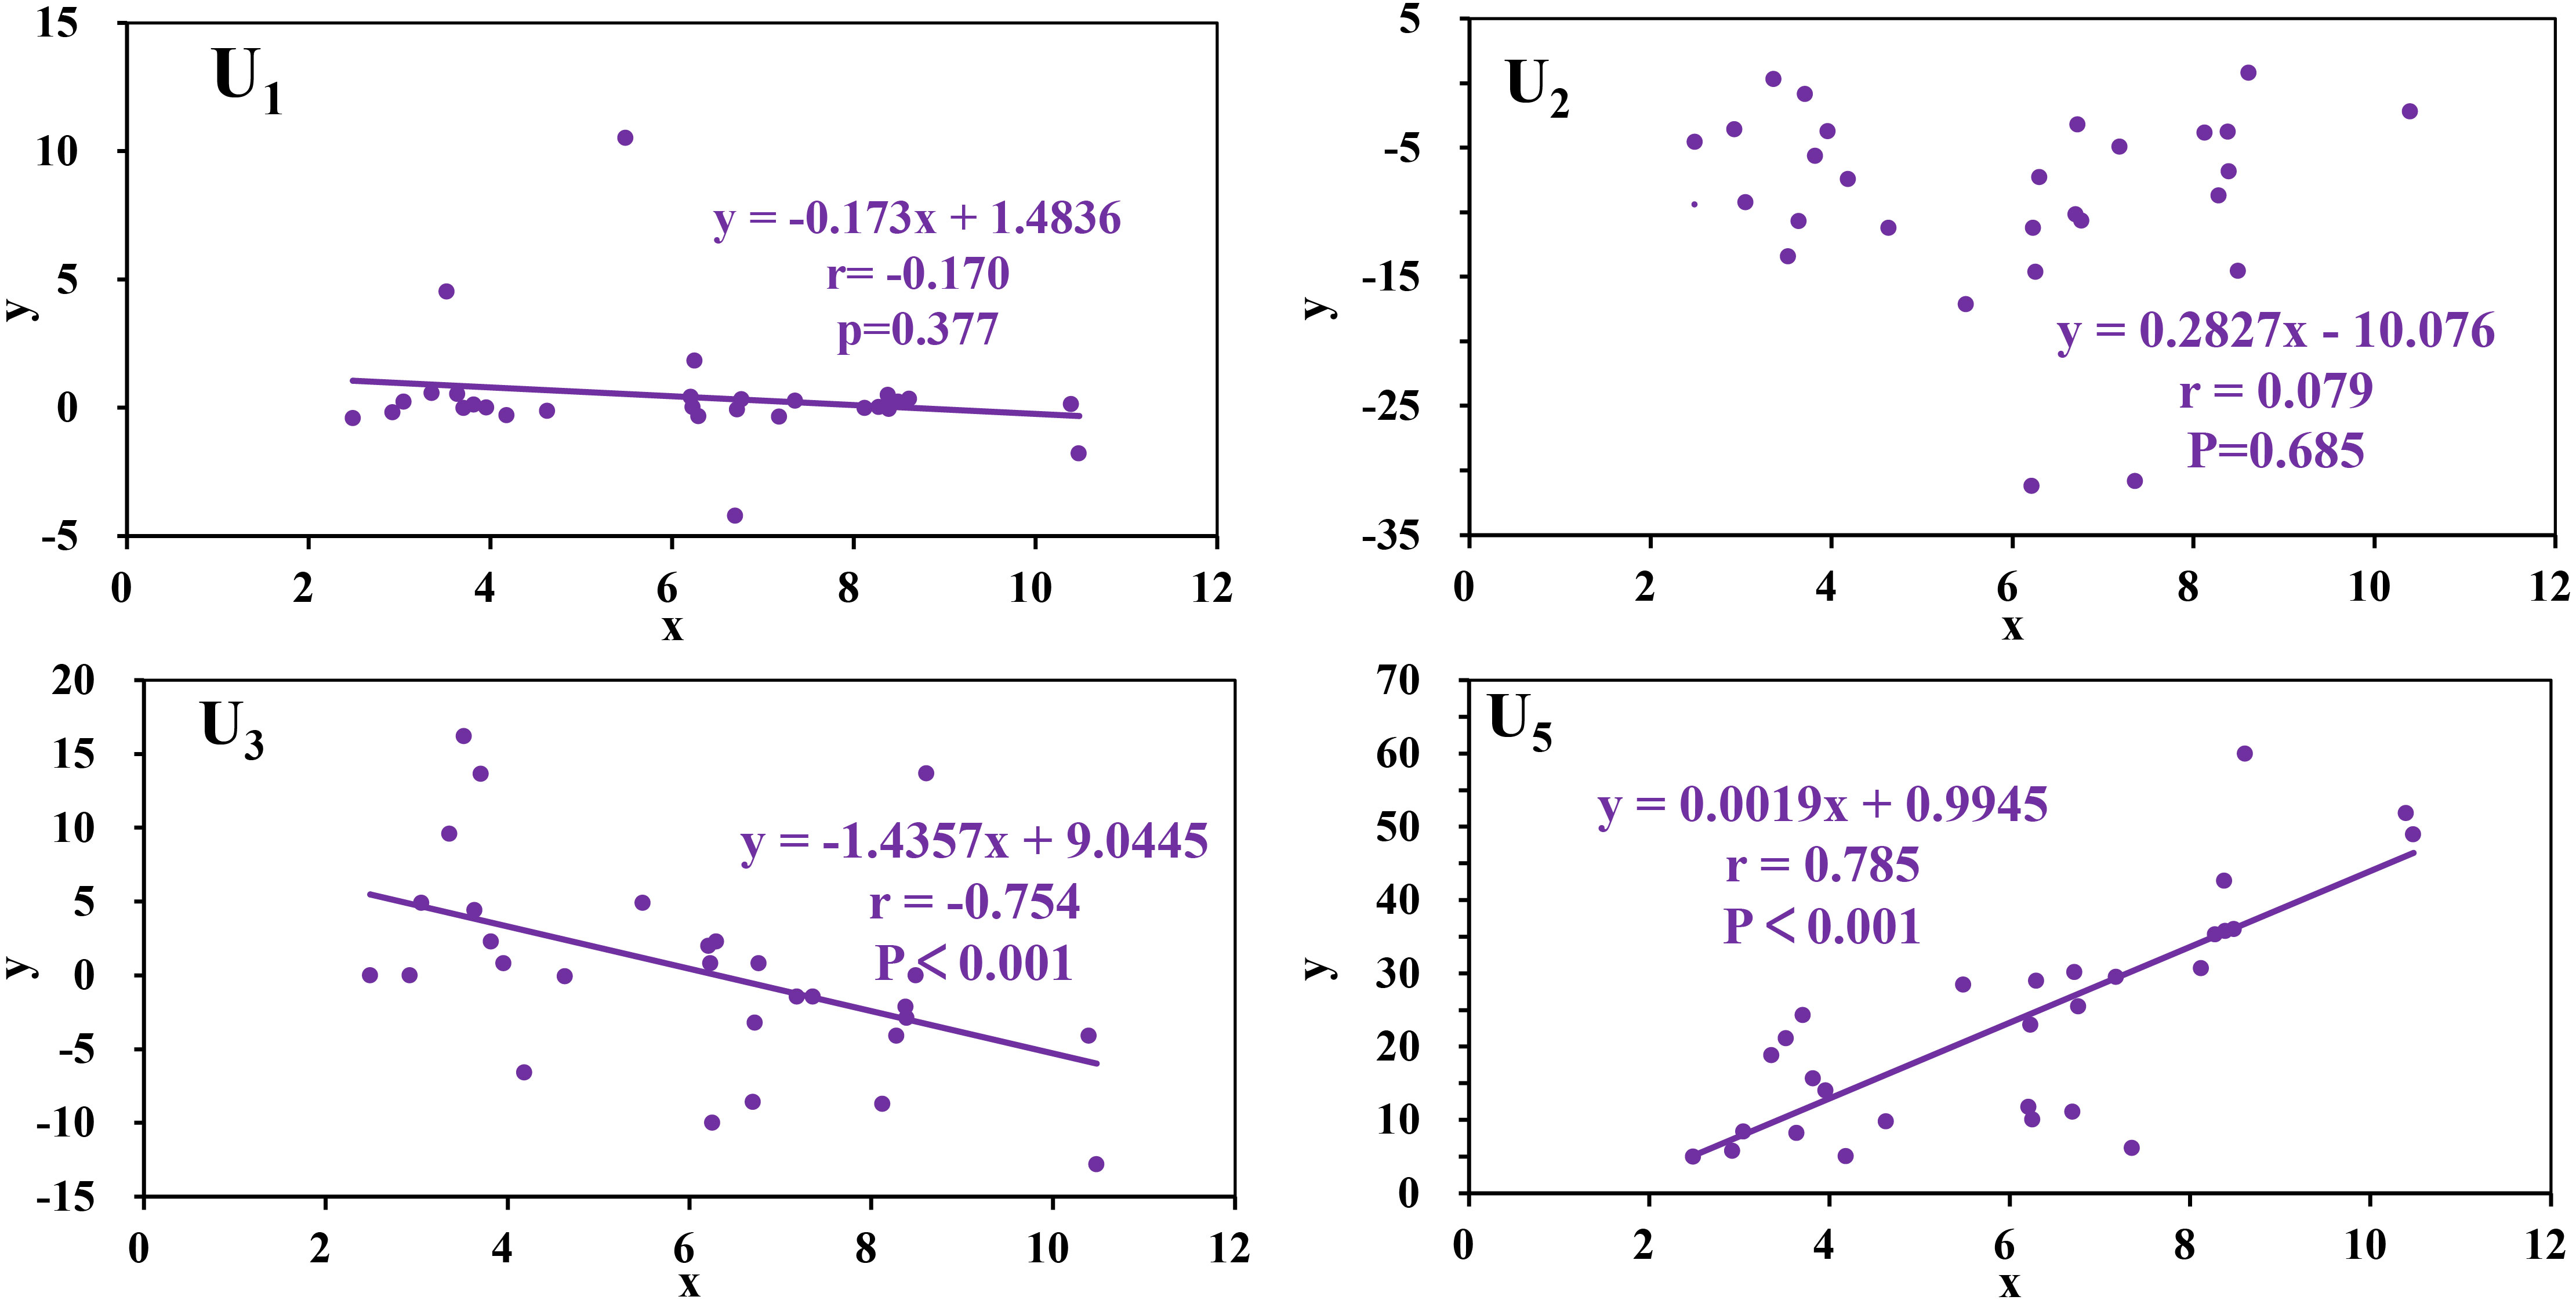
Figure 8 Correlation diagram of comprehensive evaluation vulnerability results and single factor index Ui linear regression (x in the figure is the comprehensive evaluation erosion vulnerability index, y is the original data of the factor index).
In practical research, coastal vulnerability is the degree of vulnerability based on the morphological characteristics of the coast itself, and the characteristics are affected by conditions such as coastal dynamics and human activities. Therefore, based on the state of coastal morphological factors, we conducted a partial correlation analysis between the vulnerability and the vulnerability of the remaining index factors. The results showed that the rate of change of the isobath (U2) was significantly negatively correlated with coastal vulnerability (r=-0.58, p< 0.01), indicating that the greater the rate of change of the isobath was, the greater the degree of coastal vulnerability. The interannual downward rate of erosion of the beach (U3) was strongly negatively correlated with the degree of coastal vulnerability (r=-0.75, p< 0.01); that is, the greater the interannual beach downward erosion rate was, the greater the vulnerability of the coast. The remaining indicators and the CVI were not obviously linearly related (Figure 8). Therefore, the interannual downward erosion rate and isobath change rate of the beach were the main controlling factors in the vulnerability of coastal erosion, and the other factors were secondary factors.
5.1.1. Coastal morphological factors
Coastal morphological factors are important indicators reflecting the intrinsic characteristics of the coast. The width and slope of the beach can determine the reflection ability of waves, and the reflection ability of waves reflects the characteristics of erosion; that is, the erosion intensity of waves on the beach increasesWangYonghong (Wang, 2018) and results in a higher erosion vulnerability. In contrast, a gentler slope and a wider beach result in lower vulnerability.
Figure 7B shows that the CVI curve was similar to the beach width U5 curve but had an opposite relationship with the slope; that is, a larger slope corresponds to a narrower beach width, which corresponds to a relatively lower vulnerability. In contrast, for flat and wider beaches, the slope was mostly gentle, and the vulnerability was relatively higher. There was a certain gap in the evaluation of individual factors because vulnerability was not presented according to the relationship of a single factor under the superimposed influence of the comprehensive factor indicators, which was consistent with the results of Wang (2018) in their assessment of erosion vulnerability along the Yangtze River Delta. Figure 9 shows that the proportion of coastal morphological factors in each segment was different to a certain extent; in general, coastal morphological factors played a secondary role in the vulnerability of each segment.
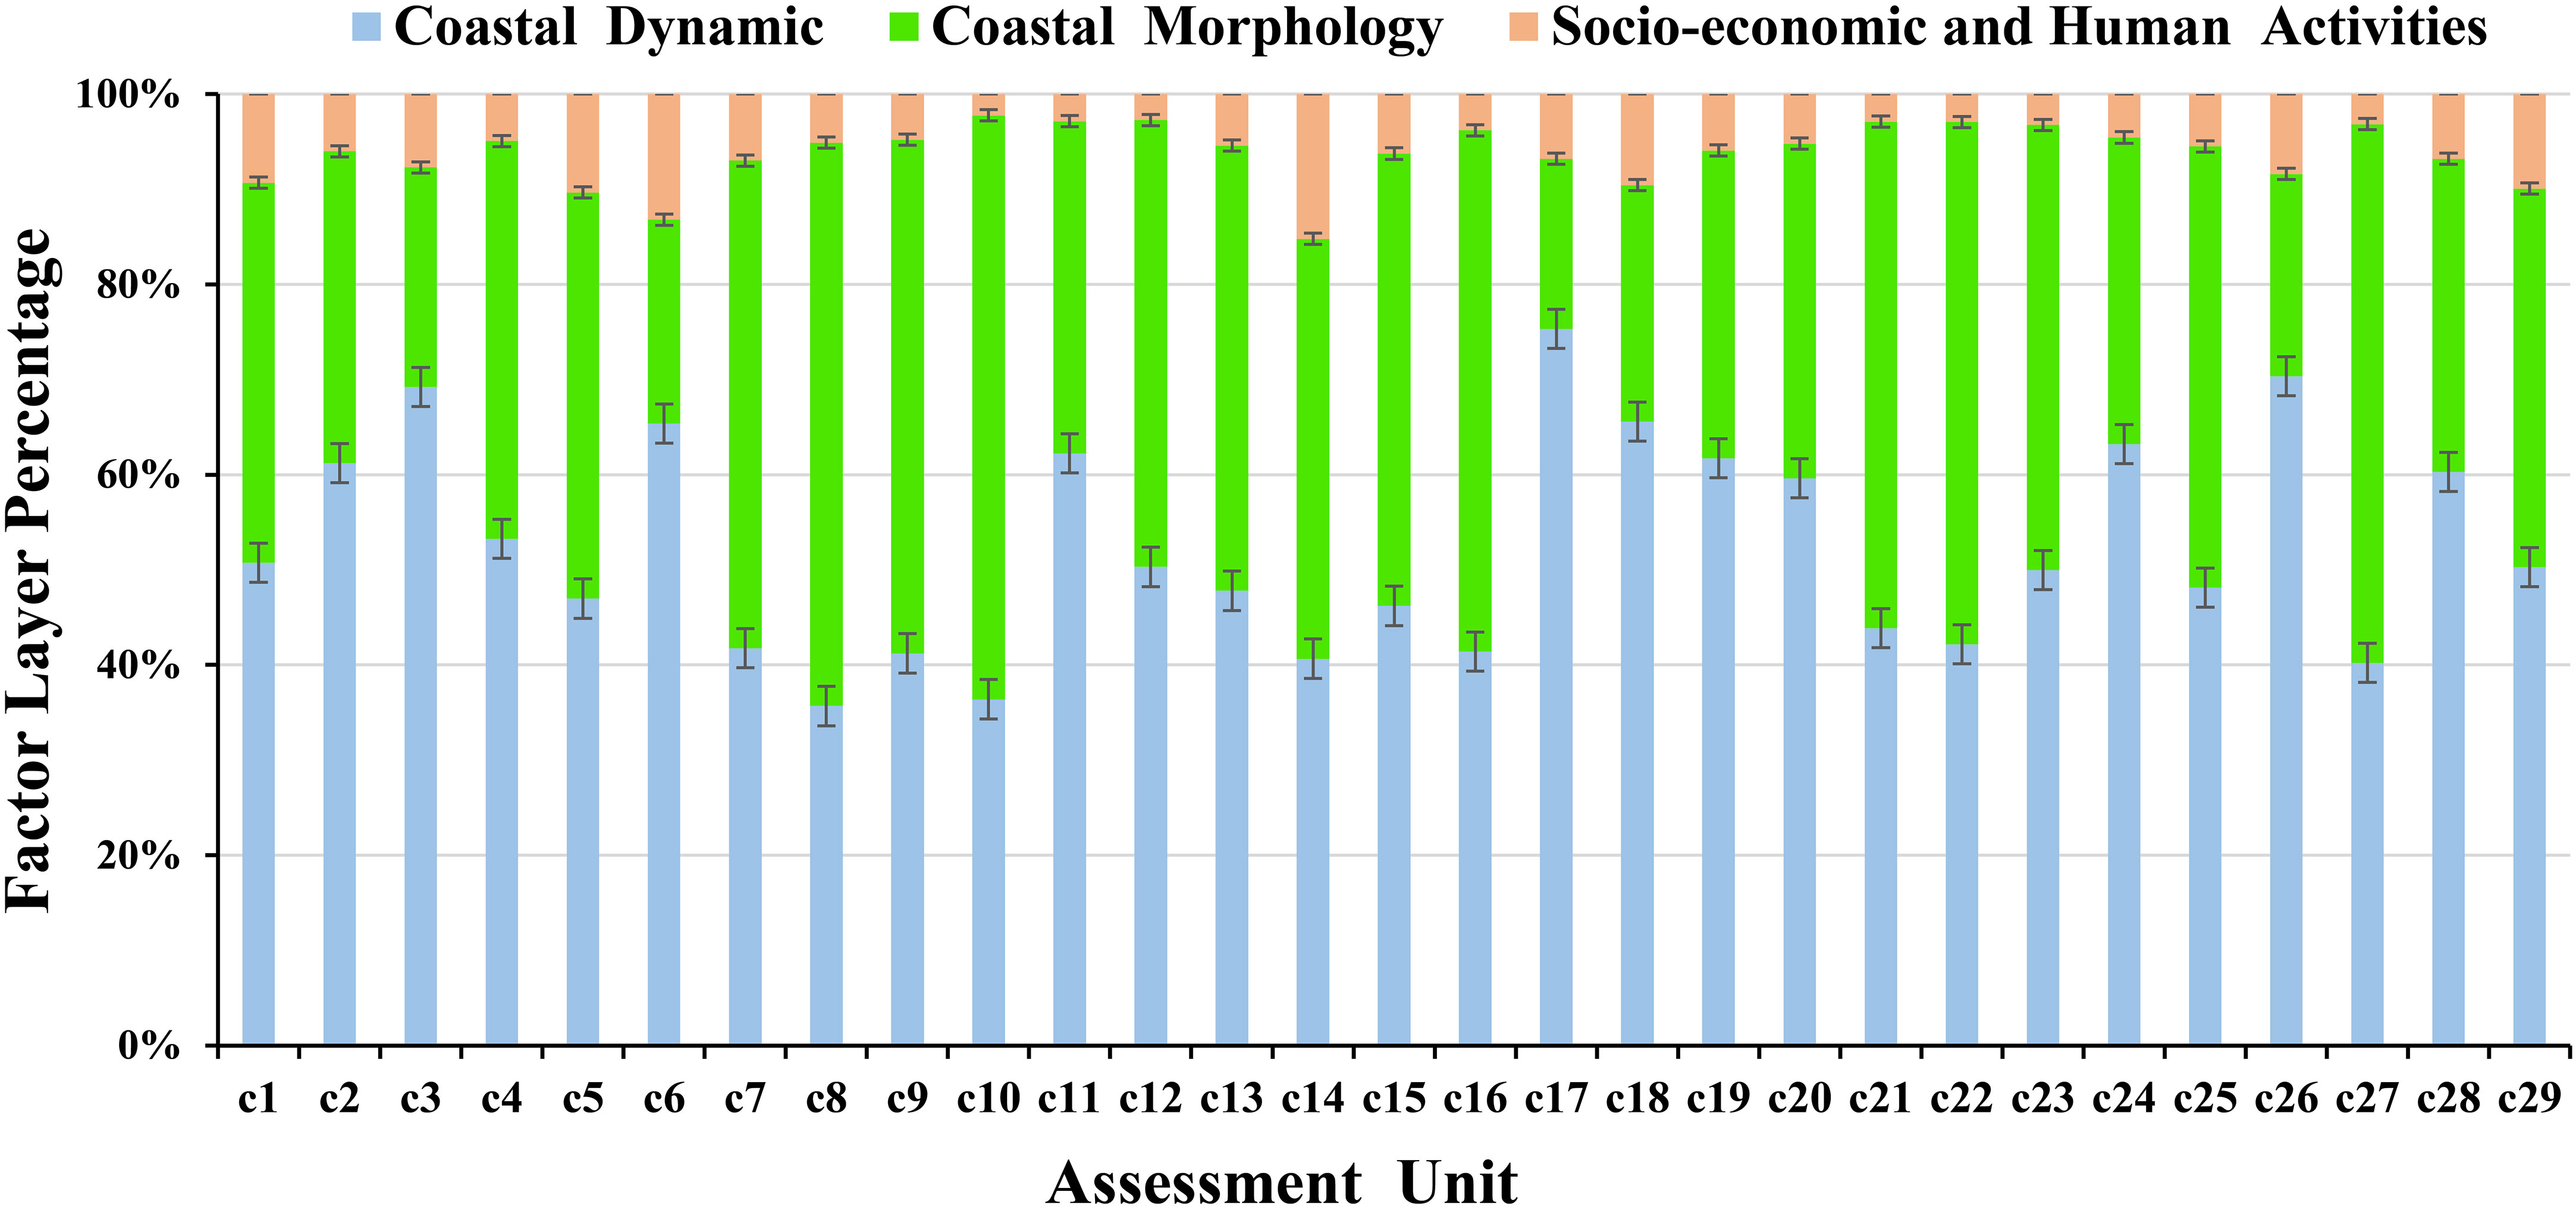
Figure 9 Map of the proportion of coastal morphology, coastal dynamics, and socioeconomic and human activity factors in each assessment unit.
5.1.2. Coastal dynamic factors
The coastal dynamic factors reflect the dynamic change characteristics of the external factors affecting the performance of the coast itself. In this assessment, the coastal vulnerability was characterized by erosion and siltation changes in the position of the supratidal beach, intertidal shoreline and subtidal nearshore sea floor and could better and more comprehensively reflect the vulnerability of the coast itself under the influence of the external environment. The assessment results showed that the coastal dynamic factors in the vulnerability of each segment were the main controlling effects overall (Figure 9). Compared with coastal morphological factors and socioeconomic and human activity factors, they had a greater impact, which was consistent with the research by Hoque et al. (2019), Sarwar (2013), and Roy and Mahmood (2016) and most of the studies believe that coastal dynamic factors such as shoreline change rate are the key factors of coastal vulnerability.
Figure 7A shows that the interannual downward rate erosion of the beach (U3) was inversely proportional to the CVI curve; in addition, there was no obvious corresponding relationship under the influence of other comprehensive superposition. Our previous index weight evaluation showed that the coastal dynamic factor had a higher weight; in particular, the change rate of the shoreline (U1) had the highest weight value, but it did not have a dominant position in the comprehensive impact of vulnerability. This result was related to the evaluation under the condition of synthesizing various indicators and factors and reflected the comprehensive scientific nature of the CVI method.
5.1.3. Socioeconomic and human activity factors
The integration of socioeconomic and human activity factors enhances the reliability and scientificity of previous erosion vulnerability models that considered only coastal shape or coastal dynamic components (Jana and Bhattacharya, 2013; Ahmed et al., 2018). The socioeconomic and human activity factors accounted for the smallest proportions in each evaluation unit and had the smallest impact value overall. The population density (U8) was generally inversely related to the CVI (Figure 7C), which indicated that in anthropogenic activities, the more developed tourism and frequent fishing activities are, the greater the vulnerability of the coast. However, the construction of coastal engineering, such as artificial islands, has had a greater impact on vulnerability than the straight section without engineering construction, which showed a state of moderate vulnerability; therefore, socioeconomic and human activity can increase the degree of coastal vulnerability.
5.2. Coastal types and the CVI
Different types of coastal areas have different erosion vulnerabilities, and even the same type of coastal area will show different results under the combined effect of different factors. There were large ranges of coral reefs (c2-c5) on the coast north of Tanmen Port in Qionghai. The multiyear coastline change rate and vulnerability curve are shown in Figure 10. The c2-c4 section progressed with siltation overall, and the corresponding vulnerabilities were all below the low level, which had a certain relationship with the length of the reef flat in the coral reef disk, the roughness of the reef surface, and the reef crown on the wave propagation deformation. When the waves moved to the reef crown position, the wave energy was reduced due to its water blocking effect, causing the wave to increase water. When moving to the reef flat section, the water depth of the reef flat section was shallow, the existence of the large roughness of the reef surface reduced the wave water value, and the wave energy was further reduced. Therefore, the existence of coral reefs has a great energy dissipation effect on wave waterChaoShao (Shao, 2016). It is a natural revetment barrier, reducing wave scour and erosion, and the coast was protected to a certain extent and showed low vulnerability.
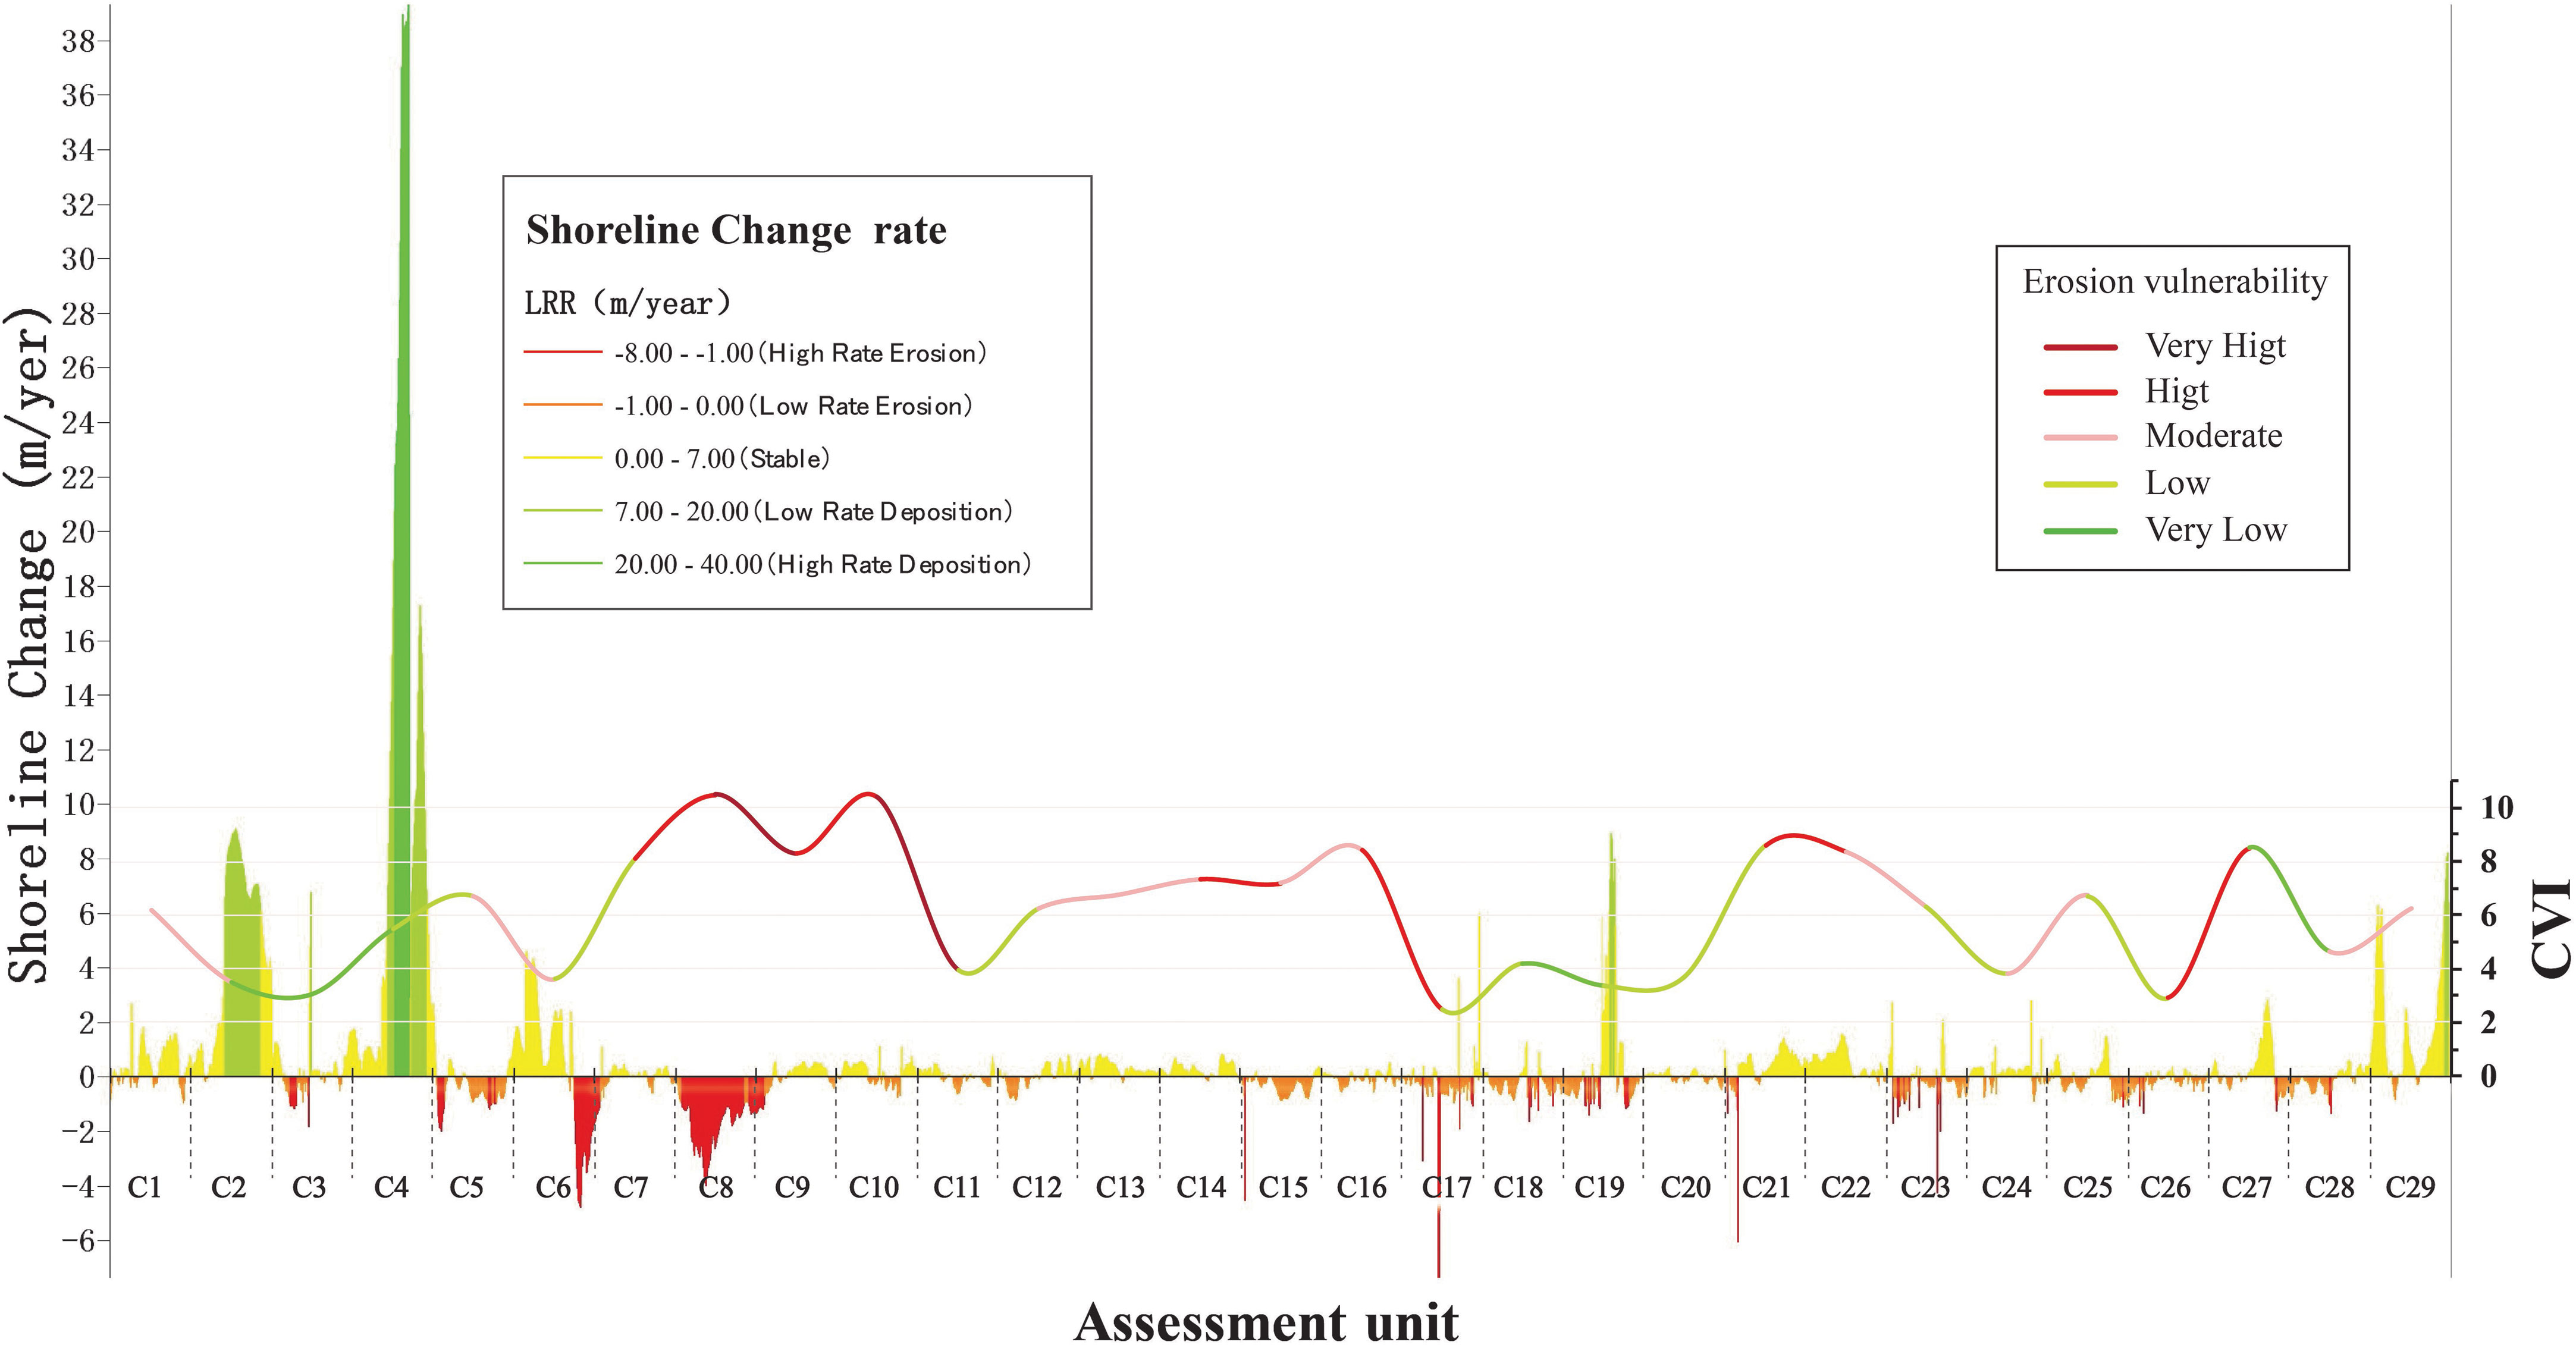
Figure 10 Shoreline change rate and vulnerability curve of different typical coasts (The left side is the legend of Change rate of shoreline, and the right side is the vulnerability index curve of the corresponding section).
The multiyear average rate of change in the c5 section was eroded, and the corresponding vulnerability was moderate vulnerability, which was related to the distribution of 2 artificial islands and the Tanmen port in the c5 coral reef section. Affected by the construction of artificial islands and the fishing activities in the port, the hydrodynamic environment in this area has become complicated, the coral reefs have been degraded, the natural barrier protection of the coral reefs has been reduced, erosion has occurred, and vulnerability has become moderate. In general, the presence of coral reefs has a protective effect on the coast, leaving the adjacent coast with relatively low vulnerability.
The estuarine segment (c8-c10) is the place with the highest degree of vulnerability in the study area, and distributed on both sides of the estuary, which is positively correlated with its erosion intensity. There is a two-way interaction between river runoff and tidal current at the estuary. The flow direction is opposite at high tide and same direction at low tide, forming a complex hydrodynamic environment, indicating that the hydrodynamic interaction at the estuary of the river under natural conditions is the main reason for the high vulnerability of the adjacent coast, which is consistent with the results of Roy et al (2021) study.
5.3. Vulnerability verification
In many vulnerability assessment studies, the reliability of the assessment results is verified by the area under the curve (AUC) under the receiver operating characteristic (ROC) curve, which has been widely used and verified by scholars (Hoque et al., 2021b; Rahman et al., 2019; Cao et al., 2022a). By calculating the true positive rate (TPR) and the false positive rate (FPR) as the y axis to draw the characteristic curve, the size of the AUC can be calculated as the probability of verification.
where TP (true positives): the number of observed erosion locations accurately identified; FP (false positives): the number of erroneously identified erosion locations in non-eroded regions; TN (true negatives): correctly identified non-erosion locations number of; FN (false negatives): the number of misidentified non-eroded locations in eroded regions (Roy et al., 2021).
We used the erosion points and non-erosion points determined by 390 observation points (Figure 11A) in the field survey as the validation dataset and the ROC curve in IBM SPSS Statistics 27 software to generate the prediction rate curve. The AUC of the prediction rate was 0.689, namely, the vulnerability assessment reached an accuracy of 68.9% (Figure 11B). The assessment results can provide important references for the development and management of the Hainan Qiongdong coastal zone and the ecological restoration of tropical coral reef biological coasts.
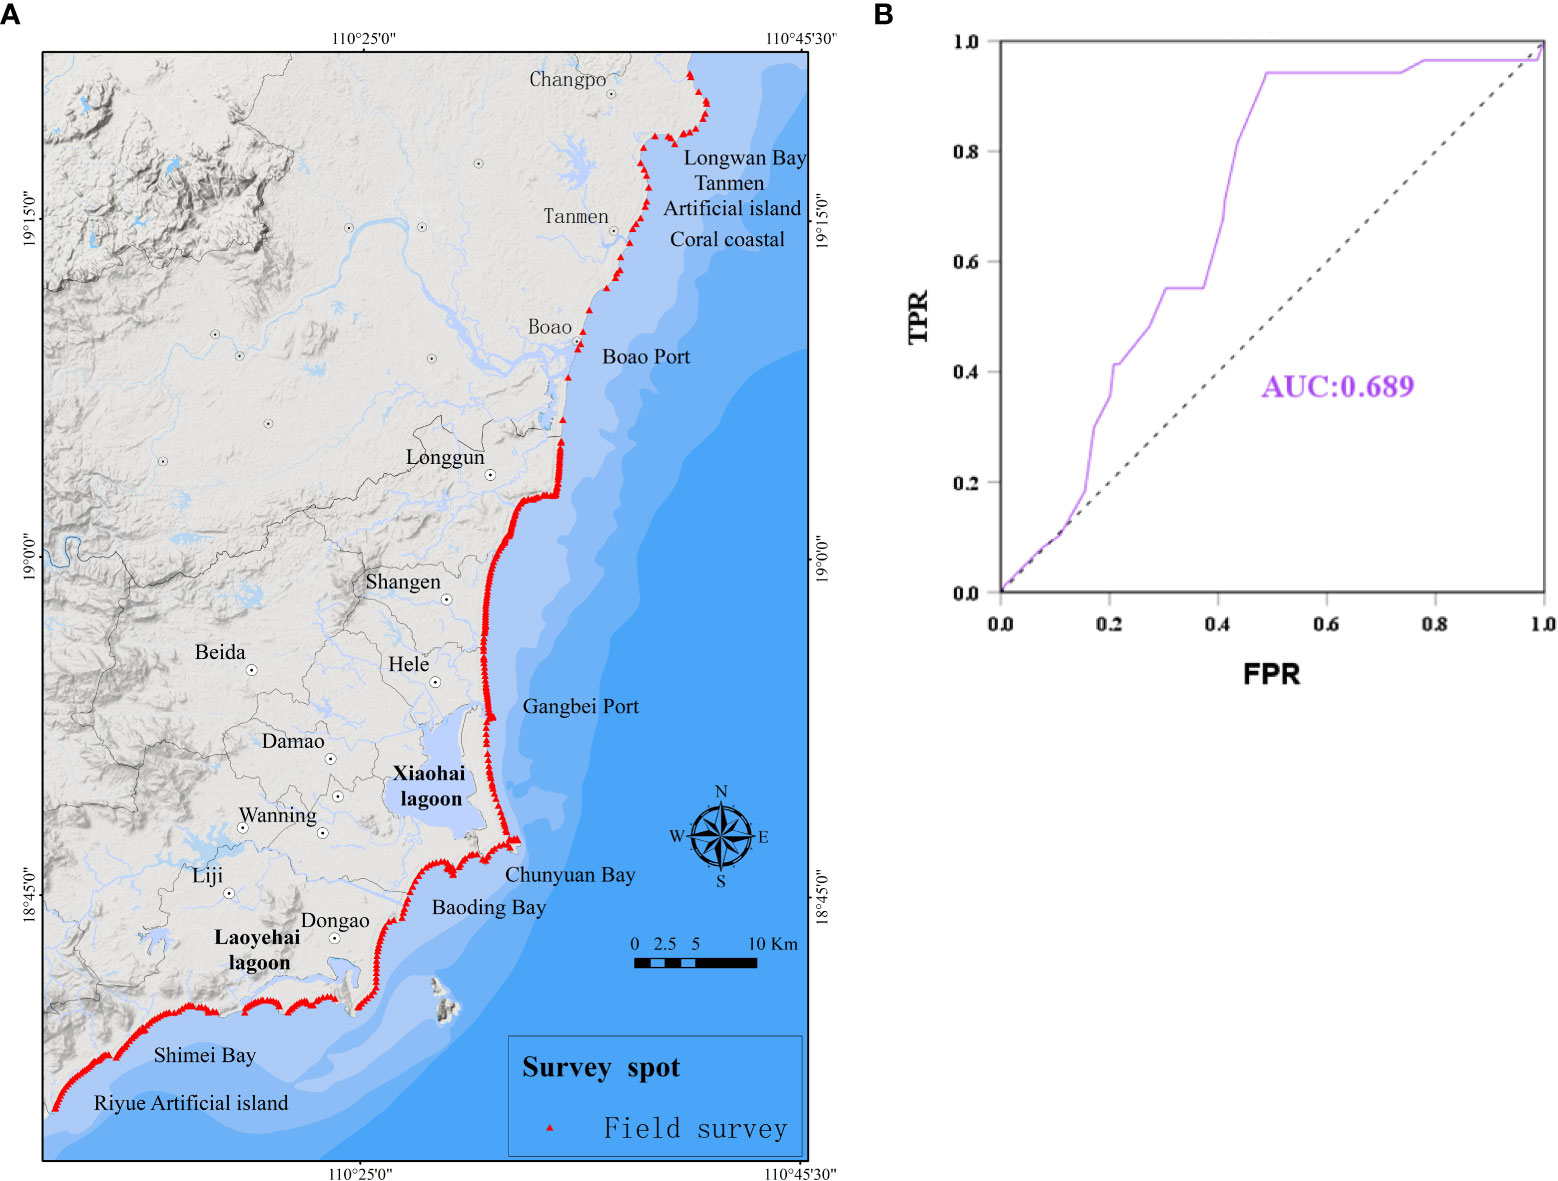
Figure 11 (A) Spatial distribution of field survey sites in 2021; (B) ROC curve and AUC = 0.689.
6. Conclusion
In this paper, 8 small-scale typical indicators, such as the change rate of the shoreline (U1) and the rate of change of the isobath (U2), were comprehensively selected, and the combination of DM and TEM was used to calculate the weight of comprehensive evaluation indicators, combined with GIS and the CVI to quantitatively evaluate the temporal and spatial distribution characteristics of coastal erosion vulnerability in Qionghai-Wanning, Qiongdong, Hainan.
(1) Most of the coastal erosion was in the state of moderate vulnerability or above, accounting for approximately 59% of the total shore section, of which the high-vulnerability section exceeded 31%. The coasts with higher vulnerability were mainly distributed in the Wanquan Estuary of Qionghai and some coasts of Cape Bay, and a few straight coasts also showed a state of higher vulnerability. The moderately vulnerable coasts were scattered, mainly in the inner bays of some headlands. The lower vulnerability areas accounted for approximately 41% of the Qionghai-Wanning coast, and they mainly distributed in coral reefs, headlands formed by bedrock, hard engineering and other locations.
(2) Under the influence of no control variables, the interannual downward rate erosion of the beach (U3) was negatively correlated with vulnerability, the beach width (U5) was highly positively correlated with vulnerability, and the rest showed an insignificant linear relationship with the CVI. Under the control variables, coastal vulnerability was based on the comprehensive influence of coastal morphological factors, showing that the rate of change of the isobath (U2) and the interannual downward erosion rate of the beach (U3) were highly negatively correlated with vulnerability. Therefore, the interannual downward erosion rate of the beach and the rate of change of the isobath were the main factors affecting the vulnerability to coastal erosion, and the other indicators were secondary factors. In addition, there were large coral reefs distributed north of Qionghai Tanmen as a natural barrier for revetment. The reason is that the length of the reef flat in the coral reef plate, the roughness of the reef surface and the reef crown can reduce the wave erosion and reduce the erosion of the coral reef coast, resulting in lower vulnerability, and the complex hydrodynamic environment, the estuarine coast presents a state of high vulnerability.
(3) The vulnerability was verified by the AUC value under the ROC curve, and the vulnerability assessment reached an accuracy of 68.9%. The assessment results provide a scientific basis for the restoration of coral reef biological coastal ecology and the development and management of the Qiongdong coastal zone.
Data availability statement
The original contributions presented in the study are included in the article/Supplementary Material. Further inquiries can be directed to the corresponding authors.
Author contributions
Designed the study, wrote the main manuscript and prepared all figures: GF; contributed to the improvement of the manuscript: CC and KF; investigate: YS and KY; figure and software: GF, YS, and KY; all authors reviewed the manuscript. All authors contributed to the article and approved the submitted version.
Funding
This research was funded by the China Geological Survey Project: Qionghai-wanning Coastal Zone Comprehensive geological survey Project (Grant Nos. ZD20220608), the National Natural Science Foundation of China (Grant No. 42076058, 41930538), the Scientific Research Foundation of Third Institute of Oceanography, MNR (Grant No. 2019006).
Acknowledgments
The authors would like to express their sincere thanks to Huilong Xu, Fei Tan who have offered support.
Conflict of interest
The authors declare that the research was conducted in the absence of any commercial or financial relationships that could be construed as a potential conflict of interest.
Publisher’s note
All claims expressed in this article are solely those of the authors and do not necessarily represent those of their affiliated organizations, or those of the publisher, the editors and the reviewers. Any product that may be evaluated in this article, or claim that may be made by its manufacturer, is not guaranteed or endorsed by the publisher.
Supplementary material
The Supplementary Material for this article can be found online at: https://www.frontiersin.org/articles/10.3389/fmars.2022.1061769/full#supplementary-material
References
Ahmed A., Nawaz R., Drake F., Woulds C. (2018). Modelling land susceptibility to erosion in the coastal area of Bangladesh: A geospatial approach. Geomorphol. 320, 82–97. doi: 10.1016/j.geomorph.2018.08.004
Alam A., Sammonds P., Ahmed B. (2020). Cyclone risk assessment of the cox’s bazar district and rohingya refugee camps in southeast Bangladesh. Sci. Total Environ. 704, 135360. doi: 10.1016/j.scitotenv.2019.135360
Alberico I., Amato V., Aucelli P., D’Argenio B., Di Paola G., Pappone G. (2012). Historical shoreline changes of the sele plain (southern italy): the 1870-2009 time window. J. Coast. Res. 28 (6), 1638–1647. doi: 10.2112/J.COASTRES-D-10-00197.1
Andrade T. S., Oliveira Sousa P. H. G., Siegle E. (2019). Vulnerability to beach erosion based on a coastal processes approach. Appl. Geogr. 102, 12–19. doi: 10.1016/j.apgeog.2018.11.003
Annelies B., das Neves L., de Nocker L., Ali D., Koen C.. (2021). A methodological framework of quantifying the cost of environmental degradation driven by coastal flooding and erosion: A case study in West Africa. J. Disaster Risk Reduction. 01 (54), 2212–4209. doi: 10.1016/j.ijdrr.2020.102022
Appeaning A. K. (2013). Shoreline morphological changes and the human factor, case study of Accra Ghana. J. Coast. Conserv. 17, 85–91. doi: 10.1007/s11852-012-0220-5
Compiled by China Meteorological Administration (2021). Tropical of cyclone yearbook Vol. 08 (China Meteorological Press), 15–193.
Barragan J. M., Andreis M. (2015). Analysis and trends of the world’s coastal cities and agglomerations. Ocean Coast. Manage. 114, 11–20. doi: 10.1016/j.ocecoaman.2015.06.004
Bathi J. R., Das H. S. (2016). Vulnerability of coastal communities from storm surge and flood disasters. Int. J. Environ. Res. Publ. Health 13 (2), 239. doi: 10.3390/ijerph13020239
Boak E. H., Turner I. L. (2005). Shoreline definition and detection: A review. J. Coast. Res. 21 (4), 688–703. doi: 10.2112/03-0071.1
Boruff B. J., Emrich C., Cutter S. L. (2005). Erosion hazard vulnerability of US coastal counties. J. Coast. Res. 21 (5), 932–942. doi: 10.2112/04-0172.1
Bruun P. (1962). Sea-Level rise as a cause of shore erosion. J. Waterways Harbours Divisions. 88, 117–130. doi: 10.1061/JWHEAU.0000252
Cabrera J. S., Lee H. S. (2019). Flood-prone area assessment using GIS-based multi-criteria analysis: A case study in davao oriental, Philippines. Water. 11, 2203. doi: 10.3390/w11112203
Cabrera J. S., Lee H. S. (2020). Flood risk assessment for davao oriental in the Philippines using geographic information system-based multi-criteria analysis and the maximum entropy model. J. Flood Risk Management. 13, e12607. doi: 10.1111/jfr3.12607
Cai F., Cao C., Qi H. S., Lei G., Liu JH., Zhu K., et al. (2022). Rapid migration of Chinese mainland coastal erosion vulnerability due to anthropogenic changes. J. Environ. Management. 319, 115632. doi: 10.1016/j.jenvman.2022.115632 1–15
Cai F., Su X. Z., Cao C., Lei G., Liu JH., Qi HS., et al. (2019). China Coastal erosion vulnerability assessment and demonstration application. Beijing Ocean Press 08, 241–247.
Cai F., Su X. Z., Liu J. H., Li B., Lei G. (2008). Coastal erosion problems and preventive countermeasures in my country under the background of global climate change. Prog. Natural Sci. 10), 1093–1103.
Cao C., Cai F., Qi H., Liu JH., Lei G., Zhu K., et al. (2022a). Coastal erosion vulnerability in mainland China based on fuzzy evaluation of cloud models. Front. Mar. Sci. 8. doi: 10.3389/fmars.2021.790664
Cao C., Zhu K., Cai F., Qi H. S., Liu J. H., Lei G., et al. (2022b). Vulnerability evolution of coastal erosion in the pearl river estuary great bay area due to the influence of human activities in the past forty years. Front. Mar. Sci. 9, 847655. doi: 10.3389/fmars.2022.847655
Chen J. Y., Xia D. X., Yu Z. Y., Cai F. (2010). Summary of coastal erosion in China (Beijing: Beijing China Ocean Press), 320–324.
Chen J. Y., Shen H. T., Yun C. X. (1988). Dynamic process and geomorphological evolution of the Yangtze estuary (Shanghai: Shanghai Science and Technology Press), 158–189.
Chen S. L., Zhang G. A., Yang S. L., Yu Z. Y. (2004). Temporal and spatial variation of suspended sediment concentration and sediment resuspension in the waters of the Yangtze estuary. Chin. J. Geography. 02, 260–266. doi: 10.11821/xb200402012
Chu J. L., Gao S., Xu J. G. (2005). Risk and safety evaluation methodologies for coastal systems: A review. Mar. Sci. Bulletin. 24 (3), 80–87. doi: 10.1111/j.1745-7254.2005.00209
Deepika B., Avinash K., Jayappa K. S. (2013). Shoreline change rate estimation and its forecast: remote sensing, geographical information system and statistics-based approach. Int. J. Environ. Sci. Technol 11 (2) , 395–416. doi: 10.1007/s13762-013-0196-11-22
Dolan A. H., Walker I. J. (2006). Understanding vulnerability of coastal communities to climate change related risks. J. Coast. Res. 39, 1316–1323. doi: 10.2307/25742967
Dominguez L., Anfuso G., Gracia F. J. (2005). Vulnerability assessment of a retreating coast in SW Spain. Environ. Geology. 47 (8), 1037–1044. doi: 10.1007/s00254-005-1235-0
Dou X., Song J., Wang L., Tang B., Xu S., Kong F., et al. (2017). Flood risk assessment and mapping based on a modified multi-parameter flood hazard index model in the guanzhong urban area, China. Stoch. Environ. Res. Risk Assess. 32, 1131–1146. doi: 10.1007/s00477-017-1429-5
Gornitz V. (1991). Global coastal hazards from future sea level rise. Global Planetary Change. 89 (4), 379–398. doi: 10.1016/0921-8181(91)90118-G
Hagedoorn L. C., Appeaning A. K., Koetse M. J., Kinney K., van Beukering P. J. H.. (2021). Angry waves that eat the coast: An economic analysis of nature-based and engineering solutions to coastal erosion. Ocean Coast. Management. 11, 0964–5691. doi: 10.1016/j.ocecoaman.2021.105945
Hoque M. A. A., Pradhan B., Ahmed N., Ahmed B., Alamri A. M. (2021a). Cyclone vulnerability assessment of the western coast of Bangladesh, geomatics, nat. Hazards Risk. 12 (1), 198–221. doi: 10.1080/19475705.2020.1867652
Hoque M. A. A., Pradhan B., Ahmed N., Roy S. (2019). Tropical cyclone risk assessment using geospatial techniques for the eastern coastal region of Bangladesh. Sci. Total Environ. 692, 10–22. doi: 10.1016/j.scitotenv.2019.07.1320048-9697
Hoque M. A. A., Pradhna B., Ahmed N., Sohel M. S. I. (2021b). Agriculturla drought risk assessment of northern new south Wales, Australia using geospatial techniques. Sci. Total Environ. 756, 143600. doi: 10.1016/j.scitotenv.2020.143600
Huang H., Chen Z., Huang L. D., Wang X., Niu W. T., Tian J. J., et al. (2019). China Coral reef status report. Coral Reef Branch China Pacific Soc., 32–37.
Jana A., Bhattacharya A. K. (2013). Assessment of coastal erosion vulnerability around midnapur-balasore coast, Eastern India using integrated remote sensing and GIS techniques. J. Indian Soc. Remote Sensing. 41 (3), 675–686. doi: 10.1007/s12524-012-0251-2
Ji R. Y., Luo X. L., Lu Y. J., Luo Z. R. (2007). Analysis of coastal erosion characteristics and main causes of hainan island. Proc. 13th China Ocean (Coastal) Eng. Symposium. 09, 374–377.
Jones A., Phillips M. (2011). Disappearing destinations: Climate change and the future challenges for coastal tourism. cabi, London. Publications review/Annals Tourism Res. 39, 2220–2226. doi: 10.1016/j.annals.2012.07.014
Kumar A. A., Kunte P. D. (2012). Coastal vulnerability assessment for chennai, east coast of India using geospatial techniques. Natural Hazards. 64 (1), 853–872. doi: 10.1007/s11069-012-0276-4
Liu X. X. (2015). Coastal evolution and intrusion vulnerability assessment of abandoned yellow river delta [Master’s thesis]. Shanghai East China Normal University 06, 2–4.
Liu H. W., Sun X. M., Wen D. G., Fang C., Hu Y. Z., Ma Z., et al. (2013). Vulnerability evaluation of the caofeidian coastal area based on coastal vulnerability index method. Hydrogeology Eng. Geology. 40 (3), 105–109. doi: 10.16030/j.cnki.issn.1000-3665.2013.03.013
Mangor K., Dronen N. K., Kaergaard K. H., Kristensen S. E. (2017). Shoreline management guidelines. Netherlands. DHI Water Environment. 294, 153–154.
Mattei G., Troisi S., Aucelli P. P., Pappone G., Peluso F., Stefanile M. (2018). Sensing the submerged landscape of nisida roman harbour in the gulf of naples from integrated measurements on a USV. Water. 10, 1686. doi: 10.3390/w10111686
Merlotto A., B´ertola G. R., Piccolo M. C. (2016). Hazard vulnerability and coastal erosion risk assessment in necochea municipality, buenos aires province. Argentina. J. Coast. Conserv. 20 (5), 351–362. doi: 10.1007/s11852-016-0447-7
Mohamed E-S. E-M., Ali S., Moursy F. E., Sharaky A., Saleh N.. (2021). Coastal erosion risk assessment and applied mitigation measures at ezbet elborg village, Egyptian delta. Ain Shams Eng. J 13 (3), 3–6. doi: 10.10.1016/j.asej.2021.10.016
Mosadeghi R., Warnken J., Tomlinson R., Mirfenderesk H.. (2019). Comparison of FuzzyAHP and AHP in a spatial multi-criteria decision making model for urban land-use planning. Comput. Environ. Urban Syst. 49, 54–65. doi: 10.1016/j.compenvurbsys.2014.10.001
Narra P., Coelho C., Sancho F., Escudero M., Silva R. (2019). Coastal hazard assessments for sandy coasts: Appraisal of five methodologies. J. Coast. Res. 35 (3), 574–589. doi: 10.2112/JCOASTRES-D-18-00083.1
Narra P., Coelho C., Sancho F., Palalane J. (2017). CERA: An open-source tool for coastal erosion risk assessment. Ocean Coast. Manage. 142, 1–14. doi: 10.1016/j.ocecoaman.2017.03.013
Pan Y., Yin S., Chen Y. P., Yang Y. B., Xu C. Y., Xu Z. S. (2022). An experimental study on the evolution of a submerged berm under the effects of regular waves in low-energy conditions. Coast. Eng. 176, 104169. doi: 10.1016/j.coastaleng.2022.104169
Parvin G. A., Takahashi F., Shaw R. (2008). Coastal hazards and community-coping methods in Bangladesh. J. Coast. Conserv. 12 (4), 181–193. doi: 10.1007/s11852-009-0044-0
Rahman M., Chen N. S., Islam M. M., Dewan A., Iqbal J., Muhammad R., et al. (2019). Flood susceptibility assessment in Bangladesh using machine learning and multi-criteria decision analysis. Earth Syst. Environment. 3, 585–601. doi: 10.1007/s41748-019-00123-y
Rodgers J. L., Nicewander W. A. (1988). Thirteen ways to look at the correlation coefficient. Am. Statis tician. 42 (1), 59–64. doi: 10.1080/00031305.1988.10475524
Roy S., Mahmood R. (2016). Monitoring shoreline dynamics using landsat and hydrological data: A case study of sandwip island of Bangladesh. Pennsylvania Geographer 54 (2), 20–41.
Roy S., Pandit S., Papia M., Rahman M. M., Ocampo J. C. O. R., Razi M. A., et al. (2021). Coastal erosion risk assessment in the dynamic estuary: The meghna estuary case of Bangladesh coast. Int. J. Disaster Risk Reduction. 07-14, 2212–4209. doi: 10.1016/j.ijdrr.2021.102364
Saffaria S., Mahmoudi A., Shafiee M., Jasemi M., Hashemi L. (2020). Measuring the effectiveness of AHP and fuzzy AHP models in environmental risk assessment of a gas power plant. Hum. Ecol. Risk Assess. 27 (5), 1227–1238. doi: 10.1080/10807039.2020.1816809
Sarwar M. G. M. (2013). “Sea-Level rise along the coast of Bangladesh,” in Disaster risk reduction approaches in Bangladesh. Eds. Shaw R., Mallick F., Islam A. (Tokyo: Springer), 217–231.
Shao C. (2016). Study on coastal erosion and adaptive management of beach-coral reef. [Master’s thesis]. Third Institute Oceanography State Oceanic Administration. 50–63. Available at: https://kns.cnki.net/KCMS/detail/detail.aspx?dbname=CMFD201701&filename=1016256149.nh
Swami D., Parthasarathy D. (2021). Dynamics of exposure, sensitivity, adaptive capacity and agricultural vulnerability at district scale for maharashtra. India Ecol. Indic. 121, 107206. doi: 10.1016/j.ecolind.2020.107206
Thampanya U., Vermaat J. E., Sinsakul S., Panapitukkuld N.. (2006). Coastal erosion and mangrove progradation of southern Thailand. Estuarine Coast. Shelf Sci. 68 (1), 75–85. doi: 10.1016/j.ecss.2006.01.011
Thieler E. R., Hammar-Klose E. S. (2000). National assessment of coastal vulnerability to sea-level rise, preliminary results for the US Atlantic coast. Survey USGS. 28–35. doi: 10.9774/GLEAF.978-1-909493-38-4_2
Tian H. B., Yin P., Yang F. L. (2016). An analysis of erosional characteristics of the sandy coast in the eastern part of wanning, hainan. Mar. Geology Quaternary Geology. 38 (4), 44–55. doi: 10.16562/j.cnki.0256-1492.2018.04.004
Wang X. T., Zhang W. G., Yin J., Wang J., Ge J. Z., Wu J. P., et al. (2021). Assessment of coastal erosion vulnerability and socio-economic impact along the Yangtze river delta. Ocean Coast. Management. 201, 164–191. doi: 10.1016/j.ocecoaman.2021.105953
Wijitkosum S., Sriburi T. (2019). Fuzzy AHP integrated with GIS analyses for drought risk assessment: A case study from upper phetchaburi river basin, Thailand. Water. 11 (5), 939. doi: 10.3390/w11050939
Xia D. X., Wang W. H., Wu G. Q., Cui J. Q., Li F. L., et al. (1993). Coastal erosion in China. Acta Geographica Sinica. 48 (5), 468–475. doi: 10.11821/xb199305010
Yang Z. X. (2013). Monitoring coastline changes and tidal flat reclamation in jiangsu using remote sensing technology. Yellow River. 1), 85–87. doi: 10.3969/j.issn.1000-1379.2013.01.027
Yoo G., Kim A. R., Hadi S. (2014). A methodology to assess environmental vulnerability in a coastal city: Application to Jakarta, Indonesia. Ocean Coast. Management. 102, 169–177. doi: 10.1016/j.ocecoaman.2014.09.018
Keywords: Hainan Island, coral reef coast, human activities, index method, coastal erosion vulnerability
Citation: Fu G, Cao C, Fu K, Song Y, Yuan K, Wan X, Zhu Z, Wang Z and Huang Z (2022) Characteristics and evaluation of coastal erosion vulnerability of typical coast on Hainan Island. Front. Mar. Sci. 9:1061769. doi: 10.3389/fmars.2022.1061769
Received: 05 October 2022; Accepted: 15 November 2022;
Published: 20 December 2022.
Edited by:
Yi Pan, Hohai University, ChinaReviewed by:
Ping Wang, University of South Florida, United StatesZhiqiang Li, Guangdong Ocean University, China
Copyright © 2022 Fu, Cao, Fu, Song, Yuan, Wan, Zhu, Wang and Huang. This is an open-access article distributed under the terms of the Creative Commons Attribution License (CC BY). The use, distribution or reproduction in other forums is permitted, provided the original author(s) and the copyright owner(s) are credited and that the original publication in this journal is cited, in accordance with accepted academic practice. No use, distribution or reproduction is permitted which does not comply with these terms.
*Correspondence: Chao Cao, Y2FvY2hhb0B0aW8ub3JnLmNu; KaiZhe Fu, ZnVrYWl6aGVAbWFpbC5jZ3MuZ292LmNu