 Myeong-Taek Kwak
 Yang-Ki Cho
- 1Fishery Resource Management Research Institute based on Information and Communication Technology (ICT), Chonnam National University, Yeosu, South Korea
- 2School of Earth and Environmental Sciences/Research Institute of Oceanography, Seoul National University, Seoul, South Korea
A high-resolution, three-dimensional numerical ocean model was employed to understand the exchange flow through Noryang Channel, which connects Gwangyang Bay and Jinju Bay. These two bays exhibit contrasting topographies, with Gwangyang Bay connected to the open ocean through a broad and deep channel, whereas Jinju Bay is relatively isolated from the open ocean by a narrow and shallow channel. Numerical experiments were conducted to determine the contribution of river discharge, wind stress, surface heat flux, and tides to the exchange flow between the two bays during summer. The results suggested that river discharge was the dominant factor affecting the exchange flow along Noryang Channel. Particularly, a high river discharge during summer increased the sea level in Jinju Bay, creating a barotropic flow toward Gwangyang Bay. However, the dense water entering Gwangyang Bay through the wide and deep channel generated a baroclinic flow toward Jinju Bay along the lower layer of Noryang Channel. An analytical model supported the conclusion that river discharge is the main driver of the exchange flow in Noryang Channel.
1. Introduction
The southern coast of the Korean Peninsula is characterized by the presence of numerous bays enclosed by capes and islands, two of which are the semi-enclosed Gwangyang and Jinju Bays. Gwangyang and Jinju Bays have an area of 259 and 168 km2, an average depth of 12 and 5 m, and a volume of 3.05 and 0.83 km3, respectively. Gwangyang Bay is connected to the open ocean through the broad and deep Yeosu Channel, whereas Jinju Bay is more isolated, being connected to the open ocean only through Changseon and Daebang Channels, which are narrow and shallow and contain a number of small islands. These two bays are interconnected by the narrow and deep Noryang Channel, which is approximately 500 m wide and 30 m deep (Figure 1).
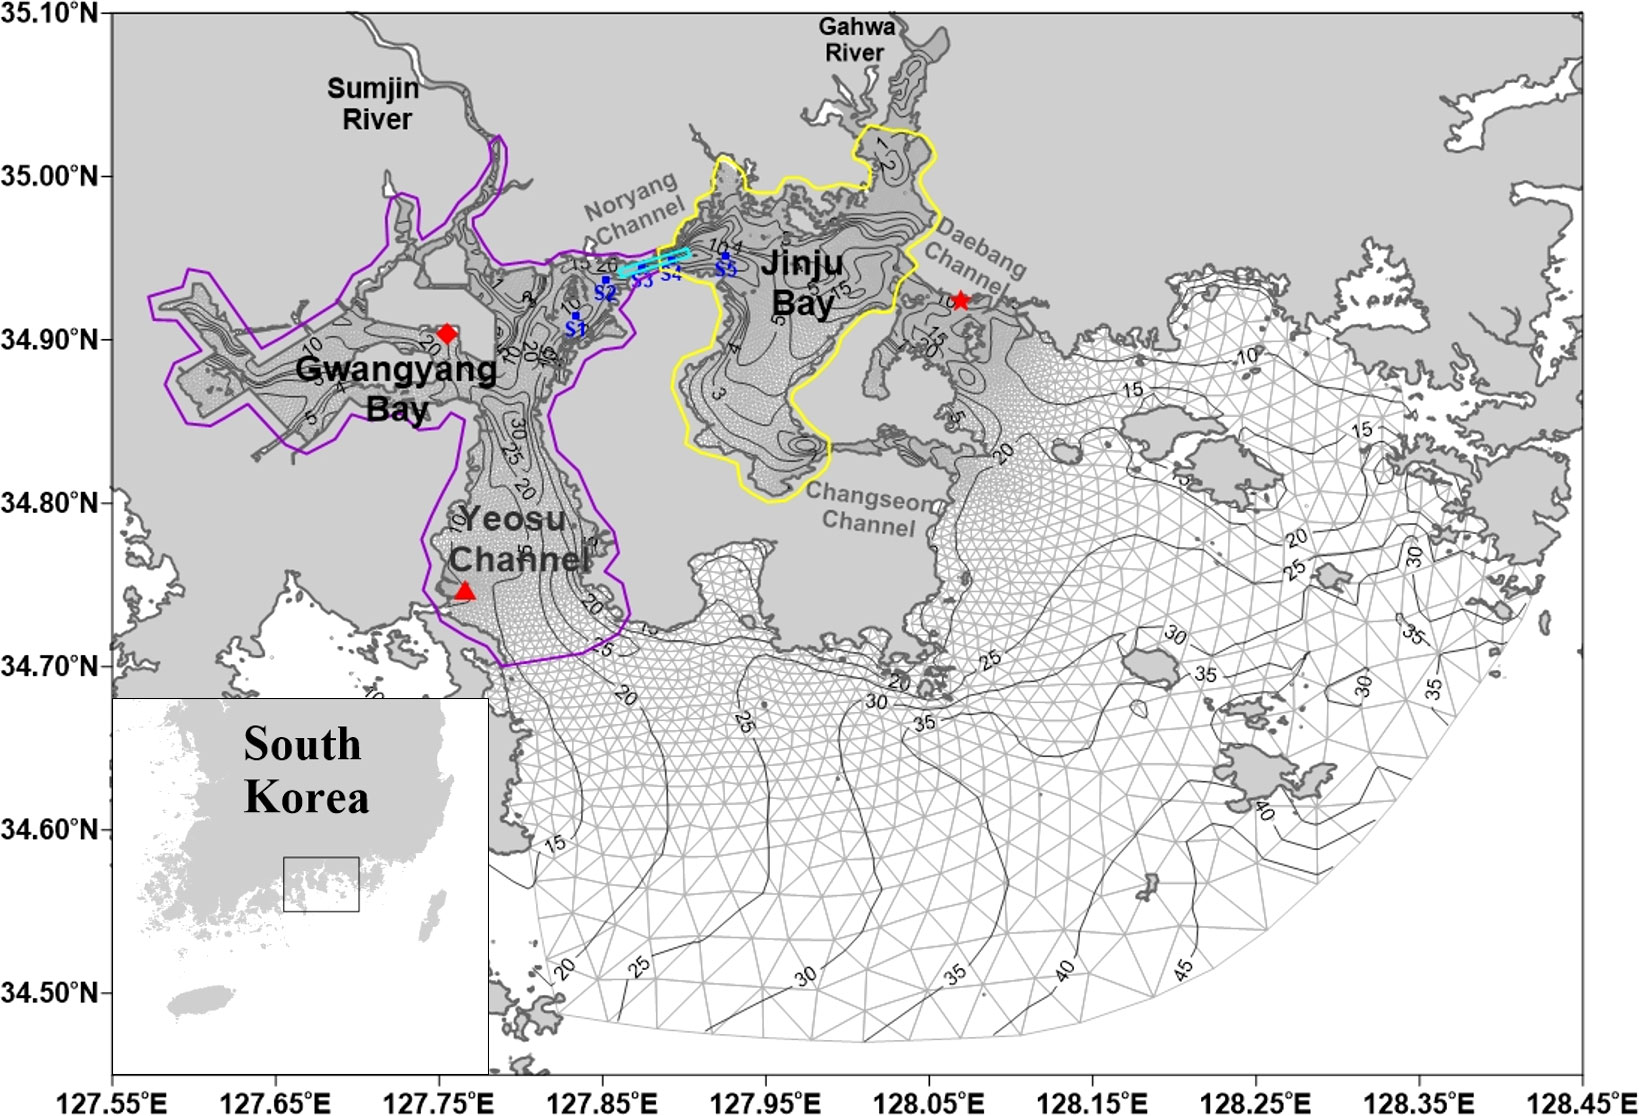
Figure 1 Study area, including Gwangyang and Jinju Bays. The red diamond, triangle, and star indicate the location of the tidal stations at Gwangyang, Yeosu, and Samcheonpo, respectively. The cyan rectangle denotes the location of the vertical profiles for the temperature, salinity, density, sea level, and density gradient. The blue circles represent CTD observation stations. The solid black lines indicate the water depth in meters. The gray triangles represent the model grid. The solid purple and yellow lines represent the initial concentration areas for dye experiment in Gwangyang and Jinju Bays, respectively.
The study area is characterized by semidiurnal tides, with an average range of approximately 3 and 1 m during spring and neap tides, respectively (Choo et al., 2002). Because Jinju Bay is affected by the presence of islands, the tidal current in Noryang Channel is mainly governed by tidal waves propagating through Gwangyang Bay. Additionally, the Tsushima Current to the south of the two bays exhibits an eastward flow all year round (Cho et al., 2009; Cho et al., 2013).
Gwangyang and Jinju Bays are influenced by freshwater discharge from Sumjin and Gahwa Rivers, respectively. During period of heavy precipitation, the discharge from these rivers can exceed 2000 m3/s. High-volume freshwater discharge mainly occurs during the summer monsoon season, with more than 80% of the annual discharge occurring during summer (Kwak and Cho, 2020).
Coastal development in and around Gwangyang Bay, such as the construction of industrial complexes and channel dredging, has increased the pollution levels in this bay (Park et al., 2005). In contrast, there are several oyster and fish farms in Jinju Bay (Ro et al., 2007), occupying approximately 33% of the total area of the bay. Thus, it is crucial to evaluate the potential pollution risk posed by the pollutants originating in Gwangyang Bay on Jinju Bay, particularly during summer when the exchange flow is highest (Kwak and Cho, 2020). Moreover, oil spill accidents frequently occur in Gwangyang Bay (Lee, 2001), with 250 accidents spilling a total of 9080 kl into the bay from 1991 to 2000 (Lee, 2001).
Therefore, understanding the hydrographic responses in Gwangyang and Jinju Bays to various external factors during summer, and the resulting exchange flow between the two bays is crucial. The most likely drivers of circulation in most coastal bays are river discharge, surface heat flux, wind stress, and tides (Valle-Levinson et al., 1998; Guo and Valle-Levinson, 2007; Ralston et al., 2008). Particularly, stratification due to freshwater inflow plays a crucial role in determining the hydrography and flow of most coastal bays in summer. Additionally, the exchange flow in Noryang Channel can be driven by differences in the surface elevation and horizontal density between the two bays.
Thus, this study conducted three-dimensional numerical experiments to evaluate the contribution of potential drivers to the exchange flow between the two bays during summer. Numerical models that employ a fine grid system to resolve the exchange flow in narrow channels are necessary to clearly understand the dynamics in real channels with a complex topography. Accordingly, the model employed in this study controlled the river discharge, wind stress, surface heat flux, and tides to determine their effect on the exchange flow between Gwangyang and Jinju Bays.
2. Experimental model design
For the numerical experiments, this study adopted the Finite Volume Community Ocean Model (FVCOM) developed by Chen and Beardsley, (2006) to reproduce the exchange flow in Noryang Channel during a period of significant discharge in 2003. The FVCOM utilized an unstructured triangular grid system to precisely fit the shoreline and imposed a sigma-coordinate system for the vertical layers. The level 2.5 turbulence closure scheme developed by Mellor and Yamada (1982) was employed for vertical eddy mixing, and Smagorinsky (1963) formula was employed for horizontal eddy viscosity and diffusivity. Further details on the FVCOM are available in the study by Chen and Beardsley (2006).
The area covered by the model included Gwangyang and Jinju Bays and the nearby open ocean (Figure 1). The grid size in the study area ranged horizontally from a minimum of 60 m in the Sumjin River estuary to a maximum of 5000 m in the open boundary, with 10 vertical sigma layers. The temperature and salinity of the open boundary and initial conditions were calculated for the model grid using observed data from the National Institute of Fisheries Science of Korea (www.nifs.go.kr) for 2003. Interim data for 2003, including shortwave radiation, longwave radiation, wind speed, air pressure, and relative humidity, were obtained from the European Centre for Medium-Range Weather Forecasts (ECMWF) to establish the surface atmospheric conditions. The average wind speed during summer for the experiment period was 3.8 m/s. NAO.99Jb regional tide model data (Matsumoto et al., 2000) were employed along the open boundary using eight tidal components (M2, S2, K1, O1, N2, K2, P1, and Q1). The freshwater discharge from Sumjin and Gahwa Rivers was modeled using daily data from Korea Water Resources Corporation (www.kwater.or.kr).
The weather in 2003 exhibited typical seasonal variation (Chung et al., 2004). The river discharge from the Sumjin and Gahwa Rivers from 25 June to 29 July was set at 656.7 and 559.1 m3/s, respectively. The river temperature was based on conductivity, temperature, and pressure (i.e., CTD) data observed in 2006 (Shaha et al., 2012) owing to the lack of water temperature data from 2003. Observational data suggest that the difference in the water temperature of the rivers between 2003 and 2006 was not significant (Kwak and Cho, 2020).
Four additional sensitivity experiments that excluded either wind stress, river discharge, surface heat flux, or tides from the control experiment were conducted (Table 1). The differences between the control experiment and sensitivity experiments were calculated to examine the effects of the factors on the exchange flow in Noryang Channel from 26 June to 24 July 2003. The difference (i.e., Control – Sensitivity) between the control experiment and the sensitivity experiments may represent the effect of each factor on the hydrography of both bays and the exchange flow in Noryang Channel.
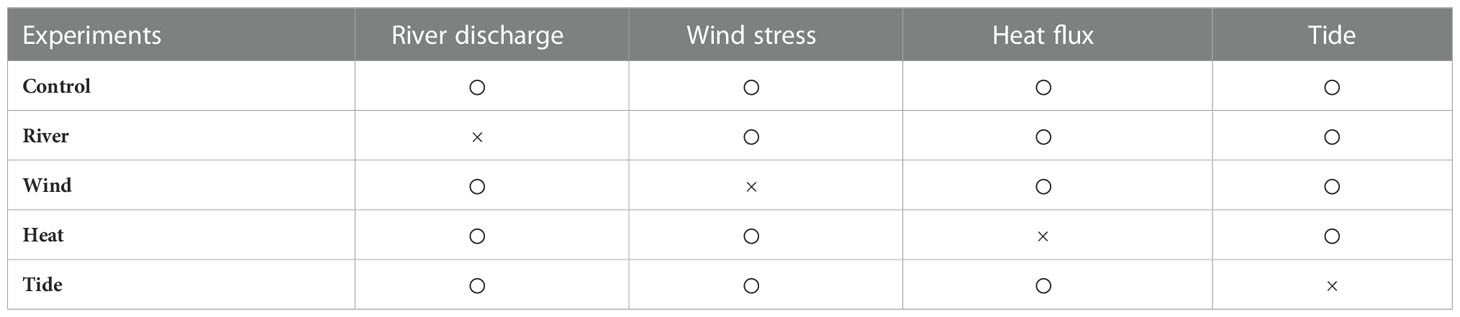
Table 1 External factors considered in each experiment.
3. Model validation
To verify the performance of the model, the tidal components from the control experiment and from observations at Yeosu, Gwangyang, and Samcheonpo tidal stations were compared (Figure 2) because the tidal elevation is a major factor governing the tidal current in both bays. Semidiurnal waves are dominant in the study area, with an average tide range of ~3 and ~1 m during spring and neap tides, respectively (Choo et al., 2002). The amplitude and phase at the Yeosu tidal station calculated in the control experiment were consistent with the observations (Figure 2). The differences in the tidal components at the Yeosu tidal station calculated using the control model and the observations were slightly lower than that at the Gwangyang tidal station. The root mean squared error (RMSE) for the amplitude observed at the Gwangyang, Yeosu, and Samcheonpo tidal stations was 3.0, 1.2, and 4.3 cm, respectively, and the RMSE for the phase was 15.2, 1.4, and 12.0°, respectively. The RMSE between the experimental and observed data was calculated using Eq. (1):
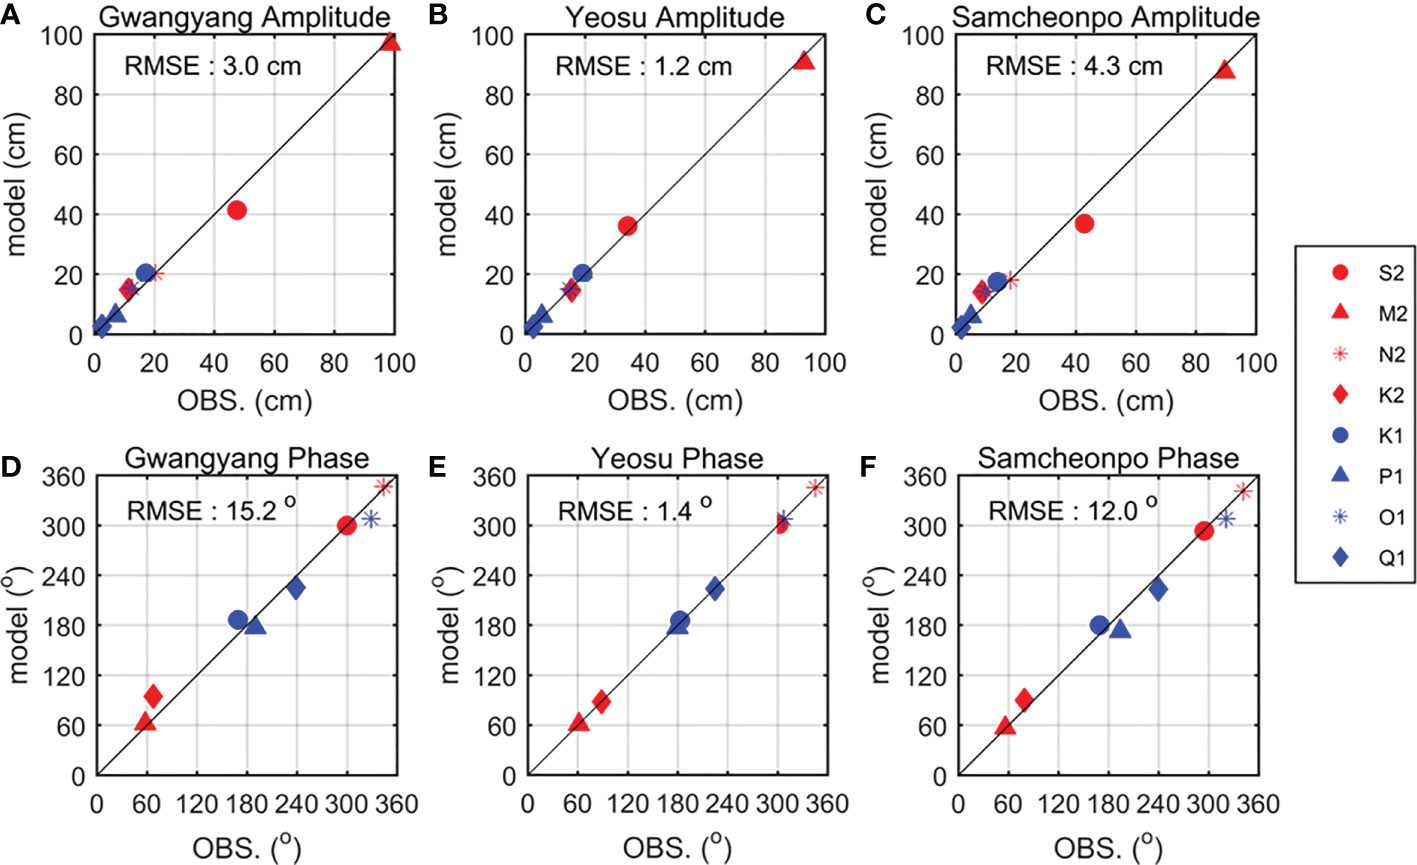
Figure 2 Comparison of the tidal amplitude and phases of the model and observations at: (A) and (D) Gwangyang, (B) and (E) Yeosu, and (C) and (F) Samcheonpo tidal stations (see Figure 1 for the locations).
where i is a specific tidal component.
Observations and the model predictions of the seawater temperature and salinity from stations S1 to S5 in Noryang Channel were compared (Figure 3). The observations revealed relatively light water (T: >20.8 °C; S<20) in the upper layer of Jinju Bay and dense water in the lower layer of Gwangyang Bay. The water temperature predicted by the model was consistent with the observations, with a difference of less than 0.5 °C. In addition, the salinity calculated by the model exhibited a stratified structure, which is consistent with the observations.
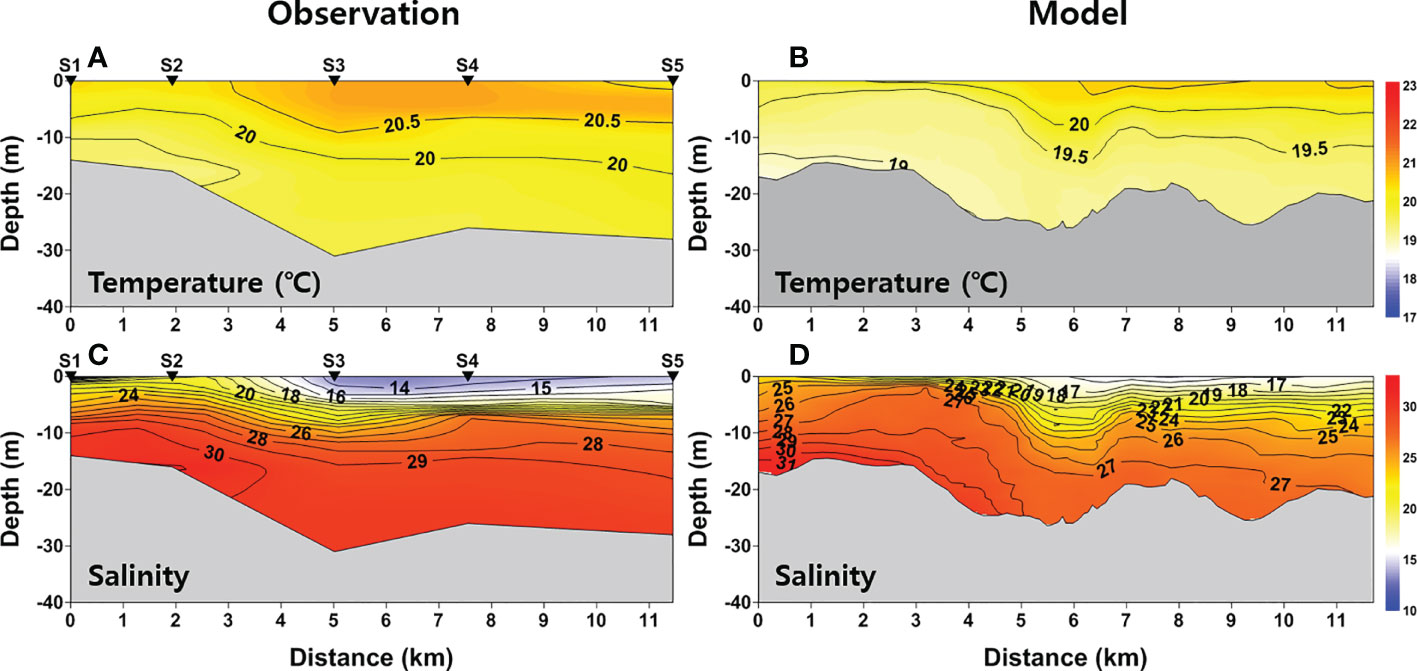
Figure 3 Comparison of (A) and (C) observed and (B) and (D) modeled vertical profiles from stations S1 to S5 for (A) and (B) temperature and (C) and (D) salinity on 13 July 2003.
4. Results
4.1. Horizontal distribution of temperature, salinity, and surface elevation
The horizontal surface temperature, salinity, and surface elevation obtained from the control experiment were averaged over the 28.5 days from 26 June to 24 July (Figure 4). The results revealed that the mean sea surface temperature was high at the head of the river estuaries and decreased toward the mouth, whereas it was lower in the two bays than in the rivers and decreased at distances closer to the open sea (Figure 4A). In contrast, the surface salinity exhibited the opposite trend: it was low at the head of the river estuaries, increased toward the bay, and was highest near the open sea (Figure 4B). The surface density was more strongly affected by the salinity than the water temperature, so it exhibited a similar trend to that of the surface salinity (Figure 4C). The mean surface elevation in Jinju Bay was approximately 2 cm higher than that of Gwangyang Bay (Figure 4D). In the Sumjin and the Gahwa River estuaries, the surface elevation was above 20 cm owing to the high river discharge. The surface elevation near the open sea was close to zero.
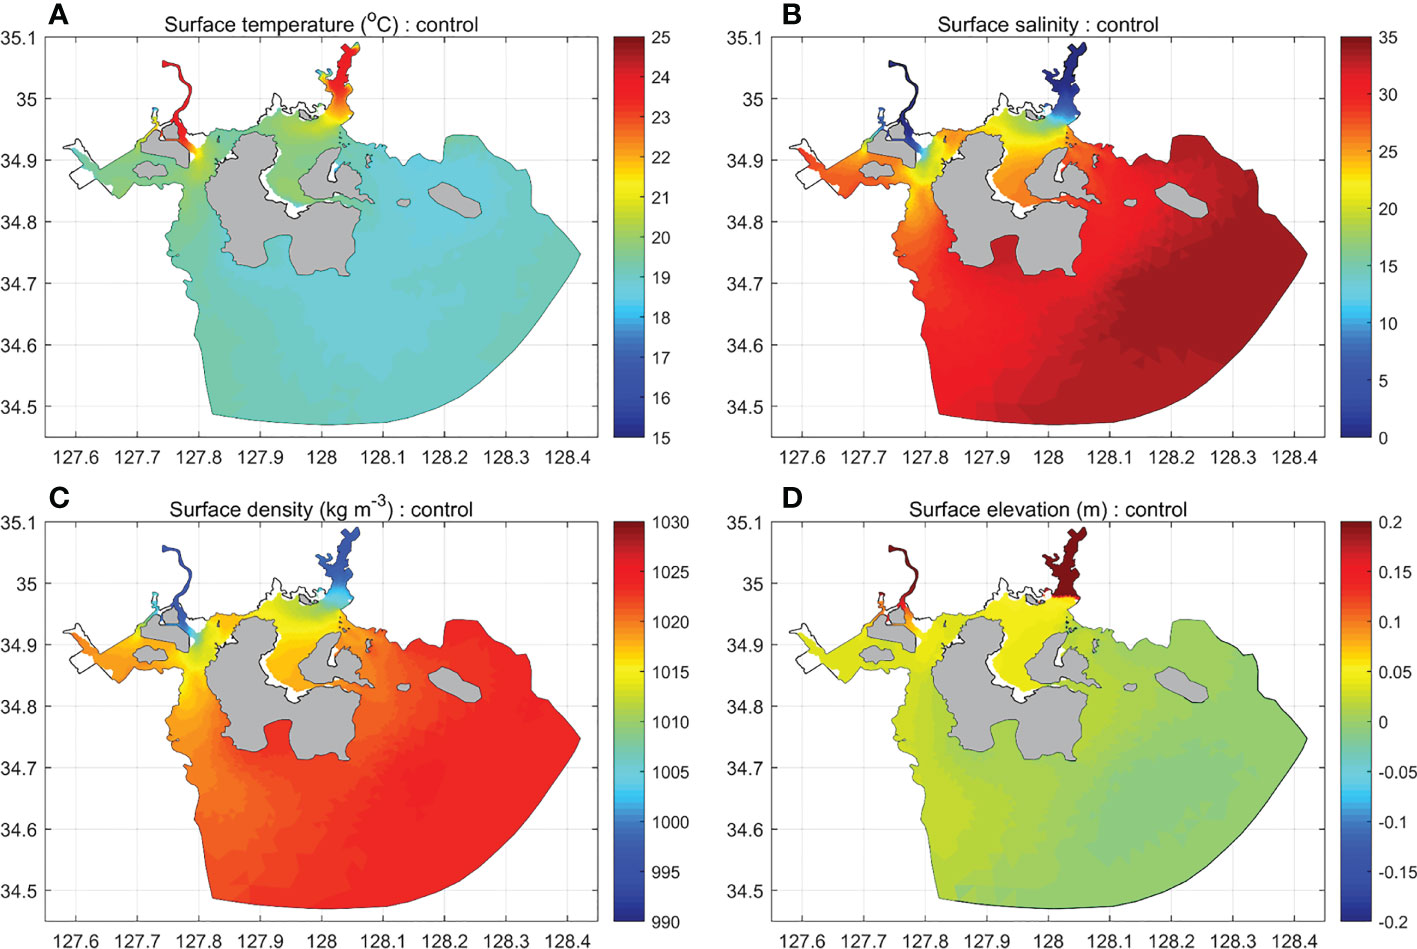
Figure 4 Averaged surface: (A) temperature, (B) salinity, (C) density, and (D) elevation results for the control model from 26 June to 24 July.
In the river experiment, the surface temperature was 2.3 °C higher in Sumjin and Gahwa Rivers and 0.9 °C higher in Gwangyang and Jinju Bays than in the control experiment, and it increased slightly near the open sea (Figure 5A). The wind stress contributed to a 0.5 °C decrease in the surface temperature near the open sea (Figure 5B), whereas the surface heat flux caused an increase in the surface temperature except in Sumjin and Gahwa Rivers, with an increase of 1 °C in Gwangyang and Jinju Bays and 2 °C near the open sea (Figure 5C). Additionally, the tides decreased the surface temperature in the central part of Gwangyang Bay and the mouth of the Gahwa River estuary owing to vertical mixing (Figure 5D).
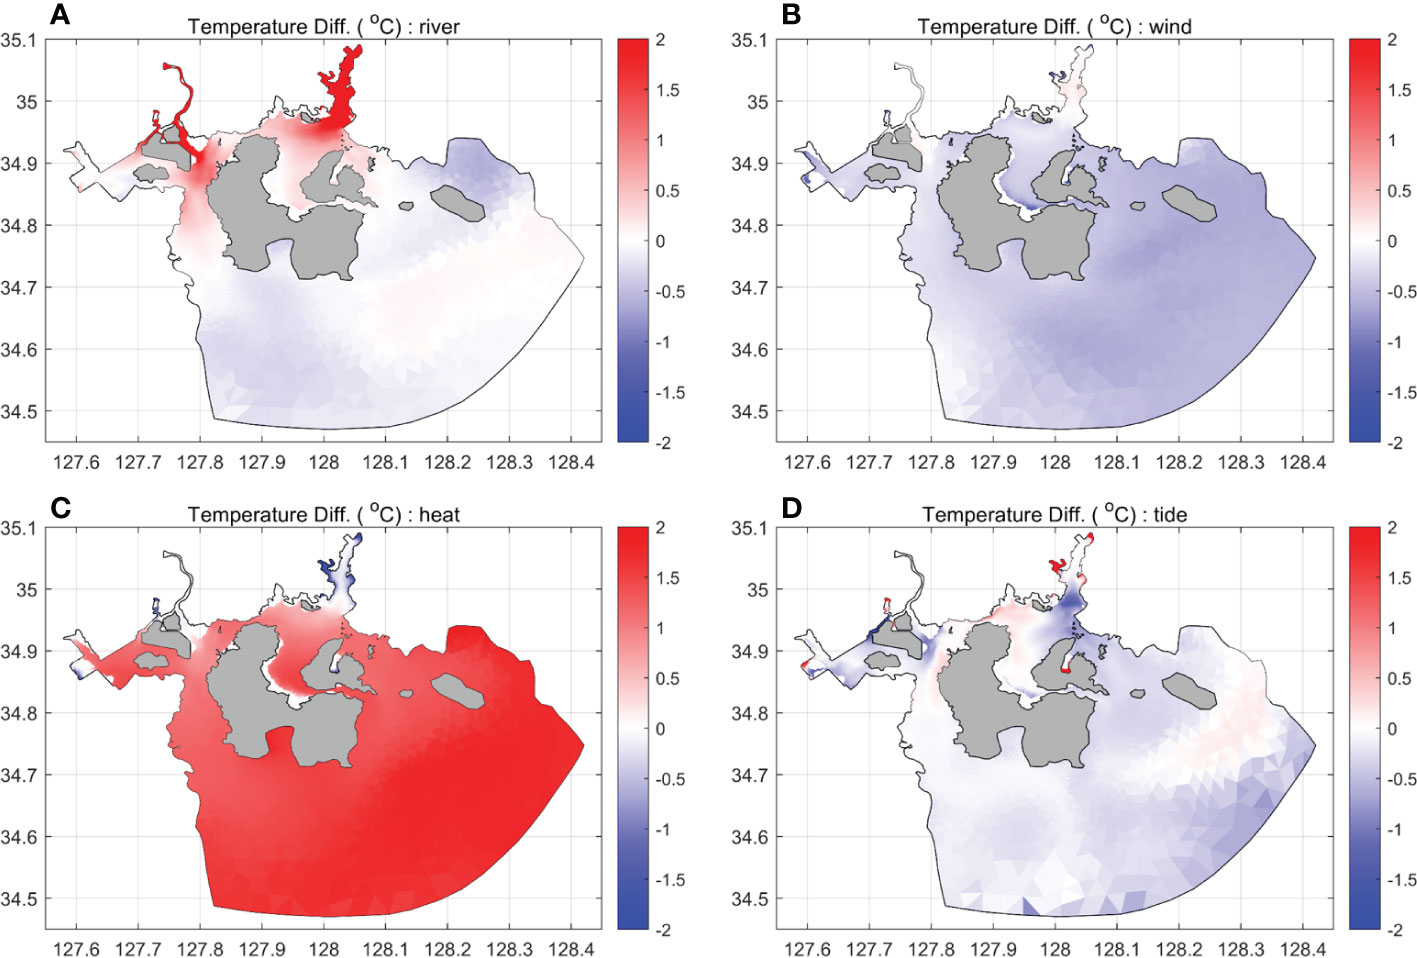
Figure 5 Contribution of river discharge, wind, heat flux, and tide to the surface temperature. The surface temperature represents the difference between the control experiment and the: (A) river discharge, (B) wind, (C) heat flux, and (D) tide experiments averaged from 26 June to 24 July.
The surface salinity of both bays was mostly affected by the river discharge, which significantly reduced their salinity (Figure 6A). The wind stress and surface heat flux exerted only a slight effect on the surface salinity (Figures 6B and C), whereas the tides increased the surface salinity in the central part of Gwangyang Bay and downstream of Gahwa River, which are relatively shallow and experience strong tidal currents (Figure 6D). In each sensitivity model (i.e., Control – Sensitivity), the distribution of the surface density was similar to that of the salinity.
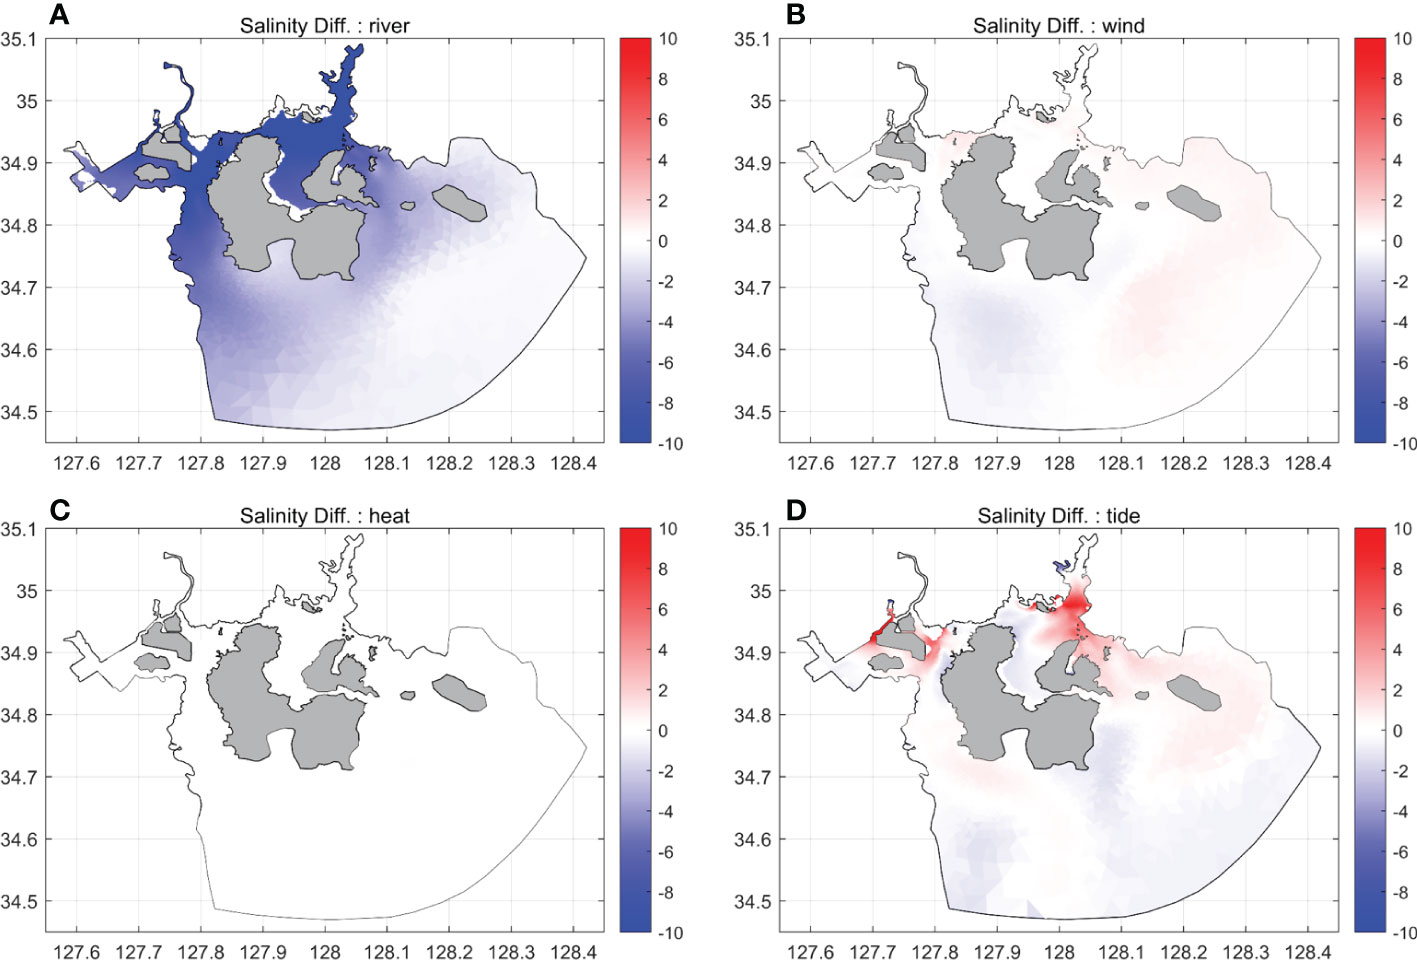
Figure 6 Same as Figure 5, but with surface salinity.
The surface elevation of Jinju Bay was approximately 2 cm higher than that of Gwangyang Bay in the river experiment (Figure 7A). Despite the similarity in the river discharge from Sumjin and Gahwa Rivers affecting the two bays, the surface elevation of Jinju Bay was higher owing to its isolation, whereas Gwangyang Bay is connected to the open sea through the broad and deep Yeosu Channel. The wind stress, surface heat flux, and tides did not significantly contribute to the mean surface elevation in either bay (Figures 7B, C, and D). However, the tides resulted in a higher surface elevation in shallow coastal areas where tidal flats were present (Figure 7D).
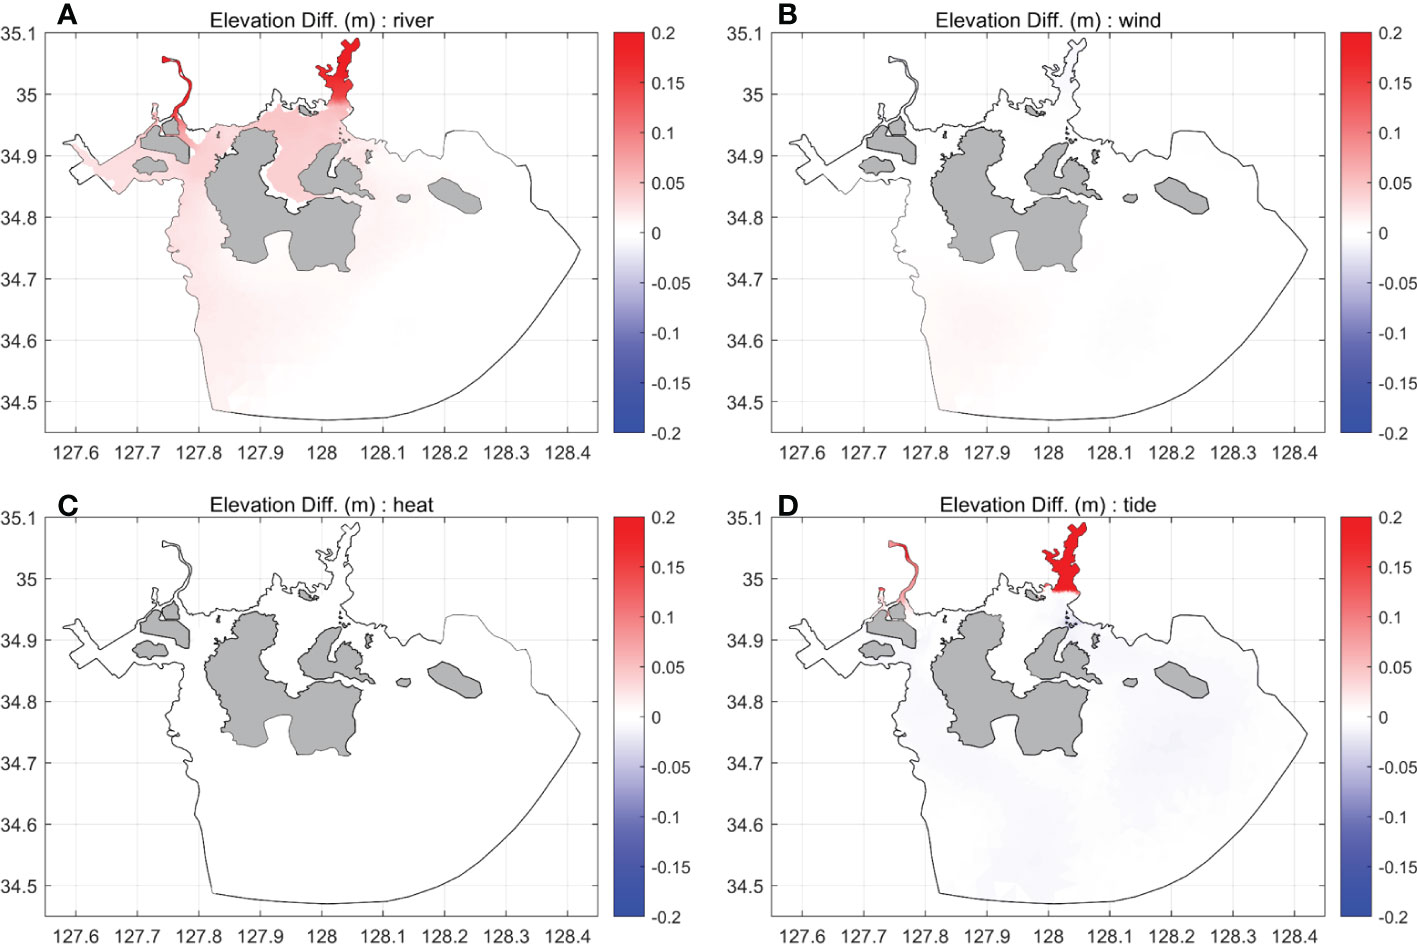
Figure 7 Same as Figure 5, but with surface elevation.
In summary, these results collectively indicated that river discharge was the primary contributor to the differences in the surface elevation and horizontal density of the two bays. Particularly, the structure produced by the control model was similar to that of the river experiment in terms of the distribution of the surface elevation.
4.2. Vertical temperature, salinity, and density profiles along the channel
According to the control experiment, the distribution of the seawater temperature along the Noryang Channel exhibited a stratified structure with a temperature of approximately 19.5 °C in the surface layer and less than 19 °C in the lower layer (Figure 8A). In addition, the salinity was lower than 25 in the surface layer, but above 29 in the bottom layer (Figure 8B). Consequently, the density also exhibited a stratified distribution due to the difference between the surface layer and the lower layer in terms of temperature and salinity. The density was less than 1017 kg m-3 in the surface layer and more than 1020 kg m-3 in the lower layer (Figure 8C). Denser water (T<19 °C, S >30) was observed in the lower layer of Gwangyang Bay, whereas less dense water (T >19.5 °C, S<23) was observed in the surface layer of Jinju Bay. The dissipation rate (ϵ ) was calculated using the following equation (Chen and Beardsley, 1998; Chen and Beardsley, 2006):
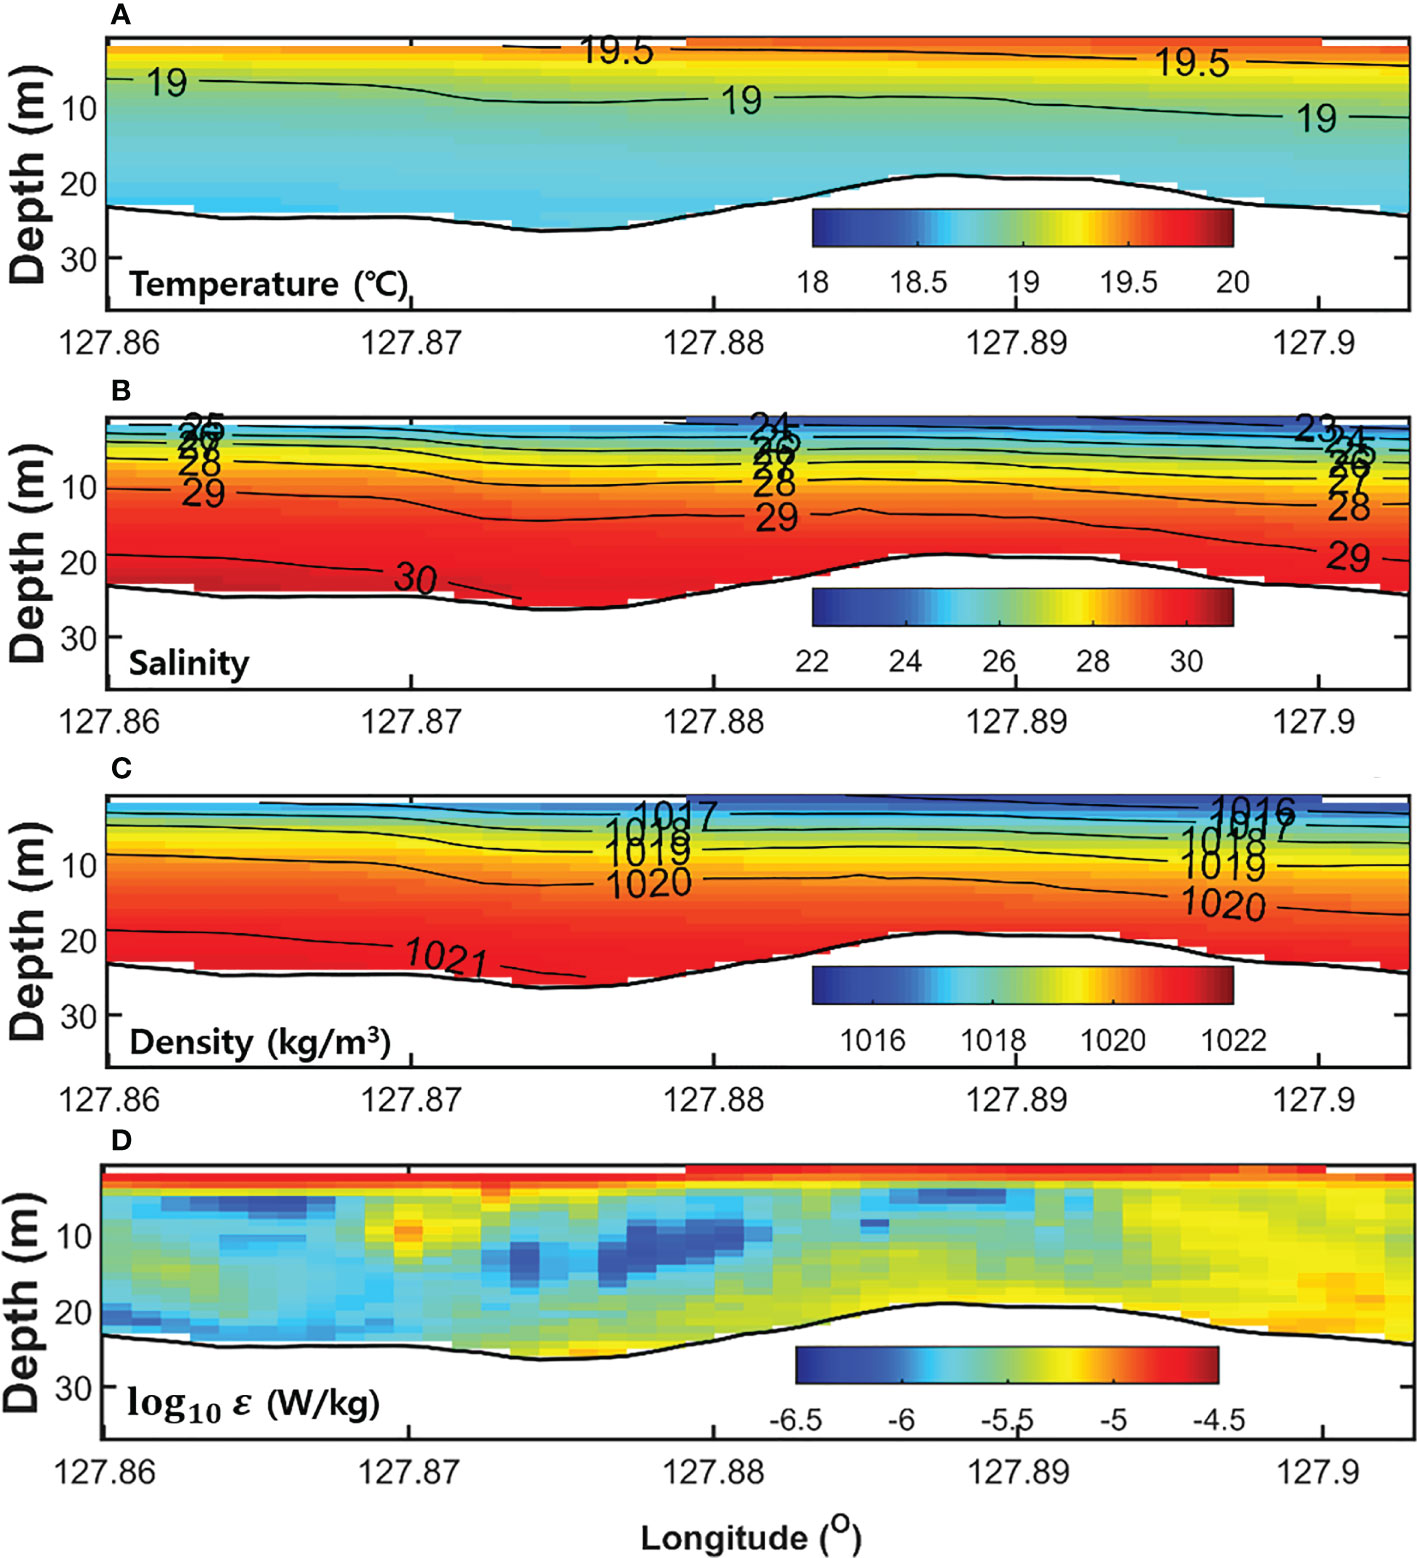
Figure 8 Vertical profiles of (A) temperature, (B) salinity, (C) density, and (D) dissipation rates in the control experiment along Noryang Channel (the cyan line in Figure 1) averaged from 26 June to 24 July.
q2=(u2+v2)/2 represents the turbulent kinetic energy, B1 is a constant equal to 16.6, l is the turbulent length scale. The dissipation rate was higher in the surface layer of both bays. The dissipation rate in the bottom layer of Jinju Bay was higher than that of Gwangyang Bay (Figure 8D).
The comparison of the control and river experiments (Control – Sensitivity) revealed an increase in temperature and a decrease in salinity owing to the river discharge. The maximum difference in the temperature and salinity in the surface layer was approximately 0.8 °C and 9, respectively (Figures 9A and 9B). The decrease in the density in the lower layer and surface layer was approximately 2.5 and 7 kg m-3, respectively (Figure 9C). The increase in temperature may be attributed to the relatively warm river water during summer, and the reduced salinity could be attributed to the freshwater discharge from the two rivers.
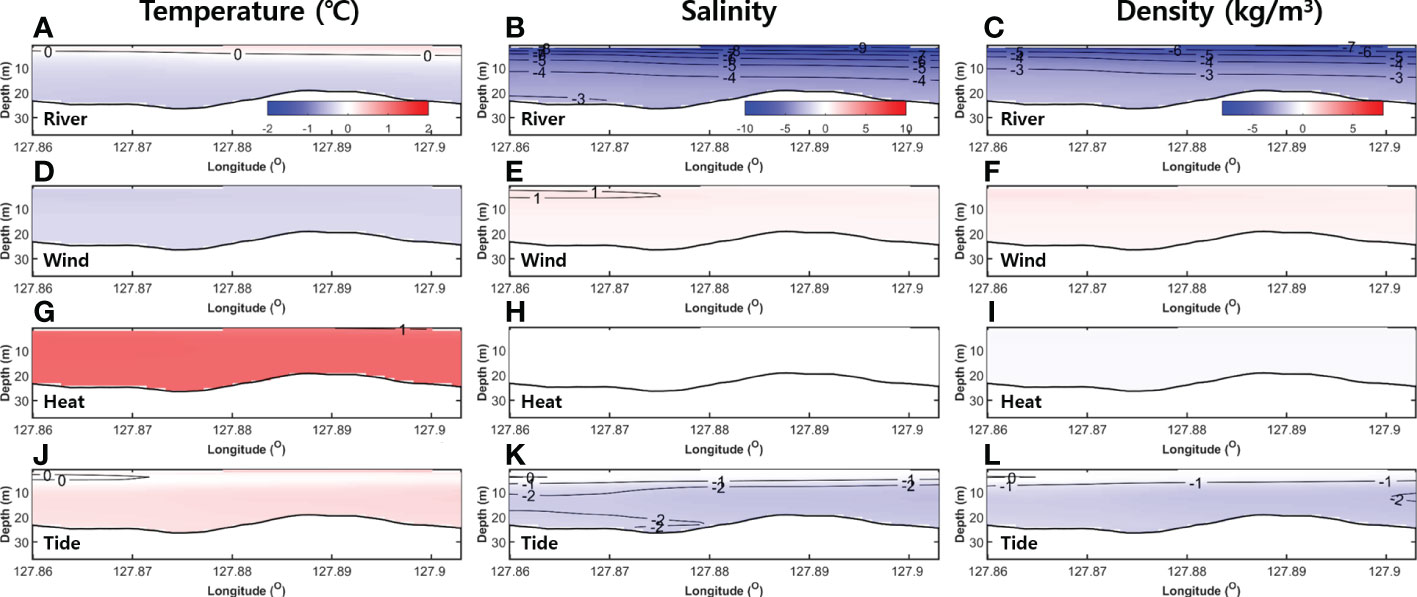
Figure 9 Differences in the [(A), (D), (G), (J)] temperature, [(B), (E), (H), (K)] salinity, and [(C), (F), (I), (L)] density of the control experiment and the [(A), (B), (C)] river, [(D), (E), (F)] wind, [(G), (H), (I)] heat, and [(J), (K), (L)] tide experiments along Noryang Channel averaged from 26 June to 24 July.
Additionally, the comparison of the control and wind experiments revealed that there was only a slight change in the temperature, whereas the salinity increased due to wind stress (Figures 9D and 9E). Further, the maximum salinity increased slightly in the surface layer owing to vertical mixing via wind stress. The difference in density was less than 1 kg m-3 (Figure 9F).
The heat flux experiment revealed an increase of approximately 1 °C in the temperature compared to the control experiment, which could be attributed to surface heat flux (Figure 9G). The difference in the salinity and density was very small (Figures 9H and 9I).
In the tide experiment, although there was no significant change in the water temperature, the salinity in the surface layer increased, while that in the lower layer decreased due to active vertical mixing by the tidal currents (Figures 9J and 9K). The maximum change in the salinity was higher than 2 in the lower layer. Consequently, the density increased by approximately 2 kg m-3 in the lower layer, but decreased by approximately 1 kg m-3 in the surface layer (Figure 9L).
These experimental results suggest that river discharge was the primary factor influencing the spatial variation in the temperature, salinity, and density within the study area. The wind stress slightly increased the salinity in the surface layer, whereas heat only increased the water temperature by approximately 1 °C. The tides changed both the water temperature and salinity, while they weakened the stratification via vertical mixing.
5. Discussion
5.1. Differences in the surface elevation and density along the channel
The mean flow in Noryang Channel may be driven by differences in the surface elevation and horizontal density gradient between the two bays. This study examined the vertical profiles for the surface elevation, horizontal density gradient, and residual current derived from the control experiment to determine the spatial change along Noryang Channel (Figure 10). Positive and negative residual currents indicated an eastward flow to Jinju Bay and a westward flow to Gwangyang Bay, respectively.
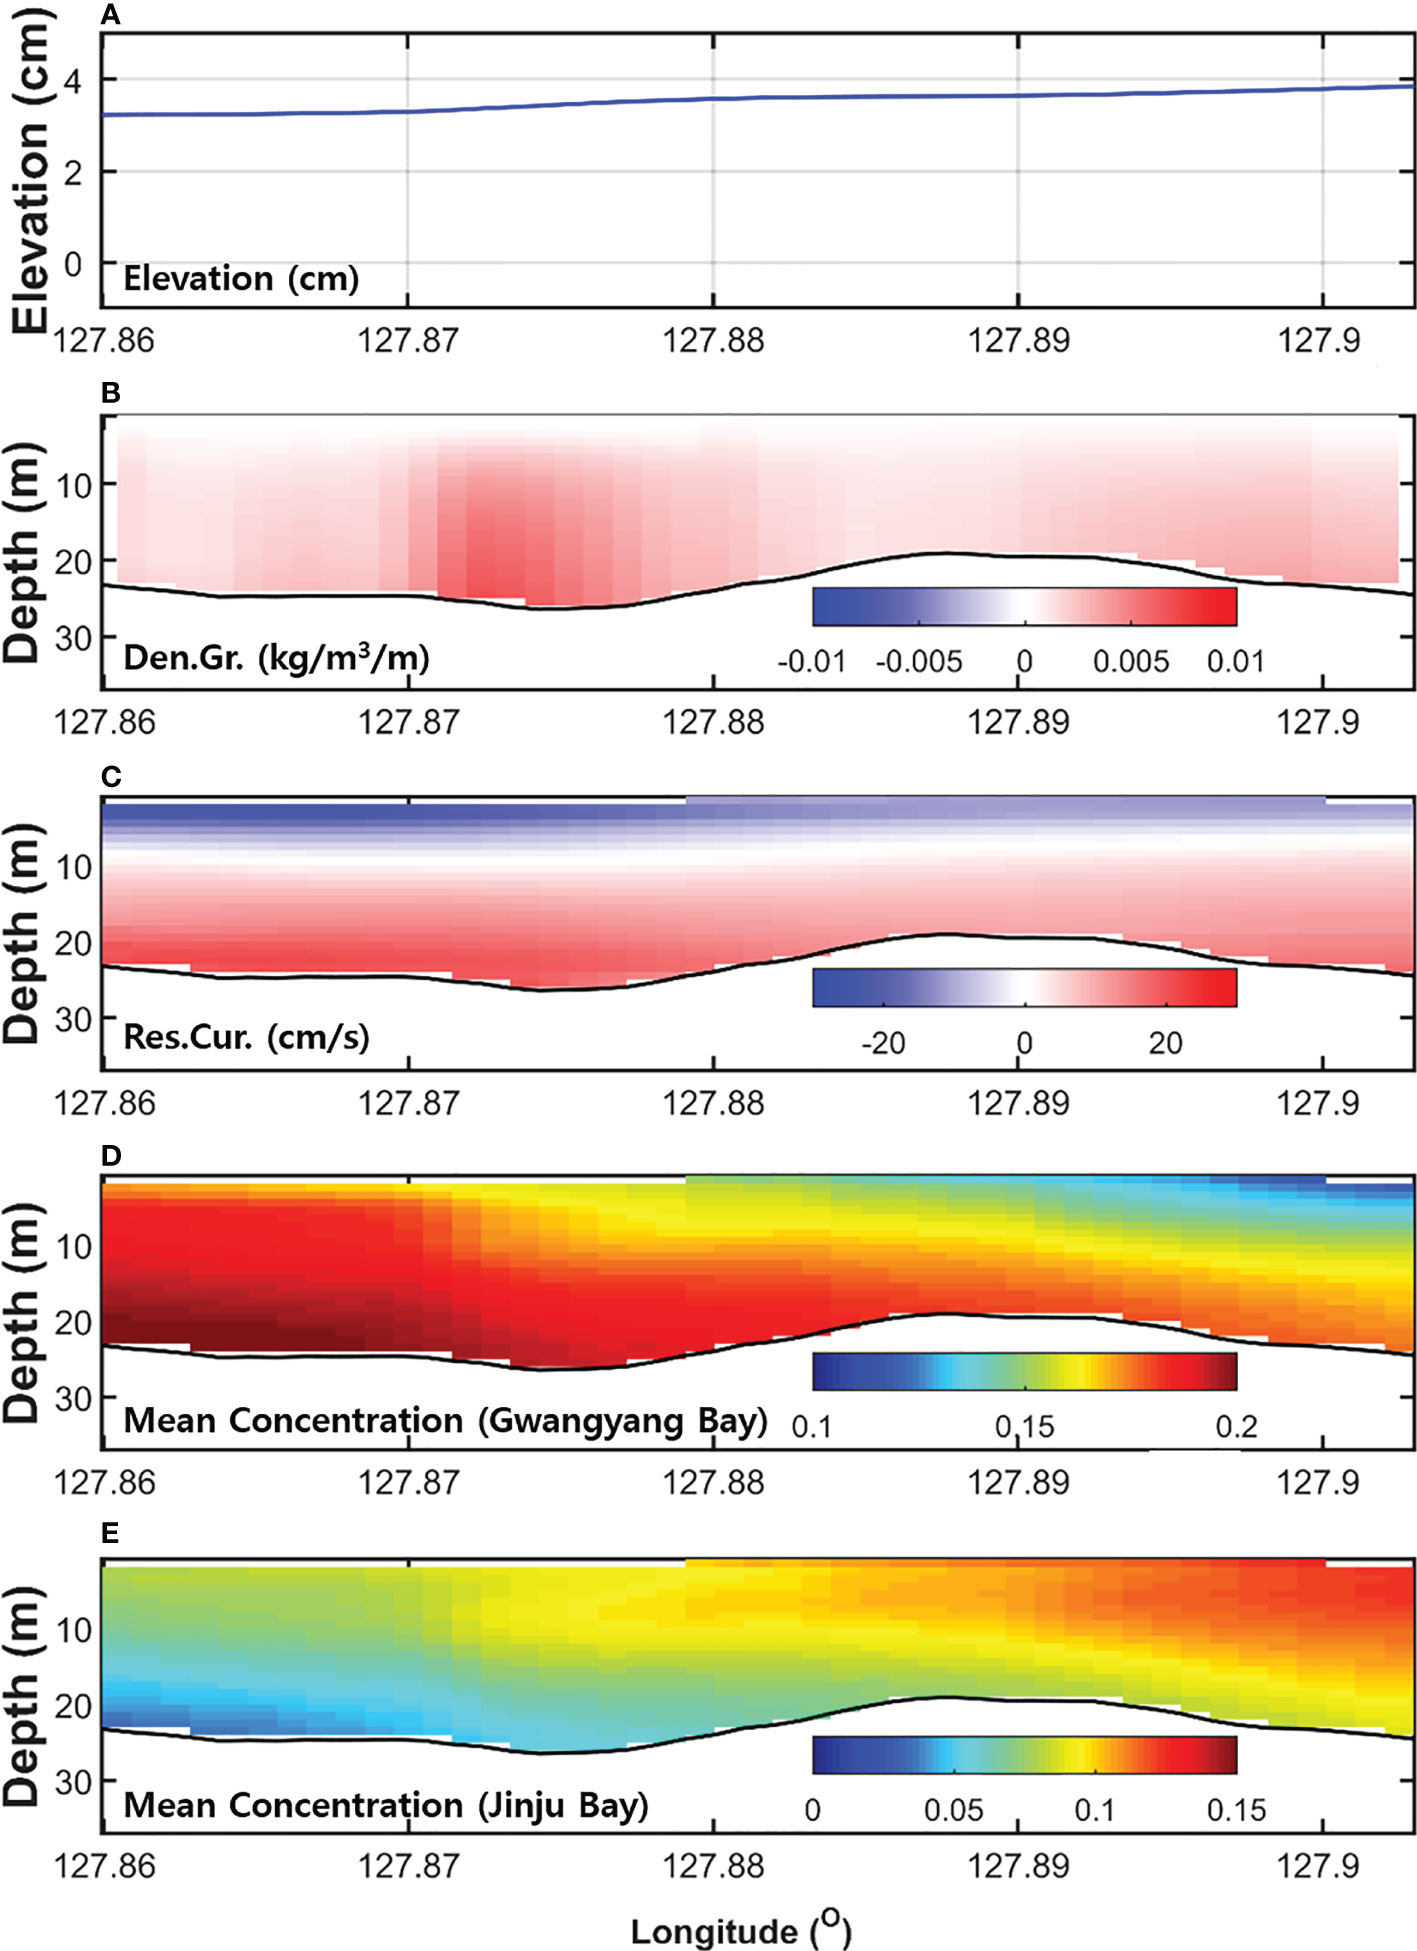
Figure 10 Vertical profiles of the (A) surface elevation, (B) density gradient, and (C) residual current from the control experiment along the Noryang Channel averaged from 26 June to 24 July. (D) Distribution of dye originating from Gwangyang Bay and (E) distribution of dye originating from Jinju Bay. The positive and negative residual currents represent eastward and westward flows, respectively.
The control experiment revealed that the surface elevation near Jinju Bay was approximately 1 cm higher than that near Gwangyang Bay (Figure 10A). The eastward flow in the Noryang Channel was driven by the horizontal density gradient (0.01 kg/m3/m) (Figure 10B), whereas the westward residual flow in the surface layer was driven by the difference in the surface elevation (Figure 10C).
The results of dye concentration experiments in the Noryang Channel were analyzed to figure out exchange flow. Figures 10D, E show the result of two experiments with the initial dye concentration of 1.0 only in Gwangyang Bay and Jinju Bay, respectively. Further detailed numerical design can be found in previous study (Kwak and Cho, 2020). The high concentration in the lower layer originates from Gwangyang Bay, whereas that in the surface layer originates from Jinju Bay. The results of dye distribution distinctly show that the exchange flow is westward in the surface layer but eastward in the lower layer.In the river experiment, the difference in the surface elevation between Gwangyang and Jinju Bays was approximately 1.0 cm (Figure 11A). Additionally, the horizontal density gradient was positive, with a maximum gradient of 0.0061 kg/m3/m at the bottom (Figure 11B). The residual current flowed westward in the surface layer, but eastward in the middle and lower layers, as in the control experiment (Figure 11C).
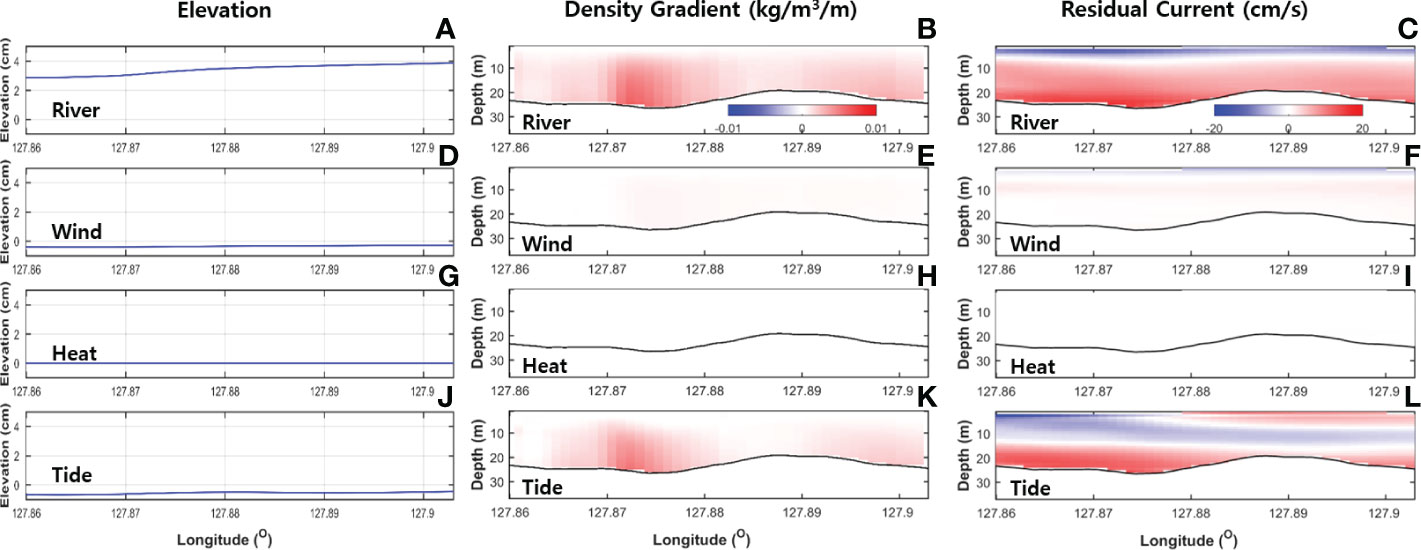
Figure 11 Differences (Control – Sensitivity) in the surface elevation, density gradient (kg/m3/m), and residual current of the control experiment and the (A–C) river, (D–F) wind, (G–I) heat, and (J–L) tide experiments for the vertical profile along Noryang Channel averaged from 26 June to 24 July.
There was only a slight change in the surface elevation and density gradient in the wind experiment (Figures 11D, E). The residual current weakly flowed to Gwangyang Bay in the surface layer, but the opposite direction in the subsurface (Figure 11F). There were no differences between these parameters of the two bays in the heat experiment (Figures 11G and 11H), and the residual current was close to zero in the whole section (Figure 11I). Additionally, the surface elevation was mostly unchanged in the tide experiment, but the density gradient increased in the lower layer (Figures 11J, K). The residual current showed a complex structure. The residual current of the surface layer flowed westward in the west but eastward in the bottom layer (Figure 11L).
5.2. Barotropic and baroclinic forces along the channel
The horizontal pressure gradient force along the channel () can be decomposed into barotropic and baroclinic forces as follows:
where and represent the barotropic and baroclinic forces, respectively, P , ρ , and ρ0 are the pressure, density, and depth-averaged density, respectively, g is the gravitational acceleration, and x and z are the eastward direction and depth, respectively. These forces result from differences in the surface elevation and density gradient, respectively.
The control experiment revealed that the barotropic force was driven westward along Noryang Channel across the entire column (Figure 12A). However, the baroclinic force was driven eastward and increased from the surface to the lower layer (Figure 12B). The sum of the two forces resulted in a westward flow in the surface layer and an eastward flow in the lower layer (Figure 12C).
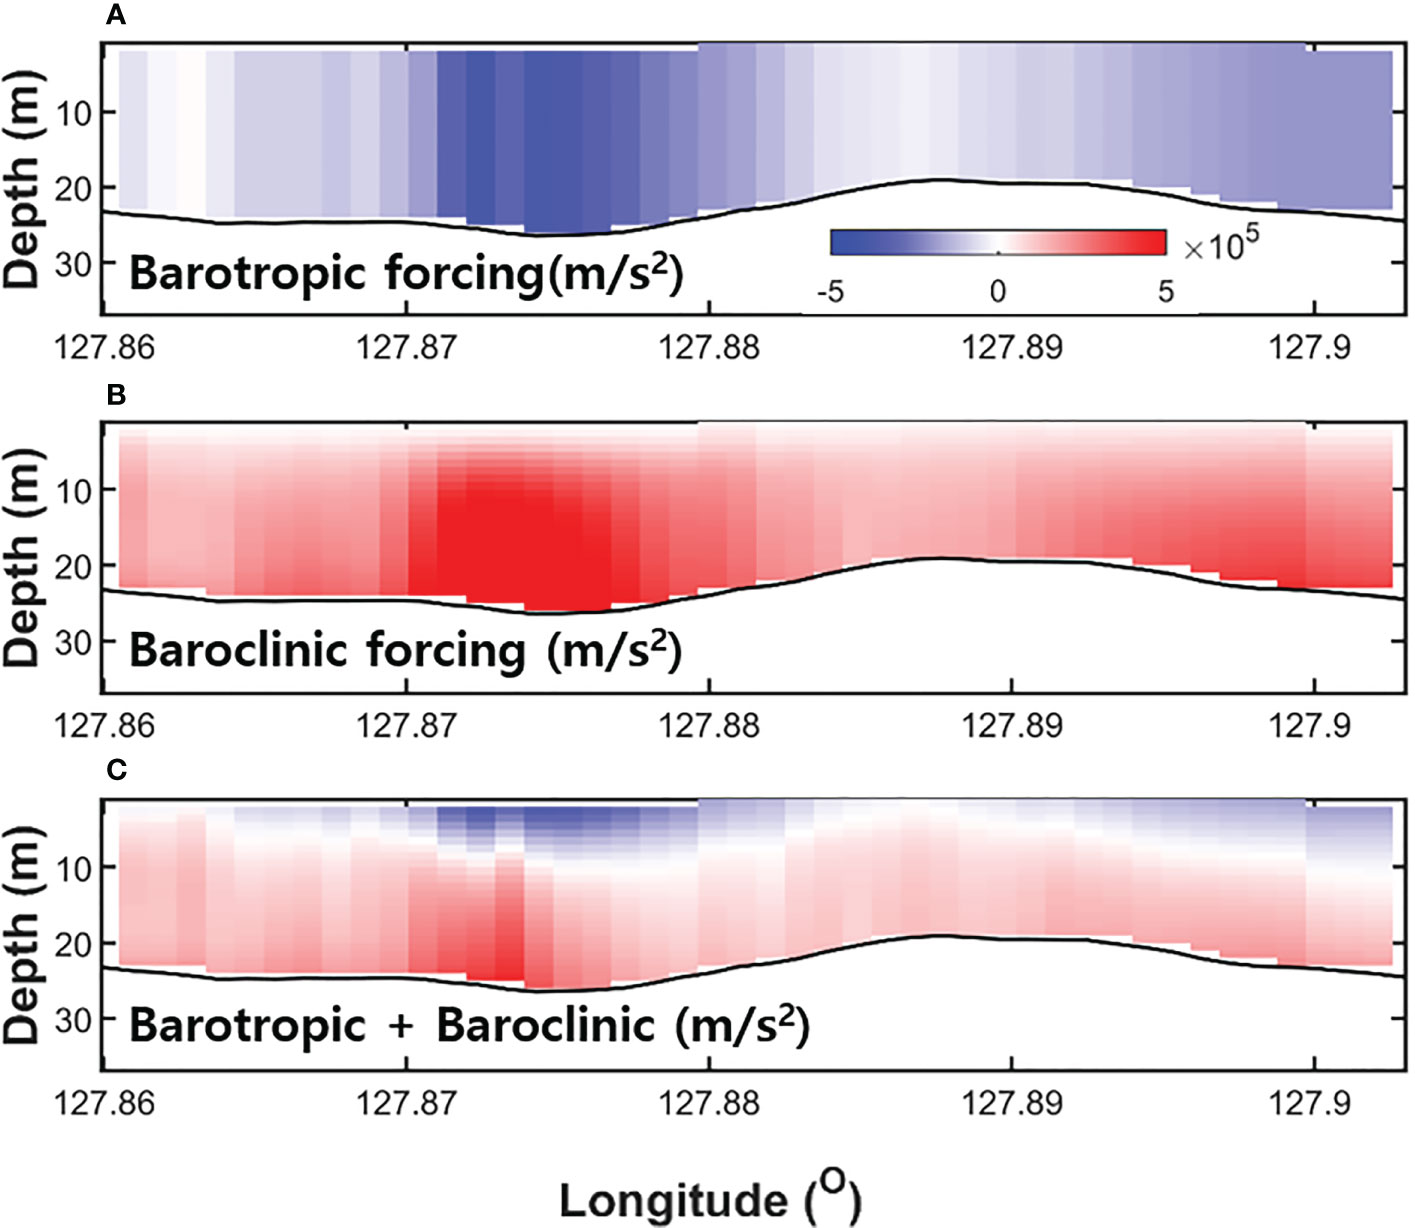
Figure 12 Vertical profiles of the (A) barotropic, (B) baroclinic, and (C) barotropic + baroclinic forces from the control experiment along Noryang Channel averaged from 26 June to 24 July.
The freshwater from Sumjin River mixed with saline water from the open ocean through the wide and deep Yeosu Channel, thus increasing the salinity in Gwangyang Bay. However, the mixing between the fresh water from the Gahwa River and the saline water from the open ocean was limited owing to the narrow and shallow Changseon and Daebang Channels, which retained the fresh water within Jinju Bay. The exchange flow in the channel was caused by the baroclinic force driven by the differences in the salinity of Gwangyang and Jinju Bays.
The tidal effect was smaller than that of the river, but was locally significant. The tidal effects on the residual current are quite complicated owing to nonlinear effects in tide-dominant shallow seas (Kim and Cho, 2017). Therefore, the distribution of the water temperature, salinity, and density in the channel can be affected by vertical mixing due to the tidal current. Uneven vertical mixing by the spatially varying tidal current might result in a horizontal density gradient in stratified seas. The model results revealed significant spatial variation in the tidal current within the study area. The maximum observed tidal current in Noryang Channel was approximately 1.3 m/s (Kwak et al., 2014).
The effect of the river discharge was significant for both the barotropic and baroclinic forces considering their surface elevation and horizontal density gradient (Figures 12A and 12B), whereas the effects of the wind stress and surface heating on both forces were very small.
5.3. Comparison of the analytical velocity profiles based on the densities obtained from the numerical experiments
The results from the numerical model regarding the main cause of the exchange flow are consistent with those of a previous study (Kwak et al., 2014). Based on limited observations of Noryang Channel, this previous study suggested that the exchange flow may be mainly driven by differences in the horizontal density owing to the river discharge. The horizontal density distribution, which drives the exchange flow in Noryang Channel, can also be potentially affected by wind stress, surface heat flux, and tides. Therefore, the results from each model were employed in an analytical model to quantitatively evaluate the contribution of each force to the development of the exchange flow in Noryang Channel. The analytical velocity profile that balances the vertical shear stress and pressure gradients along the channel (Officer, 1976) can be expressed using Eq. (4):
where u is the channel velocity, g and H are the gravitational acceleration and water depth, respectively, ρ0 is the depth-averaged density, x and z are the eastward and upward directions, respectively, Az is the eddy viscosity, and ∂ρ/∂x is the depth-averaged horizontal density gradient along the channel.
The analytical velocity profile obtained using Eq. (4) was calculated based on the density distribution obtained from the numerical experiments. The analytical model revealed that the flow in the channel was driven by the density gradient (Figure 13). The eddy viscosity in Noryang Channel was set to 0.015 m2/s, which has been demonstrated to produce the best results for the study area (Kwak et al., 2014).
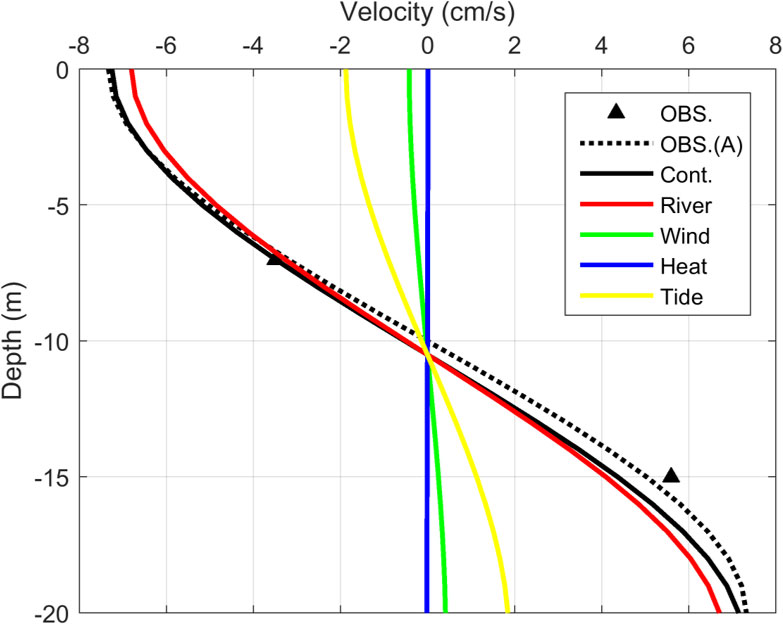
Figure 13 Along-channel velocity of the observed (triangles) and predicted velocity profile using Eq. (2) based on densities obtained from observations (dotted black line) and the control (solid black line), river (solid red line), wind (solid green line), heat (solid blue line), and tide experiments (solid yellow line).
The analytical velocity profile based on the density from the control experiment was close to the observed velocity (the triangles at depths of 7 and 15 m in Figure 13). The analytical velocity profile obtained using the observed density (the dotted black line) was also similar to the observed velocity. The velocity profile obtained using the density from the difference between the control and the river experiments (the solid red line) was similar to the results from the control experiment with a difference of –0.22 and 0.27 cm/s at 7 and 15 m, respectively. The velocity based on the densities from the wind and the heat experiments was less than 0.5 cm/s at both depths. The velocity obtained using the density from the tide experiment was approximately –1 and 1 cm/s at 7 and 15 m, respectively. These analytical model results support the interpretation that river discharge is the primary driver of the exchange flow in Noryang Channel during summer.
6. Conclusion
This study employed a three-dimensional numerical model to examine the major causes of the exchange flow in Noryang Channel, which connects two bays with contrasting topographies, during summer. A control experiment considering river discharge, wind stress, surface heat flux, and tides was conducted. In addition, sensitivity experiments considering river discharge, wind stress, surface heat flux, and tides were also conducted to evaluate the individual effects of the drivers on the exchange flow, and the results were compared to those obtained from the control experiment.
The control experiment revealed that the surface elevation of Jinju Bay was approximately 2 cm higher than that of Gwangyang Bay owing to the high river discharge during summer. The river experiment suggested that this difference in surface elevation was mainly caused by the river discharge; however, the other sensitivity experiments predicted only a slight difference in the surface elevation of the two bays.
The high river discharge resulted in large differences in the salinity and density of the two bays. In addition, the wind stress slightly decreased the surface temperature, but exerted no effect on the difference in the density of the two bays. The surface heat flux increased the water temperature by 1 °C, but there was only a slight change in the spatial density. Additionally, although the tides increased the surface salinity and decreased the lower-layer salinity owing to vertical mixing, they exerted no significant effect on the difference in the density of the two bays.
The control experiment suggested that the surface elevation and horizontal density gradient were the key drivers of the surface flow to Gwangyang Bay and the lower-layer flow to Jinju Bay, respectively. The results from the river experiment indicated that this exchange flow was mainly driven by the river discharge. The freshwater from Gahwa River generally has a high residence time in Jinju Bay owing to its isolation from the open sea, whereas the freshwater from Sumjin River mixes with saline seawater through the broad and deep Yeosu Channel in Gwangyang Bay.
The analytical model results supported the conclusion that river discharge plays the most important role among the potential drivers within the study area. The different responses to the high river discharge in terms of salinity and surface elevation in Gwangyang and Jinju Bay, which could be attributed to their contrasting topographies, resulted in the exchange flow between the two bays. The barotropic pressure gradient caused by the surface elevation resulted in a surface layer flow from Jinju Bay to Gwangyang Bay, whereas the baroclinic pressure gradient caused by the density gradient resulted in an opposite flow in the lower layer.
The exchange flow from Gwangyang Bay, where an industrial complex is located, may deliver pollutants to aquaculture in Jinju Bay. The numerous oyster and fish farms in Jinju Bay are highly susceptible to pollution via Noryang Channel owing to this exchange flow during summer. These findings from the numerical experiments were derived from typical weather conditions in 2003; however, greater river discharge may result in more severe pollution in Jinju Bay.
Data availability statement
The original contributions presented in the study are included in the article/Supplementary Material. Further inquiries can be directed to the corresponding author.
Author contributions
Conceptualization, Y-KC and M-TK. Methodology, M-TK and Y-KC. Writing draft, M-TK. Review and editing, Y-KC. Visualization M-TK. Supervision, Y-KC. Project administration, Y-KC. All authors contributed to the article and approved the submitted version.
Funding
This research was partly supported by the Korea Institute of Marine Science & Technology Promotion (KIMST) funded by the Ministry of Oceans and Fisheries (20220033) and the National Research Foundation (NRF) funded by the Korean government (NRF-2022M3I6A1085698). This research was a part of the project titled “Research center for fishery resource management based on the information and communication technology” (2023, grant number 20180384), funded by the Ministry of Oceans and Fisheries, Korea.
Conflict of interest
The authors declare that the research was conducted in the absence of any commercial or financial relationships that could be construed as a potential conflict of interest
Publisher’s note
All claims expressed in this article are solely those of the authors and do not necessarily represent those of their affiliated organizations, or those of the publisher, the editors and the reviewers. Any product that may be evaluated in this article, or claim that may be made by its manufacturer, is not guaranteed or endorsed by the publisher.
Supplementary material
The Supplementary Material for this article can be found online at: https://www.frontiersin.org/articles/10.3389/fmars.2022.1061189/full#supplementary-material
References
Chen C., Beardsley R. C. (1998). Tidal mixing and cross-frontal particle exchange over a finite amplitude asymmertric bank: A model study with application to georges bank. J. Mar. Res. 56, 1163–1201. doi: 10.1357/002224098765093607
Chen C., Beardsley R. C. (2006). An unstructured grid, finite-volume coastal ocean model: FVCOM user manual (New Bedford: University of Massachusetts Dartmouth).
Choo H. S., Lee B. G., Lee G. H. (2002). Numerical simulation of residual currents by diagnostic multilevel model in kwangyang bay. Korean Bull. Korean Environ. Sci. Soc 11, 637–650. doi: 10.5322/jes.2002.11.1.041
Cho Y.-K., Seo G.-H., Choi B.-J., Kim S., Kim Y.-G., Youn Y.-H., et al. (2009). Connectivity among straits of the northwest pacific marginal seas. J. Geophys. Res. 114, C06018. doi: 10.1029/2008JC005218
Cho Y.-K., Seo G. H., Kim C.-S., Choi B.-J., Shaha D. C. (2013). Role of wind stress in causing maximum transport through the Korea strait in autumn. J. Mar. Syst. 115-116, 33–39. doi: 10.1016/j.jmarsys.2013.02.002
Chung Y. S., Yoon M. B., Kim H. S. (2004). On climate variations and changes observed in south Korea. Climatic Change 66, 151–161. doi: 10.1023/B:CLIM.0000043141.54763.f8
Guo X., Valle-Levinson A. (2007). Tidal effects on estuarine circulation and outflow plume in the Chesapeake bay. Cont. Shelf Res. 27, 20–42. doi: 10.1016/j.csr.2006.08.009
Kim B. G., Cho Y. K. (2017). Tide induced residual circulation in a bay with asymmetric lateral depth variation. J. Geophys. Res. 122, 4040–4050. doi: 10.1002/2016JC012473
Kwak M.-T., Cho Y.-K. (2020). Seasonal variation in residence times of two neighboring bays with contrasting topography. Estuar. Coast., 43, 512–524. doi: 10.1007/s12237-019-00644-9
Kwak M. T., Seo G. H., Cho Y. K., Cho C. W., Choo H. S., Yoon Y. H., et al. (2014). Baroclinic two-layer flow induced by extreme discharge from a dam in a narrow channel. Estuar. Coast. Shelf Sci. 151, 331–335. doi: 10.1016/j.ecss.2014.07.015
Lee B. G. (2001). Status of oil spill accidents and prevention measures in gwangyang bay. J. Korean Soc Mar. Environ. Energy 5, 119–129.
Matsumoto K., Takanezawa T., Ooe. M. (2000). Ocean tide models developed by assimilating TOPEX/POSEIDON altimeter data into hydrodynamical model: A global model and a regional model around Japan. J. Oceanogr. 56, 567–581. doi: 10.1023/A:1011157212596
Mellor G. L., Yamada T. (1982). Development of a turbulence closure model for geophysical fluid problem. Rev. Geophys. 20, 851–875. doi: 10.1029/RG020i004p00851
Park K., Jung H.-S., Kim H.-S., Ahn S.-M. (2005). Threedimensional hydrodynamic-eutrophication model (HEM-3D): Application to kwang-yang bay, Korea. Mar. Environ. Res. 60, 171–193. doi: 10.1016/j.marenvres.2004.10.003
Ralston D. A., Geyer W. R., Lerczak J. A. (2008). Subtidal salinity and velocity in the Hudson river estuary: Observations and modeling. J. Phys. Oceanogr. 38, 753–770. doi: 10.1175/2007JPO3808.1
Ro Y. J., Jun W. S., Jung K. Y., Eom H. M. (2007). Numerical modeling of tide and tidal current in the kangjin bay, south sea. Korea. Ocean Sci. J. 42 (3), 153–163. doi: 10.1007/BF03020919
Shaha D. C., Cho Y. K., Kim T. W., Valle-Levinson A. (2012). Spatio-temporal variation of flushing time in the sumjin river estuary. terr. atmos. Ocean. Sci. 23 (1), 119–130. doi: 10.3319/TAO.2011.08.22.01(Hy)
Smagorinsky J. (1963). General circulation experiments with the primitive equations. i. the basic experiment. Mon. Weather Rev. 91 (3), 99–164. doi: 10.1175/1520-0493(1963)091<0099:GCEWTP>2.3.CO;2
Keywords: Gwangyang Bay, Jinju Bay, Noryang Channel, FVCOM, exchange flow, river discharge, density gradient, surface elevation
Citation: Kwak M-T and Cho Y-K (2023) Impact of dynamic factors on the exchange flow between two neighboring bays with contrasting topography during summer: A numerical study. Front. Mar. Sci. 9:1061189. doi: 10.3389/fmars.2022.1061189
Received: 04 October 2022; Accepted: 20 December 2022;
Published: 09 January 2023.
Edited by:
Yi Pan, Hohai University, ChinaReviewed by:
Hidekatsu Yamazaki, Shanghai Ocean University, ChinaPeng Zhan, Southern University of Science and Technology, China
Copyright © 2023 Kwak and Cho. This is an open-access article distributed under the terms of the Creative Commons Attribution License (CC BY). The use, distribution or reproduction in other forums is permitted, provided the original author(s) and the copyright owner(s) are credited and that the original publication in this journal is cited, in accordance with accepted academic practice. No use, distribution or reproduction is permitted which does not comply with these terms.
*Correspondence: Yang-Ki Cho, Y2hveWtAc251LmFjLmty