 David Gallo-Vélez
 Juan Camilo Restrepo
 Alice Newton
- 1Centre for Marine and Environmental Research (CIMA), Universidade do Algarve, Faro, Portugal
- 2Facultad de Ciencias Marinas y Ambientales, Universidad de Cádiz, Cádiz, Spain
- 3Grupo de Investigación en Geociencias (GEO4), Departamento de Física y Geociencias, Universidad del Norte, Barranquilla, Colombia
River mouth systems, such as estuaries and deltas are important earth system transitional zones linking the land and coastal marine systems. They funnel anthropogenic contaminants and pollutants from the activities in the river catchment into the marine environment. The present study is focused on the Magdalena River-mouth at Bocas de Ceniza where land-based contamination and pollution are important issues. These were subsequently analysed using an expanded DPSIR framework (Drivers Pressures, State, Impacts Responses). Based on export coefficients and secondary information, the loads of BOD, TSS, Nutrients and solid waste from different sources were identified and compared to prioritize their management within the study area. Findings suggest that contaminants generated in the study area may be insignificant compared to the inputs from the Magdalena River, but they can have a significant impact on the state of local ecosystems. Of all the sources analysed, agriculture and livestock are theoretically the largest contributors of nitrogen (i.e., 14.84 t d-1 and 48.99 t d-1) and phosphorus (i.e., 5.90 t d-1 and 19.46 t d-1) in the basin ‘Direct to the Caribbean’ and ‘Cienaga de Mallorquín’ (that altogether are identified as DtC+) and the ‘Western bank of the lower Magdalena’ (DtM-LM), respectively. In the case of BOD, domestic and industrial wastewaters contribute about 5.10 t d-1 and 98.43 t d-1 in the same basins. Contributions of faecal coliforms were more than 4 orders of magnitude higher in untreated wastewater, being 4.86 x10¹⁶ NMP d-1 and 1.78 x10¹⁶ NMP d-1 in the lower Magdalena and Caribbean catchments, respectively. Inadequately managed waste and plastic represent a serious problem for the Caribbean Basin. Solid waste generated within the study area and coming from the Magdalena basin and the Caribbean Sea, reaches the coast and deteriorates its visual quality, affects mangrove ecosystems, and generates impacts on coastal populations. By basin, the DtM-LM is where the greatest pollutant loads are generated. However, in terms of impact on human well-being, it is the DtC+ that bears the brunt where pressures are translated in impacts such as increased maintenance and cleaning cost of beaches, reduction or loss of tourism revenue, adverse health effects to vulnerable groups, reduce protection against natural hazards, increased living costs and loss of cultural values.
1. Introduction
Coasts are special habitats in the transitional zone between land and sea forming part of a land-ocean continuum system (Crossland, 2005). All around the world they are exposed to continuous threats due to elevated levels of nutrients flowing into the water, leading to eutrophication and algal blooms. Additionally, industrial activities discharge different type of pollutants such as heavy metals and persistent organic pollutants (POPs) that put at risk marine species and may accumulate along the food chain posing a threat to both, marine species and humans who use them for consumption. Another emerging concern is plastic waste (Future Ocean et al., 2017). From the macro-plastic that reduces the aesthetics of the beach and ‘suffocates’ animals and plants, to the micro-plastic that contains toxic additives and act as vector for other xenobiotics which are then incorporated into the organisms’ tissue with effects observed from the cellular to the organism level (Acosta-Coley et al., 2019).
On a regional scale, this problem has been recognized in the Cartagena Convention which in 1999 adopted the Protocol Concerning Pollution from Land-Based Sources and Activities. Precisely, in the framework of this protocol, an analysis of the state of the Wide Caribbean Region (WCR) with respect to pollution from land-based sources was made, showing that: demographic and economic growth is linked to an increase in the production of solid and liquid waste which, combined with inadequate management, leads to an intensification of the impacts in coastal zones by means of altered water and sediment quality and affecting ecosystem (i.e. harmful algal blooms, low oxygen zones, and coral reef degradation) and human health (UNEP/CEP, 2019).
The present study is focused on the Magdalena River-mouth socio-ecological system at Bocas de Ceniza (henceforth MRm-SES) which is the main river-mouth. The Magdalena is one of the most important rivers in Colombia. It has played an important role in the history and culture of the country (Davis, 2020). Besides, it has the largest river basin in Colombia covering nearly a quarter of the national territory (Higgins et al., 2016, pp. 25–26). It is the main contributor of freshwater and sediment discharges in the Caribbean region and the people living along its axis account for nearly 80% of the total population in the country and produce approx. 80% of the Gross Domestic Product (Restrepo et al., 2020). In turn, the Magdalena has become the largest ‘sewage’ system of the country.
Precisely the concentration of the population in the Magdalena basin has led to a strong development of industrial and other economic activities (e.g., agriculture, livestock, mining) which result in major pressures (e.g., deforestation, pollution with nutrients, heavy metals and toxic substances, sewage discharges) that are transferred from the basin to the sea through its waters (Restrepo et al., 2020, p. 42). Hence, the Magdalena delta is a place of synergistic and cumulative impacts arising not only from local pressures but also from external factors, turning it into a hotspot where many of the coastal symptoms can be found (e.g. sediment unbalance, freshwater changes, eutrophication, urbanization, biodiversity loss) (Newton et al., 2012) and these symptoms are commonly driven by population growth, economic activities, technological advances, changing governance structures and climate change (United Nations, 2021, pp. 6–7).
With these considerations in mind, this study is motivated by the question: What are the main anthropogenic sources of pollution in the MRm-SES and, moreover, how they could affect coastal habitats (e.g., coastal lagoons, mangrove swamps, sea) and, in consequence, the well-being of the people living in this region?
To answer the research questions a conceptual framework called DAPSI(W)R(M) was used (Elliott et al., 2017). This framework constitutes a further development of the traditional Driver-Pressures-State-Impact-Response (DPSIR) approach that has been widely used around the world “to assess causes and consequences of ecosystem change and the actions that might be implemented in response to that change” (United Nations, 2021). In this article, the DAPSI(W)R(M) is a valuable tool to explore the links between the causes and consequences of anthropogenic pressures on the Magdalena delta.
Rather than being a detailed inventory of pollution sources such as the ones done for the Atlántico (INVEMAR, 2015, pp. 59–74) and other coastal departments in Colombia (INVEMAR, 2018, p. 17), or establishing a nutrient budget as the one done on the mouth of the Magdalena River (Torregroza-Espinosa et al., 2020) or in other deltas in South America (de Paula Filho et al., 2015), the main focus of this study is to identify the impacts on human welfare and ecosystem services derived from land-based pollution within the study area. For that purpose, this investigation aims at estimating the loads and prioritize the pollutants from anthropogenic sources to guide the choice of management measures in the study area.
This research can be considered a complement to works that have been conducted at a broader geographical scale, such as the Magdalena River Basin and its mouth in the Bay of Cartagena (Restrepo et al., 2018), the National Water Study (IDEAM, 2019a) or in the Wider Caribbean Region (WCR) (UNEP/CEP, 2019). However, the development of studies focused on smaller areas but with more detailed information allows the identification and evaluation of management measures that would be more effective in tackling local problems.
2. Methods
2.1. Study area
The Magdalena River is in the northwestern Andean region of South America, its waters flow to the sea in the central Caribbean Region of Colombia creating an estuarine area that is a hotspot where many of the coastal symptoms of the coastal syndromes are experienced (Newton et al., 2012). The river influence on the coastal processes along the Caribbean Coast of Colombia are highly important considering that it is the longest river and the one with greatest drainage area in Colombia occupying 24% of the national territory. Moreover, the water discharge (205 km3 y-1) and sediment load (144 x 106 t y-1) account for 26% and 38% of the total discharges into the Caribbean Sea being the main source of sediments in that basin (Restrepo et al., 2015; Higgins et al., 2016; Torregroza-Espinosa et al., 2020).
The Magdalena River forms an arcuate delta with an estimated area of 1,690 km2. Its waters flow to ‘Bocas de Ceniza’, considered the main river-mouth where approximately 92% of the streamflow is discharged into the Caribbean Sea. Additionally, the river has a secondary mouth at Cartagena’s and Barbacoas’ bay where 6 - 8% of the streamflow is discharged through an artificial structure called ‘Canal del Dique’ (the flow is deviated to the ‘Canal del Dique’ at Calamar). Finally, the waters from this river represent an important influx of fresh water for the largest and most complex of Colombia’s mangrove swamps the ‘Ciénaga Grande de Santa Marta- CGSM’ (see Figure 1) (Restrepo et al., 2015; Ávila and Gallo, 2021).
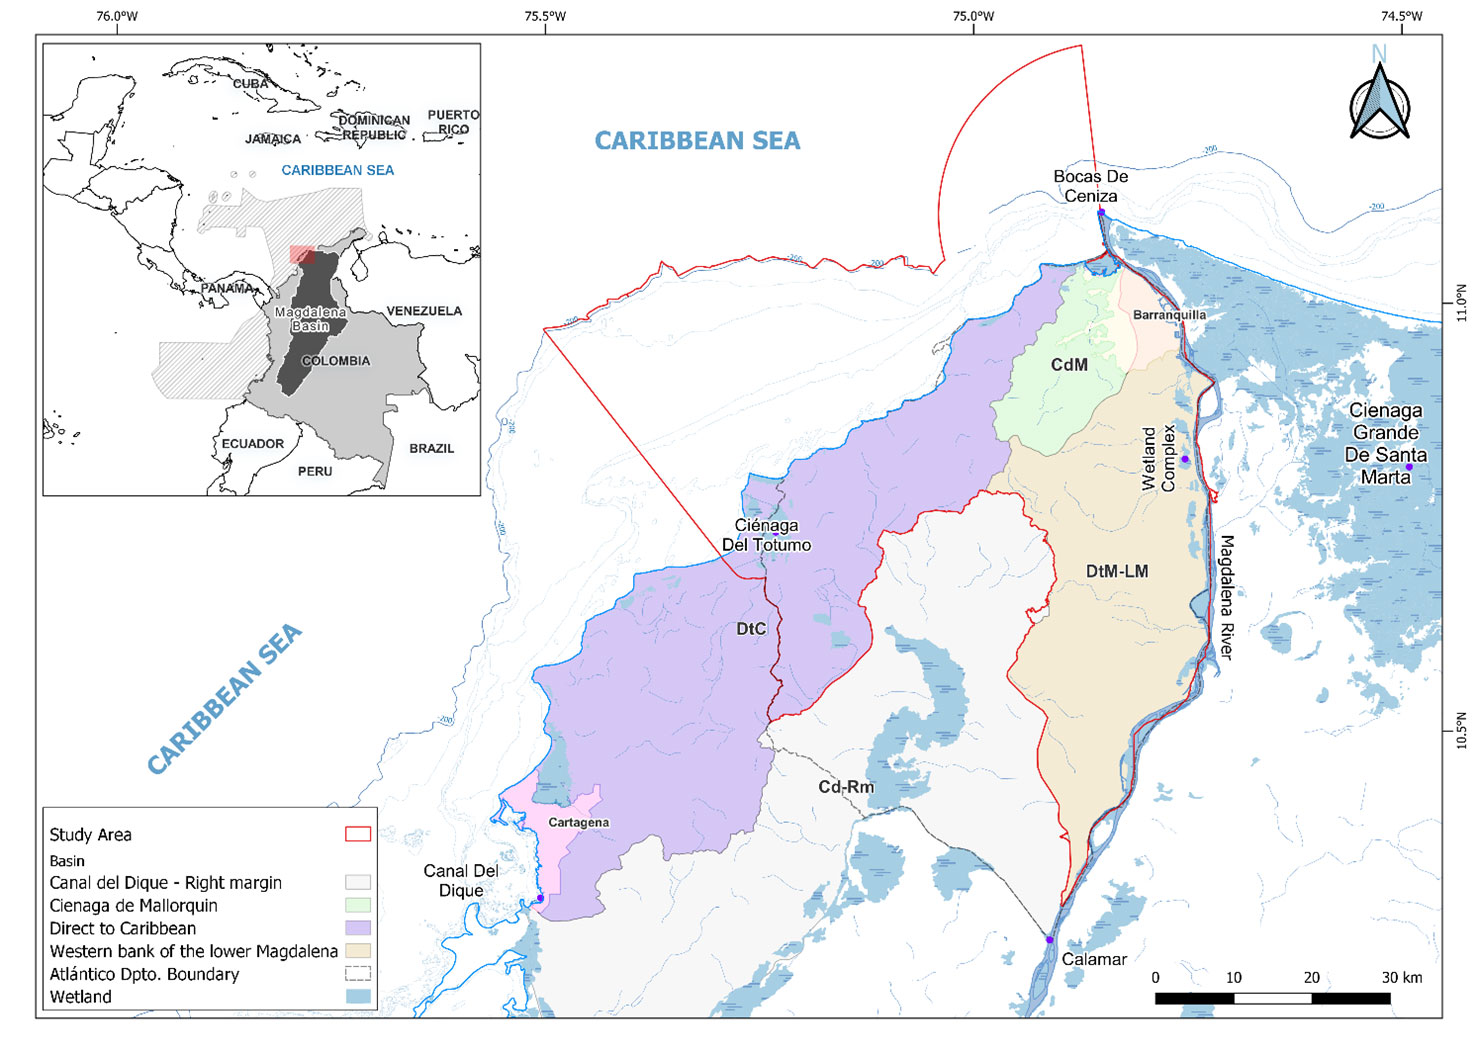
Figure 1 Location of the study area (CRS: EPSG 4326 – WGS 84).
The intra-annual variability of the freshwater discharge and suspended sediment load (SSL) in the Magdalena River basin is associated with the annual hydrological cycle. The lowest mean value of streamflow occurs during the months of January to April when the average river discharge is 4,360 m3/s of freshwater and 218 x103 t d-1 of SSL. During the same period, the maximum reported total suspended solid (TSS) has been 11.45 mg L-1 and the river-mouth experiences high-energy waves (Hs > 2.5m) caused by strong north-eastern trade winds and cold fronts. The high streamflow conditions are registered between September to November. During these months, the average river discharge is 8,060 m3 s-1 of freshwater and 531 x103 t d-1 SSL. Additionally, the maximum TSS in the river mouth drop to 5,031 mg l-1 and “the delta experiences low/moderate energy wave conditions (Hs < 1.5 m), with swells coming predominantly from the west and northwest”. Also, El Niño and La Niña phases of the El Niño-Southern Oscillation (ENSO) climate pattern, are linked to variabilities at inter- annual scale, leading to lower mean freshwater discharges and SSL during El Niño (5,510 m3 s-1 and 256 x103 t d-1, respectively) and higher magnitudes during La Niña (8,750 m3 s-1 and 511x103 t d-1, respectively) (Restrepo et al., 2015; Restrepo et al., 2020).
In terms of environmental quality, the Magdalena River exhibits ‘Satisfactory’ water quality conditions (i.e., equivalent to scoring 3 in a 1 to 5 scale where 1 is the worst quality and 5 is the best) according to the Water Quality Index (WQI) estimated for 25 stations along the river. These intermediate quality conditions are caused by inputs from domestic, industrial, and mining discharges. The Magdalena-basin receives 55% and 48% of the COD and BOD loads from industrial activities. In the case of suspended solids, the domestic sector discharges 64% and in nutrients accounted for 61% of the Total Nitrogen and 74% of the total Phosphorus. All of this is reflected by data showing that the water quality in Magdalena-Cauca subbasins is more prone to be affected by contaminant loads than other hydrographic areas in Colombia (e.g., Pacífico, Orinoco, Amazonas) (IDEAM, 2019a, pp. 217–263). But not only water is affected due to those inputs, high concentrations of metals in sediments have been found along stations located in the Cauca River, main affluent of the Magdalena River, and in the Magdalena watercourse itself in its lower part, after receiving the Cauca’s waters (IDEAM, 2019a, pp. 229–232; Tejeda-Benitez et al., 2016).
This study focuses on the Lower Basin of the Magdalena River, where the annual mean precipitation is 1632 mm y-1, and the sediment yield reaches values of 560 t km2 y-1. Moreover, the cumulative freshwater discharge and Suspended Sediment Load (SSL) in this lower part of the basin reach 228 km3 y-1 and 144 x106 t y-1, respectively (Higgins et al., 2016).
The study area presents seasonal variations controlled by the shifts in the Intertropical Convergence Zone (ITCZ). Hence, there are two wet periods (i.e., the main one goes from Sep-Nov and another one between Apr-May) and two dry periods (i.e., the main one goes from Dec-Mar and the second one, locally referred as ‘Veranillo de San Juan’, between Jun-Aug). The average number of days with precipitation in the whole study area ranges between 50 - 100 days a year, and the mean temperature is 26-28°C (IDEAM, 2015).
2.2. Socio-ecological assessment framework
In the DAPSI(W)R(M) framework, Drivers (D) refer to human needs which according to Maslow’s work are organized as a hierarchical structure going from the very ‘basic needs’ (also known as the lower needs) related to survival and safety (e.g. food, air, drinking water, shelter, security, order) which are part of the so-called ‘deficit needs’, and moving to the higher levels which pass through ‘psychological needs’, the ‘cognitive needs’, the ‘aesthetics needs’, the ‘self-fulfilment needs’ and, finally, reaching the last level of needs corresponding to the ‘Transcendence needs’ (Maslow, 1970).
Moving onto the ‘Activities’ (A), which can be associated or not to the economic sectors, are those particular actions introducing pressures into the systems (e.g. use of fertilizers, dumping, beach littering, wastewater discharge, etc.); ‘Pressures’ (P) are the result of one or multiple activities and reflect the “mechanisms of change” of the natural system and they can be spatially classified as either Endogenic Managed Pressures (EnMP), which are generated and can be tackle through measures adopted within the system boundaries (e.g., littering, introduction of contaminants and nutrients), or Exogenic Unmanaged Pressures (ExUP) which are generated outside the system and cannot be managed but whose effects need to be dealt with within the study area (e.g., thermal regime change, changes in wave exposure). The ‘State changes’ (S) are measured through physic-chemical variables/indicators and are the result of one or multiple pressures (changes in dissolved oxygen, pH, species abundance or richness). When it comes to ‘Impacts’ (I), is important to stress that in this context they are strongly linked to consequences on ‘Human Welfare’ (W). In other words, impacts are derived from those state changes that can affect the provision of good or benefits for the society. Finally, the Responses (R) or measures (M), involve a group of frameworks, agreements, strategies, projects, actions or normative, among others, that are put into place to try and tackle either the causes or effects of the ecosystem change (Elliott et al., 2017, p. 32).
2.3. Information sources
All the municipalities within the department of the Atlántico plus the municipality of Santa Catalina (Bolivar department) were included in the socioeconomic characterization of the study area. However, it is important to highlight that, in terms of pressures, state changes and impacts, only the municipalities located within the boundaries showed in Figure 1 were considered for the present study.
Behind this is the rationale that most of the contaminants (nutrients, litter, and other pollutants) are transferred to the Magdalena River and/or the Atlantico’s coast through runoff because a big portion of the area from municipalities such as Luruaco and Sabanalarga is in those sub-basins. Based on a similar rationale, the municipalities of Usiacurí, Repelón and Manatí have most of their territories in the sub-basin of the ‘Canal del Dique’ and, given that the main economic activities in the area is livestock farming and agriculture, it could be inferred that most of the pressures and impacts are transferred to that sub-basin and therefore fall outside the scope of this study (Aguilera Díaz, 2006; Ahumada Lagares and Penso Martínez, 2014; López Pineda et al., 2014).
To identify trends for the sociodemographic characterization, information in the 2000–2018-time span was collected. All the other information sources were ideally from 2018 or from the most recent year available (e.g., information about fertilizer use) using the following order of preference: 2017, 2019, 2016 and so on until 2000. Information prior to 2000 or after 2019 was not considered for this study. A complete list of the datasets and sources used for the present study is presented in Table 1.
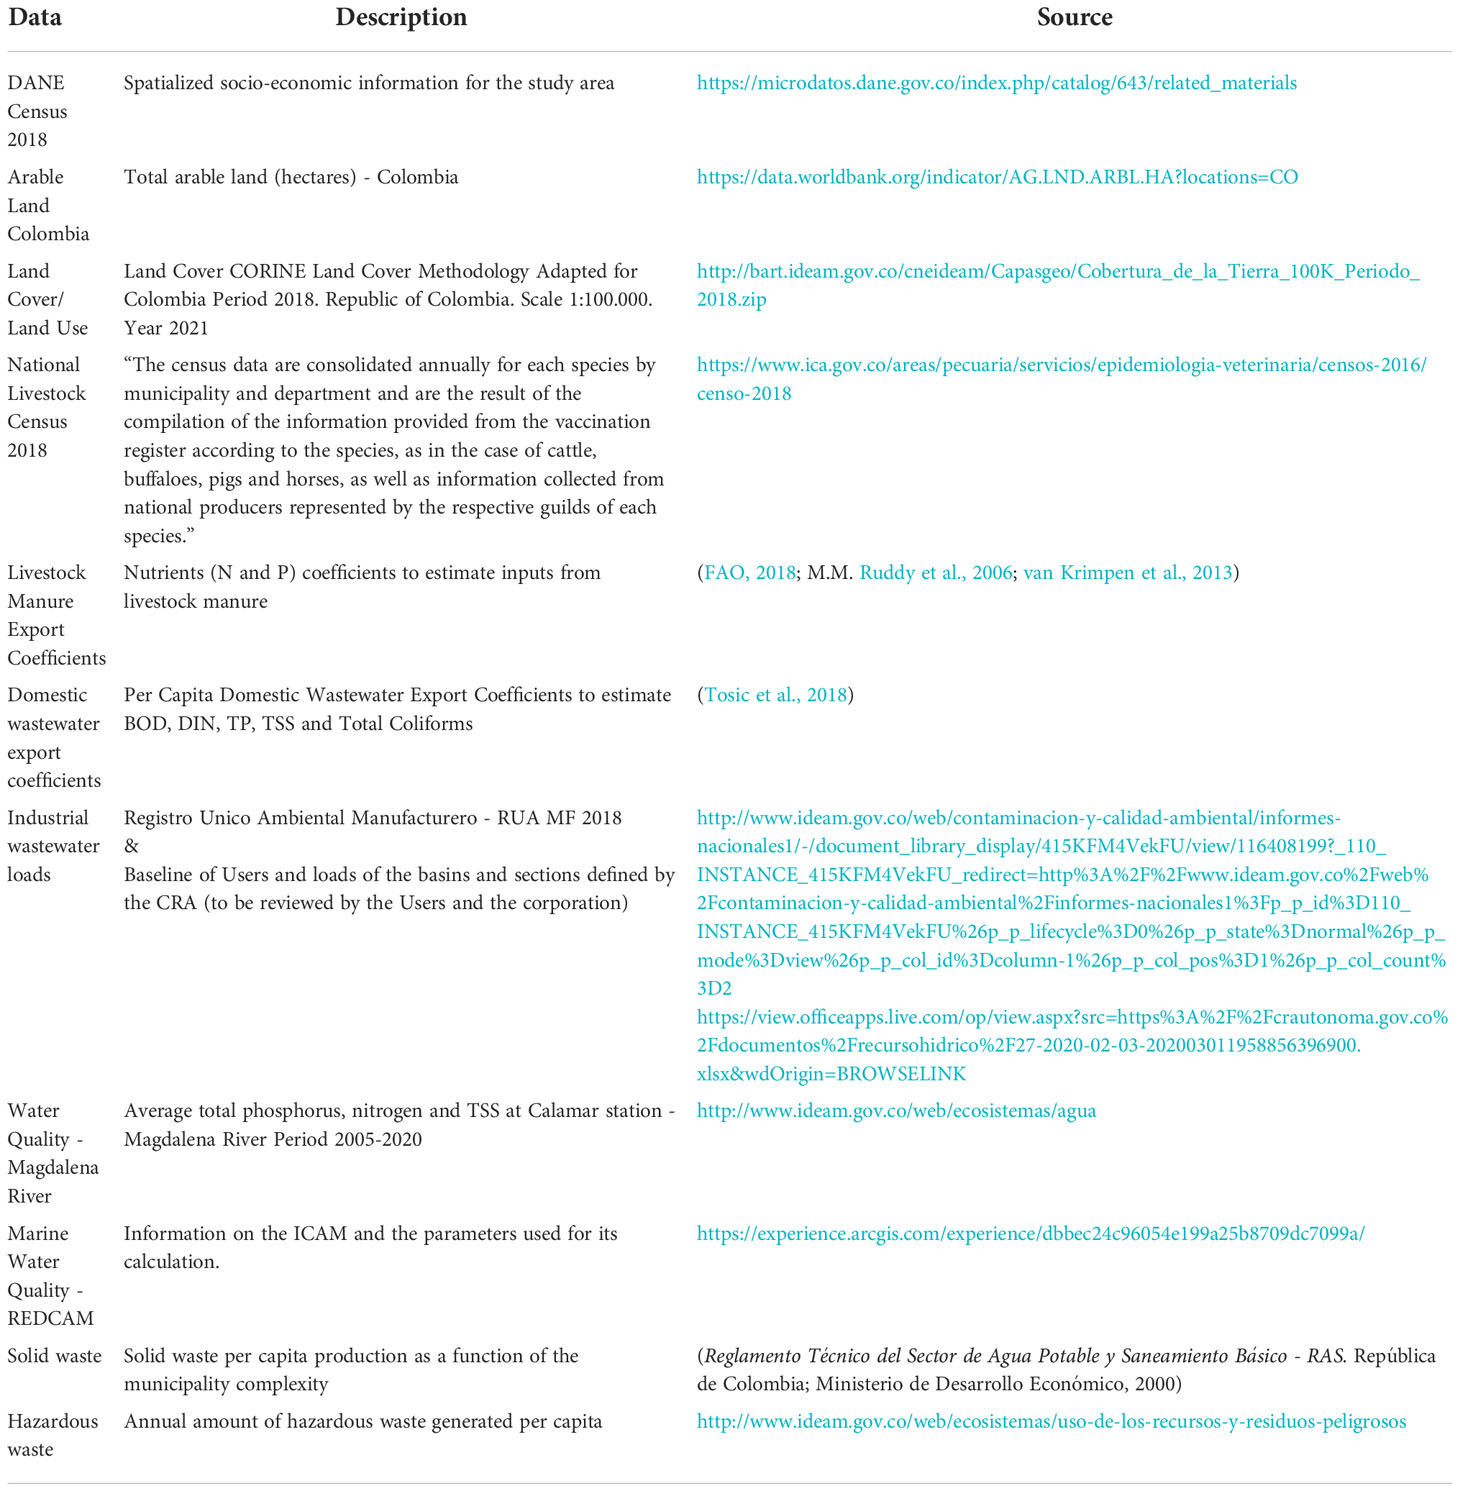
Table 1 Summary of information sources.
2.4. Load assessment
The land-based sources of pollution leading to the degradation of the coastal habitat (water and sediment) were analysed by assessing the loads of different parameters that were estimated based on export coefficients, census, and secondary information. The variables that were considered in this study correspond to total suspended solids (TSS), nitrogen (TN and DIN), total phosphorus (TP), biological oxygen demand (BOD), chemical oxygen demand (COD), and coliforms.
The study unit for this assessment is the drainage basin (see Figure 1 and Table 2). Although the study area is comprised of 3 hydrographic sub-zones (or drainage basins), namely, ‘Ciénaga de Mallorquin’ (CdM), ‘Direct to Caribbean’ (DtC) and, ‘Western bank of the lower Magdalena’ (DtM-LM); for the purpose of this analysis, the CdM and DtC were analysed together as one basin denominated ‘Direct to the Caribbean plus’ (DtC+).
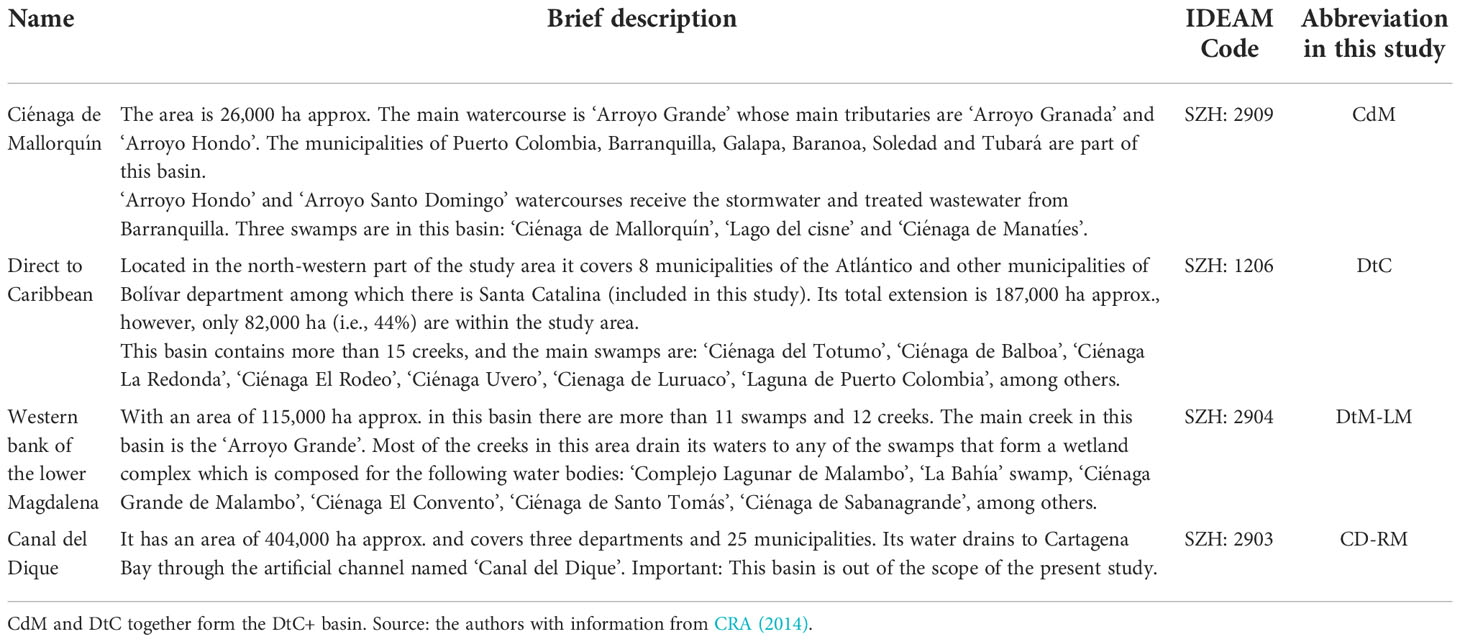
Table 2 Drainage basins within the study area. The last column (on the right) provides an arbitrary abbreviation that will be used along this study to refer to these areas.
2.4.1. Livestock manure
A coarse estimate of the total N and P from livestock manure was calculated based on the number of animals reported in the National Livestock Census (ICA, 2018) and coefficients to estimate N and P inputs from manure. The results were calculated for each municipality and those results added up according to the draining area. Despite having data for all the municipalities from the Atlántico, only the total number of animal heads were used for the calculation if more than 20% of the municipality’s area drain to either the Magdalena River (DtM-LM) or Direct to the Coast (DtC+). Hence, nutrients from Manatí, Repelón, Usiacurí, Suán and Santa Lucia, are excluded from the present analysis.
This approach can be considered conservative given that some of the municipalities (e.g. Santa Catalina and Sabanalarga) have more than 50% of the area draining to the ‘Canal del Dique’, therefore, the majority of the manure-related nutrients, might not reach the Magdalena River or the coast through the DtC+ via surface runoff or submarine groundwater discharge (SGD), however, they are being accounted for as if the totality of them were discharged to the river and, eventually, even if discharged to the Canal del Dique basin (CD – RM) they will reach the Caribbean Sea. The equation used to estimate the nutrient load from livestock manure is the following:
where:
is the estimated total load of N or P from livestock manure in each basin (Kg N/P yr-1). (Note: to express as tonnes per day (t d-1) the result can be multiplied by a factor of 2.74x10⁻⁶)
kj is the nutrient export coefficient from manure by type of animal (i.e., poultry, cattle, goats, sheep, buffaloes, horses, and swine) (j) expressed as kg N/P animal-1 year-1 (see Table 3).
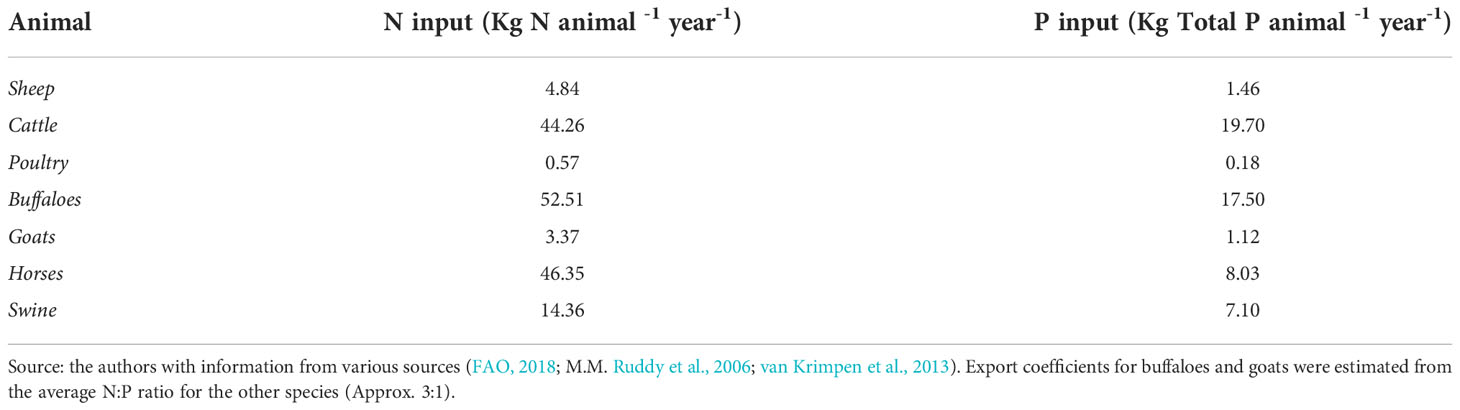
Table 3 Nutrient’s export coefficients to estimate inputs from livestock manure
Anij is the number of animals of each type (j) in each of the municipalities (i) within the basin. This data was obtained from the National Livestock Census (ICA, 2018).
It is important to note that part of the nitrogen in manure is volatile (Meisinger and Jokela, 2000), especially ammonia, in warm temperatures. Nevertheless, this atmospheric component is mostly returned to the aquatic system in humid situations such as tropical river basins (Prado-Fiedler, 1990). Phosphate is also strongly retained in soils by adsorption to soil particles. Heavy tropical rains can wash some of the soil into the river where the sediment particles can become saturated in phosphate (Xu et al., 2015). Considering the above, reduction factors to account for the losses of volatile nitrogen and phosphate retention, and inputs from dry/wet atmospheric deposition of nutrients were not used for this study.
2.4.2. Fertilizers
An estimated of Total Nitrogen and Phosphorus from agricultural fertilizer use in the study area was derived from data reported in the WorldBank (2022) and the State of Cartagena Convention Assessment (UNEP/CEP, 2019). From the first source it was stablished that 6 million hectares in Colombia are arable land and according to UNEP/CEP (2019), approximately, 31% of the national area drains to the Caribbean discharging 0.11 and 0.04 Tg of N and P, respectively. Assuming the amount of fertilizer use is proportional to the amount of arable land, we established the proportion of arable land within the study area compared to the total area in the Caribbean region. With this proportion, we scaled down the regional nutrient loads to account only for the percentage of croplands within the study area using the following equation:
where:
FUSA is the amount of fertilizer being used in the study area.
FUCC is the amount of fertilizer used in the Colombian Caribbean based on the information from UNEP/CEP (2019) assessment.
CASA and CACC represents the hectares of arable land in the study area (i.e., obtained through spatial analysis in QGIS using the latest Land Use/Land Cover information available at IDEAM) and in the Colombian Caribbean region, respectively.
2.4.3. Domestic and industrial wastewater
To estimate the contaminant loads in this category, three sources were considered: domestic served wastewater - SW (the one collected through sewage and treated before discharge); domestic wastewater from non-served households - NS, meaning wastewater which does not receive any treatment and is discharged directly to a receptor body (e.g., soil, small, creek, Magdalena River, Caribbean Sea, etc.); and industrial wastewater.
In the case of connection to public services, information from 2018 Census is given by household and not per capita, therefore, an estimate of persons was calculated based on the total population and the total number of houses in the study area. On average, 3.6 ± 0.39 people live in one house. That is the value used to convert number of houses in each basin onto the number of people and calculate how many are without access to sewage and solid waste collection. For this preliminary step, a Geographic Information System tool (i.e., QGIS) was used.
2.4.3.1. Served domestic sewage
Total discharge volume, BOD and TSS loads were reported as registered in the baseline of users and loads from the Corporación Autónoma Regional del Atlántico - CRA (CRA, 2019). Due to a lack of reported information for nutrients and coliforms loads, it was decided to estimate those loads based on population and public services coverage data from the Census 2018 and the export coefficients of DIN, TP and Total Coliforms for domestic water presented in the work from Tosic et al. (2018). Specifically, the number of inhabitants connected to sewage was estimated and then, this value was multiplied by the export coefficients.
The main difference between the estimates from this source and the ones from non-served households is the assumption that the secondary treatment undergone in the Wastewater Treatment Plants (WWTP) can achieve an 80% removal of contaminants (nutrients and coliforms) in the effluent.
The equation to estimate the average number of inhabitants per household for the whole study area was [3]. There it is observed that the average number of inhabitants is simply the sum of the number of inhabitants from each municipality (Pi) divided by the sum of the houses in each municipality. From this equation was estimated that, on average, 3.6 people live in a house. This value was used to convert data from served households (i.e., public services like solid waste collection and connection to sewage) to served people.
Then, to estimate the contaminant loads for this anthropogenic source, we used the following equation:
where:
LSW are the contaminant loads from households connected to sewage (i.e., BOD, DIN, TP, TSS, Coliformes) expressed in tons per day (t d-1).
kWWi is the export coefficient for each of the parameters in domestic wastewater. This export coefficients correspond to those reported by Tosic et al. (2018)
PSW is the number of served people within the basin. Calculated through the following expression:
Being CSW the proportion of homes connected to sewage in the study area, H is the total number of homes within the watershed, and is the average number of inhabitants per household
Finally, the expression (1- e) in equation [4] is to account for the wastewater treatment efficiency (e) which is usually around 80% removal (0.8)
2.4.3.2. Non-served domestic wastewater
The Census 2018 DANE provides information about population demographics and percentage of households connected to public services (e.g., drinking water, energy, sewage, etc), among others. This information was used to estimate the number of people who does not have access to wastewater treatment facilities and for whom it is assumed discharges are made directly to soil or water bodies. The calculations are very similar to the ones for served households. The only differences are: 1. the use of which is the proportion of non-served households in equation [6] and the inexistence of a factor to account for removal of contaminants in equation [7].
2.4.3.3. Industrial sewage
The estimated load of BOD and TSS for each basin was computed from the information reported in Colombia’s Unified Environmental Register for the Manufacturing Industry - RUA MF 2018. That database contained information of flow (Q) and contaminant loads (i.e., BOD and TSS) for the industries within the study area. The contaminant loads were aggregated by basin and then the units were converted to express loads in tonnes per day. The records from the industries that discharged their waters in the municipal sewage, were disregarded to avoid double accountability with domestic sewage.
2.4.4. Solid waste
The total amount of domestic solid waste generated in the study area was calculated based on the number of inhabitants (DANE, 2018) and suggested per capita solid waste production rates for Colombia (República de Colombia and Ministerio de Desarrollo Económico, 2000). According to the latter, per capita production of solid waste varies according to the complexity of the municipality which is established as a function of the total population. In this study, the municipalities had medium (0.45 kg hab-1 d-1), medium-high (0.53 kg hab-1 d-1) or high (0.79 kg hab-1 d-1) level of complexity. Likewise, the percentage of houses with waste collection service differs for each municipality, this information was obtained from DANE (2018) and was used to estimate the amount of solid waste which is not properly disposed and might end up in open air dumping areas, the streets, public spaces and, eventually, could reach water courses, wetlands, and the sea.
The total waste production which is not properly disposed per basin (Wsolid, see equation 9) was expressed as tonnes per year (t y-1) and was estimated by multiplying the per capita production factor of each municipality (kj) by the number of inhabitants with no waste collection service (PNWC, see equation 8) in the municipality and then aggregating the results at the basin level. In equation 8, CWC represents the proportion of houses with waste collection service, H is the total amount of houses per municipality and is the average number of people per household (i.e., 3.6 inhabitants).
2.5. State changes
The changes on the environment due to the inputs of nutrients and other contaminants from different sources were measure through 8 physic-chemical and microbiological parameters: dissolved oxygen (DO), Biological Oxygen Demand (BOD), pH, Nitrates (NO3), Dissolved Inorganic Phosphorus (PO4), Total Suspended Solids (TSS), chlorophyll-a (CLA) or Dissolved and Dispersed Hydrocarbons (HPDD), and Faecal Coliforms (CTE). Measurements of those parameters were done by INVEMAR in samples collected during the wet season (2017) and dry season (2018) (INVEMAR, 2019). The concentration of each parameter was assessed using a qualitative and numerical scale defined by the INVEMAR in Colombia. Additionally, the same parameters are combined to calculate a Coastal Water Quality Index (ICAM) which is a composite indicator that represents the quality (i.e., for conservation purposes) of the marine water, the higher the number the better the quality with a maximum score of 100 units. The methodology including equations, weighting factors and reference values used for this indicator are explained in detail in INVEMAR (2021).
2.6. Impacts
Following the definition from the DAPSI(W)R(M) framework, impacts are the result of the state changes which have an impact on human welfare (Elliott et al., 2017). Now, to better identify those impacts is necessary to recognize what are the ecosystem services from the study area.
In a simple way, “ecosystem services are the benefits that people and society derive from the ecosystems on which they depend”. (Avendaño et al., 2019, p. 17). A more specific definition suitable for the present study area is provided by Buonocore et al. (2021) who described marine ecosystem services as “the output flows generated by marine natural capital stocks that are directly consumed, used, or enjoyed by people”. These ecosystem services can be classified, without being the only categorization, in three major groups, namely, provisioning (e.g., food, water, energy, primary resources, etc.), regulating and maintenance (e.g., hydrological regulation, air and water purification, control of erosion, etc.) and cultural services (e.g., scientific knowledge, cultural diversity, sense of self) (Haines-Young and Potschin, 2018). Following there is a list of the ecosystem services that can be found within the study area (Table 4). Based on secondary information depicting how state changes could interrupt the flow of those ecosystem services, a list of impacts associated to land-based pollution sources, was created.
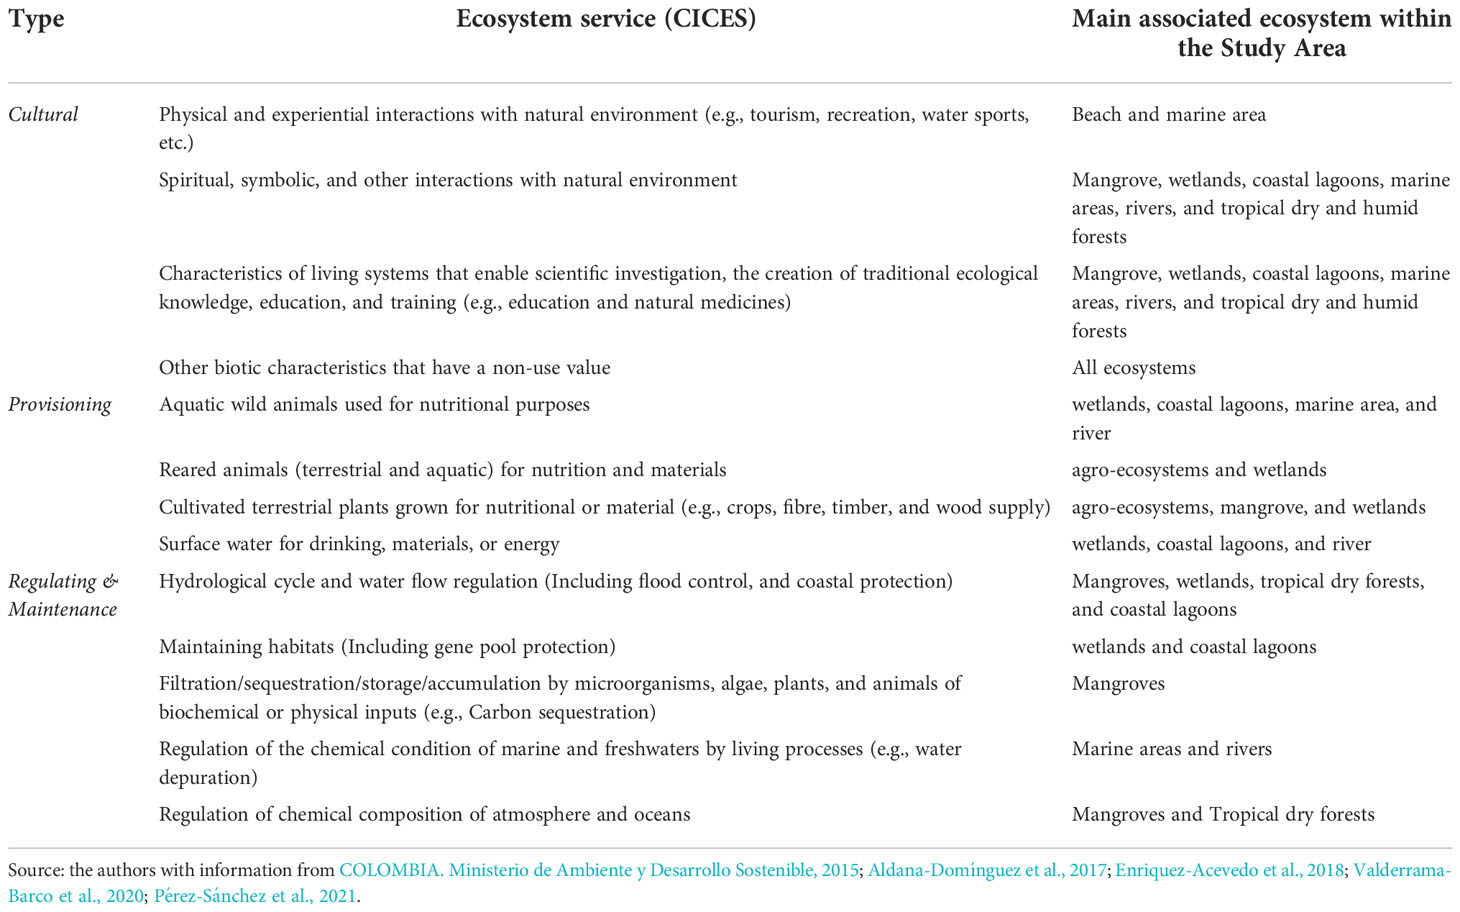
Table 4 Ecosystem services in the study area.
2.7. Responses
The term “responses” is broad and involves all types of social actions taken by the society to address the environmental issues. They not only involve governance, policies, and legislation, but also agreements, projects, strategies, action plans, monitoring campaigns, among others (Elliott et al., 2017; UNEP/CEP, 2019). An overview of the institutional frameworks, actions and processes in the study area related to land-based marine environmental pollution is presented. It is not at all complete considering that many other actions can be in place within the communities and only field work would allow their identification (e.g., cleaning campaigns, community-based management strategies, environmental education, among others).
3. Results
Using the DAPSI(W)R(M) framework facilitates the process of identifying and assessing the linkages between causes, effects, impacts, and management strategies for the land-based pollution sources that are present within the study area and that are summarized in Figure 2.
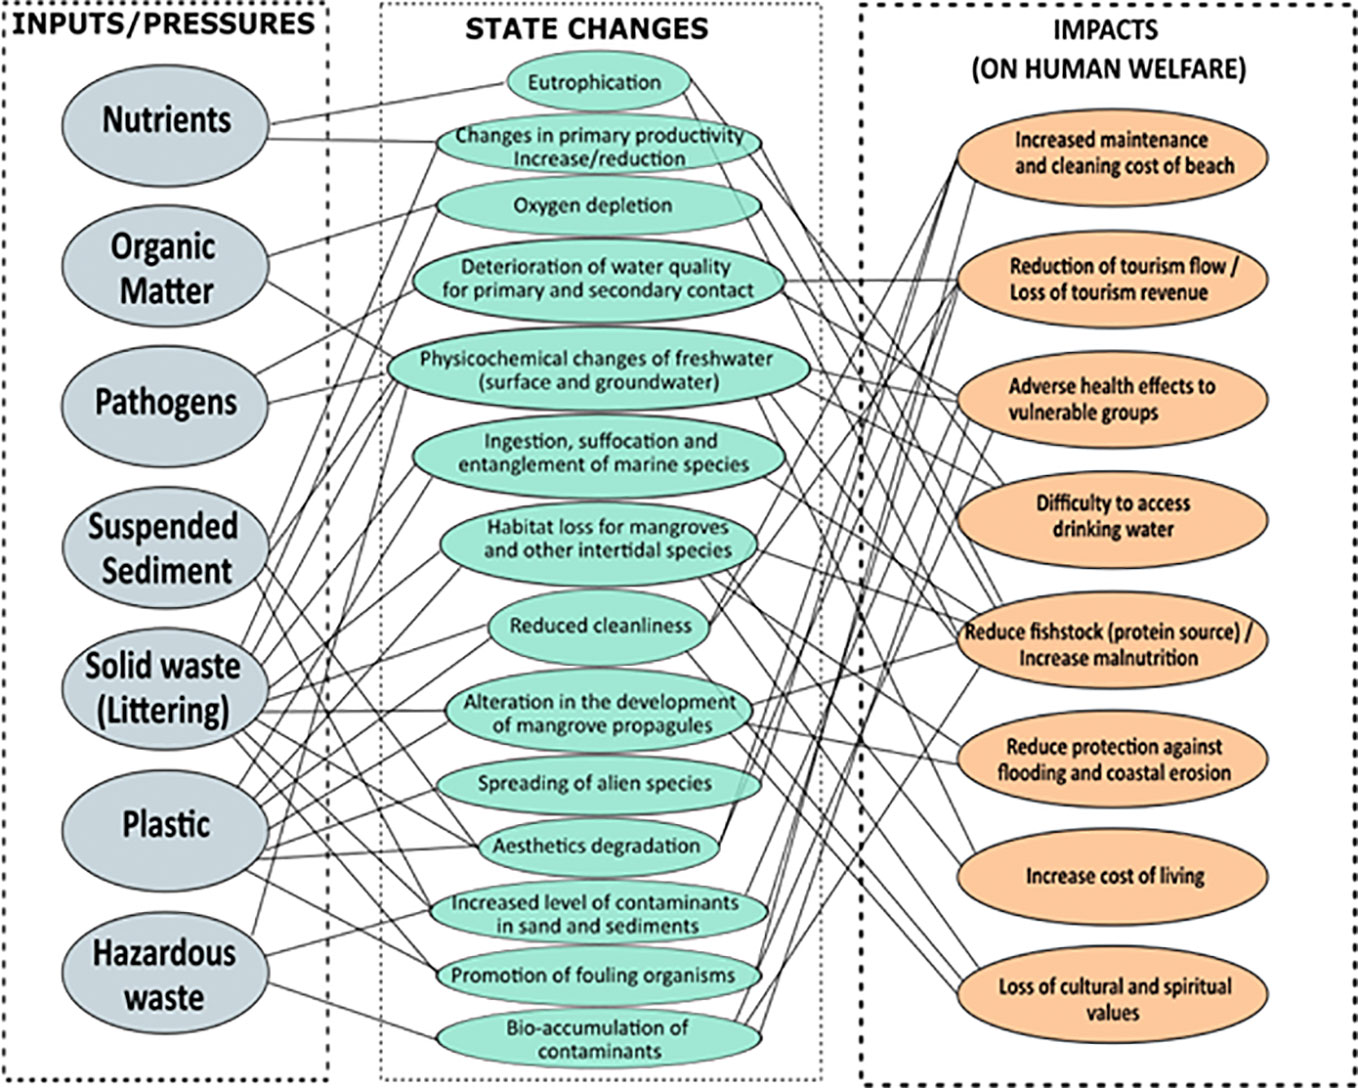
Figure 2 Pressures, State changes and Impacts horrendogram for the study area. Source: the authors with information from Fuentes-Gandara et al., 2018; Restrepo et al., 2018; Acosta-Coley et al., 2019; Rangel-Buitrago et al., 2019; Chacon et al., 2020; Portz et al., 2020; Torres-Bejarano et al., 2020; Villate Daza et al., 2020; Rangel-Buitrago et al., 2021; Soto-Varela et al., 2021.
3.1. Drivers (D)
Drivers are linked to human needs which derive in human activities manifested in the economic and social dynamics, therefore, understanding the demographic trends and the main economic sectors/activities of the study area is one of the steps towards identifying possible pressures and potentialities to achieve a sustainable development of the coastal zone.
3.1.1. Demographic trends
In 1985, the population was 1.25 million inhabitants from which 93% lived in urban areas while the other 7% lived in small, populated centres or dispersed along the rural area. Between 1985-2005, the study area population increased in more than 800,000 thousand people reaching a total number of 2.17 million inhabitants by 2005, representing an increasing rate of approximately 41,000 people per year. Regarding the distribution, a slight reduction of the rural population (i.e., passing from 7.1% in 1985 to 5.3% in 2005) was compensated by an increase in the urban areas (i.e., 94.7% in 2005).
Overall, the period between the 2005 and 2018 census showed slower increasing trends with an average increment of 28,000 people per year. Between those years the population increased approximately a 17% corresponding to more than 371,000 inhabitants, reaching a total of 2.5 million inhabitants that were located mainly in the urban areas (i.e., 94.5%) while only a 5.5% of the population lived in the rural and dispersed areas. Those percentages are slightly different when excluding the population in Barranquilla (i.e., 90% and 10% of the population is in urban and rural areas, respectively). Additionally, the projections from DANE show that the population is expected to increase by nearly 24% by 2035 surpassing the 3 million inhabitants (see Figure 3).
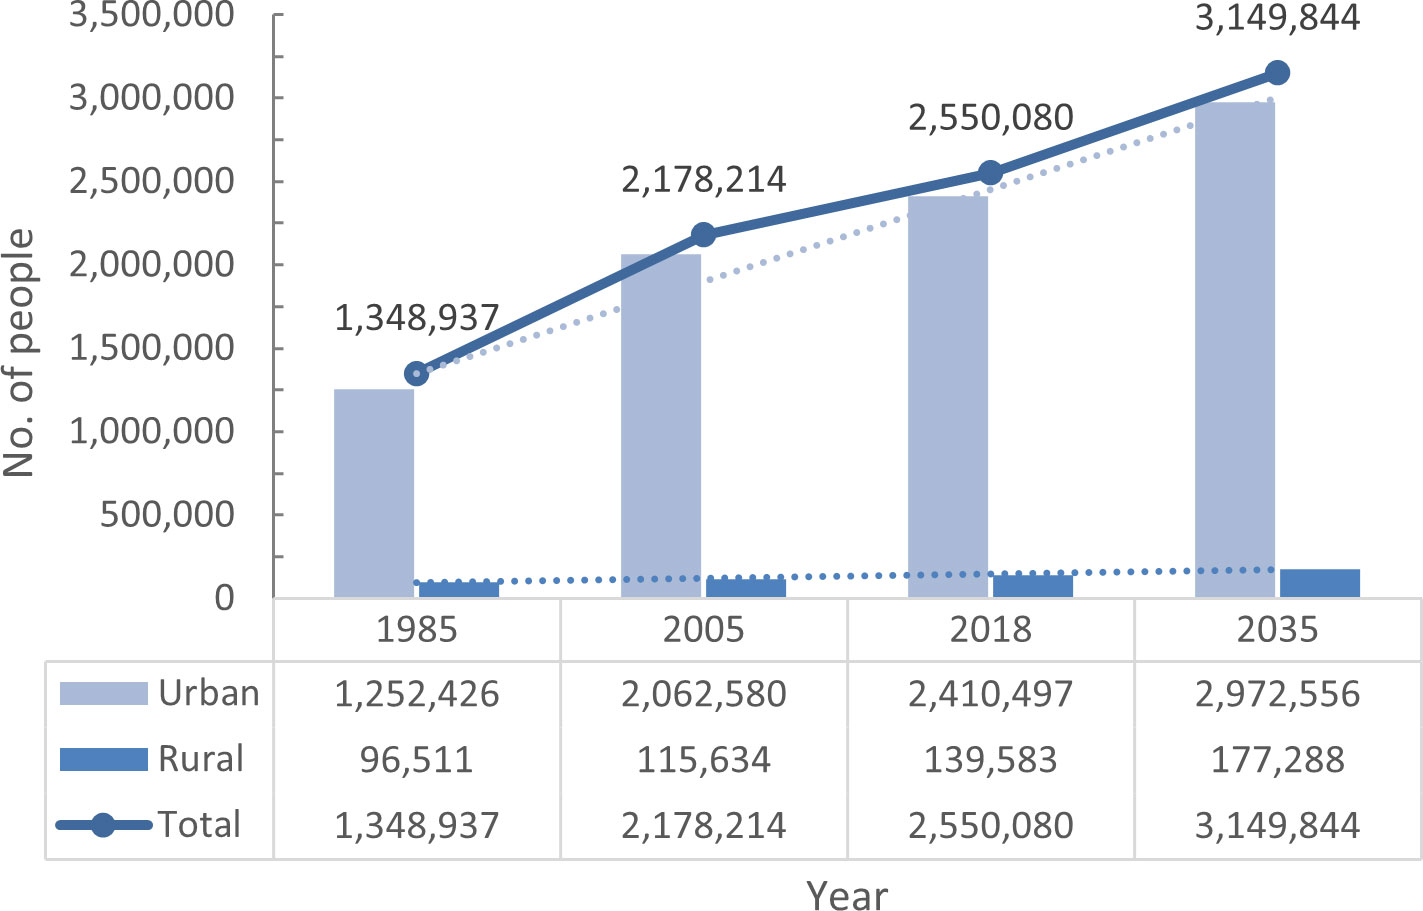
Figure 3 Population growth between 1985 and 2035. The 1985 and 2035 values are projected while the 2005 and 2018 values are from the corresponding census. Source: the authors with information from DANE (2018).
The 2018 census also showed that the Atlántico’s population is concentrated near the mouth of the Magdalena River in ‘Bocas de Ceniza’. More specifically in the Barranquilla Metropolitan Area (BMA), composed by the city of the same name and the municipalities of Soledad, Malambo, Galapa and Puerto Colombia, which altogether accounted for 80% of the total population within the study area.
One aspect worth considering in the population dynamics is the pulse due to the internal and international migration. In the case of the international migration, between 2014 and 2019 a total of 145,805 Venezuelans arrived at Barranquilla and, considering the 2018 year only, this number was 41,763 people (Oviedo Arango, 2020). Regarding the internal migration, the main flow is from and to the municipalities of the BMA and its surroundings in agreement with the statement of population being concentrated in vicinity to the Magdalena River-Mouth.
3.1.2. Economy
Among the activities that have been considered of particular interest for Colombian ocean economy are fisheries and aquaculture, maritime transport, sun and beach tourism, shipyards, offshore oil & gas and offshore non-conventional energy, and marine bioprospecting. Not in vain the National Council for Economic and Social Policy defines strategies for their promotion and development (CONPES, Spanish acronym). Table 5 contains a brief explanation of those activities which are particularly relevant for the department of the Atlántico.
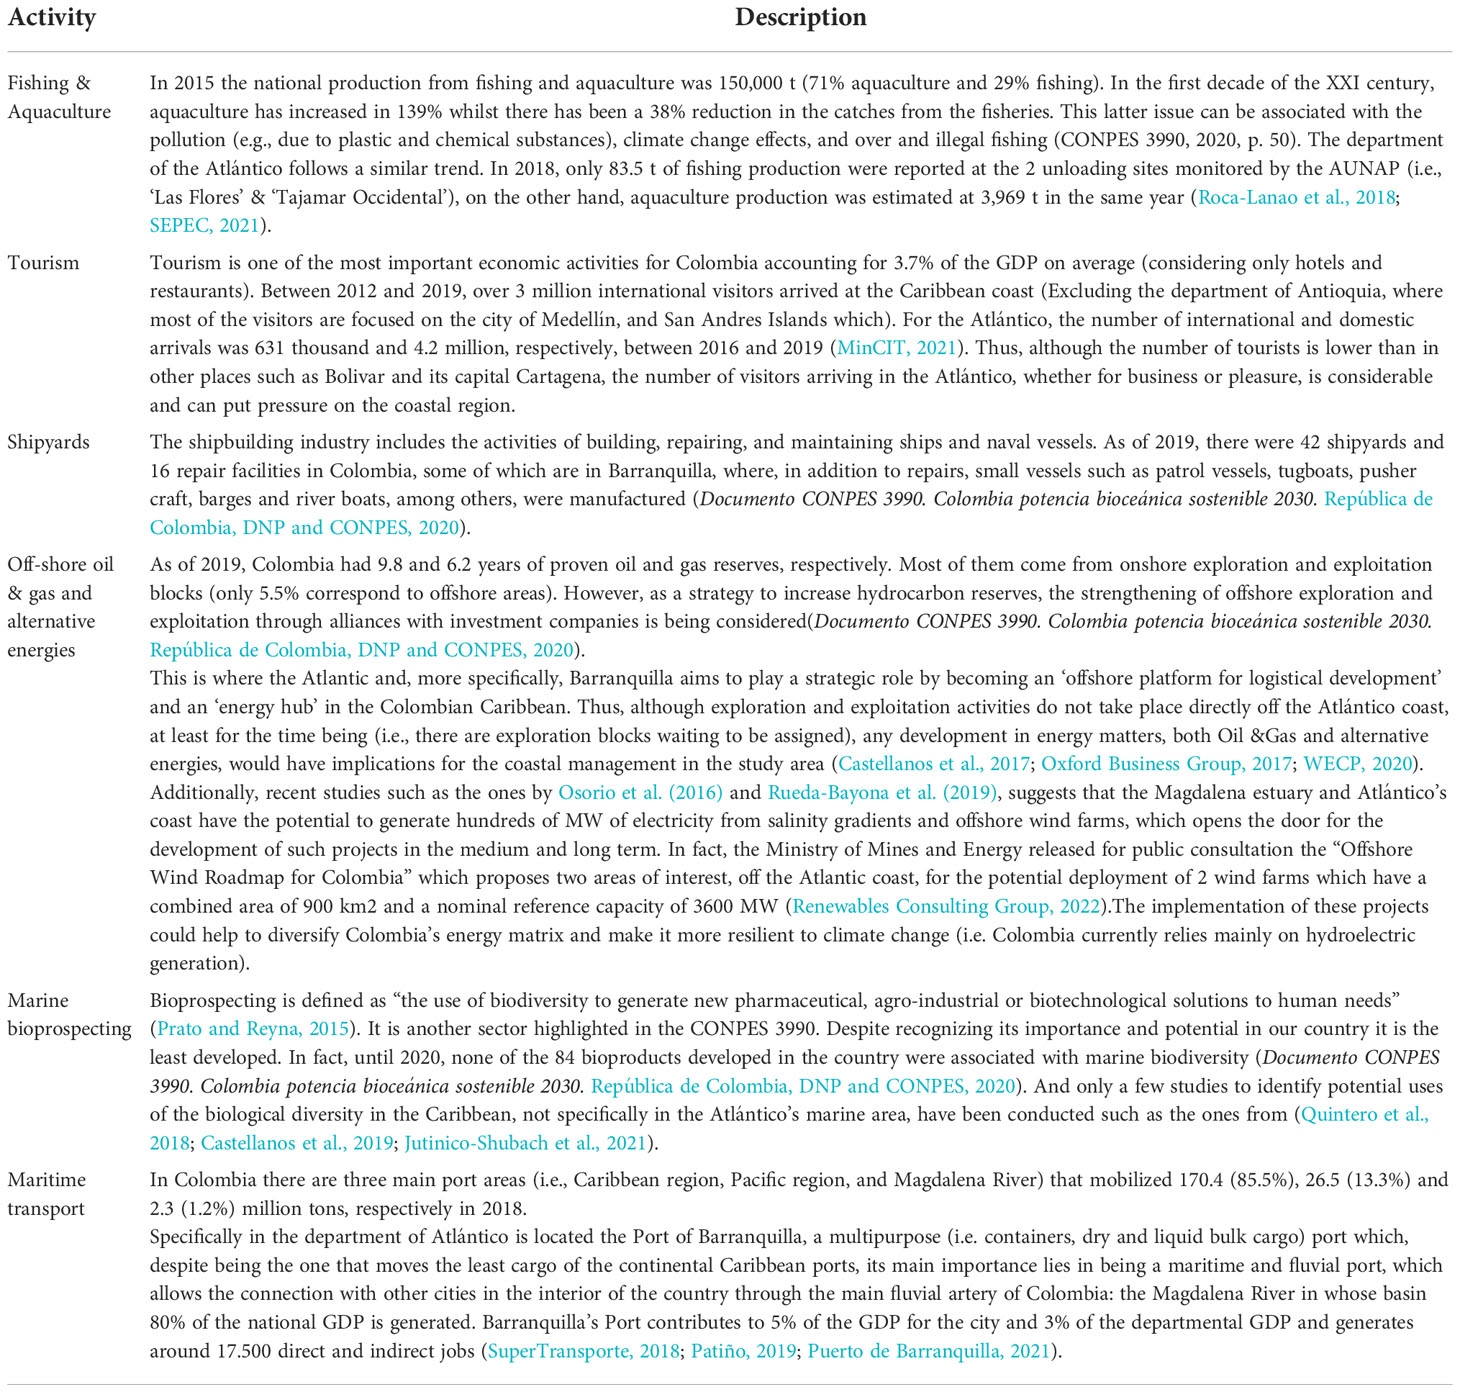
Table 5 Main activities of the blue economy in the Atlántico department.
Other important economic activities which are not part of the ‘Blue Economy’ are Commerce, transport, and communications (CTC); Corporate Services (CS), Social Services and Others (SSO); and the manufacturing industry (MI) which generated nearly three quarters of the Atlantico’s Gross Value Added (GVA) corresponding to 25 billion COP in 2018. During the same year, the main contribution to the Atlantico’s GVA was from the tertiary sectors or services activities (i.e. commerce, corporate services, hotels, restaurants and financial intermediation), followed by the secondary sector activities (i.e. construction and food, beverages, chemicals and non-metallic minerals industry); and very little representation of the primary sector or extractive activities (see details in Table 6) (Departamento de Atlántico, 2015; DANE, 2021).
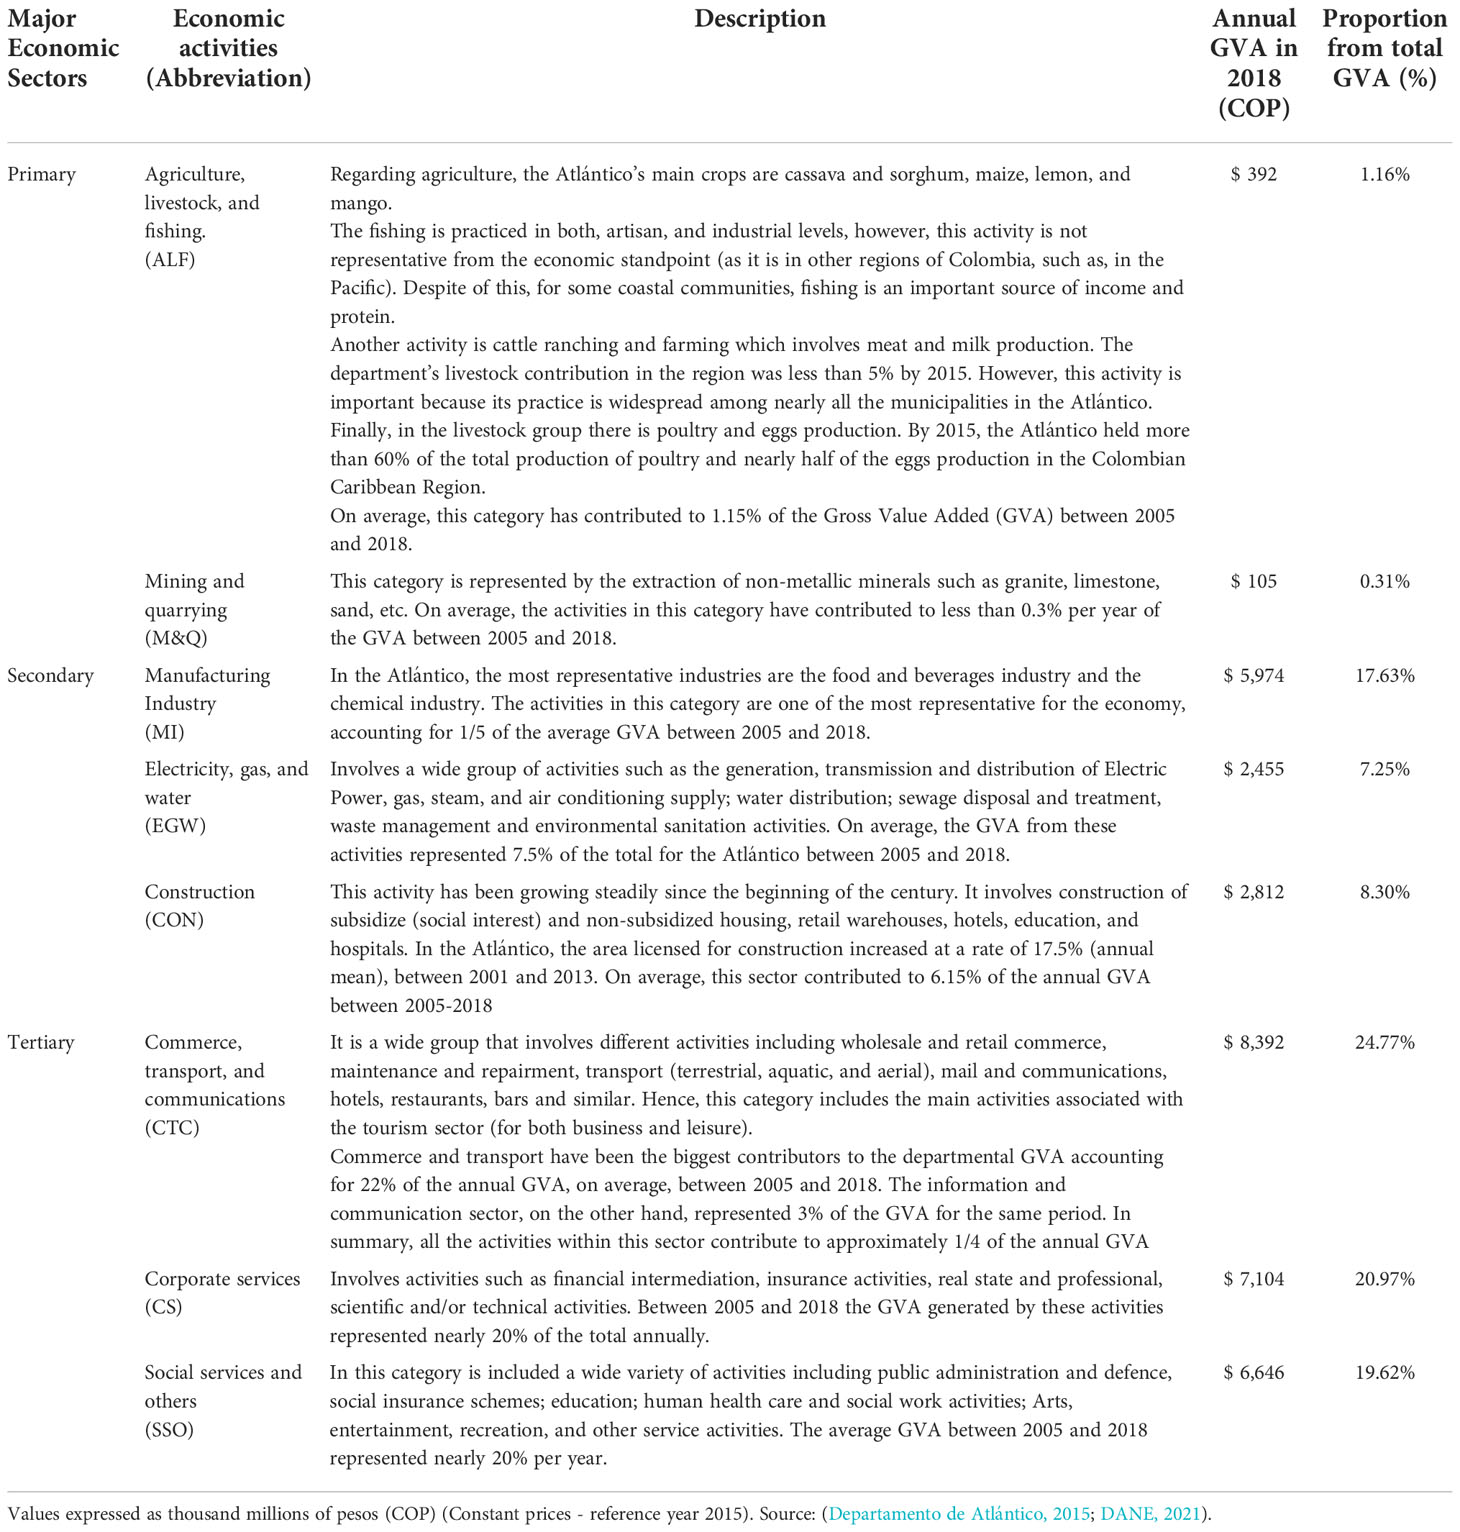
Table 6 Main economic sector and activities and their respective Gross Value Added (GVA) for the Atlántico department.
Another particularity from the economy of the study area is that the GVA participation is highly concentrated in the areas surrounding the Magdalena River Mouth, 90% of the GVA from the Atlántico was generated in the Barranquilla Metropolitan Area - BMA (i.e., composed by the city of Barranquilla and the municipalities of Puerto Colombia, Galapa, Soledad and Malambo) equivalent to COP 35.2 billion for the 2018. This means that the activities that generate the greatest GVA are concentrated on the banks of the Magdalena River, while the remaining municipalities, which cover most of the department, are mainly dedicated to the primary sector (i.e., activities where goods and natural resources are extracted). Specifically in Atlántico, these activities correspond to agriculture (i.e., the main products are cassava, maize, sorghum, cotton, banana, tomato, sesame, and fruits.); livestock (i.e., main livestock farming occurs at Sabanalarga, Luruaco, Ponedera and Candelaria); and fisheries, both artisan and industrial (Departamento de Atlántico, 2015).
3.2. Pressures (P)
This study focuses on the Endogenic Managed Pressures (EnMP) which are those mechanisms of change derived from activities occurring within the boundaries of the study area whose consequences can be managed through the implementation of local measures (responses). To identify the pressures on the system the following indicators were used: nutrient loads (N and P); domestic and industrial organic matter and microbiological discharges measured as Biological Oxygen Demand (BOD) and total coliforms, respectively; suspended sediment load, and solid waste total production. Important to note that all the loads presented here correspond to the discharges generated within the study area boundaries and not to the accumulative loads from the whole Magdalena Basin.
3.2.1. Nutrient loads
Theoretical daily loads of total N and P from livestock manure and fertilizers used in croplands are the highest in the study area. For both nutrients, higher loads enter the DtM-LM basin. Other sources of nutrients were domestic wastewater from both, served and non-served population. Overall, total nutrient loads from Cattle, Poultry and Swine manure are the main contributors, whereas, the other animals play a minor role, being goats and sheep the lowest contributors (see Figure 4).
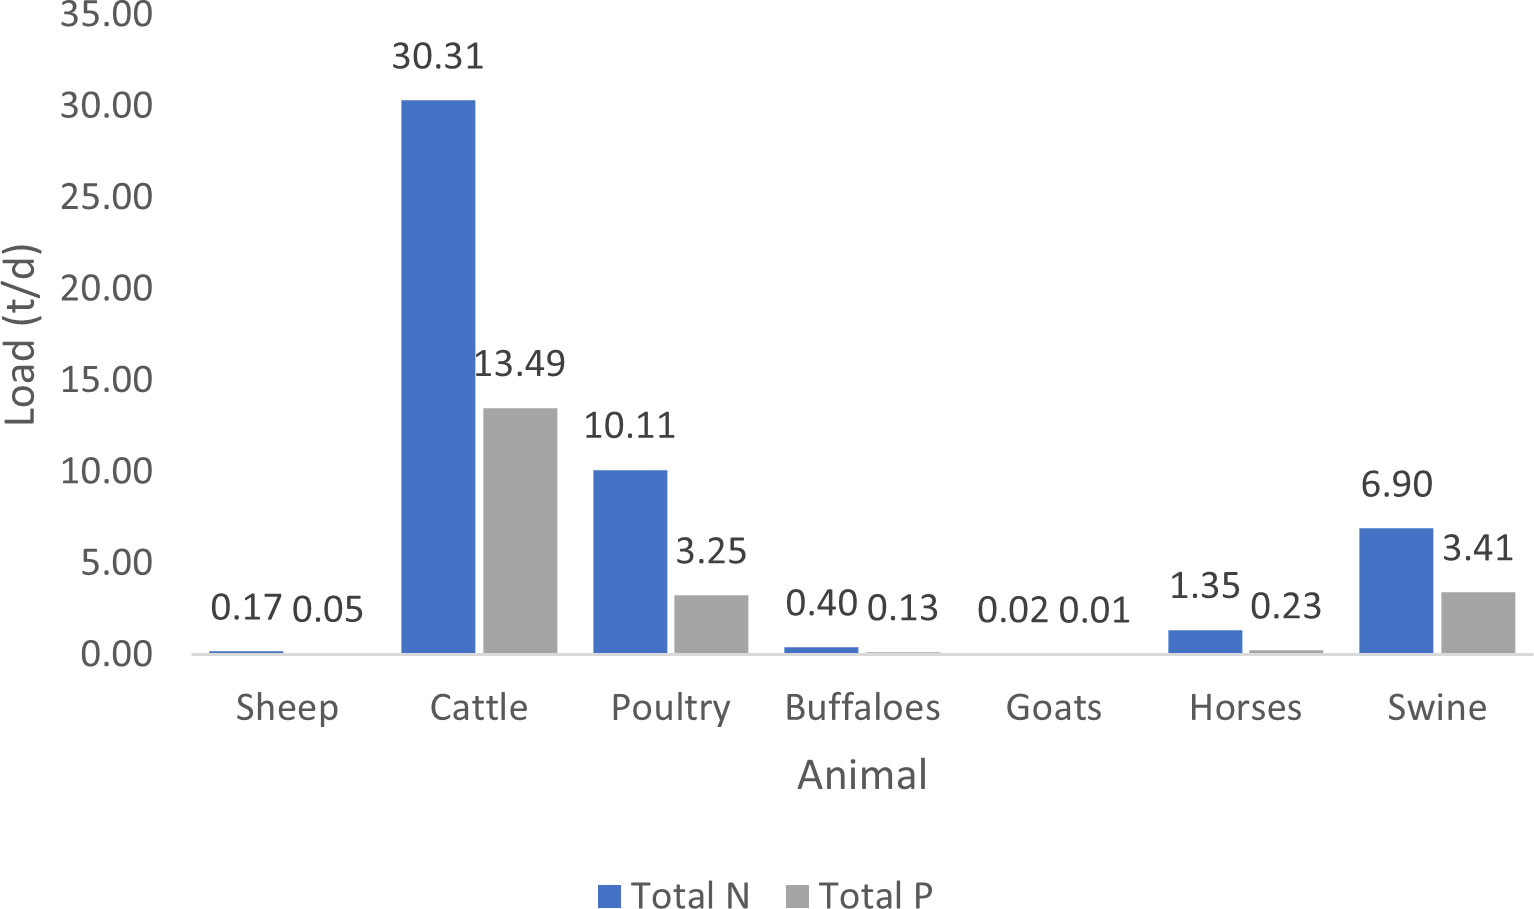
Figure 4 Nutrient loads from livestock manure by animal group.
The results for Nitrogen cannot be compared with total certainty considering that the values for some of the sources have different units, namely, manure and fertilizer’s inputs are expressed as Total Nitrogen (TN), while domestic wastewater (i.e., from served and non-served population) are expressed as Dissolved Inorganic Nitrogen (DIN). Despite of this, an acceptable comparison can be made considering that DIN is a part of Total N. Added up, the specific contributions of the study area to N from fertilizers and manure was 14.84 t d-1 and 48.99 t d-1 in the DtC+ and DtM-LM, respectively. In the case of DIN from wastewater, those values were 1.19 t d-1 and 7.17 t d-1, respectively (see Figure 5).
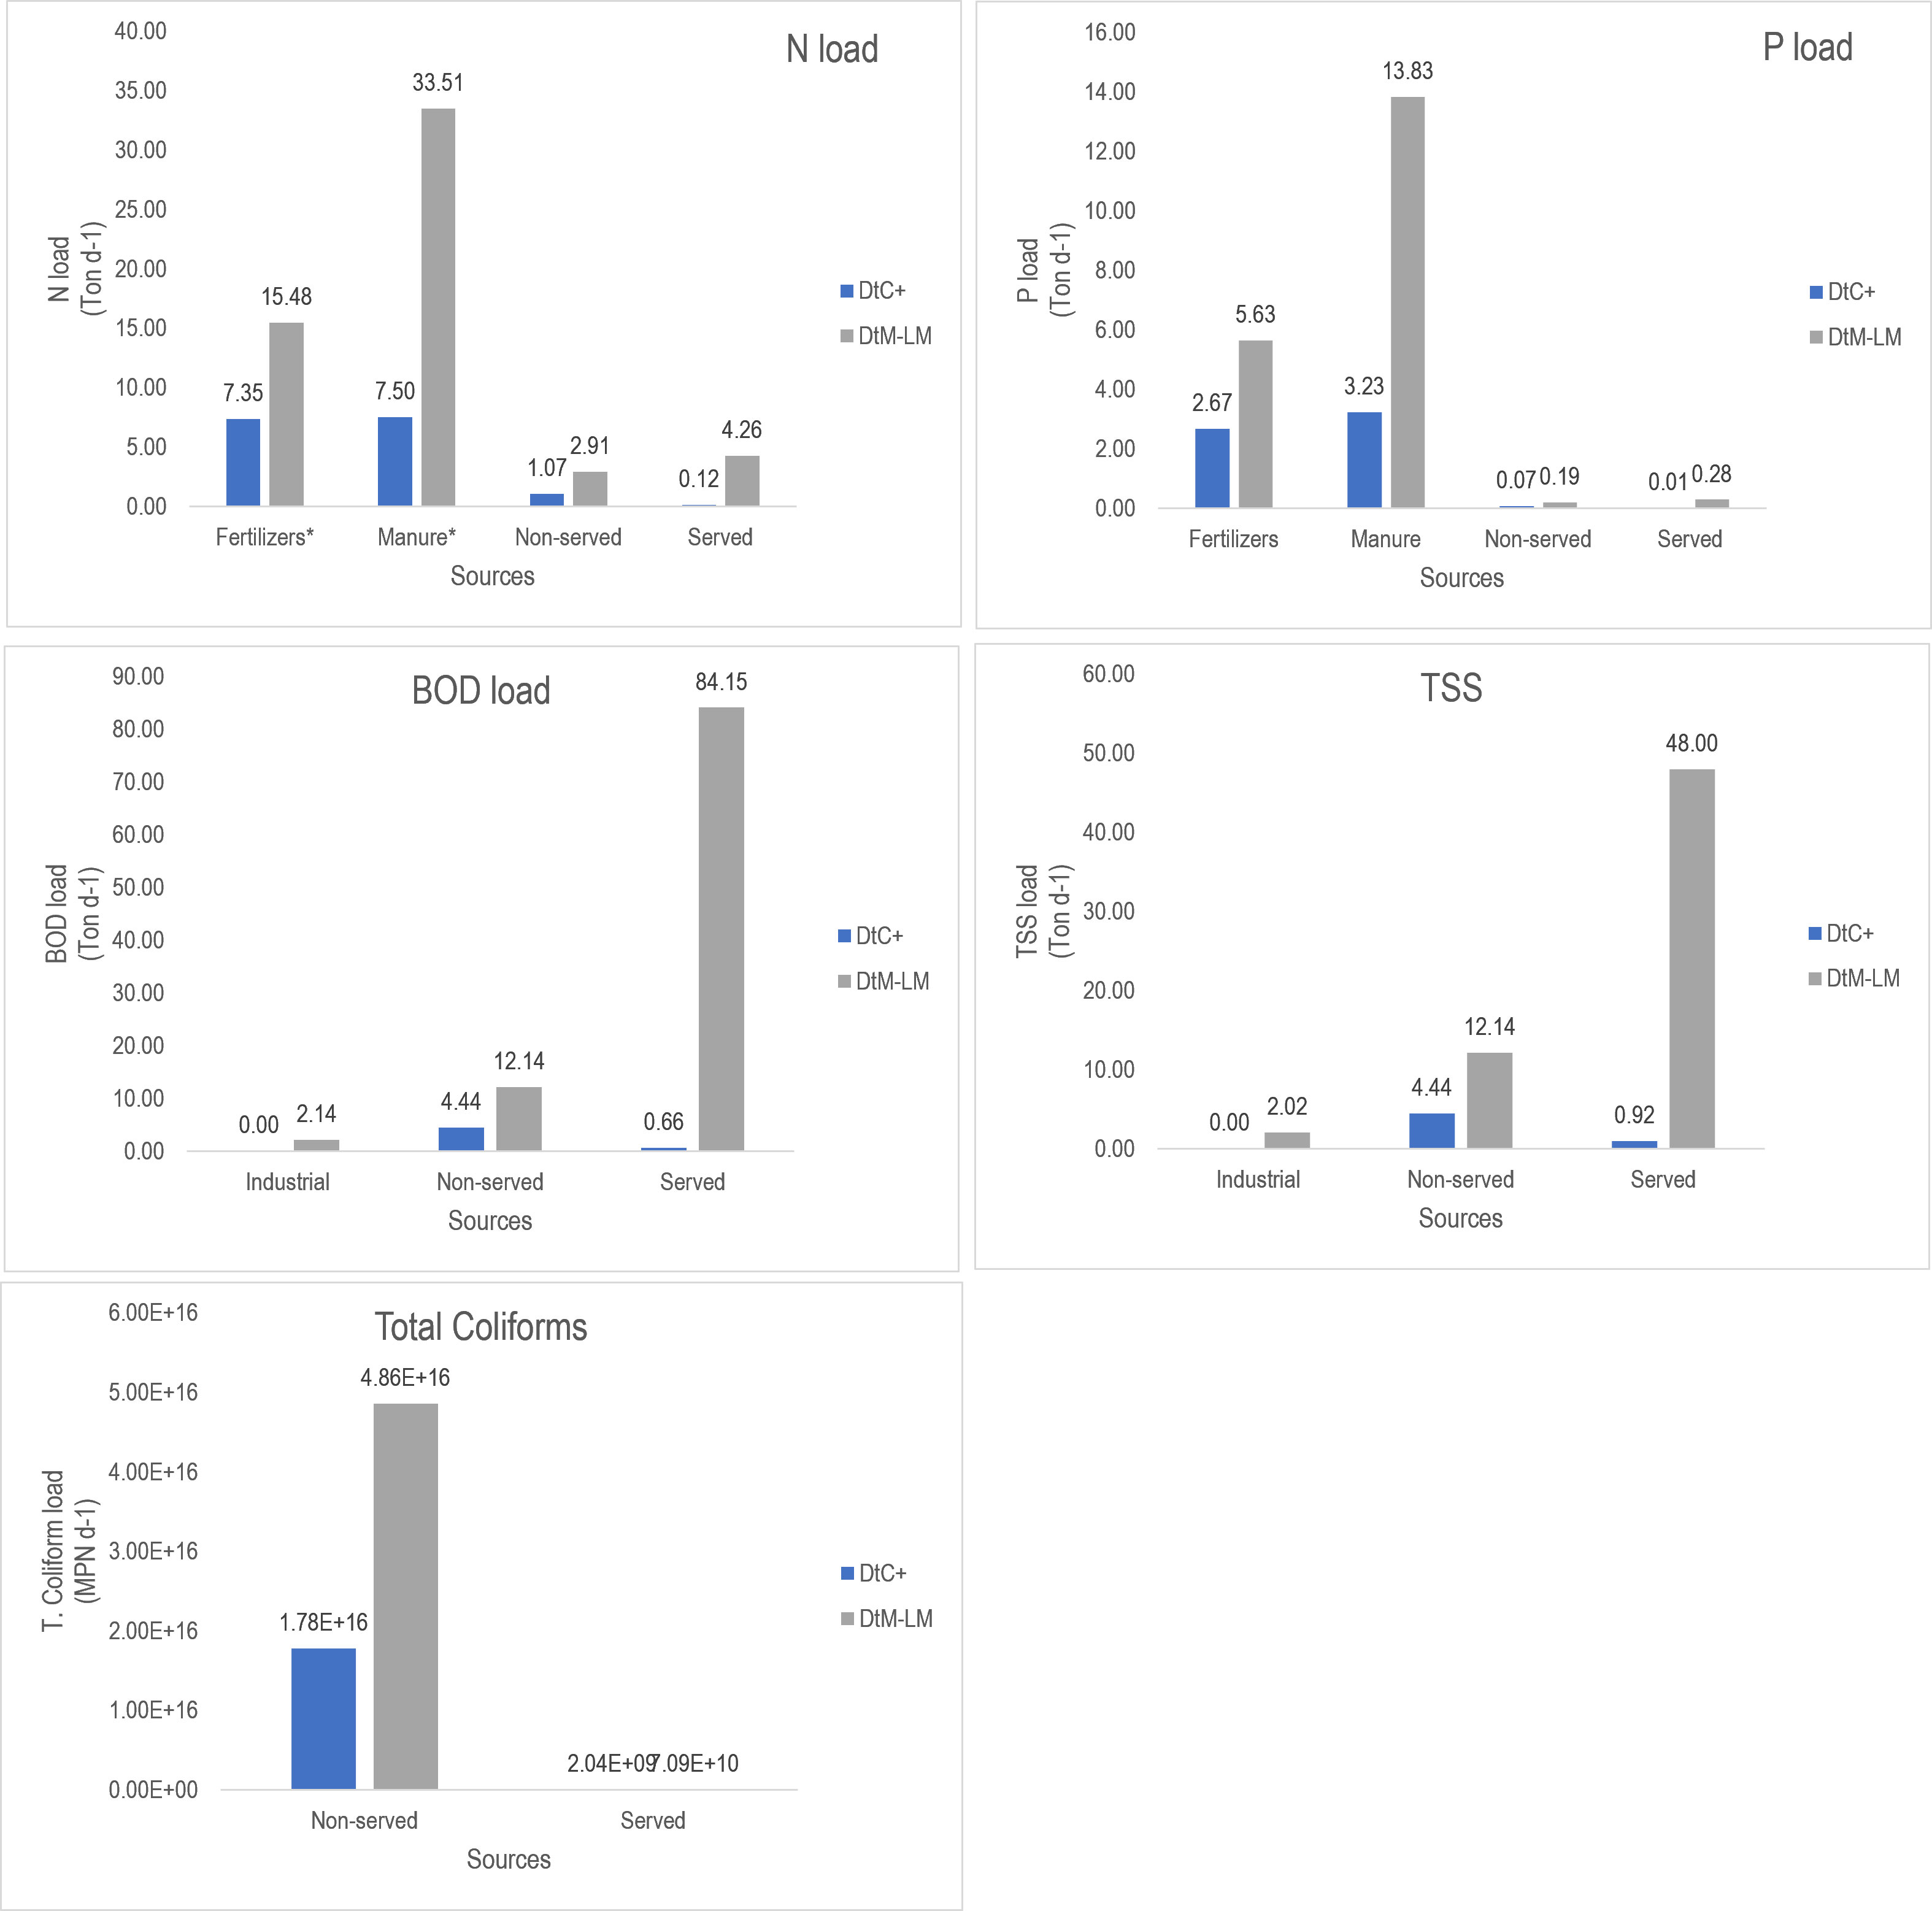
Figure 5 Contaminant loads by source and basin.
The comparison of phosphorus was simpler because all the sources were measured with the same units. In this case, is evident that manure and fertilizers, in the same order, are the highest sources of the nutrient. Overall, the daily load of phosphorus in the study area was estimated as 25.91 t d-1 from which nearly 80% of the P (i.e., 19.94 t d-1) is discharged in the DtM-LM basin, whereas the DtC+ receives 5.98 t d-1 of Total P (see Figure 5).
A rough estimation of the nutrient load at Calamar Station, located just before the bifurcation to the “Canal del Dique”, indicates that total nitrogen and total phosphorus is, respectively, 682.9 t d-1 and 185.9 t d-1 before receiving the discharges from the DtM-LM basin. Those values were calculated based on the average TN and TP recorded between 2005-2018 (IDEAM, 2022) and an average interannual flow of 7,264 m3 s-1 (Restrepo et al., 2018). Hence, the potential nutrient loads from DtM-LM could account for nearly 7% and 10% of the Nitrogen and Phosphorus load in the last stretch of the river.
3.2.2. Biological oxygen demand (BOD) and Total Suspended Solids (TSS) loads
These two parameters were associated to the discharges of domestic and industrial wastewater. In both cases the major source corresponds to domestic wastewater from served population which introduces 84 t d-1 of BOD and 48 t d-1 of TSS. The system, including all sources (i.e., industrial, non-served and served) and basins (DtC+ and DtM-LM), receives a total of 103 t d-1 of BOD and 67 t d-1 of TSS. When comparing the inputs by basin, the DtM-LM basin is the one receiving the highest loads with more than 90% of the total discharge (i.e., 98.43 t d-1 BOD and 62.16 t d-1 TSS) (see Figure 5).
3.2.3. Total coliforms
The only sources considered for this indicator were domestic wastewater from served and non-served population. There is an evident difference between the microbiological load from treated wastewater (served population) and the one discharge directly into the soil or a water body. In the first case, the discharge for the whole study area was 7.30 x 10¹⁰ NMP d-1, while, in the latter that value is estimated to be 6.63 x 10¹⁶ NMP d-1, in other words, 6 orders of magnitude higher. The comparison among basins, showed a similar behaviour to the previous parameters, namely, a higher load in the Low Magdalena Basin which represents 73% of the overall discharge (i.e., 4.86 x 10¹⁶ NMP d-1) (see Figure 5).
3.2.4. Solid waste (Non-hazardous)
Estimates of waste production based on data from the 2018 census and per capita production in kg hab-1 d-1 were obtained. Overall, the yearly production of domestic solid waste within the municipalities from the study area is 680,938 tonnes. The quantities of residues are different among municipalities ranging from 1,085 t y-1 (i.e., Piojó) to 347,842 t y-1 (i.e., Barranquilla). The highest production of domestic waste occurs within the BMA, Soledad, and its surrounding municipalities, all of them concentrated in the left margins of the Magdalena River close to its mouth, conversely, this is the area with the highest collection coverage. Analysis by basin show that garbage production in the DtM-LM accounts for 96.1% of the total waste generated in the system (i.e., 654,631 t y-1) while the DtC+ only accounts for 3.9% of the production (26,307 t y-1).
When looking at waste collection services, the average percentage of served households is 84% ± 12% overall, with different values among municipalities ranging from 54.6% in Piojó to 98.52% in Barranquilla. By basin, the average percentage of served houses is 72% ± 14% and 89% ± 7% in the DtC+ and DtM-LM basins, respectively. This translates into 4,526 t y-1 (DtC+) and 22,686 t y-1 (DtM-LM) of waste which is not being collected and has the potential to generate state changes and impacts in the surrounding habitats (see Figure 6).
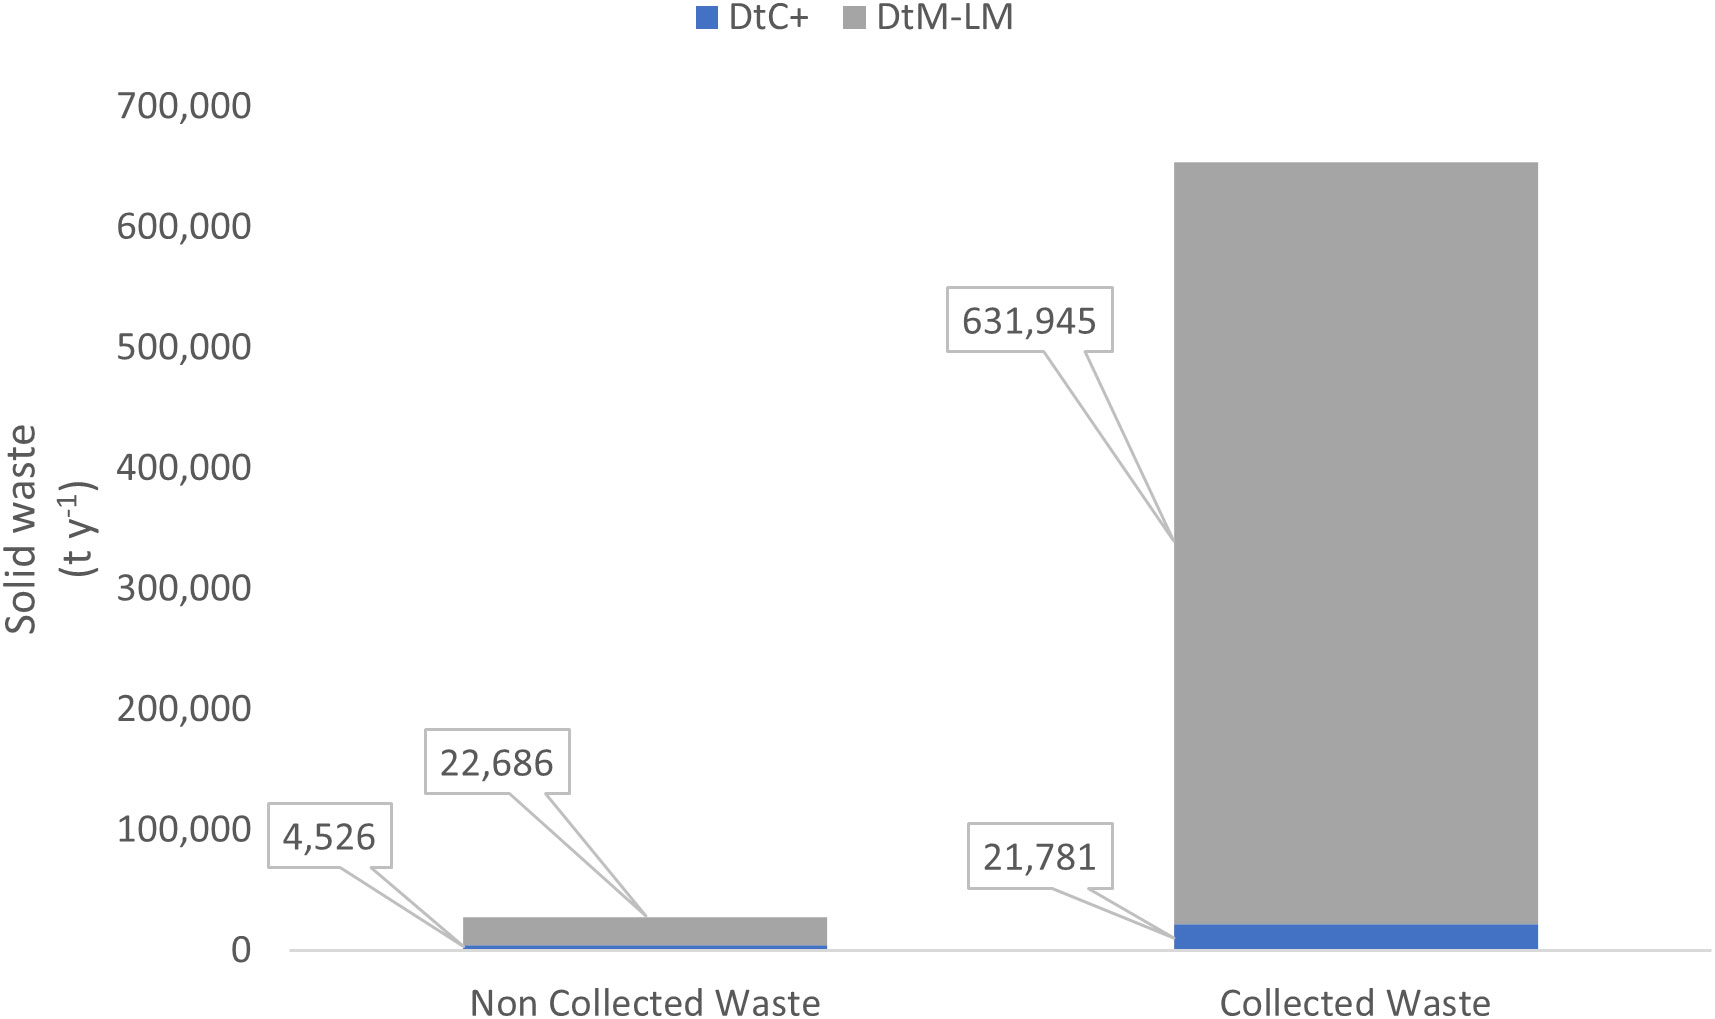
Figure 6 Collected and non-collected solid waste by basin.
3.3. Impacts (I)
Information from different studies conducted within the study area and its surroundings, show how the state changes introduced in the system, have led to disruptions in the flow of those ecosystem services, turning into impacts (on Human Welfare) that can be totally or partially caused by inputs of land-based contaminants. Horrendogram in Figure 2 shows the connection among pressures, state changes and impacts. Some of the impacts have been reported by other authors (i.e., increased maintenance and cleaning cost of the beach, reduction of tourism flow/revenue and adverse health effects to vulnerable groups) while others are deduced from the state changes in the ecosystems from where they are obtained (i.e., reduce fish stock, reduce protection against flooding and coastal erosion, difficulty to access drinking water, loss of cultural and spiritual values, and increased cost of living).
For example, nutrient inputs lead to the eutrophication of the wetlands which ends up altering the quality of the water that, in some of the reservoirs, is used to supply people. Likewise, in extreme cases of eutrophication, there can be a consequent reduction of dissolved oxygen to levels that are detrimental to the survival of fish that are used for self-consumption and commercialization. In other words, nutrient inputs may reduce the animal protein sources of local populations, increasing malnutrition or, alternatively, increasing the cost of living for people who would have to buy other protein (cattle, pigs or fish brought from elsewhere) to make up for local losses. Similar impacts can also be associated with other types of pressures such as organic matter, pathogens, garbage, and solid waste, which not only hinder access to water for consumption (making treatment more expensive or impossible to use) but also alter the visual quality of the landscape, which increases the costs of maintenance and cleaning of natural spaces and/or leads to the loss of the cultural and spiritual value of some sites. Likewise, there may be a loss of profits derived from activities such as tourism.
3.4. Responses
Colombia has a Policy for the Integral Management of Water Resources (2020) that serves as a general framework to guide actions to improve the quality of water resources and reduce pollution through the organisation and regulation of uses and users and the monitoring and surveillance of the quality of surface water bodies. This policy is implemented through instruments such as those mentioned in Table 7.
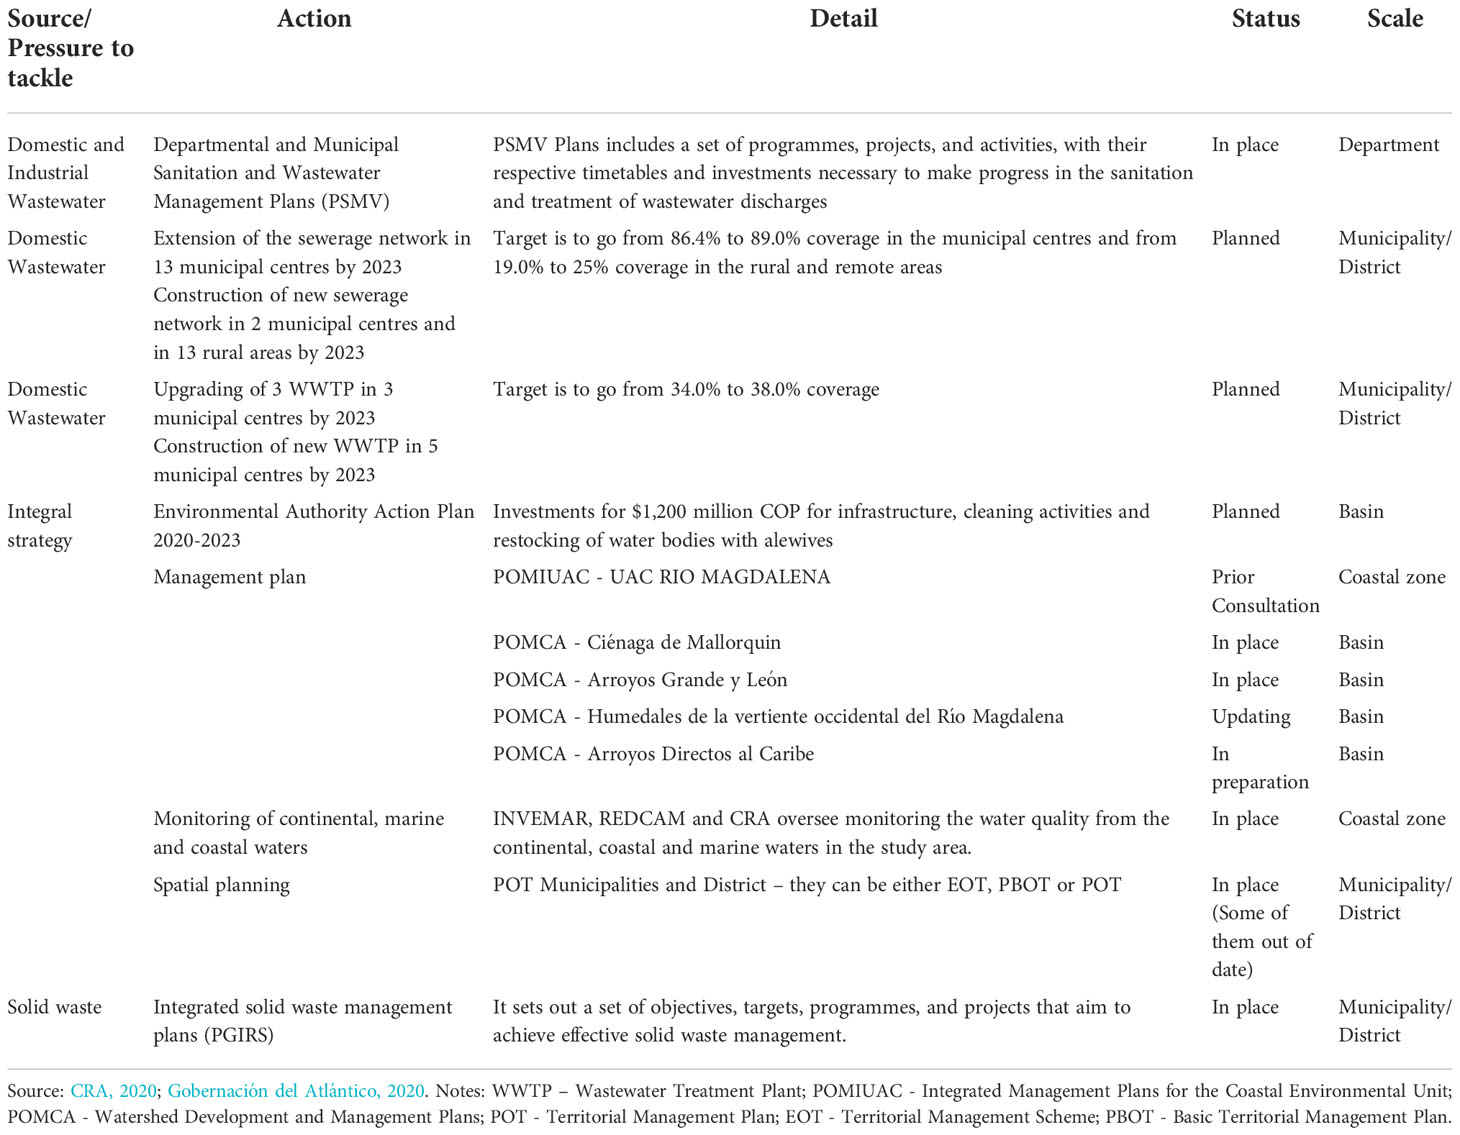
Table 7 Example of current Responses (Measures).
In general terms, the management measures that are being implemented and that help in a particular and/or transversal way to control pollution from one or several land-based sources are developed, implemented and financed by the environmental corporations of the study area (i.e., Barranquilla’s Environmental Protection Agency - EPA Barranquilla Verde, with jurisdiction in the Barranquilla Metropolitan Area – BMA; and the Corporación Autónoma Regional del Atlántico – CRA, with jurisdiction in the rest of the department) in conjunction with the administrations of the municipalities and the district of Barranquilla. Additionally, some of the activities are carried out by entities whose jurisdiction is outside the study area, as is the case of the problem of rubbish on the beach in the municipality of Puerto Colombia, which is attributed to discharges from the Magdalena River, therefore, it is considered a non-riparian municipality and is in the jurisdiction of CORMAGDALENA.
The integrated management plans for basins, wetlands and the coastal zone are lacking either the formulation or the implementation, meaning they were not operative until 2020. Instruments with a narrower scope, meaning those sectorial plans (e.g., mangrove management; water use and quality; and protected areas management) are in a further stage of development and implementation, however, there is still a considerable number of non-existent instruments (e.g., Water resource management plans).
Current responses are oriented towards the extension of the coverage of public services (i.e., sewage and wastewater treatment systems); improving the use/disposition of solid waste; management and control of discharges into water bodies; definition of land use plans and schemes; and remediation of affected ecosystems (e.g., integral recovery of the Ciénaga de Mallorquin to improve fishing and attract tourism or interventions in the wetlands on the western bank of the Magdalena River). Some examples of the measures taken at a local level are presented in Table 7.
4. Discussion
When assessed at the global and regional level, the contributions of small basins such as those in this study are negligible. For example, TSS inputs are not even 0.01% of the inputs made by the Magdalena River to the Caribbean Sea (Restrepo et al., 2018). However, the sources of pollution analysed play an important role in the health of local ecosystems and the goods and benefits they provide to the local populations.
4.1. Drivers (D)
To name the Drivers of the activities that produce an impact on a certain study area seems to be, a priori, an easy matter. However, when it comes to management frameworks such as DAPSI(W)R(M), an in-depth and critical analysis is needed if effective management measures are expected to come out of it. Hence, Maslow’s hierarchy of needs provides an interesting and useful tool to define whether such drivers constitute basic needs, psychological needs, self-fulfilment needs or others. And this categorization is important because, as Maslow suggested in 1943 and 1970, “one must satisfy the lower-level deficit needs before progressing on to meet higher level growth needs” (Elliott et al., 2017).
In summary, if the drivers of the different impacting activities for the socio-ecological system are not well-understood, management measures might not be as effective as it is expected and, in fact, could lead to creation or transfer of the problematics to other areas of the system. For example, a fishing-ban in a contaminated area where communities rely on fish as their main source of protein (e.g., Ciénaga de Mallorquín), is a measure easy to impose, however, such measure without offering alternatives for the people to satisfy their need for food (biological need) will be difficult to enforce and will derive in other problems such of public health and malnutrition.
4.2. Activities (A)
According to the information presented in the Regional Economic Situation Report – ICER (Departamento de Atlántico, 2015), complemented with information from the National Administrative Department of Statistics (DANE), the Atlántico has undergone a structural change in its economy since 1980 when it began first a process of deindustrialization (i.e. due to lack of supplies and shortage of goods to offer) accompanied by a process of outsourcing and, after the turn of the millennium, the economy of the Barranquilla, hence of the department, has re-emerged and the industrial development has taken-off since then (Departamento de Atlántico, 2015, pp. 87–102).
Today, the two sectors that drive the economy of the department are the tertiary and secondary sectors, in that order (see Table 6). The manufacturing industry (food, beverages, and chemicals), construction, commerce and social services have been the main contributors to the departmental product in the last 15 years.
The primary sector was relegated in economic importance with contributions of less than 2% of the departmental total. However, from the point of view of sustainability, this sector continues to be relevant since activities such as cattle ranching and farming, to produce meat and milk, are carried out in most of the municipalities of the department. Another activity that stands out in this sector is the poultry and eggs production.
The secondary sector has shown great development in the last two decades. This is reflected in the increase of licensed areas for Subsidised Housing (VIS) and non-VIS housing construction in the department, in addition to the increase of non-residential constructions such as commercial warehouses, hospitals, educational centres, hotels, among others. Precisely, this boost to the secondary sector is closely interrelated with the predominance of the tertiary sector as the department’s main economic engine.
Finally, the tertiary sector has contributed to the growth of nearly two thirds of the departmental Gross Value Added based on activities such as wholesale and retail trade, business services, real estate, and financial services. All the above, together with the development of hotels, restaurants, bars and the like, promote the arrival of business and leisure tourism.
4.3. Contaminant loads/pressures (P)
The case of nutrients is of particular importance. As presented in the results, the inputs from DtM-LM alone could represent between 7 and 10% of the nutrient load in the last stretch of the river. At this point, it is necessary to emphasise that these N and P loads make up only a theoretical maximum which can translate into much lower loads being transported to the water bodies. This is because it does not consider factors such as nitrogen fixation in soil and plants, denitrification processes, water consumption and retention that may occur along the network of canals and wetlands before it reaches the Magdalena or the Caribbean, among others. However, for the purposes of this analysis, these losses were considered negligible considering the small size of the basin, short residence times of the water runoff and, poor and highly intervened soils with a reduced capacity to assimilate/retain nutrients. In importance, nutrients are followed by inputs of organic matter and bacterial load, mainly associated with discharges of treated and untreated domestic wastewater (see Figure 5).
4.4. State changes (S) and impacts (I)
The results from the marine water quality characterization and assessment conducted by the INVEMAR – REDCAM in 2018 show an overall “Acceptable” water quality with ICAM values of 51.80 and 65.90 during the dry and wet seasons, respectively. Analysed by stations, the results for the dry period are more heterogeneous with stations in all the categories from “very bad” to “optimal”, however, more than 60% of the stations presented quality equal or below “acceptable”. The wet season on the other hand, did not presented any station with “optimal” conditions, however, 70% of the stations presented an “adequate” quality (see Figure 7).
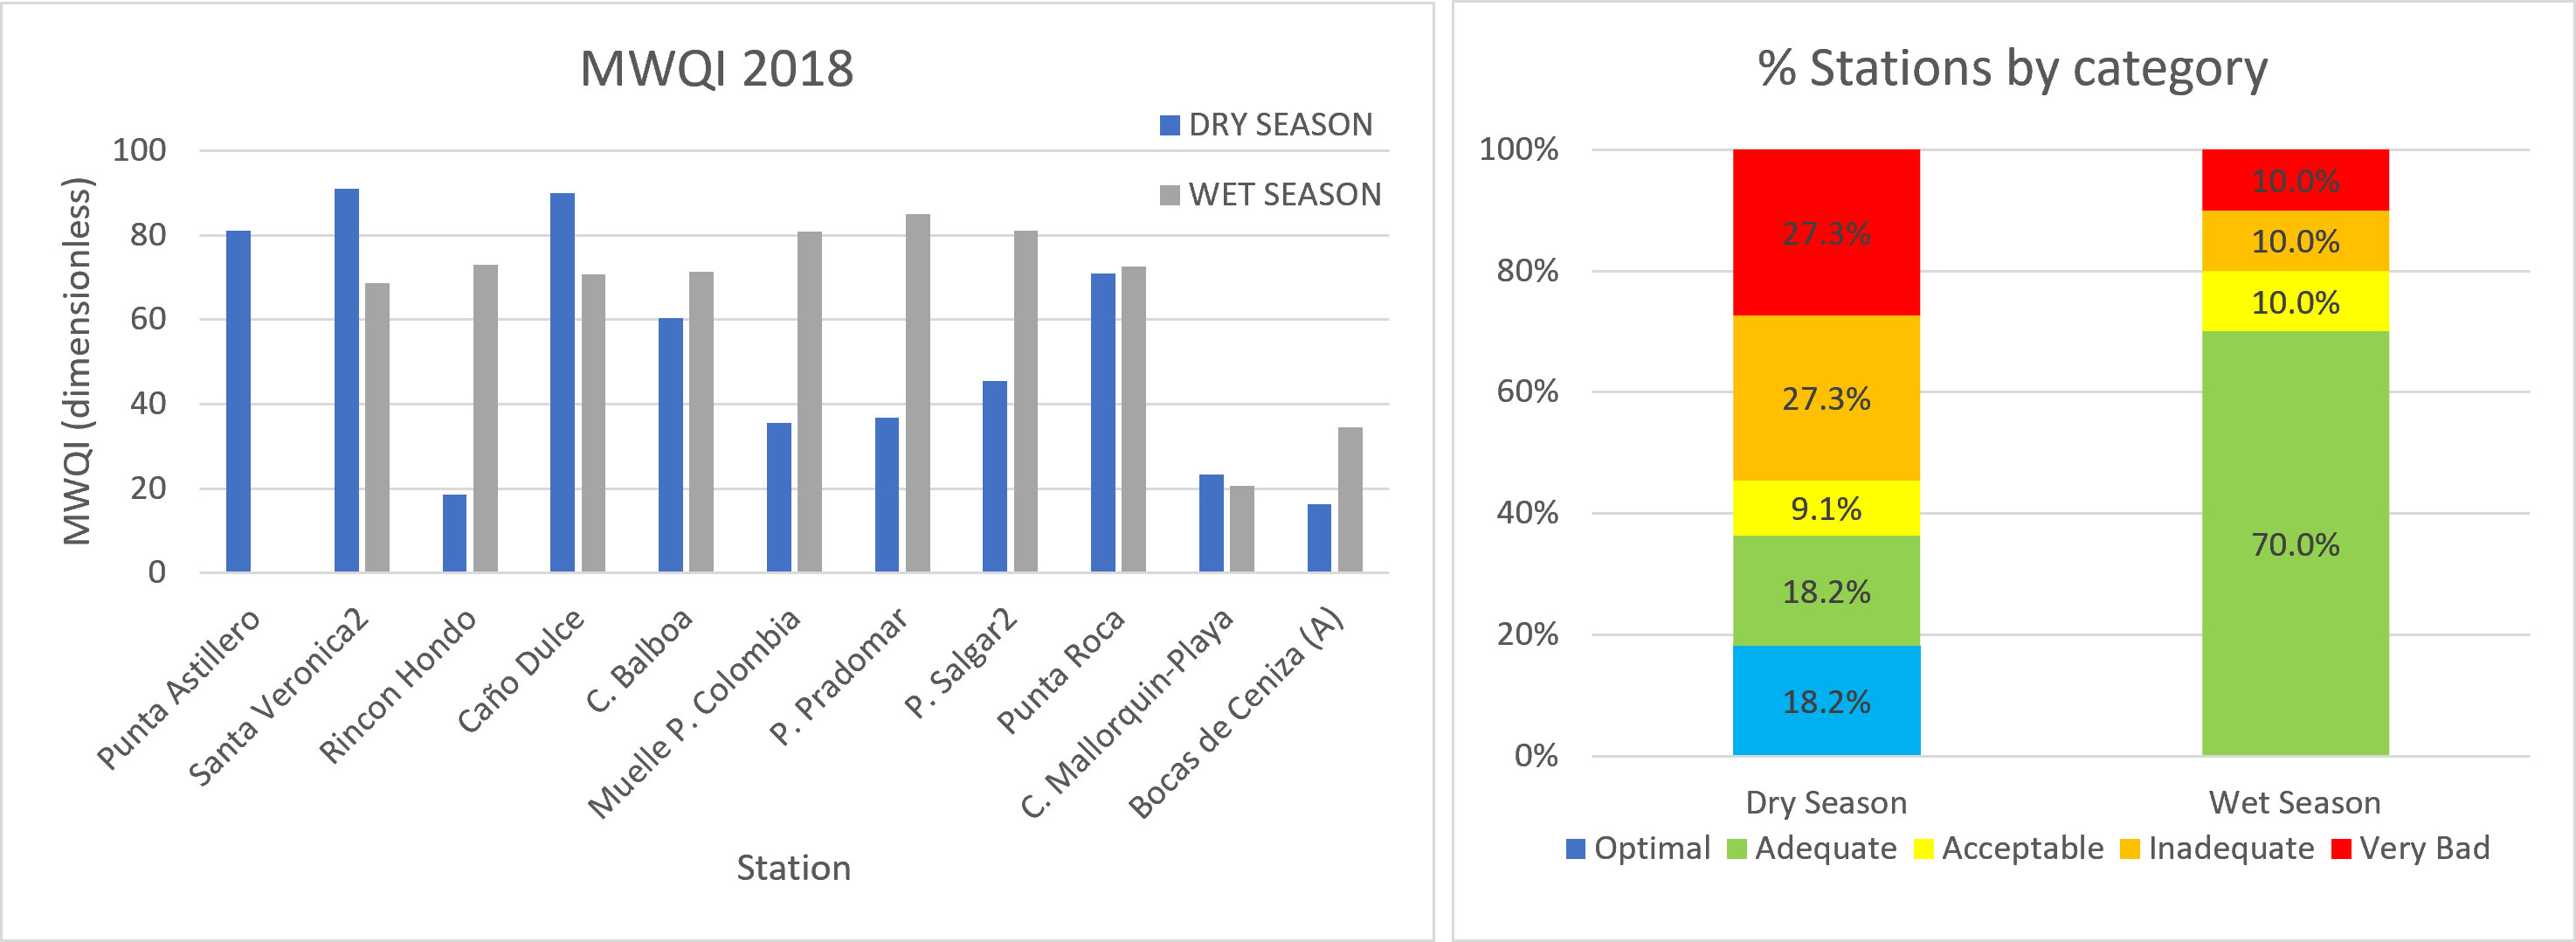
Figure 7 Coastal Water Quality Index (ICAM) calculated for 11 stations along the Atlántico’s coast. Source: Adapted from INVEMAR - REDCAM (2022).
Looking at the individual quality of each measured parameter, during the dry season the only parameter with “optimal” and “adequate” quality were pH and HDD, in the others, at least one station presented “very bad” or “inadequate” quality, showing signs of stronger negative effects due to external pressures. The parameter with the worst quality was BOD with all the stations showing a “Very Bad” quality, followed by NO3 that showed “Very bad” and “Inadequate” quality in 3 stations each. During the wet season, pH, DO, and HDD, presented and “Adequate” quality or above in all the stations. The parameter with the worst quality was BOD (i.e., 67% of the stations with “Inadequate” quality and the rest had “Very bad” quality), followed by Faecal Coliforms where half of the stations had either “Very bad” or “Inadequate” quality (see Figure 8).
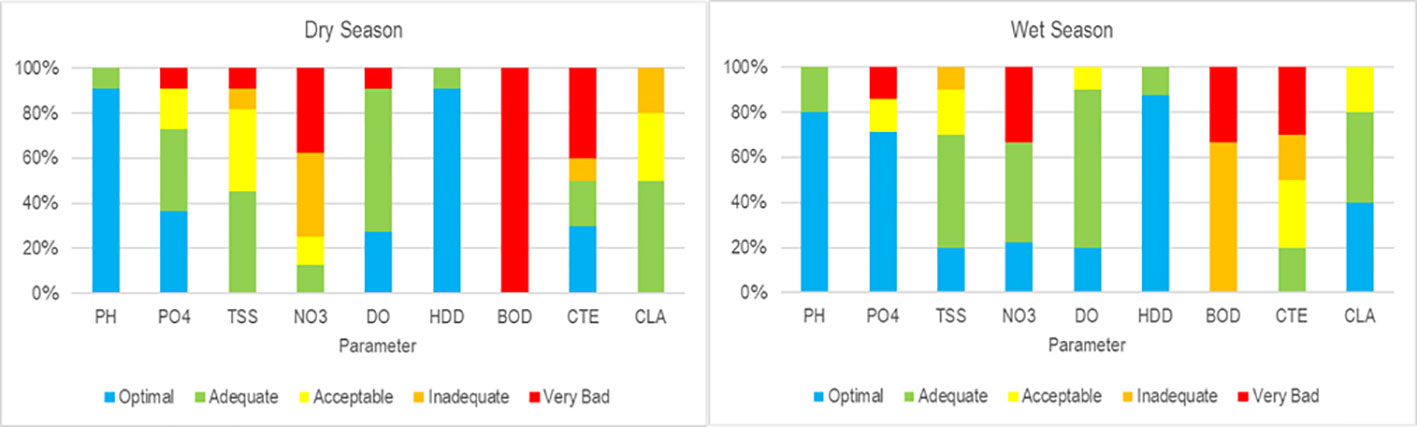
Figure 8 Proportion of measurements from each measured parameter by quality category. Source: Adapted from INVEMAR - REDCAM (2022).
It is important to highlight that BOD was only measure in those waters considered estuarine (i.e., at the mouth of the Magdalena River, Rincon Hondo, Ciénaga de Mallorquin and Ciénaga de Balboa) in the other stations, where the water is considered as marine, the parameter HDD was measured instead. As to why this adaptation was made, there is no explicit indication in the methodology and protocols from the ICAM. However, one possible explanation comes from the rationale that Chlorophyll – a is an indicator of phytoplankton biomass which can be affected by eutrophication processes which can occur with more frequency at the mouth of the rivers. However, the further away from the river-mouths more relevance is given to other contaminants less degradable and which are derived from the use and load/unload of hydrocarbons from part of the maritime transport industry.
With regard to local effects, take for example the changes and impacts that have been evidenced in some of the wetlands of the study area: eutrophication and bioaccumulation of contaminants (e.g. “Ciénaga de Mallorquín” and “Ciénaga de Luruaco”) (Torres-Bejarano et al., 2020); algal blooms (e.g. Ciénaga de Luruaco); loss of mangrove and hydrobiological resources (e.g. Ciénaga de Balboa, Ciénaga de Los Manatíes, Wetland Complex of the western slope of the Lower Magdalena); presence of pathogens in the water and possible affectation of the sand on the beach. All those impacts are caused to a greater or lesser extent by different pressures. Thus, the water quality of the wetlands is directly affected by nutrient and organic matter loads but solid waste and plastics deposited in the mangrove areas exacerbates the loss of mangroves and, therefore, decreases the purifying capacity of the ecosystem, generating a positive feedback loop that intensifies the changes in the state of the habitat (see Figure 2).
Another aspect to highlight is that state changes and its related impacts can be a direct or indirect consequence of the pressures and, sometimes, a graphical representation can be more complex due to the multiple interactions and feedback loops that occur among them. Take for example, beach littering and plastic pollution, they can obstruct the settlement and development of mangrove propagules leading to a loss of mangrove habitats. Consequently, those areas are more prone to flooding and more exposed to the wave energy, intensifying the coastal erosion in these areas. Furthermore, the households and infrastructure that were naturally protected, will require adaptation/mitigation strategies to reduce the risk associate to natural hazards, which translates in increased investments and cost of living (see Figure 2).
A final example is the reduction in the fish stock in terms of the available number meaning, fewer catches by fishing operation, or in terms of quality, namely, organisms with high concentration of contaminants in their tissues that cannot or shall not be eaten because they imposed a risk to human health. Hence, local communities that rely on fish as a source of protein will have to, in the best scenario, change their source of protein increasing their cost of living or, in the worst case, continue the consumption of contaminated fish meat despite the possible effects in their health. In any case, the bottom line is that cost of living will increase in the short of long term if the fish stock resources are reduced (see Figure 2).
4.5. Responses (R)
Measures to tackle the sustainability issues of certain area will not be effective if basic needs (i.e., biological needs and safety needs) are not guaranteed. Those basic needs involve, among others, air, food, drink, shelter, sleep, security, order, law, stability, etc. In this sense, the implementation or enforcement of the management plans and instruments to prevent land-based pollution in the municipalities within the study area can be challenging if considering that the proportion of the population with Unsatisfied Basic Needs – UBN (i.e. involves indicators about Inadequate housing, Critically overcrowded housing, Housing with inadequate services, Housing with high economic dependency, Housing with school-age children not attending school.) is as high as 58% in places such as Santa Catalina (Bolivar) or around 30% in ‘Campo de la Cruz’ and ‘Candelaria’(Atlántico) with an average of 20.6% between the municipalities in the Atlántico department and Santa Catalina (DANE, 2018)
In terms of management tools, the environmental corporations and municipal administrations have some instruments and actions focused on the planning and use of land and water resources, however, not in all cases (i.e., Mallorquin, Manatíes, Ciénaga Luisa, Ciénaga Larga and Paraiso wetlands) there are management plans, or the measures do not solve the totality of the problems. The coverage of sewerage, wastewater treatment and garbage collection systems are and will necessarily be incomplete in rural areas due to the technical and economic challenges of serving a geographically dispersed population such as that of the DtC basin. In other words, an adequate and wide coverage in the provision of public services is an important strategy in the DtM-LM basin where most of the population is concentrated, not only in the study area, but also in the entire department of the Atlántico.
The issues are not only in terms of quantity but also in the quality of the instruments. The most important instrument envisioned to manage the resources and activities in the coastal zone is the ‘Integrated Management and Development Plan for the Coastal Environmental Unit of the Magdalena River, Canal del Dique complex - Lagoon System of the Ciénaga Grande de Santa Marta’ (hereinafter POMIUAC - RM), however, it is not yet operative. The formulation of the POMIUAC-RM has been slow and difficult considering the complexity involved in coordinating studies with the other CARs and the absence of detailed baseline information on the marine areas (CRA, 2016) and this process is expected to continue during the period 2020-2023 because it requires the completion of the prior consultation phase with the ethnic communities. Therefore, there is no clear panorama of when the POMIUAC Rio Magdalena will be effectively adopted and implemented (CRA, 2020).
But this measure is not sufficient to solve the problems of DtC basin. In this zone, strategies should be adopted to generate knowledge and recognition by the communities of the ecosystem services and their value. In such a way that the beneficiaries themselves coordinate or promote initiatives and actions to prevent water and soil contamination, for example: through less waste production and better waste management/use; through the implementation of individual wastewater treatment systems; using manure in ways that contribute to the improvement of agricultural soils without having negative effects on the water resources of the area (FAO, 2018); among others. Unfortunately, these types of democratic participation actions are the ones in which the department is most neglected (i.e., malfunctioning of the Inter-Institutional Committees on Environmental Education - CIDEAs, disconnection from academia, lack of support for environmental education, among others) (CRA, 2020).
4.6. Comparison with other sites
One of the main reasons as per why this study was deemed relevant is because the Magdalena’s is a good example of a tropical River Mouth System which happens to be among the most important rivers in South America and is the most important discharging its waters in the Colombian Caribbean (Restrepo et al., 2020). Added to this is the fact of having a vast and detailed dataset that makes it a key study-case whose results can be compared to similar studies at the local level such as those conducted by INVEMAR (2018) and Tosic et al. (2018); and regional level, like the ones at North-eastern Brazil such as the Paranaíba Delta (Paula Filho et al., 2019) and the Vitoria Bay Estuary (Teubner Junior et al., 2018).
At the local scale, the results obtained here differ significantly from other studies conducted in the Magdalena Delta. The first one is the study from Tosic et al. (2018) in Cartagena Bay where nutrient and organic matter loads (i.e., using BOD as a proxy) are between 2-20 times higher (i.e., in the Magdalena River-Mouth DIN is 2 times higher; Total N is 17 times higher; Total P, BOD and Total Coliforms are between 8-12 times higher). These differences are not only because the study area here was wider and more populated, but to the inclusion of the agriculture and livestock manure as anthropogenic sources of contaminants which, as it has been found in similar studies, can be the main anthropogenic sources of nutrients (Paula Filho et al., 2015; Teubner Junior et al., 2018; Paula Filho et al., 2019)
Another aspect that could explain the difference between the nutrient loads in the Bay of Cartagena and those in the study area is that, along its path from Calamar to the mouth, the Canal del Dique and its draining area (which includes the upstream discharges of wastewater and non-point sources and is the main source of N and P in the bay) pass through a complex of wetlands and lagoons in which these nutrients could be retained. In other words, while the contaminants in this study are discharge almost directly into the sea or the Magdalena River, the contaminants in the influx area of the Canal del Dique are more likely to be retained in the lentic water bodies.
At a broader scale, using the Yi/Y* nutrient ratio (i.e., Yi = local yields and Y*=global yields) for the sake of comparison (Meybeck et al., 2006), the Magdalena River-mouth is considered a hotspot with a yield of 10,443 kg Total N km-2 y-1 and 4,239 kg Total P km-2 y-1. These yields are not corrected for volatilization (i.e., N) and/or soil retention (i.e., N and P), but even if losses were assumed to be around 50%, the study area will remain with high nutrient yields (i.e., 5,221 and 2,120 kg km-2 y-1 of Total N and Total P, respectively) and would be still considered a hotspot for nutrient discharges.
Using the yields corrected for losses, the results obtained in this study area are similar to those from the Vitoria Estuary in Brazil (i.e., 5,600 and 2,800 kg km-2 y-1 of Total N and Total P, respectively) (Teubner Junior et al., 2018). Moreover, if we were to use the more conservative approach, namely, disregarding nutrient losses by volatilization and soil retention, the initial results are in the same order of magnitude of areas such as Chesapeake Bay in USA (i.e., 13,100 kg km-2 y-1 of Total N). In any case, these values are typical from densely populated basins with intense economic activities (Teubner Junior et al., 2018)
4.7. About the approach
River Mouth Systems have been identified as ‘hotspots’ in the coastal zone (Newton et al., 2012). A better understanding of the links between Pressures, State Changes and Impacts in this social-ecological system can also be useful to identify new or evaluate existent management options. Using this updated and extended version of DPSIR is useful to compare the Magdalena River-mouth with other regions, since the DPSIR framework is widely used by environmental agencies such as United Nations Environment Programme (UNEP), Food and Agriculture Organization (FAO) and the European Environment Agency (EEA).
Studies on land-based sources of pollution are not per se a novelty. In Colombia, in the Caribbean area and particularly in the Magdalena River Delta, some authors have carried out work to identify sources of pollution in La Guajira (Doria Argumedo and Vivas Aguas, 2016); the Ciénaga Grande de Santa Marta (Vivas Aguas et al., 2013) and the bay of Cartagena (Tosic et al., 2018). In fact, since 2009, the INVEMAR has conducted a detailed inventory of land-based pollution sources for the coastal departments of Colombia: Bolívar and Valle del Cauca (2009), Cauca and Antioquia (2010), La Guajira (2011), Cordoba (2012), Magdalena (2013), Atlántico (2014), San Andrés y Providencia (2015), Sucre (2016), Nariño (2017) and Choco (2017) (INVEMAR, 2018, p. 17). However, some of these inventories, including the one for the Atlántico could be out of date. Additionally, given the wide distribution of agricultural and livestock activities within the study area, it was considered necessary to complement the existing approaches to include the contributions of Nitrogen (N) and Phosphorus (P) that could be derived from these activities. Thus, pollutant loads (i.e., nutrients) from these sources were estimated through export factors (Ruddy et al., 2006; UNEP/CEP, 2019) This approach allows estimating a theoretical limit of nutrients and other contaminants, originating from anthropogenic sources, that could be transferred to the Caribbean Sea, other coastal water bodies (i.e., Ciénaga de Mallorquin), groundwater and/or the Magdalena River.
It is true that to obtain more realistic results, nutrient concentrations and flows in the different rivers and streams could be measured, under the assumption that part of the nutrients will be washed and transported by runoff and discharged into the Magdalena River or the Caribbean. However, most of the watercourses in the study area are torrential with little or no flow during the dry and transitional seasons and/or where there are no stations to measure physic-chemical parameters and/or flow. Thus, in the absence of information for more precise estimates, the use of export factors is a useful, cost-effective, and time-efficient alternative for defining, at least preliminarily, management strategies in the study area (Paula Filho et al., 2015).
Some of the limitations of the present study, which could be considered to improve the reliability of the results are the following. The information on fertiliser use was taken from a global database from year 2001 because the authors did not find information for the municipalities or the department. Pollutants contributed by pesticides were also not considered for the present analysis due to similar limitations. For industrial sources, the RUA FM only reports values for BOD, COD and TSS, which is why it is not possible to estimate N and P loads, although this does not mean that there are none. It is also important to mention that the RUA database may be incomplete given that a baseline of users and loads in the different basins of the Atlantic, surveyed by the CRA in 2019, shows that there are several actors (industry and municipal discharges) for which there is no information available regarding flow, BOD and SST concentration, therefore, industrial, and municipal wastewater discharges could be higher. Additionally, as mentioned earlier, this study is focused on anthropogenic sources of contamination and did not include other natural sources such as hydraulic soil erosion, which can be an important source of suspended solids and nutrients in the water (IDEAM, 2019a) neither atmospheric deposition of nitrogen, which can be a significant source in proximity to big urban and industrialized areas (Paula Filho et al., 2015), nor volatilization of nitrogen which reduces the amount that could enter the streams and reach the ocean. Estimations for the natural inputs and outputs, should be considered for a more accurate nutrient budget, however, it has been found that anthropogenic sources usually exceed natural contributions (Lacerda et al., 2008; Paula Filho et al., 2015) with up to 80% of nutrient delivery coming from land transformations, agriculture, human sewage, and aquaculture (Beusen et al., 2022)
Finally, state changes were evaluated only by the MWQI which is calculated from water samples with a limited geographical and time scope (i.e., the results correspond to specific places and specific time and date). The temporal variability (e.g., interannual and intrannual) of the water quality is not accounted for in this research. This is something that could be improved if monthly data was available (Tosic et al., 2019). Also, current developments in fields like remote sensing can provide, in the near future, tools to monitor water quality with a broader geographic and time scope in a cost-efficient way (Toming et al., 2017; El Mahrad et al., 2020).
5. Conclusions
Analysing environmental problems and, in this case land-based contamination in a river delta, through the lens of the extended DPSIR allows the pieces of the puzzle to be disaggregated to understand more fully the different interrelationships that may exist between impacts, their causes, and the effectiveness of current or proposed management measures.
The pollutants generated in the study area may be insignificant compared to the inputs from the Magdalena River, but they can have a significant impact on the state of local ecosystems.
Of all the sources analysed, agriculture and livestock are theoretically the largest contributors of nitrogen (i.e., 14.84 t d-1 and 48.99 t d-1) and phosphorus (i.e., 5.90 t d-1 and 19.46 t d-1) in the DtC+ and DtM-LM basins, respectively. In the case of BOD, domestic and industrial wastewaters contribute about 5.10 t d-1 and 98.43 t d-1 in the same basins. Contributions of faecal coliforms were more than 4 orders of magnitude higher in untreated wastewater, being 4.86 x10¹⁶ NMP d-1 and 1.78 x10¹⁶ NMP d-1 in the lower Magdalena and Caribbean catchments, respectively.
Inadequately managed waste and plastic represent a serious problem for the Caribbean Basin. There, not only litter from land-based sources, but also from the Magdalena River and the Caribbean Sea, reaches the shores from the Colombian Caribbean, deteriorating their visual quality, affecting mangrove ecosystems, and generating impacts on the welfare of coastal populations.
In terms of river basin, the DtM-LM, where most of the department’s population is concentrated, is where the greatest pollutant loads are generated. However, in terms of impact on human well-being, it is the DtC+ that bears the brunt (i.e., more ecosystems are affected, and more people depend directly on their services).
The impacts found for the study area include increased maintenance and cleaning cost of the beach, reduction of tourism flow/revenue and adverse health effects to vulnerable groups, reduce fish stock, reduce protection against flooding and coastal erosion, difficulty to access drinking water, loss of cultural and spiritual values, and increased cost of living.
Regarding management measures, environmental authorities and local administrations have been implementing measures to reduce pollution from land-based sources but these measures are not sufficient, and a more active involvement of local communities is needed.
Data availability statement
The original contributions presented in the study are included in the article/supplementary material. Further inquiries can be directed to the corresponding author.
Author contributions
DG-V: Conceptualization, Formal analysis, Investigation, Data curation, Writing - original draft. JR: Conceptualization, Resources, Writing - Review & Editing, Supervision. AN: Conceptualization, Resources, Writing - Review & Editing, Supervision. All authors contributed to the article and approved the submitted version.
Funding
This research was supported by the ERASMUS+ programme from the European Commission through a scholarship granted to the lead author as a student of the Erasmus Mundus Joint Master Degree in Water and Coastal Management 2020/2022 (WACOMA; Project No. 586596-EPP-1-2017-1-IT-EPPKA1-JMD-MOB).
Acknowledgments
We thank Professor Mike Elliott whose comments contributed to a considerable improvement on the earlier stages of the writing for this article. The lead author also thanks the Centre for Marine and Environmental Research (CIMA) from the Universidade do Algarve (UALG) who hosted him during the last year of the master. Finally, the authors thank the reviewers for their relevant comments that contributed to have an improved version of the article.
Conflict of interest
The authors declare that the research was conducted in the absence of any commercial or financial relationships that could be construed as a potential conflict of interest.
Publisher’s note
All claims expressed in this article are solely those of the authors and do not necessarily represent those of their affiliated organizations, or those of the publisher, the editors and the reviewers. Any product that may be evaluated in this article, or claim that may be made by its manufacturer, is not guaranteed or endorsed by the publisher.
References
Acosta-Coley I., Duran-Izquierdo M., Rodriguez-Cavallo E., Mercado-Camargo J., Mendez-Cuadro D., Olivero-Verbel J. (2019). Quantification of microplastics along the Caribbean coastline of Colombia: Pollution profile and biological effects on caenorhabditis elegans. Mar. Pollut. Bull. 146, 574–583. doi: 10.1016/j.marpolbul.2019.06.084
Aguilera Díaz M. M. (2006) El Canal del dique y su subregión: Una economía basada en la riqueza hídrica (Cartagena de Indias: Banco de la República). Available at: https://www.banrep.gov.co/sites/default/files/publicaciones/archivos/DTSER-72_%28VE%29.pdf (Accessed 9 July 2021).
Ahumada Lagares G. A., Penso Martínez L. D. (2014)Caracterización socioeconómica de la subregión del canal del dique. In: Economía y sociedad. Available at: https://fondodeaguacartagena.org/wp-content/uploads/2017/10/pub-002-ahumada-y-penso-2014.pdf (Accessed 9 February 2021).
Aldana-Domínguez J., Montes C., Martínez M., Medina N., Hahn J., Duque M. (2017)Biodiversity and ecosystem services knowledge in the Colombian Caribbean (Accessed 22 September 2021).
Avendaño J., Rodriguez A., D. Gómez (Eds.) (2019). Servicios ecosistémicos marinos y costeros de colombia. “Enfasis en manglares y pastos marinos” (Santa Marta, Colombia).
Ávila B., Gallo M. N. (2021). Morphological behavior of the Magdalena river delta (Colombia) due to intra and interannual variations in river discharge. J. Of South Am. Earth Sci. 108. doi: 10.1016/j.jsames.2021.103215
Beusen A., Doelman J. C., van Beek L., van Puijenbroek P., Mogollón J. M., van Grinsven H., et al. (2022)Exploring river nitrogen and phosphorus loading and export to global coastal waters in the shared socio-economic pathways (Accessed 13 November 2022).
Buonocore E., Grande U., Franzese P. P., Russo G. F. (2021). Trends and evolution in the concept of marine ecosystem services: An overview. Water 13, 2060. doi: 10.3390/w13152060
Castellanos F., Amaya-García F., Tello E., Ramos F. A., Umaña A., Puyana M., et al. (2019). Screening of acetylcholinesterase inhibitors in marine organisms from the Caribbean Sea. Natural Product Res. 33 (24), 3533–3540. doi: 10.1080/14786419.2018.1481837
Castellanos A., Lombana J., Ortiz M. (2017). Exploración y explotación de hidrocarburos aguas afuera (offshore). estrategia logística para Barranquilla, una ciudad en transformación. Equidad. y Desarrollo 1 (28), 85–111. doi: 10.19052/ed.4082
Chacon S., Serrano M., Bolívar-Anillo H., Villate Daza D., Sanchez H., Anfuso G. (2020). Bosques de manglar del caribe norte colombiano: Análisis, evolución y herramientas de gestión. 31–54.
COLOMBIA. Ministerio de Ambiente y Desarrollo Sostenible (2015) Plan integral de gestión del cambio climático territorial del departamento de atlántico.: Atlántico 2040 (Ministerio de Ambiente y Desarrollo Sostenible). Available at: https://www.atlantico.gov.co/images/stories/plan_cambio_climatico/Plan_Integral_Gestion-Atlantico_2040.pdf (Accessed 22 September 2021).
CRA (2014) Plan de gestión ambiental regional. departamento del atlántico: 2012-2022 (Corporación Autónoma Regional del Atlántico). Available at: https://crautonoma.gov.co/atencion-al-publico/transparencia-y-acceso-a-informacion-publica/planeacion/plan-de-gestion-ambiental-regional-pgar (Accessed 1 April 2022).
CRA (2016) Plan de acción cuatrienal: PAC 2016-2019. atlántico frente al cambio climático (Corporación Autónoma Regional del Atlántico). Available at: https://www.crautonoma.gov.co/documentos/Planes/PAI%202020-2023%20CRA.pdf (Accessed 14 September 2021).
CRA (2019) Linea base de usuarios y cargas de las cuencas y tramos definidos por la CRA, para revisión por parte de los usuarios y la corporación. Available at: https://crautonoma.gov.co/documentos/recursohidrico/27-2020-02-03-202003011958856396900.xlsx (Accessed 21 March 2022).
CRA (2020) Plan de acción institucional: PAI 2020-2023. atlántico sostenible y resiliente (Barranquilla, Atlántico: Corporación Autónoma Regional del Atlántico). Available at: https://www.crautonoma.gov.co/documentos/Planes/PAI%202020-2023%20CRA.pdf (Accessed 14 September 2021).
Crossland C. J. (2005). Coastal fluxes in the anthropocene: The land-ocean interactions in the coastal zone project of the international geospere-biosphere programme (Berlin, Heidelberg: Springer). Available at: http://swbplus.bsz-bw.de/bsz118798103cov.htm.
DANE (2018) Censo nacional de población y vivienda 2018 (DANE). Available at: https://www.dane.gov.co/index.php/estadisticas-por-tema/demografia-y-poblacion/censo-nacional-de-poblacion-y-vivenda-2018 (Accessed 7 September 2021).
DANE. (2021). Cuentas nacionales departamentales: PIB por departamento: Valor agregado por municipio - serie, (2011-2019 provisional) (DANE). Available at: https://www.dane.gov.co/index.php/estadisticas-por-tema/cuentas-nacionales/cuentas-nacionales-departamentales (Accessed 17 September 2021).
Departamento de Atlántico (2015) Informe de coyuntura económica regional - ICER: Departamento del atlántico (Barranquilla, Atlántico). Available at: https://www.dane.gov.co/files/icer/2014/ICER_Atlantico2014.pdf (Accessed 17 September 2021).
Doria Argumedo C., Vivas Aguas L. J. (2016). Fuentes terrestres de contaminación en la zona costera de la guajira, Colombia. Rev. Investigación Agraria y Ambiental 7 (1), 123–138. doi: 10.22490/21456453.1539
Elliott M., Burdon D., Atkins J. P., Borja A., Cormier R., de Jonge V. N., et al. (2017). “And DPSIR begat DAPSI(W)R(M)!” - a unifying framework for marine environmental management. Mar. pollut. Bull. 118 (1-2), 27–40. doi: 10.1016/j.marpolbul.2017.03.049
El Mahrad B., Newton A., Icely J., Kacimi I., Abalansa S., Snoussi M. (2020). Contribution of remote sensing technologies to a holistic coastal and marine environmental management framework: A review. Remote Sens. 12 (14), 2313. doi: 10.3390/rs12142313
Enriquez-Acevedo T., Botero C. M., Cantero-Rodelo R., Pertuz A., Suarez A. (2018). Willingness to pay for beach ecosystem services: The case study of three Colombian beaches. Ocean Coast. Manage. 161, 96–104. doi: 10.1016/j.ocecoaman.2018.04.025
FAO (2018) Nitrogen inputs to agricultural soils from livestock manure: New statistics (FAO, Integrated Crop Management). Available at: https://www.fao.org/3/I8153EN/i8153en.pdf (Accessed 3 February 2022).
Fuentes-Gandara F., Pinedo-Hernández J., Marrugo-Negrete J., Díez S. (2018). Human health impacts of exposure to metals through extreme consumption of fish from the Colombian Caribbean Sea. Environ. Geochem. Health 40 (1), 229–242. doi: 10.1007/s10653-016-9896-z
Future Ocean, International Ocean Institute, German Marine Research Consortium, mare (2017). “World ocean review,” in Living with the oceans: Coasts - a vital habitat under pressure (Hamburg, Germany: maribus).
Gobernación del Atlántico (2020) Plan de desarrollo 2020-2023: ¡Atlántico para la gente!. Available at: https://www.atlantico.gov.co/images/stories/plan_desarrollo/PlanDesarrollo_2020-2023-Definitivo-A1.pdf (Accessed 13 December 2021).
Haines-Young R., Potschin M. B. (2018) Common international classification of ecosystem services (CICES) V5.1 and guidance on the application of the revised structure (CICES). Available at: https://cices.eu/content/uploads/sites/8/2018/01/Guidance-V51-01012018.pdf (Accessed 21 September 2021).
Higgins A., Restrepo J. C., Ortiz J. C., Pierini J., Otero L. (2016). Suspended sediment transport in the Magdalena river (Colombia, south america): Hydrologic regime, rating parameters and effective discharge variability. Int. J. Sediment Res. 31 (1), 25–35. doi: 10.1016/j.ijsrc.2015.04.003
ICA (2018) Censo pecuario nacional: Censo 2018 (Instituto Colombiano Agropecuario). Available at: https://www.ica.gov.co/areas/pecuaria/servicios/epidemiologia-veterinaria/censos-2016/censo-2018.aspx (Accessed 9 March 2022).
IDEAM (2015) Atlas climatológico de Colombia - interactivo - año 2015 (Bogotá, D.C.: IDEAM). Available at: http://atlas.ideam.gov.co/visorAtlasClimatologico.html (Accessed 31 August 2021).
IDEAM (2019b) Informe nacional de residuos o desechos peligrosos en colombi (Instituto de Hidrología, Meteorología y Estudios Ambientales). Available at: https://quimicos.minambiente.gov.co/wp-content/uploads/2021/05/7_Informe_Nacional_RESPEL_2018.pdf (Accessed 25 March 2022).
IDEAM (2022) Indicadores y estadísticas ambientales - IDEAM: Temática agua (Instituto de Hidrología, Meteorología y Estudios Ambientales). Available at: http://www.ideam.gov.co/web/ecosistemas/agua (Accessed 30 March 2022).
INVEMAR (2015). Diagnóstico y evaluación de la calidad de las aguas marinas y costeras del caribe y pacífico colombianos.: Informe técnico 2014 (Santa Marta, Colombia: Instituto de Investigaciones Marinas y Costeras Jose Benito Vives de Andréis).
INVEMAR (2018). Diagnóstico y evaluación de la calidad de las aguas marinas y costeras del caribe y pacífico colombianos.: Informe técnico 2017 (Santa Marta, Colombia: Instituto de Investigaciones Marinas y Costeras Jose Benito Vives de Andréis).
INVEMAR (2019). Diagnóstico y evaluación de la calidad de las aguas marinas y costeras del caribe y pacífico colombianos: Informe técnico 2018 (Santa Marta, Colombia: Instituto de Investigaciones Marinas y Costeras Jose Benito Vives de Andréis).
INVEMAR (2021). Metodología de la operación estadística Índice de calidad de aguas marinas y costeras - OE ICAM (Santa Marta, Colombia: Instituto de Investigaciones Marinas y Costeras Jose Benito Vives de Andréis).
INVEMAR - REDCAM (2022) Geovisor Índice de calidad de aguas marinas y costeras - ICAM. Available at: https://experience.arcgis.com/experience/dbbec24c96054e199a25b8709dc7099a/ (Accessed 27 March 2022).
Jutinico-Shubach L. M., Castaño J. D., Juarez T., Mariño M., Gómez-León J., Blandón L. M. (2021). A novel basydiomycete isolated from mangrove swamps in the Colombian Caribbean shows promise in dye bioremediation. Biorem. J. 26 (3), 179–197. doi: 10.1080/10889868.2021.1964426
Lacerda L. D., Molisani M. M., Sena D., Maia L. P. (2008)Estimating the importance of natural and anthropogenic sources on n and p emission to estuaries along the ceará state coast NE Brazil (Accessed 13 November 2022).
López Pineda L. F., Sáen Zapata J. A., Coneo Mendoza Y., Barraza Pava M. E. (2014) Regiones funcionales en la subregión del canal del dique y su zona de influencia costera (Revista DERROTERO). Available at: https://biblat.unam.mx/hevila/Derrotero/2014/no8/5.pdf (Accessed 9 July 2021).
Meisinger J. J., Jokela W. E. (2000). Ammonia volatilization from dairy and poultry manure. proc managing nutrients and pathogens from animal agriculture (Camp Hill, PA: Natural Resource, Agriculture, and Engineering Service), pp.28–pp.30.
Meybeck M., Dürr H. H., Vörösmarty C. J. (2006). Global coastal segmentation and its river catchment contributors: A new look at land-ocean linkage. Global Biogeochem. Cycles 20 (1). doi: 10.1029/2005GB002540
MinCIT (2021) Citur | centro de información turística de Colombia (Ministerio de Comercio, Industria y Turismo). Available at: https://www.citur.gov.co/pages/1#gsc.tab=0 (Accessed 20 September 2021).
Newton A., Carruthers T. J., Icely J. (2012). The coastal syndromes and hotspots on the coast. Estuarine Coast. Shelf Sci. 96, 39–47. doi: 10.1016/j.ecss.2011.07.012
Osorio A. F., Ortega S., Arango-Aramburo S. (2016). Assessment of the marine power potential in Colombia. Renewable Sustain. Energy Rev. 53, 966–977. doi: 10.1016/j.rser.2015.09.057
Oviedo Arango J. D. (2020) La información del DANE en la toma de decisiones de los departamentos. atlántico. Available at: https://www.dane.gov.co/files/investigaciones/planes-desarrollo-territorial/180220-Info-Gobernacion-Atlantico.pdf (Accessed 7 September 2021).
Oxford Business Group (2017) Stakeholders to boost Barranquilla, atlántico as an offshore energy hub in Colombia. Available at: https://oxfordbusinessgroup.com/analysis/out-sea-government-and-sector-stakeholders-join-forces-make-barranquilla-offshore-energy-hub (Accessed 20 September 2021).
Patiño M. E. (2019) ABC Para entender lo que sucede en el Puerto de Barranquilla (EL HERALDO). Available at: https://www.elheraldo.co/barranquilla/el-puerto-de-barranquilla-explicado-para-dummies-658705 (Accessed 20 September 2021).
Paula Filho A. D., de Sa Sampaio F. J., Menezes J. M. C., Da Costa C. T. F., Santiago M. O. (2019). Land uses, nitrogen and phosphorus estimated fluxes in a Brazilian semi-arid watershed. J. Arid Environments 163, 41–49. doi: 10.1016/j.jaridenv.2019.01.001
Paula Filho F. J., Valente Marins R., de Lacerda L. D. (2015). Natural and anthropogenic emissions of n and p to the parnaíba river delta in NE Brazil. Estuarine Coast. Shelf Sci. 166, 34–44. doi: 10.1016/j.ecss.2015.03.020
Pérez-Sánchez D., Montes M., Cardona-Almeida C., Vargas-Marín L. A., Enríquez-Acevedo T., Suarez A. (2021a). Keeping people in the loop: Socioeconomic valuation of dry forest ecosystem services in the Colombian Caribbean region. J. Arid Environments 188, 104446. doi: 10.1016/j.jaridenv.2021.104446
Portz L., Manzolli R. P., Andrade C. F. F., de Villate Daza D. A., Bolivar Bandeira D. A., Alcántara-Carrió J. (2020). Assessment of heavy metals pollution (Hg, cr, cd, Ni) in the sediments of mallorquin lagoon - Barranquilla, Colombia. J. Of Coast. Res. 95 (sp1), 158. doi: 10.2112/SI95-031.1
Prado-Fiedler R. (1990). “On the relationship between precipitation amount and wet deposition of nitrate and ammonium,” in Atmospheric environment. part a. general topics, vol. 24. , pp.3061–3065.
Prato J. A., Reyna J. (2015). Aproximación a la valoración económica de la zona Marina y costera del caribe colombiano (Bogotá, D.C.: CCO).
Puerto de Barranquilla (2021) Cifras del sector y la ciudad (Sociedad Portuaria Puerto de Barranquilla). Available at: https://www.puertodebarranquilla.com/index.php/cifras-del-sector-y-la-ciudad/?lang=en (Accessed 20 September 2021).
Quintero M., Velásquez A., Jutinico L. M., Jiménez-Vergara E., Blandón L. M., Martinez K., et al. (2018). Bioprospecting from marine coastal sediments of Colombian Caribbean: screening and study of antimicrobial activity. J. Appl. Microbiol. 125 (3), 753–765. doi: 10.1111/jam.13926
Rangel-Buitrago N., Mendoza A. V., Gracia C A., Mantilla-Barbosa E., Arana V. A., Trilleras J., et al. (2019). Litter impacts on cleanliness and environmental status of atlantico department beaches Vol. 179 (Colombian Caribbean coast: Ocean & Coastal Management).
Rangel-Buitrago N., Mendoza A. V., Mantilla-Barbosa E., Arroyo-Olarte H., Arana V. A., Trilleras J., et al. (2021). Plastic pollution on the Colombian central Caribbean beaches. Mar. Pollut. Bull. 162, 111837. doi: 10.1016/j.marpolbul.2020.111837
Renewables Consulting Group (2022) Offshore wind roadmap for Colombia: Draft report, world bank group and minenergía. Available at: https://www.minenergia.gov.co/documents/10192/24332217/FV+English+Colombia+Offshore+Wind+Roadmap.pdf/a09ab071-ff1e-4df2-86c8-a48143a004f2 (Accessed 28 February 2022).
República de Colombia and Ministerio de Desarrollo Económico (2000). Reglamento técnico del sector de agua potable y saneamiento básico - RAS (RAS 2000). (Colombia: Bogotá).
República de Colombia, DNP and CONPES (2020). “Documento CONPES 3990,” in Colombia Potencia bioceánica sostenible 2030 (CONPES 3990). (Colombia: Bogotá).
Restrepo J. D., Cárdenas-Rozo A., Paniagua-Arroyave J. F., Jiménez-Segura L. (2020). “Aspectos físicos de la cuenca del río Magdalena, Colombia: Geología, hidrología, sedimentos, conectividad, ecosistemas acuáticos e implicaciones para la biota,” in Peces de la cuenca del río Magdalena, Colombia: diversidad, conservación y uso sostenible. Eds. Jiménez-Segura L., Lasso C. A. (Bogotá, D.C., Colombia: Instituto de Investigación de Recursos Biológicos Alexander von Humboldt), 41–83 doi: 10.2112/JCOASTRES-D-14-00263.1
Restrepo J. D., Escobar R., Tosic M. (2018). Fluvial fluxes from the Magdalena river into cartagena bay, Caribbean Colombia: Trends, future scenarios, and connections with upstream human impacts. Geomorphology 302, 92–105. doi: 10.1016/j.geomorph.2016.11.007
Restrepo J. C., Orejarena-Rondón A., Consuegra C., Pérez J., Llinas H., Otero L., et al. (2020). Siltation on a highly regulated estuarine system: The Magdalena river mouth case (Northwestern south America). Estuarine Coast. Shelf Sci. 245, 1–13. doi: 10.1016/j.ecss.2020.107020
Restrepo J., Schrottke K., Traini C., Ortíz J., Rondón A., Otero L., et al. (2015). Sediment transport regime and geomorphological change in a high discharge tropical delta (Magdalena river, colombia): Insights from a period of intense change and human intervention, (1990-2010). J. Of Coast. Res. 32, 575–589. doi: 10.2112/JCOASTRES-D-14-00263.1
Roca-Lanao B., Mendoza Ureche R., Manjarrés Martínez L. (2018). Estimaciones de la producción de la acuicultura durante los años 2017 y 2018 (Bogotá, Colombia: Autoridad Nacional de Acuicultura y Pesca - AUNAP).
Ruddy B. C., Lorenz D. L., Mueller D. K. (2006) County-level estimates of nutrient inputs to the land surface of the conterminous united states 1982-2001, USGS and national water-quality assessment program, scientific investigations reports 2006-5012. Available at: https://pubs.usgs.gov/sir/2006/5012/pdf/sir2006_5012.pdf (Accessed 3 January 2022).
Rueda-Bayona J. G., Guzmán A., Eras J. J. C., Silva-Casarín R., Bastidas-Arteaga E., Horrillo-Caraballo J. (2019). Renewables energies in Colombia and the opportunity for the offshore wind technology. J. Cleaner Production 220, 529–543. doi: 10.1016/j.jclepro.2019.02.174
SEPEC (2021) Series históricas - SEPEC (Servicio Estadístico Pesquero Colombiano). Available at: http://sepec.aunap.gov.co/Estadisticas/SeriesHistoricas (Accessed 20 September 2021).
Soto-Varela Z. E., Rosado-Porto D., Bolívar-Anillo H. J., Pichón González C., Granados Pantoja B., Estrada Alvarado D., et al. (2021). Preliminary microbiological coastal water quality determination along the department of atlántico (Colombia): Relationships with beach characteristics. J. Mar. Sci. Eng. 9 (2), 122. doi: 10.3390/jmse9020122
SuperTransporte (2018) Boletín estadístico. tráfico portuario en colombia. año 2018, mintransporte. Available at: https://www.supertransporte.gov.co/index.php/superintendencia-delegada-de-puertos/estadisticas-trafico-portuario-en-colombia/ (Accessed 28 February 2022).
Tejeda-Benitez L., Flegal R., Odigie K., Olivero-Verbel J. (2016). Pollution by metals and toxicity assessment using caenorhabditis elegans in sediments from the Magdalena river, Colombia. Environ. pollut. 212, 238–250. doi: 10.1016/j.envpol.2016.01.057
Teubner Junior F. J., Lima A. T. M., Barroso G. F. (2018)Emission rates of nitrogen and phosphorus in a tropical coastal river basin: a strategic management approach (Accessed 13 November 2022).
Toming K., Kutser T., Uiboupin R., Arikas A., Vahter K., Paavel B. (2017). Mapping water quality parameters with sentinel-3 ocean and land colour instrument imagery in the Baltic Sea. Remote Sens. 9 (10), 1070. doi: 10.3390/rs9101070
Torregroza-Espinosa A. C., Restrepo J. C., Escobar J., Brenner M., Newton A. (2020). Nutrient inputs and net ecosystem productivity in the mouth of the Magdalena river, Colombia. Estuarine Coast. Shelf Sci. 243. doi: 10.1016/j.ecss.2020.106899
Torres-Bejarano F. M., Torregroza-Espinosa A. C., Martinez-Mera E., Castañeda-Valbuena D., Tejera-Gonzalez M. P. (2020). Hydrodynamics and water quality assessment of a coastal lagoon using environmental fluid dynamics code explorer modeling system. Global J. Environ. Sci. Manage. 6 (3), 289–308. doi: 10.22034/gjesm.2020.03.02
Tosic M., Restrepo J. D., Izquierdo A., Lonin S., Martins F., Escobar R. (2018). An integrated approach for the assessment of land-based pollution loads in the coastal zone. Estuarine Coast. Shelf Sci. 211, 217–226. doi: 10.1016/j.ecss.2017.08.035
Tosic M., Restrepo J. D., Lonin S., Izquierdo A., Martins F. (2019). Water and sediment quality in cartagena bay, Colombia: Seasonal variability and potential impacts of pollution. Estuarine Coast. Shelf Sci. 216, 187–203. doi: 10.1016/j.ecss.2017.08.013
UNEP/CEP (2019) State of the cartagena convention area: An assessment of marine pollution from land-based sources and activities in the wider Caribbean region, united nations environment programme and Caribbean environment programme. Available at: https://wedocs.unep.org/handle/20.500.11822/36346.
United Nations (2021) The second world ocean assessment: World ocean assessment II. volume I, united nations. Available at: https://www.un.org/regularprocess/sites/www.un.org.regularprocess/files/2011859-e-woa-ii-vol-i.pdf (Accessed 5 May 2021).
Valderrama-Barco M., Escobar-Cardona J. L., Pardo B. R., Toro S. M., Gutiérrez C. J. C., López-Casas S. (2020). “Servicios ecosistémicos generados por los peces de la cuenca del río Magdalena, Colombia,” in Peces de la cuenca del río Magdalena, Colombia: diversidad, conservación y uso sostenible. Eds. Jiménez-Segura L., Lasso C. A. (Bogotá, D.C., Colombia: Instituto de Investigación de Recursos Biológicos Alexander von Humboldt), 205–236.
van Krimpen M. M., Sebek L., Bikker P., van Vuuren A. M. (2013) Default phosphorus excretion factors of farm animals: Task 6. Available at: https://ec.europa.eu/eurostat/documents/2393397/8259002/LiveDate_2014_Task6.pdf/207ebcf9-5971-4b7d-bfbc-d48458e49009 (Accessed 3 February 2022).
Villate Daza D. A., Sánchez Moreno H., Portz L., Portantiolo Manzolli R., Bolívar-Anillo H. J., Anfuso G. (2020). Mangrove forests evolution and threats in the Caribbean Sea of Colombia. Water 12 (4), 1113. doi: 10.3390/w12041113
Vivas Aguas L. J., Espinosa L. F., Parra Henriquez L. G. (2013). Identificación de fuentes terrestres de contaminación y cálculo de las cargas de contaminantes en el área de influencia de la ciénaga grande de Santa Marta, caribe colombiano. Boletín Investigaciones Marinas y Costeras 42 (1), 7–30.
WECP (2020) Barranquilla, Colombia - world energy cities partnership (World Energy Cities Partnership). Available at: https://energycities.org/member-cities/barranquilla-colombia (Accessed 20 September 2021).
Keywords: socio-ecological assessment, contamination, DPSIR, coastal zone, river delta, Magdalena River, Colombia, Caribbean
Citation: Gallo-Vélez D, Restrepo JC and Newton A (2022) A socio-ecological assessment of land-based contamination and pollution: The Magdalena delta, Colombia. Front. Mar. Sci. 9:1057426. doi: 10.3389/fmars.2022.1057426
Received: 29 September 2022; Accepted: 25 November 2022;
Published: 08 December 2022.
Edited by:
Indra Sen, Indian Institute of Technology Kanpur, IndiaReviewed by:
Luiz Drude Lacerda, Federal University of Ceara, BrazilSirak Robele Gari, Addis Ababa University, Ethiopia
Hermano Melo Queiroz, University of São Paulo, Brazil
Copyright © 2022 Gallo-Vélez, Restrepo and Newton. This is an open-access article distributed under the terms of the Creative Commons Attribution License (CC BY). The use, distribution or reproduction in other forums is permitted, provided the original author(s) and the copyright owner(s) are credited and that the original publication in this journal is cited, in accordance with accepted academic practice. No use, distribution or reproduction is permitted which does not comply with these terms.
*Correspondence: David Gallo-Vélez, ZGdhbGxvQHVuaW1hZ2RhbGVuYS5lZHUuY28=