 Xiaokang Zhu
 Guohai Dong1
 Chunwei Bi
 Yunpeng Zhao
- 1State Key Laboratory of Coastal and Offshore Engineering, Dalian University of Technology, Dalian, China
- 2Fisheries College, Ocean University of China, Qingdao, China
A hybrid wind turbine foundation combined with a double-layer offshore net cage for marine aquaculture is proposed in this paper. To study the diffraction and hydrodynamic loads on the structure for waves with small steepness, a numerical model was established using linear potential theory and solved using the eigenfunction expansion method. A porosity parameter was introduced to describe the hydrodynamic characteristics of the net panels. The model was validated based on existing numerical results and experimental data. An empirical formula was derived to calculate the porosity parameter based on the opening ratios of the nets. The wavefield and wave force were calculated and analyzed by setting different porosity parameters, spacings between the exterior net and interior net, radius ratios of the exterior net to the wind turbine tower and thicknesses of the friction wheel. Noticeable differences in the wave elevation were observed between the upstream and downstream sides of the nets. At downstream sites, the wavefield exhibits different profiles, particularly for structures with low porosities. Sloshing modes were observed that impacted the force and wave elevation at certain frequencies. For the common fishing nets with large porosities, the spacing between the nets does not have a significant impact on the wavefield and wave force acting on the structure. Moreover, the radius and thickness of the friction wheel have a non-negligible influence on the force acting on the structure, which also narrows the intervals between adjacent sloshing frequencies. In summary, this study provides a perspective for the engineering design and hydrodynamic analysis of a hybrid wind turbine foundation with a double-layer aquaculture cage.
1 Introduction
In recent years, the offshore fish farming industry has developed rapidly based on its cost-effective productivity and environmentally friendly characteristics. Additionally, offshore wind farms are thriving as a result of increasing demand for clean wind energy. The concept of integrating offshore aquaculture with wind turbine systems is a relatively novel trend that aims to take full advantage of sea space and provide additional profits to balance the cost of constructing and maintaining wind farms. However, when deployed in offshore areas, hybrid structures may encounter intense wave conditions. Furthermore, based on the shielding effects of net panels and diffraction of waves by the wind turbine foundation, hydrodynamic characteristics tend to be relatively complex. A structure may bear increased wave loads, which introduces more uncertainty regarding the durability of the structure. Therefore, investigating the fluid-structure interactions is critical for ensuring the reliability and longevity of integrated systems, which is an important domain that has been studied by many researchers.
Extensive numerical simulations and laboratory experiments have been conducted to study the hydrodynamic characteristics of offshore net cages. Aarsnes et al. (1990) studied the distribution of water flow velocity in several groups of square cages and the attenuation of the water flow velocity in the cages was summarized. Lader et al. (2003) conducted a series of model tests, studied the stress and deformation of a cage under uniform flow, and measured a velocity attenuation of approximately 20% inside the cage. Tsukrov et al. (2003) developed a finite-element model to study the hydrodynamic responses of net panels to environmental loads They found that for each net panel, 21 special net elements were adequate to analyze the overall hydrodynamics of the net cage. Huang et al. (2006) developed a numerical model to simulate the dynamic properties of an offshore net cage system. In their model, the cage net was divided into several plane surface elements to calculate external forces. Zhao et al. (2007) adopted a lumped-mass model and calculated the hydrodynamic force on a net using the Morison equation. Bao et al. (2009) used linear potential theory by applying Darcy’s law to a porous boundary and calculated the hydrodynamic force on a net cage using the eigenfunction expansion method. Patursson et al. (2010) investigated the flow characteristics through and around a net panel through computational fluid dynamics (CFD) and laboratory measurements. A finite-volume method was used to solve the Reynolds-averaged Navier-Stokes equations and the k-ϵ turbulence model was adopted to describe the flow field. Bi et al. (2014) developed a numerical approach using the lumped-mass model to simulate the configuration of flexible nets and a porous media model to calculate the flow field. They discovered that the shielding effect of the fishing net increases as the number of nets increases. Recently, Ma et al. (2022) proposed a novel semi-analytical solution to describe the hydrodynamics of a flexible cylindrical net cage based on linear potential flow theory and the membrane vibration equation of cylindrical shells. It was found that at certain wave frequencies, the horizontal wave force acting on the cage would vanish. Apart from traditional gravity cages, several novel methods could be applied to the study of large semisubmersible aquaculture facilities. Liu et al. (2020) combined the Morison equation and the potential flow theory to analyze the hydrodynamic characteristic of a semisubmersible aquaculture facility. A good agreement was obtained between the presented method and the experimental data. Saghi (2019); Saghi et al. 2022) developed a numerical wave tank using coupled VOF-FDM method and further put forward a machine learning method for the prediction of hydrodynamic performance of floating objects. Their method was feasible and might be applied to the analysis of large aquaculture facilities, including the simulation of interaction with solitary waves.
In addition to typical environmental conditions, net panels are also subject to biofouling. Biofouling refers to the accumulation of marine organisms that may induce a significant increase in the hydrodynamic loads acting on net panels and limit the water exchange and oxygen supply inside aquaculture cages (Braithwaite et al., 2007; Klebert et al., 2013). Swift et al. (2006) tested the drag forces on biofouled plane nets through field experiments and compared them to the results of clean nets measured during experiments in a towing tank. A 240% increase in the drag coefficient was observed for the maximally biofouled plane net. Lader et al. (2015) studied the drag increase on nets caused by the biofouling of colonial hydroids. They created models of twines with artificial hydroid fouling and tested drag forces in a towing tank. Bi et al. (2015); Bi et al. (2017) studied the hydrodynamic characteristics of a single offshore net cage and a square array of offshore net cages with biofouling using a three-dimensional CFD model. They found that the damping effects of the cage array increased with increasing biofouling.
The novel concept of combining aquatic offshore net cages with offshore wind turbines has been studied by a few researchers in recent years. Buck (2004); Buck and Krause (2012) conducted a feasibility study on the multifunctional use of offshore wind farms and mariculture in the North Sea area and initiated a design project focusing on investigating the possibility of adding a net cage within the foundation of a tripod wind turbine. Jiang (2017) proposed the concept of combining a net cage with an offshore wind turbine with a jacket foundation and performed mechanical analysis using the finite-element method software ANSYS. Zheng and Lei (2018) proposed a floating offshore wind turbine integrated with a steel fish farming cage. Through comparative study, it was shown that the anti-overturning ability, surge, heave and pitch motions of the proposed structure outperformed those of OC3Hywind and OC4DeepCwind. Chu and Wang (2020); Chu et al. (2022) proposed a novel offshore fish farm that combined a floating spar with a fish cage. A partially porous wave fence was installed on the structure to attenuate wave energy. Hydrodynamic analysis revealed that the proposed structure has advantages in terms of stable motion responses while heaving and pitching against wave and current forces.
Offshore wind turbines can be categorized into several types according to their foundations, namely traditional fixed foundations such as monopiles, jackets, and tripods, and floating types such as tension leg platforms, as well as spar types and semi-submersible types (Jahani et al., 2022). The monopile type is the most prevalent foundation based on its cost-effective capacity. However, in deep sea areas, traditional monopile foundations fail to provide adequate support to withstand complex soil conditions. Therefore, as shown in Figure 1A, a novel solution was developed by installing a circular friction wheel made of steel or gravel at the mudline. According to Wang et al. (2018); Wang and Li (2020), this foundation has advantages in terms of imparting greater shear stress to resist lateral deformation and inducing additional vertical stresses in the soil beneath and in front of the foundation. Thus far, several laboratory tests and numerical simulations have been conducted to evaluate the performance of this hybrid monopile foundation (Lehane et al., 2014; Arshi and Stone, 2015; Yang et al., 2019; Wang et al., 2022). The results have been promising. However, considering different types of soil, the size of the friction wheel may be sufficiently wide to occupy vast sea areas, resulting in the waste of sea space. Therefore, in this paper, we propose a novel compound structure that integrates an offshore net cage with a hybrid monopile wind turbine foundation. As shown in Figures 1B, C, the offshore net cage mainly consists of an interior and exterior net, and supporting beams. Unlike traditional aquaculture cages, this combined system is bottom seated and can provide more stability. Additionally, an extra exterior net made of reinforced steel is incorporated to protect cultivated fish from natural predators. Finally, the system is self-sufficient because the wind turbine can generate electricity to power the instruments equipped on the net cage. Considering these advantages, this study addresses the wave diffraction and hydrodynamic characteristics of the proposed system to provide a better understanding of its interaction with waves with small steepness. In the following sections, we use the linear potential theory and eigenfunction expansion method to analyze the force and wavefield with respect to the aforementioned hybrid system.

Figure 1 Hybrid monopile foundation for offshore wind turbine. (A) Hybrid monopile foundation with a friction wheel (Wang et al., 2018). (B) Hybrid monopile foundation with a double-layer aquaculture cage. (C) Details of the hybrid foundation with a double-layer aquaculture cage.
The remainder of this paper is organized as follows. Section 2 describes the theoretical basis and analytical solutions of the numerical model. Section 3 presents the verification of the model with comparison to other published numerical models. Section 4 presents the determination of the non-dimensional porosity parameter and verification of the model with experimental data. Section 5 presents and discusses results based on a parametric study. Finally, our conclusions are summarized in Section 6. The appendix provides further detailed explanations of the proposed numerical method.
2 Numerical model
2.1 Theoretical formulation
A numerical model of the hybrid wind turbine foundation and aquaculture cage system is presented in Figure 2. The fluid domain is divided into three regions: Ω1, Ω2, and Ω3. The symbols a0, a1, a2, h, d, and s denote the wind turbine tower radius, interior net radius, friction wheel radius, static water depth, and depth and thickness of the friction wheel, respectively. The exterior net is located at the edge of the friction wheel. With the origin located at the still water level and z axis pointing vertically upward, a cylindrical coordinated system (r, θ, z) is established at the center of the wind turbine tower.
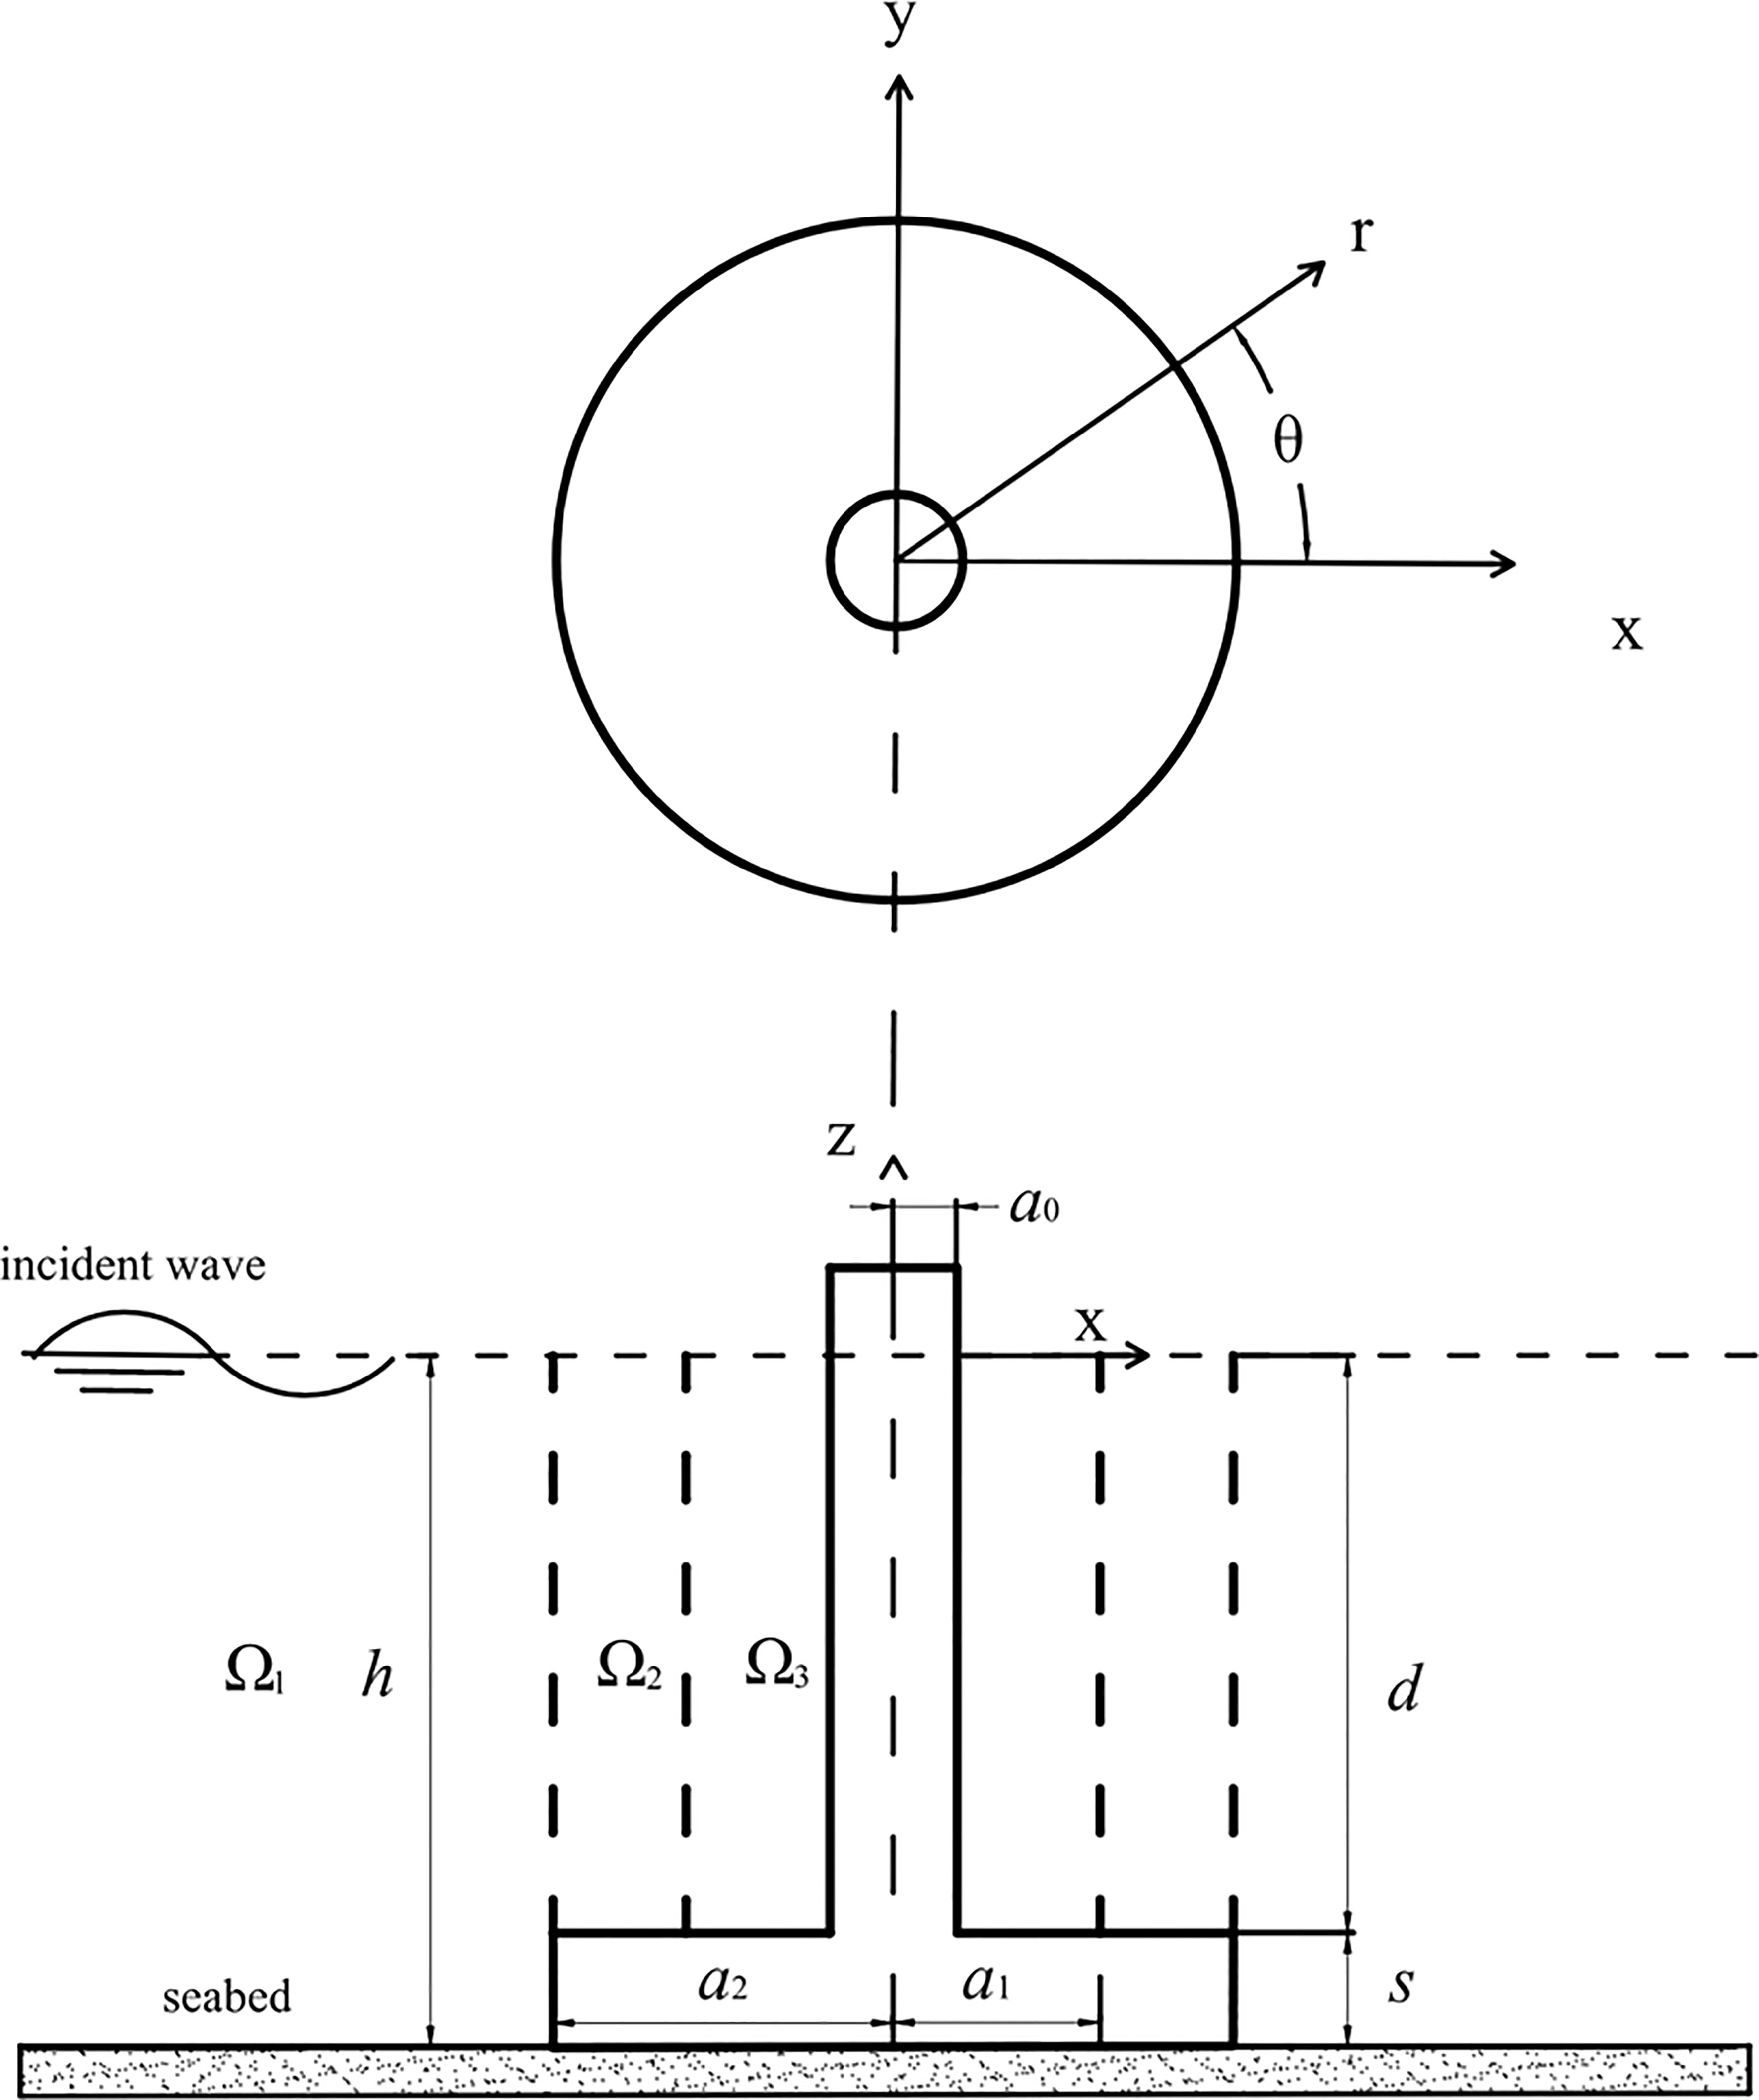
Figure 2 Sketch of the hybrid structure and division of the fluid domain.
We assume that the fluid is irrotational, inviscid, incompressible and the wave steepness is small. Therefore, a numerical model based on the linear potential theory can be applied to solve this problem. The structure is subjected to regular surface waves propagating in the positive x direction with a wave amplitude A and angular frequency ω. The complex potential function can be written as Φ(r,θ,z,t)=Re{ϕ(r,θ,z)e−iωt} , where Re denotes the real part of the complex potential expression, ϕ(r,θ,z) is the spatial potential, i is the imaginary unit, and e−iωt is a time-dependent term. In the following discussion, we separate the spatial and temporal terms, and focus on the solution of the spatial potential ϕ(r,θ,z) .
As shown in Figure 2, the entire fluid domain is divided into three regions. Region I is located outside the exterior net with r>a2 and −h<z<0 , as defined by Ω1 . Region II is located between the interior and exterior nets with a1<r<a2 and −d<z<0 , as defined by Ω2 . Region III is located inside the interior net with a0<r<a1 and −d<z<0 , as defined by Ω3 . The potential in these three regions satisfies the Laplace equation as follows:
Furthermore, the potential also satisfies the free-surface condition, seabed condition, and solid-body condition on top of the friction wheel as follows:
where g is the gravitational acceleration.
In region I, the diffracted wave potential must satisfy the Sommerfeld condition when the distance r approaches infinity as follows:
where ∂/∂r denotes the partial derivative with respect to r, k0 is the wavenumber, and ϕ(0) is the incident wave potential.
In region I and region III, the potential must satisfy the impermeable boundary condition on the friction wheel and wind turbine tower surface as follows:
On the common surface of these three regions, the potential must satisfy the following matching conditions:
where the matching conditions in Equations (8) and (9) follow the fine-pore assumption, the fluid flow passing through the porous medium obeys Darcy’s law (Chwang and Chan, 1998). The normal velocity of the flow follows the continuity condition and is linearly proportional to the pressure difference through the porous medium, so a linear pressure drop is adopted here (Taylor, 1956). Additionally, σ=b/λ , where λ is the wavelength and b is a non-dimensional porosity parameter introduced for convenience, which is defined as follows (Zhao et al., 2010a):
where ρ is the density of water, μ denotes the dynamic viscosity coefficient of the fluid, and l represents the porosity coefficient with dimensions of length. The coefficient b represents the porosity characteristics of porous materials and b = 0 indicates that the surface is impermeable. In contrast, as b increases to infinity, the surface becomes completely permeable, which can be considered as a non-existent medium. The determination of the non-dimensional porosity parameter b and the feasibility of the numerical model are discussed in Section 4.
2.2 Analytical solution
The problem presented above is solved using the eigenfunction expansion method. With different eigenfunctions defined in these regions and specific boundary values matched on common surfaces, the velocity potential of each region can be obtained.
The expansion series of the velocity potential in region I, denoted as ϕ(1) , which satisfies the free surface, seabed, and Sommerfeld conditions, is written as
where ζ0 is the amplitude of the incident wave, Anm (n, m = 0, 1, 2, …) are unknown coefficients, and the eigenvalues km(m = 0, 1, 2, 3, …) can be obtained using the following dispersion relation:
The radial eigenfunctions Rn(kmr) are defined as
where Hn is a Hankel function of the first kind and Kn is a modified Bessel function of the second kind. The vertical eigenfunctions Zm(kmz) are expressed as
which form an orthogonal set in [-h, 0].
The velocity potential in region II, which satisfies the appropriate free surface and boundary conditions, can be expressed as
where the eigenvalues λl(l = 0, 1, 2, 3, …) can be obtained using the following dispersion relation:
where . The radial eigenfunctions are defined as follows:
and
where Jn is a Bessel function of the first kind and In is a modified Bessel function of the first kind. The vertical eigenfunction Zl(λlz), which forms an orthogonal set in [− d, 0], can be written as
The velocity potential in region III, which satisfies the appropriate free surface and structural boundary conditions, can be expressed as
The radial eigenfunctions are expressed as
Then, by using the orthogonality of the vertical eigenfunctions, four sets of algebraic equations that satisfy the continuity condition on the common surface of these three regions can be obtained.
By truncating n, m, and l in Equations (11), (12), and (13) for N, M, and L, respectively, Equations (14) to (17) can be rewritten as matrix equations that can be solved using standard mathematical techniques and the unknown coefficients Anm, Bnl, Cnl, and Dnl can be determined. Therefore, the specific velocity potential in each region can be obtained. This solution procedure is detailed in the Appendix.
After determining the velocity potential, the horizontal force can be obtained by integrating the pressure over the average wet surface, which is expressed as
where , , , and denote the horizontal forces acting on the wind turbine tower, interior net, exterior net, and friction wheel, respectively, and denotes the total force exerted on the entire structure.
Furthermore, the wave elevation on the free surface can be computed using the following linear Bernoulli equation:
In the following section, the dimensionless wave elevation |η|/ζ0 is considered for calculating the wavefield and wave elevation.
3 Verification with existing numerical models
To derive accurate calculation results, 50 non-zero truncating terms were adopted throughout our calculations (i.e., M = N = L = 50). In this section, we present several published results that validate the numerical model developed in this study. Note that the dimensionless porosity parameters are expressed in different forms, namely b, τ, and G, and the conversion relationship is b=2πG=2π/τ .
First, a bottom-mounted submerged cylinder was selected for verification, which corresponds to the case of a single friction wheel. The dimensionless forces acting on the friction wheel were calculated for a0 = 0, b1 = b2 = 1E10, a2/h = 0.5, and d/h = 0.3. Figure 3 presents a comparison between the results obtained using the proposed model and another analytical solution presented by Li and Liu, 2019 for a bottom-mounted submerged cylinder. The horizontal axis represents the dimensionless wavenumber k0h and the vertical axis represents the dimensionless horizontal force on the cylinder. In this figure, a good agreement can be observed between the two results.
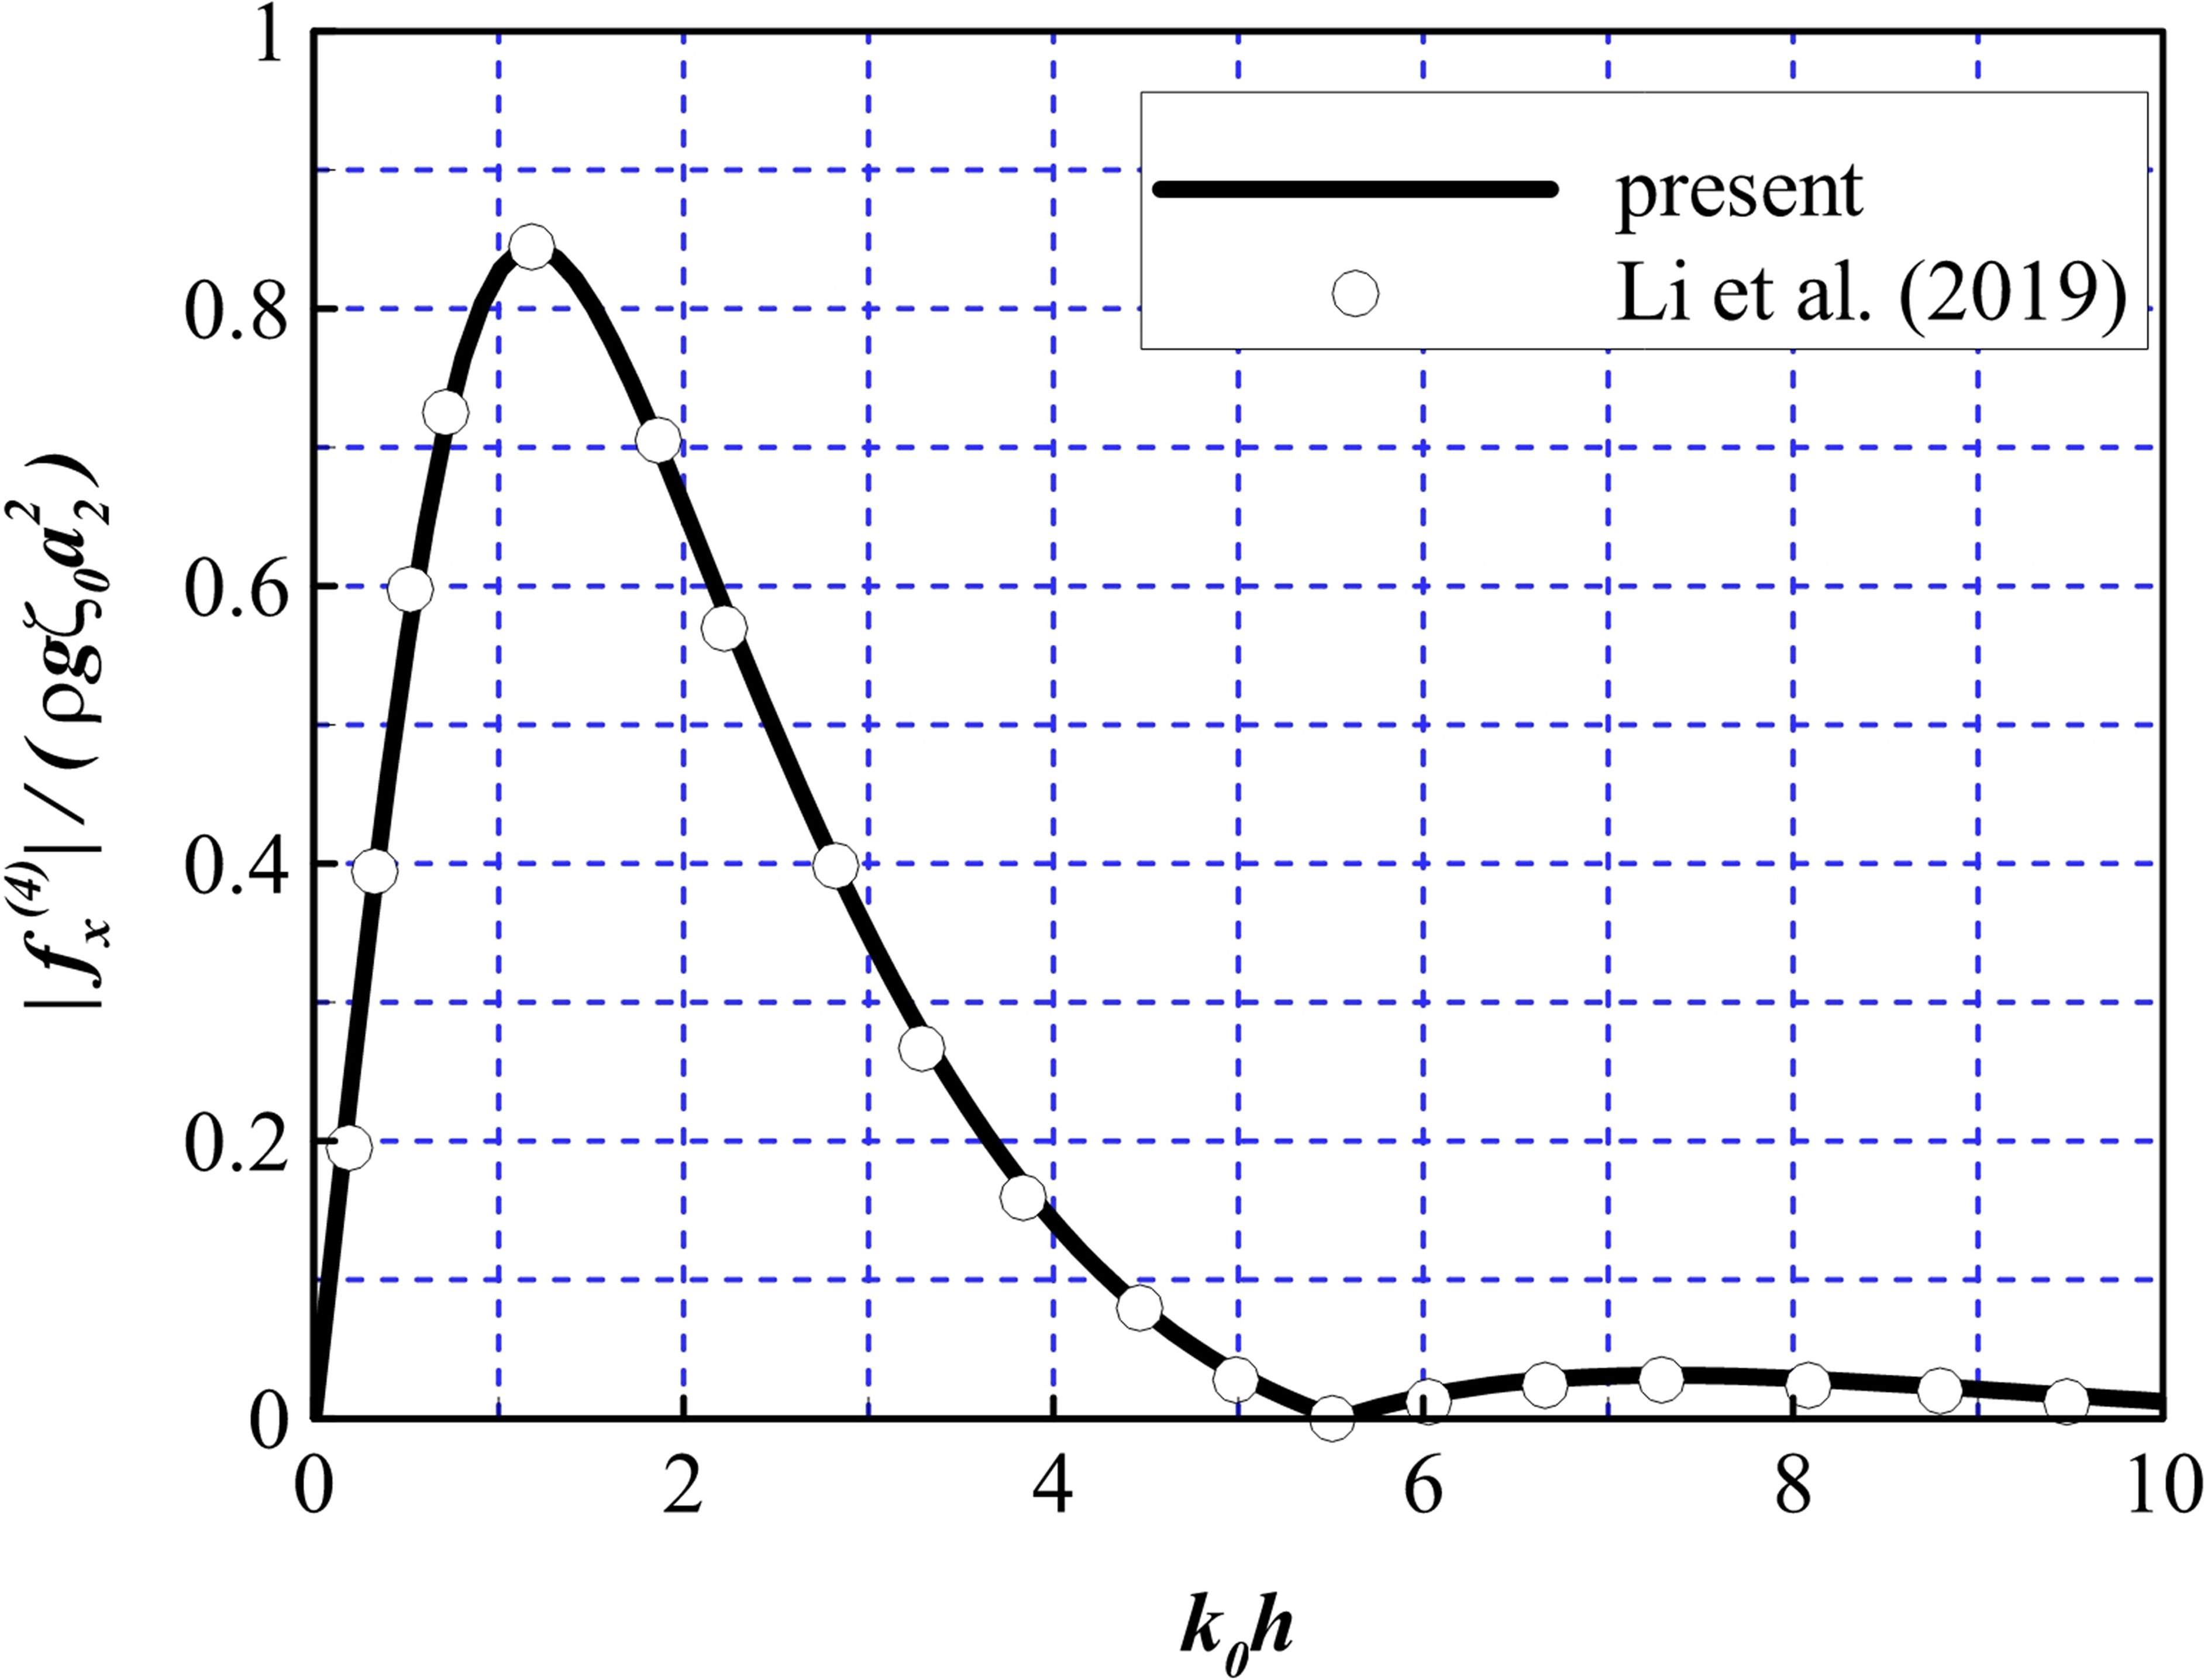
Figure 3 Comparison of the non-dimensional horizontal force to the results derived by Li et al. (2019).
Second, a bottom-mounted cylinder with an upper porous net and inner column was considered to validate the proposed numerical model. The comparison results correspond to the cases where the interior net does not exist and the porosity of the exterior net is set to different values. The parameters d/h = 0.5, a2/h = 1.0, a0/a2 = 0.5, G1 = 1E10, G2 = 0.1 + 0.1i (i.e., case 1), and G2 = 0.4 + 0.4i (i.e., case 2) were selected to validate the calculation of the total horizontal force on the structure. In Figure 4A, the proposed model agrees well with the corresponding results presented by Teng et al. (2001). To validate the wave elevation calculation along the exterior net in different directions, the following parameters were chosen: ka2 = 1.0, d/h = 0.5, a2/h = 1.0, a0/a2 = 0.5, G1 = 1E10, G2 = 0.0 (i.e., case 1), and G2 = 0.4 (i.e., case 2). In Figure 4B, the vertical axis represents the dimensionless wave elevation and the horizontal axis represents the degree along the exterior net, which is consistent with the results presented by Teng et al. (2001). To verify the calculation of the wave elevation on the upstream side of the exterior net, the following parameters were chosen: d/h = 0.5, a2/h = 1.0, a0/a2 = 0.5, G1 = 1E10, and G2 = 0.0, 0.1, and 0.4. Figure 4C reveals a good agreement between the compared numerical models.
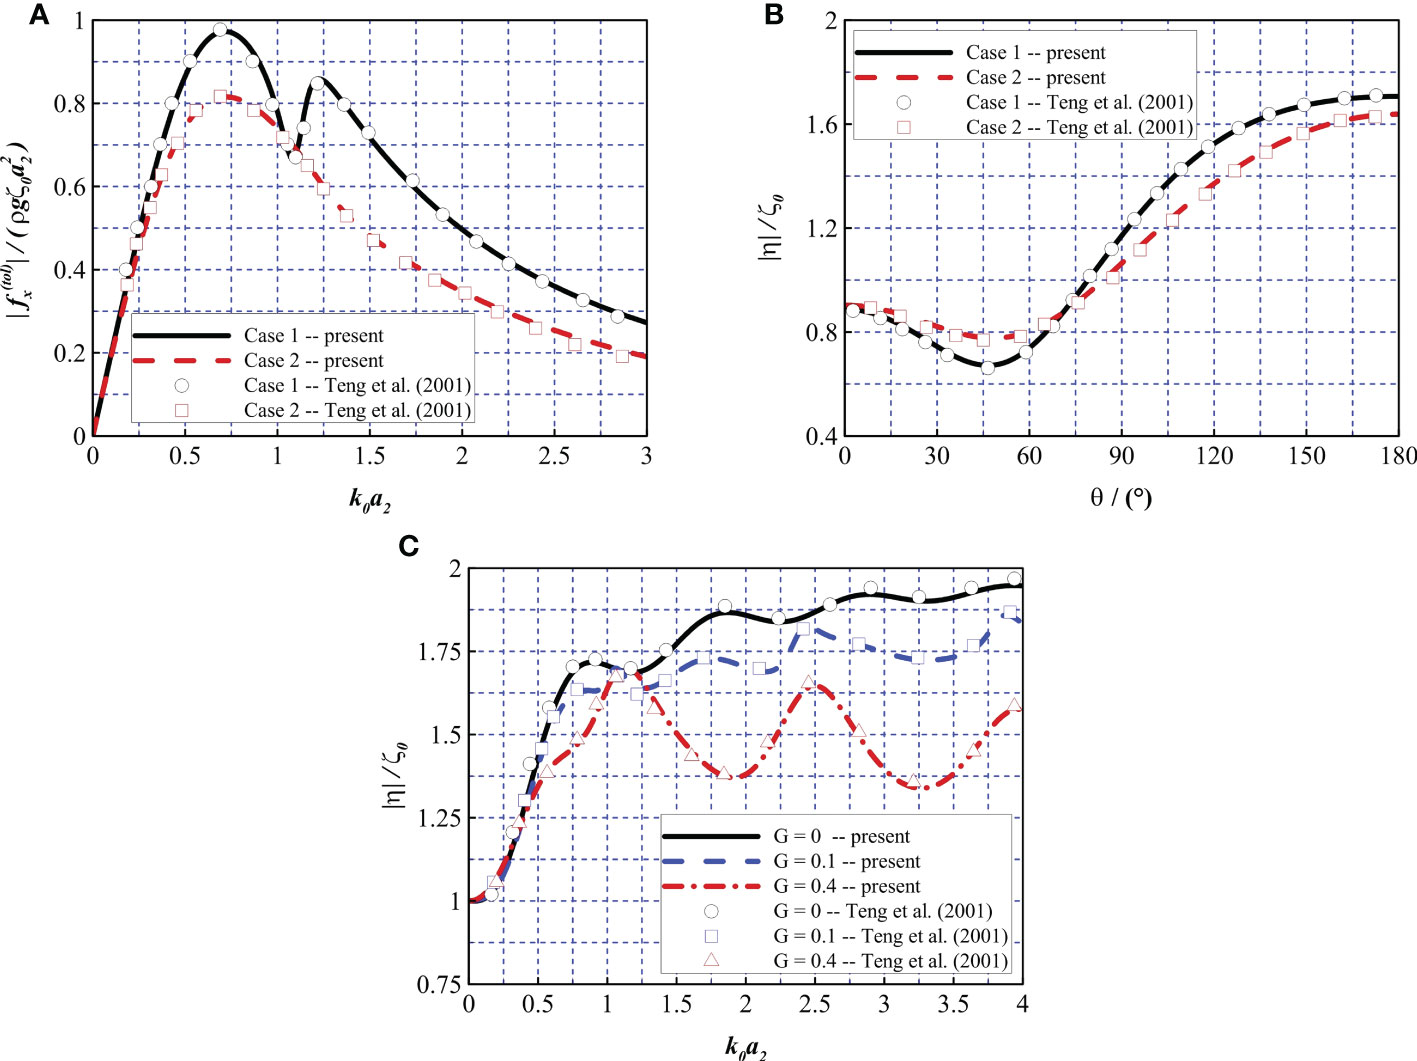
Figure 4 Comparison of the non-dimensional force and wave elevation to the results derived by Teng et al. (2001). (A) and (B, C) |η|/ζ0 .
Finally, the accuracy of cases in which the interior net is considered were validated with another numerical model presented by Liu et al. (2018). A bottom-mounted cylinder with an inner column and double nets was considered as an example. This is a special case of the model in which the friction wheel is ignored. To investigate the effects of different porosities of the interior and exterior nets on the horizontal force acting on the structure, τ0 = 20 was considered with various porosity effect parameter ratios τ1/τ2. In this verification, the parameters were set to a0 = 5, a0/h = 4, a2/a0 = 2.0, and a1/a0 = 1.5. Different parameter ratios (i.e., τ1/τ2 = 0, 1, 3, 7, 1E10) are represented in Figure 5A–C, which represent the horizontal forces on the wind turbine tower, interior net, and exterior net, respectively. One can see that the results of the two solution methods are identical.
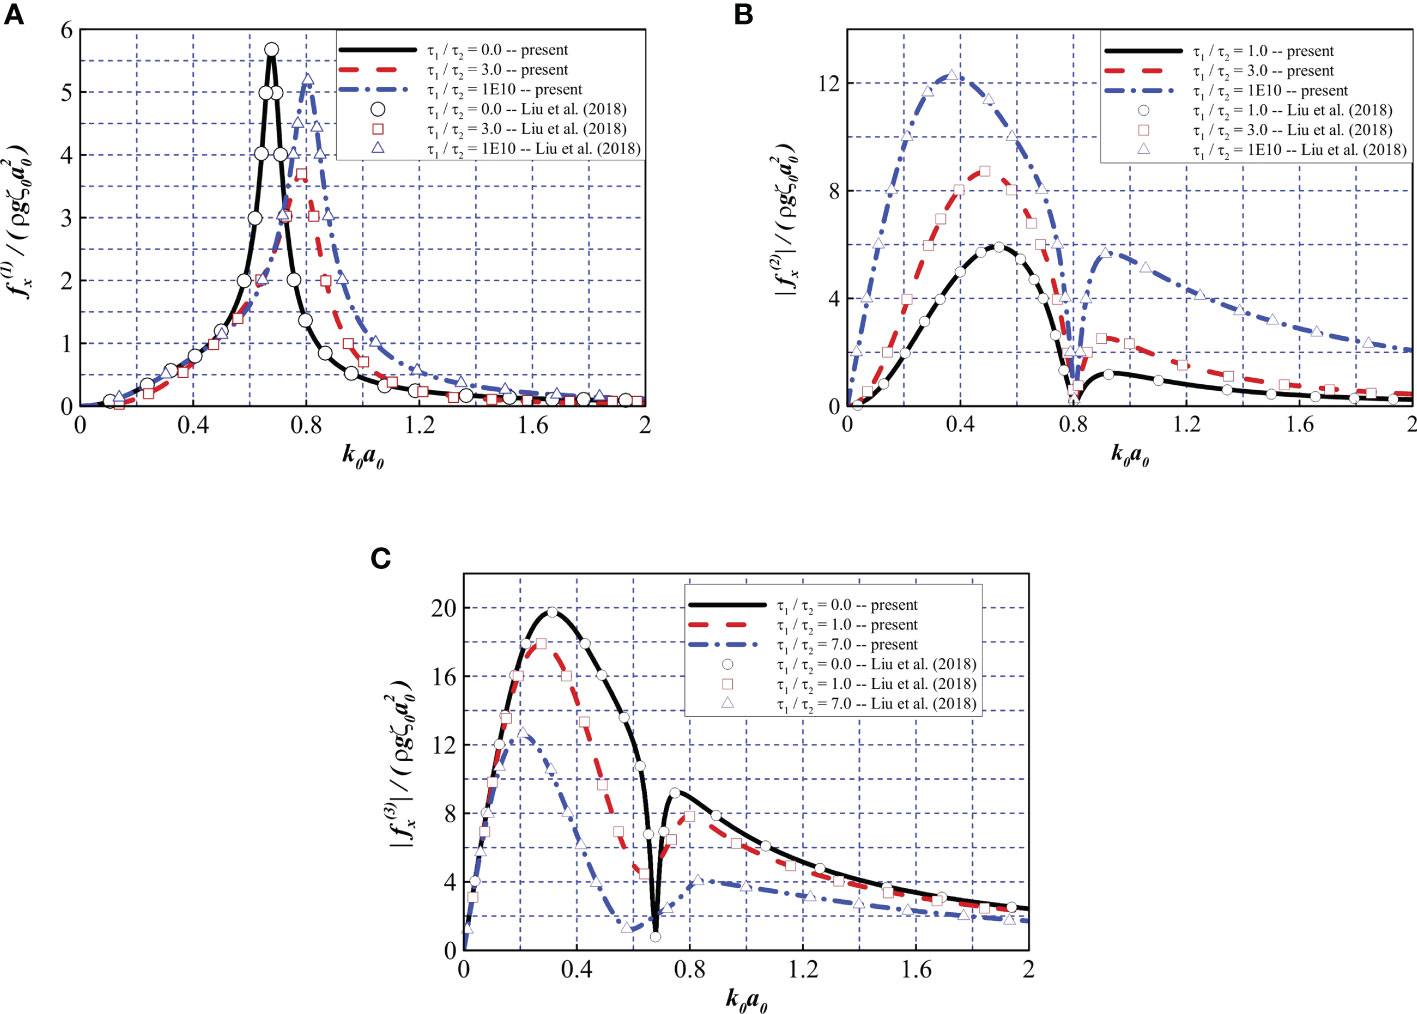
Figure 5 Comparison of the dimensionless force to the results derived by Liu et al. (2018). Force (A) on the wind turbine tower, (B) on the interior net, and (C) on the exterior net.
4 Determination of the non-dimensional porosity parameter b
In Section 2, a linear pressure drop model was adopted for the simplicity of modeling. In actual cases, considering a porous medium, the pressure drop Δp through the porous boundary is mainly composed of two terms, a linear drag term due to the viscosity of the fluid and a drag term proportional to the square of the velocity due to the separation of flow, which is similar to the Darcy-Forchheimer equation (Forchheimer, 1901). According to Sollitt and Cross (1972), the pressure drop on the two sides of a porous medium can be written as:
where ν is the kinematic viscosity coefficient, l is a typical length related to the thickness of the porous medium, τ is the opening ratio, Cd is a proper drag coefficient and U is the locally average velocity of the flow close to the porous medium. Based on the continuity condition, the average velocity of the flow through the holes of the porous medium is expressed as U/τ. For the interaction of waves with a porous cylinder, the average velocity can be expressed as , and is the position vector, is the velocity amplitude of the fluid particles. The latter term in Equation (24) could be linearized using Lorenz’s principle of equivalent work, expressed as:
According to Zhao et al. (2010a), Equation (24) can then be written as:
In which, and . So, it can be speculated that the relationship of b-τ might take the form:
Then, based on the experimental data, a suitable b can be chosen for each τ, thus A and B are determined. It should be noted that the effect of viscosity might have an influence on the wave interaction with cylinders. Although the pressure drop model has considered a viscosity term, the linear potential method might fail in the prediction for fluid with large viscosity as it assumes the fluid to be ideal, which is, inviscid and irrotational. Generally, the Keulegan-Carpenter (KC) number is adopted to describe the relationship between viscous force and inertial force of an object in an oscillating flow field, which is defined as (Liu and Li, 2016):
where um is the amplitude of horizontal fluid velocity of incident wave, is the depth-averaged value of um, δ represents the thickness of porous medium, k is the wavenumber (k = 2π/L), L is the wavelength, and takes the following form:
So, for the wave interaction with a fixed porous cylinder, if the water depth h and the wave period T are unchanged, the value of L remains constant and the KC number is proportional to the value of ϵ, which further implies that the viscosity effect is less dominant for wave cases with small wave steepness.
From Equation (28), the average velocity of fluid is written as:
As explained before, term is a constant given that h and T remain unchanged, so the averaged velocity is proportional to the wave steepness ζ in such cases. Combined with Equation (26) and Equation (27), it can be concluded that not only does the non-dimensional porosity parameter b vary with different opening ratios τ, it also varies with different wave steepness ζ.
As pointed before, there exists a positive correlation between the wave steepness and KC numbers. In reference to the work of Honji (1981); Hall (1984) and Sarpkaya (1986), for oscillating flow around a cylinder with KC numbers less than 0.75, the flow is laminar, stable and attached to the wall of cylinder. Zhao et al. (2010a); Zhao et al (2010b) noted that both the experimental data and numerical analysis indicated little relevance between the force acting on the porous structure and viscous effects within a low KC number range of 0.065 – 0.84 for a maximum wave steepness ϵ = 0.09. Mackay et al. (2021a) also stated that the effect of viscosity was not significant for wave conditions of low KC numbers with small wave steepness. For the interaction between porous structure and oscillating fluid with low KC numbers, the accuracy of the numerical model based on linear potential theory is good according to related work by Li et al. (2006); Suh et al. (2011) and Molin and Legras (1990); Molin (2001); Molin (2011). Therefore, the present numerical model may be considered reliable for the subsequent analysis concerning interaction of the structure with waves of small steepness.
To further derive an empirical formula for a bottom-mounted porous cylinder and test the feasibility of the present method for interaction between the structure and waves with small steepness, the non-dimensional horizontal force on a bottom-mounted porous cylinder was investigated.
The porosities τ were set to 0.1, 0.2 and 0.3, with the radius a1/h = 1/4 and h = 1.0 m, and the wave slope ϵ = kζ was set to 0.05 to constrain the influence of viscosity, turbulence and possible nonlinear effects (e.g., wave break). Furthermore, a constant a = h/8 was defined. To test the feasibility of the method, the following steps are advised:
1. Select proper values of b to match the frequency domain curves of horizontal excitation force for τ = 0.1 and 0.3 with the experimental data.
2. Calculate the coefficients A and B in Equation (27) using the data from step 1.
3. After the b – τ relation is obtained, calculate the non-dimensional porosity parameter b with respect to τ = 0.2. Then evaluate the discrepancies with experimental data.
Figure 6A depicts the relationship between b and τ after choosing the proper porosity parameter b for the opening ratio τ. The value of b for τ = 0.2 was calculated using the following empirical formula:

Figure 6 Determination of the non-dimensional parameter b. (A) The relationship between the non-dimensional porosity parameter b and the opening ratio τ. (B) Validation of the numerical model (solid line) with experimental data (diamonds).
From Figure 6B, it can be observed that the discrepancies between the numerical results and experimental data from Mackay et al. (2021a) are relatively small and acceptable. A good agreement is found between the compared data for the frequencies with 0.8< kh<1.5. The measurements for the higher frequencies with kh >1.5 are consistently lower than the predicted results from the numerical model. Resort to the Equations (28) and (29), for the wave cases with the same water depth h and wave period T, the wavelength L decreases as kh increases, thus leading a decrease of KC number. Therefore, the viscous effect becomes less important to the force acting on the cylinder and it causes a decrease of force acting on the structure. Another reason could be that although the estimation of b is based on a complete pressure drop model, the numerical method still adopts a linear pressure drop model, so the quadratic term may sometimes be a little overestimated or underestimated. Nevertheless, the presented method still exhibits a relatively satisfactory accuracy. Compared with some potential theory models based on boundary element method (BEM) and quadratic pressure drop model (Liu and Li, 2017; Mackay et al., 2021b), the present method does not require iteration to calculate the normal velocities and avoids the procedures of meshing and removing irregular frequencies, which are issues for BEM programs (Liu, 2019; Liu et al., 2020; Ma et al., 2022).
To further investigate the accuracy of the predicted b derived by Equation (31), the non-dimensional force on cylinders with opening ratio τ = 0.2 was compared with experimental data. The wave steepness ϵ was set to 0.05 as previously suggested, and the radii of a1 were set to 3h/16, 4h/16, 6h/16. From Figure 7A, it is found that the agreement is good overall for the compared data. The discrepancies at higher frequencies with kh > 1.5 are also observed, similar to the aforementioned case. Figure 7B shows the non-dimensional force on porous cylinder with an inner solid cylinder, in which, the ratio of outer to inner cylinder a1/a0 was set to 2.0 and the radius of the inner cylinder a0 was set to h/8, the wave steepness ϵ was set to 0.05 and the opening ratios τ of the outer cylinder were set to 0.1, 0.2,0.3 and 1. τ = 1 corresponds to the case with only the inner solid cylinder. It can be observed that in the particular case where only the inner cylinder is considered, the numerical results are consistent with the experimental data. This indicates that the effects of viscosity and turbulence have a small influence on the total horizontal force for a solid cylinder with the range of conditions considered here. It is noted that the comparison between the numerical method and the experimental data shows a similar trend as Figure 6B. Overall, the discrepancies are acceptable. Moreover, it is also noted that adding a porous cylinder does not obviously increase the wave loads at higher frequencies with kh > 2.5. Figure 7C reveals the effect of the radius of the outer porous cylinder on the total horizontal force acting on the compound structure. The ratios of outer to inner cylinder a1/a0 were set to 1.0, 1.5, 2.0 and 3.0. The consistence between compared data is also satisfactory overall.
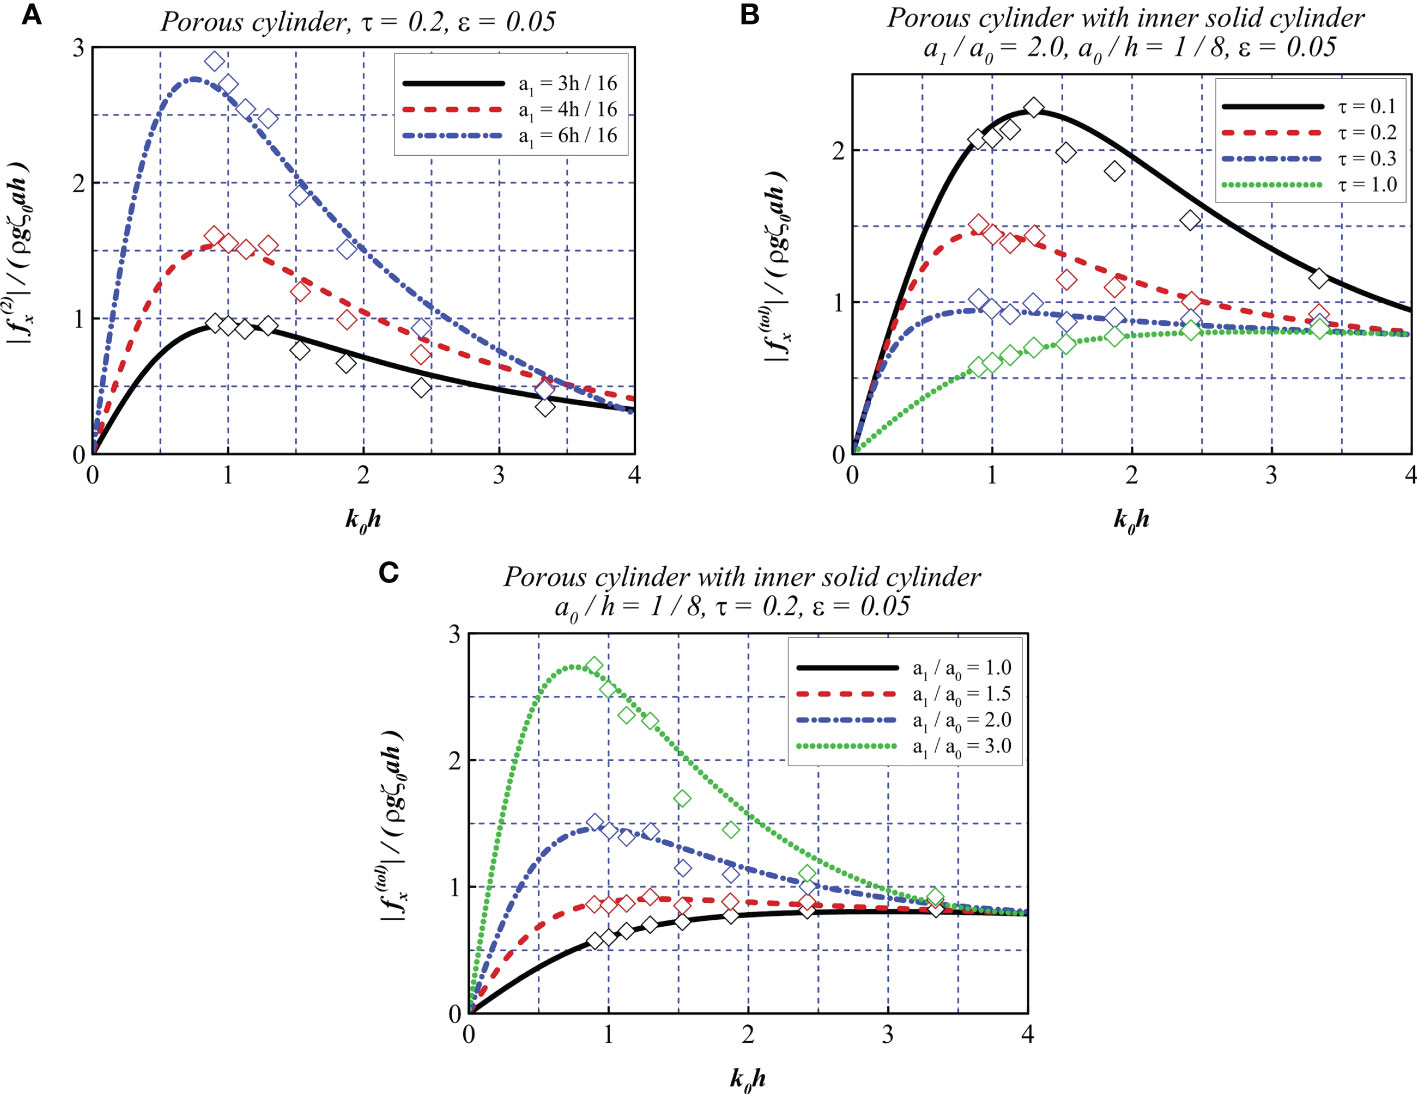
Figure 7 Comparison of non-dimensional horizontal force from the numerical model (solid line) and experimental data (diamonds). (A) Wave loads on a porous cylinder. (B, C) Wave loads on a porous cylinder with inner solid cylinder.
From the above discussion, it is found that the experimental data is well replicated by the presented numerical model. An empirical formula was also derived and tested. The numerical method based on linear potential theory and linear pressure drop model of porous medium is feasible for cases with small wave steepness and low KC numbers.
5 Results and discussion
5.1 Wavefield at the free surface
As mentioned previously, the proposed model is a combination of offshore wind turbine foundations and aquaculture infrastructure. The interactions between these components may be complex as a result of the shielding of the nets and diffraction effect of the wind turbine foundation. The manner in which waves act on a structure may have different characteristics under different environmental conditions. Furthermore, investigation of the wavefield is of great importance for enhancing the protection of aquatic creatures in fisheries. Therefore, special attention should be devoted to the wavefields within and adjacent to the model. In this section, we examine the cases with different net porosities. Moreover, cases of different net spacing are added for comparison. It should be noted that the discussion is suitable for cases with small wave steepness as stated in Section 4.
Referring to Balash et al. (2009); DeCew et al. (2010), and Kristiansen and Faltinsen (2012), the opening ratio of common fishing nets typically ranges from 0.7 to 0.9. According to Bi et al. (2018), in biofouling cases, the ratio can decrease to approximately 0.2. In the following discussion, we set ϵ = 0.05, τ = 0.25 to 0.85, and b to a minimum of 20 and maximum of 90 according to Equation (31).
The parameters were set to a2/a0 = 5.0, a1/a2 = 0.9, h/a0 = 10.0 and s/a0 = 2.0 with b1 = b2 = 90 for Figures 8A–D, which represents the common porosity of the fishing nets, and b1 = b2 = 20 for Figures 8E–H, which represents the case of biofouling. Moreover, a1/a2 = 0.5 and b1 = b2 = 90 were adopted for Figures 8I–L to investigate the impact of net spacings on the wavefield. Under the defined parameters, the wavefields of four different wavenumbers (i.e., k0a0 = 0.51, 0.82, 1.25, and 1.64) are presented in Figures 8A–L, where the central shaded circles represent the wind turbine tower and the surrounding dashed lines represent the interior and exterior nets. To illustrate the phenomena to be discussed more clearly, four zones are defined divided within or adjacent to the structure, as shown in Figures 8A, E, I. Zone I is near the upstream part of the exterior net, zone II is between the exterior net and the upstream part of the wind turbine tower, zone III is between the downstream part of the wind turbine tower and the exterior net, and zone IV is located near the downstream part of the exterior net.
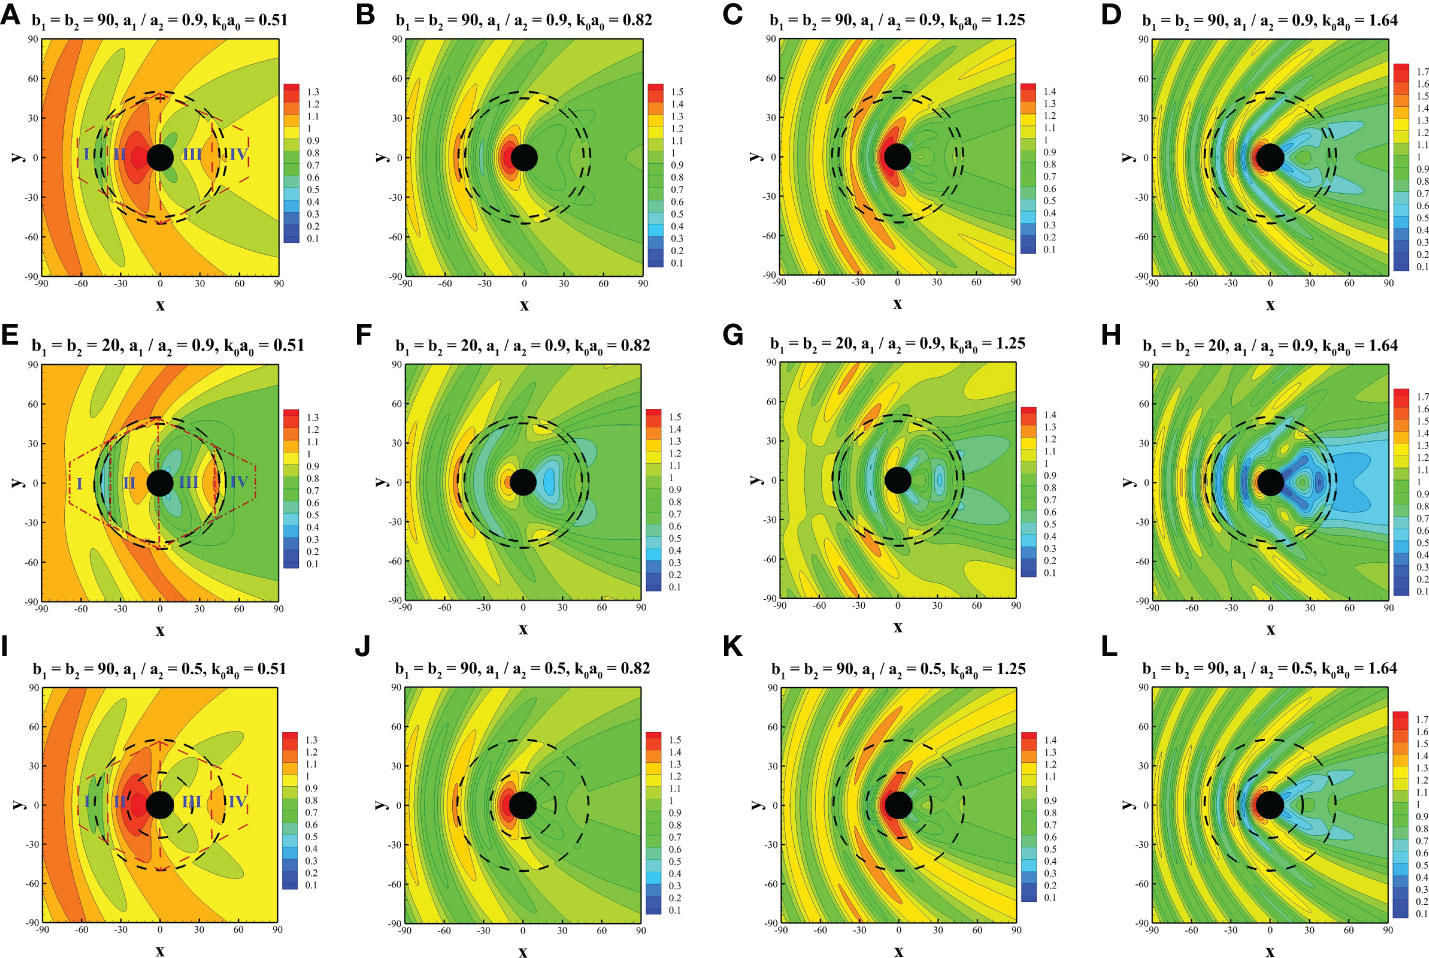
Figure 8 Comparison of wavefield at various wavenumbers. (A–D) b1 = b2 = 90, a1/a2 = 0.9, (E–H) b1 = b2 = 20, a1/a2 = 0.9, and (I–L) b1 = b2 = 90, a1/a2 = 0.5.
In general, with a decrease in porosity (i.e., parameter b decreases from 90 to 20), the wave elevation in zones II and III decreases significantly, which is intuitive based on the increased shielding effect of the two nets. Furthermore, the wave elevations on the upstream and downstream sides of the wind turbine tower decrease as the porosity decreases. Therefore, by reducing net porosity, the force acting on the wind turbine tower can be reduced. In particular, based on the combined effect of the pressure drop between the windward and leeward sides of the nets and the wave diffraction by the wind turbine tower and friction wheel, the wave elevation adjacent to the nets exhibits different characteristics. Figures 8E, G reveal that in zone I, the elevation at the windward side of the exterior net is greater than that in Figures 8A, C, but the elevation on the leeward side of the interior net is smaller. In zone IV, the wave elevation on the leeward side of the exterior net is significantly reduced with a decrease in the porosity parameter. Furthermore, a net with smaller porosity provides better shielding from water in the rear of the entire structure. In zone II, the wave elevation in Figures 8E-H is generally smaller than that in Figures 8A–D. In zone III, the wavefield exhibits more complex profiles than in zone II. However, generally speaking, Figures 8E–H show less significant wave elevation than Figures 8A-D, which reflects the improved shielding effect of nets with small porosity. However, there are several interesting phenomena to be observed. As shown in Figure 8F, the lowest elevation can be observed near the center of zone III. In Figures 8G, H, the lowest wave run-up appears near the windward side of the interior net. Furthermore, in Figure 8H, a sharp increase in wave elevation can be observed near the center of zone III, which is surrounded by an area with low wave elevation.
In comparison between wavefield of various net spacings, it is found that the discrepancies are less apparent regarding Figures 8A–D and Figures 8I–L. Some minor differences are discovered. As shown in Figure 8I, an area with smaller wave elevation exists near the upstream side of the exterior net in zone I. Moreover, due to the attenuation of the double nets, compared with Figure 8J, the wave elevation is smaller at the center of zone II in Figure 8B. The similar phenomenon is also found in comparison between Figures 8D, L. In Figure 8D, lower wave elevation is discovered near the leeward side of the interior net in zone II. In comparison between Figures 8C, K, smaller wave elevation is found near the leeward side of exterior net of zone II in Figure 8K, while slightly larger wave elevation is found near the interior net of zone II. This may be attributed to the composition of waves reflected by the interior net and propagating through the exterior net. Generally speaking, as the porosity of a fishing net is normally large, the spacings of the nets may have a less noticeable impact on the wavefield.
Based on the analysis above, a more complex wavefield tends to occur for cases with larger wavenumbers and smaller porosities. A large elevation difference may occur between the windward and leeward sides of the net, particularly for nets with smaller porosities. Furthermore, based on the interaction between shielding and diffraction effects, the wavefield may exhibit various profiles in different zones.
To explore the wavefield further, deeper quantitative analysis was conducted to highlight the wave elevation characteristics with different wavenumbers. As shown in Figure 9, eight sites are defined within or along the entire structure. Sites 1, 5, and 8 lie in the open water close to the exterior net. Sites 2, 4, and 7 are located at the middle point of the radius of the exterior net. Sites 3 and 6 are located at the wall of the wind turbine tower.
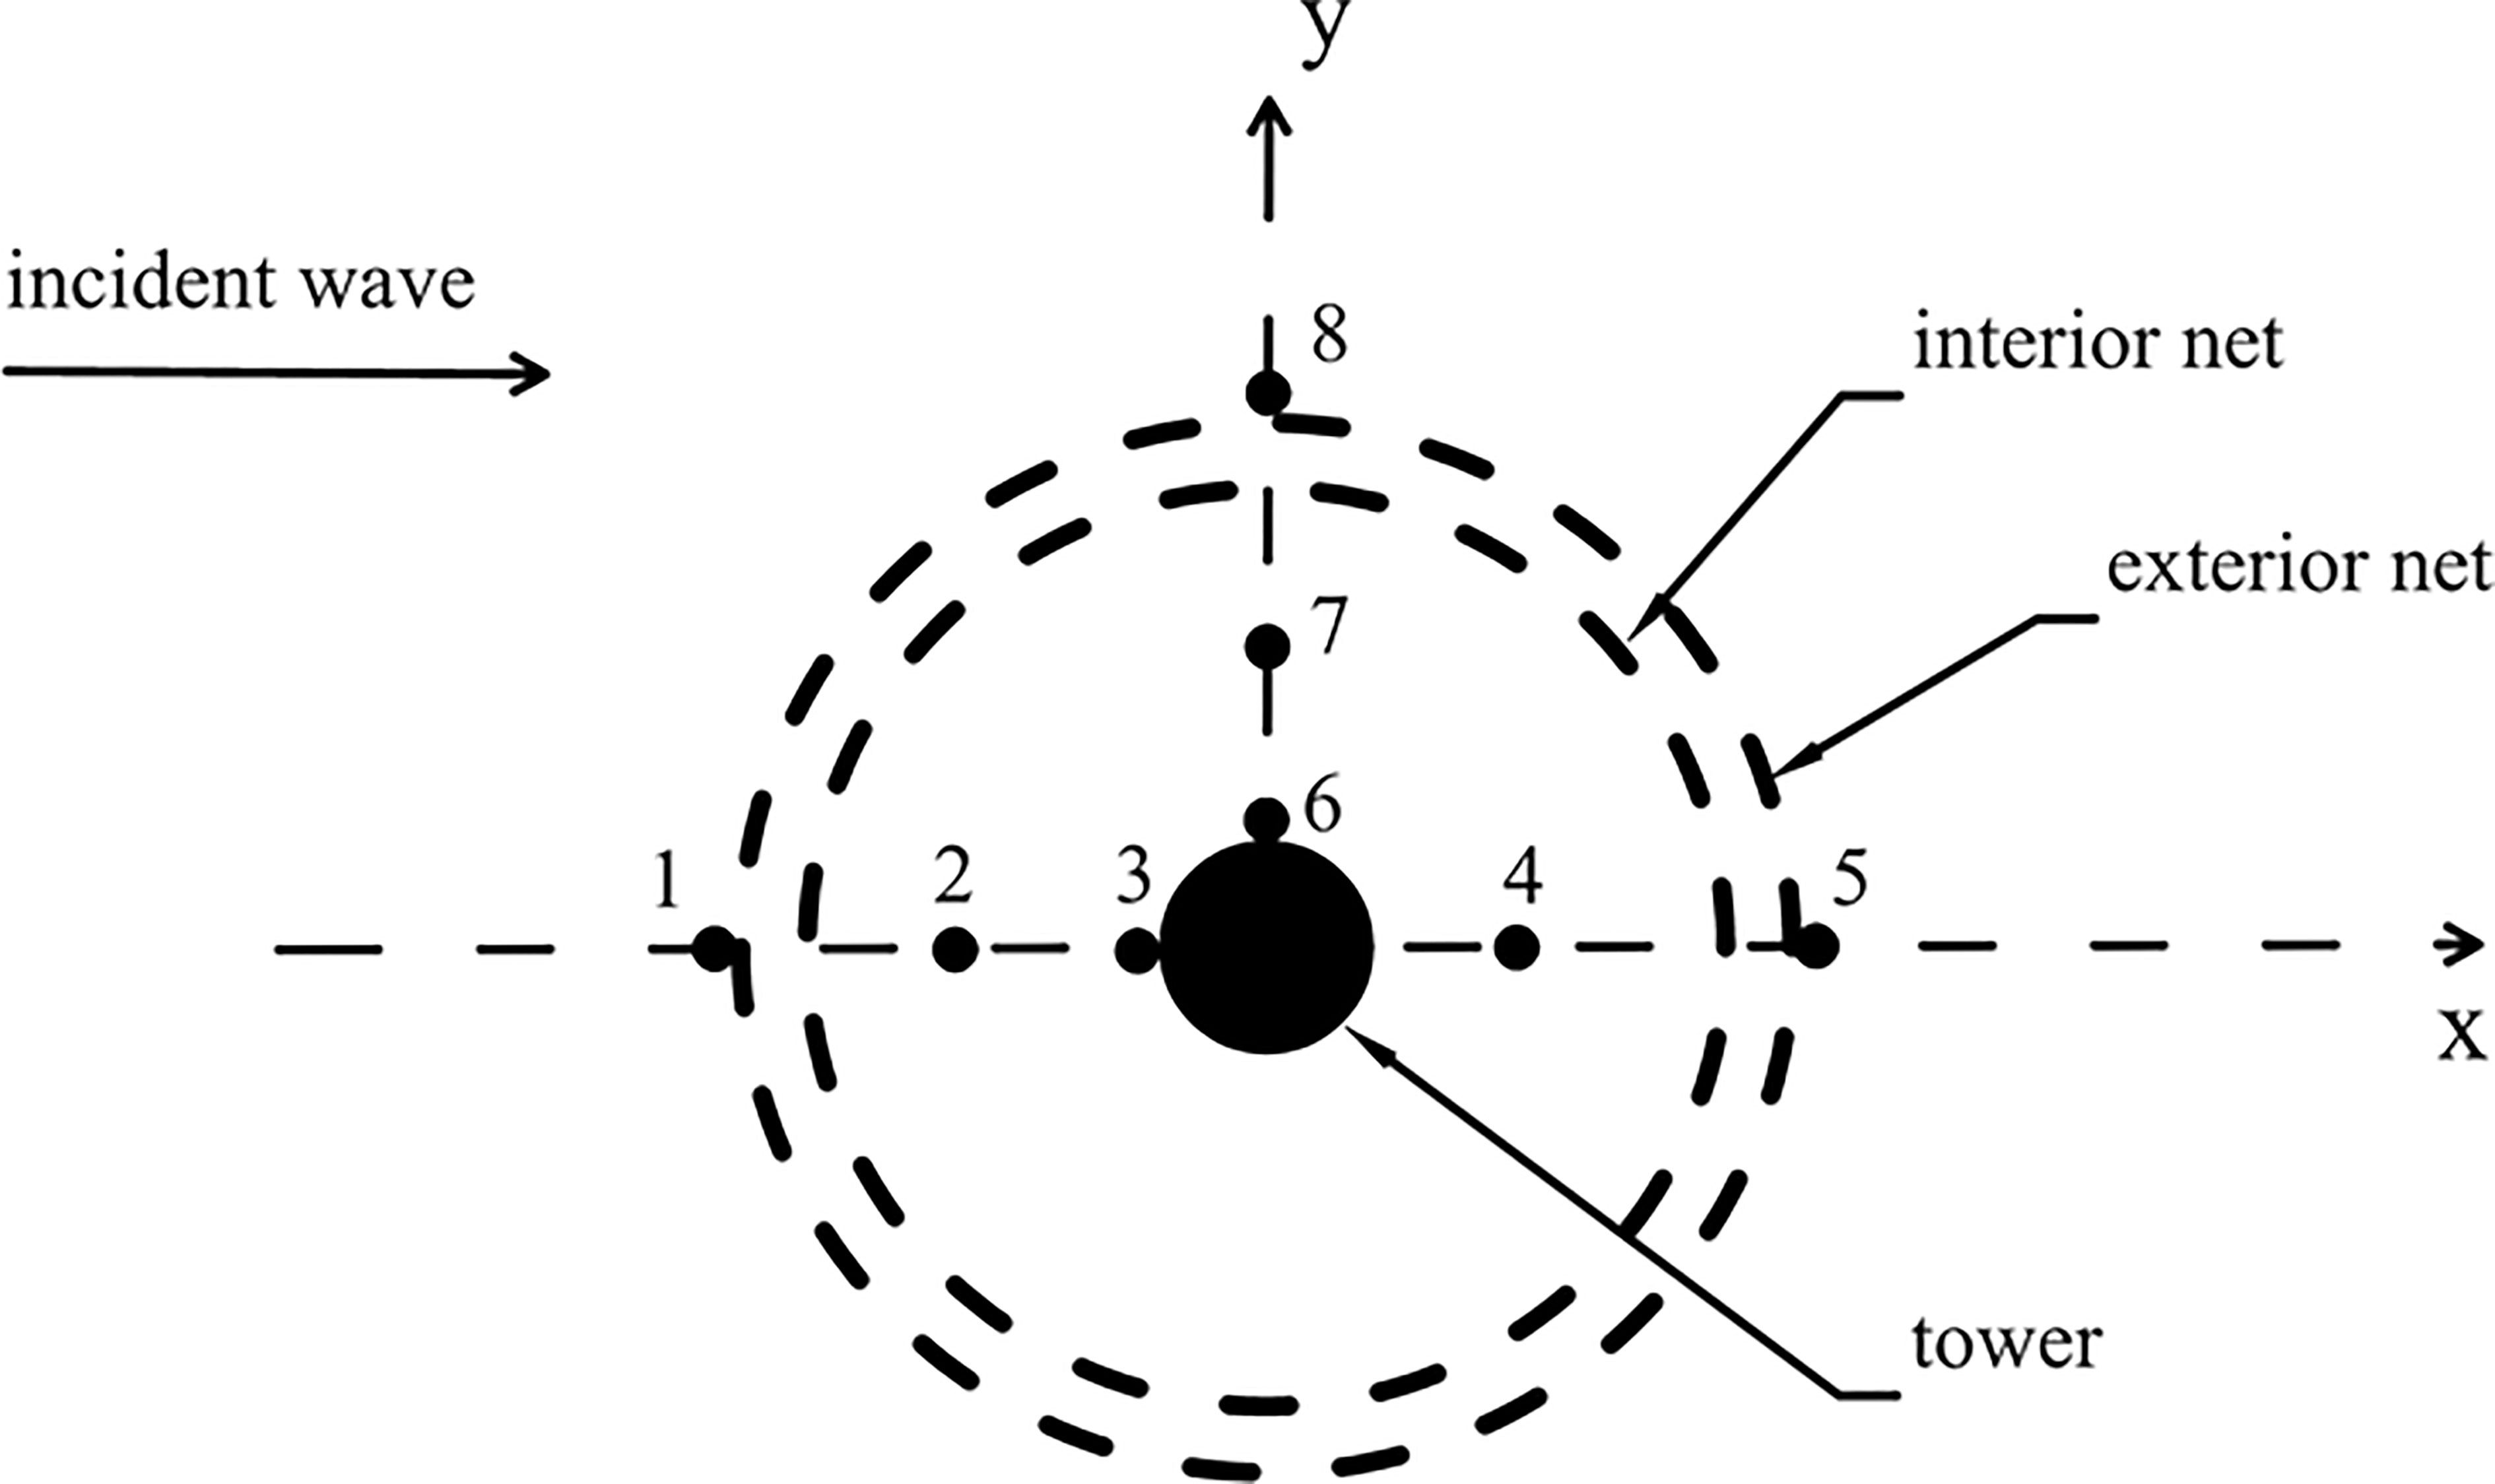
Figure 9 Layout of measurement sites for investigating wave elevation with different wavenumbers.
Figure 10A presents the wave elevation at site 1. In this figure, one can see that with a decrease in the porosity parameter b, the elevation increases, which confirms the phenomena discussed previously. Additionally, the curve peaks shift toward higher wavenumbers and the curve troughs shift toward lower wavenumbers as the porosity parameter decreases. Interestingly, minor troughs can be observed within 0< k0a0< 0.34, 0.54< k0a0< 0.91, and 1.18< k0a0< 1.64, indicating that a small-porosity net can lead to a prominent disturbance at site 1, thereby causing intensive oscillation of the wave run-up at these frequencies. Figure 10B represents the wave elevation at site 2. With an increase in the porosity parameter, the elevation increases, in contrast to Figure 10A, demonstrating that with larger porosity parameters, the shielding effect becomes less obvious. Similar to Figure 10A, minor troughs can be observed between curve peaks and within the intervals of 0< k0a0< 0.5, 0.5< k0a0< 0.77, 0.77< k0a0< 1.32, and 1.32< k0a0< 1.75, where wave elevation is evidently reduced. However, smaller porosity parameters seem to have less influence on the performance of attenuating wave elevation within the ranges adjacent to the curve peaks. Figures 10C–G reveals similar trends corresponding to the cases at sites 3, 5, 6, and 7, respectively. Figure 10D represents the wave elevation at site 4. One can see that within the range 0< k0a0< 0.40, the wave elevation increases as the porosity parameter b decreases and minor troughs emerge. In contrast, within the remaining range of 0.40< k0a0< 2.00, the wave elevation decreases as b decreases, exhibiting a complex trend in areas on the downstream side of the structure. In particular, at k0a0 = 0.89, the dotted curve (i.e., b1 = b2 = 20) exhibits an approximately 60% decrease in wave elevation. In Figure 10H, the curves exhibit a more complex trend at site 8. In the ranges of 0< k0a0< 0.14 and 0.93< k0a0< 1.31, the wave elevation increases as the porosity parameter decreases. In the remaining ranges, we observe the opposite phenomena. Particularly in the range of 1.31< k0a0< 1.68, despite the increase in b, the elevation seems to exhibit a sluggish increase. The discussion above may indicate complex interaction among the nets, wind turbine foundation and the incoming waves.
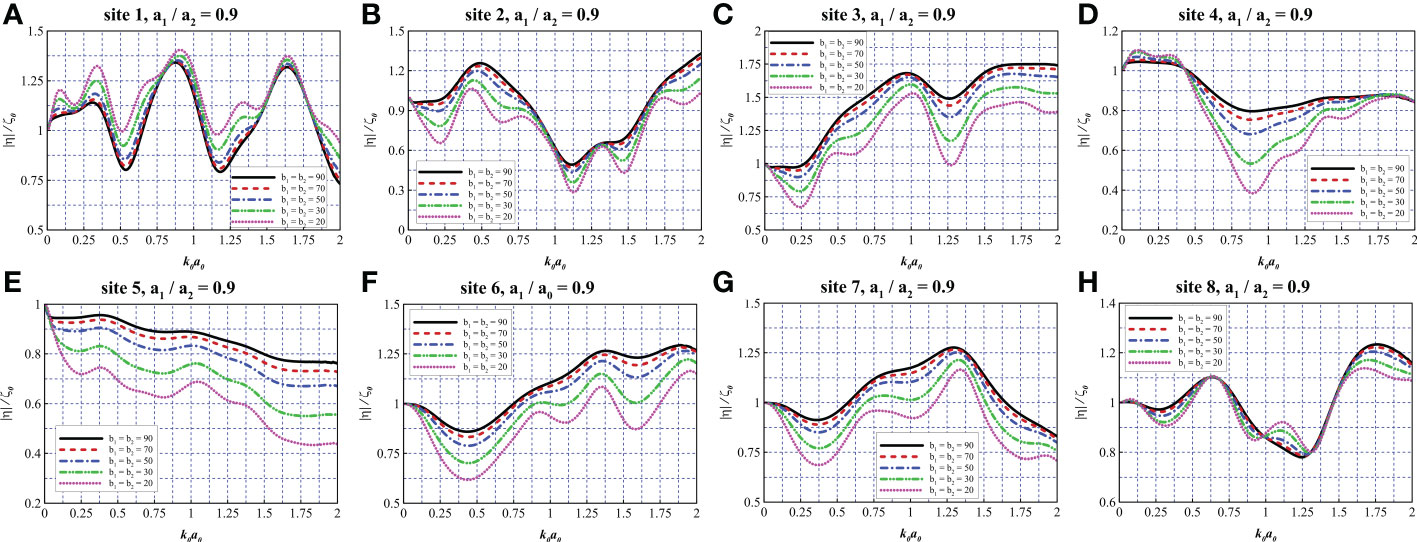
Figure 10 Comparison of wave elevation at different measurement sites with various porosity parameters. (A–H) a1/a2 = 0.9, site 1-8.
Figure 11A presents the wave elevation at site 1. It can be observed that the spacing of the nets does not have a significant impact on the wave elevation at site 1. At frequencies with 0.74< k0a0< 1.06 and 1.10< k0a0< 1.39, the wave elevation first slightly decreases then slightly increases with the decrease of the net spacing. Figure 11B depicts the wave elevation at site 3. At lower frequencies with 0< k0a0< 0.57, the discrepancies are relatively small for various net spacings. In the range of 0.58< k0a0< 1.51, the differences between various cases are noticeable. Due to the reflection of the wind turbine tower, the trend of curves for various net spacing is complex and not obvious. Figure 11C reveals the wave elevation at site 5, generally speaking, the wave elevation increases as the net spacing increases in the range of 0< k0a0< 0.89. It can be observed that the case with the largest spacing a1/a2 = 0.3 exhibits the highest wave elevation and the case with the smallest spacing a1/a2 = 0.9 exhibits the lowest wave elevation at frequencies with 0< k0a0< 0.89 and 1.43< k0a0< 2.0. In Figure 11D, the cases with a small net spacing may induce lower wave elevation at frequencies with 0< k0a0< 0.52. At higher frequencies, cases with smaller net spacing may induce higher wave elevation in the range of 0.52< k0a0< 1.06 and 1.06< k0a0< 2.0. In general, the case with the largest spacing a1/a2 = 0.3 induces the highest wave elevation at site 6. From Figure 11E, it is found that the spacing of the nets does not have an obvious impact on the wave elevation at site 8. The case with the smallest spacing a1/a2 = 0.9 may have a better performance in attenuating wave elevation at lower frequencies with 0< k0a0< 1.03.
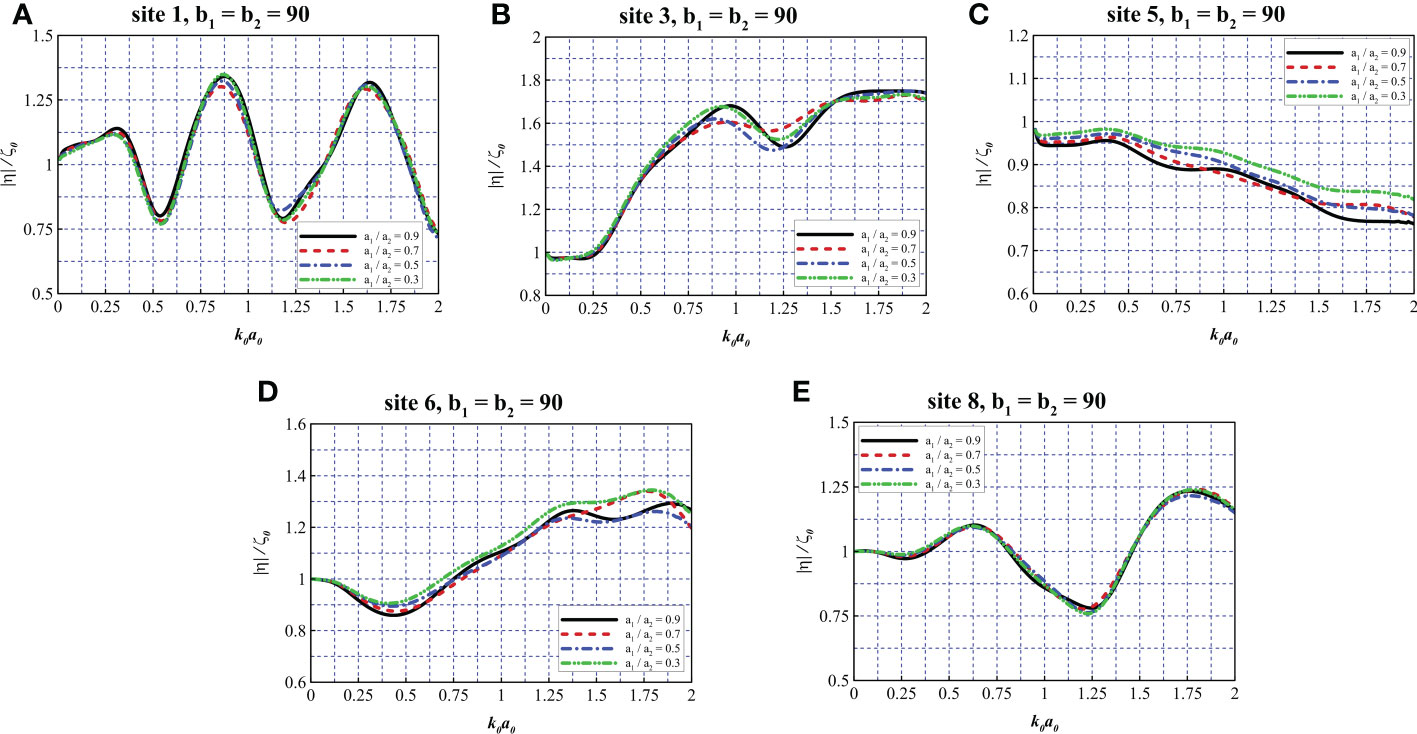
Figure 11 Comparison of wave elevation at different measurement sites with various net spacing. (A–E) b1 = b2 =90, site 1, 3, 5, 6, 8.
5.2 Wave force
In this section, we present parametric studies investigating the effects of different characteristics on the wave loads acting on the structure. As a result of the biofouling effect, the net porosity may exhibit a sharp decrease, affecting the hydrodynamic performance of the structure. The spacings between the nets may also have an impact on the force acting on the structure. Furthermore, for various soil mechanics properties, special designs can be applied to the bottom friction wheel. Consequently, the effects of the total porosity parameter, the spacing between the nets, ratio of the radius of the friction wheel to the wind turbine tower, and thickness of the friction wheel were considered for analysis.
5.2.1 Effects of the porosity parameter b
In this section, the parameters a2/a0 = 5, a1/a2 = 0.9, h/a0 = 10, and s/a0 = 2 were fixed. By introducing five different total porosity parameters b0 = 40, 60, 100, 140, and 180 (i.e., b1 = b2 = 20, 30, 50, 70, 90), the effects of total net porosity on the force acting on the structure were investigated.
As shown in Figure 12A, with an increase in the total porosity parameter, the force exerted on the wind turbine tower exhibits an overall growth trend. In Figures 12B, C, one can see that the curves exhibit an opposite trend. With a greater total porosity, less wave force acts on the interior and exterior nets. This indicates that nets with small porosities have a better shielding effect on the wind turbine tower. Overall, because the exterior net is more exposed to incoming waves with larger radii, more force is exerted. Interestingly, there are some points along the curves located close to zero (i.e., k0a0 = 0.37, 1.10, and 1.90 in Figure 12B, and k0a0 = 0.33, 0.99, and 1.69 in Figure 12C, where the sloshing modes are satisfied. In each figure, the curves exhibit almost the same sloshing mode frequencies. The sloshing mode frequencies of the two nets are slightly different. The exterior net has a lower oscillating frequency than the interior net. Near the sloshing mode frequencies, there are some major or minor peaks (i.e., k0a0 = 0.36, 1.01, 1.73), where the force is eminently weakened. As a result, near such frequencies, the tower is more likely to be damaged and it is desirable to avoid such peaks such that the wind turbine tower is better protected from severe wave conditions. Furthermore, by reconsidering the peaks and troughs in Figure 10, it was determined that some of them occurred near these frequencies, which further demonstrates the pattern of sloshing phenomena. Figure 12D indicates that low porosity (i.e., b1 = b2 = 20) causes the entire structure to bear greater wave forces at low wavenumbers. Compared to the peak value of 7.33 on the dotted line (i.e., b1 = b2 = 90), the solid line (i.e., b1 = b2 = 20) has a peak value of 18.9, representing a significant 158% increase. However, at high wavenumbers k0a0 > 1.0, this phenomenon is less prominent. Among the frequencies in question (i.e., the range of approximately 0.37< k0a0< 0.87), there may be a minor peak for low porosity because such frequencies are between the sloshing modes shown in Figures 12B, C.
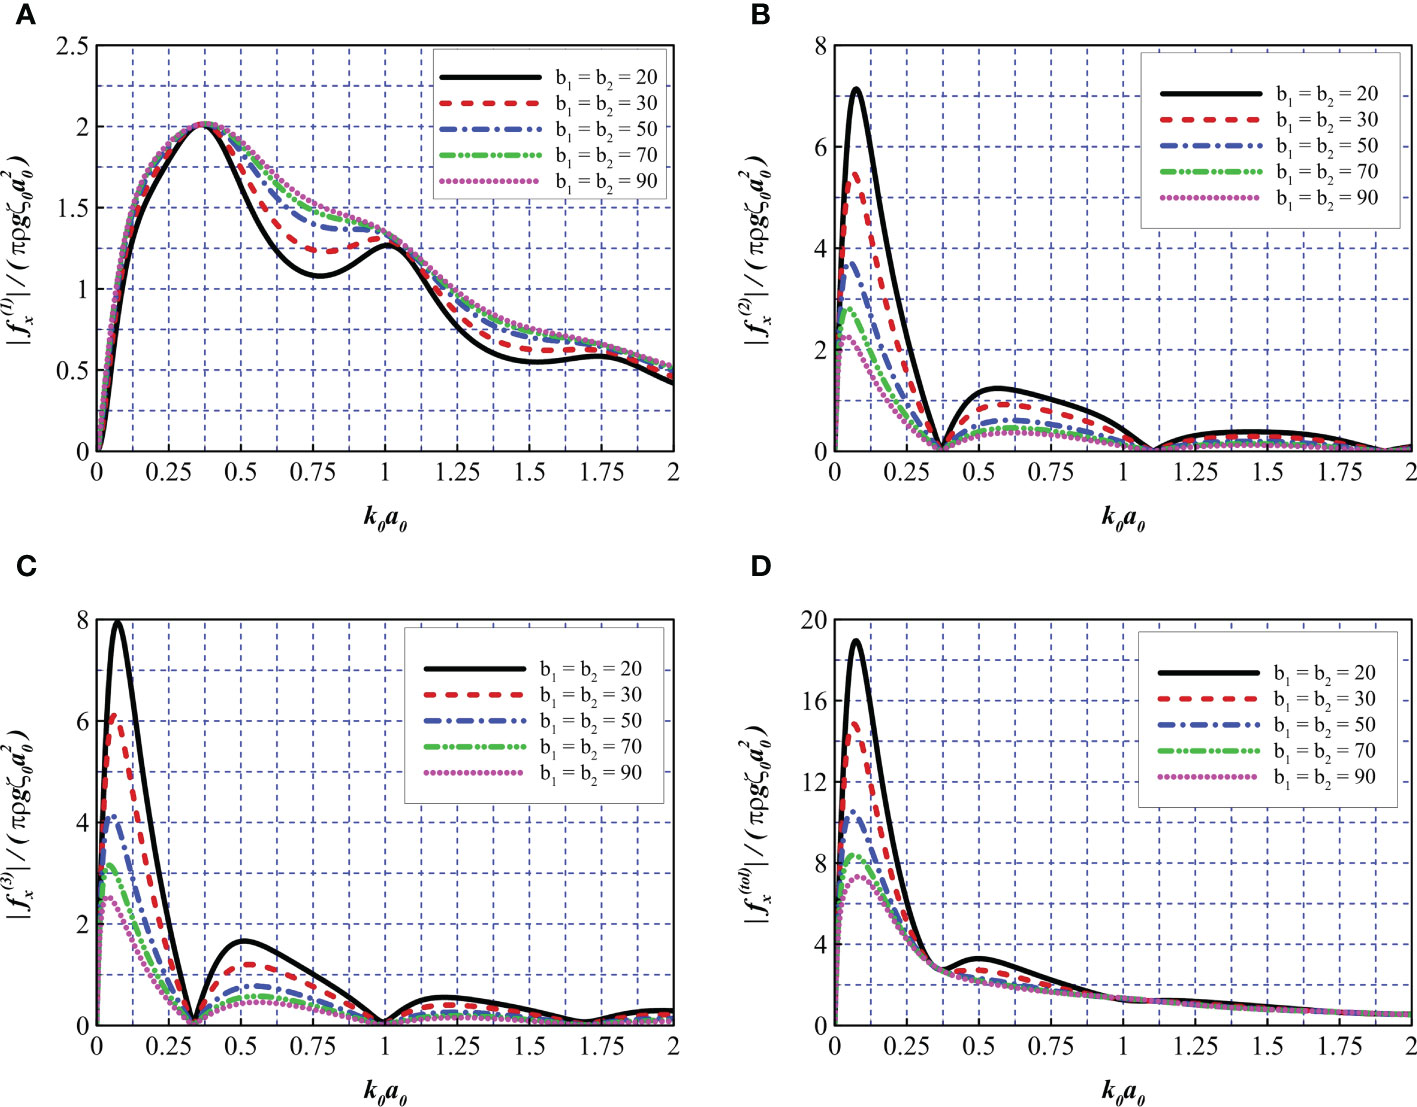
Figure 12 Comparison of wave force for different total porosity parameters. (A) , (B) , (C) , and (D) .
5.2.2 Effects of the spacing between the nets (a1/a2)
In this section, the wave loads acting on the structure with different spacings between the nets a1/a2 were investigated. The parameters a2/a0 = 5, h/a0 = 10, s/a0 = 2 and b1 = b2 = 90 were fixed, four different spacings between the nets were considered: a1/a2 = 0.3, 0.5, 0.7 and 0.9.
Figure 13A depicts the non-dimensional horizontal force on the wind turbine tower. It can be observed that the values for various net spacings are overall identical in the ranges of 0< k0a0< 0.47 and 1.63< k0a0< 2.0, indicating that the net spacing does not have an obvious impact on the wave loads of the wind turbine tower for the conditions we consider here. In the range of 0.47< k0a0< 1.63, similar to the phenomenon discussed in Section 5.1, the trends of these curves are complex and less obvious. Overall, the case with the largest net spacing a1/a2 = 0.3 tends to exhibit more force on the wind turbine tower compared with other cases. From Figure 13B, it is found that the wave loads exerted on the interior net sharply decrease as the net spacing increase due to significant decrease of the area of the interior net, especially for a frequency range within 0< k0a0< 1.26. Furthermore, the figure indicates that the sloshing mode frequencies for the interior net increase as the spacing of the net increases. Figure 13C shows that the net spacing does not obviously change the wave loads on the exterior net, except for frequencies near the first peak. Figure 13D illustrates that in the range of 0< k0a0< 0.16, the wave loads acting on the whole structure decrease as the spacing of nets increases, which is similar to what Figure 13B indicates. Moreover, the curve peak shifts to higher frequencies as the spacing of nets increases. At higher frequencies (i.e., k0a0 > 0.16), the curves are overall consistent.
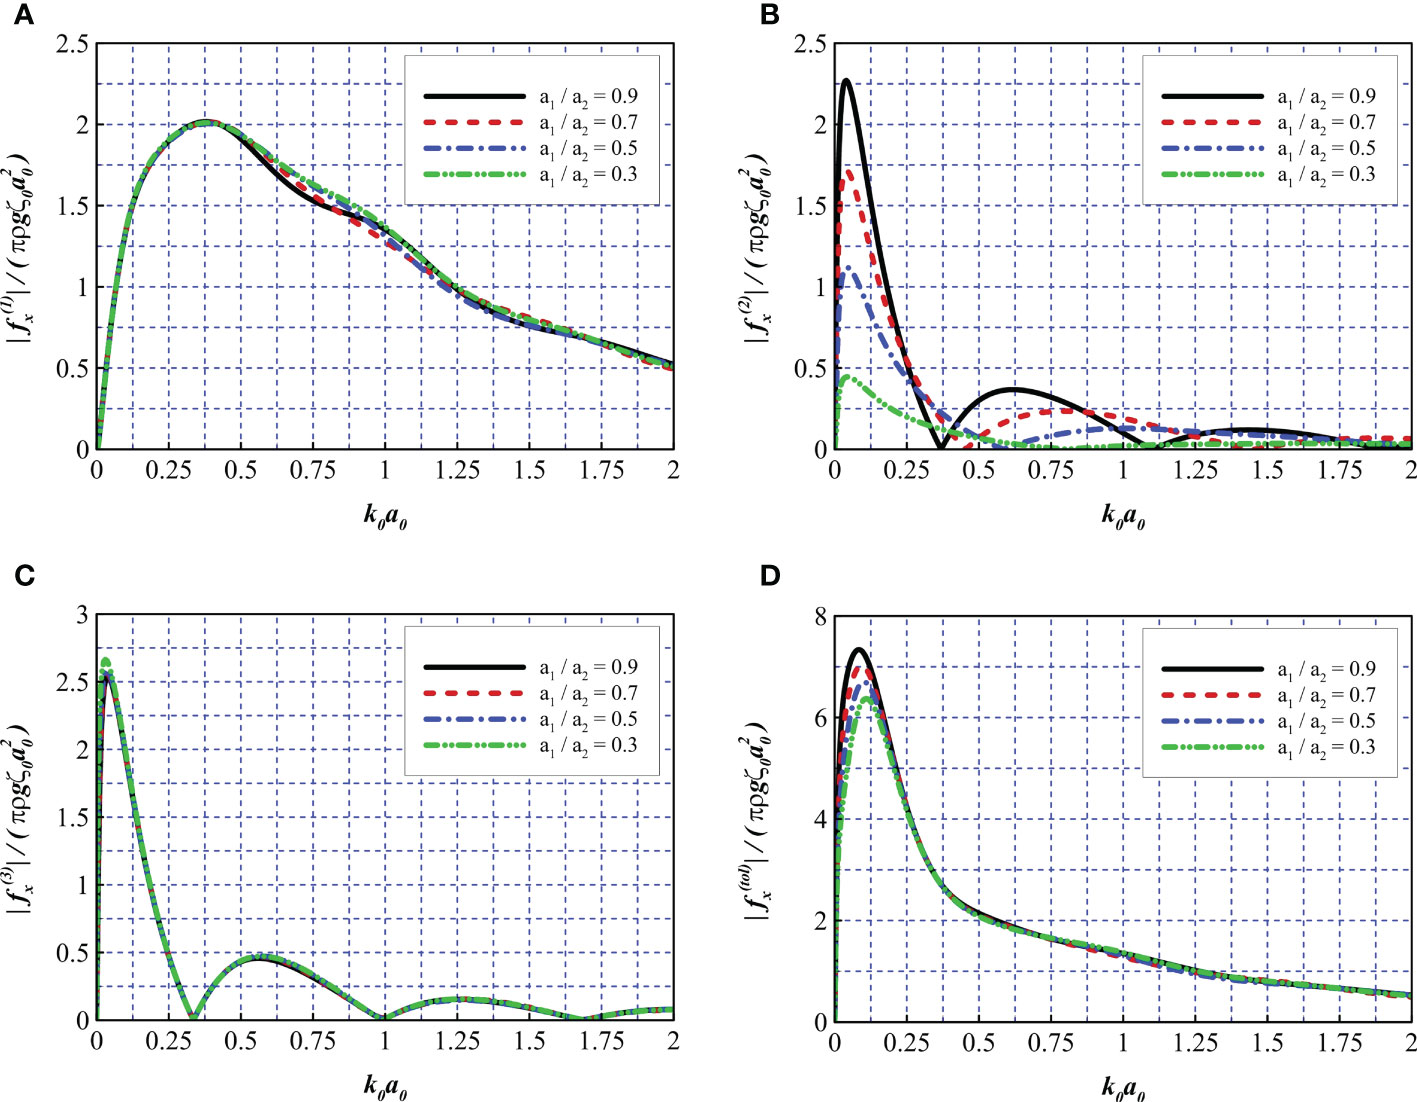
Figure 13 Comparison of wave force for different net spacing. (A) , (B) , (C) , and (D) .
5.2.3 Effects of the ratio of friction wheel to wind turbine tower radius (a2/a0)
In practical use, the radius of the friction wheel may be set to various values to ensure the stability of the foundation based on different soil properties. In the following discussion, the parameters a1/a2 = 0.9, h/a0 = 10, s/a0 = 2, and b1 = b2 = 90 were fixed, and four different radius ratios of a2/a0 = 2, 3, 5, and 7 were considered.
In Figure 14A, with an increase in the radius ratio a0/a2, the peak frequency gradually shifts toward lower wavenumbers. The radius ratio appears to have a less significant impact on the force exerted on the wind turbine tower. In Figures 14B, C, with a greater radius ratio, the curves exhibit more frequencies satisfying the sloshing mode within the range 0< k0a0< 2, which indicates that a large radius ratio can narrow the intervals between adjacent sloshing mode frequencies. For cases with large radius ratios (i.e., a2/a0 = 5 and 7), the sloshing phenomena become more apparent. At such frequencies (i.e., k0a0 = 0.38 and 1.04 on the blue line, and k0a0 = 0.31, 0.75, and 1.25 on the green line), humps can be observed in Figure 14A, which are attributed to the sloshing phenomena, as discussed in Section 5.2.1. Figure 14D reveals that the net panels have a limited capacity to dissipate wave energy within the low-frequency range (where the wavelength is sufficiently large) and that a structure with a larger radius ratio tends to experience a higher total wave force within the range 0< k0a0< 0.5, leading to a nearly 300% increase compared to the cases of a2/a0 = 2 and a2/a0 = 7. However, for higher wave frequencies, the radius ratio has little influence on the total wave force.
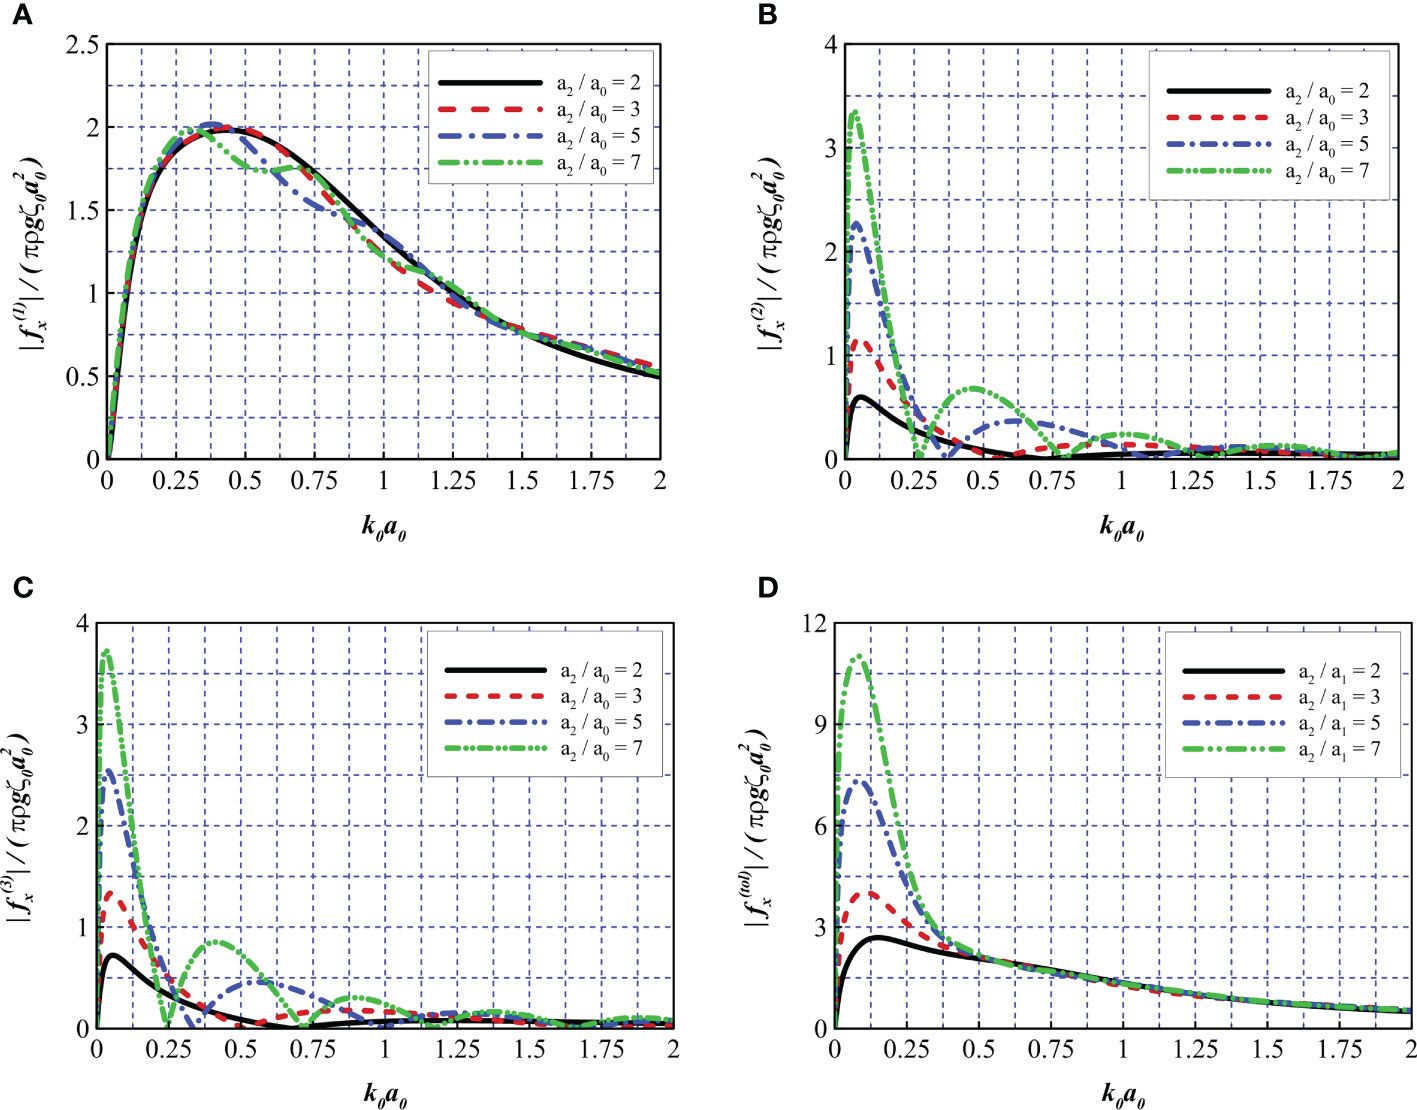
Figure 14 Comparison of wave force for different radius ratios of the friction wheel to the wind turbine tower. (A) , (B) , (C) , and (D) .
5.2.4 Effects of the thickness of the friction wheel (s/a0)
In this section, the force acting on the structure with different thicknesses of the friction wheel s/a0 was investigated. The parameters a2/a0 = 5, a1/a2 = 0.9, h/a0 = 10, and b1 = b2 = 90 were fixed, while four different thicknesses of the friction wheel were considered: s/a0 = 1.5, 2.0, 4.0, and 7.0.
Figure 15A reveals that in the range of 0< k0a0<1.0, the wave force on the wind turbine tower is reduced with an increase in the thickness of the friction wheel. However, at higher frequencies (i.e., 1.0< k0a0< 2.0), the curves exhibit very similar trends and values. Figures 15B, C indicate that structures with a greater wheel thickness exert less wave force on the double nets. Furthermore, a greater wheel thickness (i.e., s/a0 = 7.0) leads to lower oscillating frequencies in the first sloshing mode (e.g., the corresponding wavenumber is reduced from 0.33 to 0.26, as shown in Figure 15C, while rarely affecting other higher oscillating modes (i.e., at k0a0 = 0.99 and 1.68). Figure 15D reveals that with an increase in wheel thickness, larger peaks can be observed within the first oscillating frequency and a nearly 200% increase can be observed compared to s/a0 = 1.5 and s/a0 = 7.0. In the high-frequency range (i.e., k0a0 > 0.5), the total wave force exhibits little change, except for at s/a0 = 7.0, where the curve reaches a low trough at k0a0 = 0.79. This may be a comprehensive result of fewer wave loads acting on the tower based on the reduction of the stream surface and shielding of the nets. Additionally, as the upper part of the friction wheel approaches the free surface, the friction wheel begins to dominate the interaction of incoming waves with the entire structure.
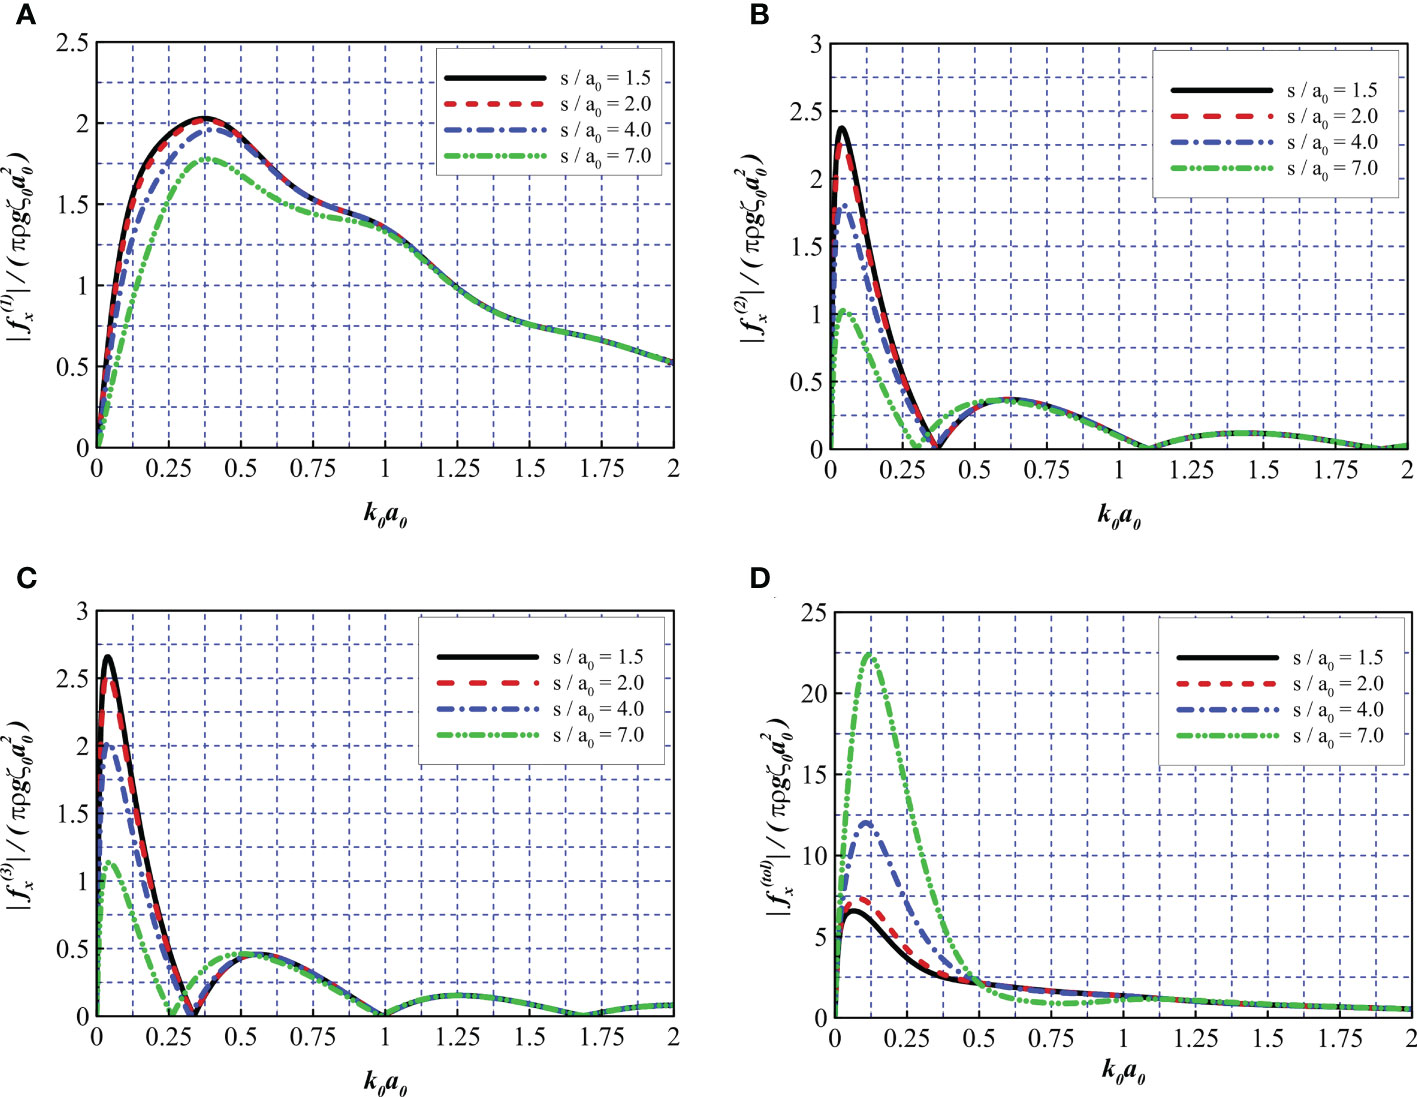
Figure 15 Comparison of wave force for different thicknesses of the friction wheel. (A) , (B) , (C) , and (D) .
6 Conclusions
In this study, the wave diffraction of a hybrid wind turbine foundation with a double-layer aquaculture cage was investigated. A numerical model based on the linear potential theory was established and solved using the eigenfunction expansion method. The feasibility and accuracy of the proposed method were verified and compared to existing numerical models and experimental data. Subsequently, the wave elevation, wavefield, and horizontal force acting on the structure were calculated by performing parametric studies. Note that the assumption of small wave steepness was adopted throughout the study. Based on the results, our main findings can be summarized as follows:
I. A noticeable difference in elevation was found between the upstream and downstream sides of the net system, which caused a large run-up accumulation at leeward sites. In general, the wave elevation within the hybrid system was reduced for structures with low net porosities (i.e., b1 = b2 = 20). In the downstream and side areas of the structure, the wavefield exhibited complex profiles and wave elevation might be significantly attenuated as a result of the shielding effect of nets and diffraction of waves by the wind turbine tower foundation (e.g., a 60% maximum decrease in wave elevation was observed at the middle point of the downstream areas for b1 = b2 = 20).
II. Sloshing modes were discovered, which had a non-negligible impact on the wave elevation and wave loads acting on the structure. At these oscillating frequencies (e.g., k0a0 = 0.36, 1.01, 1.73 for b1 = b2 = 20), the force and wave run-up on the wind turbine tower were at their peak, whereas at between the oscillating frequencies, the force on the wind turbine tower decreased and the force on the nets increased. One possible method to avoid peak values is to adjust the geometrical parameters of the structure such as the radius and thickness of the friction wheel.
III. Structures with nets of low porosities withstood greater wave loads acting on them. In the present study, a 158% maximum increase in the total wave load was observed by reducing b from 90 to 20. However, nets of low porosities tended to provide a better shielding for the wind turbine tower. Furthermore, net porosity had little influence on the sloshing-mode frequencies of the structure.
IV. For common fishing nets with relatively large porosities, the spacing between the double nets did not have a significant impact on the wavefield and wave loads on the structure.
V. In this study, by increasing the radius ratio of the exterior net to the wind turbine tower, the wave force on the wind turbine tower was slightly reduced, whereas on other parts, it increased significantly within the first oscillating frequency (i.e., approximately 0< k0a0< 0.25). However, at higher wavenumbers (i.e., 0.5< k0a0< 2.0), the wave loads acting on the tower were similar in value. Furthermore, by increasing the radius ratio, the intervals between adjacent sloshing mode frequencies were narrowed.
VI. By increasing the thickness of the friction wheel, the wave force on the wind turbine tower was reduced, whereas the force on other parts generally increased. Furthermore, the interval of the first sloshing mode (i.e., 0< k0a0< 0.33) was narrowed, whereas other sloshing modes were negligibly affected by the increase in thickness of the friction wheel.
Compared with previous research, this paper presents a deeper investigation into the physical implication of the non-dimensional porosity parameter b, derives an empirical formula for the bottom-seated porous cylinder structure and discusses the feasibility of the linear potential theory based numerical model combined with a linear pressure drop model for tackling the problem of interaction between waves with small steepness and structures with porous medium. This paper puts forward a novel hybrid aquaculture system combined with wind turbine. Furthermore, the wavefield and wave loads on this novel structure are thoroughly studied. Special phenomena (e.g., sloshing) are discovered, which further reveal the hydrodynamics of the structure. The abovementioned findings may provide useful information in practical engineering when considering a structure’s interaction with waves of small steepness. For instance, in order to avoid sloshing mode frequencies which may cause severe wave loads acting on the wind turbine tower, geometrical properties of the structure should be designed carefully according to the local sea conditions. The effect of biofouling is also nonnegligible, as it leads to apparent changes of the wavefield and drastic increases of the wave loads acting on the whole structure. Moreover, the size of the friction wheel also impacts the wave force acting on the structure, so the properties of both hydrodynamics and soil mechanics should be taken into consideration. As mentioned before, the present method provides a simplified and feasible approach to investigate the hydrodynamics of structures with porous media for wave cases of small steepness and KC numbers. However, when wave steepness and KC numbers become larger, the present model may fail in obtaining satisfactory results compared with experimental data, because it does not consider viscosity, turbulence or other non-linear effects. Therefore, a more comprehensive and accurate numerical method might be needed to tackle these problems, which will be the main topic of our future work. Furthermore, experiments shall be conducted to investigate hydrodynamic characteristics of the proposed hybrid aquaculture system.
Data availability statement
The original contributions presented in the study are included in the article/supplementary material. Further inquiries can be directed to the corresponding author.
Author contributions
XZ: Conceptualization, methodology, programming and writing the original draft. GD: Data curation, funding acquisition and supervision. CB: Writing, review, editing, investigation, methodology and supervision. YZ: Resources and investigation. All authors contributed to the article and approved the submitted version.
Funding
This work was financially supported by the National Natural Science Foundation of China (project nos. 31972843 and 31872610) and LiaoNing Revitalization Talents Program (project nos. XLYC907139 and XLYC2007045).
Conflict of interest
The authors declare that the research was conducted in the absence of any commercial or financial relationships that could be construed as potential conflict of interest.
Publisher’s note
All claims expressed in this article are solely those of the authors and do not necessarily represent those of their affiliated organizations, or those of the publisher, the editors and the reviewers. Any product that may be evaluated in this article, or claim that may be made by its manufacturer, is not guaranteed or endorsed by the publisher.
References
Aarsnes J. V., Rudi H., Løland G. (1990). “Current forces on cage, net deflection,” in Engineering for offshore fish farming (Glasgow: Thomas Telford Publishing), (137–152).
Arshi H. S., Stone K. J. L. (2015). “Improving the lateral resistance of offshore pile foundations for deep water application,” in Proc., 3rd int. symp. on frontiers in offshore geotechnics (London, UK: CRC Press).
Balash C., Colbourne B., Bose N., Raman-Nair W. (2009). Aquaculture net drag force and added mass. Aquacultural Eng. 41 (1), 14–21. doi: 10.1016/j.aquaeng.2009.04.003
Bao W., Kinoshita T., Zhao F. (2009). Wave forces acting on a semi-submerged porous circular cylinder. Proc. Institution Mechanical Engineers Part M: J. Eng. Maritime Environ. 223 (3), 349–360. doi: 10.1243/14750902JEME145
Bi C. W., Zhao Y. P., Dong G. H. (2015). Numerical study on the hydrodynamic characteristics of biofouled full-scale net cage. China Ocean Eng. 29 (3), 401–414. doi: 10.1007/s13344-015-0028-9
Bi C. W., Zhao Y. P., Dong G. H., Wu Z. M., Zhang Y., Xu T. J. (2018). Drag on and flow through the hydroid-fouled nets in currents. Ocean Eng. 161, 195–204. doi: 10.1016/j.oceaneng.2018.05.005
Bi C. W., Zhao Y. P., Dong G. H., Xu T. J., Gui F. K. (2014). Numerical simulation of the interaction between flow and flexible nets. J. Fluids Structures 45, 180–201. doi: 10.1016/j.jfluidstructs.2013.11.015
Bi C. W., Zhao Y. P., Dong G. H., Xu T. J., Gui F. K. (2017). ). numerical study on wave attenuation inside and around a square array of biofouled net cages. Aquacultural Eng. 78, 180–189. doi: 10.1016/j.aquaeng.2017.07.006
Braithwaite R. A., Carrascosa M. C. C., McEvoy L. A. (2007). Biofouling of salmon cage netting and the efficacy of a typical copper-based antifoulant. Aquaculture 262, 219–226. doi: 10.1016/j.aquaculture.2006.11.027
Buck B. H. (2004). Farming a high energy environment: Potentials and constraints of sustainable offshore aquaculture in the German bight (North Sea) (Bremen: University of Bremen). dissertation.
Buck B. H., Krause G. (2012). “Integration of aquaculture and renewable energy systems,” in Encyclopaedia of sustainability science and technology, vol. 1 . Ed. Meyers R. A. (New York: Springer Science + Business Media LLC), 511–533. doi: 10.1007/978-1-4419-0851-3_180
Chu Y. I., Wang C. M. (2020). Hydrodynamic response analysis of combined spar wind turbine and fish cage for offshore fish farms. Int. J. Struct. Stability Dynamics 20 (9), 2050104. doi: 10.1142/S0219455420501047
Chu Y. I., Wang C. M., Zhang H. (2022). A frequency domain approach for analyzing motion responses of integrated offshore fish cage and wind turbine under wind and wave actions. Aquacultural Eng. 97, 102241. doi: 10.1016/j.aquaeng.2022.102241
Chwang A. T., Chan A. T. (1998). ). interaction between porous media and wave motion. Annu. Rev. Fluid Mech. 30, 53–84. doi: 10.1146/annurev.fluid.30.1.53
DeCew J., Tsukrov I., Risso A., Swift M. R., Celikkol B. (2010). Modeling of dynamic behavior of a single-point moored submersible fish cage under currents. Aquacultural Eng. 43 (2), 38–45. doi: 10.1016/j.aquaeng.2010.05.002
Hall P. (1984). On the stability of unsteady boundary layer on a cylinder oscillating transversely in a viscous fluid. J. Fluid Mech. 146, 347–367. doi: 10.1017/S0022112084001907
Honji H. (1981). Streaked flow around an oscillating circular cylinder. J. Fluid Mech. 107, 509–520. doi: 10.1017/S0022112081001894
Huang C.-C., Tang H.-J., Liu J.-Y. (2007). Dynamical analysis of net cage structures for marine aquaculture: numerical simulation and model testing. Aquacult. Eng. 35 (3), 258–270. doi: 10.1016/j.aquaeng.2006.03.003
Jahani K., Langlois R. G., Afagh F. F. (2022). Structural dynamics of offshore wind turbines: A review. Ocean Eng. 251, 111136. doi: 10.1016/j.oceaneng.2022.111136
Jiang (2017). Design and mechanical properties analysis of aquaculture net cage installed on jacket wind turbine base (Zhenjiang: Jiangsu University of Science and Technology).
Klebert P., Lader P., Gansel L., Oppedal F. (2013). Hydrodynamic interactions on net panel and aquaculture fish cages: a review. Ocean Eng. 58, 260–274. doi: 10.1016/j.oceaneng.2012.11.006
Kristiansen T., Faltinsen O. M. (2012). Modelling of current loads on aquaculture net cages. J. Fluids Structures 34, 218–235. doi: 10.1016/j.jfluidstructs.2012.04.001
Lader P. F., Enerhaug B., Fredheim A., Krokstad J. (2003). “September. modelling of 3D net structures exposed to waves and current,” in 3rd international conference on hydroelasticity in marine technology (Oxford, UK: Department of Engineering Science, The University of Oxford), (19–26).
Lader P., Fredriksson D. W., Guenther J., Volent Z., Blocher N., Kristiansen D., et al. (2015). Drag on hydroid-fouled nets–an experimental approach. China Ocean Eng. 29 (3), 369–389. doi: 10.1007/s13344-015-0026-y
Lehane B. M., Pedram B., Doherty J. A., Powrie W. (2014). Improved performance of monopiles when combined with footings for tower foundations in sand. J. geotechnical geoenvironmental Eng. 140 (7), 04014027. doi: 10.1061/(ASCE)GT.1943-5606.0001109
Li A. J., Liu Y. (2019). New analytical solutions to water wave diffraction by vertical truncated cylinders. Int. J. Naval Architecture Ocean Eng. 11 (2), 952–969. doi: 10.1016/j.ijnaoe.2019.04.006
Li Y., Liu Y., Teng B. (2006). Porous effect parameter of thin permeable plates. Coast. Eng. J. 48 (4), 309–336. doi: 10.1142/S0578563406001441
Liu Y. (2019). HAMS: A frequency-domain preprocessor for wave-structure interactions–theory, development, and application. J. Mar. Sci. Eng. 7, 81. doi: 10.3390/jmse7030081
Liu H. F., Bi C. W., Zhao Y. P. (2020). Experimental and numerical study of the hydrodynamic characteristics of a semisubmersible aquaculture facility in waves. Ocean Eng. 214, 107714. doi: 10.1016/j.oceaneng.2020.107714
Liu Y., Li Y. (2016). Predictive formulas in terms of keulegan-carpenter numbers for the resistance coefficients of perforated walls in jarlan-type caissons. Ocean Eng. 114, 101–114. doi: 10.1016/j.oceaneng.2016.01.007
Liu Y., Li H. (2017). Iterative multi-domain BEM solution for water wave reflection by perforated caisson breakwaters. Eng. Anal. Boundary Elements 77, 70–80. doi: 10.1016/j.enganabound.2016.12.011
Liu H., Zhang L., Chen H., Zhang W., Liu M. (2018). Wave diffraction by vertical cylinder with multiple concentric perforated walls. Ocean Eng. 166, 242–252. doi: 10.1016/j.oceaneng.2018.08.025
Ma C., Bi C. W., Xu Z. (2022). Dynamic behaviors of a hinged multi-body floating aquaculture platform under regular waves. Ocean Eng. 243, 110278. doi: 10.1016/j.oceaneng.2021.110278
Mackay E., Liang H., Johanning L. (2021b). A BEM model for wave forces on structures with thin porous elements. J. Fluids Struct. 102, 103246. doi: 10.1016/j.jfluidstructs.2021.103246
Mackay E., Shi W., Qiao D., Gabl R., Davey T., Ning D., et al. (2021a). Numerical and experimental modelling of wave interaction with fixed and floating porous cylinders. Ocean Eng. 242, 110118. doi: 10.1016/j.oceaneng.2021.110118
Ma M., Zhang H., Jeng D. S., Wang C. M. (2022). Analytical solutions of hydroelastic interactions between waves and submerged open-net fish cage modeled as a porous cylindrical thin shell. Phys. Fluids 34 (1), 017104. doi: 10.1063/5.0076659
Molin B. (2001). On the added mass and damping of periodic arrays of fully or partially porous disks. J. Fluids Struct. 15, 275–290. doi: 10.1006/jfls.2000.0338
Molin B. (2011). Hydrodynamic modeling of perforated structures. Appl. Ocean Res. 33 (1), 1–11. doi: 10.1016/j.apor.2010.11.003
Molin B., Legras J.-L. (1990). Hydrodynamic modeling of the Roseau tower stabilizer. in. Proc. 9th OMAE Conf. 1, 329–336.
Patursson Ø., Swift M. R., Tsukrov I., Simonsen K., Baldwin K., Fredriksson D. W., et al. (2010). Development of a porous media model with application to flow through and around a net panel. Ocean Eng. 37 (2-3), 314–324. doi: 10.1016/j.oceaneng.2009.10.001
Saghi H. (2019). A parametric study on wave–floating storage tank interaction using coupled VOF-FDM method. J. Mar. Sci. Technol. 24, 454–465. doi: 10.1007/s00773-018-0564-0
Saghi H., Mikkola T., Hirdaris S. (2022). ). A machine learning method for the evaluation of hydrodynamic performance of floating breakwaters in waves. Ships Offshore Structures 17 (7), 1447–1461. doi: 10.1080/17445302.2021.1927358
Sarpkaya T. (1986). Force on a circular cylinder in viscous oscillatory flow at low keulegan–carpenter numbers. J. Fluid Mech. 165, 61–71. doi: 10.1017/S0022112086002999
Sollitt C., Cross R. (1972). “Wave transformation through permeable breakwaters,” in 13th international conference on coastal engineering (New York: ASME) 1827–1846.
Suh K. D., Kim Y. W., Ji C. H. (2011). An empirical formula for friction coefficient of a perforated wall with vertical slits. Coast. Eng. 58 (1), 85–93. doi: 10.1016/j.coastaleng.2010.08.006
Swift M. R., Fredriksson D. W., Unrein A., Fullerton B., Patursson O., Baldwin K. (2006). Drag force acting on biofouled net panels. Aquacultural Eng. 35 (3), 292–299. doi: 10.1016/j.aquaeng.2006.03.002
Taylor G. (1956). Fluid flow in regions bounded by porous surfaces. Proc. R. Soc London Ser. A 234, 456–475. doi: 10.1098/rspa.1956.0050
Teng B., Zhao M., Li Y. C. (2001). Wave diffraction from a cylinder with porous upper wall and an inner column. Acta Oceanol. Sin. 23 (6), 133–142. doi: 10.3321/j.issn:0253-4193.2001.06.016
Tsukrov I., Eroshkin O., Fredriksson D., Swift M. R., Celikkol B. (2003). Finite element modeling of net panels using a consistent net element. Ocean Eng. 30 (2), 251–270. doi: 10.1016/S0029-8018(02)00021-5
Wang X., Li J. (2020). Parametric study of hybrid monopile foundation for offshore wind turbines in cohesionless soil. Ocean Eng. 218 (3), 108172. doi: 10.1016/j.oceaneng.2020.108172
Wang X., Li S., Li J. (2022). Load bearing mechanism and simplified design method of hybrid monopile foundation for offshore wind turbines. Appl. Ocean Res. 126, 103286. doi: 10.1016/j.apor.2022.103286
Wang X., Zeng X., Yang X., Li J. (2018). Feasibility study of offshore wind turbines with hybrid monopile foundation based on centrifuge modeling. Appl. Energy 209, 127–139. doi: 10.1016/j.apenergy.2017.10.107
Yang X., Zeng X., Wang X., Berrila J., Li X. (2019). Performance and bearing behavior of monopile-friction wheel foundations under lateral-moment loading for offshore wind turbines. Ocean Eng. 184, 159–172. doi: 10.1016/j.oceaneng.2019.05.043
Zhao F., Bao W., Kinoshita T., Itakura H. (2010a). Theoretical and experimental study on a porous cylinder floating in waves. J. offshore mechanics Arctic Eng. 133 (1), 11301. doi: 10.1115/1.4001435
Zhao F., Bao W., Kinoshita T., Itakura H. (2010b). Interaction of waves and a porous cylinder with an inner horizontal porous plate. Appl. Ocean Res. 32 (2), 252–259. doi: 10.1016/j.apor.2009.11.003
Zhao Y. P., Bi C. W., Dong G. H., Gui F. K., Cui Y., Guan C. T., et al. (2013). Numerical simulation of the flow around fishing plane nets using the porous media model. Ocean Eng. 62, 25–37. doi: 10.1016/j.oceaneng.2013.01.009
Zhao Y. P., Li Y. C., Dong G. H., Gui F. K., Teng B. (2007). Numerical simulation of the effects of structure size ratio and mesh type on three-dimensional deformation of the fishing-net gravity cage in current. Aquacultural Eng. 36 (3), 285–301. doi: 10.1016/j.aquaeng.2007.01.003
Zheng X. Y., Lei Y. (2018). Stochastic response analysis for a floating offshore wind turbine integrated with a steel fish farming cage. Appl. Sci. 8 (8), 1229. doi: 10.3390/app8081229
Appendix.
After truncating m to M and l to L, we can establish a set of matrix equations based on Equations (14) to (17).
From Equation (14), based on the orthogonal relationship , we can get
The matrix coefficients are given by
where “diag” indicates the matrix diagonalization of a vector. The integrals of the vertical eigenfunctions are given by
From Equation (15), based on the orthogonal relationship , we can derive
The matrix coefficients are expressed as
where the integral of the eigenfunction is defined as
From Equation (16), we can get
The matrix coefficients are expressed as
From Equation (17), we can get
The matrix coefficients are expressed as
Equations(i) to (iv) constitute a system of linear algebraic equations. All the unknown coefficients in the velocity potentials can be determined by solving this system of linear algebraic equations.
Keywords: hybrid wind turbine foundation, aquaculture cage, wave diffraction, hydrodynamic load, linear potential theory, eigenfunction expansion method
Citation: Zhu X, Dong G, Bi C and Zhao Y (2022) Wave diffraction of a hybrid wind turbine foundation with a double-layer aquaculture cage. Front. Mar. Sci. 9:1057419. doi: 10.3389/fmars.2022.1057419
Received: 18 October 2022; Accepted: 16 November 2022;
Published: 08 December 2022.
Edited by:
Wei-Bo Chen, National Science and Technology Center for Disaster Reduction(NCDR), TaiwanReviewed by:
Jinhai Zheng, Hohai University, ChinaHassan Saghi, University of Zagreb, Croatia
Bang-Fuh Chen, National Sun Yat-sen University, Taiwan
Xiaosen Xu, Jiangsu University of Science and Technology, China
Copyright © 2022 Zhu, Dong, Bi and Zhao. This is an open-access article distributed under the terms of the Creative Commons Attribution License (CC BY). The use, distribution or reproduction in other forums is permitted, provided the original author(s) and the copyright owner(s) are credited and that the original publication in this journal is cited, in accordance with accepted academic practice. No use, distribution or reproduction is permitted which does not comply with these terms.
*Correspondence: Chunwei Bi, YmljaHVud2VpQG91Yy5lZHUuY24=