 Lingyun Xu1,2
 Peng Li
95% of researchers rate our articles as excellent or good
Learn more about the work of our research integrity team to safeguard the quality of each article we publish.
Find out more
ORIGINAL RESEARCH article
Front. Mar. Sci. , 08 December 2022
Sec. Marine Fisheries, Aquaculture and Living Resources
Volume 9 - 2022 | https://doi.org/10.3389/fmars.2022.1055873
This article is part of the Research Topic Offshore Aquacultural Engineering and Its Interaction with the Marine Environment View all 18 articles
This paper aims to understand the drag coefficient discrepancy between the equivalent-twine and twisted-twine nets based on their wake and turbulence characteristics. To that end, we conduct unsteady Reynolds-averaged Navier-Stokes (URANS) and the second-moment (Reynolds stress, RSM) simulations at a Reynolds number, Re=4.5×10³, based on the effective diameter of the net twine, which corresponds to the subcritical flow regime. Then, the vortex structures and the turbulence statistics are assessed at AOA=90°. The results highlight that the wake interactions for the twisted-twine net are relatively strong compared to the equivalent-twine net, due to the disturbance of the helixes on the twisted twines. In comparison to the classical Karman vortex, the overall vortex shedding of these two nets is well organized. Symmetric vortices form behind the equivalent-twine net, while single vortices form behind the twisted-twine net. Moreover, the Reynolds normal and shear stresses show symmetric and anti-symmetric profiles. The addition of helixes to smooth circular cylinders changes the flow development, leading to a decrease of turbulence kinetic energy. With this understanding, engineers need to be carefully select the net type for preliminary design of marine aquaculture cages to avoid over- or underestimation of the drag forces.
Aquaculture farming is a sustainable method that provides food to the increasing world population. Aquaculture farms are growing in size and open-ocean farming is becoming more favorable. However, the harsh oceanic conditions in the open ocean place significant demands on the farming-system designs. Aquaculture cages must be designed to withstand harsh conditions and to provide a dependable habitat for the farmed fish. As such, it is vital to understand the hydrodynamic interactions between ocean environmental loads, for this will help improve the design of aquaculture nets/systems.
According to (Xu and Qin, 2020), physical model tests and field measurements have been conducted to understand hydrodynamic behaviors of net panels and aquaculture systems in steady flow (Bi et al., 2013; DeCew et al., 2013; Klebert and Su, 2020; Tang et al., 2021), oscillating flow (Liu et al., 2012) and waves (Fredriksson et al., 2003; Fredriksson et al., 2004; Lader et al., 2007; Zhao et al., 2008; Park et al., 2021). Many experimental tests examined the biofouling effects on net panels (Swift et al., 2006; Bi et al., 2018; Bi et al., 2020). These experimental studies evaluate hydrodynamic behaviors of net panels based on the angle of attack, α, the solidity ratio, Sn, and the Reynolds number, Re. The physical model approach requires wave basins, instruments and certain similarity principles. The opposing numerical approach was used to analyze the hydrodynamic performances of net panels and aquaculture cages in current and waves. These include the finite element method (Tsukrov et al., 2000; Tsukrov et al., 2003; Tsukrov et al., 2005; Fredriksson et al., 2007; Fredriksson et al., 2014; Cheng et al., 2021; Su et al., 2021), the computational fluid dynamics method (Patursson et al., 2010; Zhao et al., 2013a; Zhao et al., 2013b; Chen and Christensen, 2016; Bi et al., 2018) and the coupled fluid-structure interactions (FSI) method (Bi et al., 2014a; Chen and Christensen, 2017; Martin et al., 2020).
In the finite element method (FEM) framework, the net is modeled with triangular/truss elements or mass-spring systems. Priour (2003) developed a triangular element model to calculate the fluid forces acting on net panels. The results revealed that the triangular element model presented a reasonable representation for the net deformation. Tsukrov et al. (2003) modeled the net panel using an equivalent truss element method. When applied to a tension-leg cage, the extreme environmental loading caused large deformations but moderate tensions. Lader and Fredheim (2006) studied the dynamic properties of a flexible net panel when exposed to waves and current using a screen model. Their results highlighted that the slack caused by floater motion led to large dynamic forces in the bottom of the net structure. Zhao et al. (2008) used a lumped-mass model to approximate the net panels under current and waves. The results showed that the lumped-mass model could accurately predict the hydrodynamic behavior of the net panels in waves. The FEM-based models are computationally efficient, because they use a grouping mesh method. However, due to the absent interference of the flow field these FEM models overestimated the drag force of the net.
In order to examine the flow field and velocity distribution around and inside the net cages, the CFD-based porous media model was developed. For instance, Patursson et al. (2010) studied the fluid characteristics of a net panel under steady flow. A mean normalized absolute error of 6.2% between measured and modeled data was discovered. Zhao et al. (2013a); Zhao et al. (2013b) investigated the flow field around net panels using the porous media model. Their results showed that, when the number of net panels reached five, the velocity reduction from the downstream net panel was 42%. To examine the fluid forces and wave attenuation of the biofouling net cages, the porous media model was used (Bi et al., 2018). Their results revealed that the biofouling accumulation led to 10 times the hydrodynamic loads on nets. The porous media model was used to study the porous resistance coefficients of fishing net cages (Chen and Christensen, 2016). The relevant achievements have been applied to a floater-net system under both waves and current conditions (Chen and Christensen, 2018).
To examine the interactions between steady flow and the flexible nets the structural model (e.g., lumped-mass model) was used in conjunction with the porous media model (Bi et al., 2014a). Their coupled FSI model assumed that the steady-state condition was satisfied at each iteration. Chen and Christensen (2017) conducted the FSI analysis of an aquaculture net under steady flow. The FSI model coupled the porous media model and the lumped-mass structural model. Tu et al. (2020) examined the fluid-structure interaction of a net panel under current using the lattice Boltzmann method. The results indicated that the flow-velocity attenuation was mainly dependent on the net solidity. Martin et al. (2020) developed a Lagrangian approach for the coupled simulation of fixed net panels in a Eulerian fluid model. In contrast to the porous media model, the net was represented by the Lagrangian points. The Reynolds-averaged Navier-Stokes equations were solved in a Eulerian fluid domain. Most recently, a coupled fluid-structure partitioned scheme was used to examine the wake characteristics induced by the net deformation (Xu et al., 2022).
The finite element model, the porous media model and the FSI model have all significantly advanced the numerical modeling for aquaculture systems. However, there remains several issues that still need to be resolved. These are:
(1) Almost all the aquaculture nets/cages in numerical simulations are approximated by a system of equivalent cylinders. Hence, they neglect the helixes of the net twines. However, it still remains unclear how these helixes influence the general wake and turbulence characteristics of a net/cage.
(2) The use of the porous media model to approximate the aquaculture nets/cages risks influencing results so that they tend to a constant pressure zone, rather than a natural pressure drop. Also, the specific flow field of the individual net twines is missing. These drawbacks of the porous media model should be resolved, and the specific flow field of the individual net twines requires further explorations.
(3) During the CFD simulations, the Boussinesq hypothesis-based two-equation turbulence models, namely the k - ε and k - ω models, have been used to ascertain the underlying turbulence mechanisms of the aquaculture nets/cages. However, the selection of the turbulence models seems random.
Having considered these issues, we decided to model a piece of the aquaculture net using the natural helical net twines rather than approximations, as shown in Figure 1. The use of a representative net panel, could reduce the computational cost without losing the physical properties of the cage. For the purposes of this study the net modeled by the natural helical net twines is referred to as the twisted-twine net, and the equivalent-twine net means the net is approximated by a system of smooth cylinders. A subcritical Reynolds number Re = 4.5 × 10³ is selected based on the effective diameter of the net twine (McKenna et al., 2004; Evans and Ridge, 2005; Lader et al., 2015). The effects of helixes on the wake and turbulence characteristics of the nets, the specific flow field of the net twines, and the comparison of the turbulence models are all assessed.
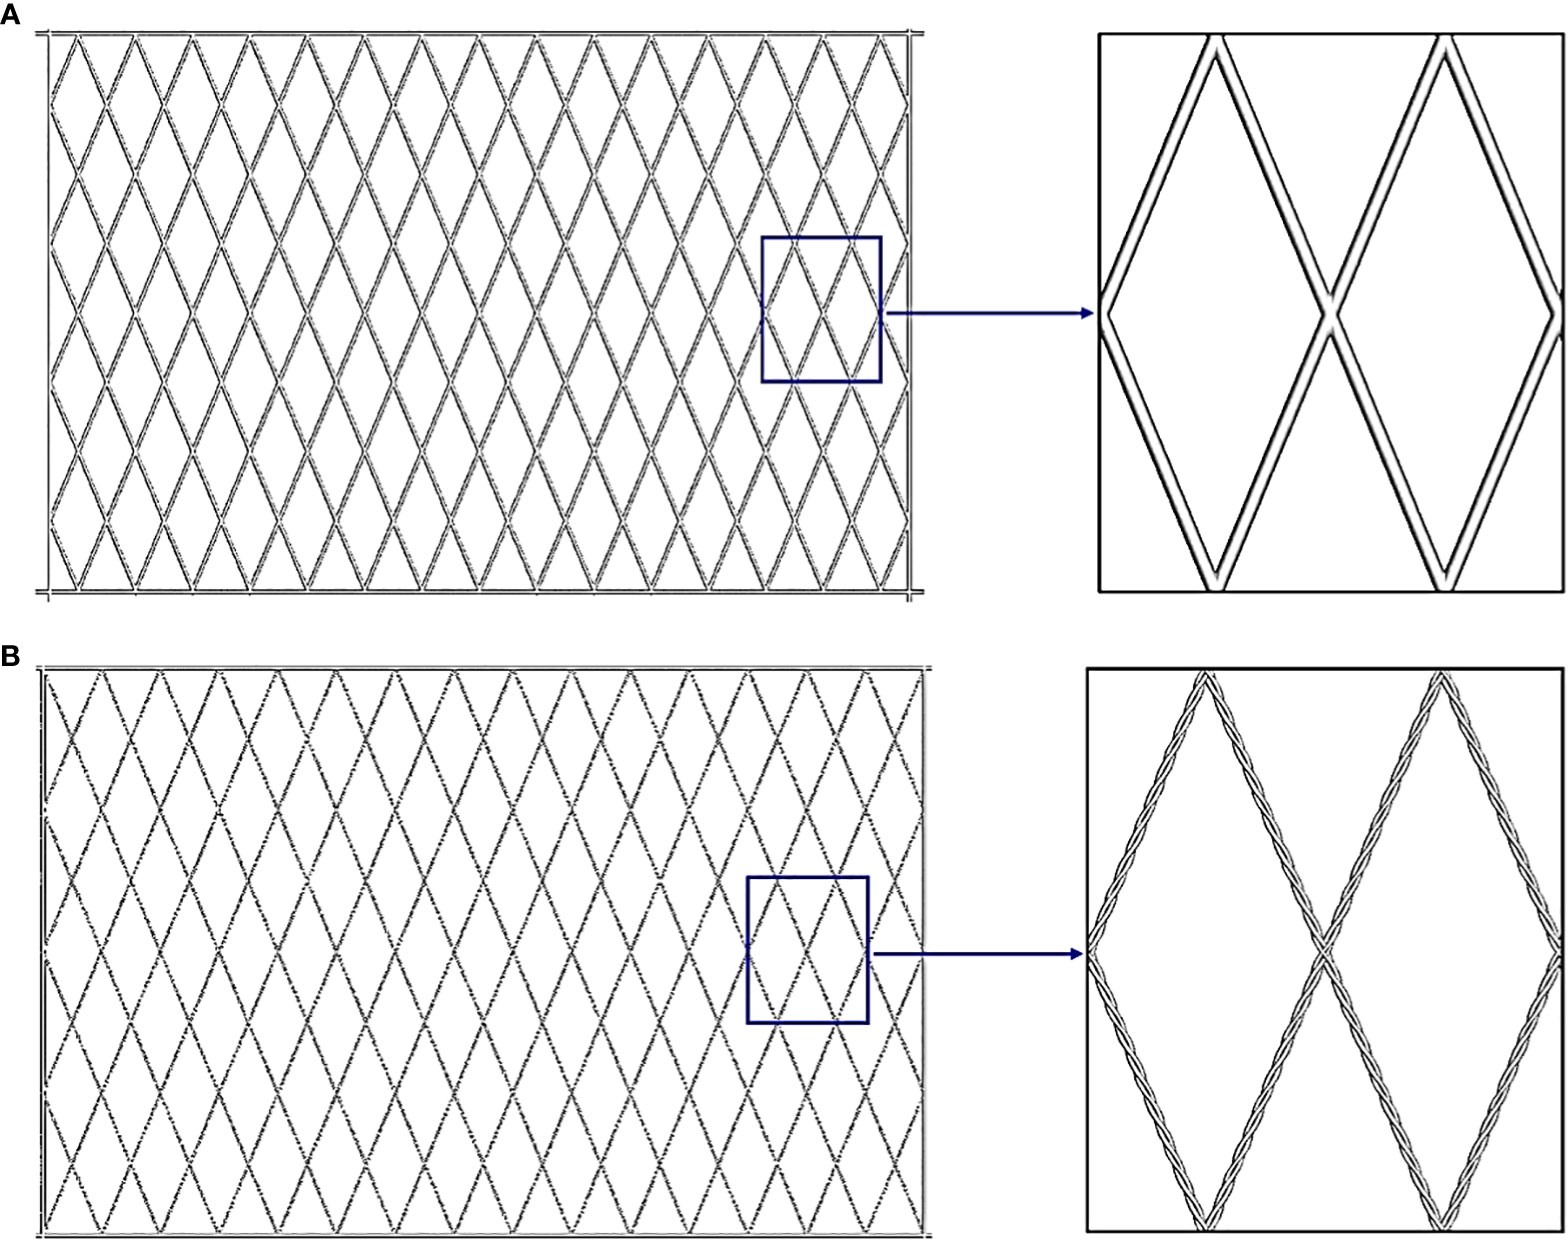
Figure 1 The representatives of the net panels, (A) the equivalent-twine net and (B) the twisted-twine net.
The remainder of this paper is organized as follows. Firstly, we summarize the turbulence models used for evaluating flow characteristics of aquaculture nets/cages in Section 2. The strengths and weaknesses of each two-equation turbulence model are evaluated and compared. In Section 3 the governing equations and numerical solutions for the present study are outlined. Section 4 elaborates on the verifications of the present numerical method. The drag force, the second-order turbulence statistics are verified for both smooth and twisted bodies. Section 5 presents the numerical results regarding the effects of the helixes of net twines. Finally, the conclusions of this paper are presented in Section 6.
Previously, all turbulence models used for evaluating flow characteristics of aquaculture nets/cages have been based on the Reynolds-averaged Navier-Stokes (RANS) framework. The primary purpose of turbulence modeling in RANS is to prompt equations that anticipate the time-averaged variables without calculating the complete turbulent flow as a function of time. Two groups of turbulence models, namely the k - ε models (Patursson et al., 2010; Zhao et al., 2013a; Zhao et al., 2013b; Bi et al., 2014a; Bi et al., 2014b; Winthereig-Rasmussen et al., 2016; Yao et al., 2016; Bui et al., 2020) and k - ω models (Tang et al., 2017), have been used for the preliminary estimation of flow around and inside aquaculture cages. However, for evaluating the flow field of aquaculture nets/cages, there is no such criterion to distinguish the applications of these turbulence models. Therefore, it is essential to compare these turbulence models to predict flow characteristics of aquaculture net structures precisely. We summarize the turbulence models applied to flow through aquaculture nets/cages in Table 1.

Table 1 Summary of turbulence models applied to flow through aquaculture nets/cages.
Reynolds numbers, illustrated in Table 1, reveal that the flow behind the nets is developed as turbulent flow (Zdravkovich, 1997). The turbulence kinetic energy k and the dissipation rate ε/ω shown in Table 1 are directly given by values (Patursson et al., 2010; Zhao et al., 2013a; Zhao et al., 2013b; Winthereig-Rasmussen et al., 2016), or they can be dependent on empirical formulae (Bi et al., 2014a; Bi et al., 2014b; Yao et al., 2016; Tang et al., 2017; Bui et al., 2020). I and lτ are the turbulence intensity and the turbulence length scale. These are denoted as (ANSYS, 2017)
where ReD is the Reynolds number based on the hydraulic diameter of the domain, LC is the characteristic length of the object. The turbulence intensity is dependent on the Reynolds number, and it significantly affects the turbulence kinetic energy k. However, the Boussinesq hypothesis assumes that the fluctuation velocity is isotropic, and the turbulence intensity is specified (Wilcox, 1998).
When using the medium turbulence parameters for k and ε, it was found that CFD simulations underestimated the drag coefficients and the velocity deficit much more than experiments did. These discrepancies could be attributed to the turbulence parameters used in the simulations. However, this could also be due to the resistance coefficients of the porous media. Despite the discrepancies, comparable results between CFD predictions and experimental measurements were obtained using values between the high and medium turbulence parameters. The coupled FSI models slightly underestimated the drag coefficients and velocity reductions of the nets. The turbulence parameters were calculated based on empirical formulae (Bi et al., 2014a; Bi et al., 2014b; Yao et al., 2016). Higher turbulence intensities should be responsible for underestimating hydrodynamic forces since the turbulence intensity from Table 1 is in a range of 2.2%−8%. In order to avoid over- or under-estimations it is recommended that the turbulence parameters, k and ε/ω should be selected based on field measurements.
The turbulence models have been used to resolve conditions such as transition in wake and transition in shear layers. According to (Wilcox, 1998), the equation of ε in the standard k - ε model is postulated, and it is not feasible for no-slip wall conditions along net twines. The realizable k - ε model was improved to modify the equation for ε, by introducing the effect of the mean flow distortion on turbulence dissipation. However, the difficulty has also been encountered when solving the epsilon equation. To accurately model the near-wall interaction the standard k - ω model was developed. This model performs better than the k - ε model in predicting the near-wall interactions. However, the model over-predicts shear stress and has issues with free stream flows. In addition, it is also susceptible to inlet boundary conditions. In comparison to the k - ε model, the standard k - ω model is more challenging to reach convergence. The shear stress transport (SST) k - ω model has gained popularity due to its excellent ability to predict separation and reattachment. This is achieved through the use of a blended function based on wall distance. The SST k - ω model works like k - ε model in the far field and like the standard k - ω model in the near-wall region. The wall damping effect that has been considered in (Tang et al., 2017) increased the grid number and left the turbulence intensity effect uncertain. As a result, the SST k - ω model overestimated the drag coefficients by 6.82% compared to the experimental data.
Furthermore, the CFD simulation results can also be affected by the near-wall treatment. The near-wall treatment can be attended with either the wall function or the near-wall model approaches. However, this is dependent on whether the wall function has been used or not. The use of the wall function reduces the computational cost, but the boundary layer profiles are assumed to be near equilibrium. In contrast, the near-wall model approach abandons the wall function, instead it modifies the wall with refined grids to capture transitions within the near-wall region. The near-wall model approach significantly improves the accuracy but raises a lower computational efficiency. A significant number of the studies in Table 1 use standard wall function, this makes the turbulent quantities less accurate. It is recommended that one should carefully select the wall functions to avoid resolving the near-wall layer and losing accuracy. In addition, the near-wall model approach is recommended if the computational resources are affordable. This paper uses the near-wall model approach with refined grids in the near-wall region.
It can be concluded that (1) The k - ε model underestimated the drag coefficients and the velocity reduction, while the SST k - ω model overestimated the drag coefficients. (2) Boussinesq hypothesis-based two-equations turbulence models lose accuracy due to assumption. Consequently, the accuracy may be improved if the turbulence parameters of k and ε/ω could be selected based on field measurements. (3) The near-wall treatment or other advanced techniques should be addressed to resolve the near-wall region and gain accurate results.
In this paper we consider two diamond-mesh net panels with the dimension of 0.6m (length)×0.4m (height), as shown in Figure 2. The flow field and the drag force on a net panel are influenced by three parameters. These are the angle of attack, α, the solidity ratio, Sn, and the Reynolds number, Re. For the diamond-mesh nets, the solidity ratio represented by the hang ratios, E1 and E2, is defined as (Fredheim, 2005).
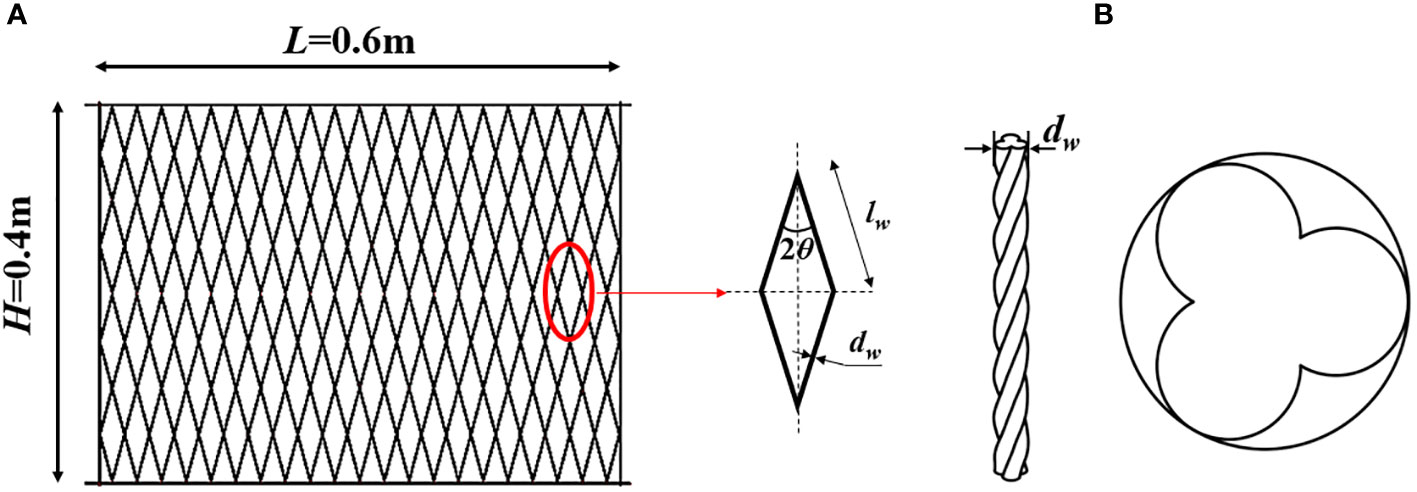
Figure 2 Geometric description of the net panel. (A) The overall geometry and (B) twisted twine and its cross-section. The effective diameter of the twisted twine is the diameter of the circumcircle (McKenna et al., 2004; Evans and Ridge, 2005; Lader et al., 2015).
Here, Ap and A are the projected and the outline areas of a net panel. dw is the diameter of the net twine, lw represents the length of the mesh bar. The hang ratios, E1 and E2, represent the diamond shape of a mesh and are functions of the mesh opening angle, 2θ, they can be denoted as (Fredheim, 2005)
Where L and H represent the length and height of the net panel, NH and Nv are mesh numbers in horizontal and vertical directions.
As shown in Figure 2, the effective twine diameter dw is 3mm. The hang ratios E1 and E2 can be adjusted by changing the mesh opening angle. In this manner, the hydrodynamic behaviors of diamond-mesh net panels can be examined in either a tensive or a loose condition. In this paper, 2θ = 45°, corresponds to solidity of 0.16, and was specifically selected for the numerical studies.
This paper conducts incompressible unsteady Reynolds-averaged Navier-Stokes (URANS) simulations using ANSYS Fluent (ANSYS, 2017). To effectively capture the unsteady flow effect induced by the wall-shear stress with respect to free stream velocity, the boundary layer needs to be resolved. The low Reynolds number near-wall turbulence modeling (e.g., URANS) seems suitable for this purpose (Palkin et al., 2016). On the other hand, as a physics-based low-fidelity simulation model, URANS is a computationally cheap representation of the high-fidelity such as large eddy simulations (LES). For the incompressible, viscous flow, the URANS equations regarding the conservation of mass and momentum are
where represents the time-dependent mean velocity, ρ is the fluid density, v is the kinematic viscosity of the fluid, is the pressure, is the fluctuation velocity, i, j=1, 2, 3 (x, y, z), is the Reynolds stress.
The Reynolds stress turbulence model (Versteeg and Malalasekera, 2005), which is beyond the Boussinesq hypothesis, is used to resolve the six independent Reynolds stresses concerning the Reynolds stress transport equation and the dissipation rate of the turbulent kinetic energy as follows,
where , the production Pij is expressed as
Here, The lower case ‘k’ signifies the turbulent kinetic energy, and is fluctuating velocity related to the turbulent kinetic energy, xk is the position in the local coordinate system of the eddy. σk is the turbulent Prandtl number, σk = 1.0, C1 = 1.8 and C2 = 0.52 are constants that specified for the present case (Pope, 2001; Versteeg and Malalasekera, 2005).
The dissipation rate of the turbulent kinetic energy ε is calculated by
where the constants are σϵ = 1.3,Cϵ1 = 1.44 and Cϵ2=1.92.
The Reynolds stress turbulence model (RSM) is particularly successful in reproducing the growth rate of the turbulence kinetic energy in the initial shear layer. As RSM naturally accounts for the stress anisotropy and phase lag between the stress and strain eigenvectors (Palkin et al., 2016). It has been used to predict the separation-induced transitions (Versteeg and Malalasekera, 2005; Yu and Yuan, 2014). The present study does not use wall functions because the RSM is free from any surface topography (Palkin et al., 2016).
Two non-dimensional parameters relevant to the present flow problems are given as follows:
Here, U∞ is the free stream velocity, CD represents the mean drag coefficient of the net panel, and Ap is the projected area. The Reynolds number calculated in Eq. (10) is based on the effective diameter of the net twine, as can be seen in Figure 2.
This work uses the non-dimensional computational domain with hexahedral grids. As exhibited in Figure 3, this domain uses the symmetry of the problem and is set as 2000dw (length) × 1000dw (width) × 1000 dw (height) for the model (Lange et al., 1998; Bi et al., 2014a; Bi et al., 2017), dw is the effective diameter of the net twine, which can be found in Figure 2 or from (McKenna et al., 2004; Evans and Ridge, 2005; Lader et al., 2015). We set the left and right sides of the domain as velocity inlet and pressure outlet. The pressure condition is set as zero normal pressure gradient at the inlet boundary. At the outlet boundary, the velocity condition is specified as zero normal gradient boundary conditions. Top, bottom, front and back sides are implemented as symmetry boundaries. To model an undisturbed flow channel slip, no slip walls are imposed on the net panel.
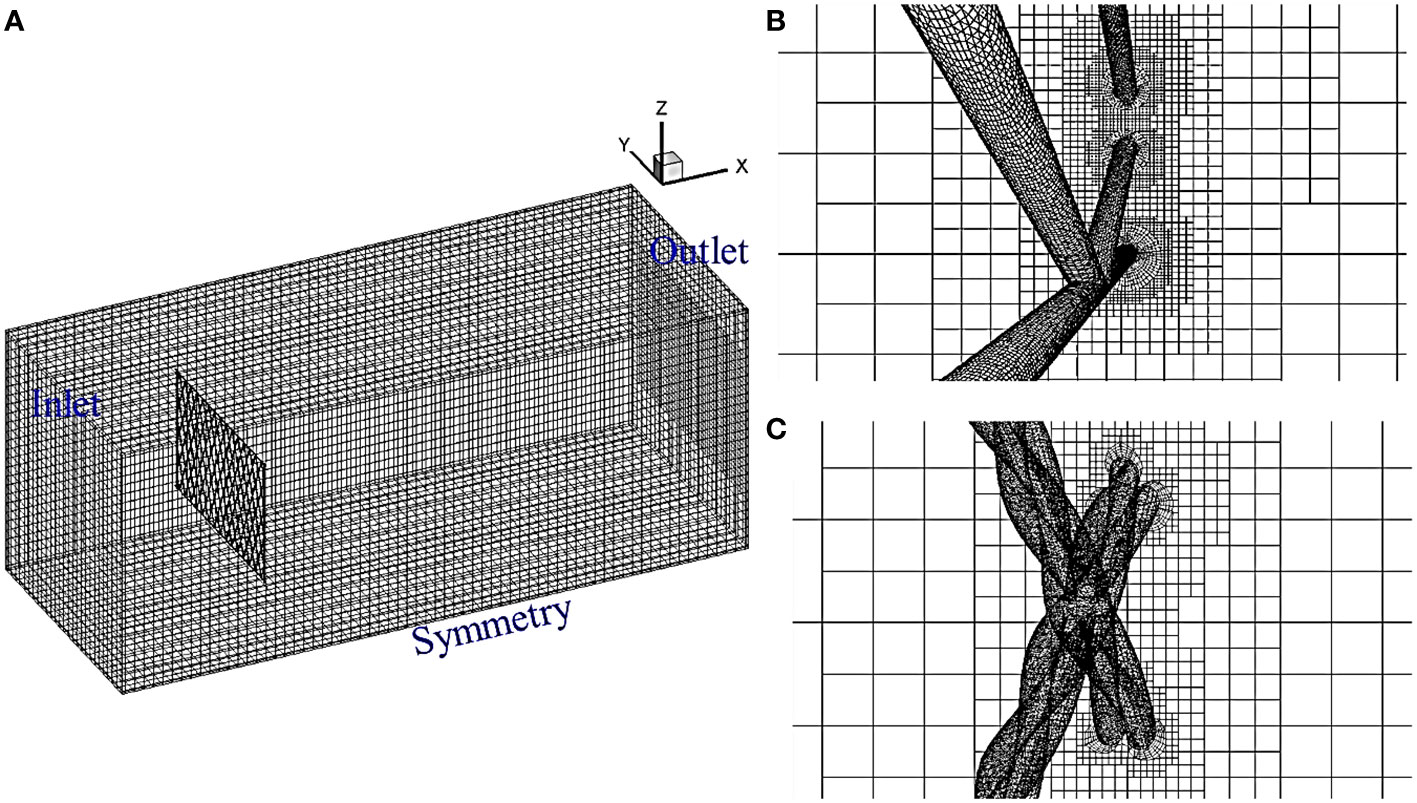
Figure 3 The schematics of the computational domain and the hexahedral grids. (A) The overall computational domain, (B) and (C) zoom-in views and prism layers around the net twines.
The domain is divided into the background and the refined regions. The refined region signifies the net panel and is surrounded by the background region. The prism captures the near-wall turbulent flow characteristics around net twines. For the equivalent-twine net, the height of the first prism layer, is dependent on the flow velocity (Reynolds number), is set as 3 × 10⁻³dw, dw = 3 × 10⁻³m. Whereas, for the twisted-twine net, the height of the first prism layer is 2 × 10⁻³dw. With 15 prism layers being applied to each net, the total grid numbers of the computational domain are maximally 13.6 million for the equivalent-twine net and 19.9 million for the twisted-twine net.
We use the finite volume method (FVM) with structured grids to discretize the governing equations. The coupled scheme is implemented for pressure-velocity coupling. The discretization of the convective terms is conducted by the semi-implicit method for pressure-linked equations (SIMPLE) scheme. The spatial discretization of the pressure and momentum is conducted via second-order and second-order upwind differencing schemes. The specific dissipation rate and Reynolds stresses are discretized using the first-order upwind scheme. The time step is 5 × 10⁻³dw, dw~O(10-3) to the Reynolds number. We begin with some low inflow turbulence to initialize the turbulence equations. For instance, the initial turbulence intensity of 2.2% and vt/v ≈ 5 are used in the present study (Wilcox, 1998; Pope, 2001; Palkin et al., 2016). Once the turbulence field (e.g., eddy viscosity or turbulent stresses) is well established, the inflow turbulence is then switched off.
This section conducts URANS and RSM simulations at subcritical Reynolds to verify the present flow solver. Two cases have been examined; these are (1) flow past a circular cylinder, (2) grid independence studies for equivalent- and twisted-twine nets. The specific physical questions raised in this section are:
i. What is the suitable grid strategy for flow past the aquaculture net?
ii. What are the dynamics of the shear layer and how does it affect the very near wake?
iii. How does the coherent motion affect the mean flow and the Reynolds stresses?
To address these questions, hydrodynamic characteristics and turbulence statistics of these structures are reported. Particularly, comparisons are conducted between smooth and twisted structures to gain insights into the first- and second-order turbulence statistics.
Flow past a smooth circular cylinder (referred to as flow past a circular cylinder) has been considered a classical problem in flow mechanics for centuries (Zdravkovich, 1997). There has been a surge in the numerical modeling of flow past a circular cylinder using various numerical simulations with the rapid growth of computing power. The purposes of investigating flow past a circular cylinder including (Jiang and Cheng, 2021)
(1) Resolving fundamental flow behaviors, e.g., flow structures, wake characteristics, turbulence statistics and hydrodynamic forces.
(2) Guiding practical applications, e.g., flow control (Choi et al., 2008; Yan et al., 2018), vortex-induced vibration (Williamson and Govardhan, 2004; Gsell et al., 2018).
(3) Testing the accuracy and robustness of new numerical methods and schemes.
The most well-studied case among different Re values is Re=3900, where flow characteristics and numerical findings have been reported extensively (Jiang and Cheng, 2021). It is worth mentioning that Parnaudeau et al. (2008) studied the flow past a circular cylinder at Re=3900 based on PIV experiments and LES. The experimental results suggested that the wake recirculation length, Lr, serves as the best indicator for determining the accuracy of the numerical simulation. Therefore, the present numerical results have been compared against the experimental results from (Parnaudeau et al., 2008); these include the hydrodynamic characteristics and the turbulence statistics. Three different grids based on the rectangle computational domains (Figure 4) are used in the present study for flow past circular cylinder to study the grid independence, as shown in Table 2.

Figure 4 Computational domain and the prism layers for circular and twisted cylinders.
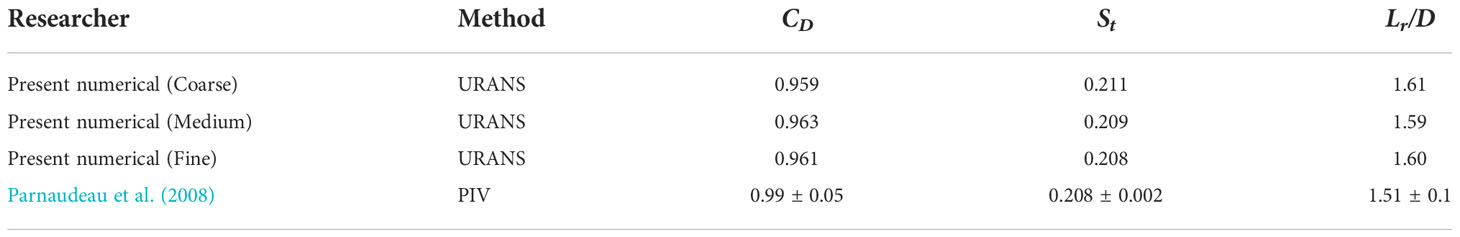
Table 2 Grid independence study of flow past a circular cylinder at Re = 3900.
In the present study, the rectangle computational domain is (30D) length × (20D) width × (20D) height, as shown in Figure 4. The grid numbers for three different domains are 1.8million, 2.6 million and 3.3 million, respectively. From Table 2, we see that the overall drag coefficient is smaller than the experimental measurement (e.g., ⪅2.7% variation in CD), but the Strouhal number and the wake recirculation length is larger than the experimental measurement (e.g., ⪅1.4% variation in St and ⪅6.6% variation in Lr). The hydrodynamic forces and wake recirculation length show that the flow solver is not sensitive to the grids. We use a Medium grid to further examine the second-order turbulence statistics along the wake centerline at three typical locations of x/D = 1.06, 1.54 and 2.02, as exhibited in Figure 5. Considering the computing efficiency and convergence, statistics are acquired throughout 30 vortex shedding cycles.
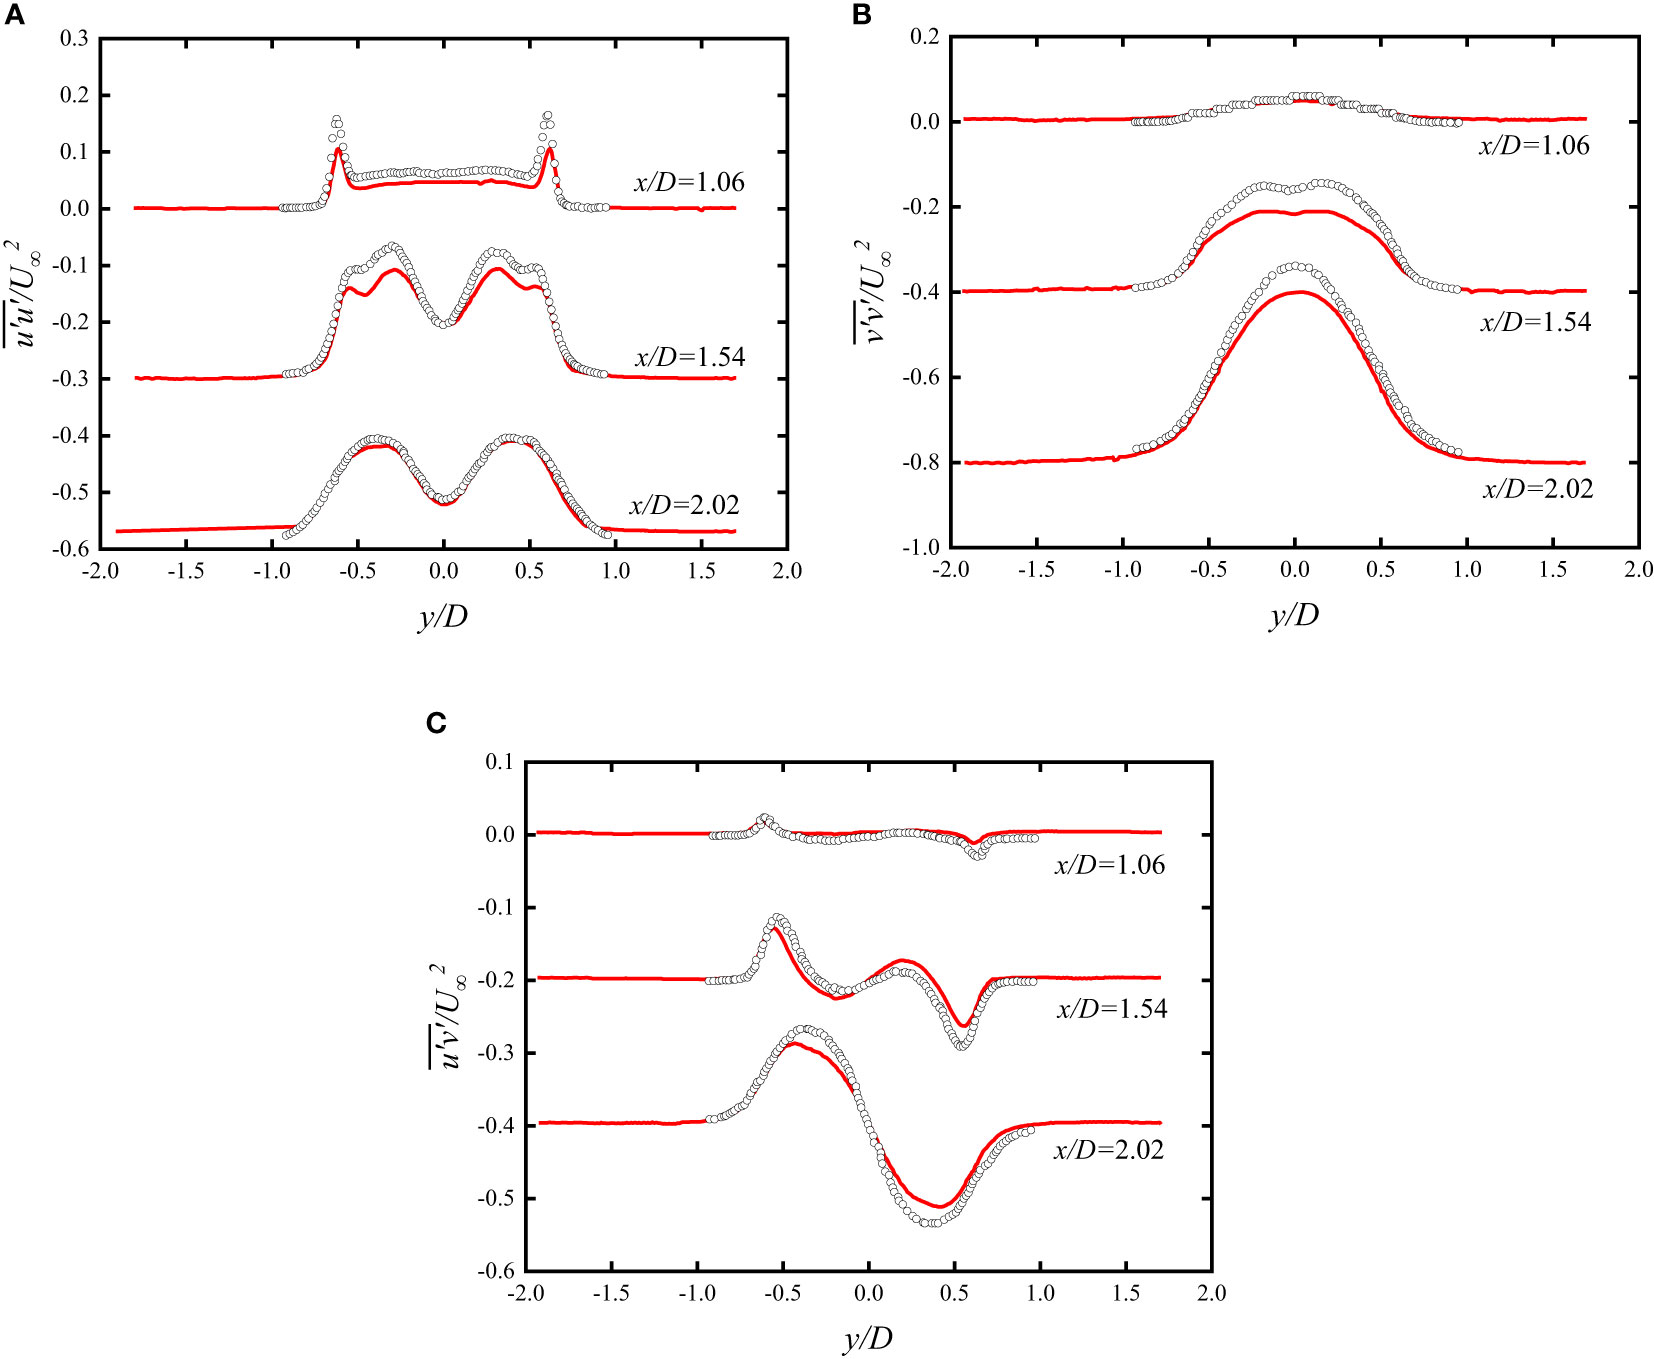
Figure 5 Normal and shear Reynolds stress component profiles for circular cylinders at Re=3900. (a) The variance of the streamwise velocity fluctuations ¯(u'u')/U_∞2. (b) Variance of the transverse velocity fluctuations ¯(v'v')/U_∞2. (c) Covariance of the velocity fluctuations ¯(u'v')/U_∞2. The solid red curve represents the present URANS simulation; empty black circles are experimental data reproduced from (Parnaudeau et al., 2008).
Figure 5 shows the present mean velocities and fluctuations at Re = 3900 in comparison with the experimental results from (Parnaudeau et al., 2008) at three x-locations in the very near wake (x/D≤3). The profiles in Figure 5A show a typical double-peak shape, mostly caused by the symmetrical shear layer transition. The present study has the same shape as the experiments of (Parnaudeau et al., 2008) at three selected positions. The peak values of at x/D = 1.06 and 1.54 are slightly lower than the experiments of (Parnaudeau et al., 2008), while a perfect match is found at x/D = 2.02. The profiles approach peak values at y/D = 0 as shown in Figure 5B, and the peak value increases alongside the downstream distance. The discrepancy exists between the present numerical simulations and experiments from (Parnaudeau et al., 2008). This discrepancy is mainly attributed to the transition of the shear layer. The show anti-symmetric profiles and the present numerical results are close to the experiments from (Parnaudeau et al., 2008). Overall, the present numerical results show a good agreement with the experiments of (Parnaudeau et al., 2008), demonstrating the accuracy and robustness of the present URANS approach in simulating flow past a circular cylinder. In particular, the present numerical approach has sufficient accuracy for predicting the first-order statistics at Re = 3900.
The equivalent-twine and twisted-twine nets characterized with the twine diameter dw=3mm and Sn = 0.16 are selected to evaluate the grid sensitivity and numerical accuracy. This study examines different computational domains and y+, as illustrated in Table 3. The domain dimension increases exponentially with a factor of , and the values of y+ are adjusted around 1.0. The testing free stream velocity remains 1m/s, and the corresponding Reynolds number is 3000. CD represents the mean drag coefficient and is calculated based on Eq. (11).
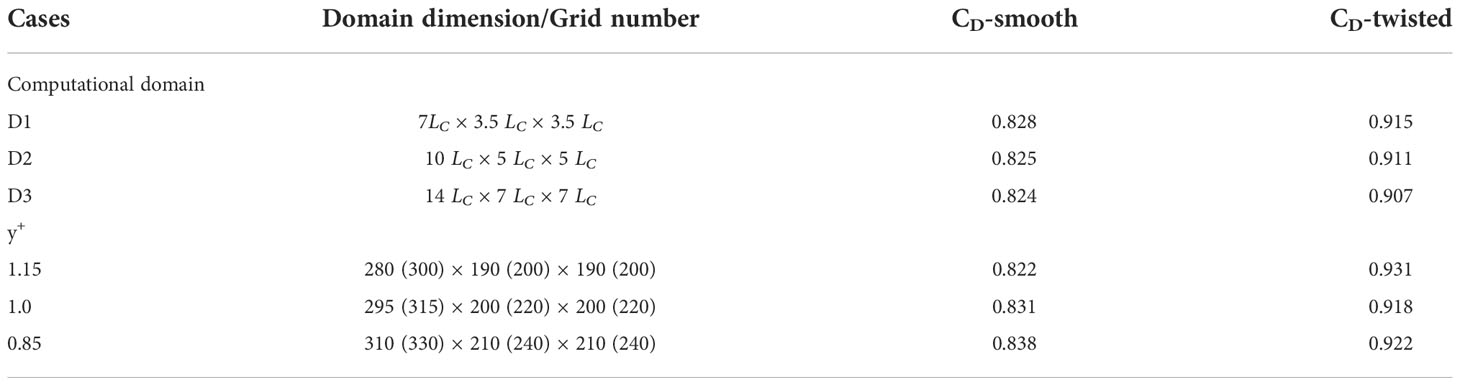
Table 3 Grid independent study at different domains and y+.
The numbers in the parentheses represent the grid numbers for twisted nets. Table 3 shows that the effect of domain dimension on the drag coefficient seems insignificant. However, a higher CD has been witnessed when using D1 as the computational domain. This indicates that CD could be slightly overestimated if the domain is relatively small. CD is obtained to verify the grid sensitivity at the near-wall region (e.g., y+). The results show that the grids in the near-wall region affect the CD; thus, the grids in the near-wall region should be resolved carefully. Overall, the grid convergence is satisfied after the comparison of drag coefficients.
We see that the drag coefficients for twisted-twine nets (i.e., CD-twisted) are larger than that of the equivalent-twine nets (i.e., CD -smooth); this is also evident from (Tsukrov et al., 2011 and Wang et al., 2021). Eventually, the D2 domain and y+ = 1 are used to verify the present numerical solver. The numerical predictions are compared with the experimental results of a yellow brass Chain-link diamond netting from (Tsukrov et al., 2011) and a four-strand braided diamond netting (i.e., ultra-cross knotless netting) from (Zhou et al., 2015). The twine diameter and the solidity of the yellow brass Chain-link diamond netting are 4 mm and Sn = 0.18; for the four-strand braided diamond netting, the solidity is 0.16. The samples of the netting are shown in Figure 6, and the comparisons of the drag coefficients for equivalent-twine and twisted-twine nets are exhibited in Figure 7.
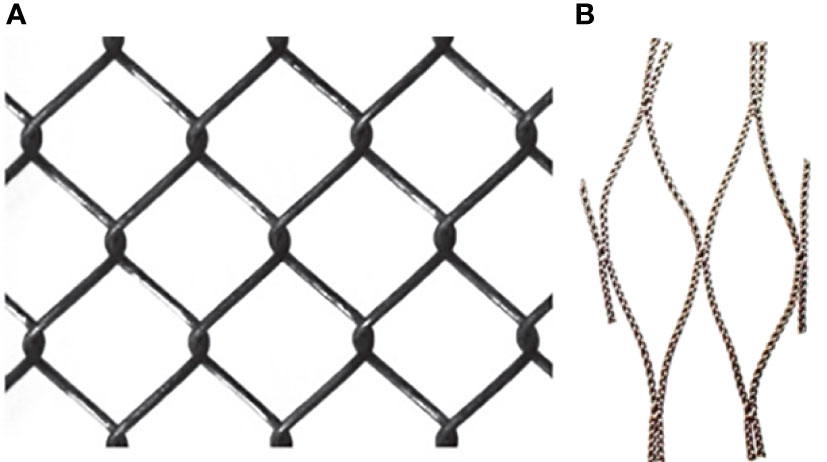
Figure 6 The samples of the netting. (A) The yellow brass ChainLink diamond netting, reproduced from (Tsukrov et al., 2011). (B) The four-strand braided diamond netting, reproduced from (Zhou et al., 2015).
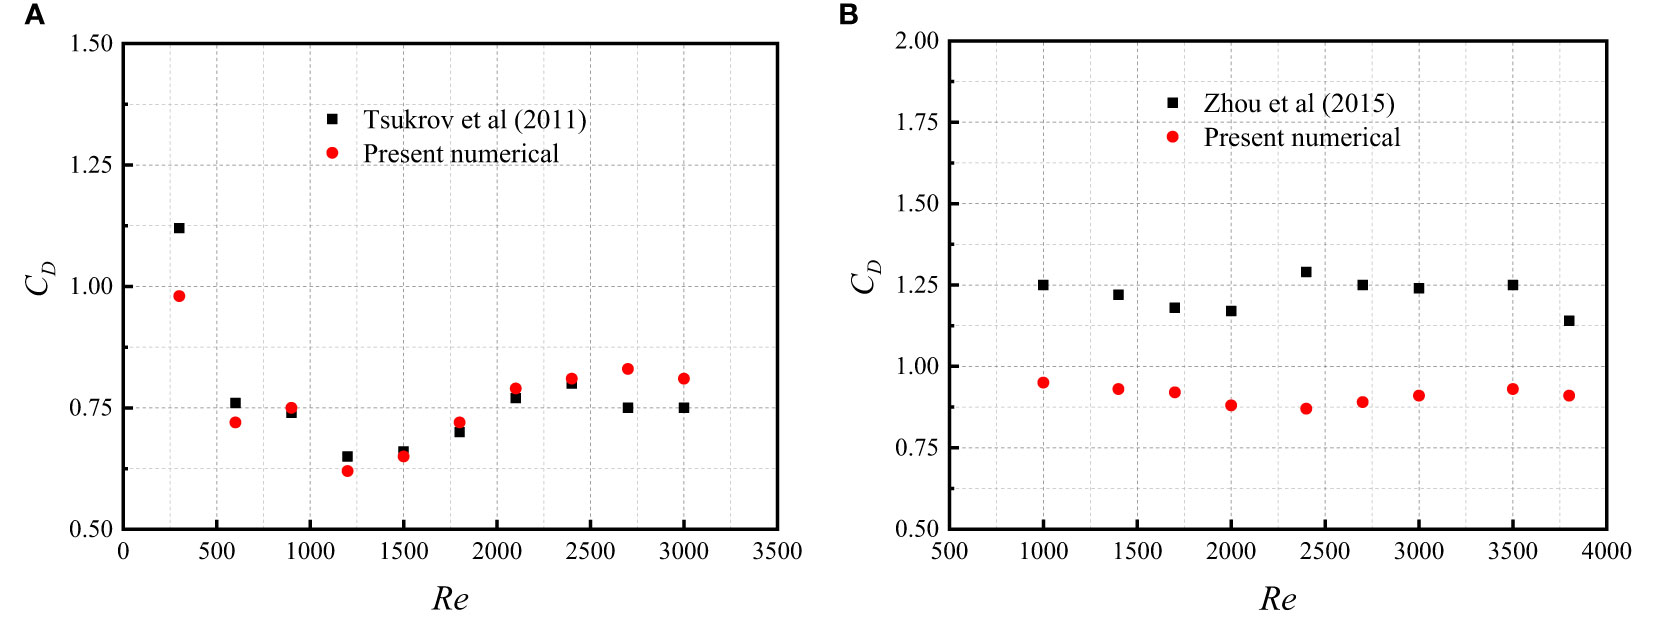
Figure 7 The dependence of drag coefficient on the Reynolds number. (A) Drag coefficients of the yellow brass ChainLink diamond netting. (B) Drag coefficients of four-strand braided diamond netting.
Figure 7A reveals that the comparative results of drag coefficients for the yellow brass Chain-link diamond netting are close to each other (e.g., ⪅12.7% variation in CD). However, the drag coefficients obtained from the present numerical simulations are overall smaller than that in (Zhou et al., 2015), as shown in Figure 7B. It is worth mentioning that in their study, Zhou et al. (2015) examined a four-strand twisted netting, which is slightly different from what we study in the present work, because in our study a three-strand netting is used. In addition, Zhou et al. (2015) also claimed that two-strand netting showed a lower drag coefficient in comparison to that of the three-strand, even though the two-strand netting owns a larger solidity. Hence, it is reasonably established in Figure 7B that the drag coefficient of the present three-strand twisted netting is lower than that of the four-strand from (Zhou et al., 2015). In summary, alongside the angle of attack, the Reynolds number and the solidity, structure patterns such as woven type of the net twines also significantly affect the drag coefficient of the netting.
Verifications in this section demonstrate that the present URANS framework is valid in predicting flow past smooth and twisted bodies regarding cylinders and nets. Particularly, it is more compatible in predicting second-order turbulence statistics. Next, we will provide specific wake and turbulence characteristics of the target nets since the verifications have been extensively exhibited.
To examine the effects of helixes on the vortex formations in the wake, Figure 8 exhibits the comparison of the instantaneous vortex structures of the equivalent-twine and twisted-twine nets at Re = 4500 and AOA = 90°. The three-dimensional vortex structures are visualized based on the Q-criterion and it is defined as Q = - (Sij-Sij-ΩijΩij)/2, where Sij is the strain rate and Ωij is the rotation rate tensor (Hunt et al., 1988). The Q-criterion is colored by iso-contours of the streamwise velocity.
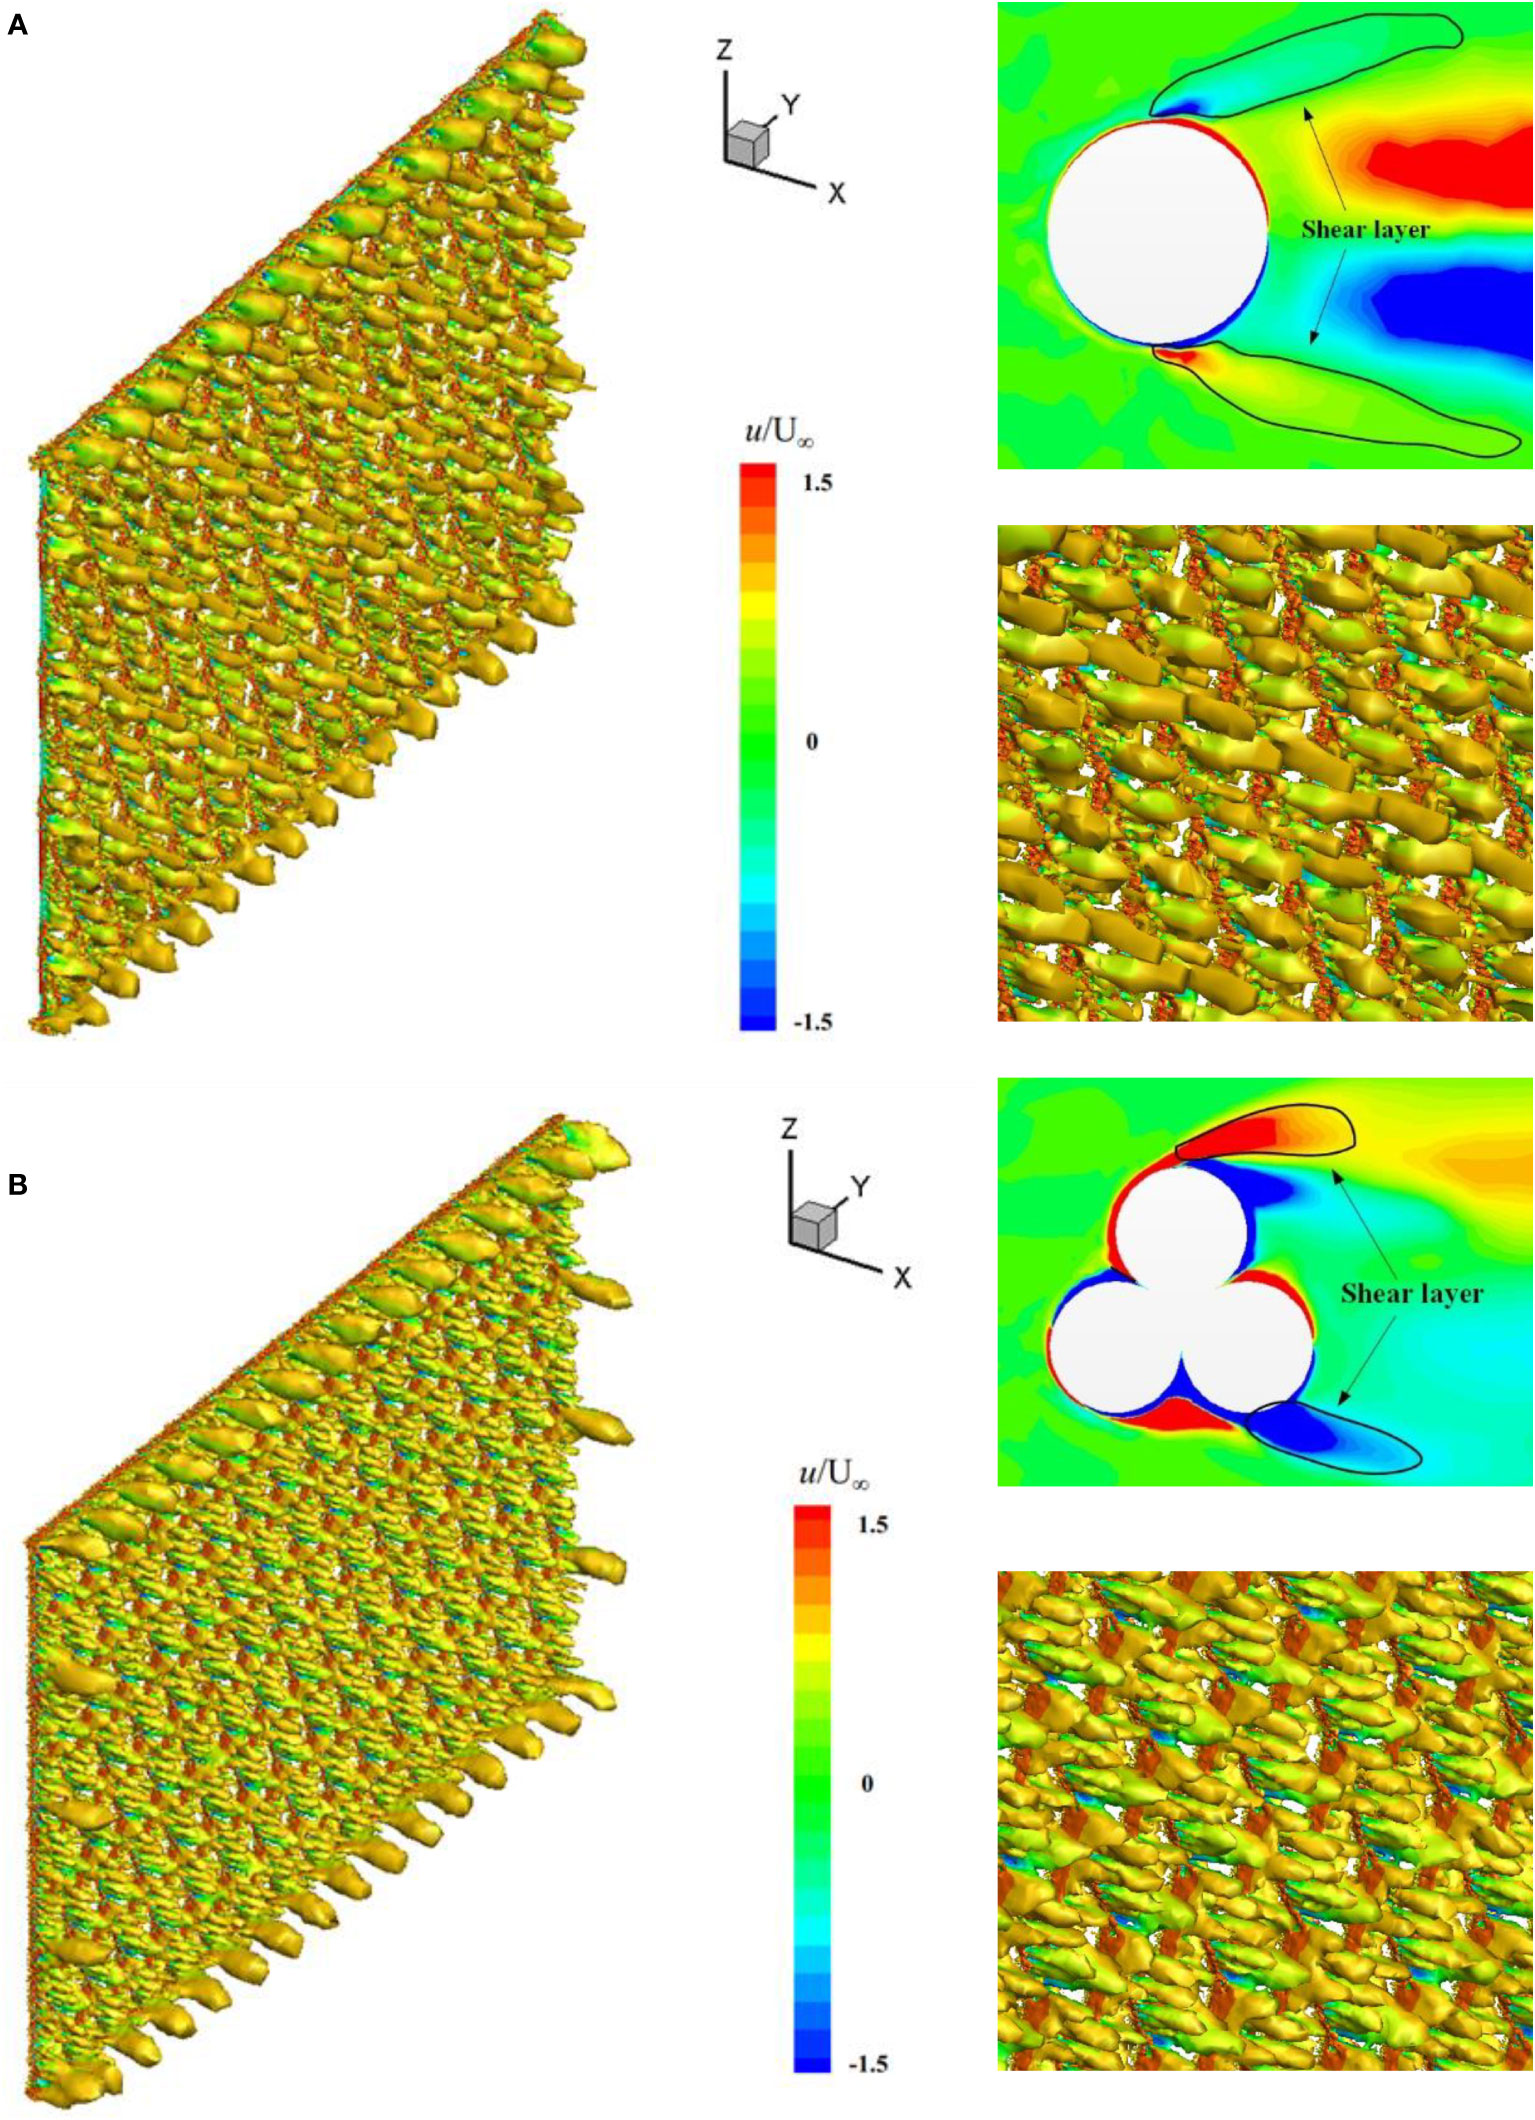
Figure 8 Instantaneous vortex structures and detailed shear layers of the individual twines at Re = 4500. (A) Equivalent-twine net and (B) twisted-twine net.
The fully turbulent effect is established with the observation of small-scale vortex structures in the instantaneous field of the wake. Vortex shedding overall is well-organized but not as regular as the classical Karman vortex. There is little wake interference between net twines under a certain net solidity of 0.16, but vortex interaction does exist when flow passes through the net twines. The vortex structures of the twisted-twine net are much smaller than that of the equivalent-twine net. As the inner shear layer of the twisted-twine net is disturbed by the helixes. Furthermore, small-scale vortices are observed to be attached in the turbulent boundary layer of the twisted-twine net, and the shear layer seems to be suppressed by the helixes. Consequently, the separated shear layer at subcritical Reynolds is turbulent, represented by small-scale vortices. As a result, the fluctuating velocity and the Reynolds normal stress components in the shear layer decrease.
Three selected horizontal planes perpendicular to the net are used to present the two-dimensional instantaneous streamlines of the individual net twines. These horizontal planes are defined as z = 0 (Middle) and z = ± 0.14m (Top and Bottom), based on the net height. Two-dimensional instantaneous streamlines of the net twines in these three selected planes are depicted in Figure 9 to provide close-up views of the turbulence characteristics. The vortex structures generated by the flow separation show distinct features. Symmetric vortices form behind the equivalent net twine and single vortices appear behind the twisted twines. The vortices behind the twisted twines show wall-attached characteristics after the separation point. The recirculation length, Lr, of the equivalent net twine is around 2.2 dw, which is longer than that of the twisted twine (1.6dw).
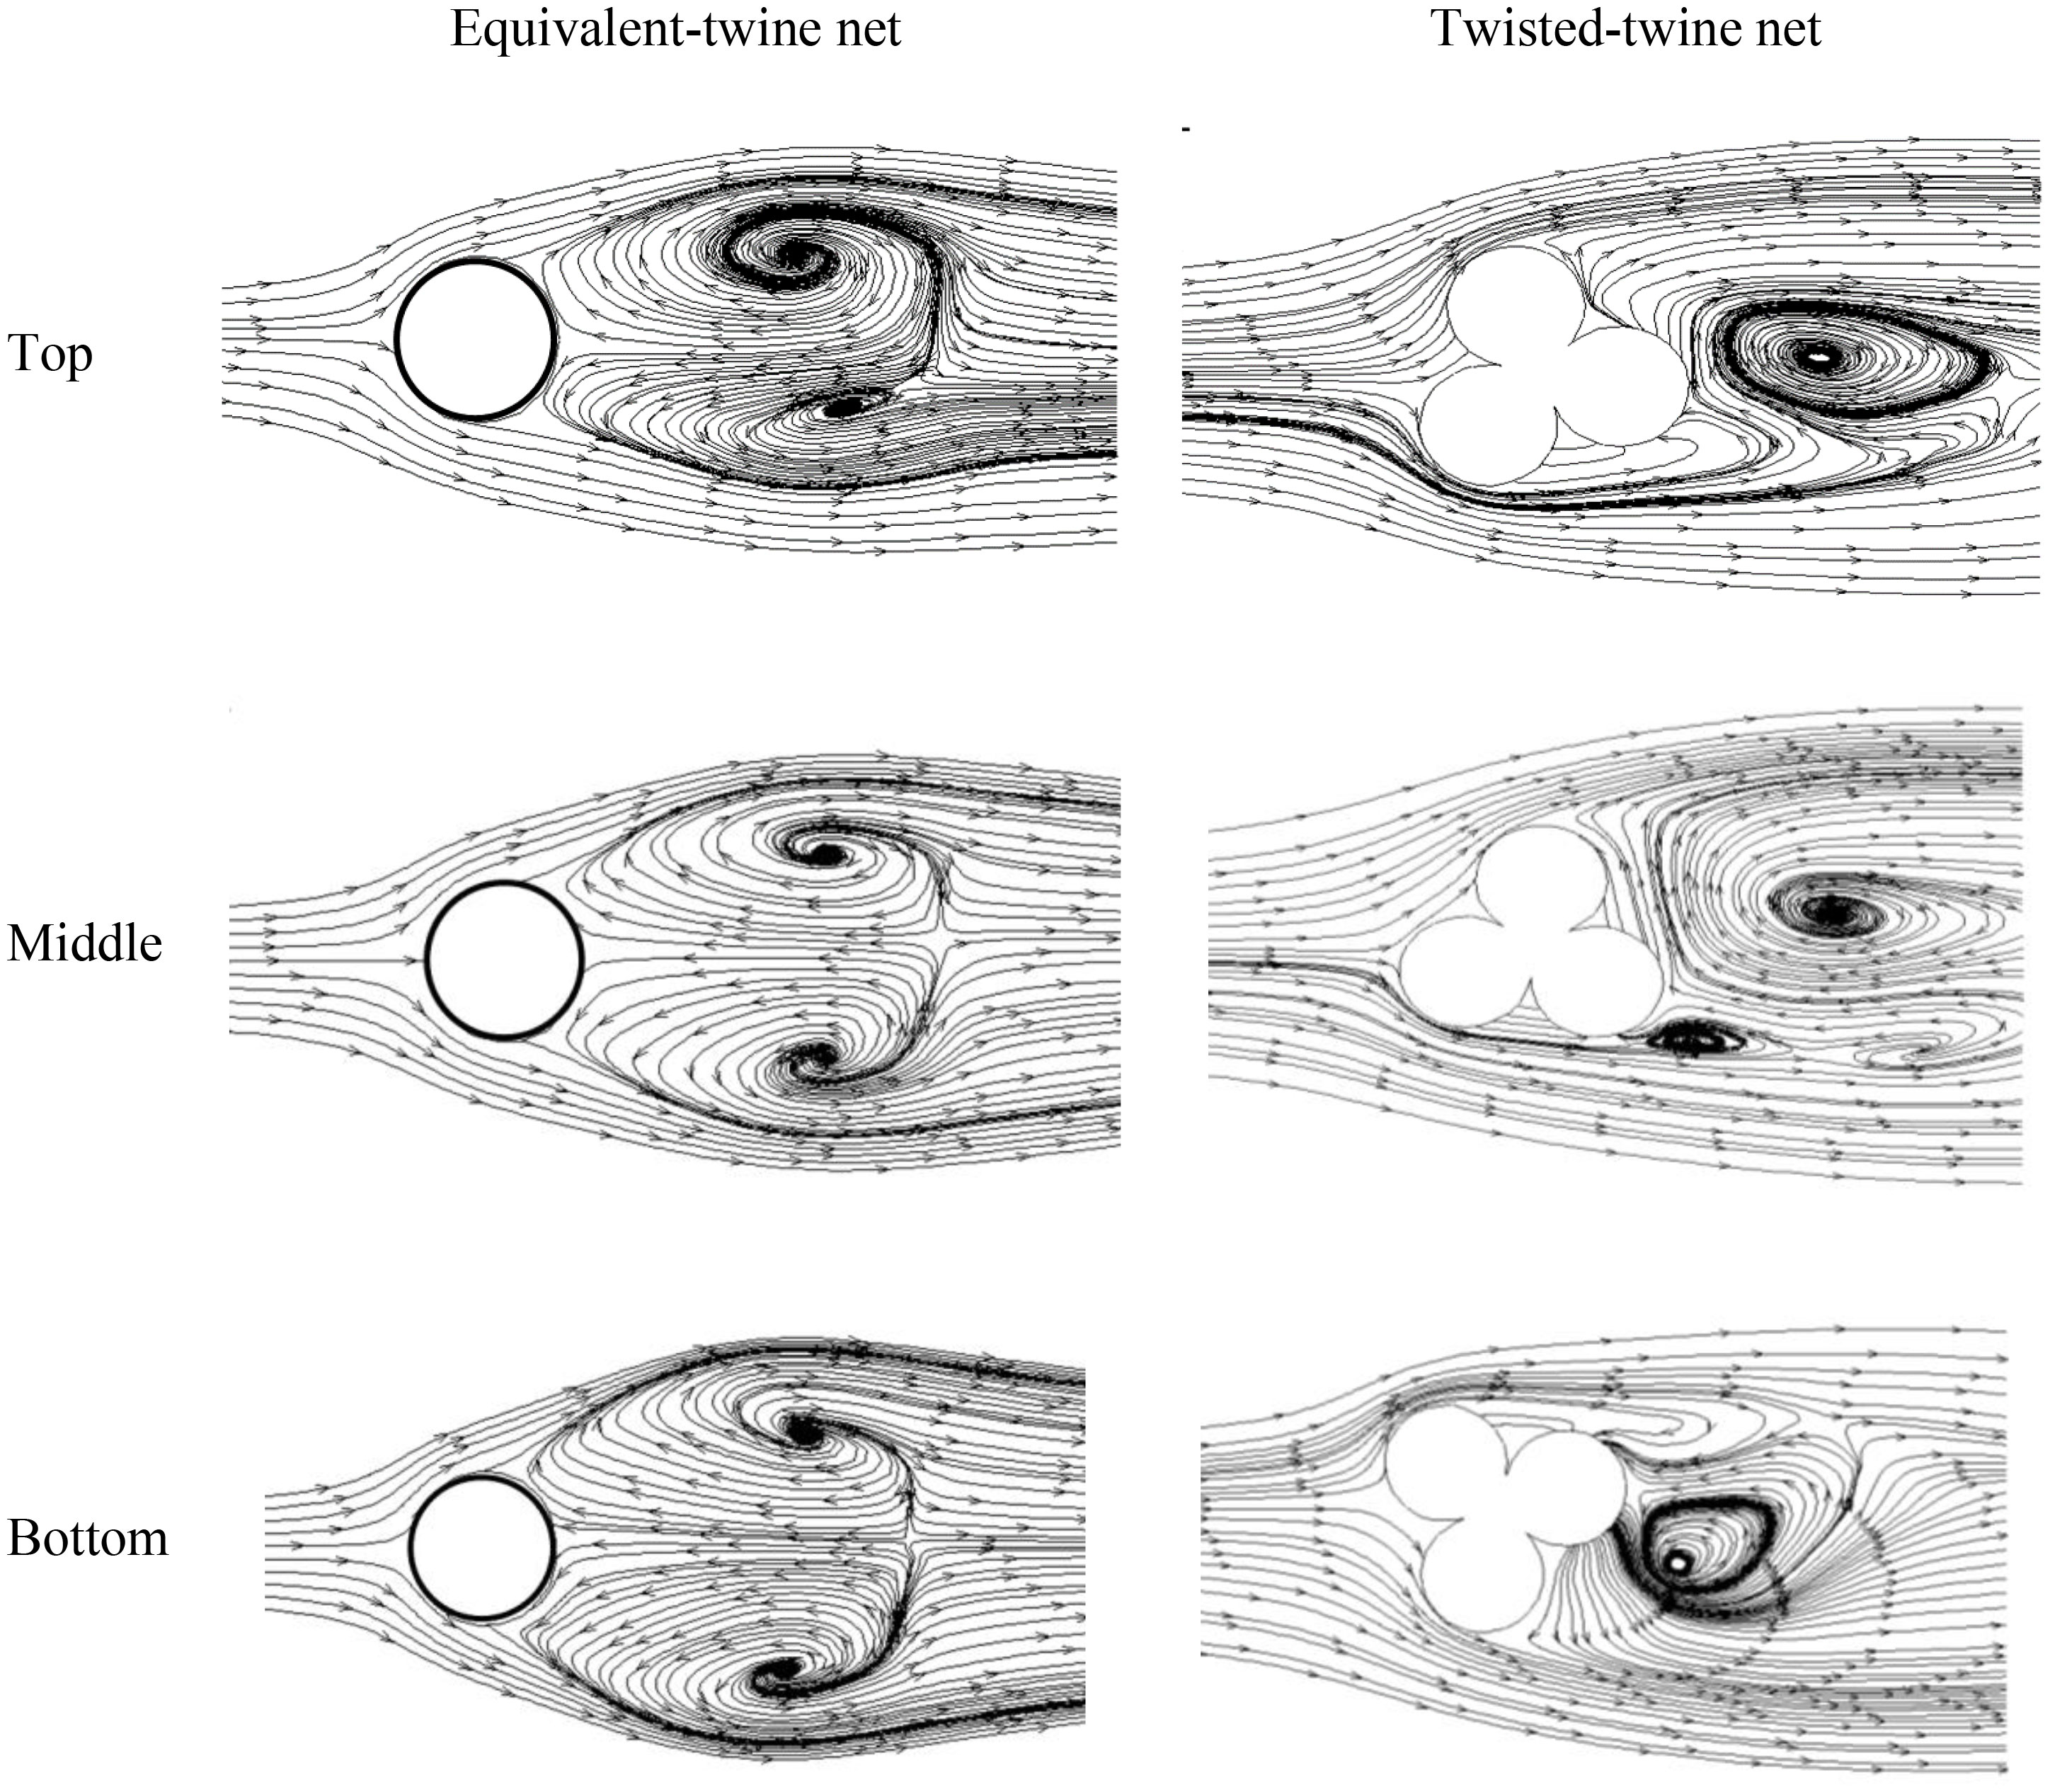
Figure 9 Streamlines around the equivalent net twines (left column) and the twisted net twines (right column) at different planes of the nets for Re = 4500.
The unsteady flow velocity fluctuations caused by the vortex shedding give rise to the Reynolds stresses in the near wake. Moreover, the transition to turbulence in the laminar shear layer also contributes to the Reynolds stresses. Therefore, to better understand the turbulence characteristics in the wake, it is vitally important to examine the Reynolds stresses. Figure 10 depicts the normal and shear Reynolds stresses in the near and far wake regions of the equivalent-twine and the twisted-twine nets. The Reynolds normal stresses , and show symmetric profiles while the Reynolds shear stress has an anti-symmetric profile. Moreover, the amplitude of Reynolds stress fluctuations for the equivalent-twine net is higher than that of the twisted-twine net.
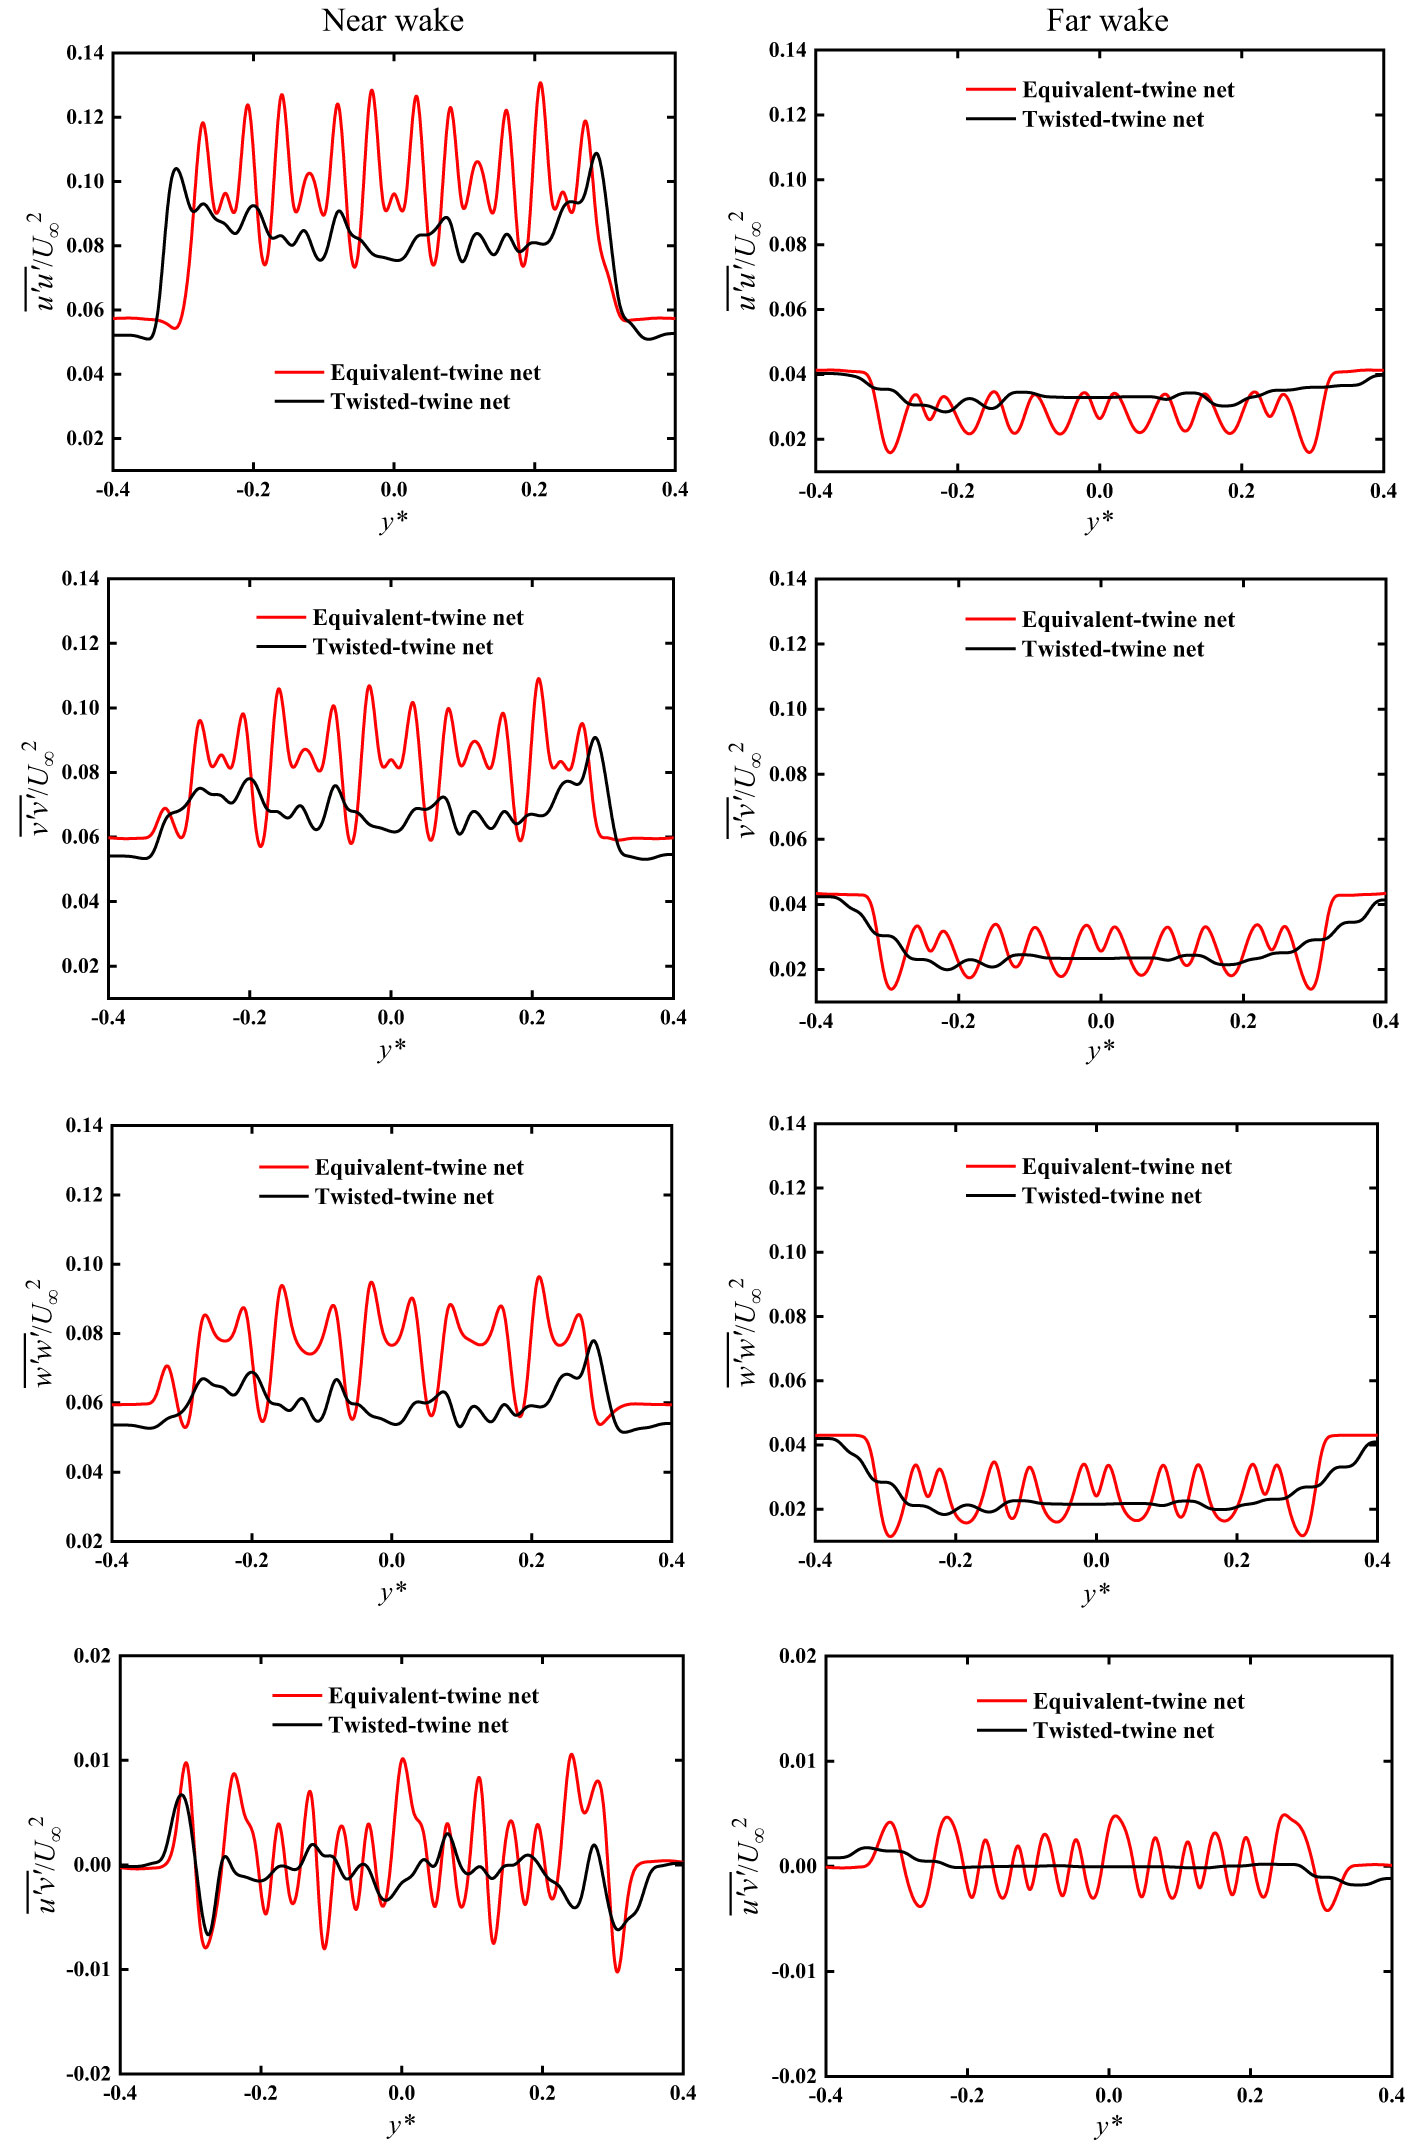
Figure 10 Profiles of the normal and shear Reynolds stress components in the near- and far-wake regions “*” means the dimensionlessization of y. y*=y(m)/1(m) ,”m” means Unit of length – meter.
Of all the Reynolds stresses, show the highest fluctuations. The maximum value is found to be 0.13 in the near wake of the equivalent-twine net. In comparison to the equivalent-twine net, there is a conspicuous reduction in the fluctuation magnitude of the for the twisted-twine net. In particular, a nearly 23% reduction in the is evident between the two nets. This significant reduction is caused by the decrease in streamwise velocity fluctuations in the near wake. The Reynolds normal stress is also related to the vortex formation (Williamson, 1996). The location of the maximum closely follows the extent of the recirculation zone. This causes the vortex formation length to decrease.
The and the are related to the transverse velocity, contributing to the fluctuating kinetic energy in the wake (Ma et al., 2000; Zhu et al., 2020). The magnitudes of the Reynolds stresses and show their maximum values due to the vortices formed in the shear layers. For the equivalent-twine net, the maximum and are found to be 0.11 and 0.10 in the near wake. For the twisted-twine net, the fluctuation amplitudes of and decrease compared to the equivalent-twine net.
The Reynolds shear stress contributes to the momentum transport in the wake of the net (Matsumura and Antonia, 1993). The Reynolds shear stresses show anti-symmetric profiles mostly because the anti-symmetric vortex shedding dominates the wake. For the equivalent-twine net, the maximum is found to be 0.01 . The magnitude of decreases significantly due to the addition of the helixes on the twisted twines.
Figures 11, 12 depict the turbulence kinetic energy (TKE) contours and statistics for both equivalent-twine and twisted-twine nets. The TKE is associated with momentum, heat transport and turbulence intensity (Matsumura and Antonia, 1993; Pope, 2001). In addition, the TKE can be used to approximate turbulence diffusion. Thus, the TKE is one of the most critical variables in a turbulent flow. Understanding the turbulence fluctuations (usually the fluctuating velocity) is instructive to examine the TKE. This study follows the definition of (Wilcox, 1998) in which TKE is half the trace of the Reynolds stress tensor, and it is defined as .
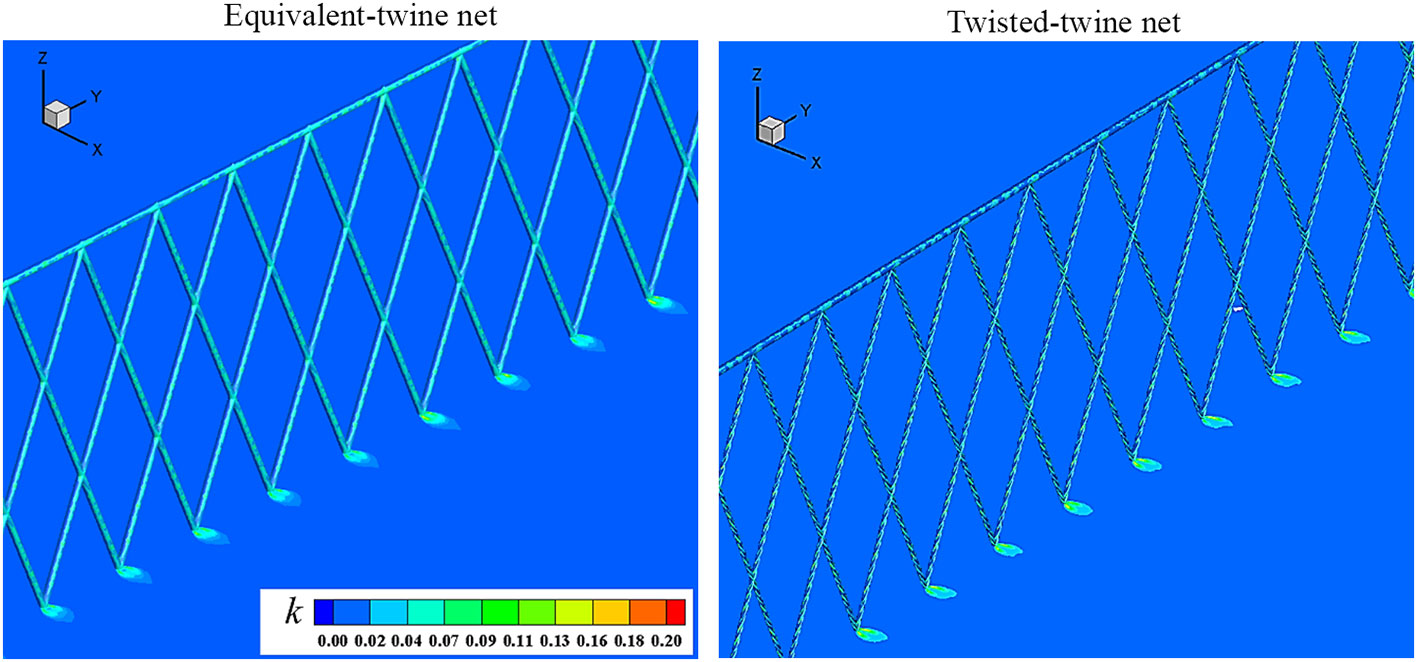
Figure 11 Comparison of the turbulent kinetic energy contours by the URANS model at AOA = 90°.
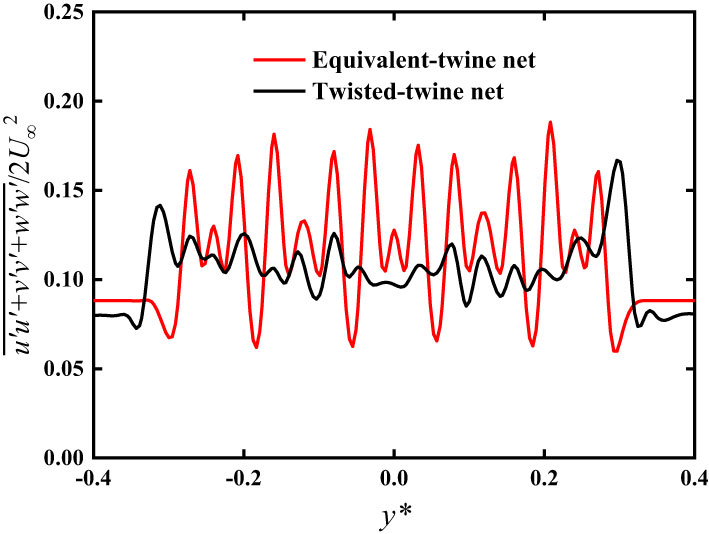
Figure 12 Comparison of the turbulent kinetic energy along the transverse direction of the equivalent-twine and the twisted-twine nets.
Figure 11 shows that the TKE of the equivalent-twine net is larger than that of the twisted-twine net. This is due to the helixes on the twisted twines which hinder the development of the flow. This then results in less fluctuating velocities in the near wake. Consequently, the wider turbulent region appears in the wake of the equivalent-twine net, while the twisted-twine net shows a narrower turbulent region. The observation from Figure 11 has also been confirmed by Figure 12, where the statistics show detailed profiles for these two different nets. The average difference of the TKE for these two different nets is 16%. Which means at least 3.3% of the fluctuating velocity is lost due to the effect of the helixes. Furthermore, the energy in the wake of the twisted-twine net is relatively low because of the galloping response induced by the helixes. It can be concluded that the helixes could cause a decrease in turbulent kinetic energy.
In this paper, two diamond-mesh net panels, namely the equivalent-twine and the twisted-twine nets with the dimension of 0.6m (length)×0.4m (height), are numerically examined to understand the wake and turbulence characteristics of the aquaculture nets. To capture the unsteady flow effect induced by the wall-shear stress regarding the free stream velocity, Unsteady Reynolds-averaged Navier-Stokes (URANS) simulations are conducted. The subcritical Reynolds number Re = 4.5 ×10³ is selected for all simulation cases based on the effective diameter of the net twine. The Reynolds stress model (RSM) is used to resolve the separation-induced transition problems.
The overall vortex shedding for these two nets is well organized but not as regular as the classical Karman vortex. Due to the helixes the vortex structures of the twisted-twine net are smaller compared to the equivalent-twine. Two-dimensional close-up views show that symmetric vortices form behind the equivalent net twine and single vortices appear behind the twisted twines. The recirculation length of the equivalent twine is longer than that of the twisted twine. Similar to the mean velocity profiles, the Reynolds normal and shear stresses show symmetric and anti-symmetric profiles, respectively. causes the decrease of the vortex formation length, and provide the most contribution to the fluctuating kinetic energy, and contributes to the momentum transport in the wake. Compared to the other Reynolds stress components, shows the highest fluctuations and the maximum value is 0.13 in the near wake of the equivalent-twine net. The turbulent regions and the statistics clearly show that the helixes on the twisted twines lead to decreased turbulence kinetic energy.
This study provides insight into understanding the drag coefficient discrepancy between the equivalent-twine and the twisted-twine nets based on their wake and turbulent mechanisms. Engineers need to properly identify the net type for preliminary design of marine aquaculture cages to avoid over- or under-estimating the drag forces. Future studies should focus on wake and turbulent characteristics of three-dimensional net cages to better guide the design of marine aquaculture systems.
The original contributions presented in the study are included in the article/supplementary materials. Further inquiries can be directed to the corresponding author.
LX completed the numerical calculation and writing of the paper, PL performed the numerical analysis of the paper, HQ provided financial support, and ZX performed the typesetting and revision of the paper. All authors contributed to the article and approved the submitted version.
This work was financially supported by the National Natural Science Foundation of China (Grant No. 51909040), Natural Science Foundation of Heilongjiang Province (Grant No. LH2020E073), the Key Technology Research and Development Program of Shandong (Grant No. 2020CXGC010702), the Stable Supporting Fund of Science and Technology on Underwater Vehicle Technology (Grant No. JCKYS2022SXJQR-11), the Jiangsu Province Science Foundation for Youths (Grant No. BK20220221), and the High-tech Ship Research Projects Sponsored by the Ministry of Industry and Information Technology (2019[357]).
The authors declare that the research was conducted in the absence of any commercial or financial relationships that could be construed as a potential conflict of interest.
All claims expressed in this article are solely those of the authors and do not necessarily represent those of their affiliated organizations, or those of the publisher, the editors and the reviewers. Any product that may be evaluated in this article, or claim that may be made by its manufacturer, is not guaranteed or endorsed by the publisher.
Bi C.-W., Balash C., Matsubara S., Zhao Y.-P., Dong G.-H. (2017). Effects of cylindrical cruciform patterns on fluid flow and drag as determined by CFD models. Ocean Eng. 135, 28–38. doi: 10.1016/j.oceaneng.2017.02.032
Bi C.-W., Chen Q.-P., Zhao Y.-P., Su H., Wang X.-Y. (2020). Experimental investigation on the hydrodynamic performance of plane nets fouled by hydroids in waves. Ocean Eng. 213, 107839. doi: 10.1016/j.oceaneng.2020.107839
Bi C.-W., Zhao Y.-P., Dong G.-H., Wu Z.-M., Zhang Y., Xu T.-J. (2018). Drag on and flow through the hydroid-fouled nets in currents. Ocean Eng. 161, 195–204. doi: 10.1016/j.oceaneng.2018.05.005
Bi C.-W., Zhao Y.-P., Dong G.-H., Xu T.-J., Gui F.-K. (2013). Experimental investigation of the reduction in flow velocity downstream from a fishing net. Aquacult. Eng. 57, 71–81. doi: 10.1016/j.aquaeng.2013.08.002
Bi C.-W., Zhao Y.-P., Dong G.-H., Xu T.-J., Gui F.-K. (2014a). Numerical simulation of the interaction between flow and flexible nets. J. Fluids Struct. 45, 180–201. doi: 10.1016/j.jfluidstructs.2013.11.015
Bi C.-W., Zhao Y.-P., Dong G.-H., Zheng Y.-N., Gui F.-K. (2014b). A numerical analysis on the hydrodynamic characteristics of net cages using coupled fluid–structure interaction model. Aquacult. Eng. 59, 1–12. doi: 10.1016/j.aquaeng.2014.01.002
Bui C. M., Ho T. X., Khieu L. H. (2020). Numerical study of a flow over and through offshore fish cages. Ocean Eng. 201, 107140. doi: 10.1016/j.oceaneng.2020.107140
Chen H., Christensen E. D. (2016). Investigations on the porous resistance coefficients for fishing net structures. J. Fluids Struct. 65, 76–107. doi: 10.1016/j.jfluidstructs.2016.05.005
Chen H., Christensen E. D. (2017). Development of a numerical model for fluid-structure interaction analysis of flow through and around an aquaculture net cage. Ocean Eng. 142, 597–615. doi: 10.1016/j.oceaneng.2017.07.033
Chen H., Christensen E. D. (2018). Simulating the hydrodynamic response of a floater–net system in current and waves. J. Fluids Struct. 79, 50–75. doi: 10.1016/j.jfluidstructs.2018.01.010
Cheng H., Li L., Ong M. C., Aarsæther K. G., Sim J. (2021). Effects of mooring line breakage on dynamic responses of grid moored fish farms under pure current conditions. Ocean Eng. 237, 109638. doi: 10.1016/j.oceaneng.2021.109638
Choi H., Jeon W.-P., Kim J. (2008). Control of flow over a bluff body. Annu. Rev. Fluid Mech. 40, 113–139. doi: 10.1146/annurev.fluid.39.050905.110149
DeCew J., Fredriksson D., Lader P., Chambers M., Howell W., Osienki M., et al. (2013). Field measurements of cage deformation using acoustic sensors. Aquacult. Eng. 57, 114–125. doi: 10.1016/j.aquaeng.2013.09.006
Evans J. J., Ridge I. M. L. (2005). Rope and rope-like structures[J] Vol. 20 (WIT Transactions on State-of-the-art in Science and Engineering).
Fredheim A. (2005). Current forces on net structure. (PhD Thesis)[J]. Trondheim, Norway Norwegian University of Science and Technology,, 139.
Fredriksson D., DeCew J., Lader P., Volent Z., Jensen Ø., Willumsen F. (2014). A finite element modeling technique for an aquaculture net with laboratory measurement comparisons. Ocean Eng. 83, 99–110. doi: 10.1016/j.oceaneng.2014.03.005
Fredriksson D. W., DeCew J., Swift M. R., Tsukrov I., Chambers M. D., Celikkol B. (2004). The design and analysis of a four-cage grid mooring for open ocean aquaculture. Aquacult. Eng. 32 (1), 77–94. doi: 10.1016/j.aquaeng.2004.05.001
Fredriksson D. W., DeCew J. C., Tsukrov I. (2007). Development of structural modeling techniques for evaluating HDPE plastic net pens used in marine aquaculture. Ocean Eng. 34 (16), 2124–2137. doi: 10.1016/j.oceaneng.2007.04.007
Fredriksson D. W., Swift M. R., Irish J. D., Tsukrov I., Celikkol B. (2003). Fish cage and mooring system dynamics using physical and numerical models with field measurements. Aquacult. Eng. 27 (2), 117–146. doi: 10.1016/S0144-8609(02)00043-2
Gsell S., Bourguet R., Braza M. (2018). Three-dimensional flow past a fixed or freely vibrating cylinder in the early turbulent regime. Phys. Rev. Fluids 3 (1), 013902. doi: 10.1103/PhysRevFluids.3.013902
Hunt J., Wray A., Moin P. (1988). Eddies, streams, and convergence zones in turbulent flows. 2 Proc. Summer Program (Center Turbul. Res. 1988), 193–208.
Jiang H., Cheng L. (2021). Large-Eddy simulation of flow past a circular cylinder for reynolds numbers 400 to 3900. Phys. Fluids 33 (3), 034119. doi: 10.1063/5.0041168
Klebert P., Su B. (2020). Turbulence and flow field alterations inside a fish sea cage and its wake. Appl. Ocean Res. 98, 102113. doi: 10.1016/j.apor.2020.102113
Lader P. F., Fredheim A. (2006). Dynamic properties of a flexible net sheet in waves and current–a numerical approach. Aquacult. Eng. 35 (3), 228–238. doi: 10.1016/j.aquaeng.2006.02.002
Lader P., Fredriksson D. W., Guenther J., Volent Z., Blocher N., Kristiansen D., et al. (2015). Drag on hydroid-fouled nets–an experimental approach. China Ocean Eng. 29 (3), 369–389. doi: 10.1007/s13344-015-0026-y
Lader P., Jensen A., Sveen J. K., Fredheim A., Enerhaug B., Fredriksson D. (2007). Experimental investigation of wave forces on net structures. Appl. Ocean Res. 29 (3), 112–127. doi: 10.1016/j.apor.2007.10.003
Lange C. F., Durst F., Breuer M. (1998). Momentum and heat transfer from cylinders in laminar crossflow at 10– 4≦̸ Re≦̸ 200. Int. J. Heat Mass Transf. 41 (22), 3409–3430. doi: 10.1016/S0017-9310(98)00077-5
Liu L., Kinoshita T., Wan R., Bao W., Itakura H. (2012). Experimental investigation and analysis of hydrodynamic characteristics of a net panel oscillating in water. Ocean Eng. 47, 19–29. doi: 10.1016/j.oceaneng.2012.03.013
Ma X., Karamanos G.-S., Karniadakis G. (2000). Dynamics and low-dimensionality of a turbulent near wake. J. Fluid Mech. 410, 29–65. doi: 10.1017/S0022112099007934
Martin T., Kamath A., Bihs H. (2020). A Lagrangian approach for the coupled simulation of fixed net structures in a eulerian fluid model. J. Fluids Struct. 94, 102962. doi: 10.1016/j.jfluidstructs.2020.102962
Matsumura M., Antonia R. (1993). Momentum and heat transport in the turbulent intermediate wake of a circular cylinder. J. Fluid Mech. 250, 651–668. doi: 10.1017/S0022112093001600
McKenna H. A., Hearle J. W., O'Hear N. (2004). Handbook of fibre rope technology (Woodhead publishing).
Palkin E., Mullyadzhanov R., Hadziabdic M., Hanjalic K. (2016). Scrutinizing URANS in shedding flows: The case of cylinder in cross-flow in the subcritical regime. Flow Turbul. Combust. 97 (4), 1–30. doi: 10.1007/s10494-016-9772-z
Park S., Lee J., Lee C. W. (2021). Design evaluation of a fish cage mooring system with different bridle line connections using model experiments and simulations. Aquacult. Eng. 94, 102177. doi: 10.1016/j.aquaeng.2021.102177
Parnaudeau P., Carlier J., Heitz D., Lamballais E. (2008). Experimental and numerical studies of the flow over a circular cylinder at reynolds number 3900. Phys. Fluids 20 (8), 085101. doi: 10.1063/1.2957018
Patursson Ø., Swift M. R., Tsukrov I., Simonsen K., Baldwin K., Fredriksson D. W., et al. (2010). Development of a porous media model with application to flow through and around a net panel. Ocean Eng. 37 (2-3), 314–324. doi: 10.1016/j.oceaneng.2009.10.001
Priour D. (2003). Analysis of nets with hexagonal mesh using triangular elements. Int. J. numer. Methods Eng. 56 (12), 1721–1733. doi: 10.1002/nme.635
Su B., Kelasidi E., Frank K., Haugen J., Føre M., Pedersen M. O. (2021). An integrated approach for monitoring structural deformation of aquaculture net cages. Ocean Eng. 219:108424. doi: 10.1016/j.oceaneng.2020.108424
Swift M. R., Fredriksson D. W., Unrein A., Fullerton B., Patursson O., Baldwin K. (2006). Drag force acting on biofouled net panels. Aquacult. Eng. 35 (3), 292–299. doi: 10.1016/j.aquaeng.2006.03.002
Tang M.-F., Xu T.-J., Dong G.-H., Zhao Y.-P., Guo W.-J. (2017). Numerical simulation of the effects of fish behavior on flow dynamics around net cage. Appl. Ocean Res. 64, 258–280. doi: 10.1016/j.apor.2017.03.006
Tang H. J., Yang R. Y., Yao H. C. (2021). Experimental and numerical investigations of a mooring line failure of an aquaculture net cage subjected to currents. Ocean Eng. 238, 109707. doi: 10.1016/j.oceaneng.2021.109707
Tsukrov I., Drach A., DeCew J., Swift M. R., Celikkol B. (2011). Characterization of geometry and normal drag coefficients of copper nets. Ocean Eng. 38 (17-18), 1979–1988. doi: 10.1016/j.oceaneng.2011.09.019
Tsukrov I., Eroshkin O., Fredriksson D., Robinson M. (2003). Finite element modeling of net panels using a consistent net element. Ocean Eng. 30, 251–270. doi: 10.1016/S0029-8018(02)00021-5
Tsukrov I., Eroshkin O., Paul W., Celikkol B. (2005). Numerical modeling of nonlinear elastic components of mooring systems. IEEE J. Ocean. Eng. 30 (1), 37–46. doi: 10.1109/JOE.2004.841396
Tsukrov I., Ozbay M., Swift M. R., Celikkol B., Fredriksson D. W., Baldwin K. (2000). Open ocean aquaculture engineering: numerical modeling. Mar. Technol. Soc. J. 34 (1), 29–40. doi: 10.4031/MTSJ.34.1.4
Tu G., Liu H., Ru Z., Shao D., Yang W., Sun T., et al. (2020). Numerical analysis of the flows around fishing plane nets using the lattice Boltzmann method. Ocean Eng. 214, 107623. doi: 10.1016/j.oceaneng.2020.107623
Versteeg H. K., Malalasekera W. (2005). An introduction to computational fluid dynamics (New York: Wiley).
Wang G., Martin T., Huang L., Bihs H. (2021). Modelling the flow around and wake behind net panels using large eddy simulations. Ocean Eng. 239, 109846. doi: 10.1016/j.oceaneng.2021.109846
Williamson C. H. (1996). Vortex dynamics in the cylinder wake. Annu. Rev. Fluid Mech. 28 (1), 477–539. doi: 10.1146/annurev.fl.28.010196.002401
Williamson C. H., Govardhan R. (2004). Vortex-induced vibrations. Annu. Rev. Fluid Mech. 36, 413–455. doi: 10.1146/annurev.fluid.36.050802.122128
Winthereig-Rasmussen H., Simonsen K., Patursson Ø. (2016). Flow through fish farming sea cages: Comparing computational fluid dynamics simulations with scaled and full-scale experimental data. Ocean Eng. 124, 21–31. doi: 10.1016/j.oceaneng.2016.07.027
Xu Z., Qin H. (2020). Fluid-structure interactions of cage based aquaculture: From structures to organisms. Ocean Eng. 217, 107961. doi: 10.1016/j.oceaneng.2020.107961
Xu L., Qin H., Li P., Xu Z. (2022). Numerical modeling of flexible net panels under steady flow using a coupled fluid–structure partitioned scheme. Appl. Sci. 12 (7), 3399. doi: 10.3390/app12073399
Yan T., Wang R., Bao Y., Zhou D., Zhu H., Ping H., et al. (2018). Modification of turbulent wake characteristics by two small control cylinders at a subcritical reynolds number. Phys. Fluids 30 (10), 105106. doi: 10.1063/1.5046447
Yao Y., Chen Y., Zhou H., Yang H. (2016). Numerical modeling of current loads on a net cage considering fluid–structure interaction. J. Fluids Struct. 62, 350–366. doi: 10.1016/j.jfluidstructs.2016.01.004
Yu K. T., Yuan X. (2014). Introduction to computational mass transfer Vol. XI (Berlin Heidelberg: Springer-Verlag), 337.
Zdravkovich M. M. (1997). Flow around circular cylinders: Volume 2: Applications (Oxford university press).
Zhao Y.-P., Bi C.-W., Dong G.-H., Gui F.-K., Cui Y., Guan C.-T., et al. (2013a). Numerical simulation of the flow around fishing plane nets using the porous media model. Ocean Eng. 62, 25–37. doi: 10.1016/j.oceaneng.2013.01.009
Zhao Y.-P., Bi C.-W., Dong G.-H., Gui F.-K., Cui Y., Xu T.-J. (2013b). Numerical simulation of the flow field inside and around gravity cages. Aquacult. Eng. 52, 1–13. doi: 10.1016/j.aquaeng.2012.06.001
Zhao Y.-P., Li Y.-C., Dong G.-H., Gui F.-K., Wu H. (2008). An experimental and numerical study of hydrodynamic characteristics of submerged flexible plane nets in waves. Aquacult. Eng. 38 (1), 16–25. doi: 10.1016/j.aquaeng.2007.10.004
Zhou C., Xu L., Hu F., Qu X. (2015). Hydrodynamic characteristics of knotless nylon netting normal to free stream and effect of inclination. Ocean Eng. 110, 89–97. doi: 10.1016/j.oceaneng.2015.09.043
Keywords: aquaculture nets, wake, turbulence, URANS, RSM
Citation: Xu L, Li P, Qin H and Xu Z (2022) Numerical studies on wake and turbulence characteristics of aquaculture nets. Front. Mar. Sci. 9:1055873. doi: 10.3389/fmars.2022.1055873
Received: 28 September 2022; Accepted: 24 November 2022;
Published: 08 December 2022.
Edited by:
Igor Tsukrov, University of New Hampshire, United StatesReviewed by:
Alexander Knysh, University of New Hampshire, United StatesCopyright © 2022 Xu, Li, Qin and Xu. This is an open-access article distributed under the terms of the Creative Commons Attribution License (CC BY). The use, distribution or reproduction in other forums is permitted, provided the original author(s) and the copyright owner(s) are credited and that the original publication in this journal is cited, in accordance with accepted academic practice. No use, distribution or reproduction is permitted which does not comply with these terms.
*Correspondence: Peng Li, cGVuZy5saUBocmJldS5lZHUuY24=
Disclaimer: All claims expressed in this article are solely those of the authors and do not necessarily represent those of their affiliated organizations, or those of the publisher, the editors and the reviewers. Any product that may be evaluated in this article or claim that may be made by its manufacturer is not guaranteed or endorsed by the publisher.
Research integrity at Frontiers
Learn more about the work of our research integrity team to safeguard the quality of each article we publish.