
94% of researchers rate our articles as excellent or good
Learn more about the work of our research integrity team to safeguard the quality of each article we publish.
Find out more
ORIGINAL RESEARCH article
Front. Mar. Sci., 25 November 2022
Sec. Ocean Observation
Volume 9 - 2022 | https://doi.org/10.3389/fmars.2022.1052802
This article is part of the Research TopicDeep-Sea Sampling TechnologyView all 10 articles
 Jin Guo1,2
 Qixiao Zhou1,2
 Yongqiang Ge1
 Haonan Li1,2
 Qiaoling Gao1Ying Wang1,2
 Yuan Lin1
 Jiawang Chen1,2,3*
Methane leakage at the interface between sediment and overlying seawater is an important basis for gas hydrate exploration. Therefore, a transfer device with working pressure of 30MPa and corresponding scheme are proposed to separate and transfer the sediment and overlying water inside the sampler under the condition of pressure-retaining. Based on the pressure relief valve with adjustable threshold pressure, the device transfers the overlying water by compressing the internal volume and transfers the sediment by secondary sampling. The performance of transfer device is studied by simulation and experiment. Based on the coupled Eulerian-Lagrangian approach in the Abaqus, the secondary sampling was investigated, and the penetration resistance and coring rate of the secondary sampling tube are 141N and 86.2%, respectively. By using the hydraulic simulation software AMESim, the pressure fluctuation caused by the movement of the mechanism during the transfer process was studied, and the pressure fluctuation amplitude is within 0.89 MPa. Furthermore, the laboratory transfer tests were carried out under high pressure conditions, and meantime, the simulation results are verified. Under the working condition of 30MPa, the device can maintain a pressure loss of no more than 8.0% (2.4MPa) within two hours, maintain pressure fluctuations during the transfer process within 4.8% (1.44MPa), and ensure that the pressure in the culture kettle decreases by 4.7% relative to the pressure in the sampler after the transfer, which shows the feasibility of the device application.
Methane leakage (cold seeps) at sediment seawater interface is an important basis for gas hydrate exploration and subsequent pre-production test (Gornitz and Fung, 1994; Roberts and Aharon, 1994; Suess et al., 1999), which is also an international research hotspot of marine environmental change, but the detection of regional methane leakage is relatively insufficient due to the lack of sampling technology on this interface and corresponding pressure-retaining transfer analysis technology.
For methane in situ detection technology, Minato et al. (1999) used a LIDAR system to measure the concentration of methane in the atmosphere by analyzing the initial and return power of the laser to obtain the gas concentration based on the selective absorption of light by gas molecules. Yalong et al. (2011) designed a methane concentration detection system based on TDLAS (diode laser absorption) technology, which emits a laser that is reflected by methane gas clusters, but the system is only suitable for close-range handheld devices. Weil (1993) developed a device that uses infrared light to analyze changes in thermal radiation around a pipeline when methane leaks and the surrounding temperature decreases due to the throttling effect. There are many other technical approaches to measure methane concentration using different technical principles, but there is still no more mature methane detection technique that can be applied to the sediment seawater interface.
In order to study the scientific problems related to natural gas hydrate and seabed geology, the existing sampling technology is developing towards longer cores and high fidelity on the basis of pressure-retaining function. Single pressure-retaining core obtained by subsea drilling rig usually exceeds 2 m (Tréhu, 2006); the length of the sample obtained from the pressure coring barrel (PCB) used in the international deep-sea drilling project is 6 m (Zhu et al., 2011); the sample length obtained by the advanced piston corer used in the international offshore drilling project can reach 9.5 m (Jutzeler et al., 2014); the pressure-retaining cores obtained in the sea trial in 2011 reached 9.5 m by using the long pressure-retaining coring device developed by Zhejiang University (Chen et al., 2013). Moreover, by using a vacuum in the middle of an interlayer, a pressure and temperature preservation system (PTPS) was proposed and applied in the gravity piston sampler developed by Zhejiang University to obtain gas-hydrate-bearing sediments (Li et al., 2006; Zhu et al., 2013). Furthermore, Japan’s pressure temperature coring system (PTCS) achieved an active temperature-retaining function by using adiabatic and thermoelectric inner tube cooling (Kawasaki et al., 2006).
After the pressure-retaining sediment sample is obtained, a set of devices is required to transfer the sample to the laboratory for further analysis without obvious pressure drop and disturbance. For the purpose of analyzing the physical and chemical properties of samples, usually only a section of sample needs to be taken from the pressure core. Therefore, a transmission system that can cut and transmit long cores under the working condition of retaining pressure is needed (Rothwell and Rack, 2006; Abegg et al., 2008; Schultheiss et al., 2009; Hao et al., 2013). For example, the hydrate auto-clave coring equipment (HYACE), features not only sampling tools but also a range of pressure core processing equipment (Matsumoto et al., 2011). This device has been used in four major gas hydrate surveys to quantify gas hydrates and accurately measure sediments containing gas hydrates (Amann et al., 1997; Schultheiss et al., 2006). A pressure-retaining transfer system was developed by Zhejiang University to study natural gas hydrate, which includes a mechanical device for continuous sample transfer, e.g., sample grabbing, sample pushing, sample cutting, sample encapsulation, and small sample transfer (Chen et al., 2019; Zhang et al., 2019; Zhu et al., 2022).
In addition, Geotek UK has developed a series of devices for sample transfer analysis. For example, Multi-Sensor Core Logger (MSCL) is a sample undisturbed analysis tool that can quickly acquire high-resolution data from pressure cores or seafloor sediments without damaging the sample structure (Schultheiss and Weaver, 1992; Dickens et al., 2003). On the basis of MSCL, Geotek has further developed the pressure core analysis and transmission system (PCATS), which can cut the high-pressure long columnar sediment into sub samples with a minimum length of 50 mm (Priest et al., 2015; Priest et al., 2019). The Mini-PCATS is a small, simplified version of the PCATS (Liu et al., 2014). By using Mini-PCATS, a core section up to 1.2 m can be removed from the storage chamber and accurately cut into sub-samples, which can be transferred to the sample test unit while maintaining a pressure of up to 35 MPa. However, the existing sampling and transfer analysis technologies lack attention to the interface between sediment and overlying seawater.
In this paper, (1) based on the pressure-retaining sampler for sediment and overlying water, we propose a device and corresponding scheme that can realize multiple separation and transfer of sediment and overlying water under the condition of pressure-retaining, which can effectively reduce the loss of gas components, microbial death and organic component decomposition of samples; (2) by using the pressure relief valves with adjustable threshold pressure and gas-liquid booster pumps, the pressure-retaining transfer device can transfer the overlying water by compressing the internal volume and sediment by secondary sampling; (3) by using the coupled Eulerian-Lagrangian (CEL) approach in the Abaqus, the penetration resistance and coring rate of secondary sampling tube were investigated, (4) the pressure fluctuation caused by the movement of the mechanism during the transfer process is studied based on AMESim; (5) furthermore, the laboratory tests are carried out to test the strength, sealing performance, the ability to maintain pressure stability of the device, and the feasibility of the device application.
As shown in Figure 1, the pressure-retaining transfer device is composed of a push transfer system, a sampler system and a culture system, and any the two systems are sealed through a clamp with O-ring seal. In addition, the transfer device also includes an air compressor, a gas-liquid booster pump, support carts, high-pressure stainless-steel pipes, high-pressure needle valves, and pressure relief valves that can adjust the threshold pressure, etc.
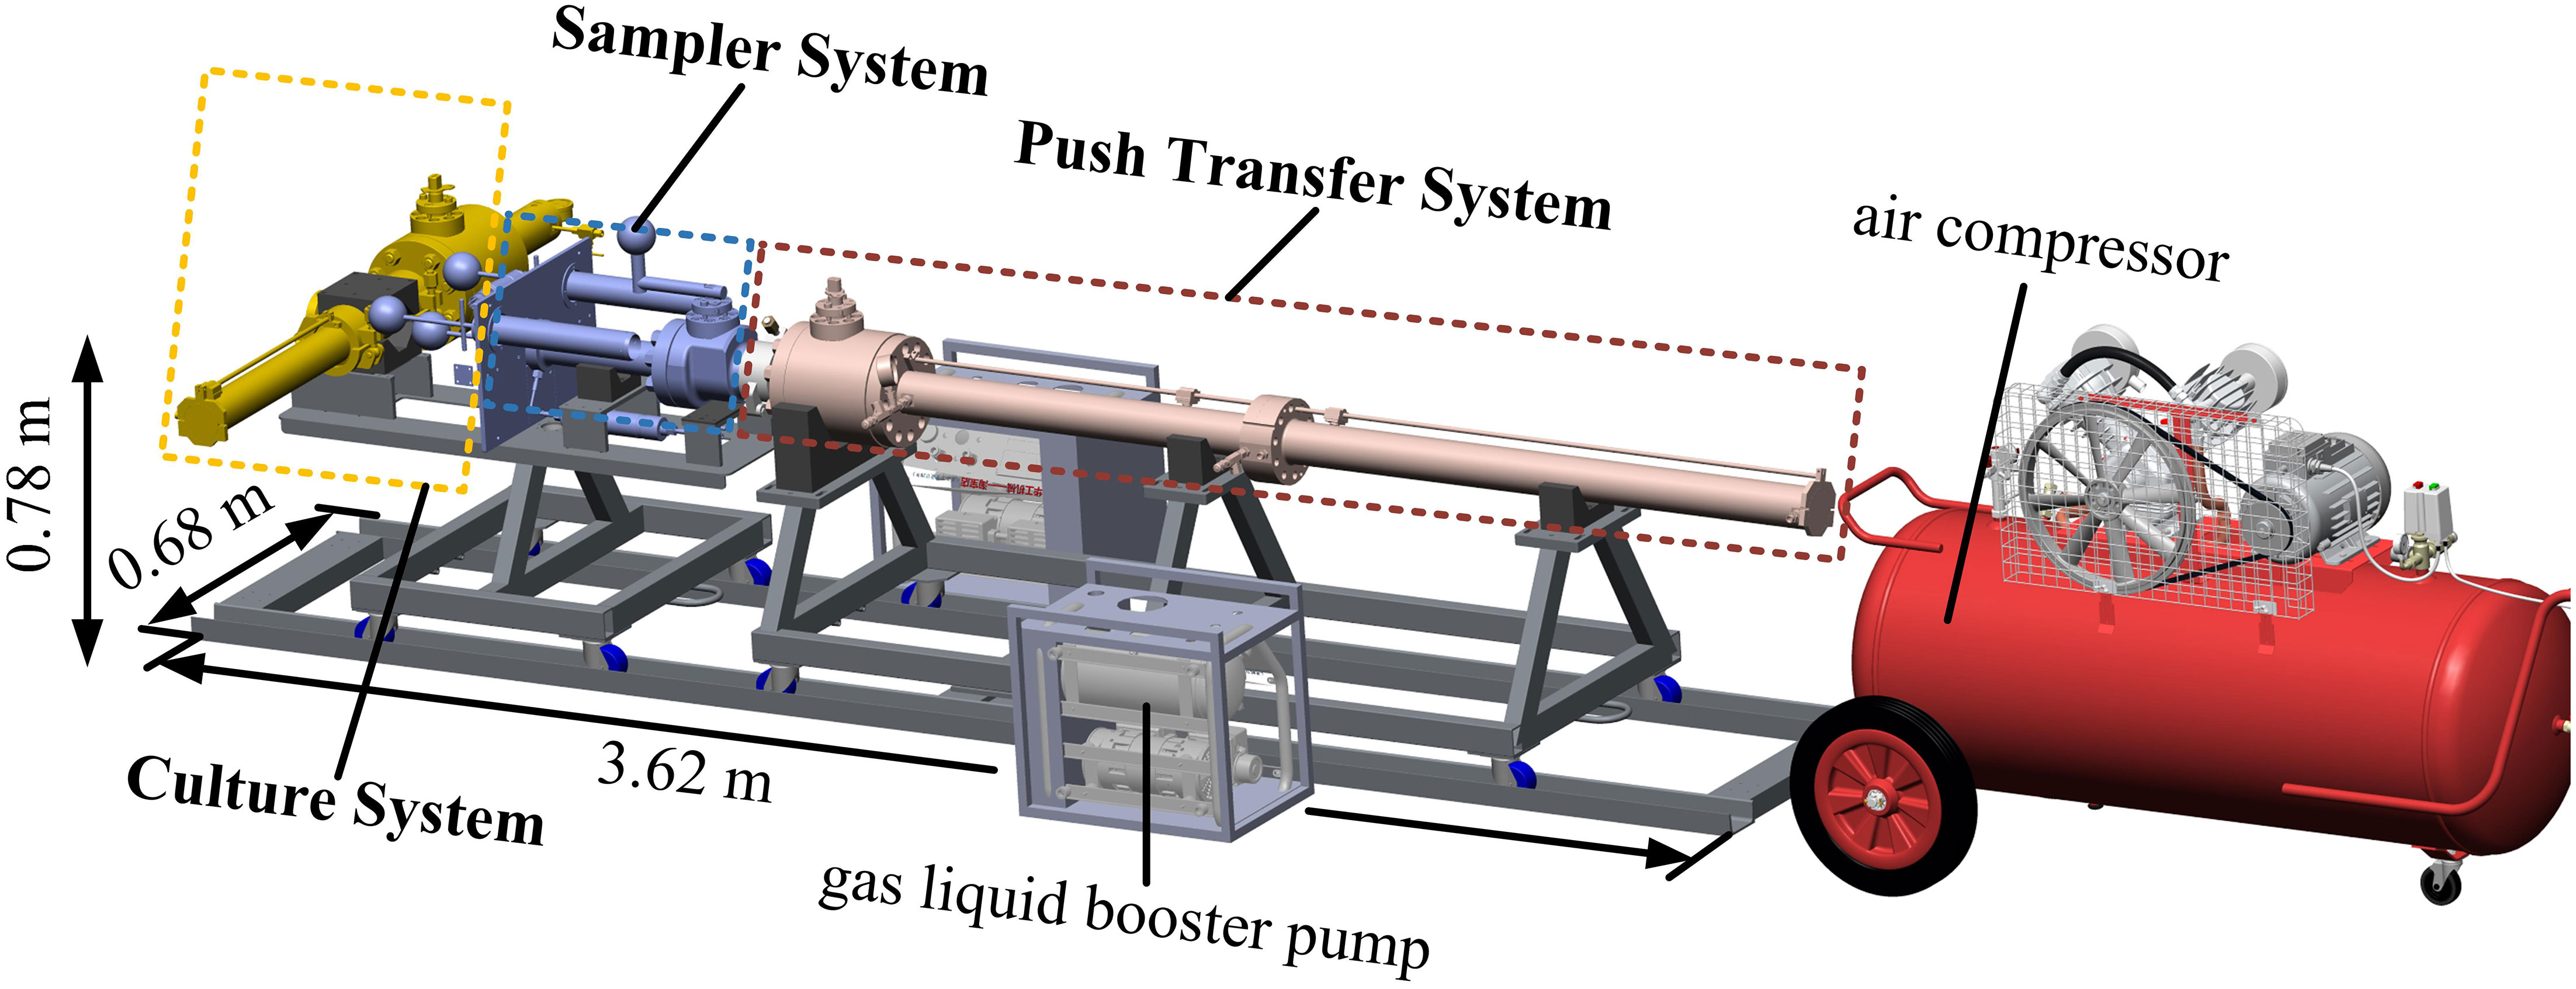
Figure 1 Sediment and overlying water pressure-retaining separation and transfer system.
As shown in Figure 2, the push transfer system includes two sections of pressure chamber (chamber-A: secondary sampling tube mechanism chamber; chamber-B: putter mechanism chamber). In which, the sealing piston-A (connected with the secondary sampling tube) moves in the pressure chamber-A, and the sealing piston-B (connected with the putter-B) moves in the pressure chamber-B. A hydraulic interface is designed at both ends of the two sections of pressure chambers. Therefore, the reciprocating motion of piston-A (secondary sampling tube) is achieved by injecting water at interface-A1 or interface-A2, and the reciprocating motion of the piston-B (putter-B) is achieved by injecting water at the interface-B1 or the interface-B2. In addition, the push block-B at the other end of the putter-B can reciprocate in the secondary sampling tube to push the sediment the sediment in the secondary sampling pipe into the three-way joint. Furthermore, in order to determine the real-time position of pistons inside the chamber, magnets are installed on all pistons and magnetic induction sensors are installed outside the chamber.
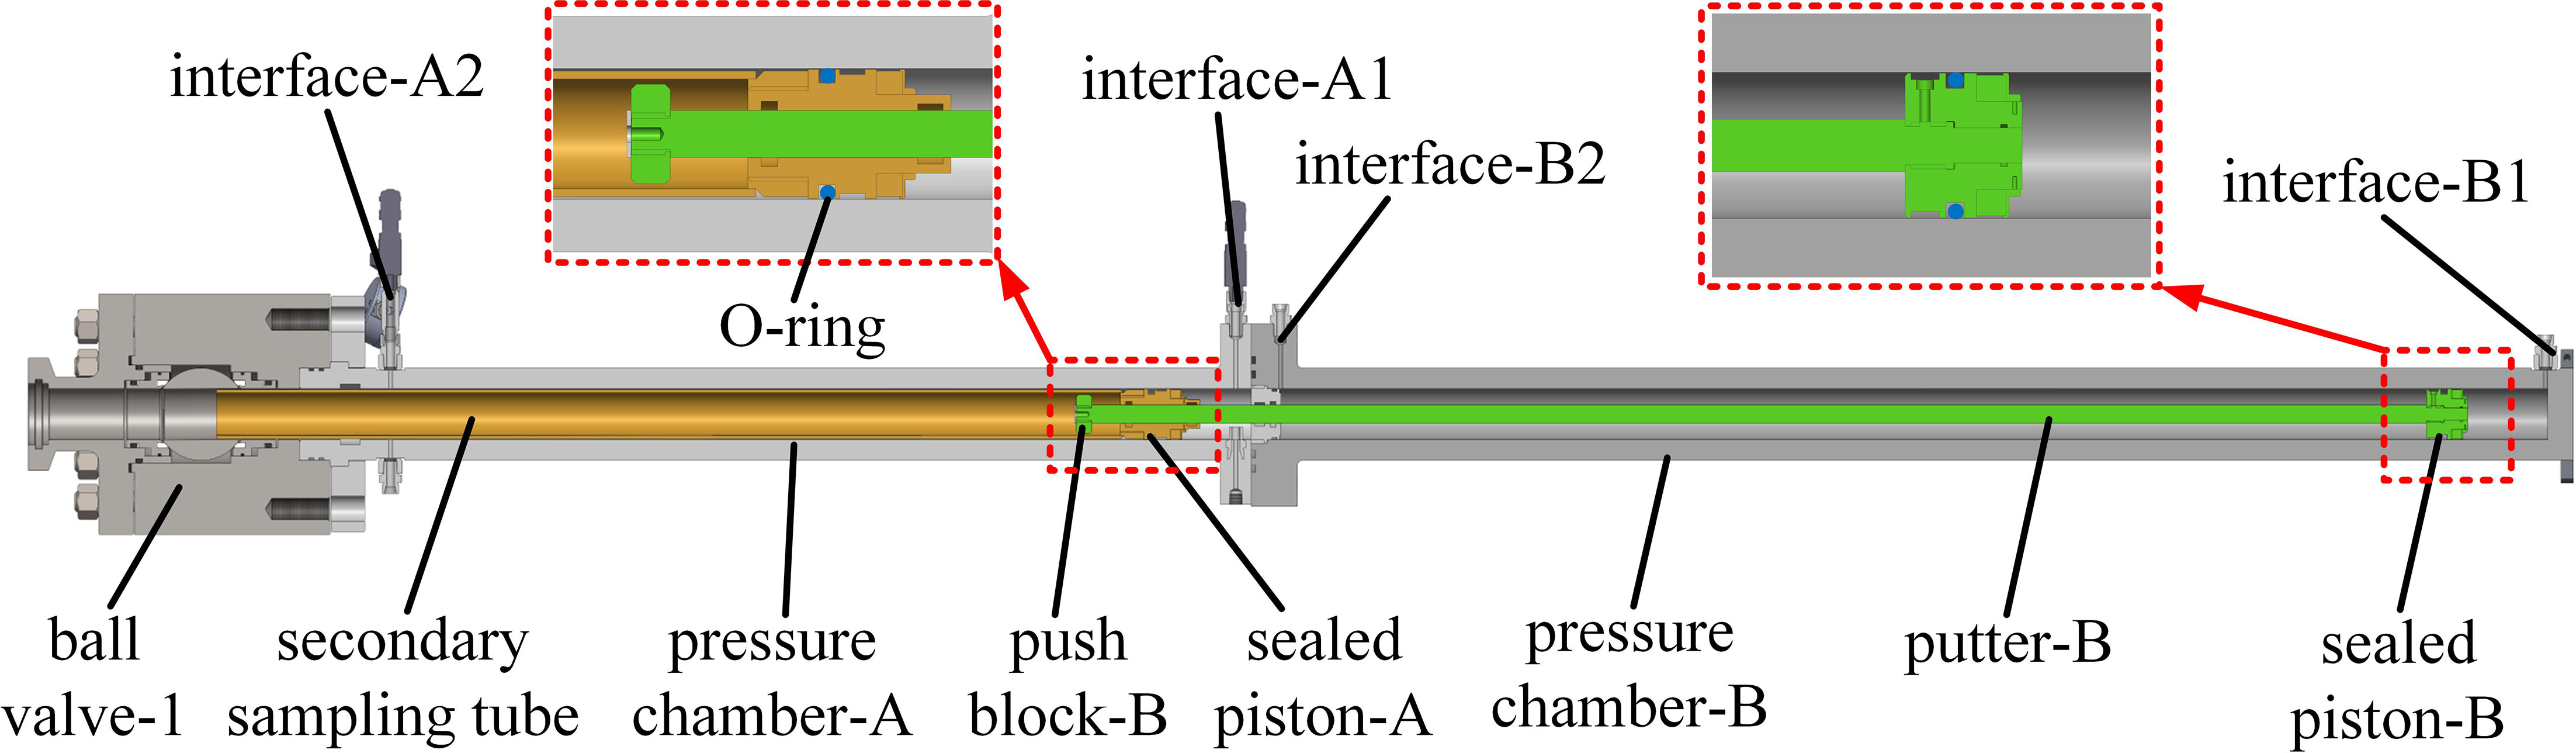
Figure 2 Section view of push transfer system.
As shown in Figure 3, the culture system includes a culture kettle and putter mechanism, in which the sealing piston-C (connected with the putter-C) moves in the pressure chamber-C. A hydraulic interface is set at both ends of the pressure chamber-C, and the reciprocating motion of the piston-C (putter-C) is achieved by injecting water at the interface-C1 or the interface-C2. There are four hydraulic interfaces on the culture kettle, which are used to fill the culture liquid, monitor the pressure and overpressure overflow. Moreover, a three-way joint is used to connect the culture system to the push transfer system.

Figure 3 Section view of sediment culture system.
Figure 4 shows the sampler for sediment and overlying water developed by the Zhejiang University team (Guo et al., 2022). The high-pressure needle valve installed on the side wall of the pressure-retaining cylinder and the ball valve installed at the bottom are used to transfer the overlying water and sediment, respectively, under the pressure-retaining condition, and multiple transfer of samples can be completed by controlling the switch of the needle valve and ball valve.
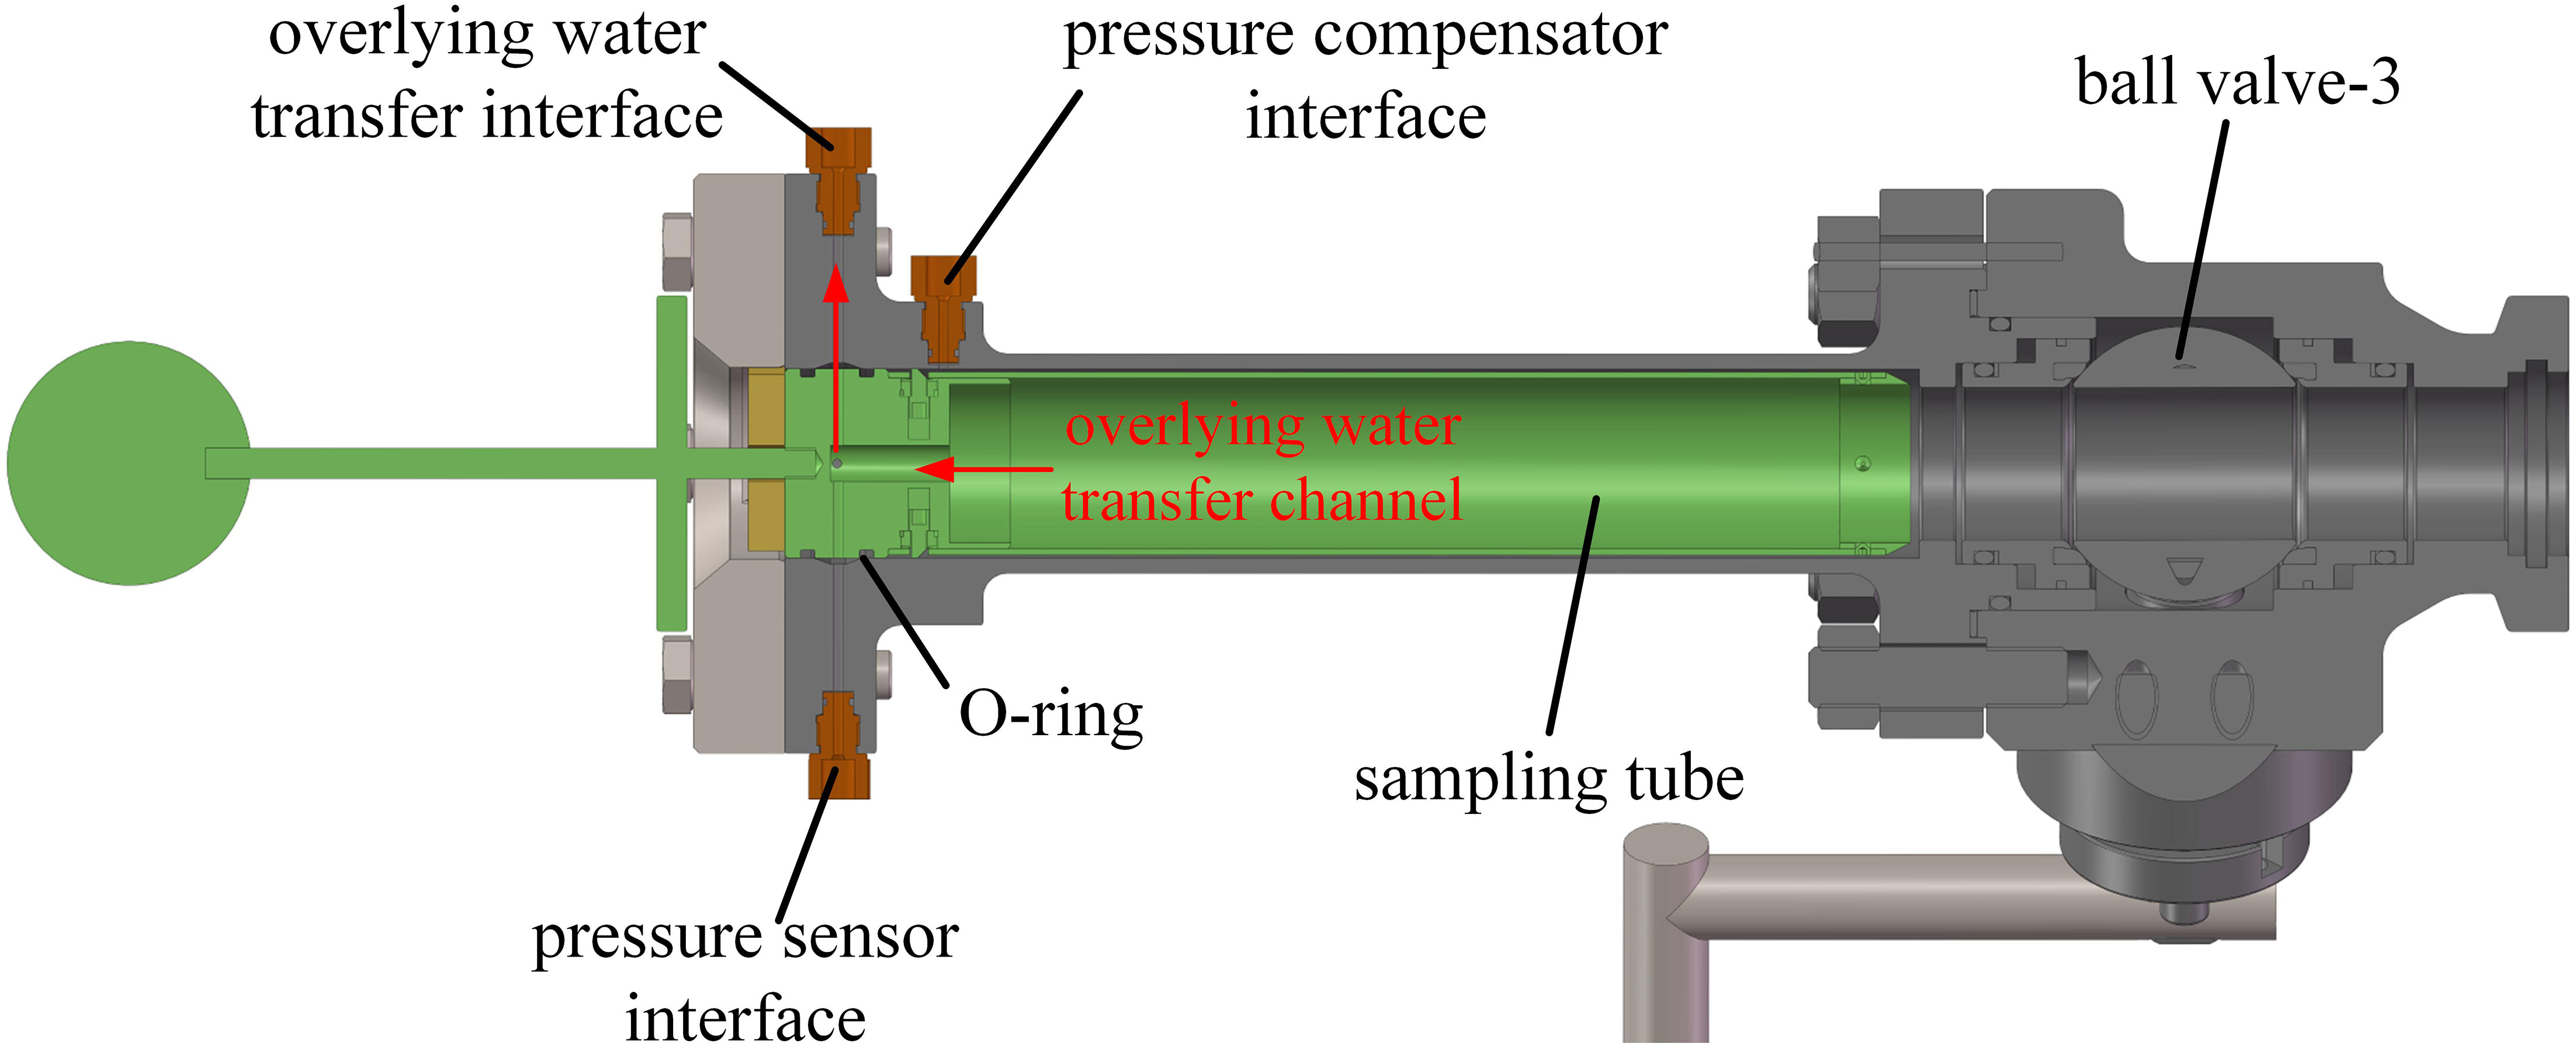
Figure 4 Section view of sediment and its overlying seawater sampler.
Figure 5 shows the process of overlying water transfer and sediment secondary sampling, which is divided into the following steps.
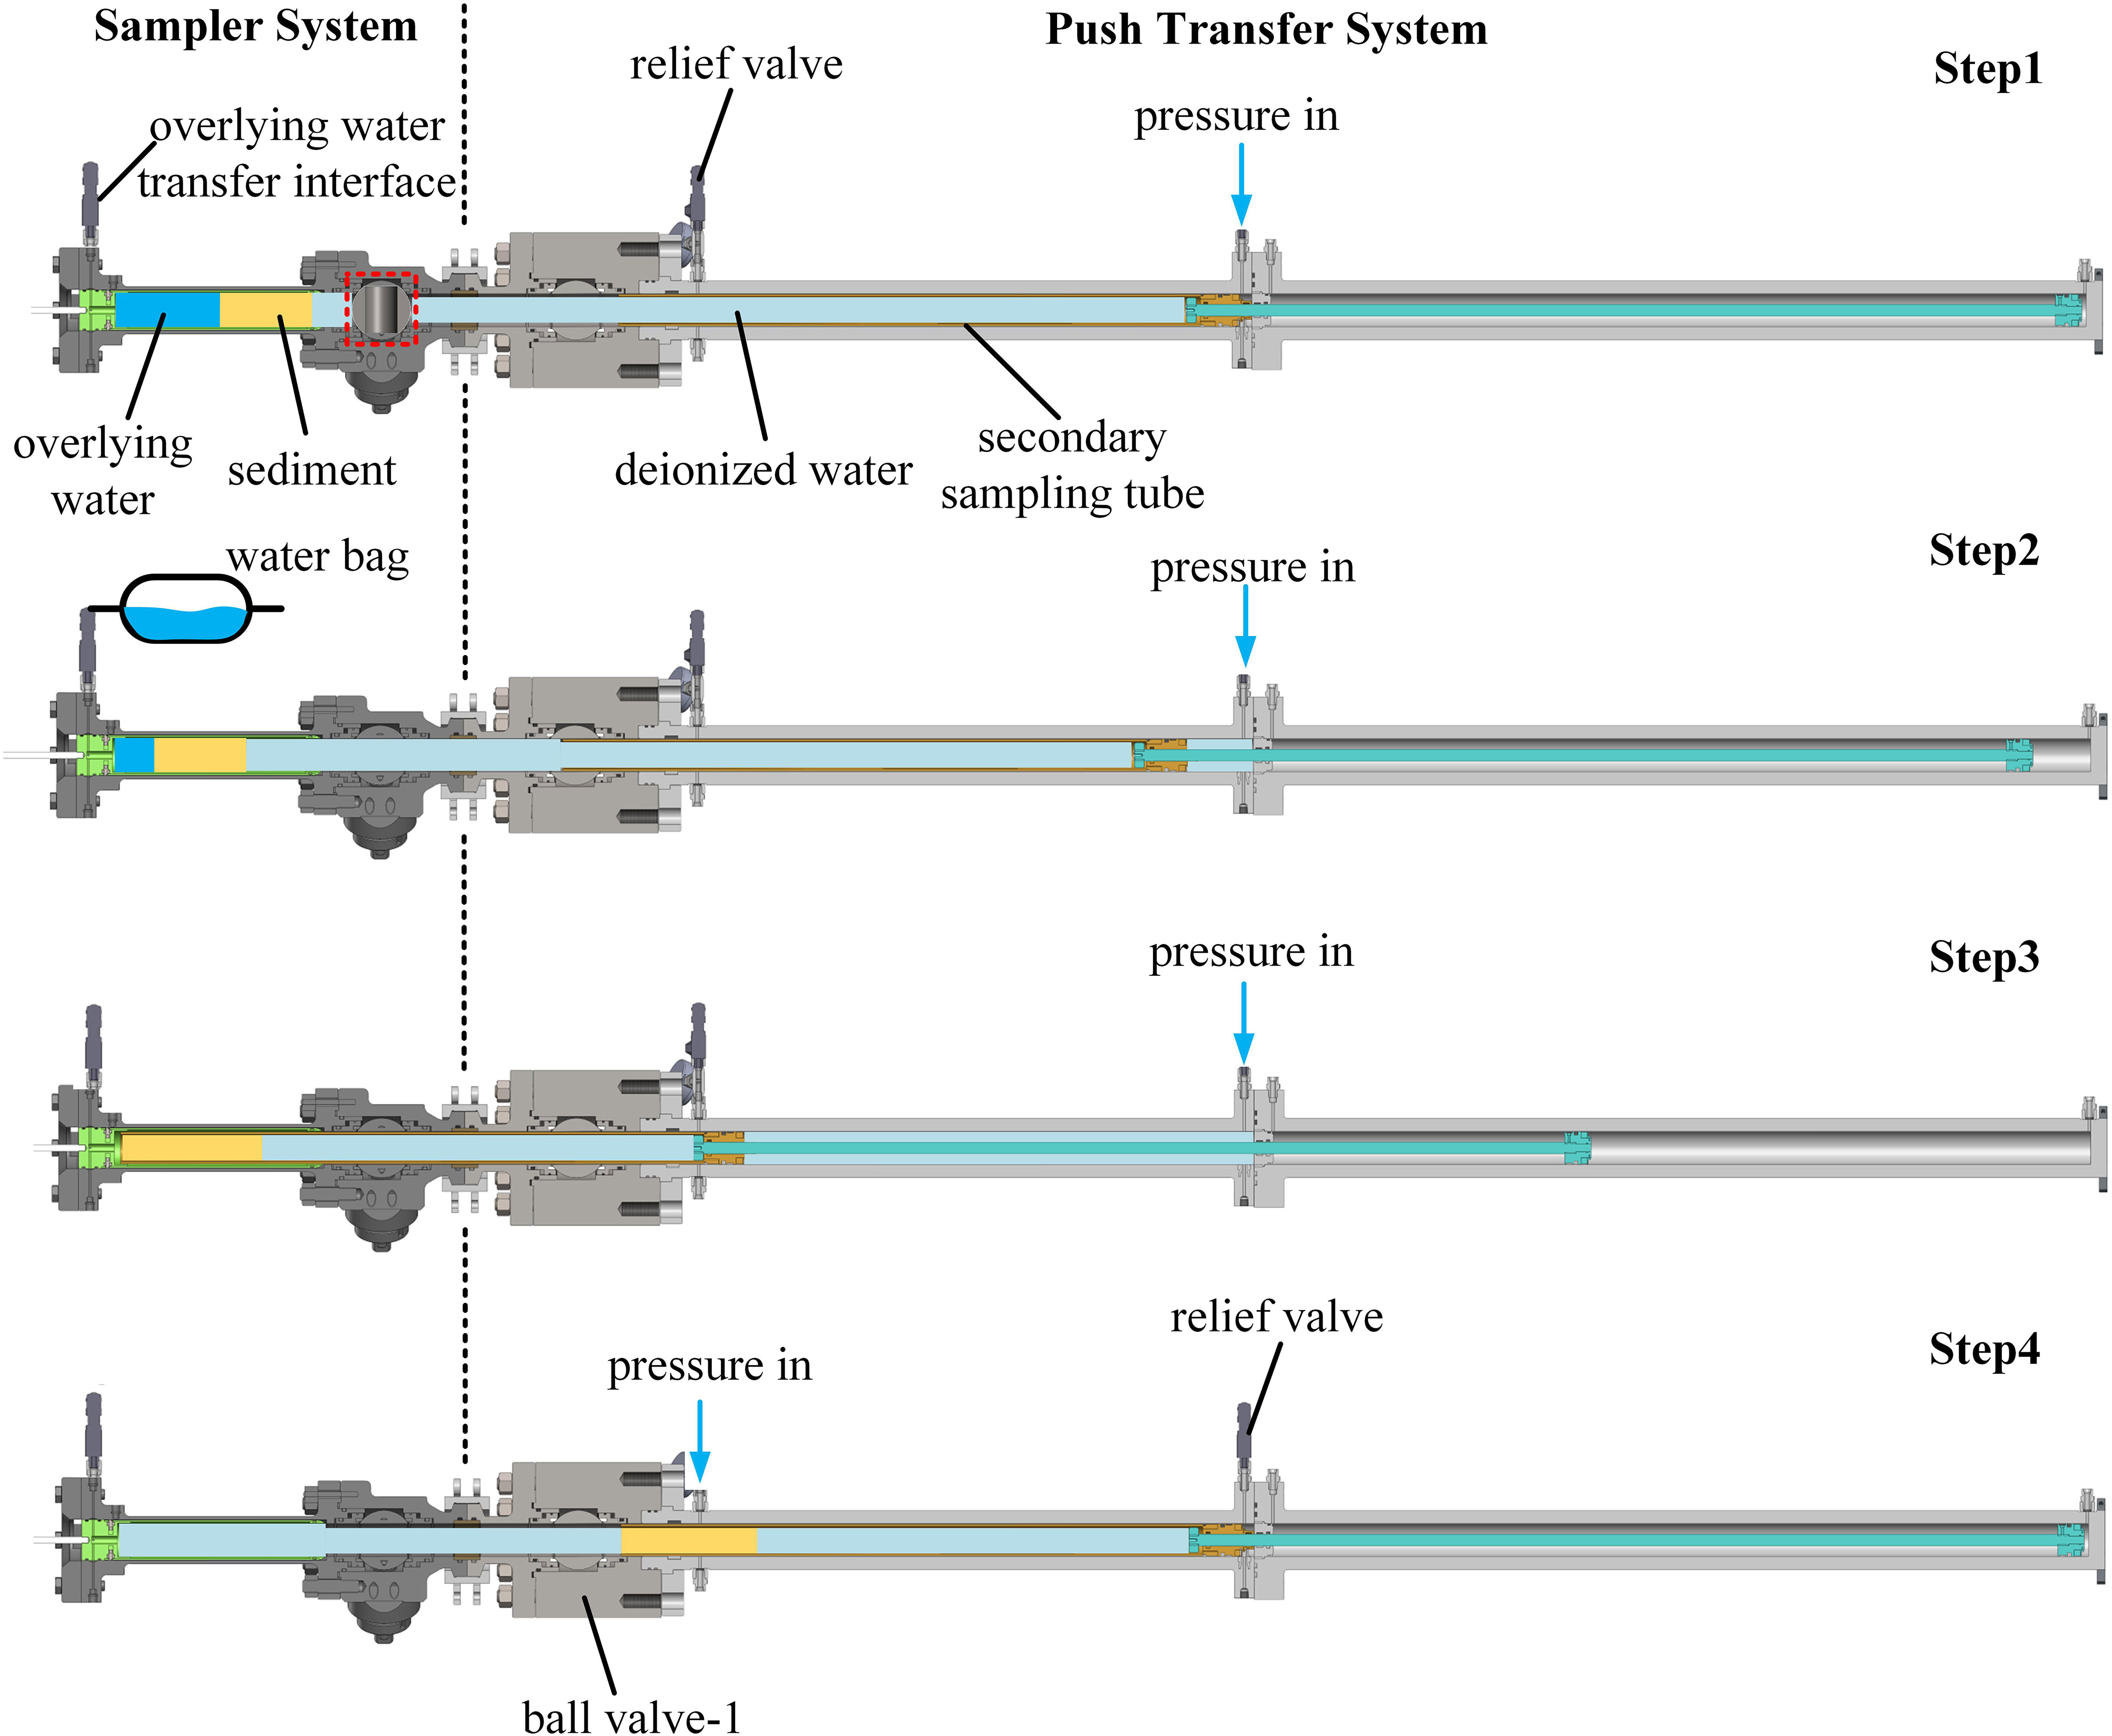
Figure 5 Schematic diagram of overlying water transfer and sediment secondary sampling process.
Step 1: The sampler system is connected with the push transfer system with a clamp, and the pressure chamber-A is pre-filled with deionized water. The installation and current position of all parts are shown in step 1 in Figure 5. The threshold pressure of the pressure relief valve at the interface-A2 is slightly greater than the internal pressure of the sampler, and the threshold pressure of the relief valve at the overlying water transfer interface is consistent with the internal pressure of the sampler. The gas-liquid booster pump is connected to the interface-A1 to pressurize the chamber-A to the same pressure as the internal pressure of the sampler to balance the pressure on both sides of the ball valve-3.
Step 2: The water bag is connected to the overlying water transfer interface, and the sampler ball valve is opened to connect the sampler chamber with the push transfer chamber. When high-pressure deionized water is pumped into the interface-A1, the sealing piston-A moves to the left and compresses the liquid in its left chamber to make the overlying water flow out of the relief valve to the water bag.
Step 3: The threshold pressure of the relief valve at the interface-A2 is adjusted to be equal to the threshold pressure of the relief valve at the overlying water interface. High-pressure deionized water (the specific pressure value will be calculated based on the simulated penetration resistance) is pumped at interface-A1. Seal piston-A (secondary sampling tube) continues to move to the left and compress the liquid in its left chamber to flow out of the relief valve at interface-A2. When the sealing piston-A moves to the leftmost end of its stroke, the secondary sampling tube completes the secondary sampling of sediment in the sampler chamber.
Step 4: The relief valve is connected to interface-A1, and the gas-liquid booster pump is connected to interface-A2 to pump high-pressure deionized water to move the sealing piston-A (secondary sampling tube) to the right and meanwhile compress the liquid in its right chamber to flow out of the relief valve at interface-A1. When seal piston-A moves to the rightmost end of its stroke, ball valve-1 of the push transfer chamber is closed. At this point, the secondary sampling process of the sediment from the sampler to the transfer device has been completed.
Figure 6 shows the process of transferring sediment to the culture kettle, which is divided into the following steps.
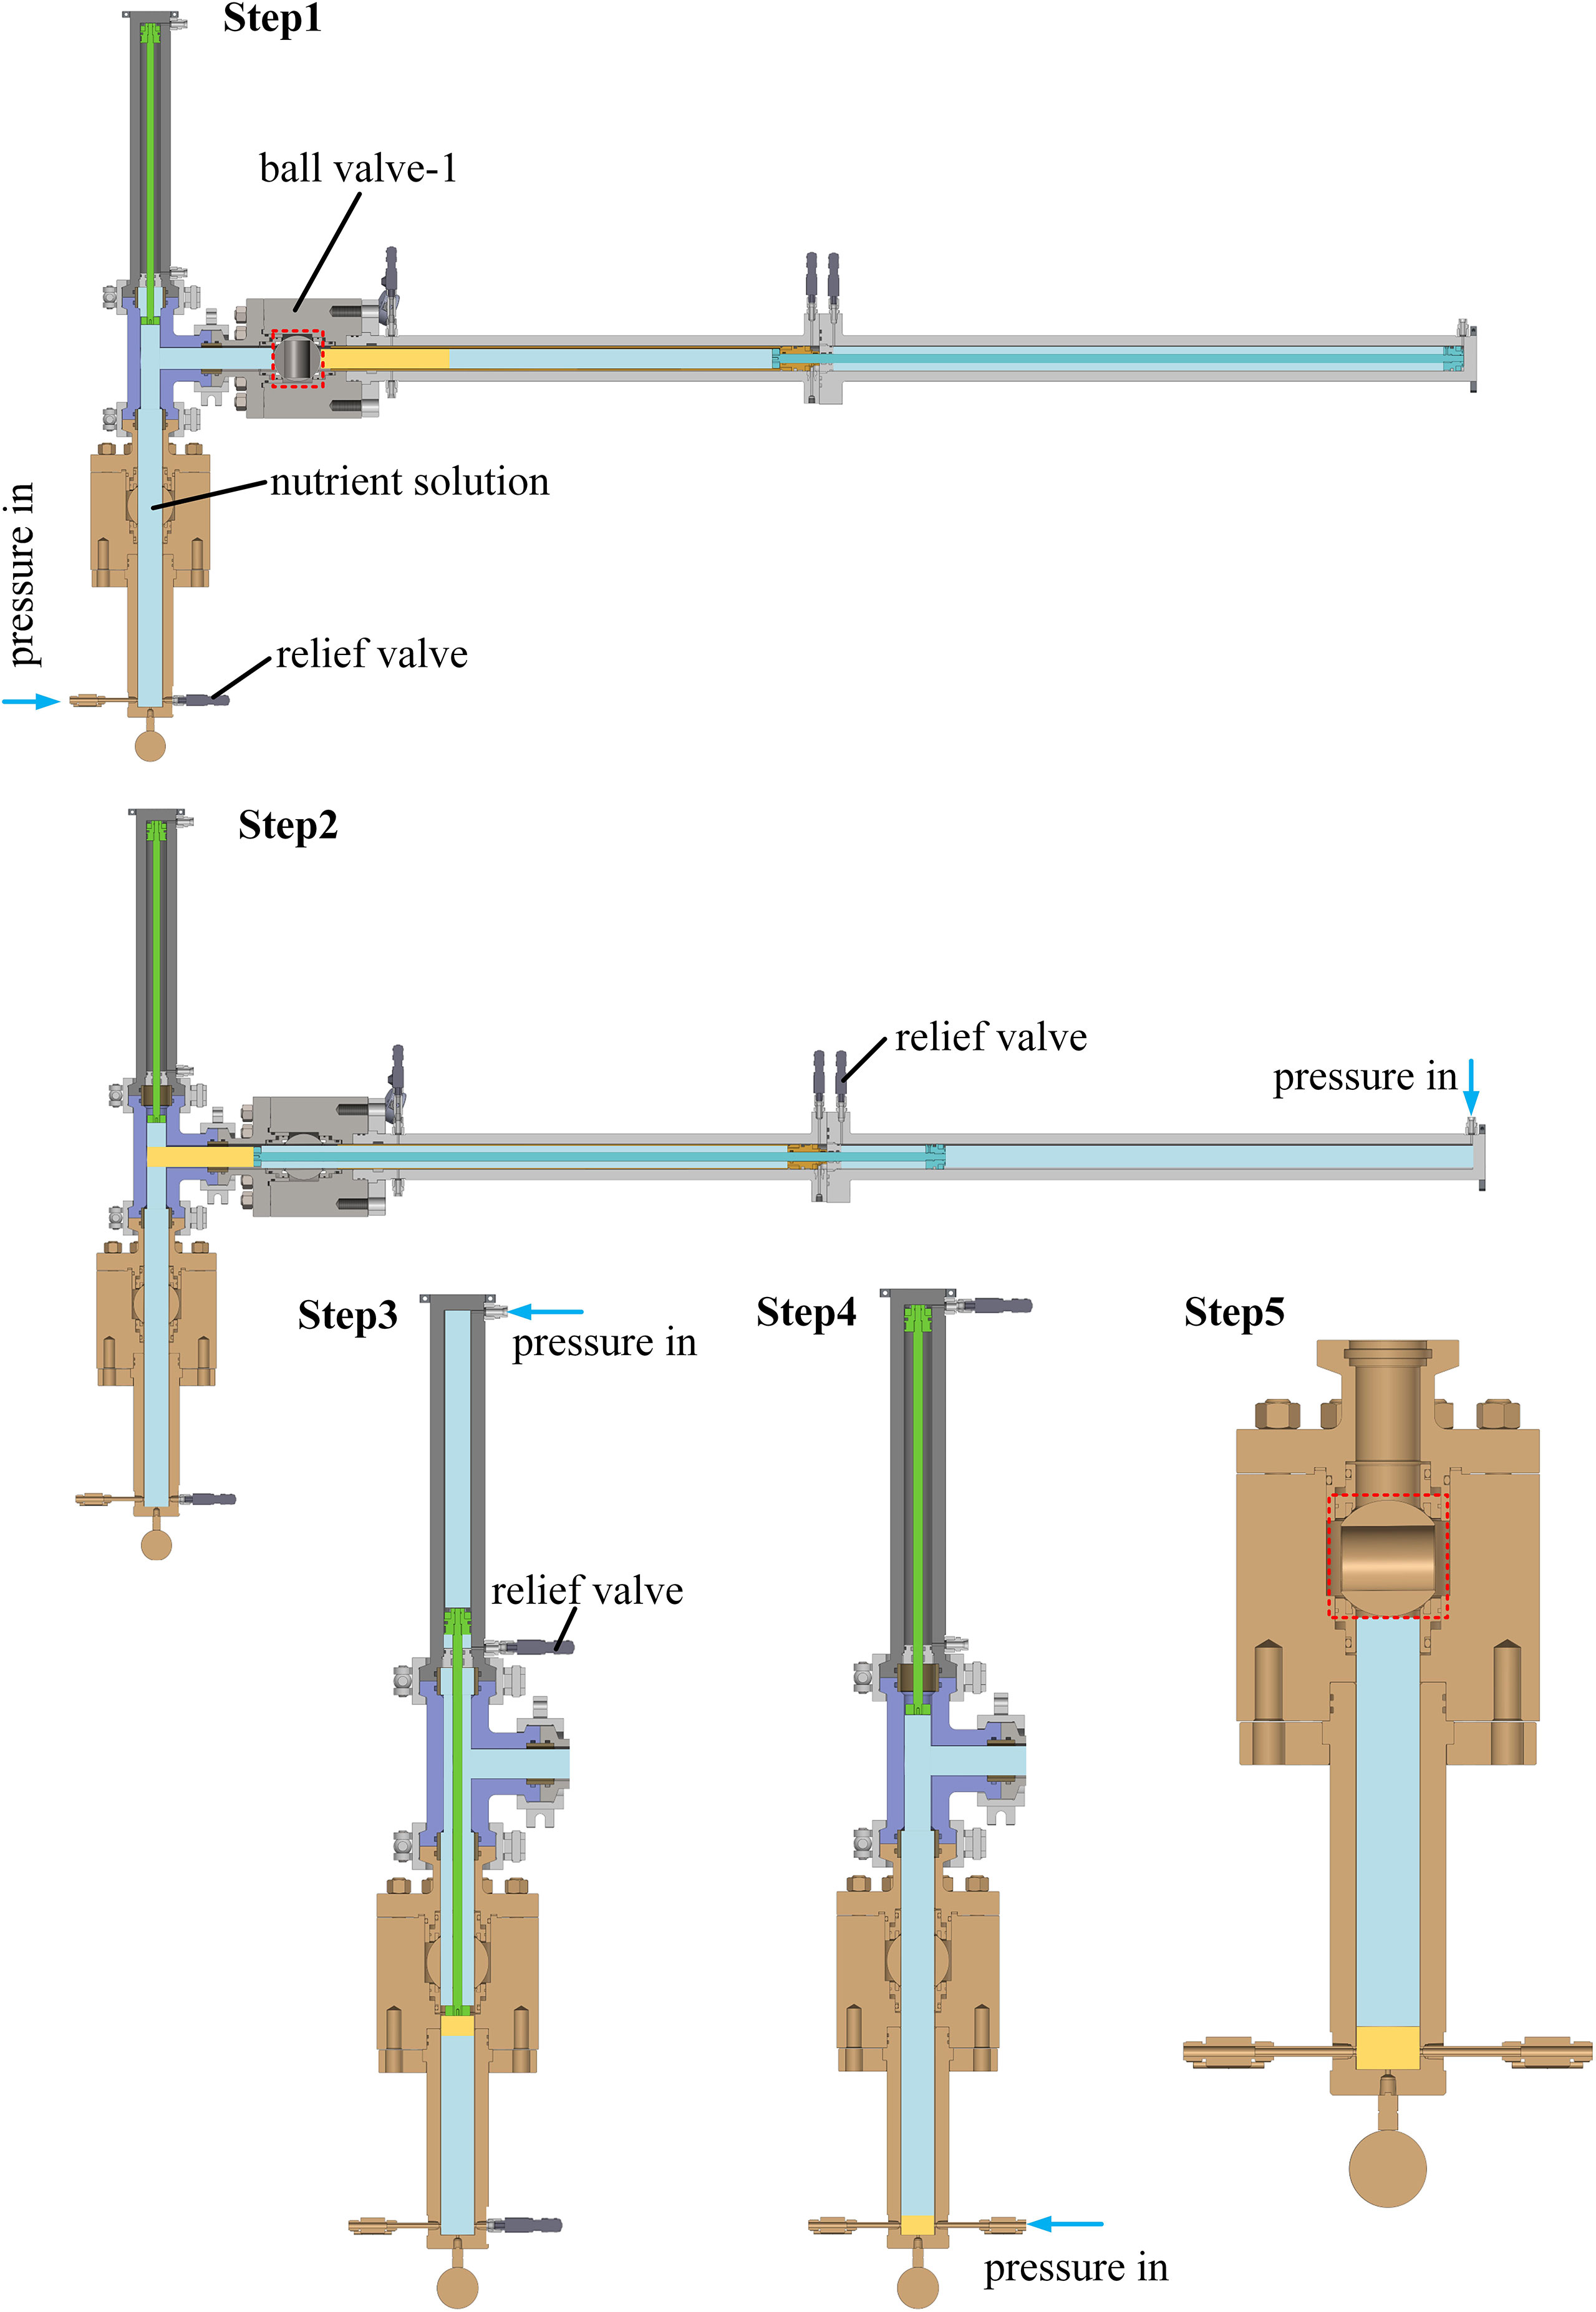
Figure 6 Schematic diagram of transferring sediment to culture kettle.
Step 1: The clamp is used to connect and seal the culture kettle system with the push transfer system, and the culture kettle cabin is pre-filled with microbial culture solution. The installation and current position of all parts are shown in step 1 in the Figure 6. The threshold pressure of the relief valve (connected with the culture kettle) is adjusted to be consistent with the internal pressure of the push transfer cabin, and the gas-liquid booster pump is connected to the side wall interface of the culture kettle to pressurize the culture kettle cabin to the same pressure as the internal pressure of the sampler to balance the pressure on both sides of the ball valve-1.
Step 2: The ball valve-1 is opened to connect the push transfer chamber with the culture kettle cabin. The threshold pressure of the relief valve at the interface-B2 is adjusted to an appropriate value, and the threshold pressure of the relief valve at the interface of the culture kettle is consistent with the internal pressure of the push transfer chamber. High-pressure deionized water is pumped into the interface-B1 to move the sealing piston-B to the left and drive the putter-B to push the sediment in the secondary sampling tube to the three-way joint.
Step 3: The threshold pressure of the relief valve at interface-C2 is adjusted to an appropriate value, and high-pressure deionized water is pumped at interface-C1 to make the sealing piston-C move down and drive the putter-C to push the sediment in the three-way joint into the culture kettle chamber.
Step 4: The relief valve at interface-C2 is moved to interface-C1, and high-pressure nutrient solution is pumped into the side wall interface of the culture kettle to make the putter-C move upward to the top of its stroke.
Step 5: The ball valve-2 and all interfaces on the side wall of the culture kettle are closed. The clamp between the ball valve-2 and the three-way joint is removed, and the culture kettle is transferred to the laboratory for further culture analysis.
In order to ensure that the secondary sampling tube can penetrate the sediment sample in the sampler smoothly with low disturbance, the penetration resistance of the secondary sampling tube needs to be defined by using the coupled Eulerian-Lagrangian (CEL) approach in the commercial package Abaqus/Explicit. Therefore, the pressure to be maintained at interface-A1 (see Figure 2) can be determined. CEL model in Abaqus has advantages in solving mesh distortion in large deformation problems (Konkol, 2015; Ko et al., 2017; Zhen et al., 2017), which has been successfully used to study the behavior of anchors during dynamic installation in non-homogeneous clay (Kim and Hossain, 2017) and optimize the gravity coring (Qin et al., 2016). The Euler mesh used in the CEL approach can be void domain, or part or all of it is occupied by more than one material, and its volume fraction represents the part of the mesh filled with a specific material.
As shown in Figure 7, the diameter and length of the sediment inside the sampler are 56 mm and 150 mm respectively (the volume is 369.5 ml), and 100 mm thick (no material) void field is set at the end of the sediment to provide a place for sediment deformation during secondary sampling. The inner diameter and outer diameter of the secondary sampling tube are 42mm and 48mm, respectively. The computational domain is divided into hexahedral structured mesh, and the mesh size is shown in Table 1. The sampling tube is simplified as a rigid body and is assumed to be vertical and not inclined during the penetration process. In simulation, the soil is modeled as an elasto-perfectly plastic material that obeys the mohr-coulomb yield criterion. In the entire soil profile, the elastic behavior is defined by poisson’s ratio of 0.4 and young’s modulus of 10 MPa and the plastic behavior is defined by a friction angle of 12 degrees and a cohesive force of 15 KPa (Tong et al., 2019).
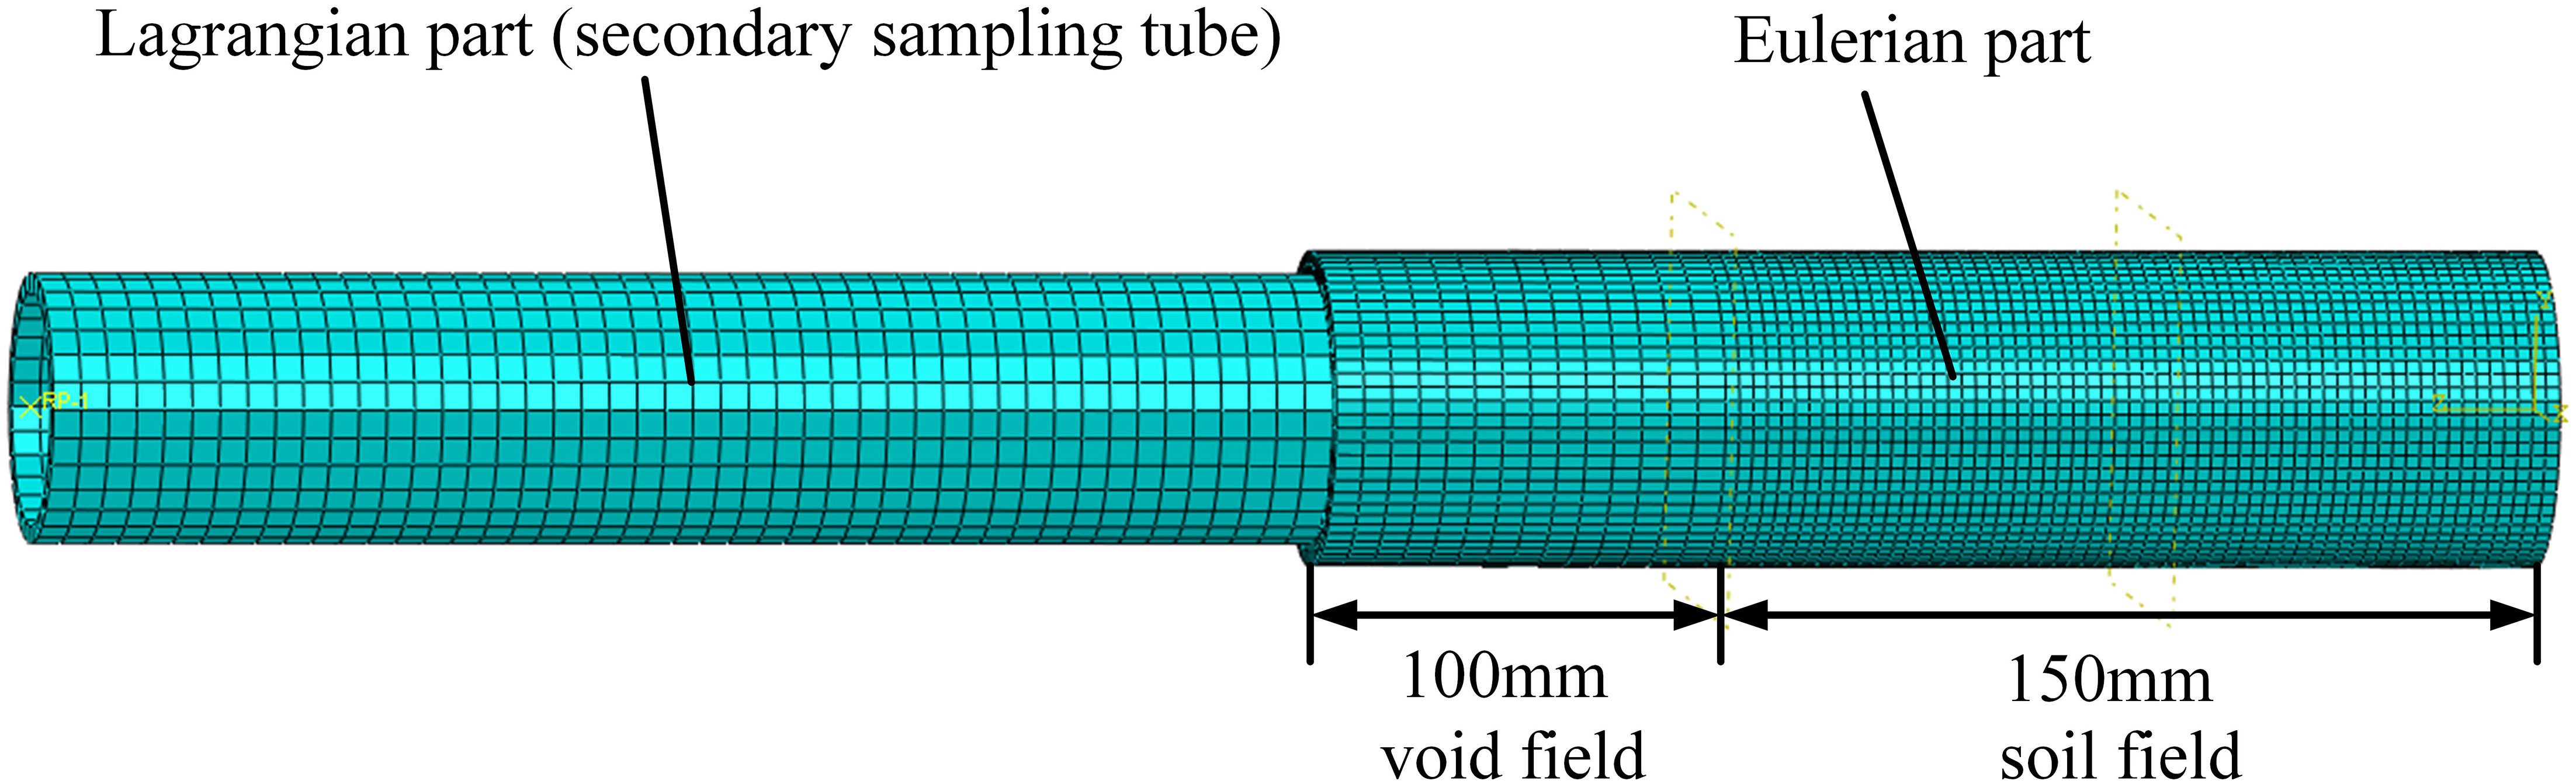
Figure 7 Meshes of penetration simulation used in CEL analysis.

Table 1 Size and number of meshes used in Abaqus.
In order to verify that the device can maintain the pressure stability of the sample during transfer process to avoid the death of microorganisms and decomposition of dissolved gas, the pressure fluctuations during sample transfer were simulated in the software AMESim (advanced modelling environment for performing simulation of engineering systems), which is widely used for numerical calculations of hydraulic problems (Zhao et al., 2009; Xuanyin et al., 2010; Ramakrishnan et al., 2012; Zeng et al., 2018).
For the simulation model, the HCD (hydraulic component design) library and the HYD (hydraulic) library are used to build the model, and the spring element is used to simulate the resistance existing in the process of marine sediment transfer. The corresponding chamber pressure change is simulated by variable volume pressure change, and reasonable pipe diameter, pump speed, mass of mass block, leakage coefficient, etc. are set to ensure that they are close to the actual working conditions. As shown in Figure 8A, the reciprocating linear motion of the secondary sampling tube is achieved by using the throttle valve and the waveform signal control channel. Figure 8B shows the simulation model of the process of pushing the sediment with putter-B. In addition, it should be noted that the piston with spring module in Figure A needs to be replaced with the rightmost piston module when the secondary sampling tube moves in different directions. For the process of pressurization, a sinusoidal signal plus a random signal is used to simulate the actual working condition of a single-stroke gas-liquid booster pump. Table 2 lists the settings of key parameters in the simulation.
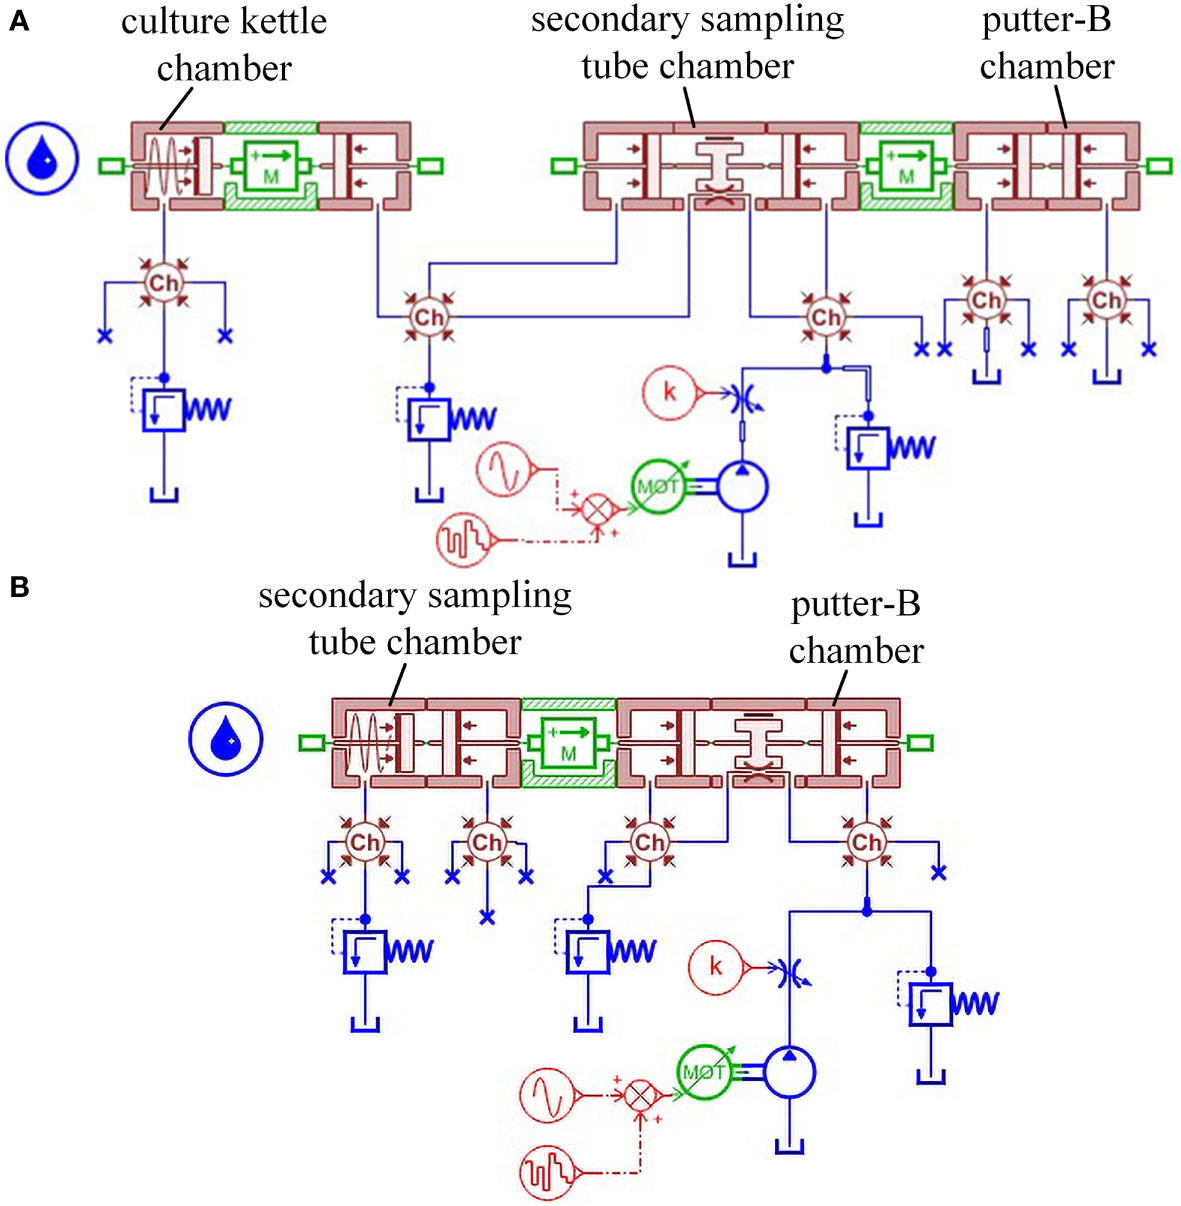
Figure 8 Simulation model, (A) the movement process of the secondary sampling tube, and (B) the movement process of the putter-B.
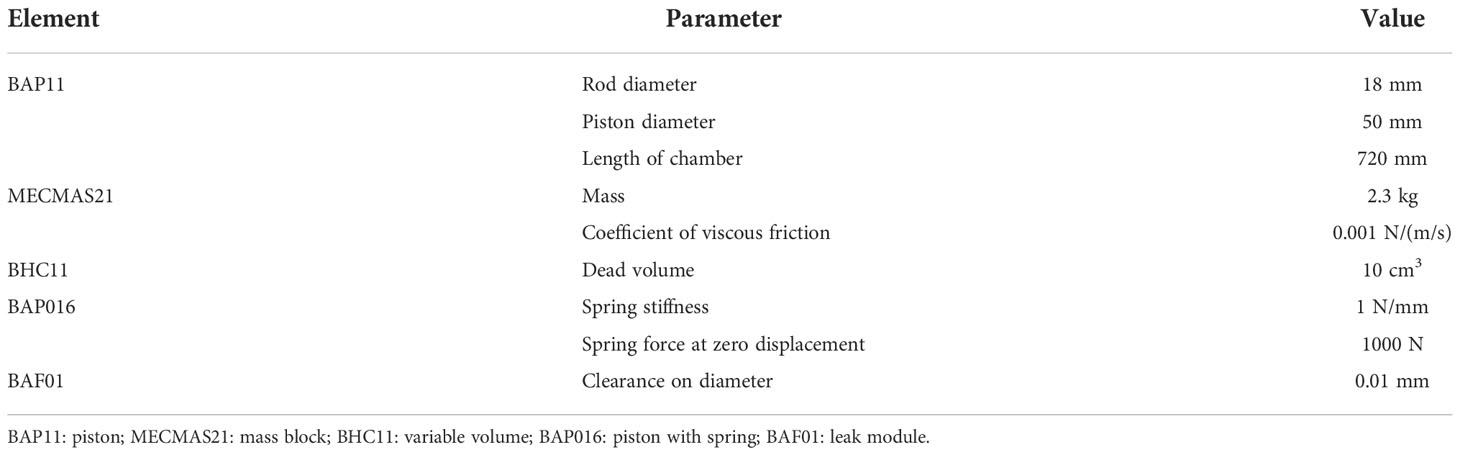
Table 2 Key parameters in the simulation.
In order to further understand the real performance of the device to maintain pressure stability, and also to verify the simulation results, the transfer test under high pressure is adopted.
As shown in Figure 9, according to section 2.4 Transfer process, the sealed chambers formed by the transfer device and the sampler, the transfer device and the sediment culture kettle were constructed respectively to check sealing and pressure-retaining performance. Before the test, the pressure sensor and gas-liquid booster pump are connected with the interface of the transfer device. During the test, the gas liquid booster pump pumps water into the internal chamber of the transfer device to pressurize, and the pressure-retaining performance of the device is reflected by measuring the pressure drop within two hours.
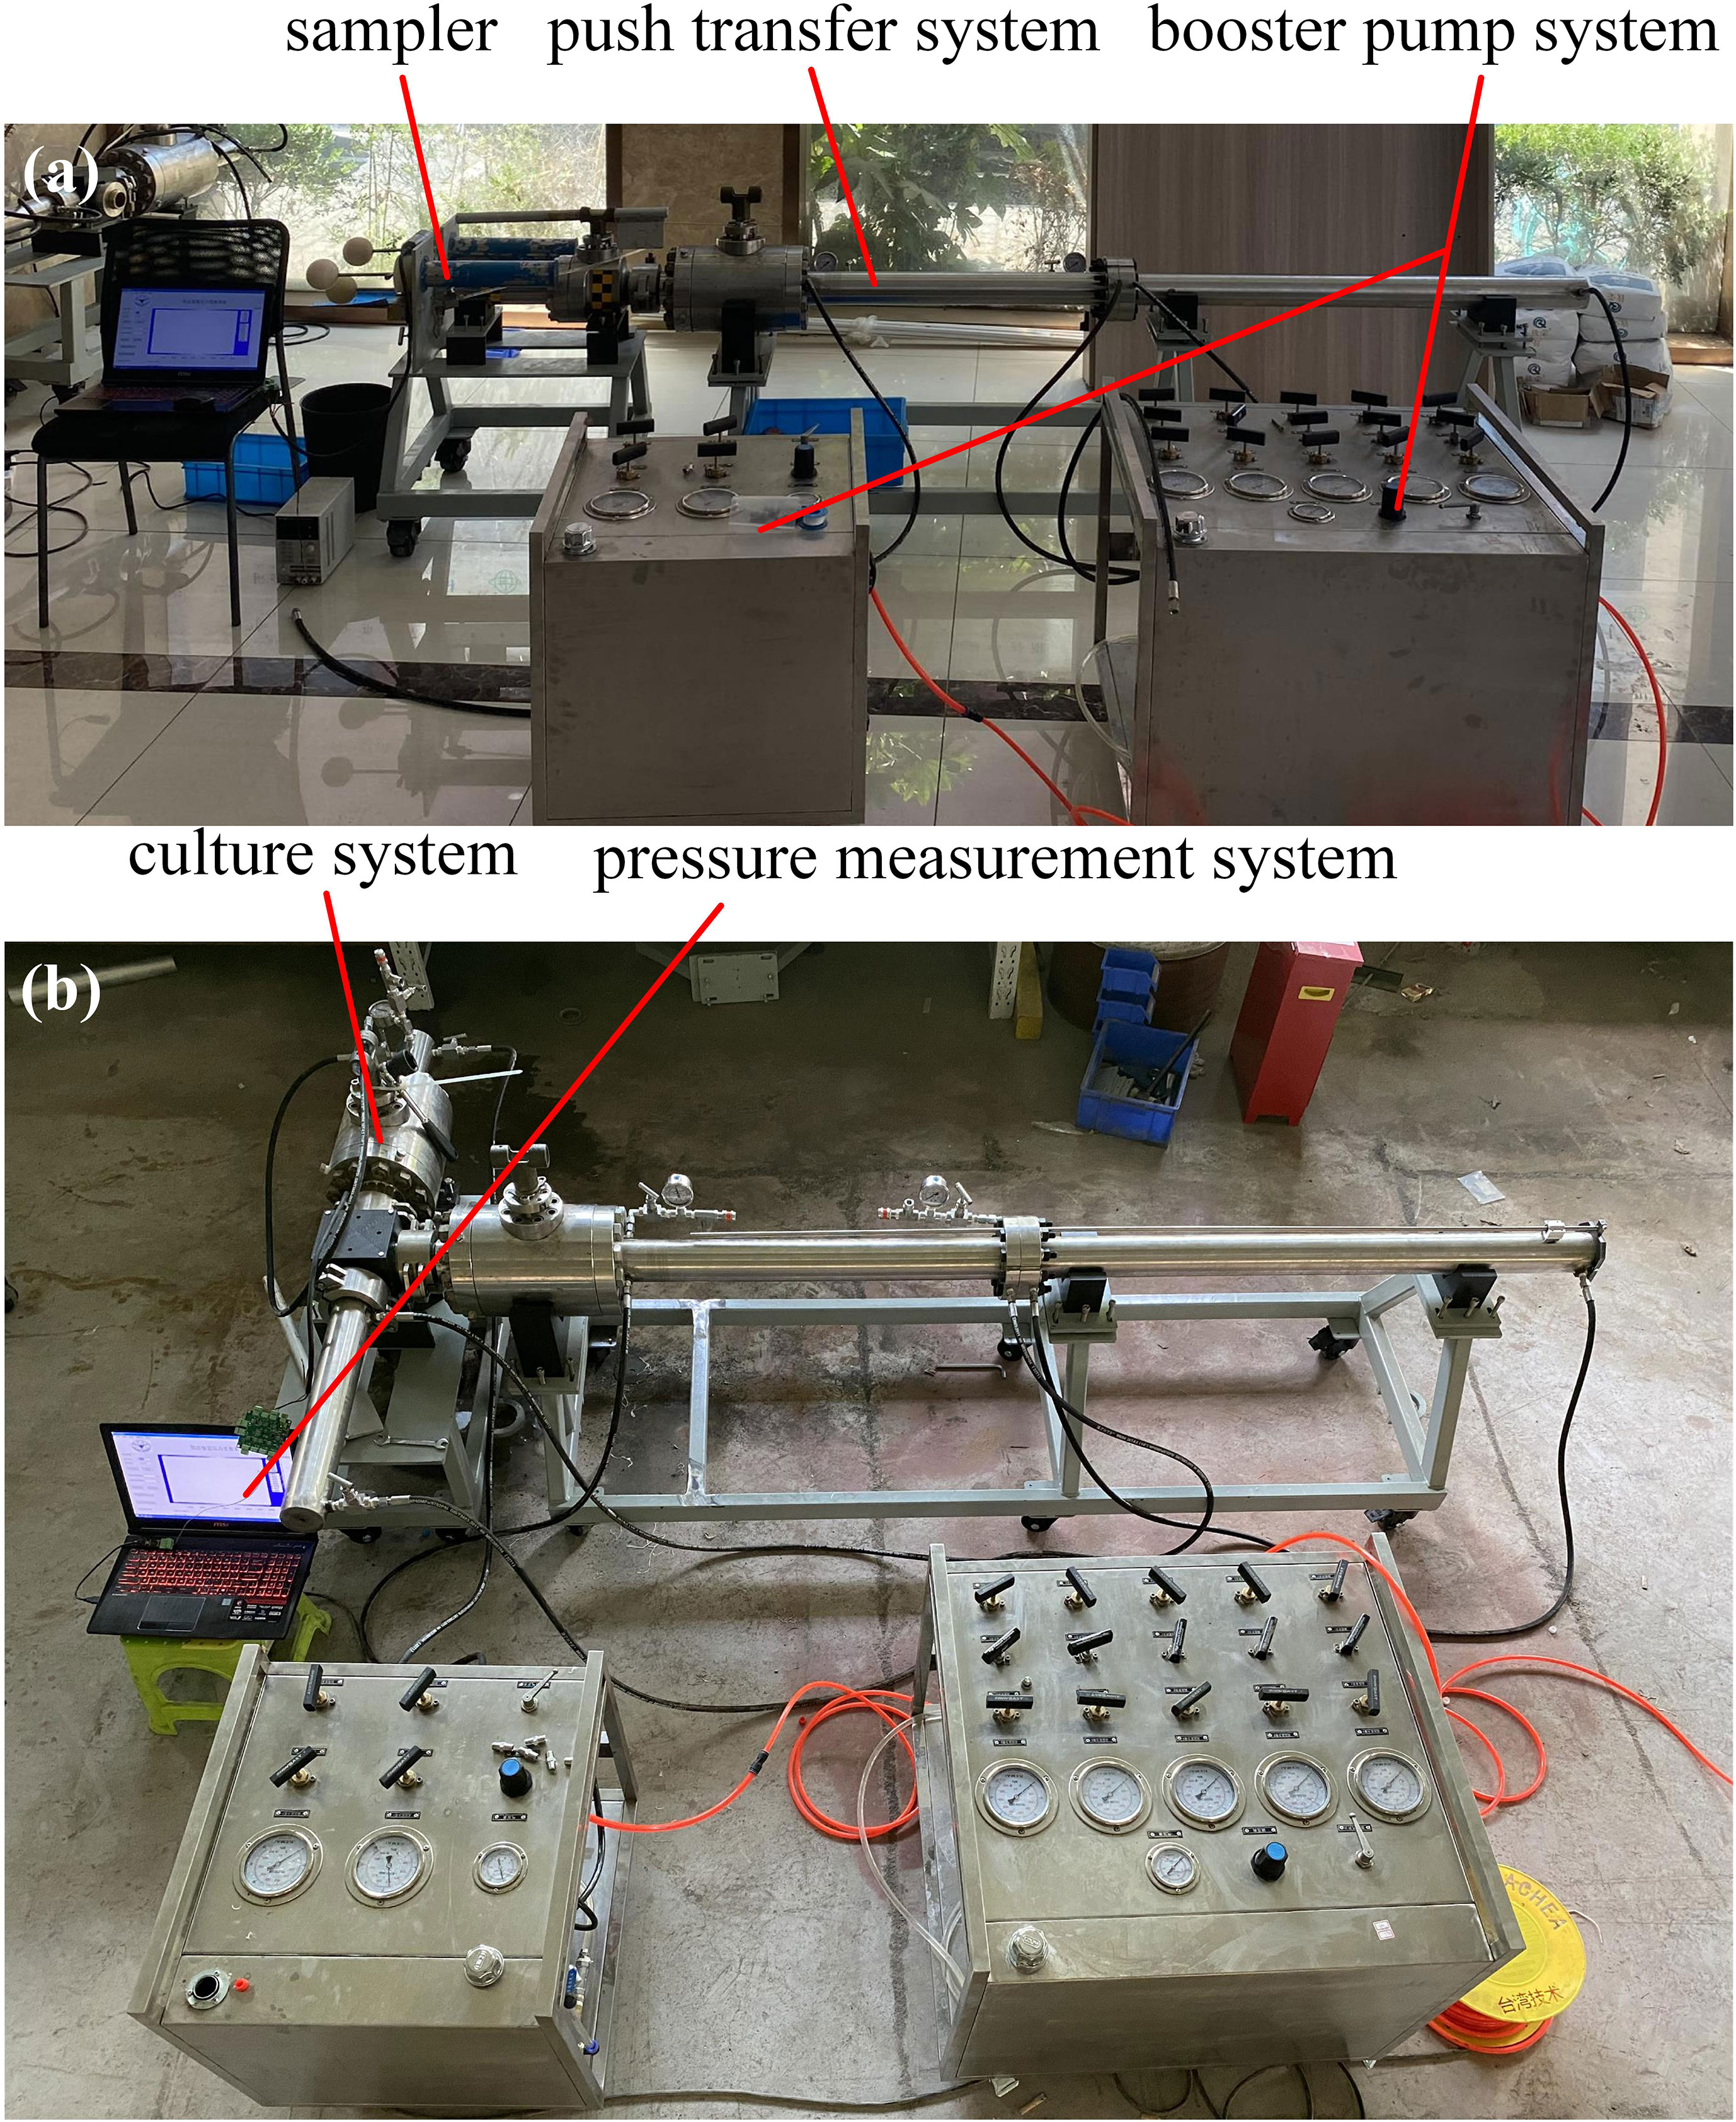
Figure 9 Experimental device and construction, (A) the transfer device is connected to the sampler and (B) the transfer device is connected to the culture kettle.
Furthermore, according to the operation process in section 2.4.1. The process of overlying water transfer and sediment secondary sampling and 2.4.2. The process of transferring sediment to the culture kettle, the pressure evolution during the transfer process is measured to reflect the performance of the transfer device to maintain pressure stability.
Based on the penetration force of secondary sampling tube, the mesh independence in numerical simulation is studied. As shown in Figure 10A, the penetration resistance decreases first with the number of meshes increasing from 23816 to 68372. When the number of meshes exceeds 68372, the penetration resistance tends to be stable, that is, the number of meshes is used in the following simulation. In addition, since the sediment inside the sampler is soft, the penetration force of the secondary sampling tube remains at a low level (about 140 N, this value can be used to determine the injection pressure during the transfer process), which is Much lower than the penetration resistance of the shallow sediment sampler (Chen et al., 2020; Guo et al., 2022; Wang et al., 2022). When the penetration depth is close to 150mm, the sediment between the end of the secondary sampling tube and the end of the sampler is compacted and hardened, resulting in the sudden increase of the penetration force. Therefore, during the actual pressure-retaining transfer, a penetration depth of 140 mm can be used to prevent the damage of the secondary sampling tube.
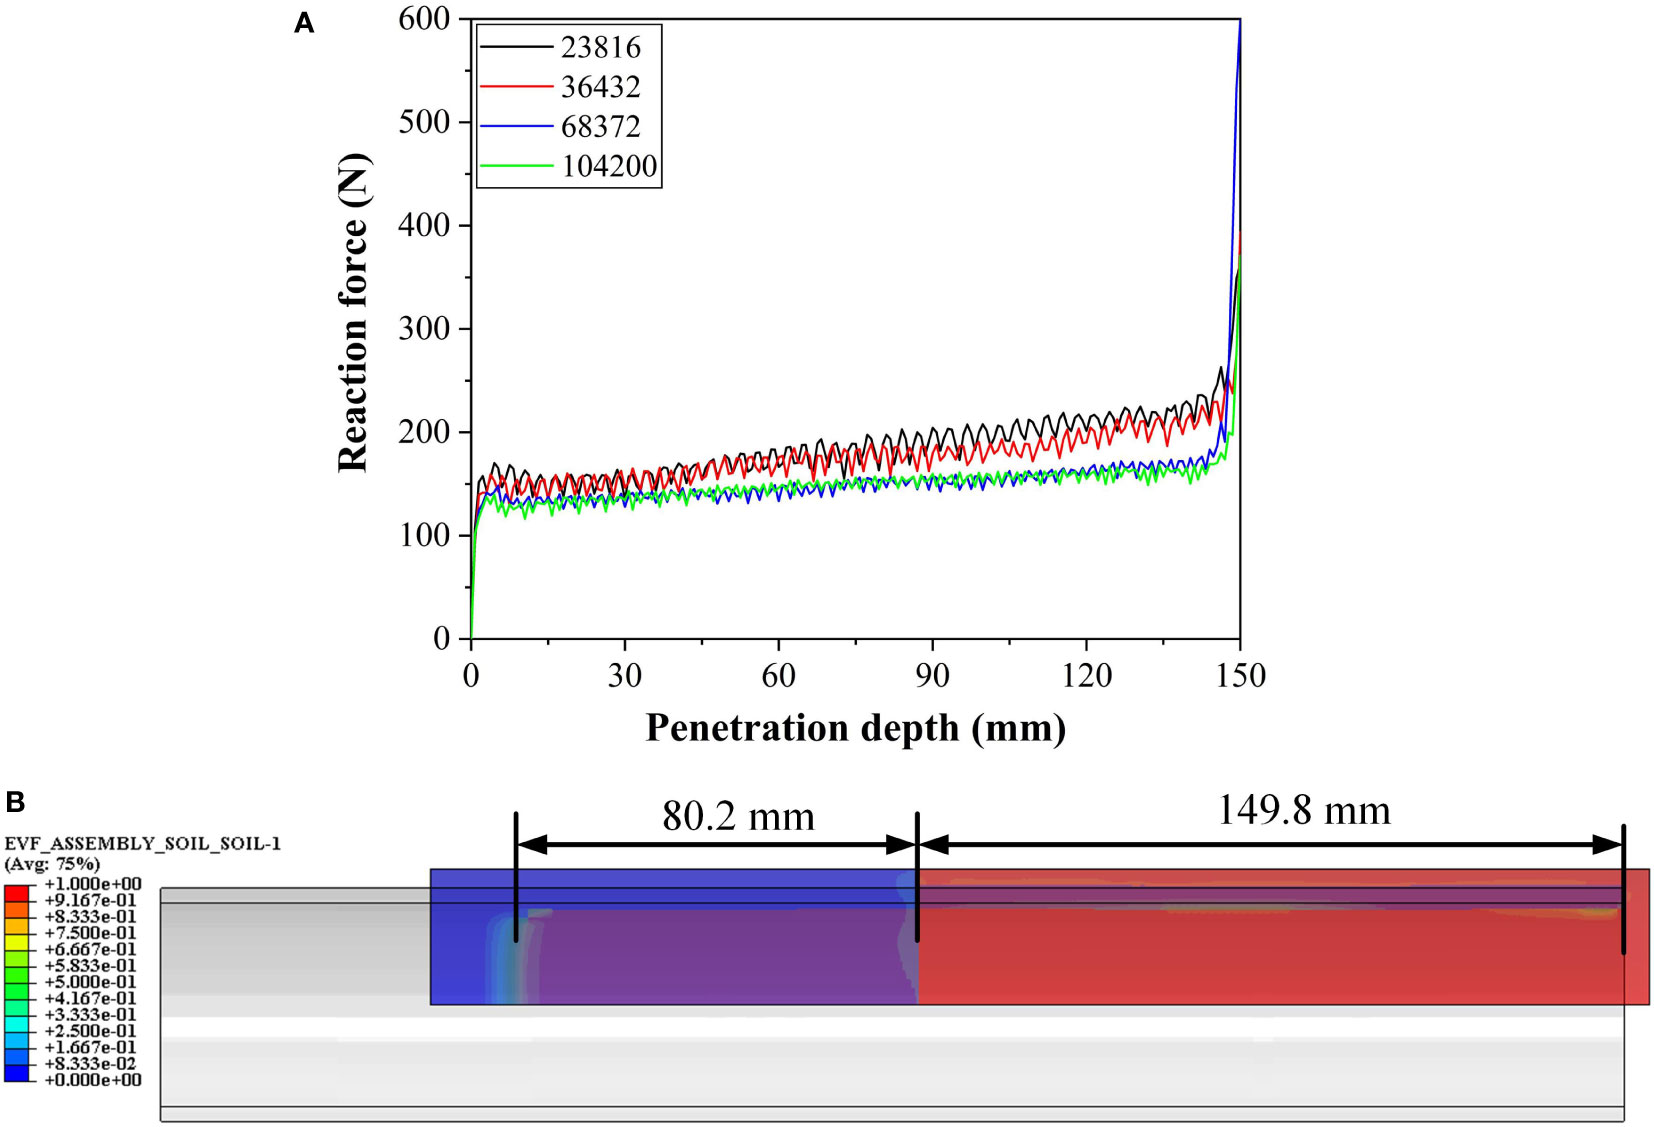
Figure 10 (A) Evolution of penetration resistance with penetration depth, and (B) profile of soil deformation.
Furthermore, the distribution of sediments in secondary sampling tube is shown in the Figure 10B, the actual sediment volume in the secondary sampling tube is 318.68 ml without soil plug effect, which shows the feasibility of the transfer scheme.
Since the sampling tube is made of thin-wall PC tube, the buckling failure is the primary form of failure during penetration. In structural mechanics, the criterion of buckling failure of slender members under compression is determined by the critical force FPcr. Therefore, the critical force FPcr = 580.5 N of tube, which is greater than penetration force, can be calculated by the equation (1) given by Batdorf et al. (1947), where r is the radius, t is the wall thickness, L is the length and μ is the poisson’s ratio, and the Kx in the formula can be obtained by the relationship between it and the variable Z.
The Figures 11A-C show the simulated pressure evolution of the three key steps (pushing the secondary sampling tube into the sampler, recovering secondary sampling tube, and pushing the putter-B) with the movement of the mechanism under three pressure conditions (10MPa, 20MPa, and 30MPa) respectively. Comparing the Figures 11A-C, it can be seen that the pressure fluctuation amplitudes caused by the actions of the three mechanisms under different pressure conditions are all within 0.89 MPa, which shows that the pressure fluctuation amplitude has no obvious relationship with the pressure of the working conditions and also the mechanism that produces the action. The pressure fluctuations of each process at different pressure conditions can be found in Table 3.
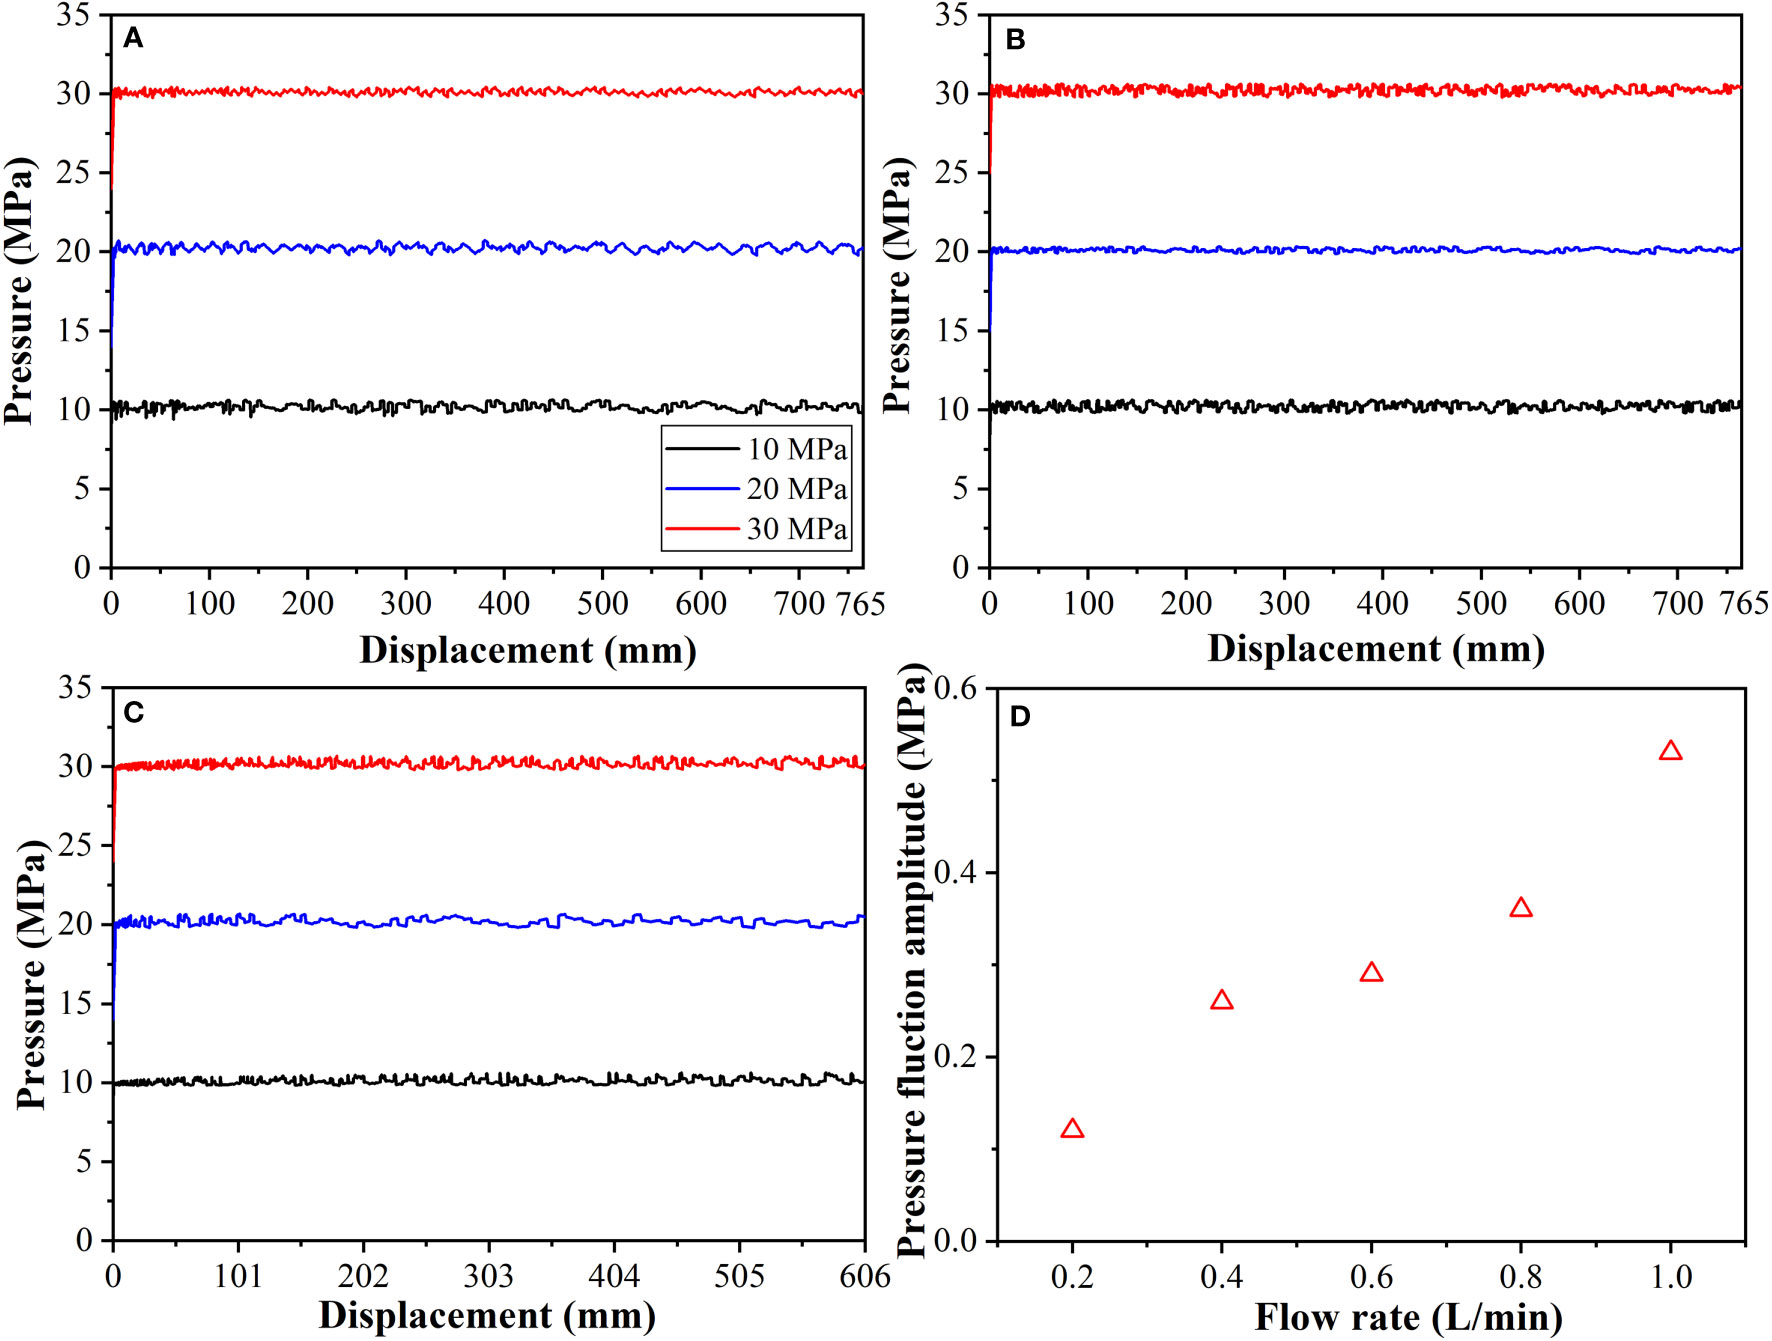
Figure 11 Pressure evolution with displacement during the process of (A) pushing the secondary sampling tube into the sampler (Step3 in section 2.4.1), (B) recovering secondary sampling tube (Step4 in section 2.4.1), (C) pushing the putter-B (Step2 in section 2.4.2), and (D) pressure fluctuation amplitude at different flow rates.
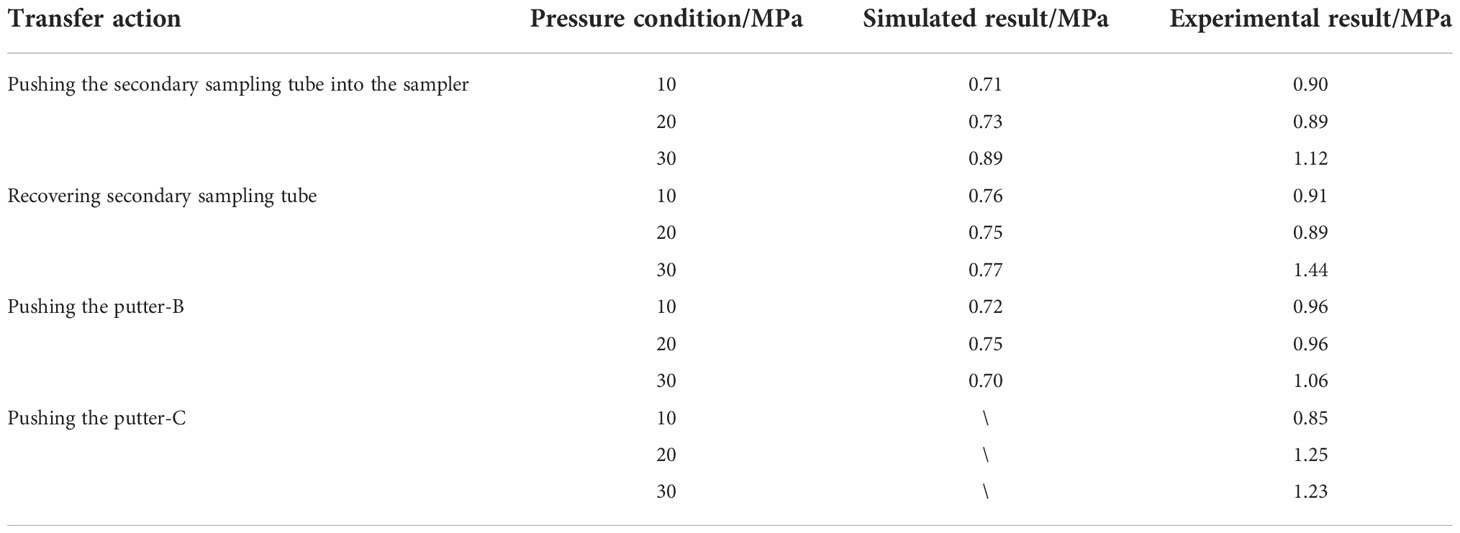
Table 3 Simulated and experimental pressure fluctuations.
Moreover, in order to identify the factors that affect the pressure fluctuation amplitude, based on the process of pushing the secondary sampling tube into the sampler, the influence of the outlet flow of the booster pump on the pressure fluctuation amplitude was studied. As shown in the Figure 11D, the pressure fluctuation amplitude increases with the increasing outlet flow of the booster pump, which means that a small flow booster pump can be selected to keep the pressure stability during the transfer process.
Furthermore, the laboratory test is carried out to verify the feasibility of device application, and also verify the simulation results. Figure 12 shows the internal pressure drop of the two systems within 2 hours, and the pressure decreased from 30.60MPa to 28.34MPa (system-1, decreased by 7.4%) and 30.60MPa to 28.18MPa (system-2, decreased by 7.9%), respectively, which shows that the transfer device has sufficient strength and sealing performance compared with other pressure-retaining devices (Abid et al., 2015; Peoples et al., 2019; He et al., 2020). Since the volume of the system-2 chamber is greater than the volume of the system-1 chamber, the pressure drops in system-2 is greater.
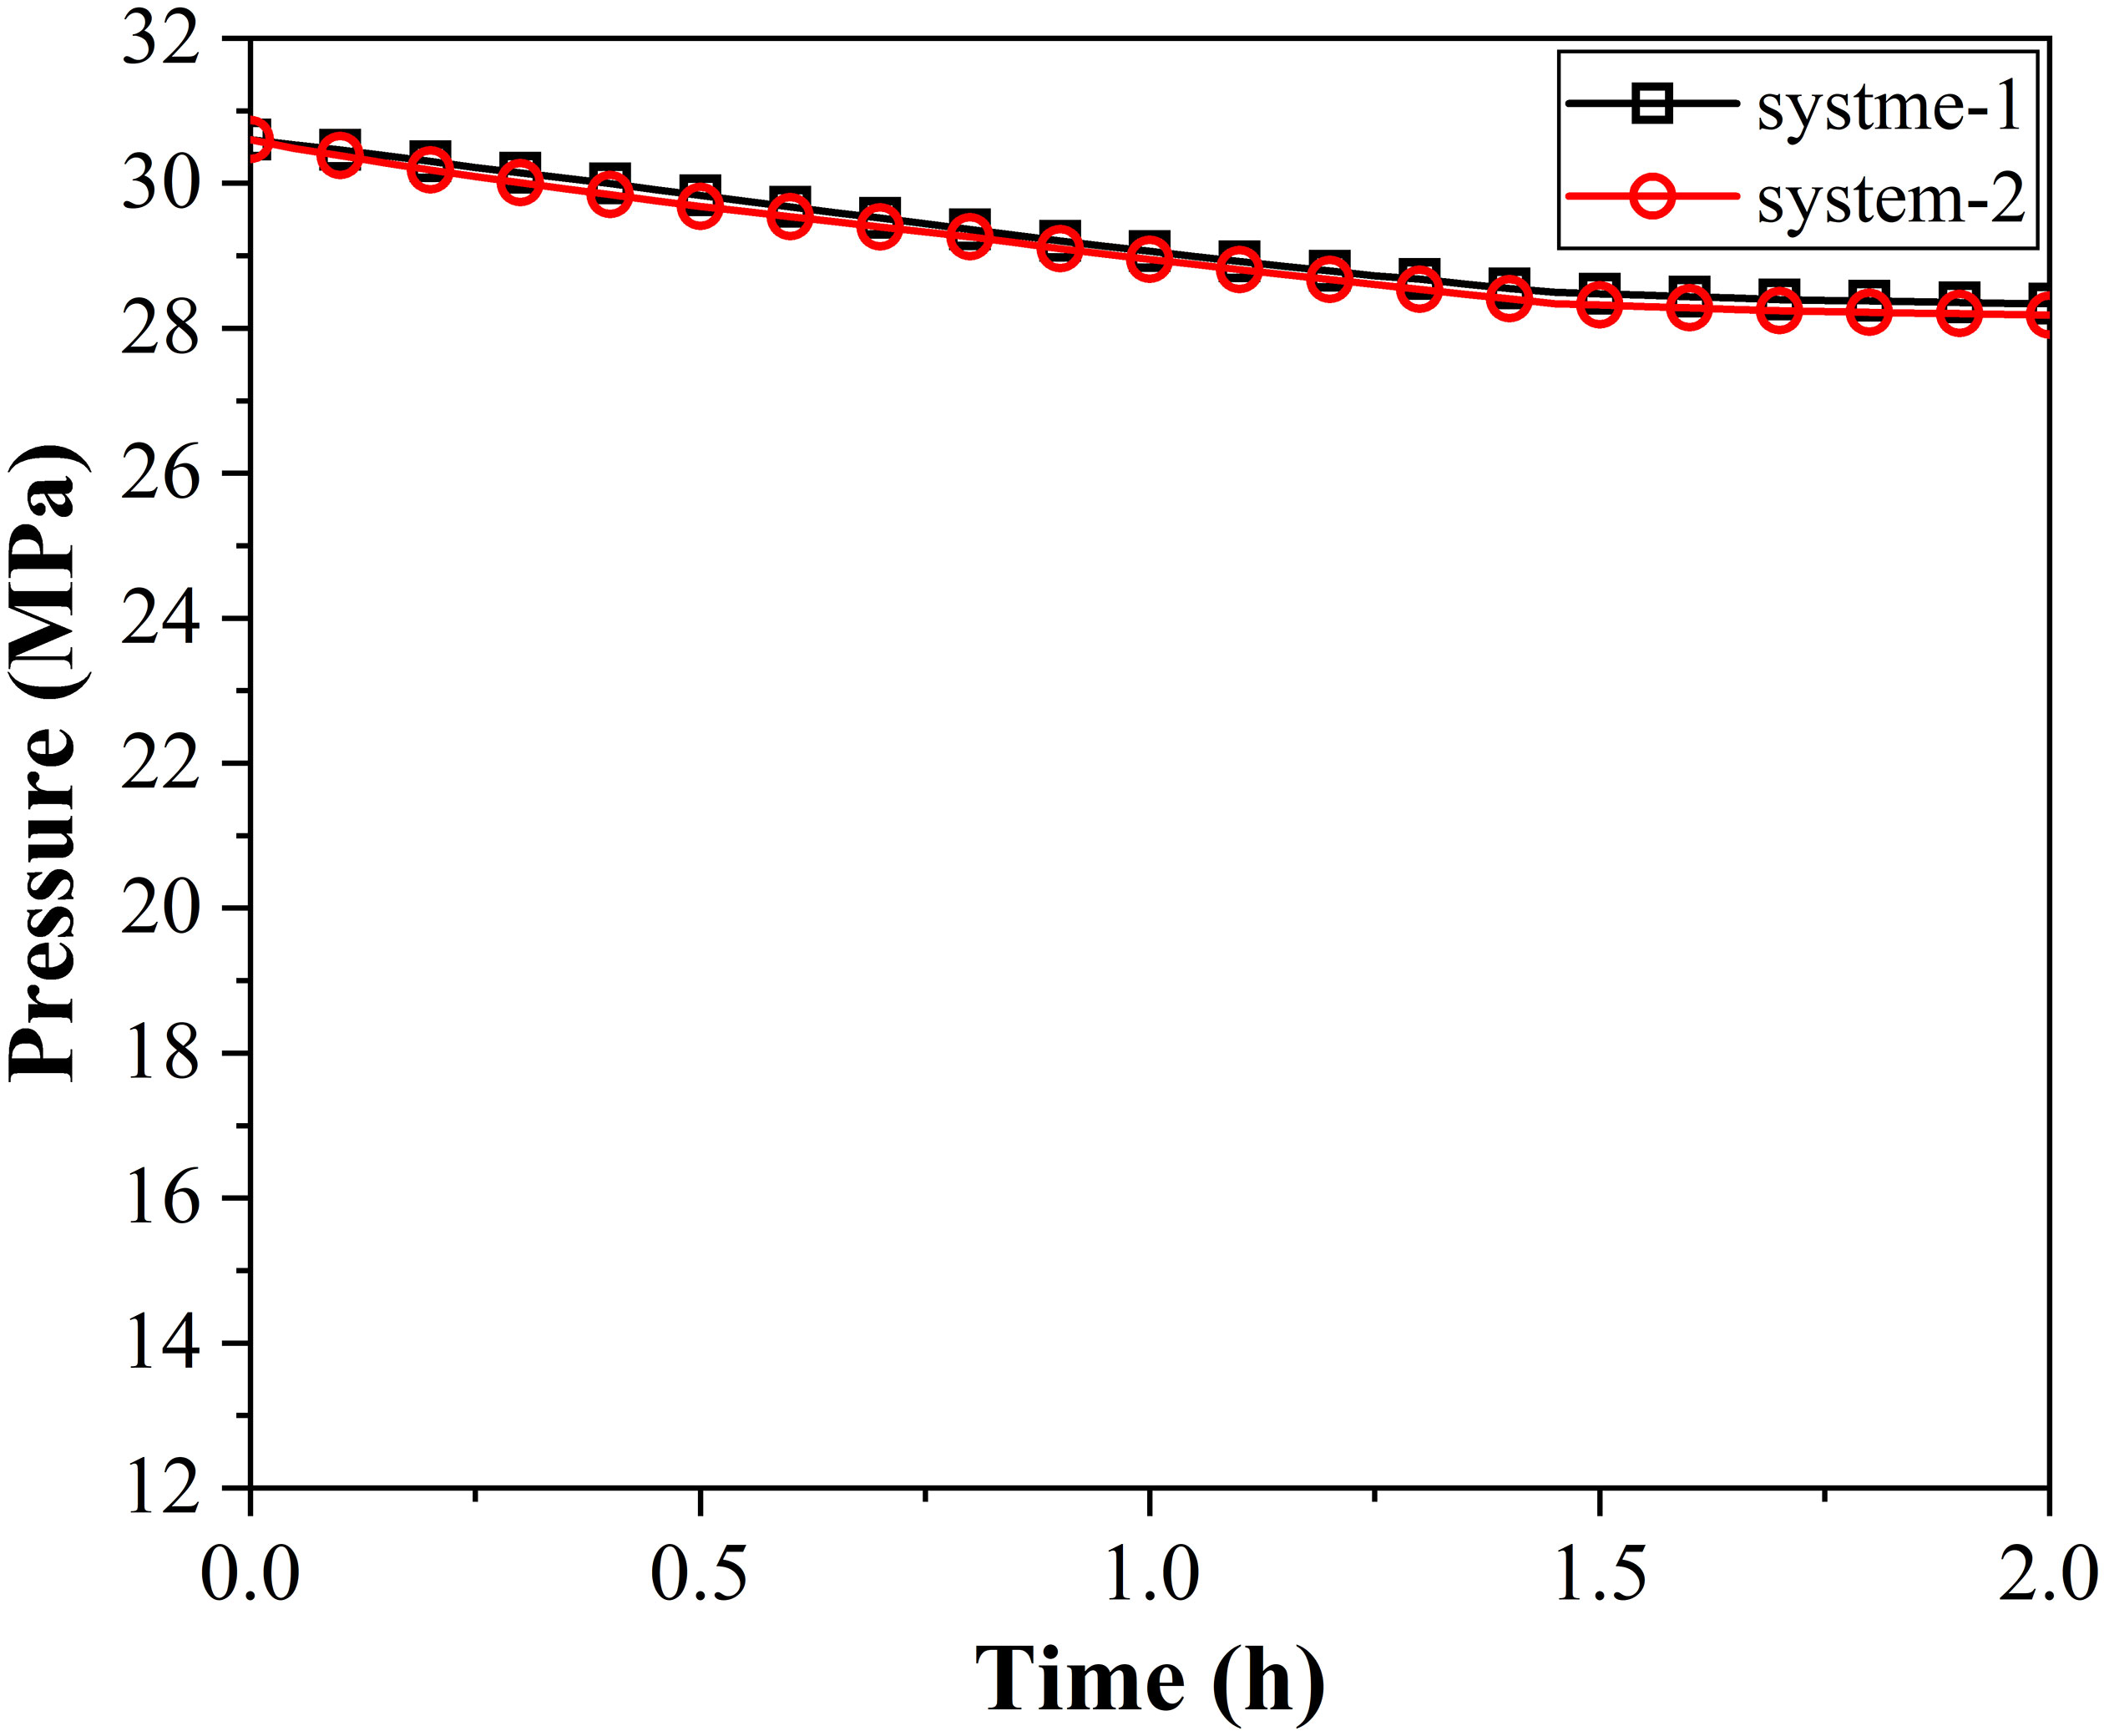
Figure 12 Evolution process of internal pressure of system-1 and system-2 within 2 hours. system-1: the transfer device is connected to the sampler, and system-2: the transfer device is connected to the culture kettle.
The Figure 13 shows the experimental pressure evolution of the four key steps (pushing the secondary sampling tube into the sampler, recovering secondary sampling tube, pushing the putter-B, and pushing the putter-C) with the movement of the mechanism under three pressure conditions (10MPa, 20MPa, and 30MPa) respectively. The largest pressure fluctuation occurs in the recovery process of the secondary sampling tube under 30MPa, and the pressure fluctuation amplitude is 29.96MPa to 31.40 MPa (a change of 4.8%, Figure 13B), which is slightly larger than the simulation result (0.89MPa). The pressure fluctuations of each process at different pressure conditions can be found in Table 3.
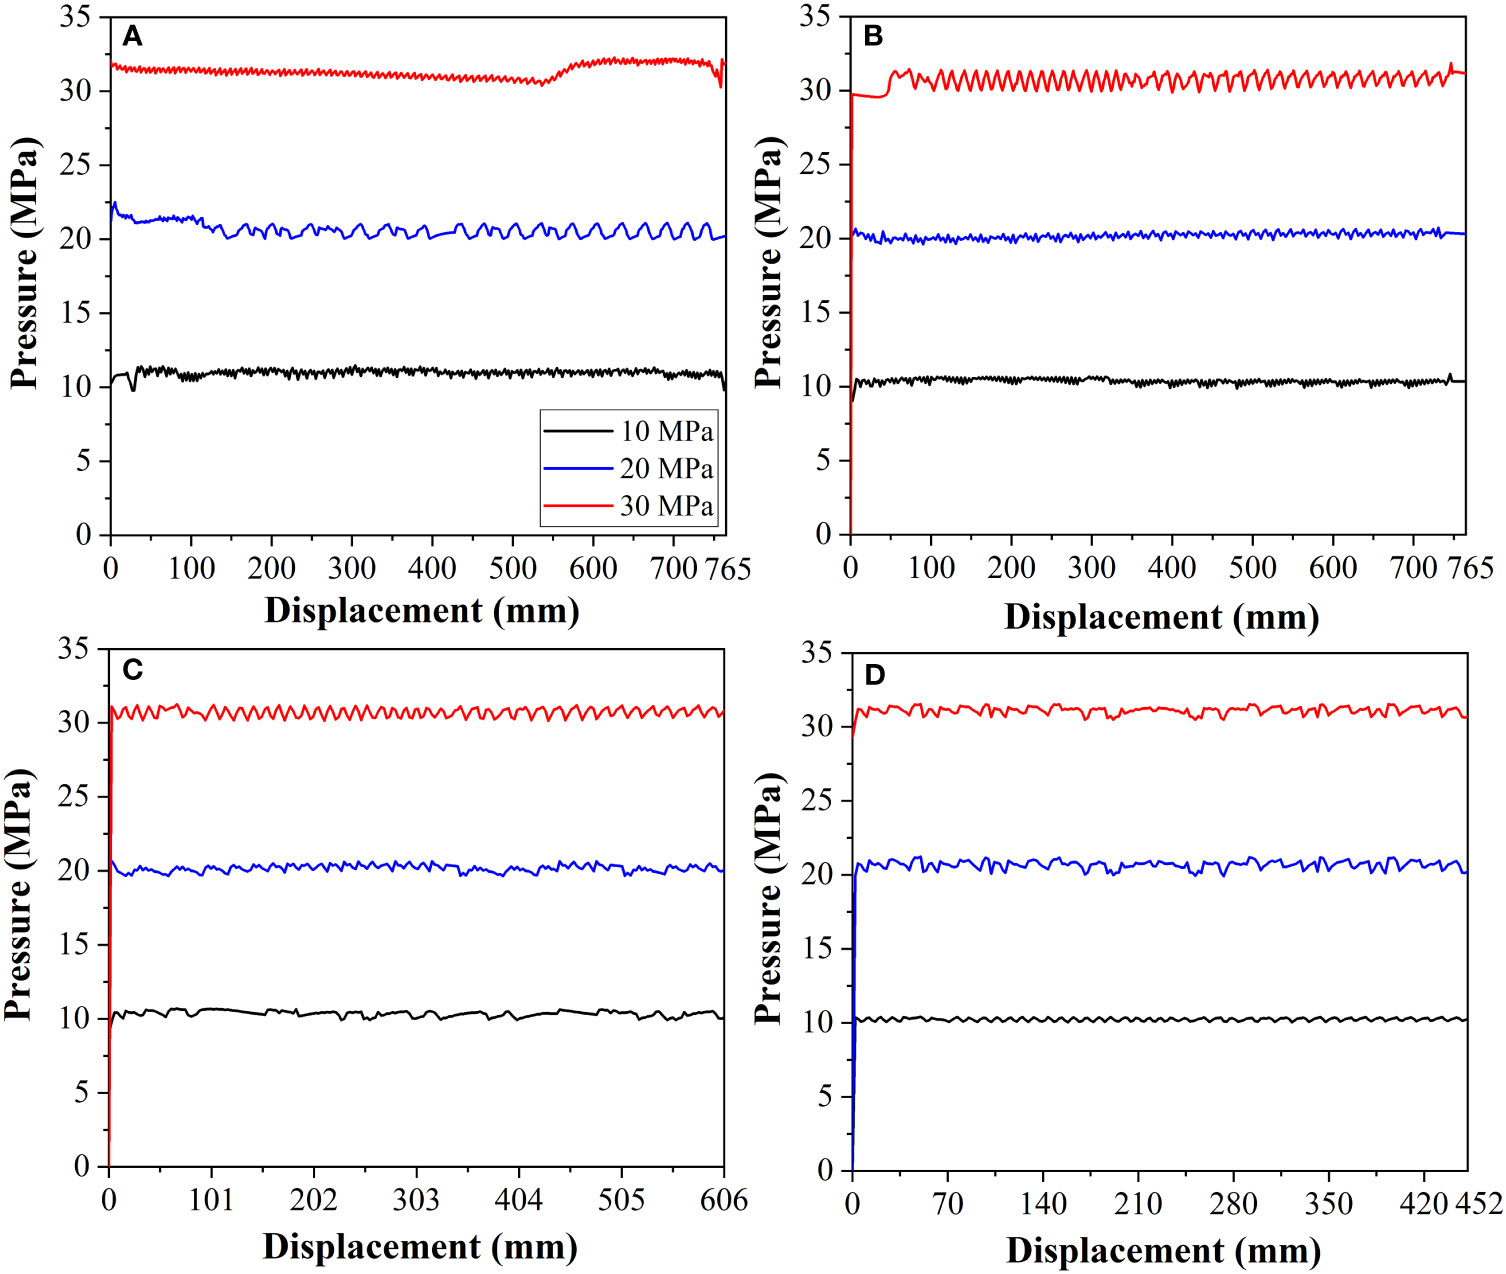
Figure 13 Pressure evolution with displacement during the process of (A) pushing the secondary sampling tube into the sampler (Step3 in section 2.4.1), (B) recovering secondary sampling tube (Step4 in section 2.4.1), (C) pushing the putter-B (Step2 in section 2.4.2), and (D) pushing the putter-C (Step3 in section 2.4.2).
Since the system is pressurized by a single stroke gas-liquid booster pump, the frequency of pressure fluctuation is related to the working frequency of the gas-liquid booster pump, which can be adjusted by the gas source pressure, and the magnitude of pressure fluctuation is related to the flow degree of the outlet valve of the gas-liquid booster pump. Furthermore, by comparing Figures 13A-D, it can be found that there is no obvious relationship between the pressure fluctuation and the pressure under the test condition and motion mechanism that generates the action, which agrees with the findings from the simulation.
In order to test the ability of the device to transfer samples, a complete transfer operation was carried out by pre-placing 300ml of clay and 300ml of water in the sampler under the working pressure of 30 MPa, as shown in the Figure 14A. Before the test, the threshold pressure of the pressure relief valve of the overlying water chamber is adjusted to 30MPa, and then, the high-pressure water is pumped into the interface-A1 (see Figure 2) to move the secondary sampling tube and compress the overlying water to flow out from the pressure relief valve, as shown in Figure 14B. During the whole process, the pressure inside the transfer system is maintained at about 30MPa.
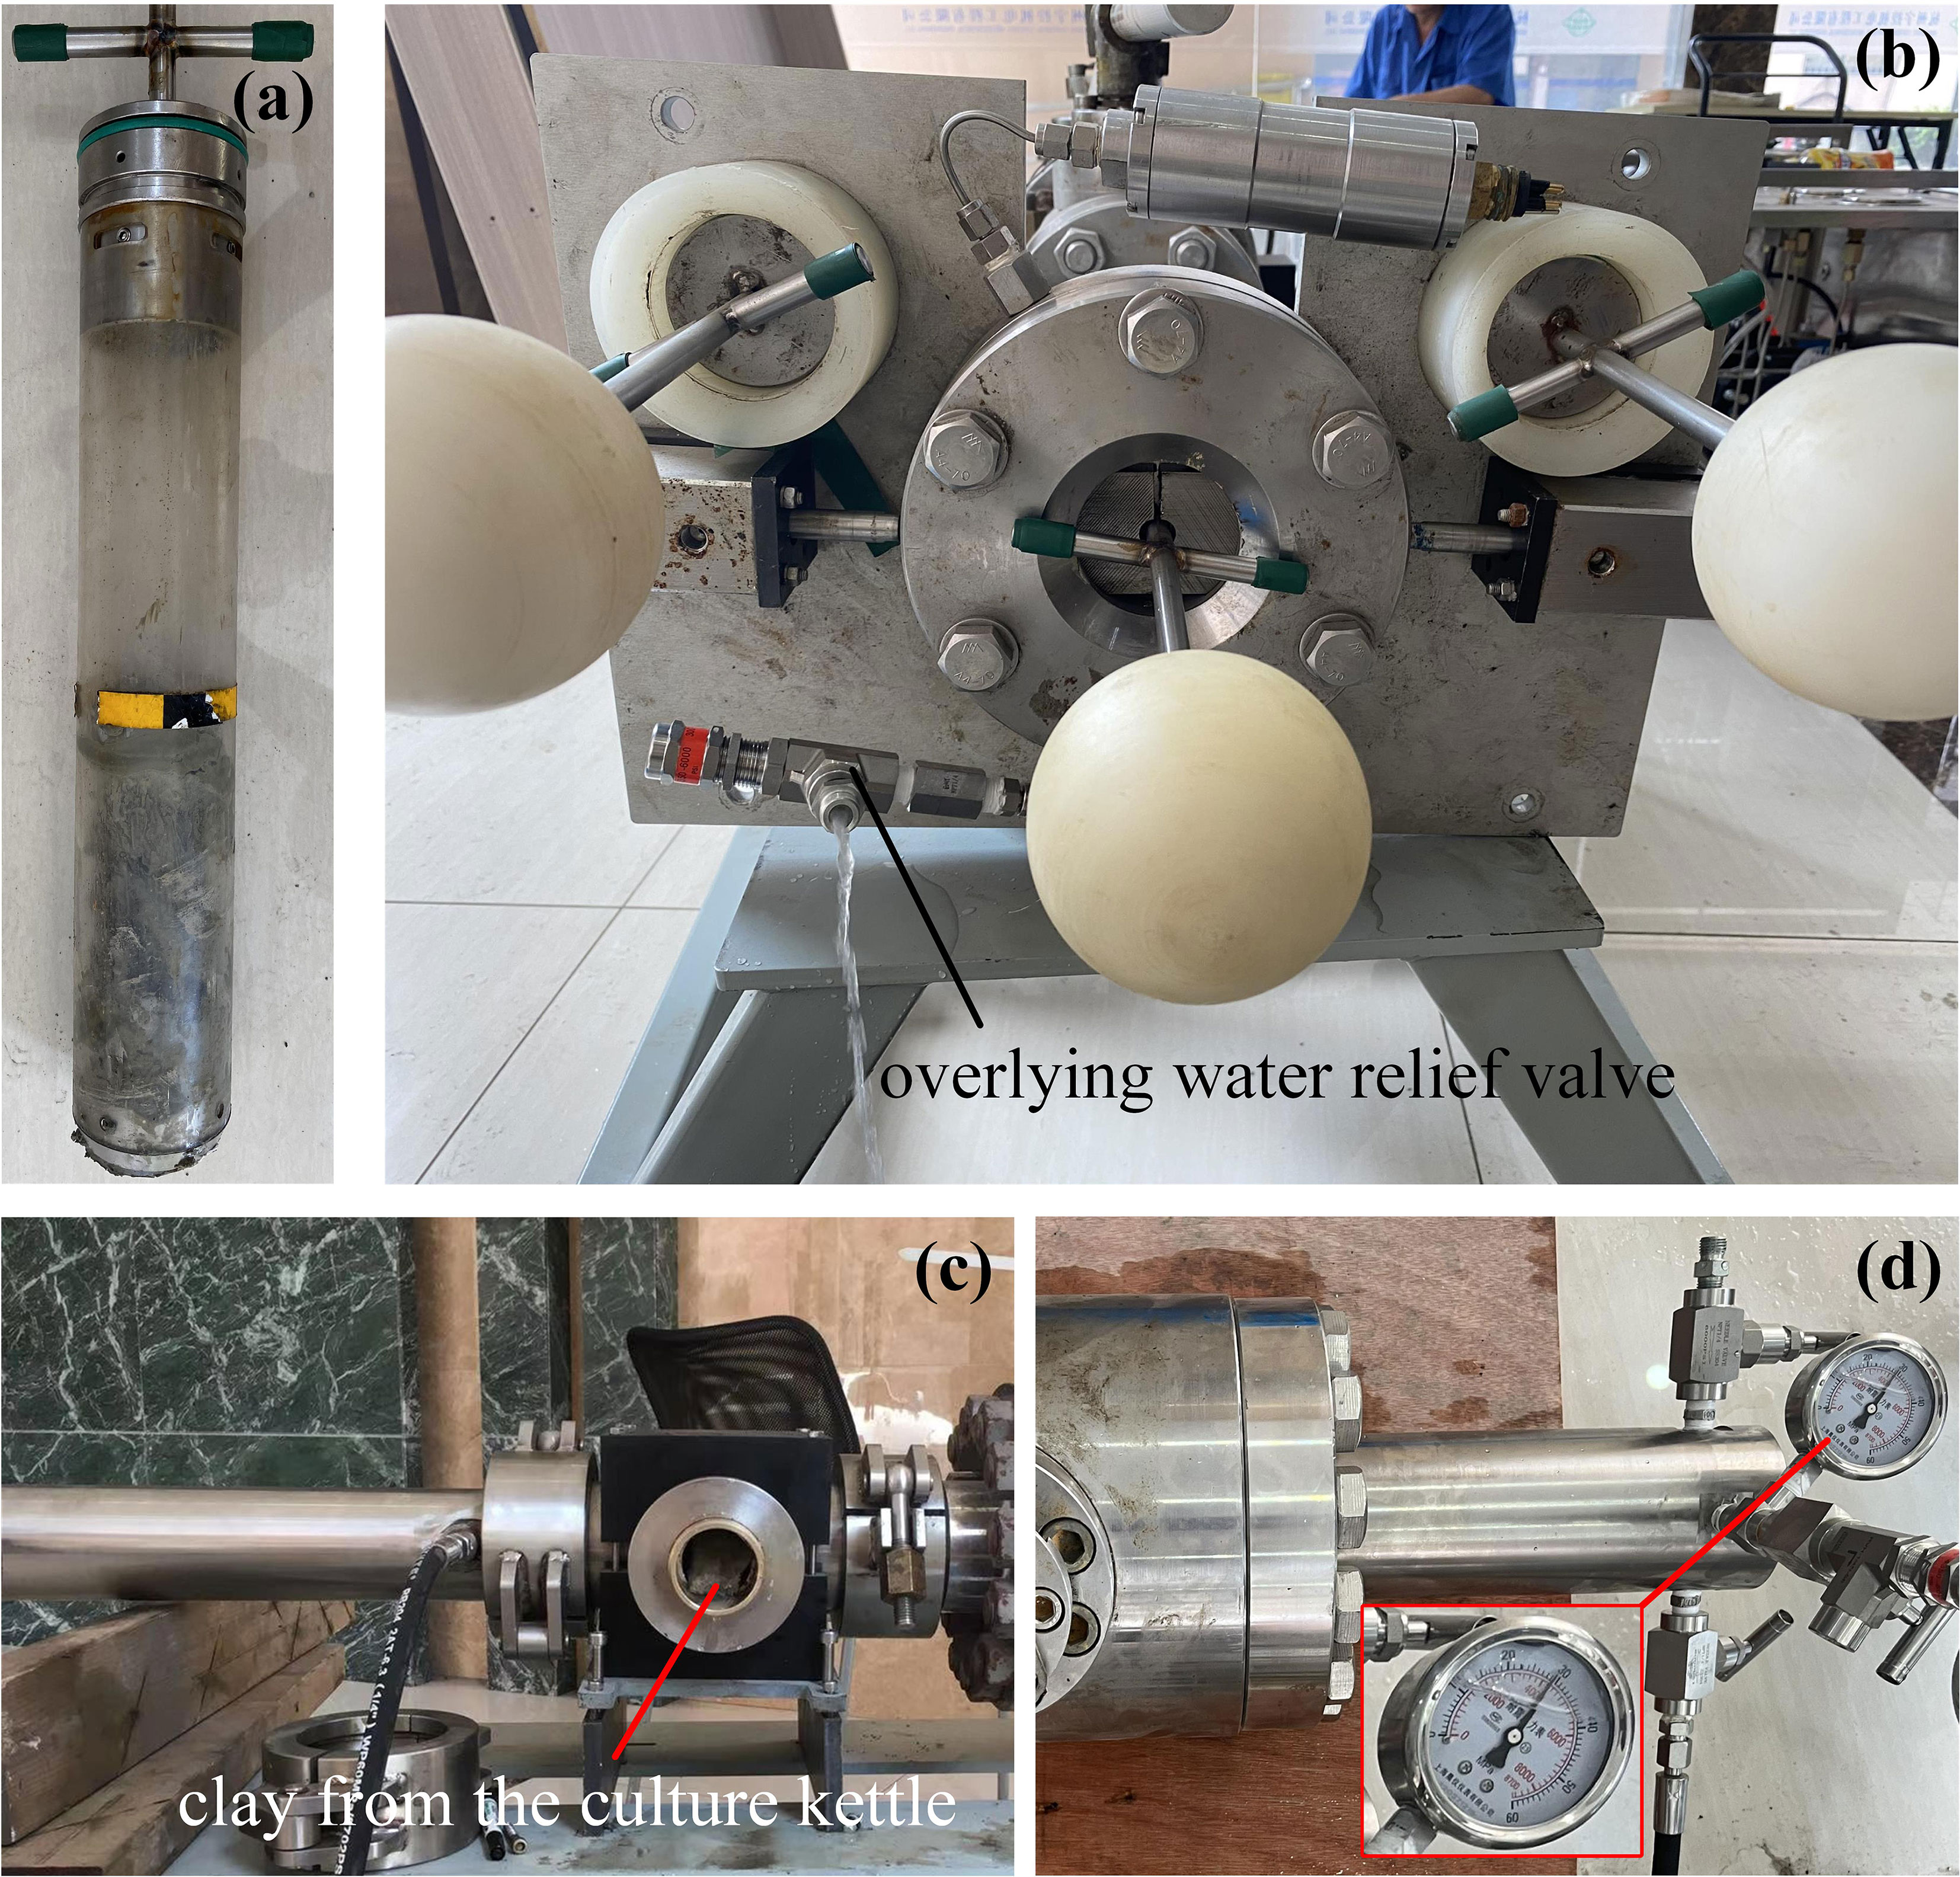
Figure 14 (A) sampling tube with clay in the sampler, (B) transfer of overlying water under 30MPa working condition, (C) the clay in the culture kettle, and (D) pressure of culture kettle after transfer.
Then, according to the steps in sections 2.4.1 and 2.4.2, the pressure-retaining transfer of the sediment from the sampler to the culture kettle is completed, and the transferred sediment is shown in the Figure 14C, which verifies the conclusion obtained from the simulation that the soil plug effect will not occur in the secondary sampling pipe. During the complete pressure-retaining transfer process, the final pressure Figure 14D of the sample in the culture kettle changed by 4.7% (1.41MPa) compared with the initial pressure in the sampler, which is much lower than the pressure drop of other transfer devices (Tabor et al., 1981; Chen et al., 2019; Garel et al., 2019; Priest et al., 2019).
The results of the laboratory tests demonstrate the rationality of the transfer scheme and the ability of the device to maintain pressure stability during the transfer process. The pressure fluctuation in the transfer process can be improved by adjusting the working frequency of the gas-liquid booster pump and the flow degree of the outlet valve. Additionally, compensators can be installed on the transfer device to further reduce pressure drop and pressure fluctuations.
Based on the pressure-retaining sampler for sediment and overlying seawater, the pressure-retaining transfer device with working pressure of 30MPa, composed of a push transfer system, a sampler system and a culture system, and the corresponding scheme are proposed to separate and transfer the sediment and overlying water inside the sampler under the condition of pressure-retaining. Based on the pressure relief valve with adjustable threshold pressure, the transfer device transfers the overlying water by compressing the internal volume and transfers the sediment by secondary sampling, respectively.
By using the numerical method, the secondary sampling is investigated based on the coupled Eulerian-Lagrangian (CEL) approach in the Abaqus, and the penetration resistance and coring rate of the secondary sampling tube are 141N (this value can be used to determine the injection pressure during the transfer process) and 86.2%, respectively. In addition, the pressure fluctuation during transfer process is studied based on the AMESim, and the pressure fluctuation amplitudes caused by the actions of the mechanisms under different pressure conditions are all within 0.89MPa, which shows that the pressure fluctuation amplitude has no obvious relationship with the pressure of the working conditions and the mechanism that produces the action.
Furthermore, the strength, sealing performance and ability to maintain pressure stability of the device were also studied by laboratory test. The device can maintain a pressure loss of no more than 8% within two hours, maintain pressure fluctuations during the transfer process within 4.8% (which agrees well with the findings from simulation), and ensure that the pressure in the culture kettle decreases by 4.7% relative to the pressure in the sampler after the transfer, which shows the feasibility of the device application. The pressure fluctuation during the transfer process can be improved by adjusting the working frequency of the gas-liquid booster pump and the flow degree of the outlet valve. Additionally, compensators can be installed on the transfer device to further reduce pressure drop and pressure fluctuations.
In the next, sea trials will be adopted in the methane leakage area to further study the application performance of the device. In addition, since the transfer process of the device includes a large number of needle valve switching operations, we will replace the needle valve with a solenoid valve in the future. The corresponding control system and the upper computer will also be designed to automatically complete all operations.
The original contributions presented in the study are included in the article/Supplementary Material. Further inquiries can be directed to the corresponding author.
JG: software, data curation, and writing- original draft preparation, visualization; JC: conceptualization, supervision, and writing- reviewing and editing; QZ: data curation, visualization, and investigation; YG: software, visualization, and investigation; HL: software, visualization, and investigation; QG: methodology, writing- reviewing and editing, and validation; YL: conceptualization, supervision, and writing- reviewing and editing; YW: data curation, writing- original draft preparation, and visualization. All authors contributed to the article and approved the submitted version.
This work was supported by Key R&D of Zhejiang Province (Grant No. 2021C03183); the Finance Science and Technology Project of Hainan Province (Grant No. ZDKJ202019); the 2020 Research Program of Sanya Yazhou Bay Science and Technology City (Grant No. SKYC-2020-01-001).
The authors declare that the research was conducted in the absence of any commercial or financial relationships that could be construed as a potential conflict of interest.
All claims expressed in this article are solely those of the authors and do not necessarily represent those of their affiliated organizations, or those of the publisher, the editors and the reviewers. Any product that may be evaluated in this article, or claim that may be made by its manufacturer, is not guaranteed or endorsed by the publisher.
Abegg F., Hohnberg H.-J., Pape T., Bohrmann G., Freitag J. (2008). Development and application of pressure-core-sampling systems for the investigation of gas-and gas-hydrate-bearing sediments. Deep Sea Res. Part I Oceanogr. Res. Pap. 55, 1590–1599. doi: 10.1016/j.dsr.2008.06.006
Abid K., Spagnoli G., Teodoriu C., Falcone G. (2015). Review of pressure coring systems for offshore gas hydrates research. Underw. Technol. 33, 19–30. doi: 10.3723/ut.33.019
Amann H., Hohnberg H. J., Reinelt R. (1997). HYACE-a novel autoclave coring equipment for systematic offshore gashydrate sampling, 37–49.
Batdorf S. B., Schildcrout M., Stein M. (1947). Critical stress of thin-walled cylinders in axial compression. Tech. Rep. Arch. image Libr 1344), 0–21.
Chen J.-W., Fan W., Bingham B., Chen Y., Gu L.-Y., Li S.-L. (2013). A long gravity-piston corer developed for seafloor gas hydrate coring utilizing an in situ pressure-retained method. Energies 6, 3353–3372. doi: 10.3390/en6073353
Chen J. W., Gao Q. L., Liu H. H., Zhang H. Q., Xiao B., Liu F. L. (2019). Development of a pressure-retained transfer system of seafloor natural gas hydrates. Environ. Geotech. 8, 529–538. doi: 10.1680/jenge.19.00062
Chen J., Huang Y., Lin Y., Zhou P., Fang Y., Le X., et al. (2020). A novel sediment pressure sampling device carried by a hadal-rated lander. J. Mar. Sci. Eng. 8, 839. doi: 10.3390/jmse8110839
Dickens G. R., Schroeder D., Hinrichs K.-U. (2003). “The pressure core sampler (PCS) on ODP leg 201: General operations and gas release,” in Proceedings of the ocean drilling program, initial reports (TX: Ocean Drilling Program College Station), 1–22.
Garel M., Bonin P., Martini S., Guasco S., Roumagnac M., Bhairy N., et al. (2019). Pressure-retaining sampler and high-pressure systems to study deep-sea microbes under in situ conditions. Front. Microbiol. 10, 453. doi: 10.3389/fmicb.2019.00453
Gornitz V., Fung I. (1994). Potential distribution of methane hydrates in the world’s oceans. Global Biogeochem. Cycles 8, 335–347. doi: 10.1029/94GB00766
Guo J., Wang Y., Wang W., Ren X., Zhou P., Fang Y., et al. (2022). Pressure-retaining sampler for sediment including overlying water based on heavy duty ROV-jellyfish. Appl. Ocean Res. 128, 103354. doi: 10.1016/j.apor.2022.103354
Hao Z.-B., Huang W.-Q., Qin J.-X., Wu X.-Y. (2013). Estimation technique for gas hydrate saturation of pressure core samples. Chin. J. Geophys. 56, 3917–3921. doi: 10.6038/cjg20131133
He S., Peng Y., Jin Y., Wan B., Liu G. (2020). Review and analysis of key techniques in marine sediment sampling. Chin. J. Mech. Eng. 33. doi: 10.1186/s10033-020-00480-0
Jutzeler M., White J. D. L., Talling P. J., McCanta M., Morgan S., Le Friant A., et al. (2014). Coring disturbances in IODP piston cores with implications for offshore record of volcanic events and the Missoula megafloods. Geochem. Geophys. Geosyst. 15, 3572–3590. doi: 10.1002/2014GC005447
Kawasaki M., Umezu S., Yasuda M. (2006). Pressure temperature core sampler (PTCS). J. Japanese Assoc. Pet. Technol. 71, 139–147. doi: 10.3720/japt.71.139
Kim Y. H., Hossain M. S. (2017). Dynamic installation, keying and diving of OMNI-max anchors in clay. Geotechnique 67, 78–85. doi: 10.1680/jgeot.16.T.008
Ko J., Jeong S., Kim J. (2017). Application of a coupled eulerian-Lagrangian technique on constructability problems of site on very soft soil. Appl. Sci. 7, 1080. doi: 10.3390/app7101080
Konkol J. (2015). Numerical estimation of the pile toe and shaft unit resistances during the installation process in sands. Stud. Geotech. Mech. ), 37–44. doi: 10.1515/sgem-2015-0005
Li S., Cheng Y., Qin H. (2006). Development of pressure piston corer for exploring natural gas hydrates. Journal-Zhejiang Univ. Eng. Sci. 40, 888. doi: 10.3785/j.issn.1008-973X.2006.05.033
Liu J., Chen J., Liu F., Gu L., Sheng Y., Zhang M., et al. (2014). “Development of one pressure core transfer device for one long gravity-piston pressure-retained corer,” in 2014 oceans-st. john’s (St. John's, NL, Canada: IEEE), 1–6.
Matsumoto R., Ryu B.-J., Lee S.-R., Lin S., Wu S., Sain K., et al. (2011). Occurrence and exploration of gas hydrate in the marginal seas and continental margin of the Asia and Oceania region. Mar. Pet. Geol. 28, 1751–1767. doi: 10.1016/j.marpetgeo.2011.09.009
Minato A., Joarder M. D. M. A., Ozawa S., Kadoya M., Sugimoto N. (1999). Development of a lidar system for measuring methane using a gas correlation method. Jpn. J. Appl. Phys. 38, 6130. doi: 10.1143/JJAP.38.6130
Peoples L. M., Norenberg M., Price D., McGoldrick M., Novotny M., Bochdansky A., et al. (2019). A full-ocean-depth rated modular lander and pressure-retaining sampler capable of collecting hadal-endemic microbes under in situ conditions. Deep Sea Res. Part I Oceanogr. Res. Pap. 143, 50–57. doi: 10.1016/j.dsr.2018.11.010
Priest J. A., Druce M., Roberts J., Schultheiss P., Nakatsuka Y., Suzuki K. (2015). PCATS triaxial: A new geotechnical apparatus for characterizing pressure cores from the nankai trough, Japan. Mar. Pet. Geol. 66, 460–470. doi: 10.1016/j.marpetgeo.2014.12.005
Priest J. A., Hayley J. L., Smith W. E., Schultheiss P., Roberts J. (2019). PCATS triaxial testing: Geomechanical properties of sediments from pressure cores recovered from the bay of Bengal during expedition NGHP-02. Mar. Pet. Geol. 108, 424–438. doi: 10.1016/j.marpetgeo.2018.07.005
Qin H., Cai Z., Hu H., Wang J., Ye W., Chen Y. (2016). Numerical analysis of gravity coring using coupled eulerian-Lagrangian method and a new corer. Mar. Geores. Geotechnol. 34, 403–408. doi: 10.1080/1064119X.2014.958880
Ramakrishnan R., Hiremath S. S., Singaperumal M. (2012). Theoretical investigations on the effect of system parameters in series hydraulic hybrid system with hydrostatic regenerative braking. J. Mech. Sci. Technol. 26, 1321–1331. doi: 10.1007/s12206-012-0321-y
Roberts H. H., Aharon P. (1994). Hydrocarbon-derived carbonate buildups of the northern gulf of Mexico continental slope: A review of submersible investigations. Geo-Marine Lett. 14, 135–148. doi: 10.1007/BF01203725
Rothwell R. G., Rack F. R. (2006). New techniques in sediment core analysis: an introduction. Geol. Soc London Spec. Publ. 267, 1–29. doi: 10.1144/GSL.SP.2006.267.01.01
Schultheiss P. J., Francis T. J. G., Holland M., Roberts J. A., Amann H., Parkes R. J., et al. (2006). Pressure coring, logging and subsampling with the HYACINTH system. Geol. Soc London Spec. Publ. 267, 151–163. doi: 10.1144/GSL.SP.2006.267.01.11
Schultheiss P., Holland M., Humphrey G. (2009). Wireline coring and analysis under pressure: Recent use and future developments of the HYACINTH system. Sci. Drill. 7, 44–50. doi: 10.5194/sd-7-44-2009
Schultheiss P. J., Weaver P. P. E. (1992). “Multi-sensor core logging for science and industry,” in OCEANS 92 proceedings M_Mastering the oceans through technology (Newport, RI, USA: IEEE), 608–613.
Suess E., Torres M. E., Bohrmann G., Collier R. W., Greinert J., Linke P., et al. (1999). Gas hydrate destabilization: Enhanced dewatering, benthic material turnover and large methane plumes at the cascadia convergent margin. Earth Planet. Sci. Lett. 170, 1–15. doi: 10.1016/S0012-821X(99)00092-8
Tabor P. S., Deming J. W., Ohwada K., Davis H., Waxman M., Colwell R. R. (1981). A pressure-retaining deep ocean sampler and transfer system for measurement of microbial activity in the deep sea. Microb. Ecol. 7, 51–65. doi: 10.1007/BF02010478
Tong D., Liao C., Chen J. (2019). Wave-monopile-seabed interaction considering nonlinear pile-soil contact. Comput. Geotech. 113, 103076. doi: 10.1016/j.compgeo.2019.04.021
Tréhu A. M. (2006). Gas hydrates in marine sediments: Lessons from scientific ocean drilling. Oceanography 19, 124–142. doi: 10.5670/oceanog.2006.11
Wang H., Ruan D.-R., Cao C., Fang J.-S., Zhou P., Fang Y.-P., et al. (2022). Collection sediment from Mariana trench with a novel pressure-retaining sampler. Deep Sea Res. Part I Oceanogr. Res. Pap. 183, 103740. doi: 10.1016/j.dsr.2022.103740
Weil G. J. (1993). “Non contact, remote sensing of buried water pipeline leaks using infrared thermography,” in Water management in the’90s: A time for innovation (St. Louis, United States: ASCE), 404–407.
Xuanyin W., Xiaoxiao L., Fushang L. (2010). Analysis on oscillation in electro-hydraulic regulating system of steam turbine and fault diagnosis based on PSOBP. Expert Syst. Appl. 37, 3887–3892. doi: 10.1016/j.eswa.2009.11.029
Yalong J., Tingli C., Yuquan Z. (2011). Methane monitoring system based on absorption spectroscopy of tunable diode laser. J. Electron. Meas. Instrum 25, 265–271. doi: 10.1631/jzus.B1000265
Zeng X., Li G., Yin G., Song D., Li S., Yang N. (2018). Model predictive control-based dynamic coordinate strategy for hydraulic hub-motor auxiliary system of a heavy commercial vehicle. Mech. Syst. Signal Process 101, 97–120. doi: 10.1016/j.ymssp.2017.08.029
Zhang P., Chen J., Gao Q., Xiao B., Geng X., Zhou P. (2019). Research on a temperature control device for seawater hydraulic systems based on a natural gas hydrate core sample pressure-retaining and transfer device. Energies 12), 1–20. doi: 10.3390/en12203990
Zhao Z., Jia M., Wang F., Wang S. (2009). Intermittent chaos and sliding window symbol sequence statistics-based early fault diagnosis for hydraulic pump on hydraulic tube tester. Mech. Syst. Signal Process 23, 1573–1585. doi: 10.1016/j.ymssp.2009.01.011
Zhen M., Jinjian C., Jianhua W. (2017). The coupled eulerian-Lagrangian analysis of pile jacking process in saturated soft clay by using modified cam-clay model. J. Shanghai Jiaotong Univ. 51, 263. doi: 10.16183/j.cnki.jsjtu.2017.03.002
Zhu H., Chen J. W., Ren Z. Q., Zhang P. H., Gao Q.L., Le X.L., et al. (2022). A new technique for high-fidelity cutting technology for hydrate samples. J. Zhejiang Univ. Sci. A 23, 40–54. doi: 10.1631/jzus.A2100188
Zhu H., Liu Q., Deng J., Wang G., Xiao X., Jiang Z., et al. (2011). Pressure and temperature preservation techniques for gas-hydrate-bearing sediments sampling. Energy 36, 4542–4551. doi: 10.1016/j.energy.2011.03.053
Keywords: sediment, overlying seawater, pressure-retaining transfer, numerical simulation, laboratory test
Citation: Guo J, Zhou Q, Ge Y, Li H, Gao Q, Wang Y, Lin Y and Chen J (2022) Development of a pressure-retaining separation and transfer system for sediment and overlying seawater. Front. Mar. Sci. 9:1052802. doi: 10.3389/fmars.2022.1052802
Received: 24 September 2022; Accepted: 14 November 2022;
Published: 25 November 2022.
Edited by:
Xianbiao Lin, Ocean University of China, ChinaCopyright © 2022 Guo, Zhou, Ge, Li, Gao, Wang, Lin and Chen. This is an open-access article distributed under the terms of the Creative Commons Attribution License (CC BY). The use, distribution or reproduction in other forums is permitted, provided the original author(s) and the copyright owner(s) are credited and that the original publication in this journal is cited, in accordance with accepted academic practice. No use, distribution or reproduction is permitted which does not comply with these terms.
*Correspondence: Jiawang Chen, YXJ3YW5nQHpqdS5lZHUuY24=
Disclaimer: All claims expressed in this article are solely those of the authors and do not necessarily represent those of their affiliated organizations, or those of the publisher, the editors and the reviewers. Any product that may be evaluated in this article or claim that may be made by its manufacturer is not guaranteed or endorsed by the publisher.
Research integrity at Frontiers
Learn more about the work of our research integrity team to safeguard the quality of each article we publish.