 Feng Luo
 Zhipeng Chen
 Hongbo Wu1
 Weimin Quan
- 1College of Harbour, Coastal and Offshore Engineering, Hohai University, Nanjing, Jiangsu, China
- 2Nantong Ocean and Coastal Engineering Research Institute, Hohai University, Nantong, China
- 3Key Laboratory of Coastal Disaster and Defence, Ministry of Education, Nanjing, China
- 4East China Sea Fisheries Research Institute, Chinese Academy of Fishery Sciences, Shanghai, China
As human activity increases, coastal ecosystems are becoming increasingly vulnerable to a range of challenges. Oyster reefs are coastal ecosystems that provide habitats for a diverse range of marine species while also purifying water and providing natural coastal defense. However, because of human activity, global oyster reef areas have drastically diminished and are in grave danger. Simultaneously, it is impossible to determine the negative impact of human engineering activity on oyster reefs, due to the lack of intuitive and quantitative study methodologies. To address this issue, we applied a hydrodynamic model to analyze the impact on oyster reefs. First, we considered that human engineering activity, that is, coastal engineering, mainly affects the development of Liyashan Oyster Reefs by influencing hydrodynamics, sediment concentration, and bed-level evolution. We then applied MIKE3 to establish and validate a 3D hydrodynamic model of the southern part of the Yellow Sea around oyster reefs. Results showed that regional variations in flow velocity and suspended sediment concentration occurred in oyster reef waters, but the magnitude of these variations was limited. However, seabed elevation increased substantially in the Center Protection Area, which had a negative impact on oyster reefs. In general, our study provided a paradigm for analyzing the degree of impact on oyster reefs, showed the advantages of hydrodynamic models in quantitatively analyzing impact factors, and had reliable results.
1 Introduction
An oyster reef is a biological reef formed by the long-term attachment and growth of oysters (Beck et al., 2011), and is widely distributed in coastal temperate and subtropical estuarine areas (Airoldi and Beck, 2007). As filter-feeding shellfish, oysters can effectively filter detritus and suspended sediment in water, which can considerably improve water quality and increase water clarity (Nelson et al., 2004; Newell, 2004; Dame et al., 2006). Simultaneously, oysters can absorb nutrients such as nitrogen and phosphorus from the water and promote denitrification to avoid harmful algal blooms and eutrophication outbreaks (Hoellein et al., 2014). Furthermore, oysters have a strong enrichment effect on Pb, Cd, and other heavy metals, which can effectively reduce heavy metal pollution in water (Chakraborty, 2017). In addition to purifying waters, oyster reefs perform more diverse ecosystem service functions (Peterson et al., 2003; Coen et al., 2007; Scyphers et al., 2011; Smaal et al., 2019). Similar to tropical coral reef systems, the complex three-dimensional reef structure of oyster reefs provides a habitat for a wide range of marine organisms, including benthic invertebrates, fish, and crustaceans (Rodney and Paynter, 2006). Oyster reefs are gaining increasing attention as a form of natural coastal defense (Morris et al., 2018), and a specific scale of oyster reefs can reduce wave energy, stabilize sediments, and thus reduce coastal erosion (Grabowski and Peterson, 2007; Scyphers et al., 2011).
Estuarine coastal areas are among the most densely populated and economically developed areas for human activity, with approximately 60% of the world’s population living in them (Morris et al., 2018), within which oyster reefs are also distributed. Owing to the global acceleration of coastal urbanization, human intervention and modification of coastal areas are becoming more intensive (Heath, 2008; Rockström et al., 2009). However, while meeting social and economic development needs, human activity has also altered the natural characteristics of coastal areas, causing severe damage to oyster reefs worldwide. Oyster reefs globally have been severely degraded for nearly 100 years due to overfishing, pollution discharge, and coastal area development (Airoldi and Beck, 2007; Richardson et al., 2022), and 85% of oyster reefs have been extirpated (Jackson et al., 2001), making them one of the most endangered marine ecosystems (Beck et al., 2011). The Liyashan Oyster Reef is the largest living oyster reef in China, which not only has economic benefit but also plays a crucial role in the conservation of marine biological resources and ecological protection and has great scientific value. However, owing to the combined effect of the natural environment and human activity, the Liyashan Oyster Reef has been in continuous degradation for almost half a century, which has caused widespread concern among relevant departments and researchers. According to the results of the 2013 survey, the reef area decreased by approximately 38.8% compared to that in 2003 (Quan et al., 2016).
With the acceleration of urbanization, the population and infrastructure of coastal areas has increased dramatically, and changes in traditional fishing practices and engineering activities have severely affected oyster reef survival and development. Some engineered structures may cause changes to the nearshore seabed, further altering the coastal dynamic environment (Pan et al., 2022). Therefore, current research on the effect of human activity on oyster reefs has focused on direct damage to reefs from fishing and engineering projects. As coastal settlement populations have grown rapidly, overfishing has severely damaged the living environment of oyster reefs, resulting in the collapse and even extinction of local oysters (Jackson et al., 2001; Alleway and Connell, 2015). Waves generated by the stern of a ship during sailing can affect the attachment of oysters, and thus reduce their survival rate (Wall et al., 2005). The spatial structure of oyster reefs can be severely damaged by dredging, which leads to a drastic reduction in oyster production and oyster reef area (Rothschild et al., 1994). Simultaneously, sediment resuspension caused by dredging projects inundates oyster beds, generating high sediment loads and directly causing decline in oyster populations (Volety et al., 2009; Wilber and Clarke, 2010; Lin et al., 2021). All these human activities have a direct or indirect effect on the development of oyster reefs.
At present, studies on oyster reefs mainly focus on current status assessment, growth characteristics, impact of human activity, and reef structure. Studies on the systematic impact of changes in the hydrodynamic environment and bed level caused by coastal engineering on oyster reefs are limited. Oyster reef development is affected by a combination of environmental factors such as flow velocity, suspended sediment concentration, and bed level. Coastal engineering affects these environmental factors, which in turn has a substantial impact on the development of oyster reefs. Therefore, it is necessary to study the effects of changes in marine environmental factors on oyster reefs owing to coastal engineering.
Meanwhile, oysters, as benthic shellfish, live on the bottom of the water long-term and grow attached to the surface of the reef, mainly constrained by environmental conditions of the bottom waters. The two-dimensional model calculates the vertical average flow velocity and suspended sediment concentration. However, when the hydrodynamic environment of the water changes drastically, the distribution of these two physical quantities in the vertical direction becomes irregular, and the simulated values obtained by the two-dimensional model cannot reflect the vertical hydrodynamic characteristics of the sea well at this time.
The categories of impact studied in this paper are hydrodynamics and sediment dynamics. Specifically, we analyzed the current velocity, sediment concentration and bed level evolution. And the impact of human activity on oyster reefs discussed in this paper is mainly caused by coastal engineering, including reclamation projects, port and dike construction, and channel construction. Based on the analysis results of oyster reef growth impact factors, a conceptual model was constructed to characterize the impact of human engineering activity on oyster reefs, as shown in Figure 1. Human engineering activity affects oyster reef development in many ways; coastal engineering mainly influences hydrodynamics, suspended sediment concentration, and bed-level evolution, which are also the basic influences considered in our modeling. First, flow velocity can affect the grazing rate of oysters (Beisel et al., 1998), and when the flow velocity is too high, oysters may not be able to feed (Lenihan et al., 1996). In addition, if the distribution of the vertical flow velocity is disturbed, oysters need to consume more energy to maintain their spatial position (Hart and Finelli, 1999). Second, high suspended sediment concentrations can damage the gill filaments of oysters and affect their filter feeding rates (La Peyre et al., 2020). It may also carry a greater load of contaminants, causing serious oyster poisoning (Edge et al., 2015). Third, oysters at the bottom are at risk of suffocation and death if the bed level is raised. Related studies have found that oysters die when the sediment layers exceed 40 and 60 mm in thickness (Comeau, 2014), and only a few millimeters of sediment can inhibit oyster larvae from colonizing the reef (Thomsen and McGlathery, 2006).
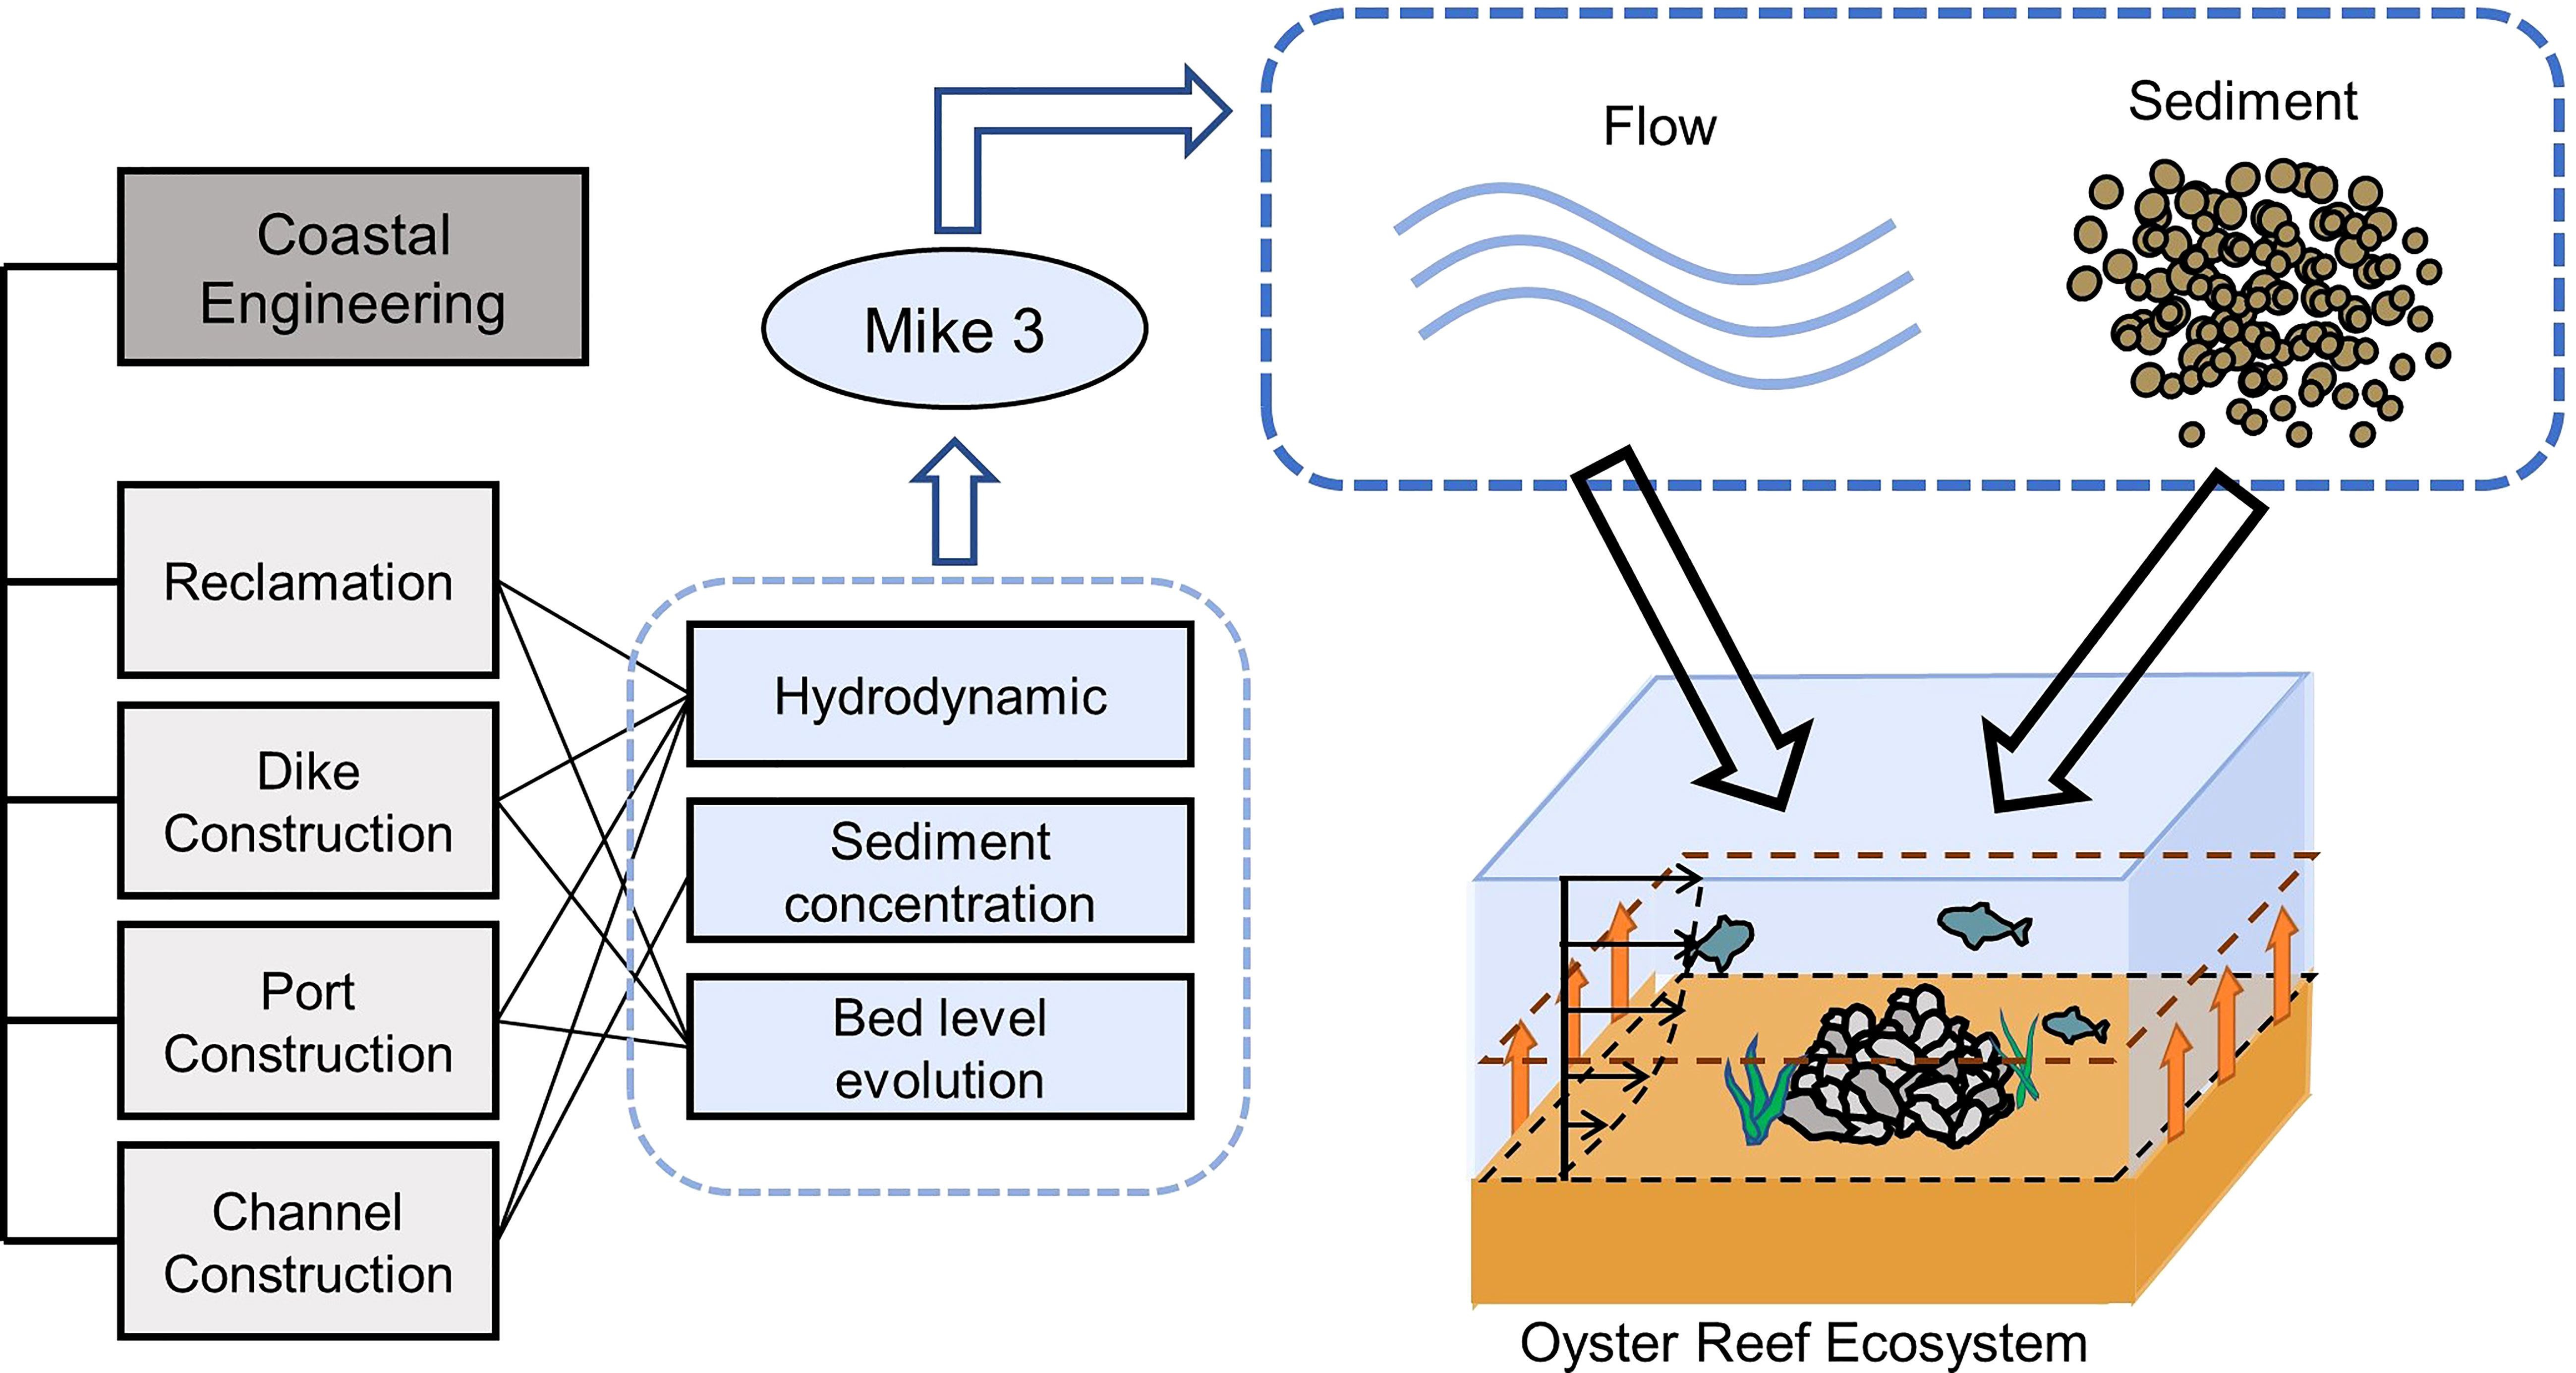
Figure 1 The framework of this study. The effects of the four main forms of coastal engineering on the three natural properties of waters and their relative relationships are shown. We abstracted these three natural properties as flow and sediment through the MIKE3 model and studied their variation at the three-dimensional scale to assess the impact of coastal engineering on oyster reefs.
Therefore, to study the influence of changes in regional hydrodynamics and sediment dynamics characteristics caused by coastal engineering on oyster reefs, and to compensate for the shortcomings of the two-dimensional model, we used MIKE3 numerical simulation software to construct a three-dimensional hydrodynamic model. By calculating the vertical distribution of flow velocity and suspended sediment concentration before and after the project, as well as the variation of bed bottom, and combining it with the change in sea level in the oyster reef area, the impact of coastal engineering on Liyashan Oyster Reefs was comprehensively analyzed.
2 Materials and methods
2.1 Study area and study content
2.1.1 Study area
The Liyashan Oyster Reef is located in the intertidal zone on the southern side of the western section of the Xiaomiaohong Channel, Nantong, Jiangsu Province, China, as shown in Figure 2. The Xiaomiaohong Channel is located on the southern flank of the submarine radial sand ridges southwest of the Yellow Sea. The study area is characterized by irregular semidiurnal tides and a large tidal range, with neap tides reaching 2.5 m and spring tides reaching 6 m (Lin et al., 2021). Shielded by the wide Yaosha Shoal extending from east to west, the waves of the Xiaomiaohong Channel are small, and the multi-year average wave height is only 0.3 m (Zhang, 2004). In addition, the number of days without waves is approximately 50%, the average wave height when there are waves is 0.53 m, and the measured maximum wave height is 3.8 m (Zhang, 2004). The tidal flats adjacent to the oyster reefs are the transition zone from siltation to strong erosion on the southern part of the Jiangsu coast; therefore, the overall geological activity of the oyster reefs is relatively weak (Zhang, 2004).
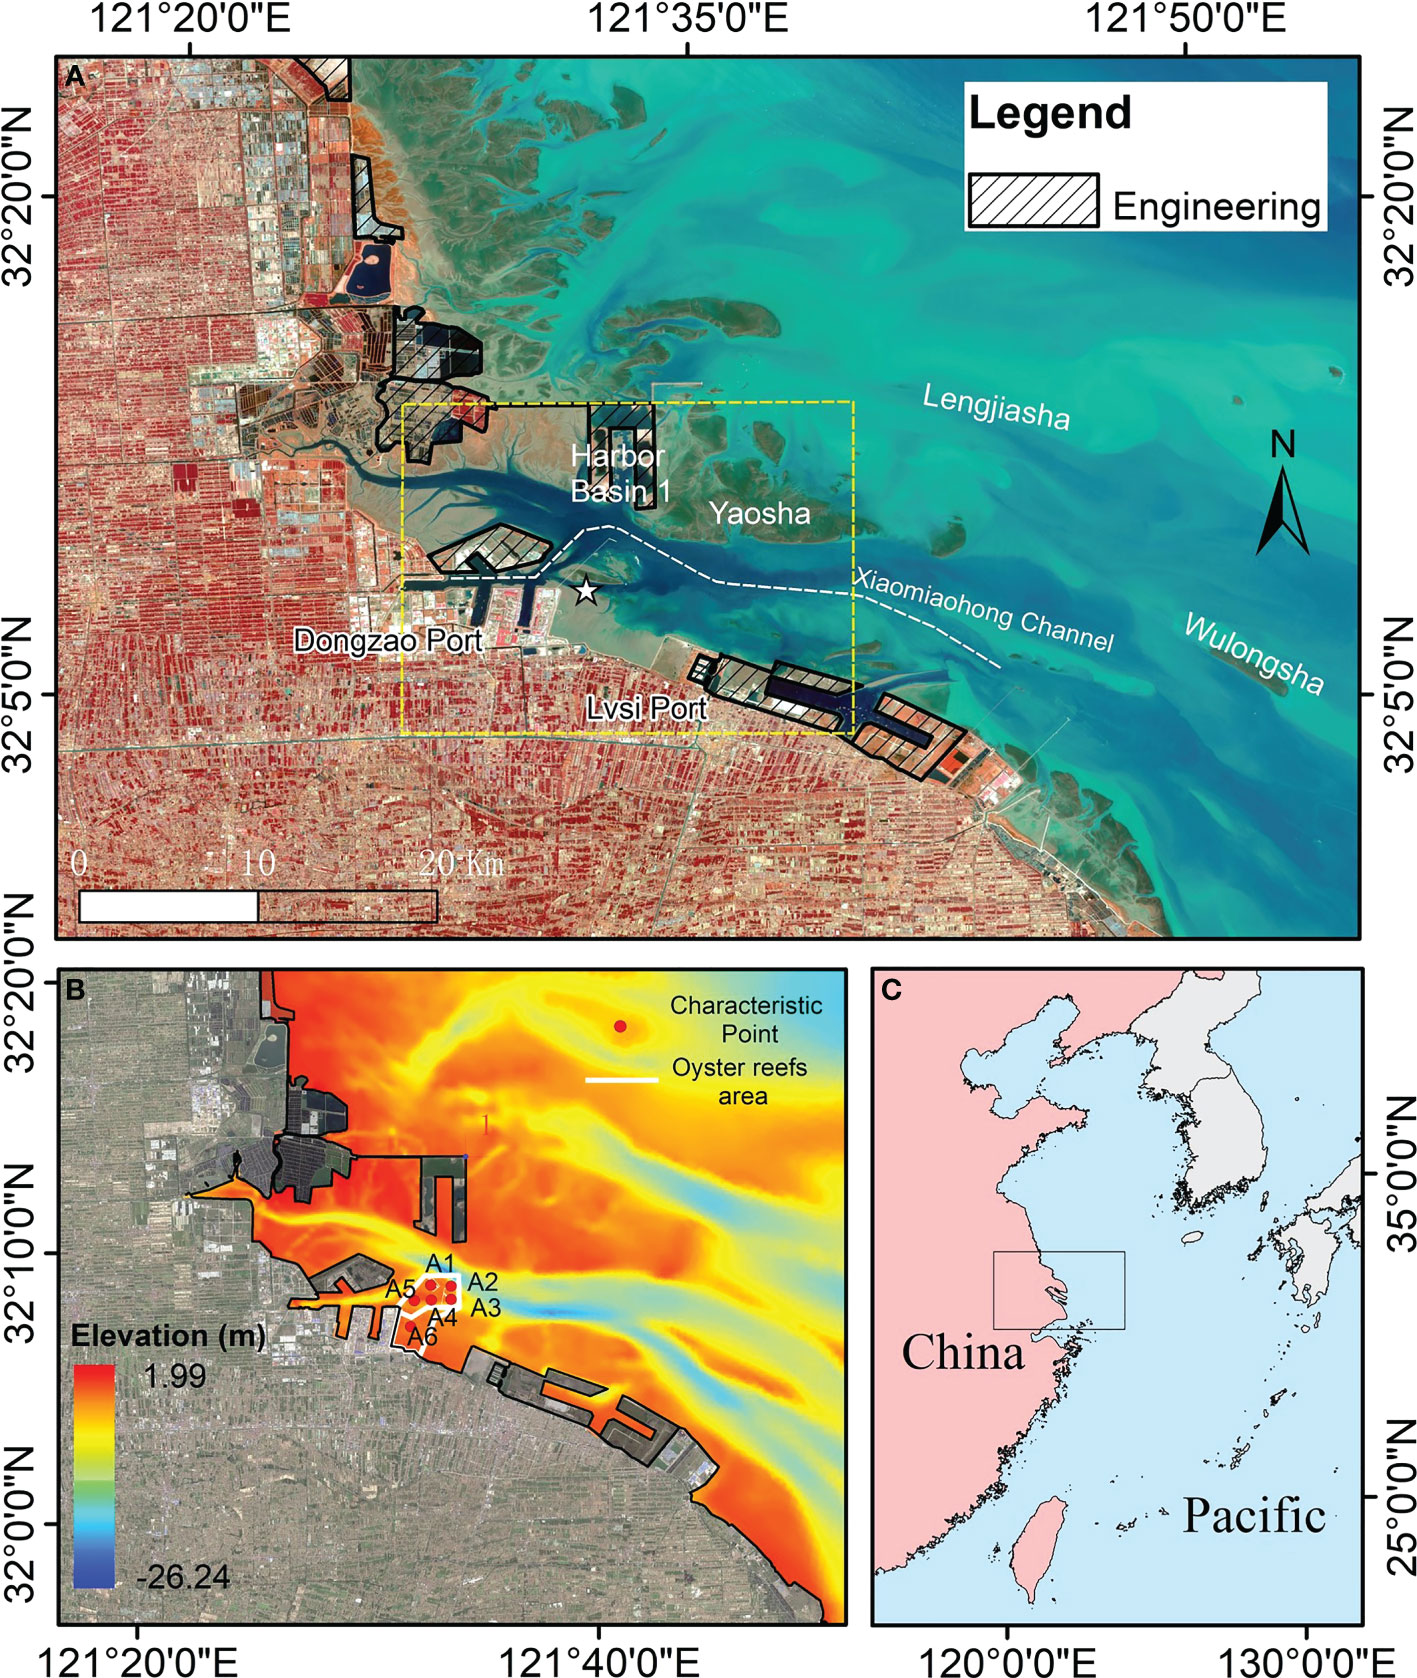
Figure 2 Location map of Liyashan Oyster Reefs. (A) Remote sensing image of the engineering area and oyster reefs (represented by a pentagram). (B) Selection of characteristic points in the oyster reef waters (A1 to A6). The elevation selection is National Vertical Datum 1985. (C) General location map of oyster reef area.
An important change in the depositional environment occurred in the study area approximately 5630 years ago, resulting in coarser sediment grain size, lower salinity of seawater, and lower concentration of suspended sediment, which created conditions suitable for oyster growth and oyster reef development (Wang et al., 2009). However, the high salinity of the study area currently is not suitable for the survival of the dominant species of local oysters; the low temperature in winter and high temperature in summer inhibit the growth of oysters to a certain extent, and the high concentration of sediment suspended in seawater is not suitable for the reproduction and development of oysters (Wang et al., 2009). In this context, human engineering activity may accelerate the deterioration of prospects for development of the Liyashan Oyster Reefs.
The reef area was divided into three functional areas: the center protection area (CPA), resource restoration area (RRA), and moderate utilization area (MUA), as shown in Figure 3. Oyster reefs and their biological resources are mainly concentrated in the CPA and RRA on the north side, whereas the reefs in the MUA near the shore on the south side are relatively sparsely distributed. The CPA is divided into two major blocks of dense oyster reef areas in the southeast and northwest of the Liyashan Oyster Reefs, which are the key protection zones in the reef area.
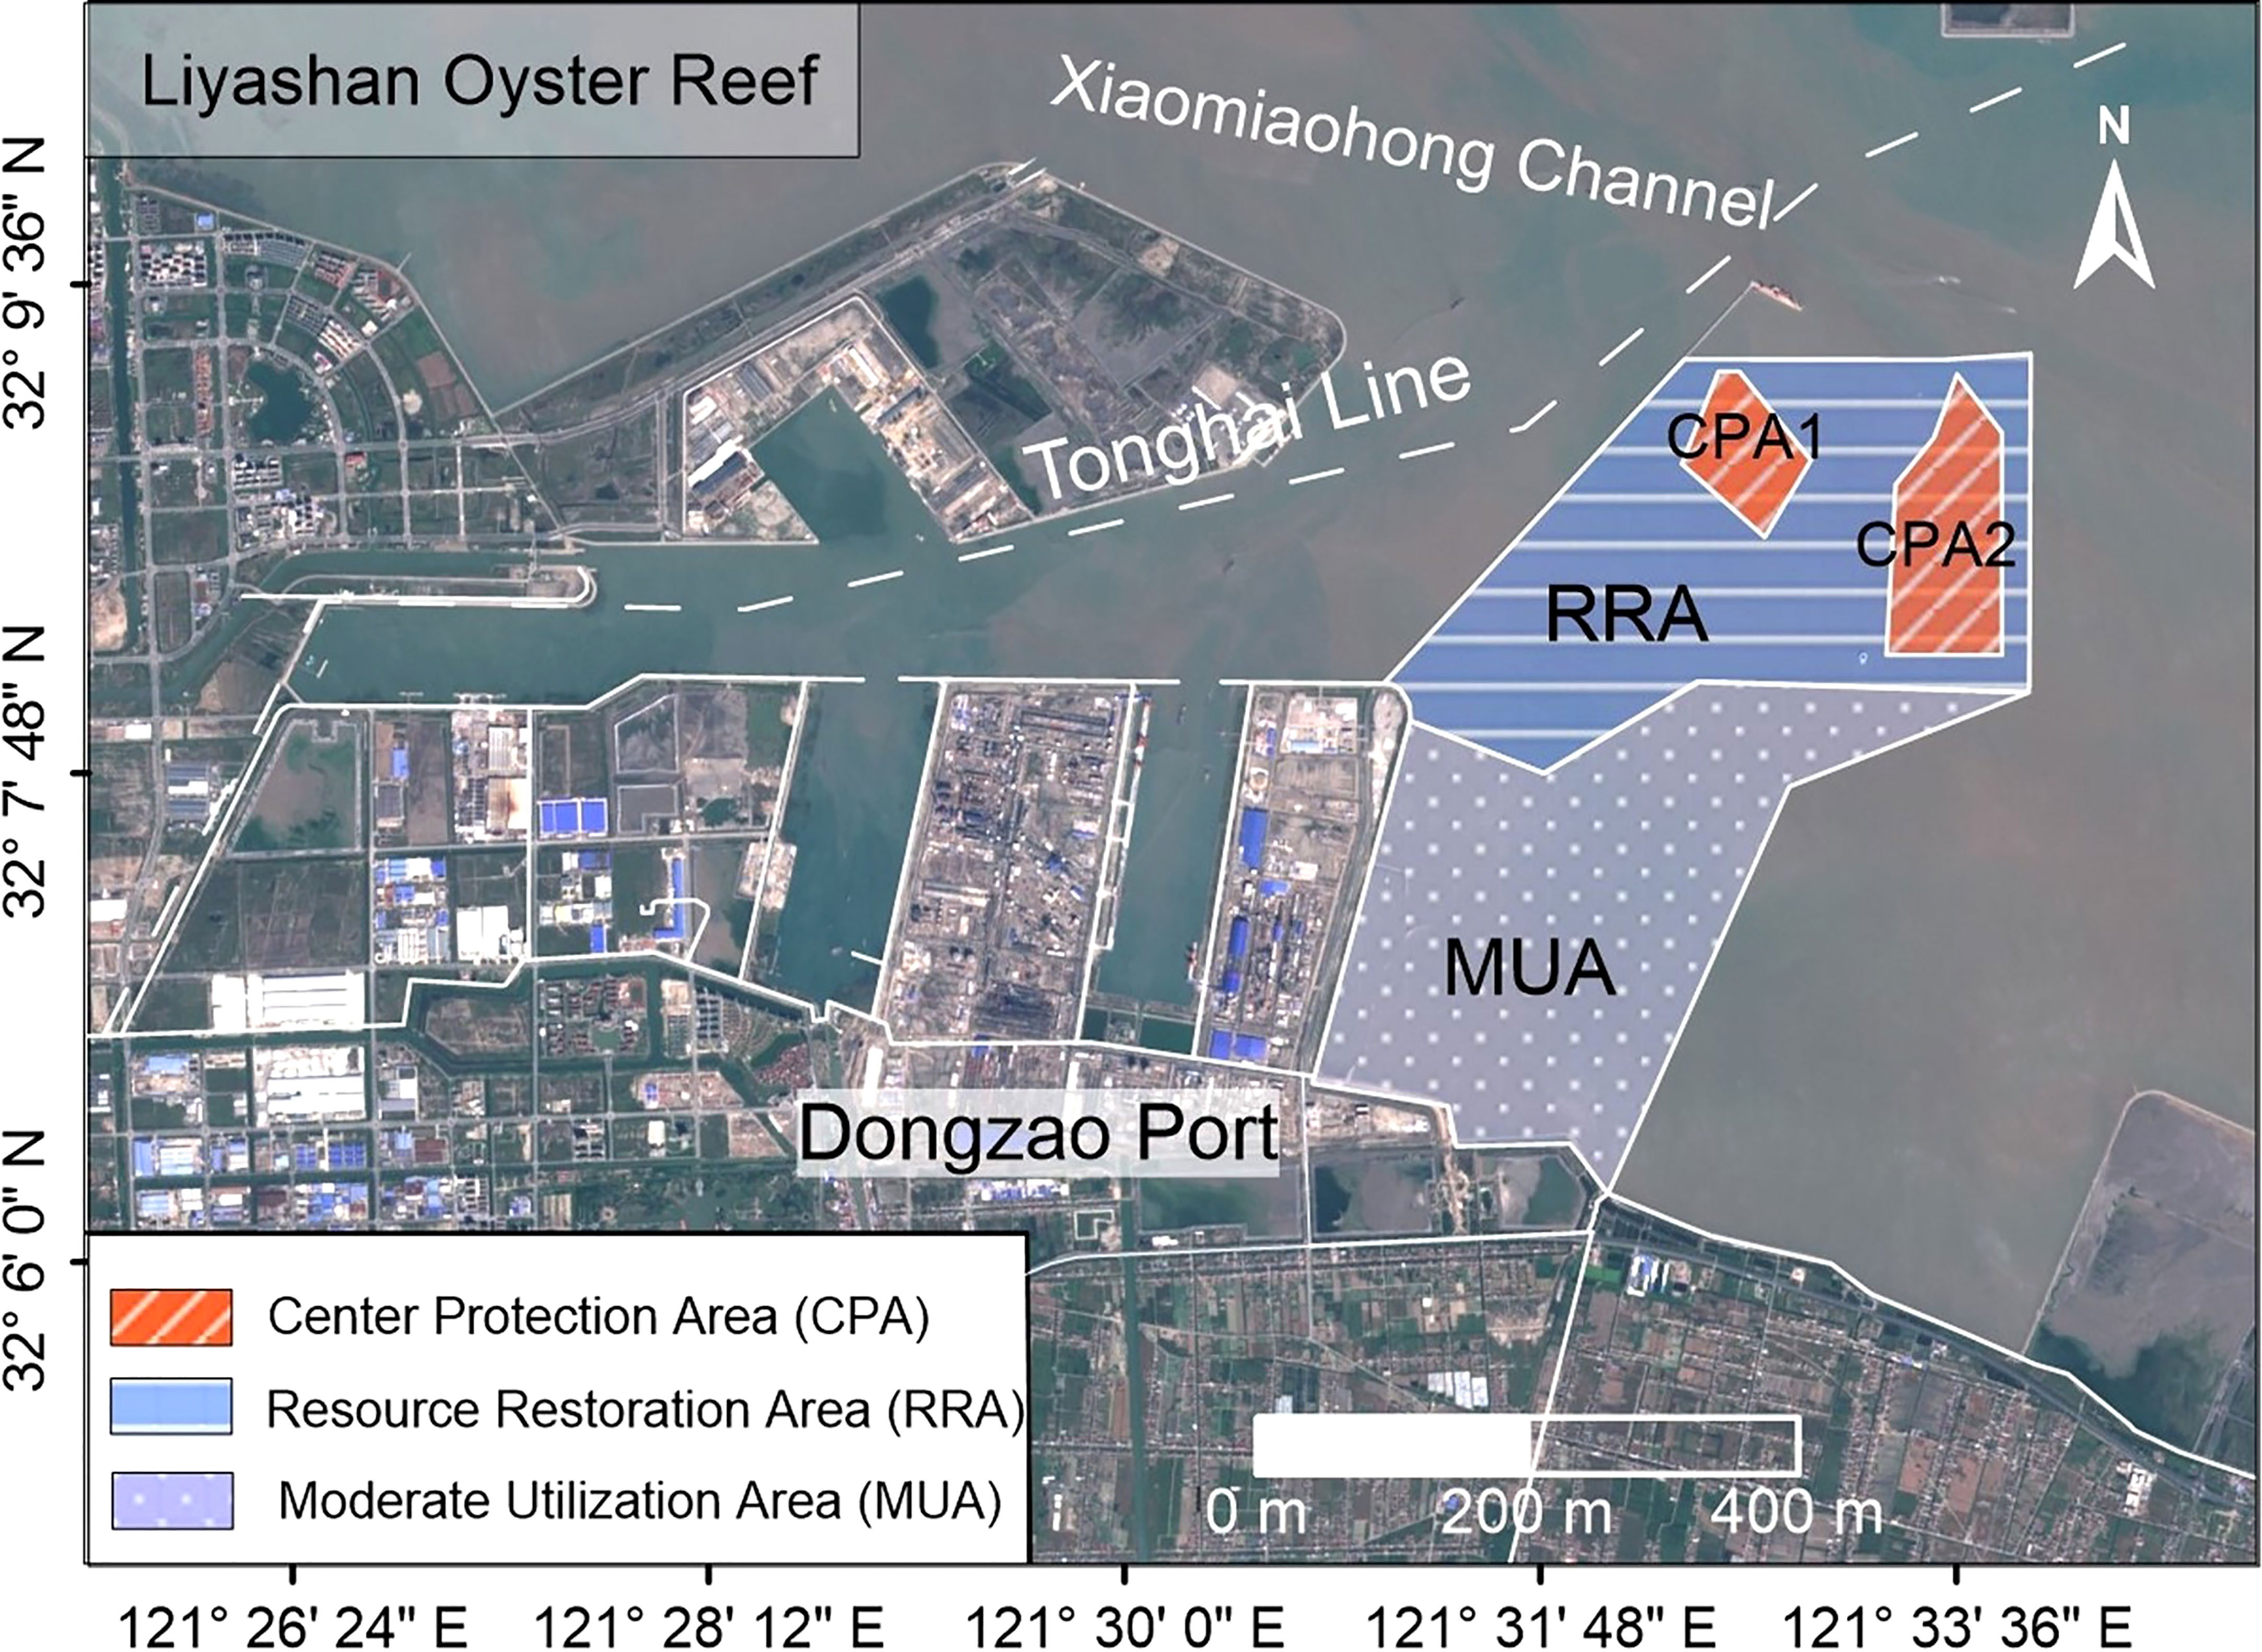
Figure 3 Relative position of the Liyashan Oyster Reefs to the coast and surrounding engineering. The Liyashan Oyster Reefs are divided into three types of functional areas, of which the Centre Protection Area is divided into two blocks.
2.1.2 Introduction to human engineering activity
In early 2012, Nantong City planned to conduct a series of coastal projects in Tongzhou Bay to promote the implementation of related development strategies. The main types of coastal engineering are mudflat reclamation and construction of guide dikes, as well as port and channel construction. It includes the formation of Harbor Basin 1 through the reclamation of Yaosha Shoal, the construction of an east-west guide dike to connect Harbor Basin 1 to the shoreline, the reclamation of Dongzao Port and Lvsi Port, and the construction of the channel connecting the Xiaomiaohong channel with Harbor Basin 1 and Dongzao Port. All the above construction areas are shaded in Figure 2A, except for the channel construction. The model considered the impact of channel construction in changing the seabed elevation in the channel area. The connections between the various types of engineering and environmental factors are shown in Figure 1.
The reclamation of the three coastal blocks northwest of Yaosha Shoal, the reclamation of Dongzao Port, and the construction of Lvsi Port were completed by 2013, whereas the construction of Harbor Basin 1 was completed by 2015. Therefore, in this paper, 2015 is considered as the dividing year, and all construction after 2015 is considered as completed in order to analyze the impact of the construction of coastal engineering through the model.
Considering human engineering activity, the impact of reclamation on oyster reefs is relatively important and should be discussed under the following two conditions. When the flow velocity is greater than 0.6 m/s or the suspended sediment concentration is higher than 0.5 kg/m3 (Li and Shen, 2013), the increase in flow velocity and suspended sediment concentration will cause stress to the growth of oysters and interfere with the development of the reef, while a decrease in flow velocity and suspended sediment concentration will be beneficial to its further development. In contrast, when the flow velocity was less than 0.6 m/s or the suspended sediment concentration was less than 0.5 kg/m3, the changes in flow velocity and suspended sediment concentration had no effect on oyster reefs. In addition, oyster reefs can be affected under three other conditions. First, since oyster growth requires calm water flow conditions, oyster growth is stressed when the distribution of water flow velocity in the vertical direction is disturbed and irregular (Figure 1) (Hart and Finelli, 1999). Second, when the vertical growth rate of oyster reefs was less than the sediment deposition rate, oyster reefs were at risk of degradation by the sediment cover (Figure 1) (Colden and Lipcius, 2015). At this time, enhanced siltation would considerably increase the risk of oyster reef degradation, whereas weakened siltation would be beneficial for reef development. Third, when slight scouring occurs, reef development is not affected, but when scouring is enhanced, the reef is at risk of erosion retreat (Gangnery et al., 2003; Soletchnik et al., 2007).
The construction of ports and dikes has almost the same impact as the reclamation project. The difference, however, is that ports and dikes have a smaller impact on the water, usually confined to the vicinity of the project area, and do not affect the natural properties of the water overall. Channel construction will not only change the hydrodynamic and siltation environments in the sea, but more importantly, the suspended materials generated by dredging during waterway construction will cause great harm to the organs of oysters, which will interfere with the normal development of oyster reefs.
To compare the effects of human engineering activities on the hydrodynamic environment and the bed-level change in the oyster reef area, A1–A3 were taken from the CPA, A4–A5 from the RRA, and A6 from the MUA (Figure 2B) for quantitative analysis of the effect of human engineering activity on tidal flow velocity, suspended sediment concentration, and siltation distribution in the oyster reef area.
2.2 Model setup
2.2.1 Model description
The MIKE3 Flow Model FM is based on a flexible mesh approach and it has been developed for applications in oceanographic, coastal and estuarine environments. The system is based on the numerical solution of the three-dimensional incompressible Reynolds averaged Navier-Stokes equations invoking the assumptions of Boussinesq and of hydrostatic pressure. At the same time, the free surface is taken into account using a sigma coordinate transformation approach. The main equations involved include equations (1) to (8) (DHI, 2012), and the parameters used in the MIKE3 model are listed in Table 1.
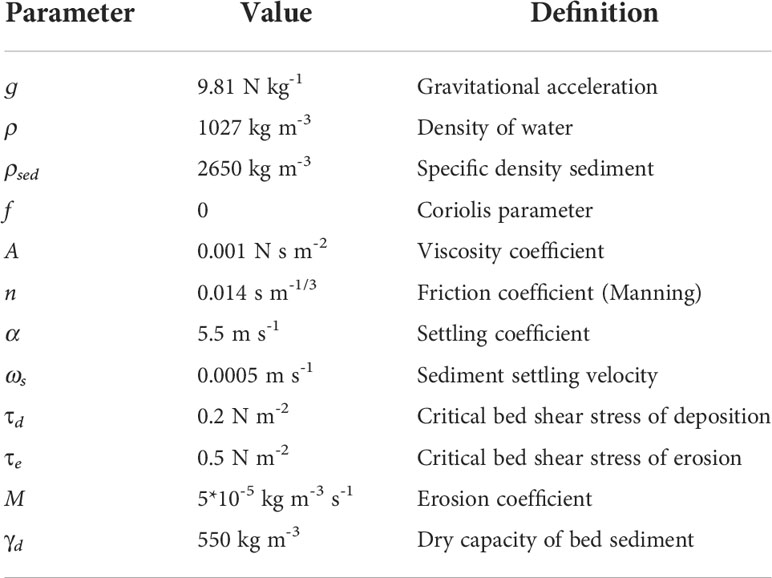
Table 1 Model parameters.
Among them, equations (1) to (5) are basic equations of water flow.
The continuous equation is characterized as:
The momentum equation is characterized as:
In equations (2) and (3):
Where, t is time; η is water surface fluctuation; d is still water depth; h is total water depth (h = d + η); u, v, ω are flow velocity vectors along x, y, z direction respectively; ɡ is gravitational acceleration; f is Coriolis parameter (f = 2ωsinφ, ω is the angle of earth rotation, φ is local latitude); Sxx, Sxy, Syx, Syy are the wave radiation stresses; ut is the vertical turbulence coefficient; Pα is the atmospheric pressure; ρ is the density of water; ρ0 is the relative density of water; Fu, Fv are the stress terms in x and y directions; A is the viscosity coefficient.
The remaining equations (6) to (8) are sediment transportation equations (DHI, 2014).
Convective diffusion equation is characterized as:
Where, ϵx, ϵy, and ϵz are the sediment diffusion coefficients in the x, y, and z directions, respectively; S is the sediment concentration of water; Fs is the sediment source and sink function or bed level change function, also known as near-bottom sediment flux, given by equation (7).
In equation (7), α is the settling coefficient; ωs is the sediment settling velocity; τb is the shear stress at the bottom of bed; τd is the critical siltation shear stress, determined by experiments or field data; τe is the critical scouring shear stress, and is related to the bed sand dry bulk weight, porosity and other parameters; M is the scouring coefficient.
Equation of bed level change is characterized as:
In Eq. (8), γd is the dry capacity of bed sediment; ηb is the bed level.
2.2.2 Mesh and model parameters
The calculation domain of the hydrodynamic model is shown in Figure 4. The model area was set to approximately 3770 km2, with a non-structural triangular grid for dissection. Furthermore, local refinements were conducted in the near-shore area. The minimum grid resolution of the model was 30 m, the number of grid cells was 43 640, and the number of grid nodes was 22 162. Three outer sea open boundaries were set in the model, including south, east, and north, all of which were provided by the tide model of the offshore waters of Jiangsu Province for tidal level boundary conditions.
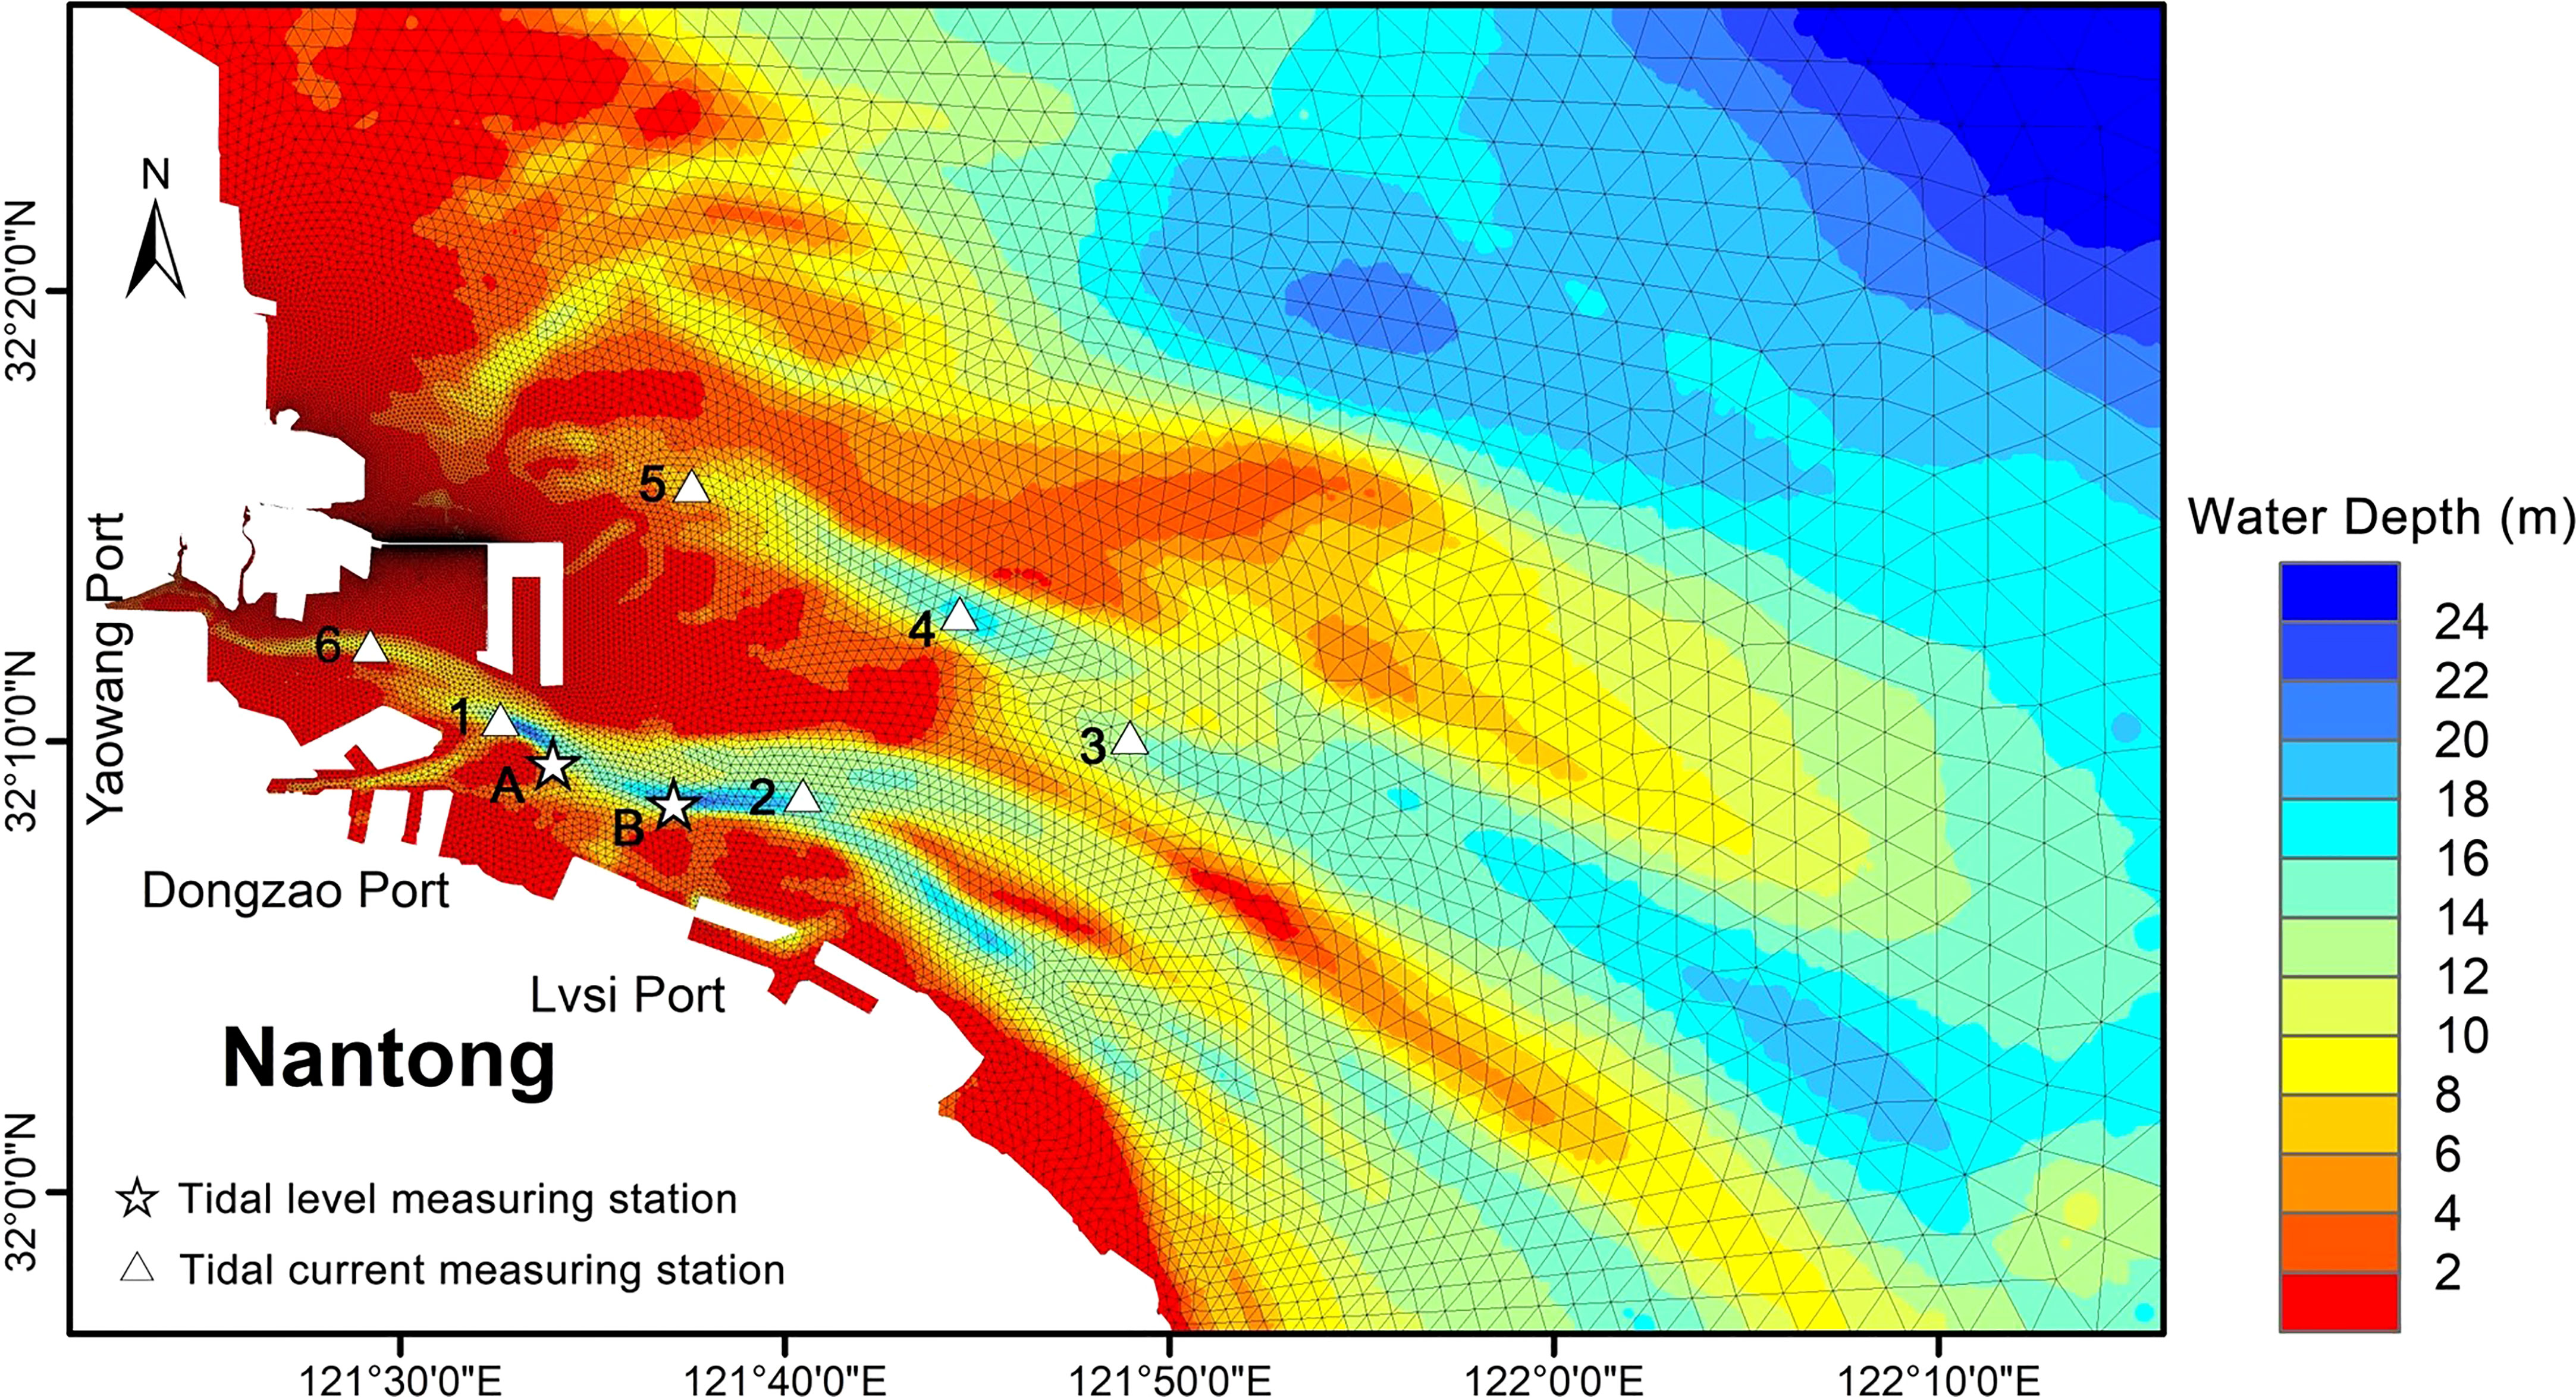
Figure 4 Model grid of study area, and locations of two tidal level measuring stations (A, B) and six tidal current measuring stations (1–6). The model grid is refined in the nearshore waters, and the water depth in the surrounding waters is represented by a gradual change from red to blue. The map also identifies the names of adjacent ports and cities. In addition, the water depth corresponds to the National Vertical Datum 1985.
2.3 Model validation
In order to verify the accuracy of the model, the measured data of tide level, flow velocity and suspended sediment concentration from December 22, 2018 to January 22, 2019 were applied. And the distribution of the validation points is shown in Figure 4.
The actual measurement data used in the paper were acquired from the hydrodynamic and sediment measurements conducted by the CCCC Third Harbor Consultants Co., LTD. in the waters of Tongzhou Bay from December 2018 to January 2019. Tidal level measuring stations A and B used the AQUAlogger 520p tide gauge from AQUATEC, which automatically records water level values every 10 minutes and uses 40 sets of water level values spaced 1 second apart each time for wave abatement operations. Each tidal current measurement station uses NORTEK’s Acoustic Doppler Current Profiler (ADCP) for vertical tidal current velocity measurement. Finally, water samples were collected in six layers using a horizontal water collector on six tidal current measuring stations, with a sampling volume of 500 ml each. The suspended sediment concentration at the measurement points was obtained by filtering, drying and weighing operations.
During the measurement period, the average wind speed was between 6.9 m/s and 8.1 m/s, and the maximum wind speed was within 14.2 m/s. The wind direction was mainly northwest to north, and the sea state was below level 4. Hydrodynamic measurements were carried out in strict accordance with technical requirements and specifications, and all measuring instruments were calibrated before the measurements to ensure the reliability of the original data.
According to the measured data to determine the tide level validation period from December 23, 2018 00:00 to January 22, 2019 23:00, the flow velocity and sediment concentration validation period from December 22, 2018 16:00 to December 23, 2018 18:00. Among them, the tide level validation stations were the tidal level measuring station A and tidal level measuring station B, and the flow velocity and sediment validation stations were points 1-6 as shown in Figure 4. In view of the limitation of space, only the tidal level validation results of tidal level measuring station A and tidal level measuring station B, along with the flow velocity and sediment concentration validation results of station 1 are listed in this paper, as shown in Figures 5–7. The validation results show that the difference between the calculated value and the actual measurement is slight, and the process is in good agreement, indicating that the model can be relatively accurate to simulate the hydrodynamic conditions of coastal area. Due to space limitations, the validation of flow velocity, flow direction and sediment concentration at the station 1-6 in the surface and bottom layer is shown in the Supplementary Figures 1-3.
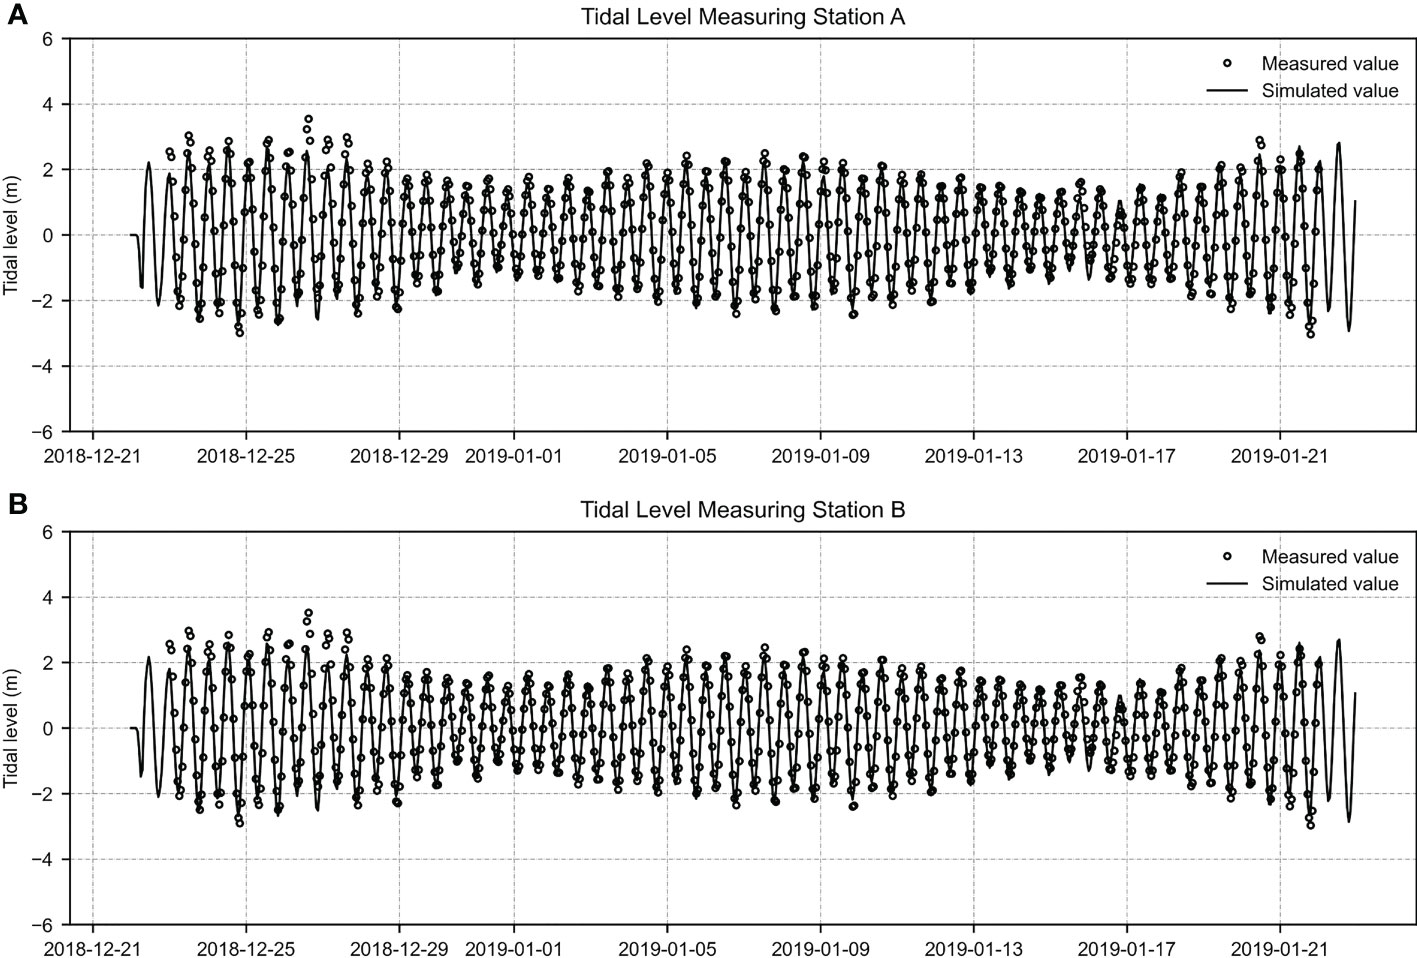
Figure 5 Comparison of tidal level measurement data points with model simulated tidal level fit curves for (A) Tidal Level Measuring Station A and (B) Tidal Level Measuring Station B from December 22, 2018 to January 22, 2019.
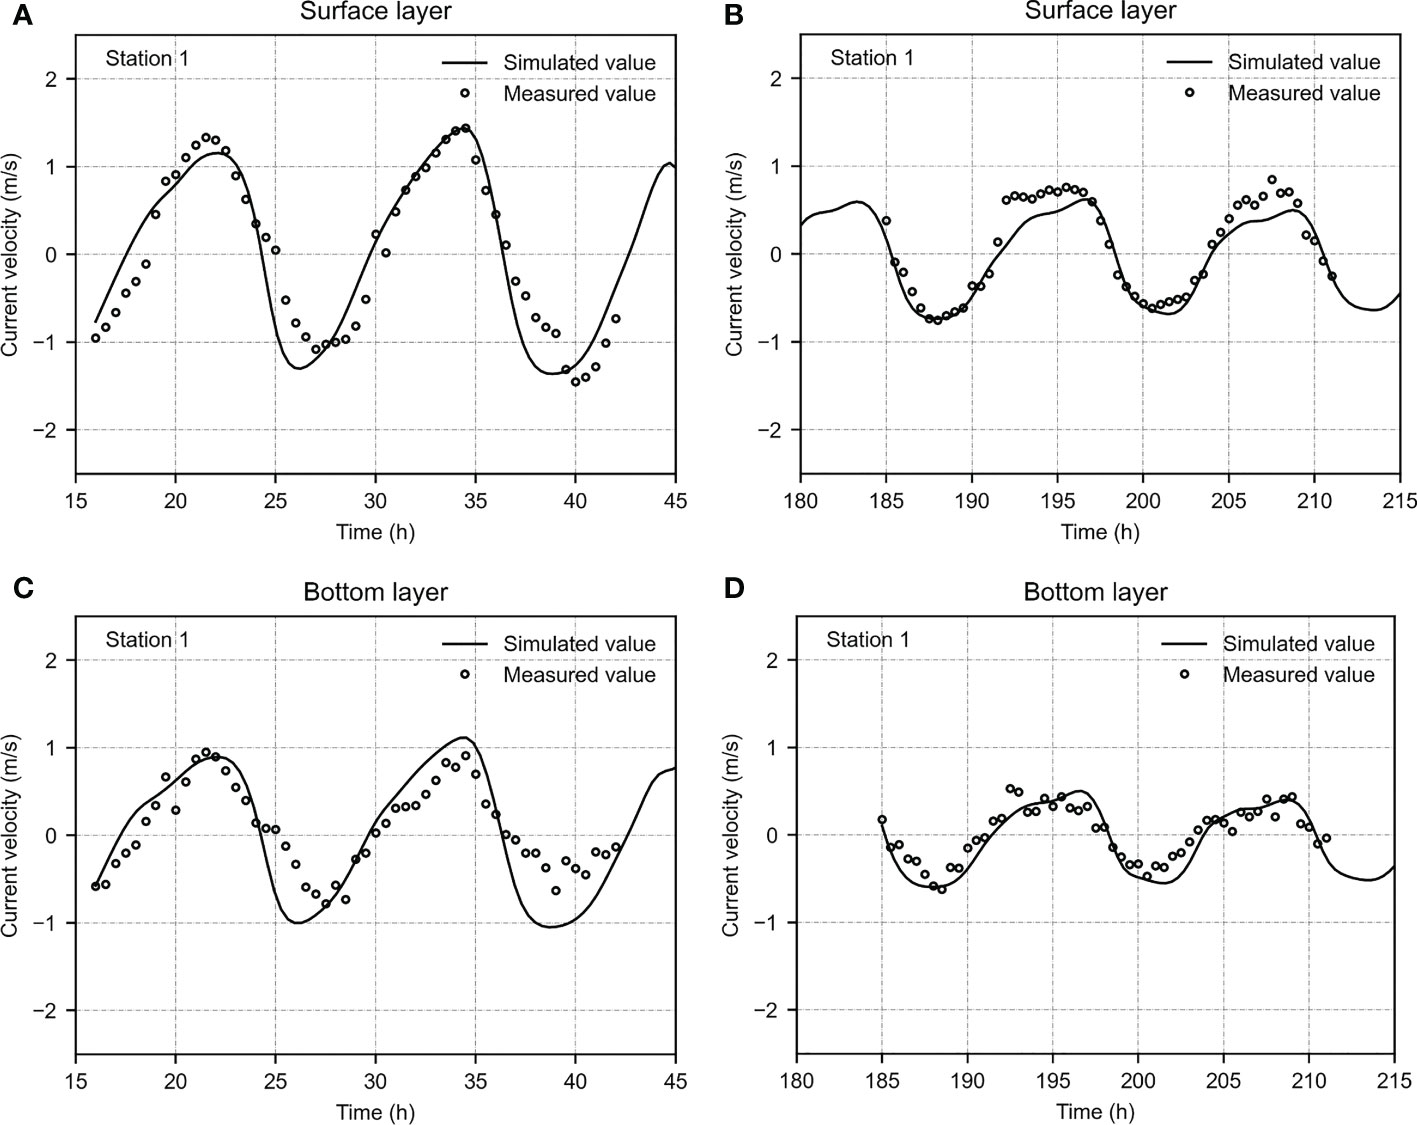
Figure 6 Validation of surface & bottom flow velocity during spring & neap tide at Station 1. (A) Surface current velocity at Station 1 during spring tide. (B) Surface current velocity at Station 1 during neap tide. (C) Bottom current velocity at Station 1 during spring tide. (D) Bottom current velocity at Station 1 during neap tide.
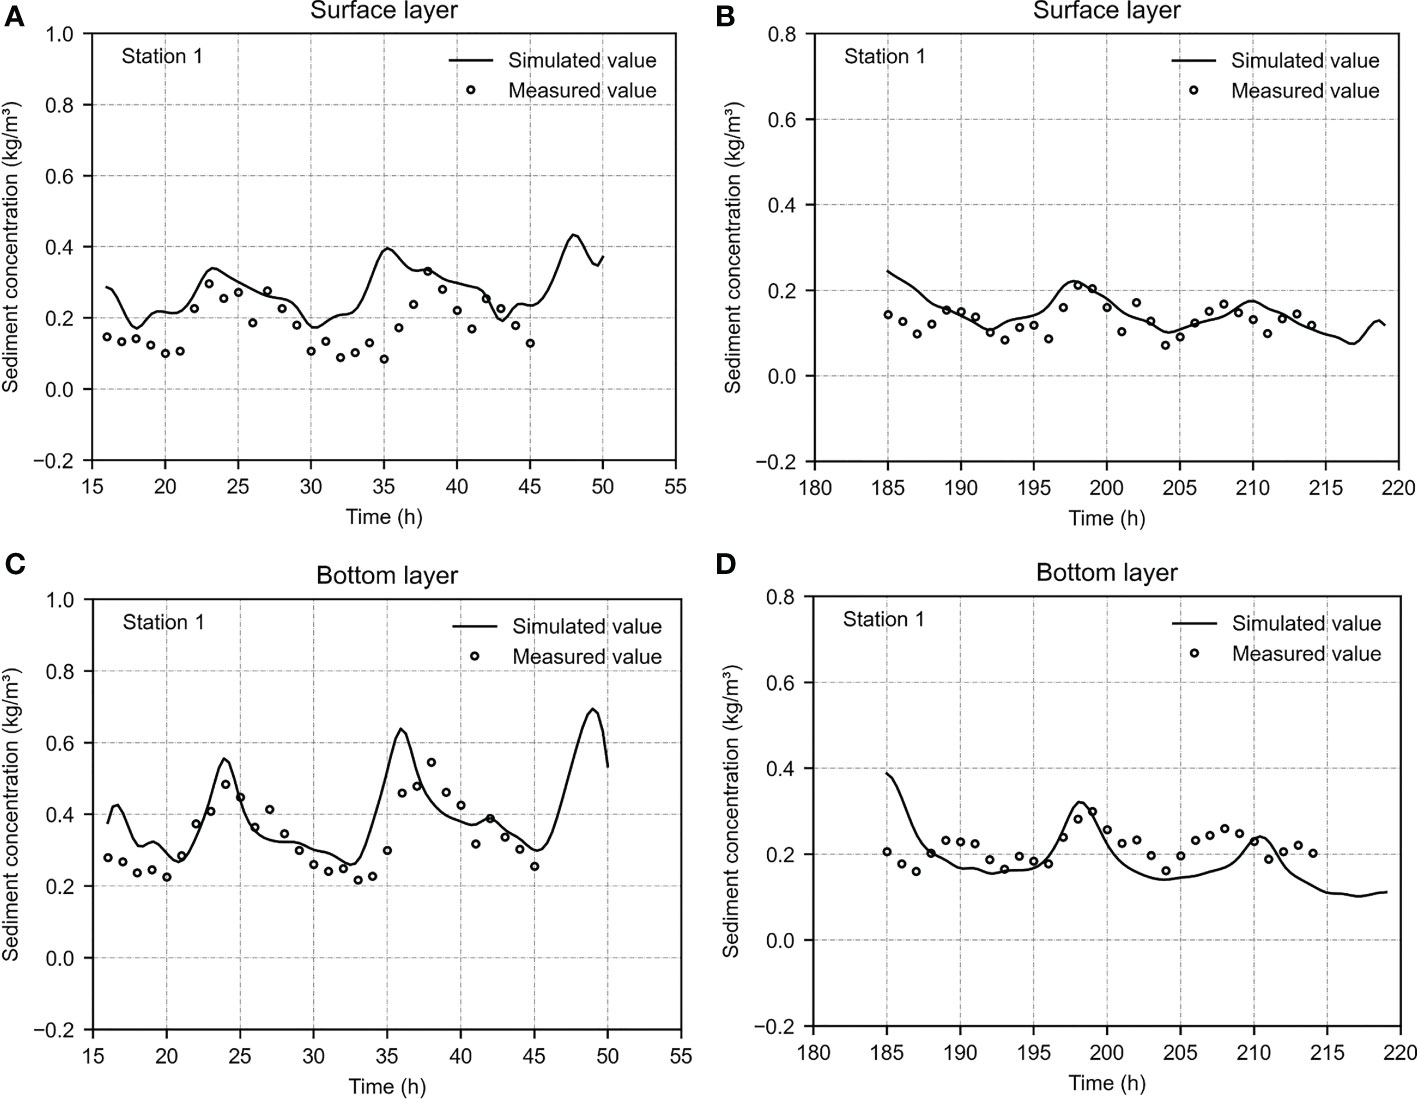
Figure 7 Validation of surface & bottom sediment concentration during spring & neap tide at Station 1. (A) Surface sediment concentration at Station 1 during spring tide. (B) Surface sediment concentration at Station 1 during neap tide. (C) Bottom sediment concentration at Station 1 during spring tide. (D) Bottom sediment concentration at Station 1 during neap tide.
Also, to quantitatively show the results of the model validation, we evaluated the differences between the measured and simulated values of flow velocity, flow direction, and sediment concentration, which are shown in Supplementary Tables 2, 3. We use Pearson correlation coefficient to evaluate the correlation between flow velocity and flow direction, the higher the result tends to 1, the better the model simulation results. Supplementary Table 2 shows that the Pearson correlation coefficient for 87.5 percent of the flow velocity exceeds 0.9, indicating that the model simulated flow velocity distribution is very close to the actual situation. Supplementary Table 2 also shows that the Pearson correlation coefficient for 83.3 percent of the flow direction exceeds 0.8, indicating that the model simulated flow distribution is also quite close to the actual situation. In addition, considering the relatively large difference in simulation accuracy of sediment concentration in the mathematical model, we use Mean Absolute Percentage Error (MAPE) to evaluate, as shown in Supplementary Table 3. The results show that the MAPE of 75 percent sediment concentration is less than 0.1, and the maximum MAPE is 0.152. Considering the difference of sediment concentration distribution in Figure 8, the error of the model is acceptable and basically does not affect the analysis of sediment concentration distribution.
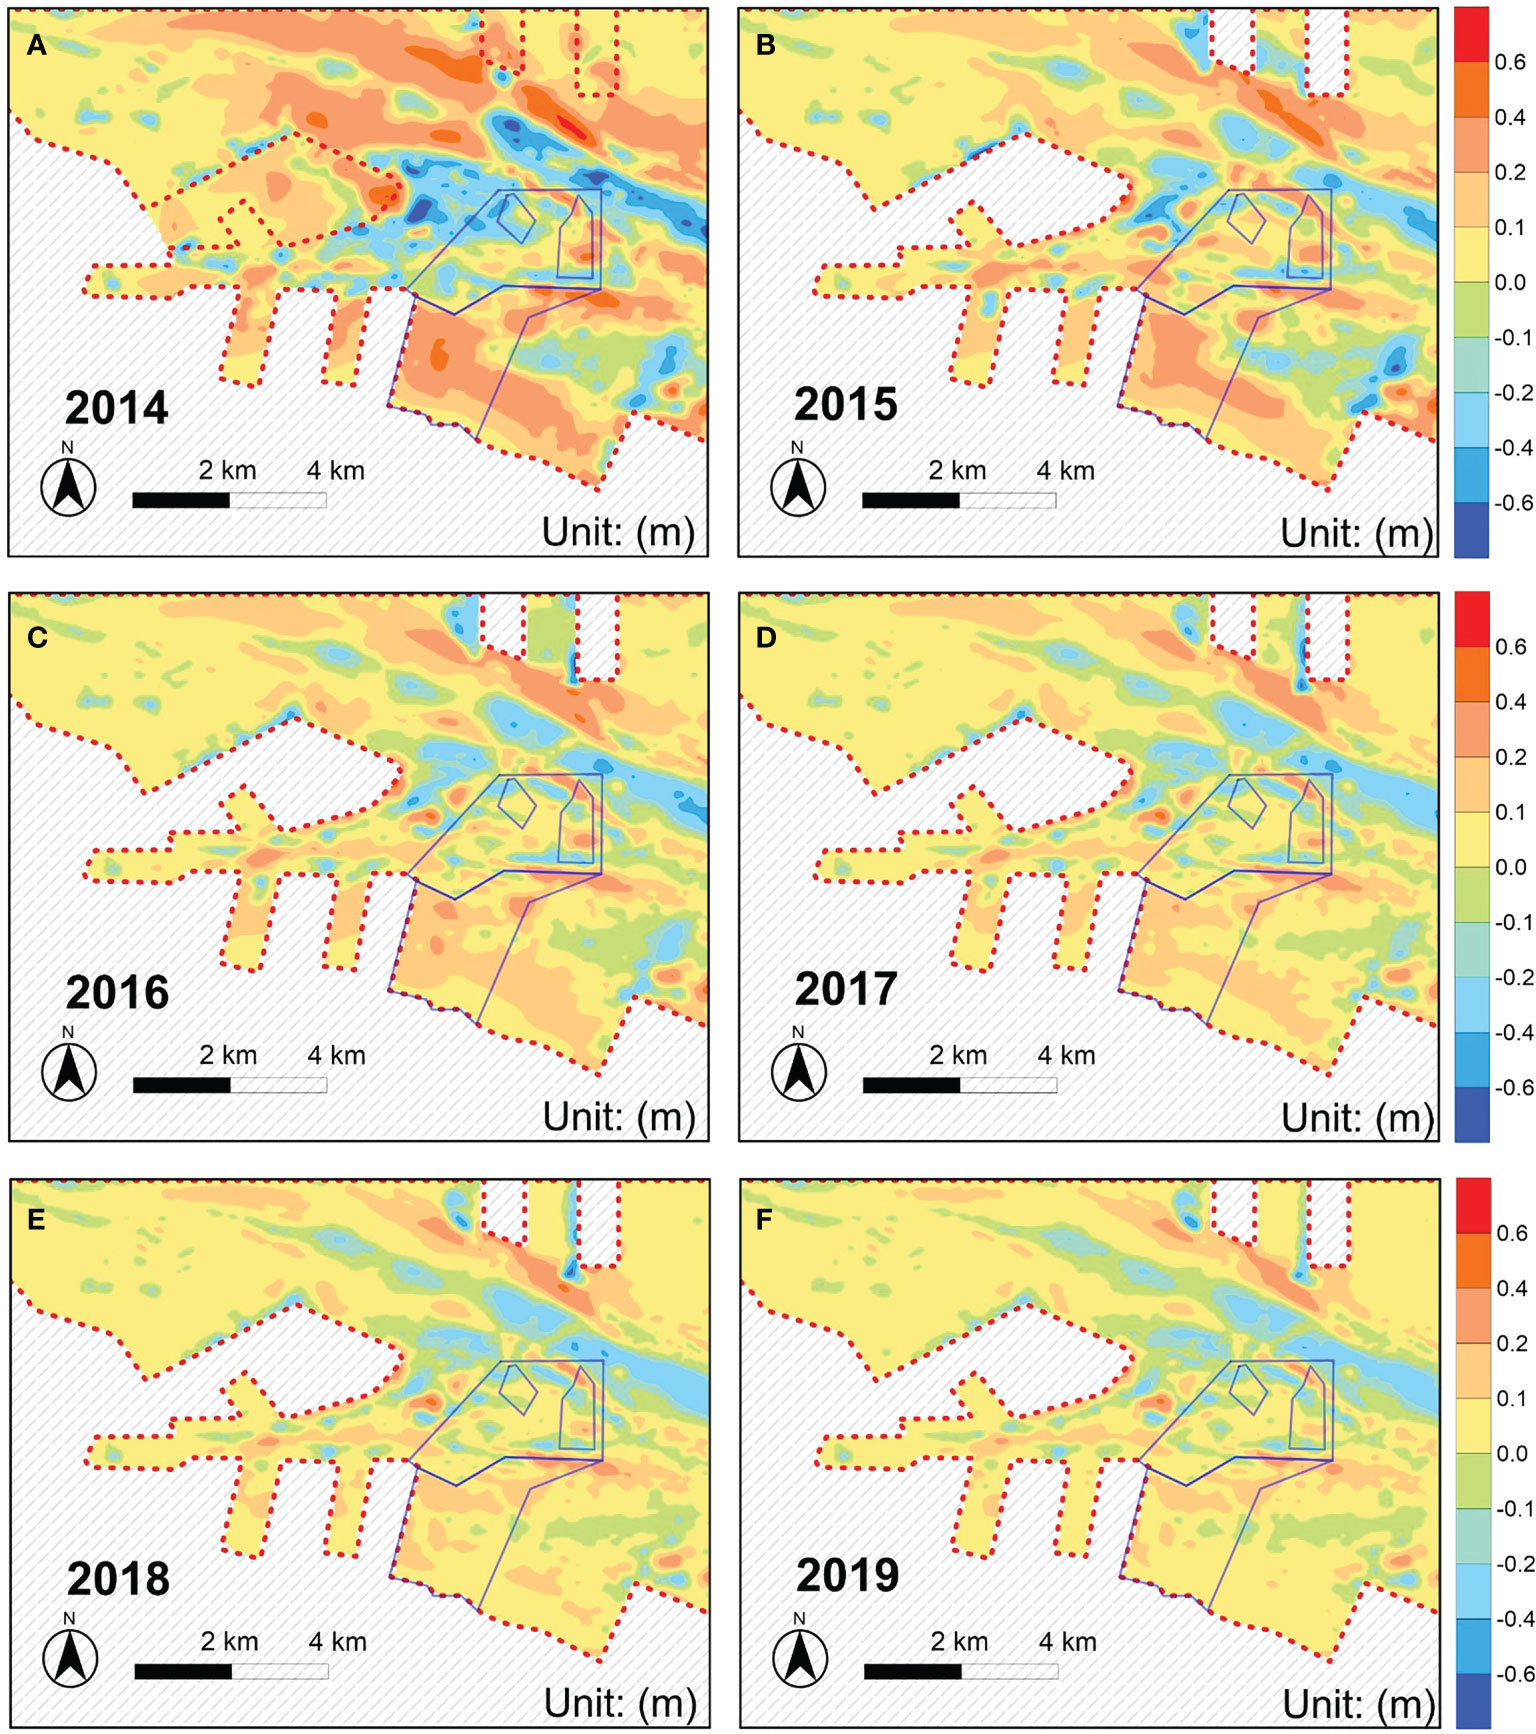
Figure 8 Distribution of bed level in oyster reef waters before (2014) and after (2015–2019) human engineering activity. The locations of oyster reefs and their subdivisions are marked on the figures with solid blue lines. (A–F) 2014–2019.
3 Results
Although the Liyashan Oyster Reefs are in a state of degradation due to high salinity, low winter temperature, and high summer temperature, as well as high suspended sediment concentration of seawater (Wang et al., 2009), disturbance to the oyster reefs by human engineering activity still cannot be ignored. As benthic shellfish, oysters always live on the seabed and grow on the surface of the reef, which is mainly affected by the environment of the bottom waters. Human engineering activity affects oyster growth by influencing the environmental factors of the water column, which in turn hinders the development of oyster reefs. However, human engineering activity directly leads to the degradation of reef cover by promoting sediment deposition, which is also the most important reef stress factor.
3.1 Analysis of the impact of the flow velocity
The dynamic environment of the Liyashan Oyster Reefs is mainly controlled by progressive waves in the East China Sea. Tidal waves are in the form of standing waves, and the currents reciprocate. The distribution of bottom flow velocity changes in the oyster reef waters before and after human engineering activity (Figure 9) showed that bottom flow velocity in the reef area generally decreased due to human engineering activity. The decrease in flow velocity is most obvious in the CPA and RRA, and largest in the area near the inlet channel of Dongzao Port and the side of Xiaomiaohong Channel, with the largest decrease of 0.15 m/s. The decrease in flow velocity in the near-shore MUA was smaller, and in the reef area showed a trend of increasing offshore. In addition, a comparison of the surface and bottom flow fields during spring and neap tides in the oyster reef area before and after human engineering activity is shown in Supplementary Figure 4. It can be seen that the flow direction in the oyster reef waters, which is our concern, remained stable.
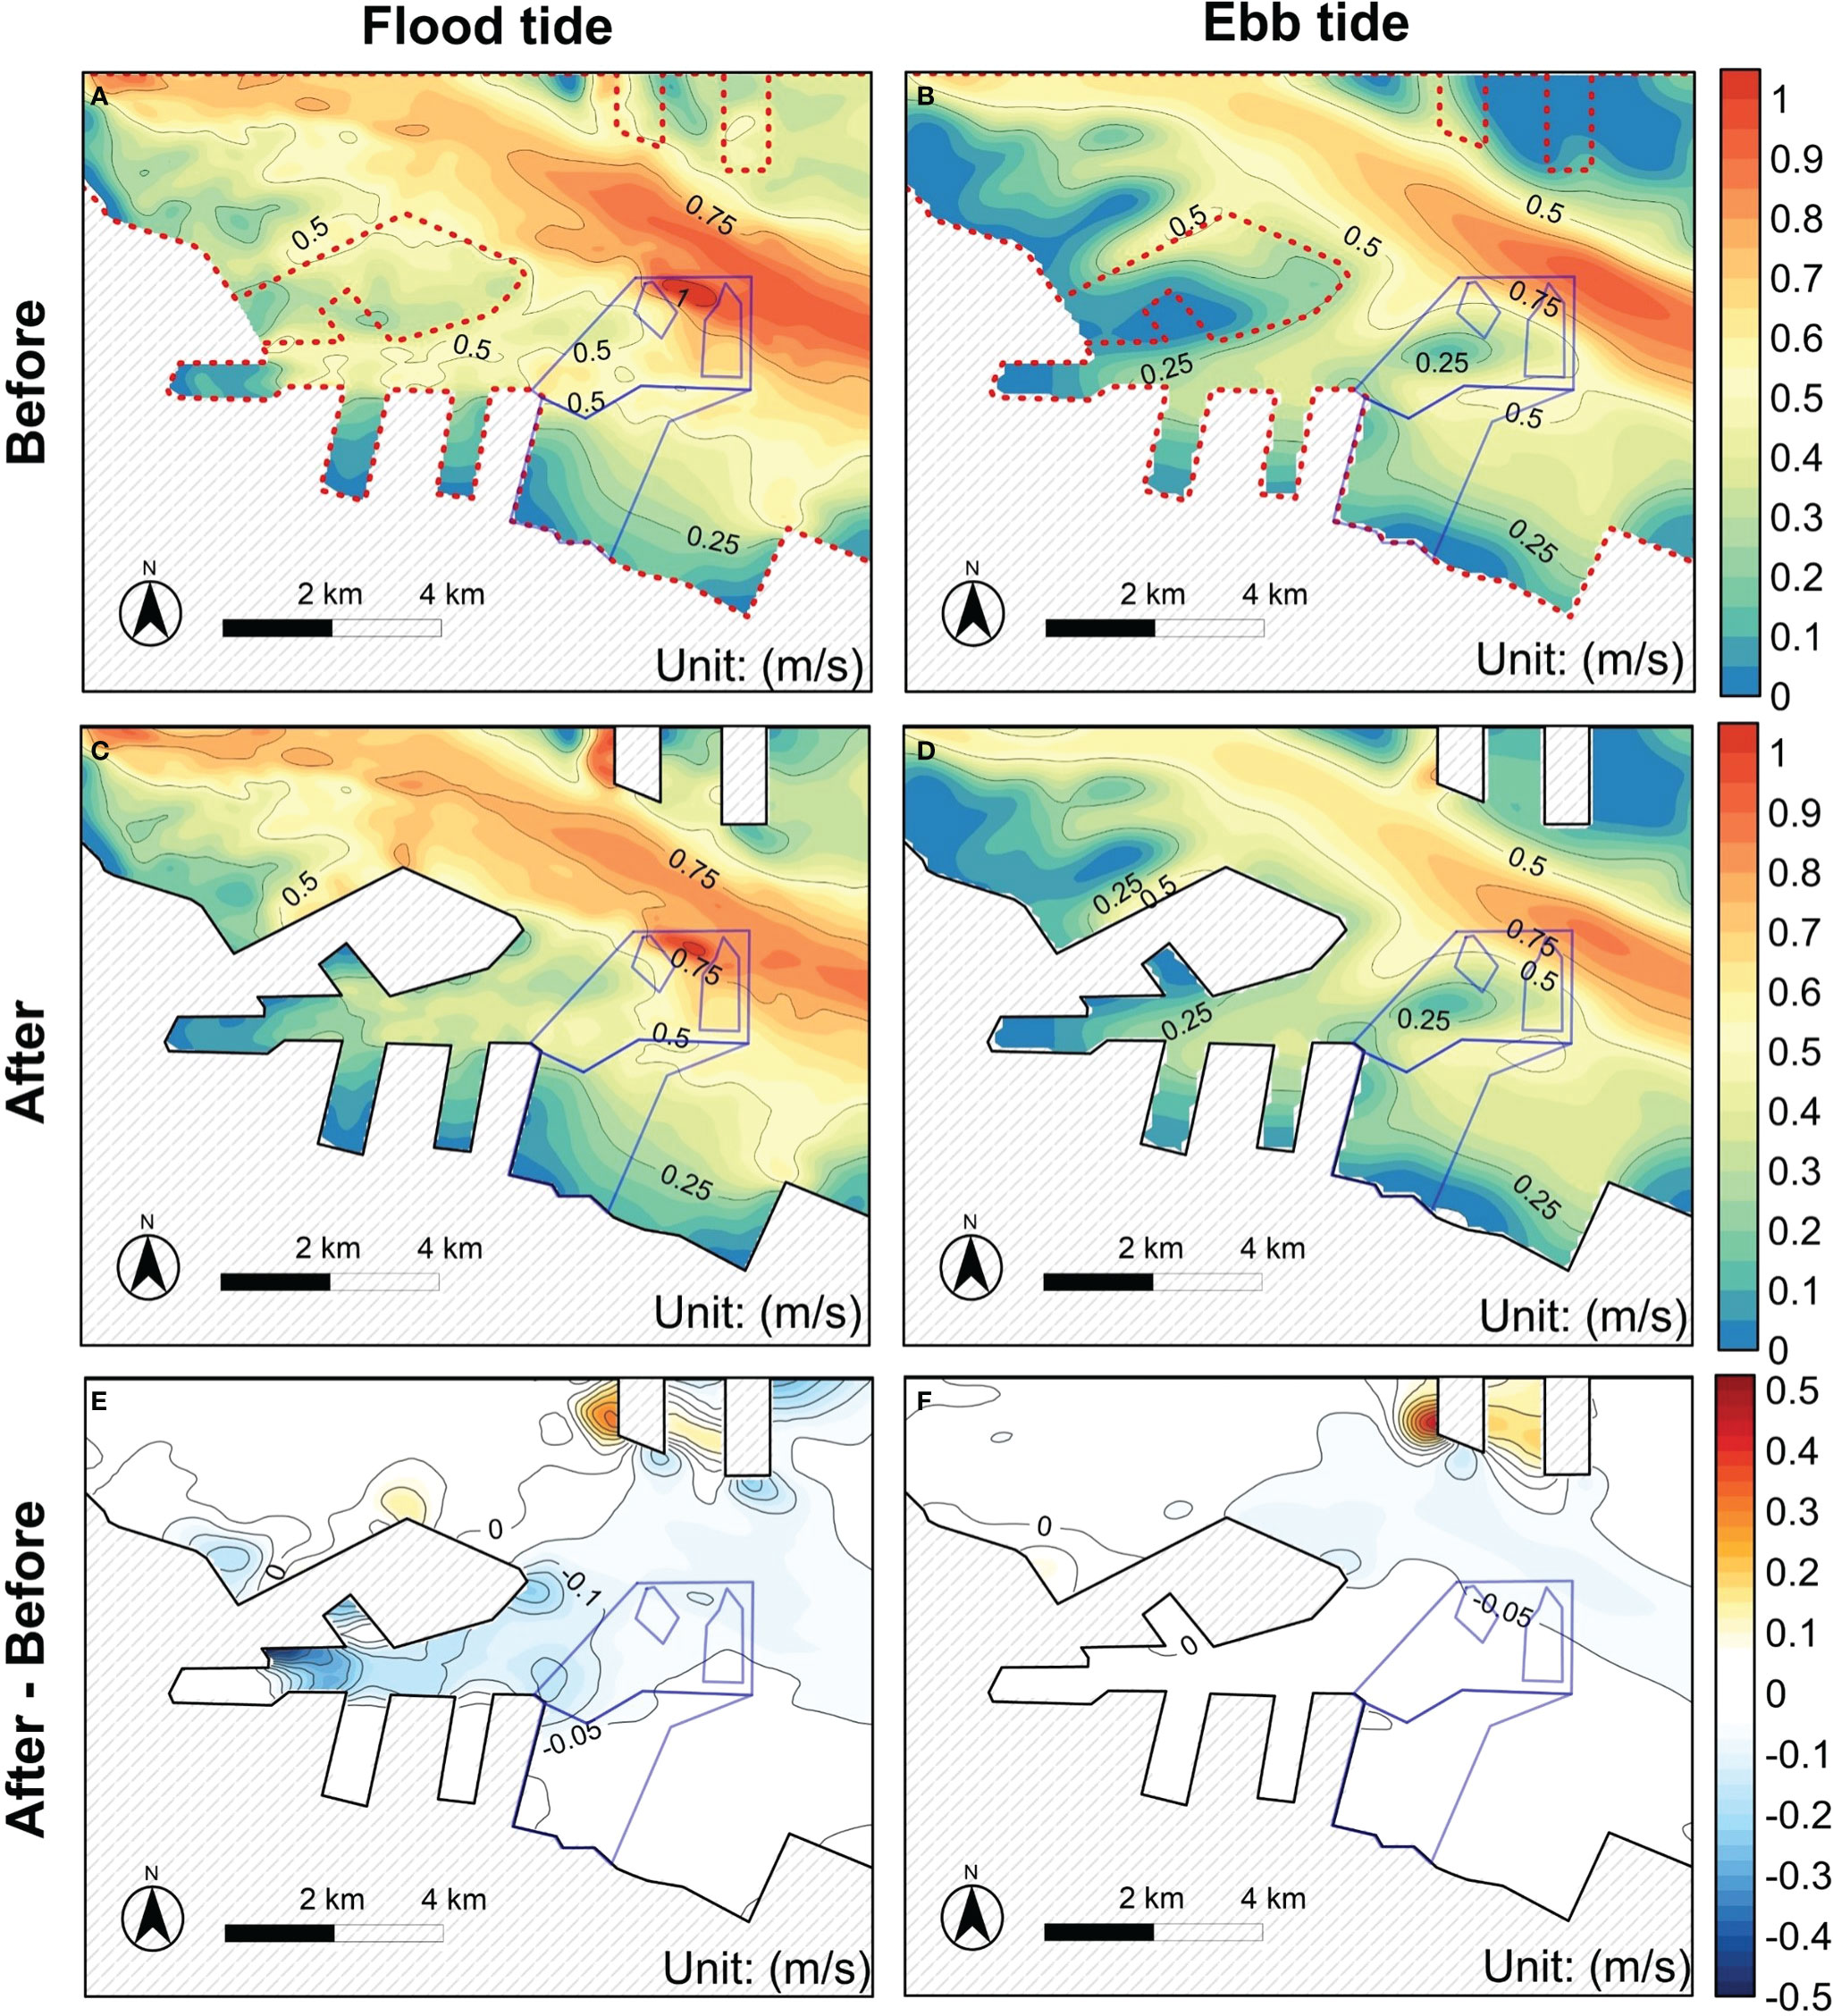
Figure 9 Comparison of bottom flow velocity during spring tide before and after construction of the project. The locations of oyster reefs and their subdivisions are marked on the figures with solid blue lines. Bottom flow velocity distribution during (A) peak flood tide and (B) peak ebb tide of the spring tide before construction of the project. Bottom flow velocity distribution during (C) peak flood tide and (D) peak ebb tide of the spring tide after construction of the project. Difference in bottom flow velocity distribution during (E) peak flood tide and (F) peak ebb tide of the spring tide before and after construction (flow velocity before construction minus flow velocity after construction).
To further study the influence of human engineering activity on the vertical distribution of tidal flow velocity in the oyster reef area, a logarithmic distribution fit was conducted to further determine whether the vertical distribution of flow velocity is stable and whether stable current conditions can have a positive effect on the growth of oyster reefs. The simulated values of the vertical flow velocity at the characteristic points before and after human engineering activity were plotted and fitted with a logarithmic distribution, as shown in Figure 10. In this study, the coefficient of determination R and root mean square error (RMSE) were used to evaluate the fitting effect of the vertical flow distribution to the logarithmic distribution. The values of R range from [0, 1]; the closer R is to 1, the better the fit to the logarithmic distribution. Similarly, the closer the RMSE is to 0, the more effective the fit to the logarithmic distribution.
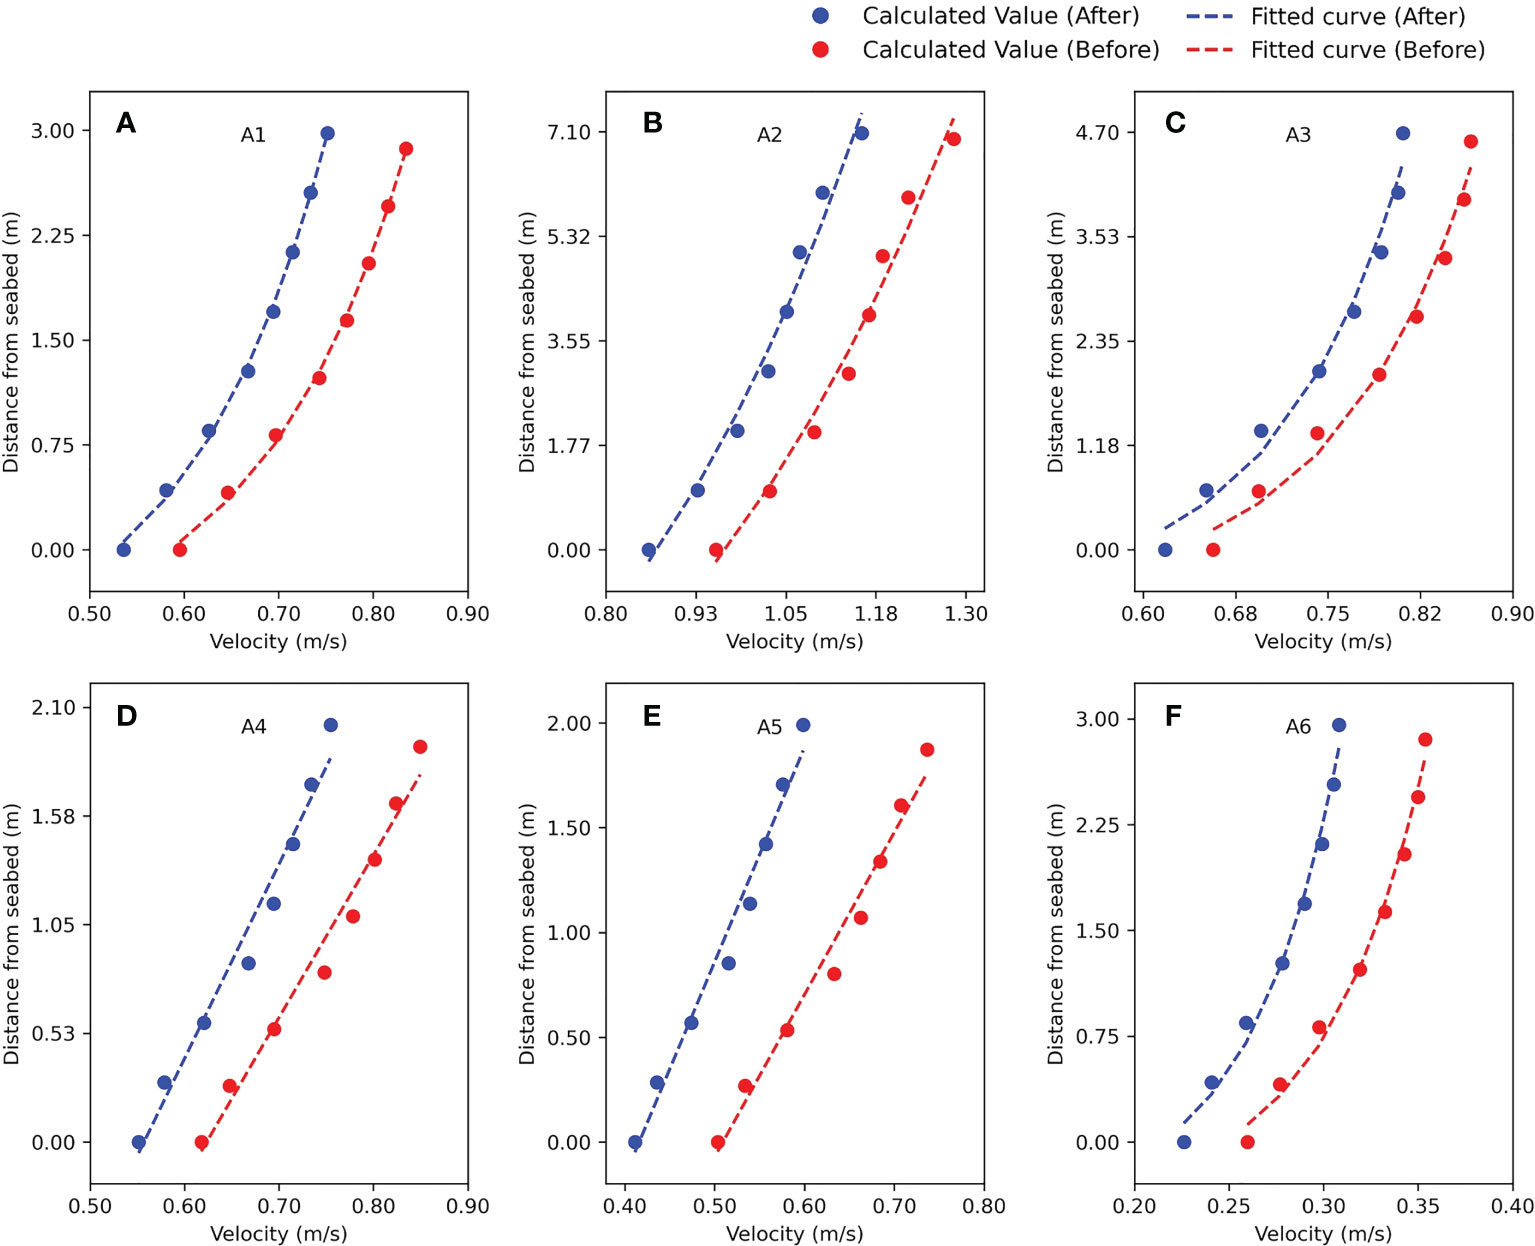
Figure 10 Calculated values and fitted curves of vertical flow velocity at characteristic points of peak flood tide of spring tide before and after human engineering activity. (A–F) Characteristic points A1 to A6.
The coefficient of determination R and RMSE for the fit to logarithmic distribution of flow velocity at each characteristic point is listed in Supplementary Table 1. By combining Figure 9 with Supplementary Figure 5, it can be seen that before human engineering activity, the flow velocities in CPA1 (A2), RRA (A4, A5), and MUA (A6) basically conformed to the logarithmic distribution in the vertical direction, and CPA2 (A2, A3) was close to the Xiaomiaohong Channel, which had a slightly poorer fit to the logarithmic distribution of flow velocity. The positions of A1–A6 are shown in Figure 1. The overall flow pattern in the oyster reef area was stable, surface flow velocity was greater than bottom flow velocity, vertical flow velocity was in line with the logarithmic distribution, and the flow velocity in the CPA was the largest. Flow velocity in the reef area decreased owing to human engineering activity; however, the law that the vertical flow velocity conforms to the logarithmic distribution remains unchanged, and the water flow remains stable.
3.2 Analysis of changes in the suspended sediment
The implementation of human engineering activity will lead to simultaneous changes in the suspended sediment environment in oyster reef areas. Unlike the changes in flow velocity, the changes in suspended sediment concentration in the vertical direction were not consistent, and human engineering activity led to an overall decreasing trend in the surface suspended sediment concentration in the reef areas, whereas changes in the bottom suspended sediment concentration were distributed regionally (Figure 11 and Supplementary Figure 6).
For the bottom suspended sediment concentration, the southwest side of the RRA showed the greatest change during spring tide. The concentration of suspended sediment in the CPA remained at 0.30–0.40 kg/m3 (basically unchanged); in the southwest side of the RRA a clear change was noted, from 0.20–0.40 kg/m3 to 0.17–0.35 kg/m3, with the largest reduction value of 0.15 kg/m3, while the rest of the zone showed less change. In MUA, the concentration of suspended sediment increased nearshore and decreased offshore, and the change value was within 0.05 kg/m3. During neap tide, the change in suspended sediment concentration was smaller than that during spring tide, and was most obvious in the MUA. The concentration of suspended sediment in CPA of oyster reefs had decreased, from 0.12–0.18 kg/m3 to 0.1–0.16 kg/m3, with a maximum reduction of 0.03 kg/m3; in the southeast and southwest sides of the RRA it decreased significantly, from 0.15–0.18 kg/m3 to 0.13–0.15 kg/m3 in the southeast side, with a maximum reduction of 0.02 kg/m3; in the southwest side it decreased from 0.10–0.13 kg/m3 to 0.08–0.11 kg/m3, with a maximum reduction of 0.02 kg/m3; the remaining areas had basically no change; in the MUA it was increasing nearshore and decreasing offshore, and the variation was within 0.04 kg/m3.
3.3 Analysis of the impact of bed level
Changes in the hydrodynamic environment caused by human engineering activity inevitably led to changes in the intertidal bed level. Figures 8, 12, 13 show bed-level distribution and its variation from the model simulation. As the model does not consider the effect of natural sedimentation, the results shown in the figure can be regarded as being caused by engineering alone. As shown in Figures 8 and 12, human engineering activity did not change the overall trend of siltation pattern in oyster reefs, but the local siltation pattern in the CPA and RRA changed significantly, and the rate of bed-level change in the reef areas varied from −0.20 m/a to 0.40 m/a.
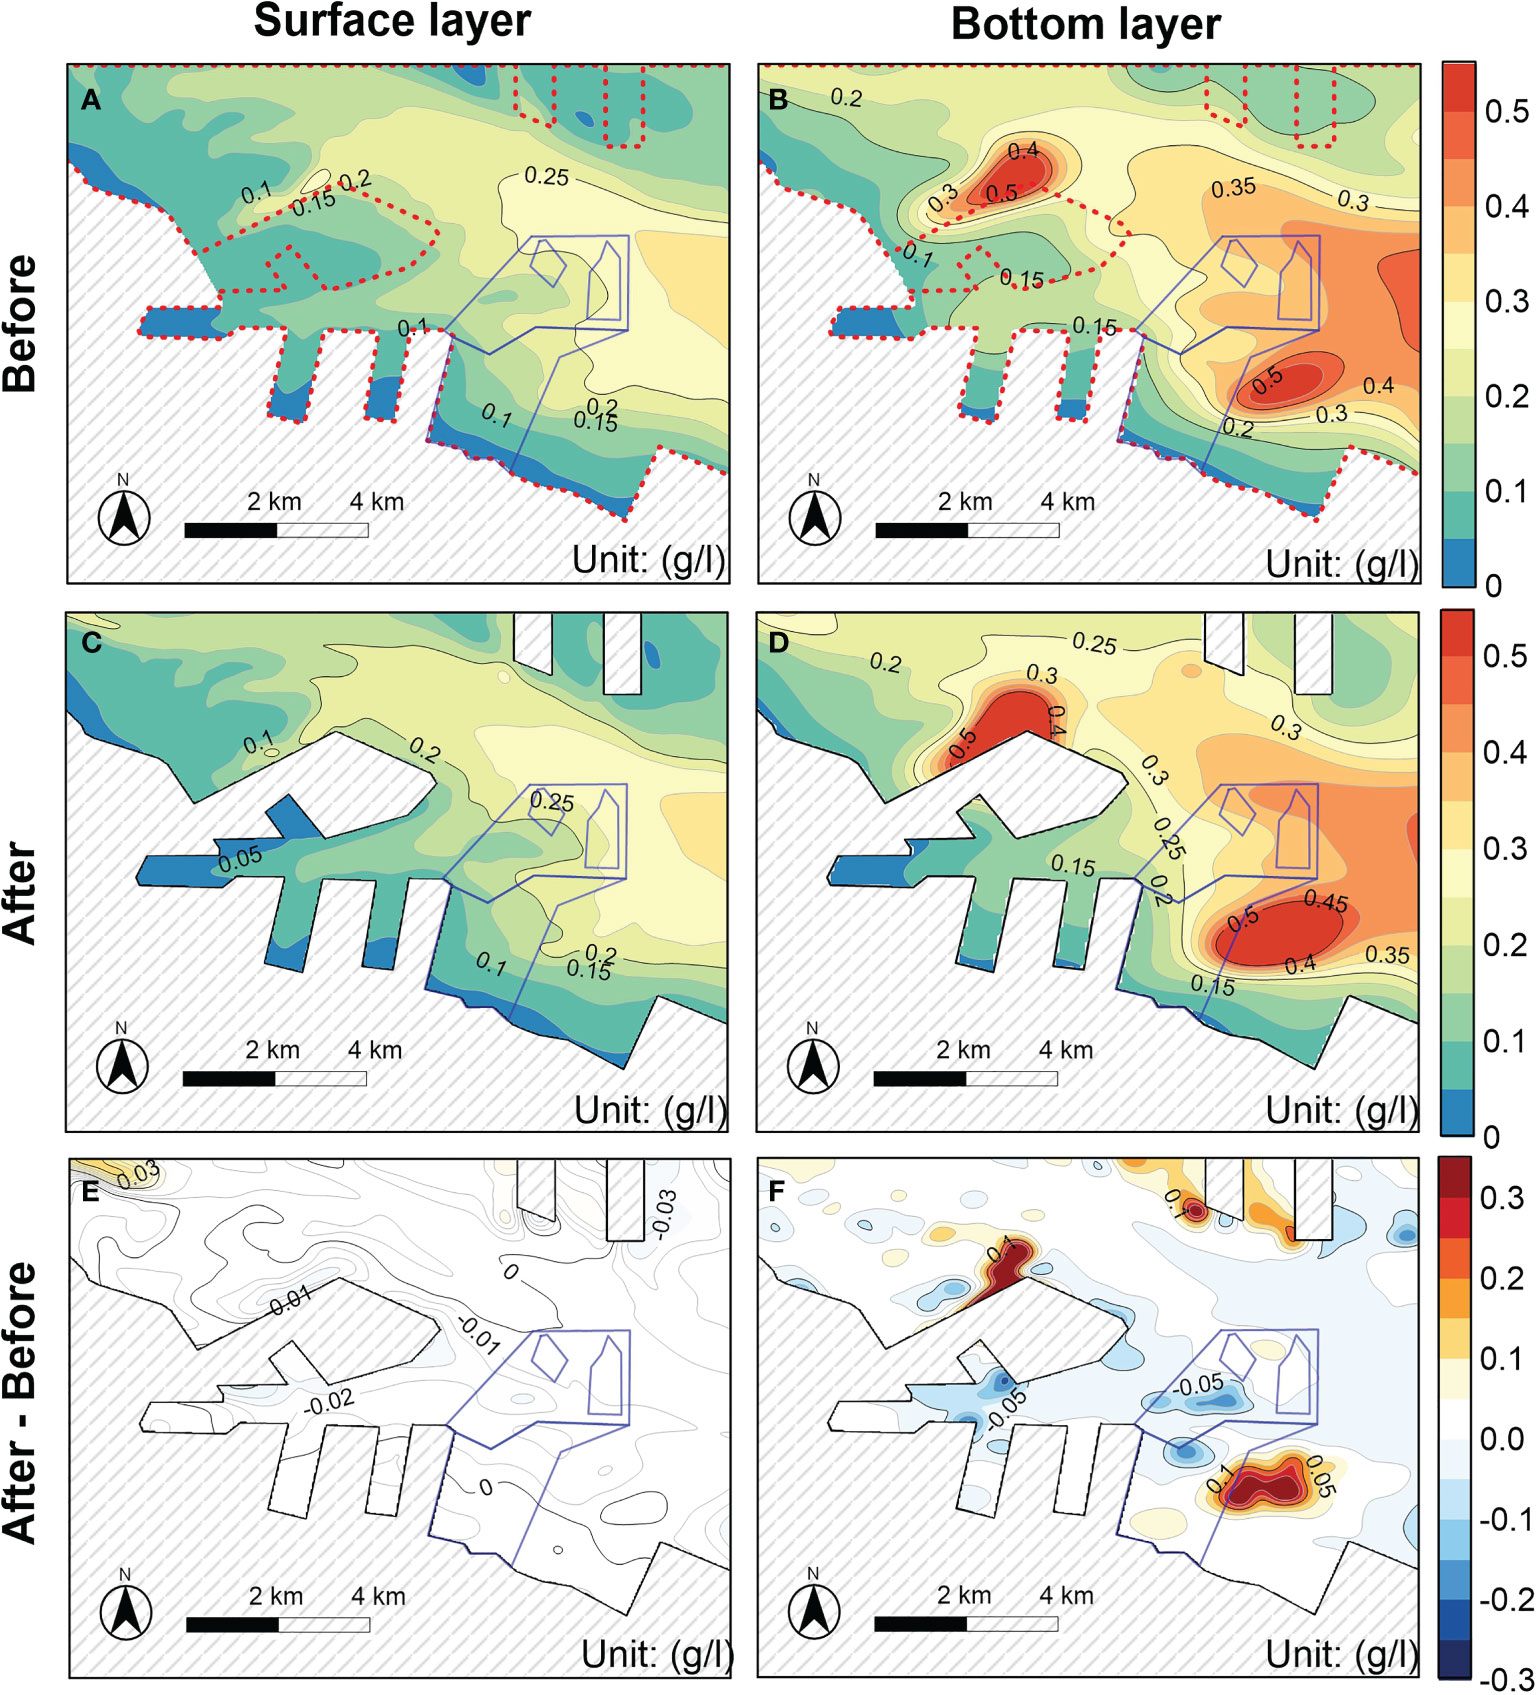
Figure 11 Comparison of surface and bottom sediment concentrations before and after human engineering activity. The locations of oyster reefs and their subdivisions are marked on the figures with solid blue lines. (A) Surface and (B) bottom sediment concentration distribution during the flood tide of spring tide before construction of the project. (C) Surface and (D) bottom sediment concentration distribution during the flood tide of spring tide after construction of the project. Difference in (E) surface and (F) bottom sediment concentration distribution during the flood tide of spring tide before and after construction (sediment concentration before construction minus sediment concentration after construction).
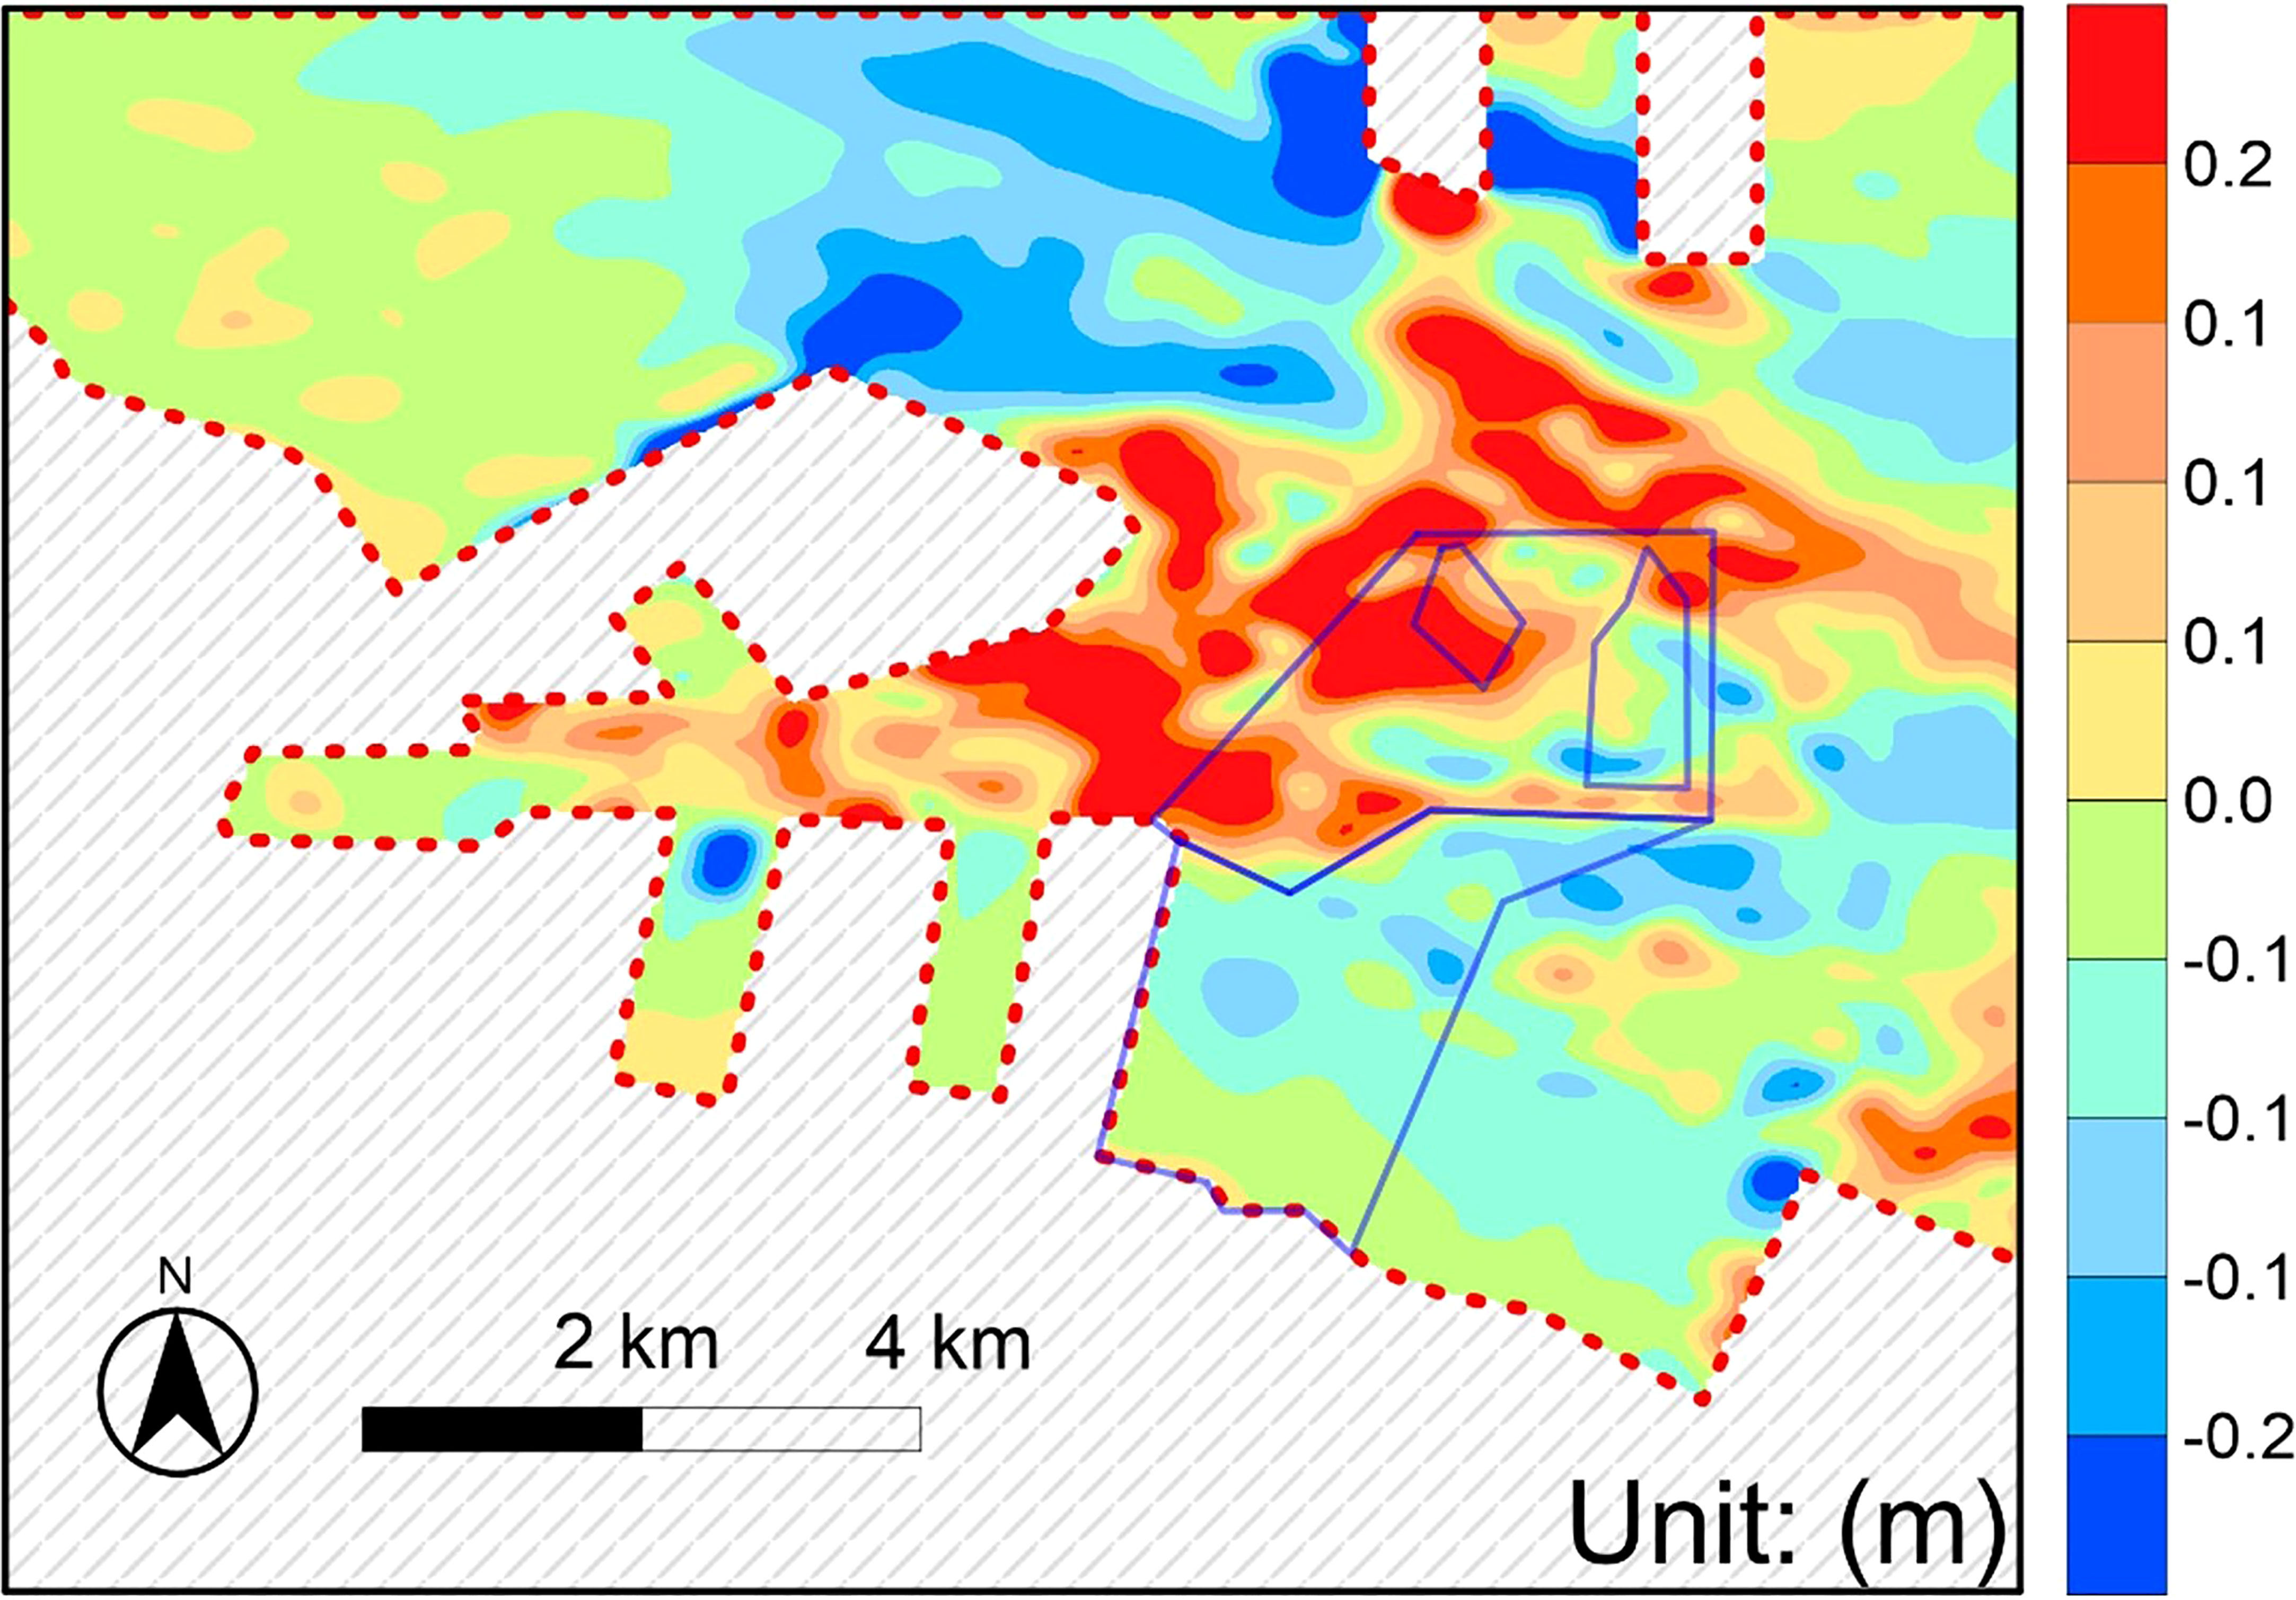
Figure 12 Difference in the distribution of bed-level change in oyster reef waters before (2014) and after (2019) human engineering activity. The locations of oyster reefs and their subdivisions are marked on the figures with solid blue lines. .
Figure 13 shows the annual variation in bed-level change intensity at characteristic points before and after human engineering activity, where 2014 and 2015–2019 show the bed-level change before and after human engineering activity. From Figures 8, 12, 13, it can be seen that after human engineering activity, the siltation in CPA1 is clearly enhanced, from the combination of scouring and siltation to overall siltation, and annual siltation increased to 0.03–0.15 m, with a maximum increase value of 0.3 m, and then decreased annually, and tended to balance scouring and siltation. At the northeast corner of CPA2, annual bed-level change was altered from scouring to siltation, and maximum annual siltation was 0.2 m, with an average increase of 0.2 m, while the siltation in the rest of the area was weakened, with a maximum decrease of 0.15 m. The central local area favored scouring and maximum annual scouring volume was 0.1 m, the siltation on the south side had weakened, however, maximum annual siltation volume still maintained around 0.3 m annually. The overall siltation in the RRA was enhanced, and the area near the inlet channel of Dongzao Port changed from scouring to siltation, average annual siltation was 0.1 m, the rest of the area was slightly weakened, the deep trough on the south side of the boundary still maintained the trend of scouring, and the RRA tended towards slight scouring or slight siltation with the evolution. The MUA still maintained overall siltation, however, annual siltation volume generally decreased by about 0.05 m, and siltation intensity gradually decreased as the evolution proceeded, and finally, annual siltation volume stabilized at approximately 0.07 m.
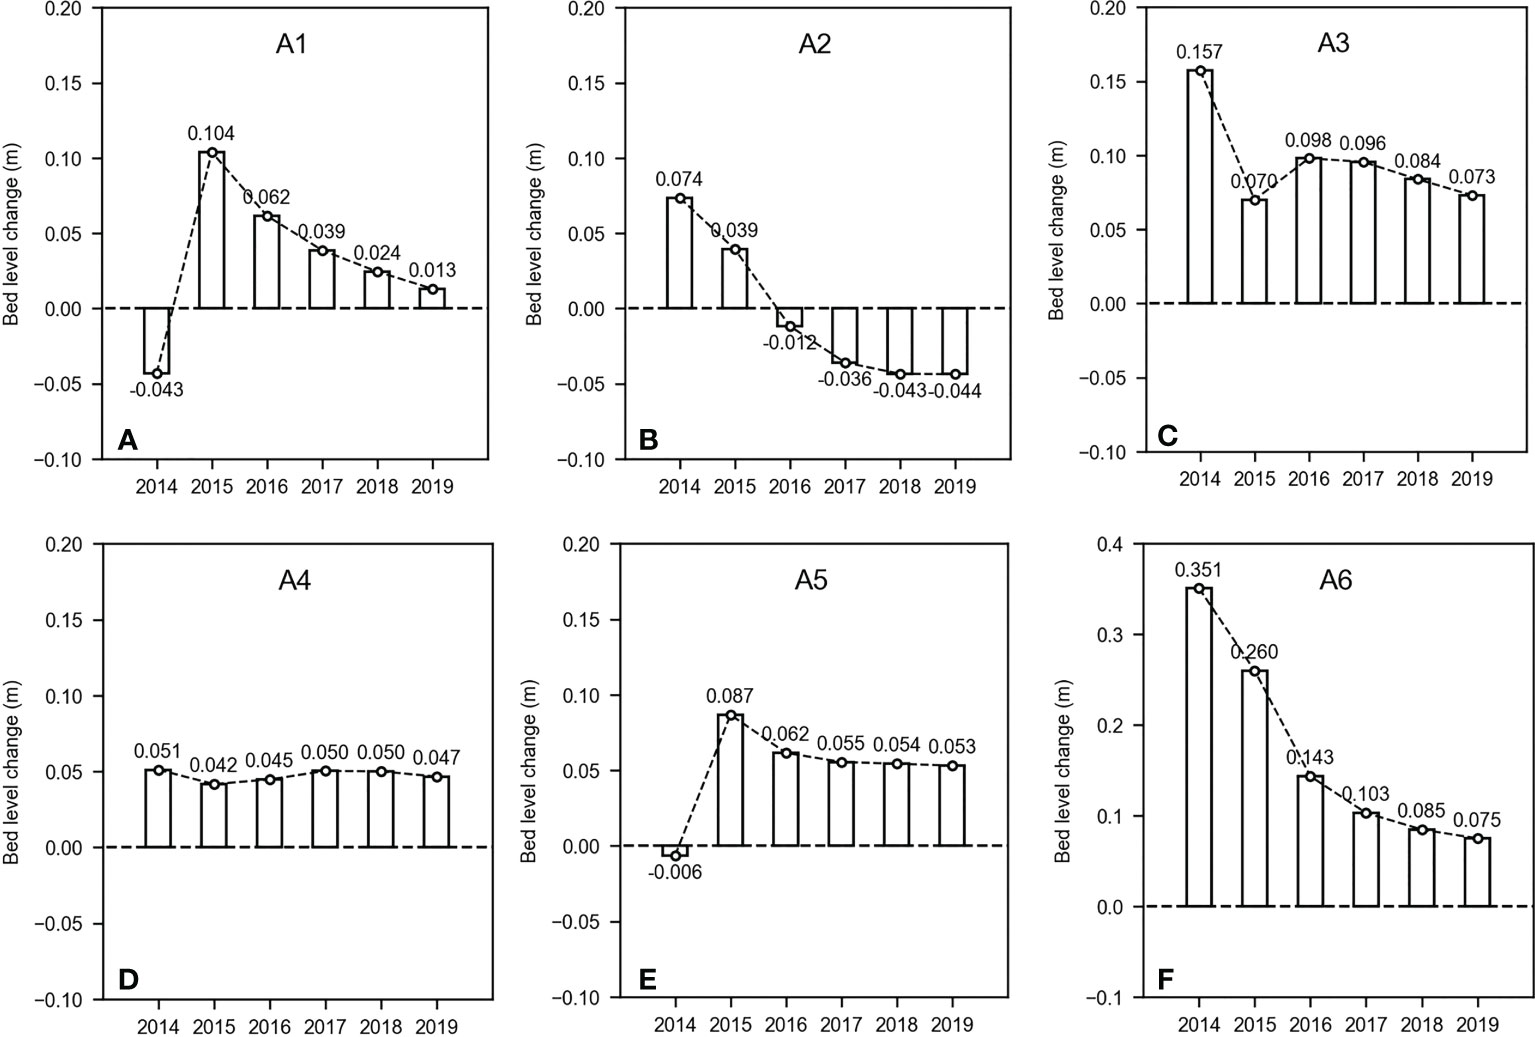
Figure 13 Annual variation of bed-level change intensity at characteristic points before and after human engineering activity. (A–F) Characteristic points A1 to A6.
4 Discussion
4.1 Analysis of the impact of human engineering activity on oyster reefs
Human engineering activity affects the growth of oysters and thus the growth of reefs indirectly by changing the flow velocity and suspended sediment concentration in the water column on the one hand, and directly affects the evolution of reefs by changing the bed level on the other hand.
4.1.1 Flow velocity stress
Both excessively fast and turbulent flow velocities are detrimental to oyster attachment growth. According to related specifications, flow velocity during the oyster breeding period should be no more than 0.6 m/s, so the evaluation standard for flow velocity is 0.6 m/s. Human engineering activity did not change the logarithmic distribution law of the vertical flow velocity. During spring tide, the flow velocity was high and exceeded 0.6 m/s in some areas, which was conducive to oyster attachment and reproduction due to the decrease in flow velocity caused by human engineering activity. In the rest of the area, the flow velocity was low, and the decrease in flow velocity had no effect on oyster growth. During neap tide, the flow velocity was below 0.6 m/s, and the decrease in flow velocity had no effect on the growth of oysters. In general, changes in the hydrodynamic conditions of the Liyashan Oyster Reef waters caused by human engineering activity would not have a significant effect on oyster reef development.
4.1.2 Suspended sediment stress
The survival rate of oysters was not affected by low concentrations of suspended sediments. However, when concentration of suspended sediment exceeds 0.5 kg/m3, the growth of Kumamoto Oysters, which is the dominant species, will be inhibited, so 0.5 kg/m3 is used as the evaluation standard of suspended sediment concentration. When the concentration of suspended sediment is greater than 0.5 kg/m3, the increase will harm oyster development; however, when the concentration of suspended sediment is less than 0.5 kg/m3, the effect of suspended sediment concentration on oysters can be ignored.
After human engineering activity, the bottom suspended sediment concentration in the reef areas showed regional changes. The suspended sediment concentration on the nearshore side of the MUA increased locally, while in other areas it generally decreased. The bottom suspended sediment concentration remained below 0.5 kg/m3, and the change in suspended sediment concentration under such a concentration range would not affect the growth of oysters. Therefore, changes in the bottom suspended sediment concentration caused by human engineering activity would not have significant effect on the growth of oysters and the development of reefs in the Liyashan Oyster Reef waters.
4.1.3 Impact of bed-level change
Sediment deposition is the most important cause of oyster reef degradation in the Liyashan Oyster Reefs. Sediment covering the surface of the reefs directly leads to oyster suffocation or even death, resulting in a reduction in the reef area.
After human engineering activity, the siltation of CPA1 was enhanced, the northeast corner of CPA2 changed from scouring to siltation, scouring of the central area was enhanced, and siltation of the southern area was weakened; however, the intensity of siltation remained at a high level. The CPA is the most densely populated area for oysters. The enhanced siltation in CPA1 led to an increased risk of degradation of oyster reefs covered by sediment, whereas scouring in the central area of CPA 2 was slightly enhanced, and the intensity of siltation on the south side decreased, which was favorable for reef growth and development. However, the high intensity of sediment deposition on the southern side of the reefs should not be neglected. The RRA changed from a combination of scouring and siltation, to siltation, and the risk of degradation of oyster reefs on the side of the inlet channel of Dongzao Port greatly increased. The scouring intensity at the northeast corner near Xiaomiaohong Channel weakened but remained at a high value, and the reefs were still in danger of receding from erosion. The overall siltation in the RRA was enhanced, and human engineering activity was generally more detrimental than beneficial to reefs in the area. However, siltation intensity of the MUA decreased less after human engineering activity, and the reefs in this area were sparsely distributed; therefore, human engineering activity would have no effect on oyster reefs in this area. In general, the impact of human engineering activity on bed-level in the Liyashan Oyster Reef waters was significant, especially in CPA.
4.2 Application of the model to oyster reefs conservation
In this study, a hydrodynamic model was constructed using MIKE3 (Figure 4), which was validated by tide level, flow velocity, flow direction, and suspended sediment concentration (Figures 5–7, Supplementary Figures 1–3). The difference between the measured data and the model-simulated data is slight, which shows that the model meets the accuracy requirements for simulating nearshore hydrodynamic conditions, especially the waters around the Liyashan Oyster Reefs. Previous studies using hydrodynamic models have tended to analyze the effects of individual factors, such as salinity, on oyster reefs (Wang et al., 2008; Kaplan et al., 2016); however, a comprehensive quantification of the various influences is lacking. Results of the model simulation include the changes in flow velocity (Figure 11), suspended sediment concentration (Figure 11), and bed level (Figures 8–11), as well as the changes in flow velocity (Figure 10) and bed level (Figure 13) at characteristic points in the oyster reef waters before and after construction. Results of the model simulations provide intuitive data and, with strict test criteria, a comprehensive analysis of the impact of human engineering activity on oyster reefs.
The unique advantage of applying hydrodynamic modeling to oyster reef conservation lies in its generalizability and quantification. In response to different events, such as coastal engineering mentioned in this study, sea level rise, storm surge, etc., the dominant factors affecting oyster reefs can change or even produce completely different factors. Fortunately, the model can adapt to varying research needs, study scales (both temporal and spatial), and analyze quantitative simulation results to obtain reliable conclusions for assessing the future state of oyster reef development. If an engineering project has a considerable adverse impact on oyster reefs, it is necessary to reconsider the site and scale of the project to reduce damage. The model can also simulate the expected effects of various oyster reef protection projects and simultaneously consider environmental protection and resource conservation to select the best engineering strategy, which is conducive to the long-term protection of oyster reefs.
In this study, the developed model considers several main influencing factors determined by engineering, as shown in Figure 1. Undeniably, if we want to fully analyze the impact on oyster reefs, we also need to consider the changes in temperature, salinity, chlorophyll, dissolved nutrients, dissolved oxygen, heavy metal pollutant concentrations, etc. of the waters (Hoellein et al., 2014). However, too comprehensive a consideration can greatly increase the difficulty of modeling and discussion because of complex interaction between the various factors. Therefore, for different research subjects, we believe that it is necessary to properly select the important influencing factors before modeling, which is beneficial for completing the study in a cost-effective way.
4.3 Overall results and suggestions for restoration
In conclusion, changes in the hydrodynamics of oyster reef waters due to human engineering activity would not affect the development of oyster reefs, but changes in the distribution of bed level would cause some stress to the local reef body. The risk of degradation of oyster reefs by sediment cover increased with enhanced siltation in CPA1 and most of RRA. The overall siltation in CPA2 was weakened; however, the southern reef was still stressed by high-intensity sediment deposition. The northeast side of the RRA was weakened by scouring but still at risk of erosion and degradation, and the MUA was unaffected by human engineering activity due to the sparse distribution of reefs and weakened siltation.
Most areas of oyster reefs are currently under duress of sediment deposition and some areas are severely scoured; therefore, the oyster population would be in decline, so the following suggestions are made.
(1) Replenishment of oyster populations
Oyster reef development is directly related to the number of oyster populations. To maintain the development of oyster reefs, it is recommended to place adult oysters of local species or larvae on the surface of the reef at neap tide to enhance the replenishment of oyster resources and maintain them at the level of the self-sustaining population.
(2) Oyster reef dredging and restoration
The areas south of CPA1 and CPA2 were seriously silted. Experimental dredging measures are suggested to expose the reef beach surface with a certain vertical structure, which is conducive to the attachment and growth of oyster larvae, and allow the reef to recover naturally.
(3) Protective restoration of eroded oyster reefs
The northeast corner of the RRA was seriously eroded by tidal waves. It is suggested that a large concrete ecological protective oyster reef be placed in front of the reef (seaward side) to protect the natural oyster reef, on the one hand, and increase the oyster attachment area on the other.
5 Conclusion
In this study, a three-dimensional hydrodynamic model of the southern part of the Yellow Sea around oyster reefs was established using MIKE3 numerical simulation software. After the accuracy of the model was verified, we quantitatively analyzed the impact of human engineering activity on the hydrodynamics and the sediment dynamic of the Liyashan oyster reef waters, and then discussed the contribution of this study to ecological protection. The following conclusions were obtained.
Human engineering activity has effectively changed the water environment of the Liyashan Oyster Reefs. First, the water flow pattern was stable after the completion of engineering; however, the overall flow velocity decreased. While surface concentrations of suspended sediment remained basically unaffected and concentrations of suspended sediment remained stable at the bottom of CPA, there was a slight variation in concentrations of suspended sediment in other areas, ranging from −0.2 to 0.1 kg/m3 during spring tides. This indicates that the impact on the hydrodynamic environment is relatively minor and does not necessitate serious warning indicators. Secondly, CPA and RRA show obvious siltation trends after engineering, while MUA shows a slight scouring trend, and the annual variation of bed level in the oyster reef waters ranges from 0.2 to 0.35 m. This indicates that the bed level in priority protection areas is increasing, which is harmful for oyster reef development.
The changes in hydrodynamic and bed levels were regional. In particular, we must pay sufficient attention to the siltation of CPA and RRA by organizing regional measures to reduce silt and avoid oyster reef cover degradation. Some of the measures mentioned in this study may be applied to protect oyster reefs. Moreover, hydrodynamic modeling requires attention for oyster reef conservation. As the model has universal applicability and quantification ability, it can be adapted to a wide range of scenarios to obtain reliable conclusions to assess the impact of human engineering activity and finally facilitate the adoption of optimal engineering and environmental protection measures.
Data availability statement
The original contributions presented in the study are included in the article/Supplementary Material. Further inquiries can be directed to the corresponding authors.
Author contributions
FL: Conceptualization, Methodology, Validation, Supervision. ZC: Methodology, Software, Writing - Review & Editing. HW: Data Curation, Writing - Original Draft. FZ: Formal analysis, Investigation. JZ: Visualization. WQ: Writing - Review & Editing. All authors contributed to the article and approved the submitted version.
Funding
This study is supported by the Marine Science and Technology Innovation Project of Jiangsu Province (Grant No. JSZRHYKJ202105), the National Key Research and Development Program of China (Grant No. 2020YFD0900703), the National Natural Science Foundation of China (Grant 51909100), and the Nantong Science and Technology Bureau (Grant No. MS12022009, No. MS22022082, No. MS22022083).
Conflict of interest
The authors declare that the research was conducted in the absence of any commercial or financial relationships that could be construed as a potential conflict of interest.
Publisher’s note
All claims expressed in this article are solely those of the authors and do not necessarily represent those of their affiliated organizations, or those of the publisher, the editors and the reviewers. Any product that may be evaluated in this article, or claim that may be made by its manufacturer, is not guaranteed or endorsed by the publisher.
Supplementary material
The Supplementary Material for this article can be found online at: https://www.frontiersin.org/articles/10.3389/fmars.2022.1051868/full#supplementary-material
References
Airoldi L., Beck M. W. (2007). “Loss, status and trends for coastal marine habitats of Europe,” in Oceanography and marine biology, vol. 45 . Eds. Gibson R. N., Atkinson R. J. A., Gordon J. D. M. (Boca Raton: Crc Press-Taylor & Francis Group), 345–405.
Alleway H. K., Connell S. D. (2015). Loss of an ecological baseline through the eradication of oyster reefs from coastal ecosystems and human memory. Conserv. Biol. 29, 795–804. doi: 10.1111/cobi.12452
Beck M. W., Brumbaugh R. D., Airoldi L., Carranza A., Coen L. D., Crawford C., et al. (2011). Oyster reefs at risk and recommendations for conservation, restoration, and management. BioScience 61, 107–116. doi: 10.1525/bio.2011.61.2.5
Beisel J.-N., Usseglio-Polatera P., Thomas S., Moreteau J.-C. (1998). Stream community structure in relation to spatial variation: the influence of mesohabitat characteristics 16. Hydrobiol. 389, 73–88. doi: 10.1023/A:1003519429979
Chakraborty P. (2017). Oyster reef restoration in controlling coastal pollution around India: A viewpoint. Mar. pollut. Bull. 115, 190–193. doi: 10.1016/j.marpolbul.2016.11.059
Coen L., Brumbaugh R., Bushek D., Grizzle R., Luckenbach M., Posey M., et al. (2007). Ecosystem services related to oyster restoration. Mar. Ecol. Prog. Ser. 341, 303–307. doi: 10.3354/meps341303
Colden A. M., Lipcius R. N. (2015). Lethal and sublethal effects of sediment burial on the eastern oyster crassostrea virginica. Mar. Ecol. Prog. Ser. 527, 105–117. doi: 10.3354/meps11244
Comeau L. A. (2014). Spring awakening temperature and survival of sediment-covered eastern oysters crassostrea virginica. Aquaculture 430, 188–194. doi: 10.1016/j.aquaculture.2014.04.009
Dame R. F., Zingmark R. G., Haskin E. (2006). Oyster reefs as processors of estuarine materials. J. Exp. Mar. Biol. Ecol. 83, 239–247. doi: 10.1016/S0022-0981(84)80003-9
DHI (2012). MIKE 3 flow model user guide and scientific documentation (Hørsholm, Denmark: Danish Hydraulic Institute).
DHI (2014). MIKE21 & MIKE 3 flow model FM mud transport module scientific documentation (Hørsholm, Denmark: Danish Hydraulic Institute).
Edge K. J., Dafforn K. A., Simpson S. L., Ringwood A. H., Johnston E. L. (2015). Resuspended contaminated sediments cause sublethal stress to oysters: A biomarker differentiates total suspended solids and contaminant effects: Resuspended contaminated sediment effects. Environ. Toxicol. Chem. 34, 1345–1353. doi: 10.1002/etc.2929
Gangnery A., Chabirand J.-M., Lagarde F., Le Gall P., Oheix J., Bacher C., et al. (2003). Growth model of the pacific oyster, crassostrea gigas, cultured in thau lagoon (Méditerranée, France). Aquaculture 215, 267–290. doi: 10.1016/S0044-8486(02)00351-4
Grabowski J. H., Peterson C. H. (2007). Restoring oyster reefs to recover ecosystem services. Ecosyst. Eng. Plants Protists 4, 281–298. doi: 10.1016/S1875-306X(07)80017-7
Hart D. D., Finelli C. M. (1999). Physical-biological coupling in streams: The pervasive effects of flow on benthic organisms. Annu. Rev. Ecol. Syst. 30, 363–395. doi: 10.1146/annurev.ecolsys.30.1.363
Heath M. R. (2008). Comment on “A global map of human impact on marine ecosystems.” Science 321, 1446–1446. doi: 10.1126/science.1157390
Hoellein T. J., Zarnoch C. B., Grizzle R. E. (2014). Eastern Oyster (Crassostrea virginica) filtration, biodeposition, and sediment nitrogen cycling at two oyster reefs with contrasting water quality in great bay estuary (New Hampshire, USA). Biogeochemistry 122, 113–129. doi: 10.1007/s10533-014-0034-7
Jackson J. B. C., Kirby M. X., Berger W. H., Bjorndal K. A., Botsford L. W., Bourque B. J., et al. (2001). Historical overfishing and the recent collapse of coastal ecosystems. Science 293, 629–637. doi: 10.1126/science.1059199
Kaplan D. A., Olabarrieta M., Frederick P., Valle-Levinson A. (2016). Freshwater detention by oyster reefs: Quantifying a keystone ecosystem service. PLoS One 11, e0167694. doi: 10.1371/journal.pone.0167694
La Peyre M. K., Bernasconi S. K., Lavaud R., Casas S. M., La Peyre J. F. (2020). Eastern Oyster clearance and respiration rates in response to acute and chronic exposure to suspended sediment loads. J. Sea Res. 157, 101831. doi: 10.1016/j.seares.2019.101831
Lenihan H. S., Peterson C. H., Allen J. M. (1996). Does flow speed also have a direct effect on growth of active suspension-feeders: An experimental test on oysters. Limnol. Oceanogr. 41, 1359–1366. doi: 10.4319/lo.1996.41.6.1359
Lin H., Yu Q., Du Z., Fan Y., Wang Y., Gao S. (2021). Geomorphology and sediment dynamics of the liyashan oyster reefs, jiangsu coast, China. Acta Oceanol. Sin. 40, 118–128. doi: 10.1007/s13131-021-1866-3
Li Y., Shen A. (2013). Damage and recovery in the kumamoto oyster crassostrea sikamea stressed by suspended solids: Damage and recovery in the kumamoto oyster crassostrea sikamea stressed by suspended solids. J. Fish. Sci. China 19, 138–144. doi: 10.3724/SP.J.1118.2012.00138
Morris R. L., Konlechner T. M., Ghisalberti M., Swearer S. E. (2018). From grey to green: Efficacy of eco-engineering solutions for nature-based coastal defence. Glob. Change Biol. 24, 1827–1842. doi: 10.1111/gcb.14063
Nelson K. A., Leonard L. A., Posey M. H., Alphin T. D., Mallin M. A. (2004). Using transplanted oyster (Crassostrea virginica) beds to improve water quality in small tidal creeks: a pilot study. J. Exp. Mar. Biol. Ecol. Anthropogenic Influences Ecol. Tidal Creeks Canals 298, 347–368. doi: 10.1016/S0022-0981(03)00367-8
Newell R. I. (2004). Ecosystem influences of natural and cultivated populations of suspension-feeding bivalve molluscs: a review. J. Shellfish Res. 23, 51–62.
Pan Y., Yin S., Chen Y. P., Yang Y. B., Xu C. Y., Xu Z. S. (2022). An experimental study on the evolution of a submerged berm under the effects of regular waves in low-energy conditions. Coast. Eng. 176, 104169. doi: 10.1016/j.coastaleng.2022.104169
Peterson C. H., Grabowski J. H., Powers S. P. (2003). Estimated enhancement of fish production resulting from restoring oyster reef habitat: quantitative valuation. Mar. Ecol. Prog. Ser. 264, 249–264. doi: 10.3354/meps264249
Quan W., Zhou W., Ma C., Feng M., Zhou Z., Tang F., et al. (2016). Ecological status of a natural intertidal oyster reef in haimen county. Acta Eeologica Sin. 36, 7749–7757.
Richardson M. A., Zhang Y., Connolly R. M., Gillies C. L., McDougall C. (2022). Some like it hot: The ecology, ecosystem benefits and restoration potential of oyster reefs in tropical waters. Front. Mar. Sci. 9. doi: 10.3389/fmars.2022.873768
Rockström J., Steffen W., Noone K., Persson Å., Chapin F. S., Lambin E. F., et al. (2009). A safe operating space for humanity. Nature 461, 472–475. doi: 10.1038/461472a
Rodney W. S., Paynter K. T. (2006). Comparisons of macrofaunal assemblages on restored and non-restored oyster reefs in mesohaline regions of Chesapeake bay in Maryland. J. Exp. Mar. Biol. Ecol. 335, 39–51. doi: 10.1016/j.jembe.2006.02.017
Rothschild B. J., Ault J. S., Goulletquer P., Héral M. (1994). Decline of the Chesapeake bay oyster population: a century of habitat destruction and overfishing. Mar. Ecol. Prog. Ser., 111:29–39. doi: 10.3354/meps111029
Scyphers S. B., Powers S. P., Heck K. L., Byron D. (2011). Oyster reefs as natural breakwaters mitigate shoreline loss and facilitate fisheries. PLoS One 6, e22396. doi: 10.1371/journal.pone.0022396
Smaal A. C., Ferreira J. G., Grant J., Petersen J. K., Strand Ø. (Eds.) (2019). Goods and services of marine bivalves (Cham: Springer International Publishing). doi: 10.1007/978-3-319-96776-9
Soletchnik P., Ropert M., Mazurié J., Gildas Fleury P., Le Coz F. (2007). Relationships between oyster mortality patterns and environmental data from monitoring databases along the coasts of France. Aquaculture 271, 384–400. doi: 10.1016/j.aquaculture.2007.02.049
Thomsen M. S., McGlathery K. (2006). Effects of accumulations of sediments and drift algae on recruitment of sessile organisms associated with oyster reefs. J. Exp. Mar. Biol. Ecol. 328, 22–34. doi: 10.1016/j.jembe.2005.06.016
Volety A. K., Savarese M., Hoye B., Loh A. N. (2009). Landscape pattern: present and past distribution of oysters in south Florida coastal complex (Whitewater Bay/Oyster Bay/Shark to robert’s rivers) (Fort Myers: Fla. Gulf Coast Univ).
Wall L. M., Walters L. J., Grizzle R. E., Sacks P. E. (2005). Recreational boating activity and its impact on the recruitment and survival of the oyster crassostrea virginica on intertidal reefs in mosquito lagoon, florida. J. Shellfish Res. 24, 965–973. doi: 10.2983/0730-8000(2005)24[965:RBAAII]2.0.CO;2
Wang H., Huang W., Harwell M. A., Edmiston L., Johnson E., Hsieh P., et al. (2008). Modeling oyster growth rate by coupling oyster population and hydrodynamic models for Apalachicola bay, Florida, USA. Ecol. Model. 211, 77–89. doi: 10.1016/j.ecolmodel.2007.08.018
Wang J., Zhao M., Bai S., Gong X., Zhang M., Wu Y., et al. (2009). Environmental background of oyster reef development in near-shore haimen of southern yellow Sea. Geogr. Res. 28, 1170–1178.
Wilber D., Clarke D. (2010). “Dredging activities and the potential impacts of sediment resuspension and sedimentation on oyster reefs,” in Proceedings of the Western Dredging Association Thirtieth Technical Conference. (San Juan, Puerto Rico, USA: WEDA). 61–69jmn
Keywords: oyster reefs, human activities, hydrodynamic model, sediment transport, coastal engineering, MIKE3
Citation: Luo F, Chen Z, Wu H, Zhu F, Zeng J and Quan W (2022) Hydrodynamic and sediment dynamic impact of human engineering activity on Liyashan oyster reefs, China. Front. Mar. Sci. 9:1051868. doi: 10.3389/fmars.2022.1051868
Received: 23 September 2022; Accepted: 28 October 2022;
Published: 14 November 2022.
Edited by:
Sha Lou, Tongji University, ChinaReviewed by:
Ya Ping Wang, East China Normal University, ChinaHoujie Wang, Ocean University of China, China
Copyright © 2022 Luo, Chen, Wu, Zhu, Zeng and Quan. This is an open-access article distributed under the terms of the Creative Commons Attribution License (CC BY). The use, distribution or reproduction in other forums is permitted, provided the original author(s) and the copyright owner(s) are credited and that the original publication in this journal is cited, in accordance with accepted academic practice. No use, distribution or reproduction is permitted which does not comply with these terms.
*Correspondence: Feng Luo, Zmx1b0BoaHUuZWR1LmNu; Zhipeng Chen, enBjaGVuQGhodS5lZHUuY24=