 Yunpeng Zhao
 Sida Xie
 Chao Ma
- 1State Key Laboratory of Coastal and Offshore Engineering, Dalian University of Technology, Dalian, China
- 2Ningbo Institute of Dalian University of Technology, Ningbo, China
The coastal area near islands has become a key area for aquaculture because of the long offshore distance and suitable wave conditions. There is a topographic change near the islands, and the reflected waves generated by the topography modify the wave field in the aquaculture area, which may cause structural damage to the offshore net cage. Most studies on the hydrodynamic characteristics of aquaculture structures do not consider the effects of topography. Therefore, we investigated the hydrodynamic characteristics and wave field of a multi-body floating aquaculture platform under the influence of sloping seabed by leveraging a physical model approach. The results show that the low-frequency component of the surge motion of the cage on the weather side increases significantly under the influence of sloping seabed. However, the heave and pitch motions change slightly. Considering the presence of the sloping seabed, the wave elevations inside cages have been changed too., The wave breaking inside the cage on the weather side becomes more evident when the incident wavelength is equal to the width of the cage. And its wave response gradually shifts from wave frequency to high frequency. Regarding the cage on the lee side, the wave response inside it is positively correlated with the incident wavelength. The results of this study provide a reference for the design and optimization of aquaculture structures anchored near islands.
1 Introduction
Aquaculture is a sustainable industry that secures the global food supply. In addition to traditional agriculture and animal husbandry, it is a crucial source of protein and essential trace elements for balanced nutrition and good health. According to a report by the Food and Agriculture Organization of the United Nations, by 2030, seafood demand can reach approximately 180 million tons owing to the increasing world population (FAO, 2018). Expansion of aquaculture to open oceans with larger structures is a solution to increase seafood production. However, severe environmental conditions in the open ocean pose challenges to the design of aquaculture structures. Alternatively, inshore aquaculture practices are particularly favored because the coastline and islands provide a natural shelter that avoids severe conditions. Nevertheless, the wave mechanisms affected by the complicated seabed topography in shelter water (e.g., Figures 1A, B) and the subsequent effects on aquaculture platforms have received insignificant attention. Therefore, studying the wave mechanisms and hydrodynamic performance of aquaculture platforms in sheltered environments is the aim of this study.
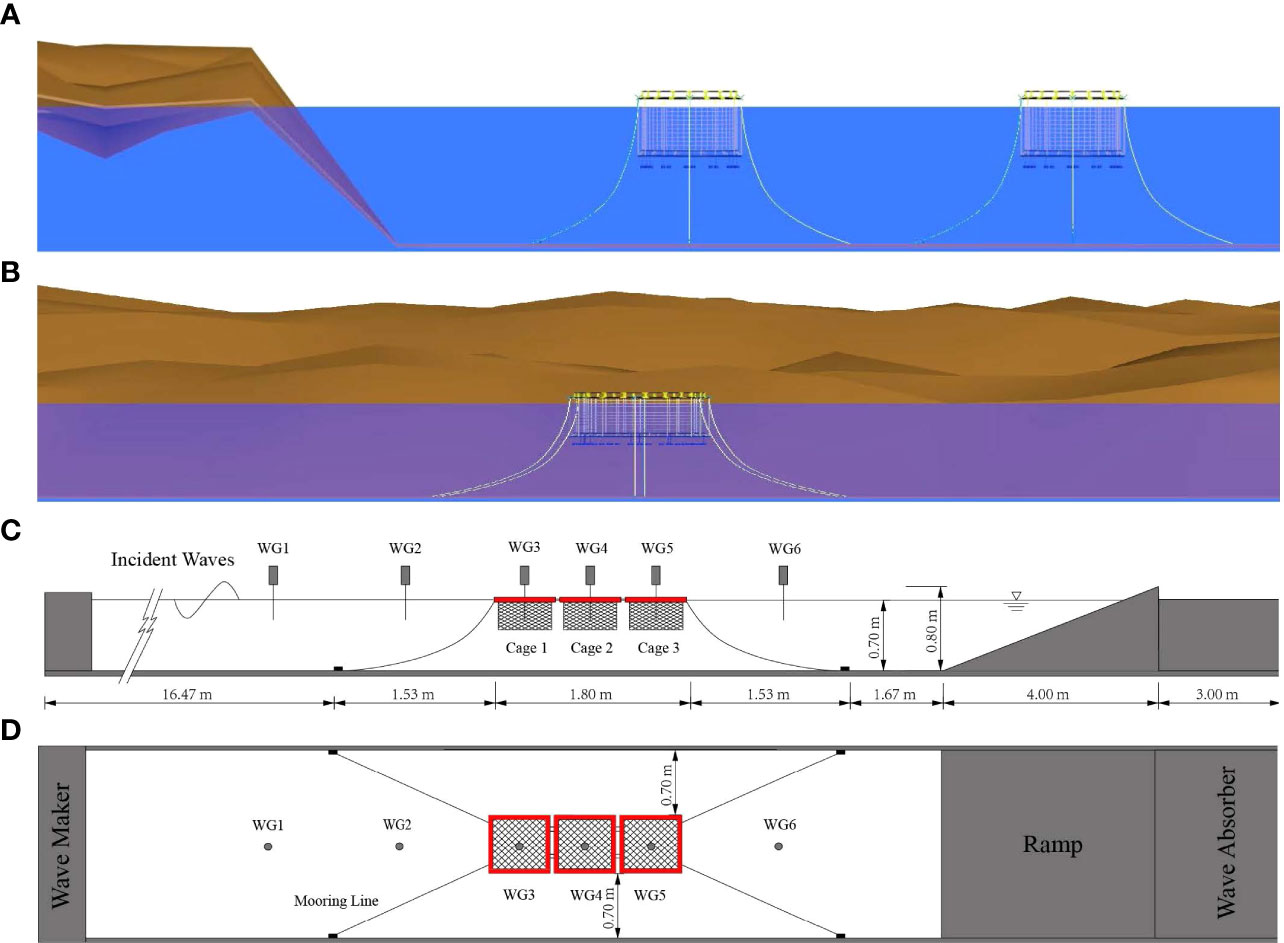
Figure 1 Net cages anchored near the island and specifications of the experimental setups: (A) perpendicular to the coastline, (B) parallel to the coastline, (C) elevation view, (D) plan view.
Previously, there was a considerable number of studies focused on hydrodynamic characteristics of aquaculture structures (Gao et al., 2020; Gao et al., 2021). Tsukrov et al. (2003) proposed a consistent net element to predict the hydrodynamic forces on aquaculture net panels. Lader and Fredheim (2006) utilized a screen model to analyze the dynamic properties of a flexible net sheet exposed to waves and currents. Gui et al. (2006) proposed a method based on the CCD image technique for analyzing the motion responses of moving objects. And the validity of the method was verified through a specific experiment. Zhao et al. (2008) used a lumped-mass model to simulate net panels under current and waves. Lee et al. (2008) established a mass–spring model to approximate a net cage. The dynamic response was calculated by solving the dynamic equilibrium equation and comparing the results with experimental results. Bi et al. (2014) proposed a numerical approach to simulate the hydrodynamic characteristics of an offshore net cage at a steady current. The numerical approach was based on the joint use of the porous-media fluid model and lumped-mass mechanical model. Chen and Christensen (2016) proposed a new approach to calculate the porous resistance coefficients based on the transformation of Morison type load model. Bi et al.(2017) analyzed the wave attenuation by a square array of biofouled net cages through numerical simulation. Bai et al. (2018) proposed a fatigue life assessment procedure for a float collar under random waves, and then analyzed the probability density function to estimate the floating system fatigue life. Qin et al. (2020) analyzed the nonlinear vertical acceleration and mooring loads of cages under extreme loads. Liu et al. (2020) applied a new method that combined the boundary element method with the Morison equation to investigate the hydrodynamic responses of a semi-submersible aquaculture facility. Knysh et al. (2021) investigated the significance of a protective barrier through physical testing, numerical simulations and field deployment. Shen et al. (2021) compared the motion responses and interior waves of closed and semi-enclosed fish cages. Yang et al. (2022) proposed a one-way fluid–structure coupling model to examine the flow interaction with pile-net structures. Regarding the cage array, Fredriksson et al. (2004) used standard chain catenary equations and equilibrium analysis to study the dynamics of a submerged, four-cage grid mooring system. Xu et al. (2012) developed a numerical model based on the lumped mass method and the principle of rigid body kinematics to investigate the hydrodynamic responses of multiple offshore net cages and mooring grid systems in regular waves. Bi et al. (2021) studied the hydrodynamic characteristics of a multi-body floating aquaculture platform and measured the horizontal stiffness of a platform’s mooring system. Ma et al. (2022a) compared the effects of floating aquaculture cages in single and tandem arrangements on the wave field. The relationship between the wavelength and wave-dissipation performance was analyzed. The impact of a changing seabed on floating bodies is an important issue to be considered. Buchner (2006); Ferreira and Newman (2009) and De Hauteclocque et al. (2009) developed second body model to describe the sloping seabed profile and found a sloping seabed significantly influenced the magnitudes of the cross coupling hydrodynamic coefficients. Kim and Kim (2013) proposed two models involving the Rankine source method and a unified method coupled to the Boussinesq equation. They found that the peak frequency of the exciting forces and motion responses shifted due to the influence of the sloping seabed. Feng and Price (2018); Feng et al. (2019) used a boundary element model to examine the influences of wave and current on the hydrodynamic responses of a floating or fixed body in the presence of a flat or sloping seabed. Yang et al. (2019) claimed that the wave statistics experienced a change when propagating and approaching the sloping seabed. Ding et al. (2020) established a direct coupling analysis method based on the Boussinesq equation and Rankine source method to investigate the wave propagation near the island. Furthermore, the motions and connector load of a very large floating structure (VLFS) deployed on a typical island were examined. When the water depth was assumed to be constant by ignoring the influence of seabed topography, the load of connectors between modules was underestimated (Yang et al, 2019). Feng et al. (2017); Feng et al. (2021) adopted a continuous Rankine source method to investigate two-dimensional or three-dimensional water wave problems in an environment with a flat or sloping rigid seabed. To study the effect of the complicated seabed topography on the performance of aquaculture cages, we conduct physical model experiments in a wave flume. A ramp is used to simplify the sloping seabed. Subsequently, the influence of the ramp on the structural hydrodynamic and wave field characteristics is investigated. The dynamic response, mooring force, and wave performance under different wave conditions are analyzed.
The remainder of this paper is organized as follows. We first report the laboratory experiments, including the physical model, experimental setup, test conditions, and data processing in Section 2. The dependence of the dynamic response and mooring loads of the weather-side cage on the wave steepness and wavelength is analyzed in Section 3. The wave elevations inside different cages are also considered. Thereafter, the hydrodynamic characteristics and free surface effect of the cage are analyzed in the frequency domain using a fast Fourier transform (FFT). Finally, the conclusions of this study are presented in Section 4.
2 Experiment
Selecting an appropriate model scale and the environmental loads to minimize the influence of the flume walls on the measurements is vitally important. Three major factors that affect the scale selection should be considered: (1) model characteristics; (2) wave/tow basin dimensions; and (3) wave generation (Qin et al., 2020).
Physical model tests of the aquaculture platform under regular waves are conducted in a wave flume at the Ningbo Institute of Dalian University of Technology, Ningbo, China. This wave flume is 30 m long, 2 m wide, and 1.2 m in height. The wave flume is equipped with a servo motor-driven piston-type wave-maker to generate regular and irregular waves. Wave absorbers are installed at the end of the flume to mitigate wave reflection.
2.1 Physical model
The multi-body floating aquaculture platform consists of three net cages connected by hinges and a mooring system. Compared with other connection methods, the hinge-connected structures can effectively eliminate the influence of the longitudinal bending moment (Ma et al., 2022b). Each cage includes a floating frame, netting, and bottom weight. The platform is moored to the bottom of the flume using four cables, as illustrated in Figures 1C, D. The physical model we utilize has a 1:60 scale, which is within the range of scales typically used in wave flumes, from 1:10 to 1:100 (Chakrabarti, 1994). Froude similarity criterion is used for the components of the physical model and wave conditions, except for the nets.
The floating frame is the primary component of a floating aquaculture cage that is subjected to environmental loads. Two floating frames are connected by hinge joints with zero rotational stiffness, which restrict the relative translational motion between the two frames, as shown in Figure 2A. Owing to the large stiffness of Plexiglas, the model is not considered to be deformed, and the elasticity of the frame is ignored in the experiment. Detailed parameters of the floating frames are listed in Table 1.
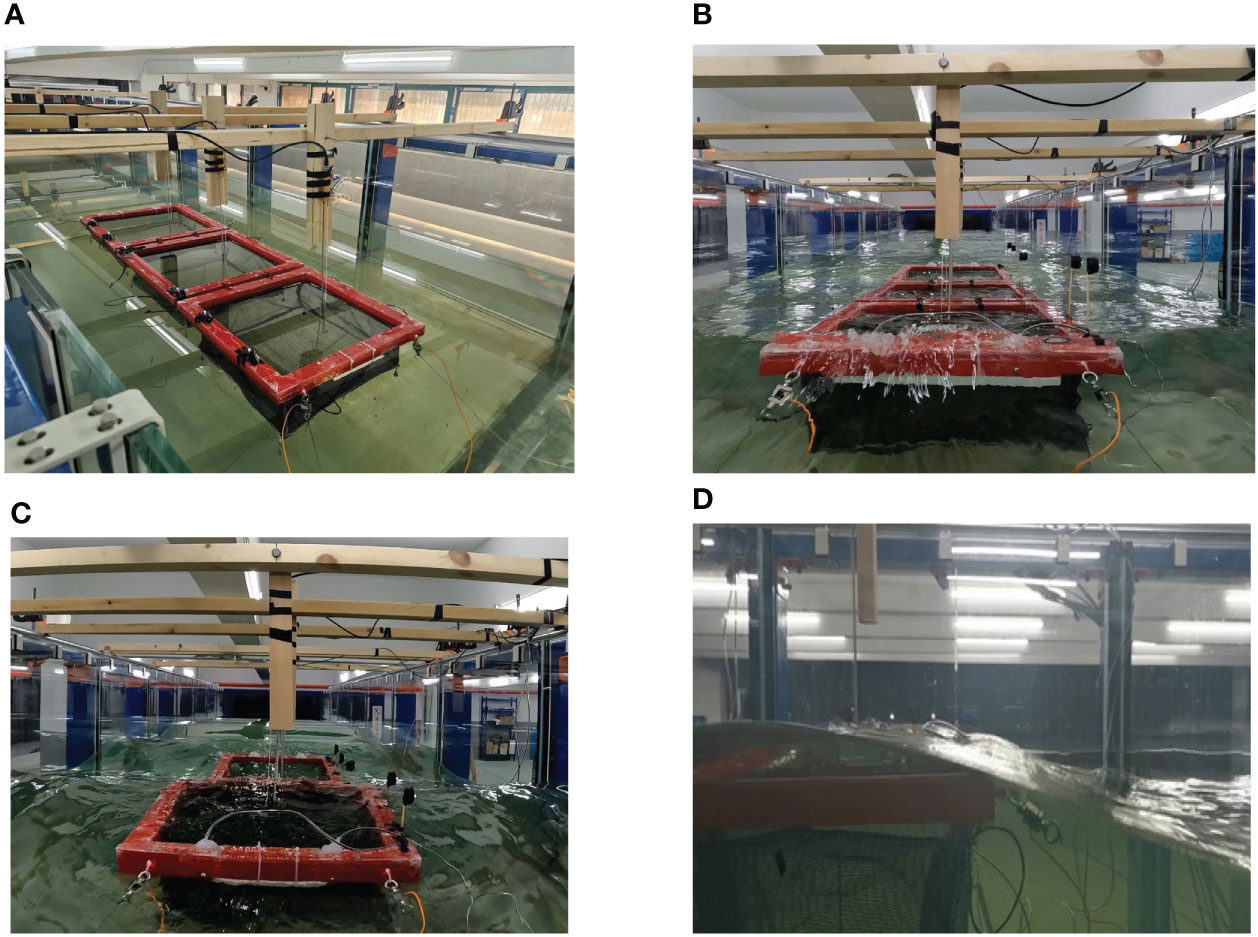
Figure 2 Physical model of the floating aquaculture platform: (A) model in the calm water, (B) wave slamming of the net cage, (C) wave reflection inside cage, (D) completely submerged net cage.
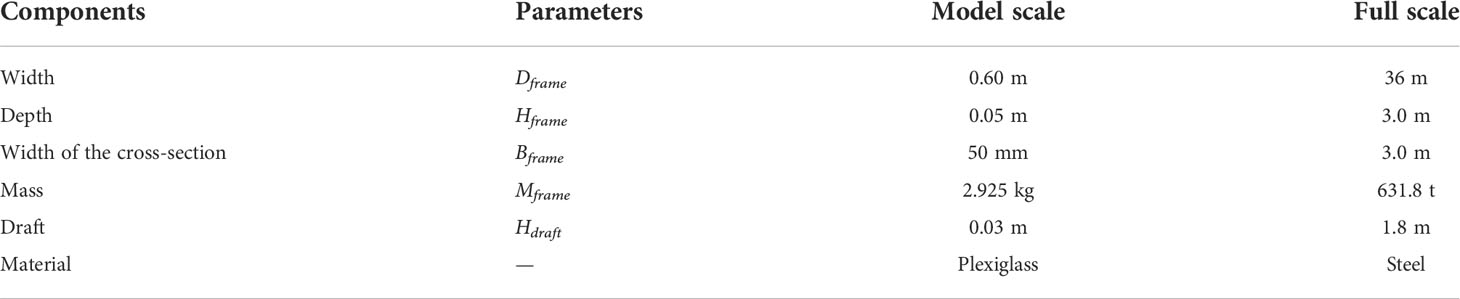
Table 1 Structural parameters of the floating frame.
In the experiment, a smaller model scale of 1/5 is adopted to determine the mesh size and twine diameter of the model owing to material limitations. If the scale of the twine diameter is the same as that of the floating frame, it would be 0.03 mm in the physical model, which is too small to be acquired. The main hydrodynamic force acting on the nets is the drag force, which is related to the projected area of the net per unit area in the normal direction of the current. In our experiment, an equivalent net is used to ensure that the equivalent and prototype nets have the same projected area. The geometric similarity criterion for the nets is satisfied provided that the ratio of mesh size to net diameter of the model nets is consistent with the ratio of mesh size to net diameter of the prototype nets (Zhao et al, 2007). The geometric similarity of the nets is defined as a1 /d1 = a2 /d2 = 5.0, where a1 and d1 are the prototype mesh size and net diameter, respectively, and a2 and d2 are model values.
Owing to the change in scale, the weight of the equivalent model net must not satisfy Froude’s similarity criterion. Therefore, the weight of the equivalent model net has to be corrected. The formula for calculating the modified mass is as follows:
where ΔW is the corrected weight of the model nets; Λ2 is the small scale of the nets that can be calculated by d1 /d2; Λ1 is the geometric scale; μ1 and μ2 are the horizontal and vertical hanging ratios, respectively; ρn is the net material density; Sn is the solidity ratio of the nets; Snet is the contour area of the model nets. The weight of the equivalent nets should be increased by 9.7 g after the calculation to meet the similarity principle. The mass of the sinker in the air of a single net cage is 228 g, which includes the weight of the equivalent nets that should be increased. The structural parameters of the nets used in this study are listed in Table 2.
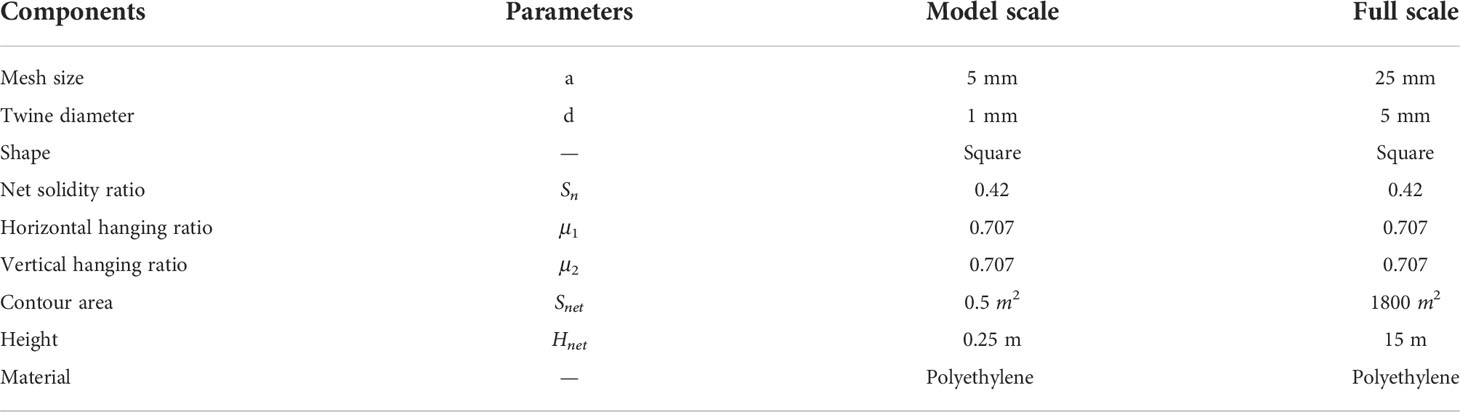
Table 2 Structural parameters of the nets.
The platform is held in place by four mooring lines that are designed based on the Froude similarity criterion. All mooring lines exhibit the same properties. And a single mooring line consists of two parts: one made of a steel chain at the bottom and the other of nylon rope at the top. Such multicomponent lines provide an optimal combination of stiffness and total weight (Journée et al., 2000). The details of the mooring system are listed in Table 3.
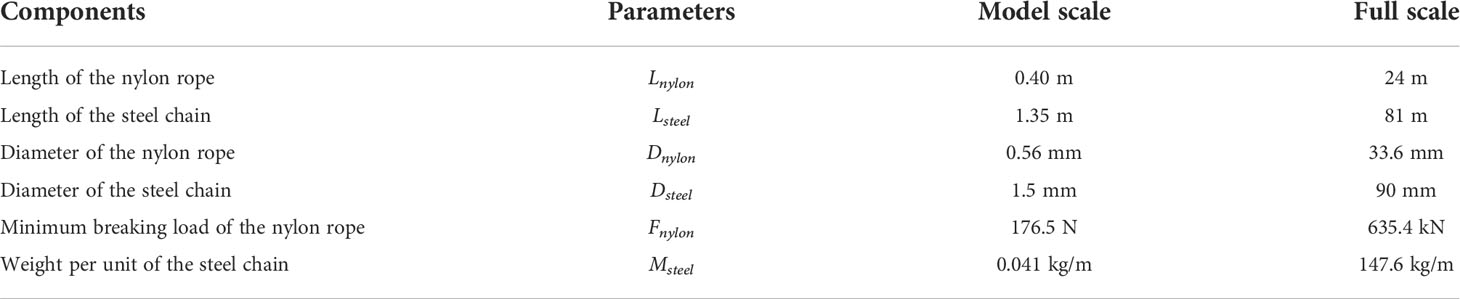
Table 3 Parameters of the mooring system.
2.2 Experimental setup
A ramp is used to simplify the depth-varying seabed, as illustrated in Figure 1. Considering the reality of the island, the vertical height of the ramp needs to be greater than the water depth to ensure that the ramp can be exposed to the water. So, we set the height of the ramp to 0.8m. But the length of the wave flume is limited, too small a slope will result in insufficient space for cage mooring. Therefore, referring to Ning’s research (Ning et al., 2022), we set the slope of the ramp to be 1/5 and the corresponding horizontal length of the ramp to be 4m. Plexiglass panels of 0.6 cm are used for the ramp surface. Before the experiment, we design a reasonable frame structure to support the Plexiglas plates and limit their deformation, which is proven to be effective. Simultaneously, five weights of 25 kg are placed at the bottom of the frame to ensure that the ramp remains stable in the flume under the effect of the wave.
The configuration of the experimental setup is shown in Figure 1. Six wave gauges (WG1, WG2, WG3, WG4, WG5, and WG6) are used to measure wave-induced variations in water surface elevation. The measurement range is 60 cm with an accuracy of ±1 mm.WG1 is used to measure the incident wave height, and is placed 10 m from the wave-making plate. WG2 and WG6 are placed 1 m away from the net cages. Other wave gauges are placed at the center of the cage. We choose a suitable position for them to avoid the cages touching the wave gauges. A sampling frequency of 100 Hz is used to record the time history of the wave height. Three CCD cameras are placed directly in front of each cage to record its motion response. The frame rate of the camera was 25. The mooring force of the cage was measured using four water-resistant load cells with a range of 50 N. A camera running at a frame rate of 60 fps and a resolution of 3840×2160 pixels was placed in front of the cage on the weather side to record the general behavior of the platform.
2.3 Test conditions
The wave field near the floating net cages is closely related to the ratio of the wavelength to the structural span. Longer wavelengths correspond to lower wave frequencies, which is more likely to cause larger surge motion and greater mooring force of the cages. (Bi et al., 2021; Ma et al., 2022a). However, considering the working ability of water flume, the wavelength is too long to ensure that enough of the reflected wave is absorbed by the dissipating material. Therefore, regular waves with periods in the range 0.62–1.08 s are used in the experiment. The ratio of the wavelength to the structural span varies in the range 1–3. Because wave steepness is closely related to wave nonlinearity, the influence of different wave steepnesses on the structure should be considered. Referring to Qin’s experiment (Qin et al., 2020) and the working ability of the wave maker, three wave steepness values (H/λ = 1/15, 1/30, and 1/60) are used in the experiment. The water depth of the experiment is 0.7 m. And the corresponding prototype water depth is 42 m. The parameters of the regular wave are listed in Table 4, where T is the wave period, H is the wave height, and λ is the wavelength.
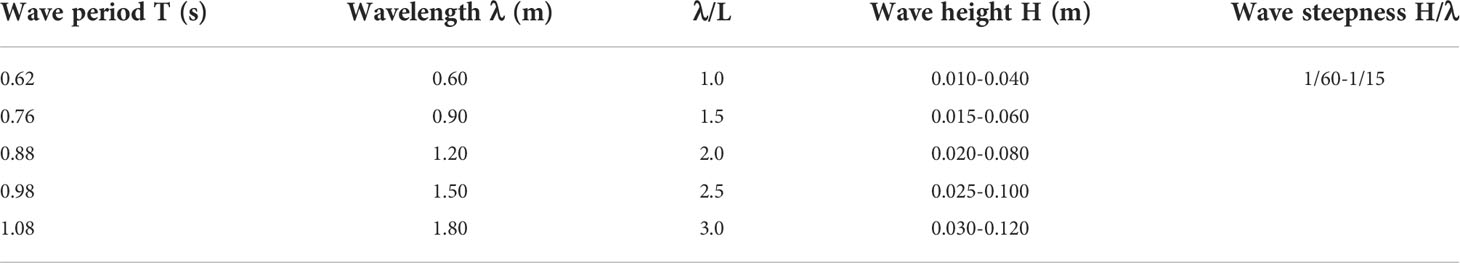
Table 4 Wave parameters used in the experiments.
Because of the voltage fluctuations and interference from other electronic equipment, it is difficult for wave makers to produce waves exactly in accordance with the prescribed wave height. Through several tests, we obtained an empirical coefficient that describes the proportional relationship between the prescribed and measured values; this reduces the influence of the aforementioned error caused by wave makers. In addition, we waited 5–10 min before the next test to prevent interference between the tests. Each test was repeated three times to ensure reproducibility. Comparisons between the prescribed and measured wave heights in the absence of the models are presented in Table 5. H(p) and H(m) are the prescribed and measured wave heights in meters, respectively.
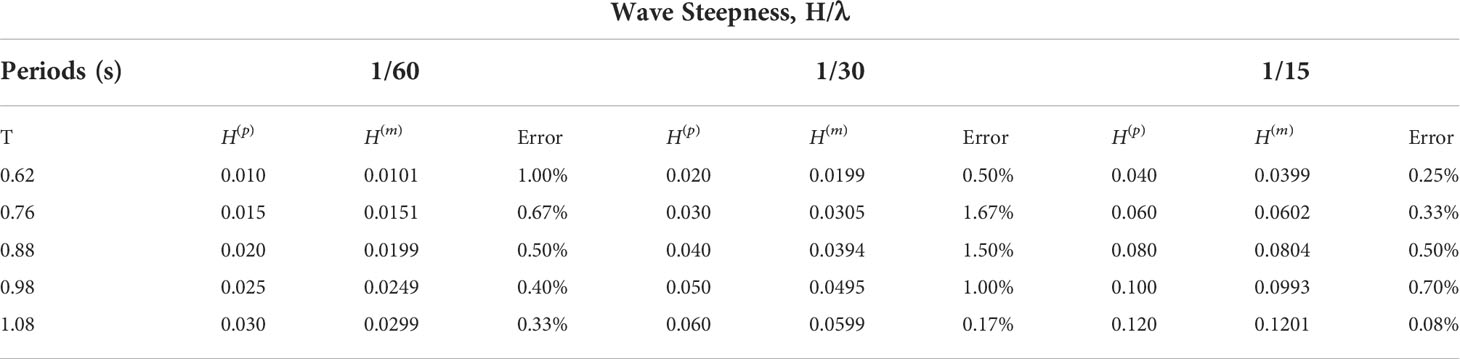
Table 5 Comparisons of prescribed and measured wave heights.
Filtering the experimental data is important as it helps (1) eliminate noise, (2) isolate low- and high-frequency data, (3) prepare the data for spectral analysis, and (4) remove the transition data (Qin et al., 2020). The Savitzky–Golay filter, designed based on the least-squares method, was used in the experiment (Savitzky and Golay, 1964). We can remove high-frequency noise or separate low-frequency noise because of its low-pass characteristics.
3 Results and discussion
To understand the influence of ramp on the hydrodynamic characteristics and wave field of the aquaculture platform, we regard regular waves as environmental loads. We employ different wave length that are equally divided into five groups spanning from λ = 0.6 m to λ = 1.8 m in the experiment. In addition, the effect of the wave steepness is considered. Three wave steepnesses are used in the experiment: 1/15, 1/30, and 1/60. The cage on the weather side is most likely to suffer structural damage due to direct wave slamming without shelter. Therefore, we select this cage as an example to analyze the effect of ramp on structure.
3.1 Time domain analysis
3.1.1 Dynamic response of cage array
Figure 3 shows the time histories of the surge motion, trajectories of the cage and dependence of the amplitude of the surge motion on wavelength under different wave steepness. The maximum wavelength L = 1.8 m (λ/L = 3) was chosen as the representative owing to the low-frequency characteristics of the surge motion (Bi et al., 2021). As can be seen in Figure 3, the equilibrium position of the surge of the cage is further away from the initial position with an increase in wave steepness. In other words, the drift distance of the cage gradually increased. This is because the drift distance depends on the average wave force, which is proportional to the square of the wave height. When the wavelength was constant, the wave height increased with an increase in wave steepness. Larger wave heights resulted in greater average wave forces and drift distances. In addition, the trajectories of the cage were not as elliptical as the water particle trajectories for wave motion near the free surface owing to the nonlinear characteristics of the mooring lines. Notably, the trajectory became irregular with the effect of the ramp. This trend became increasingly significant as the wave steepness increased, which can be attributed to wave reflection caused by the ramp, resulting in more intense wave slamming and breaking near the cage on the weather side. The water particle trajectories became more random with the influence of these phenomena.
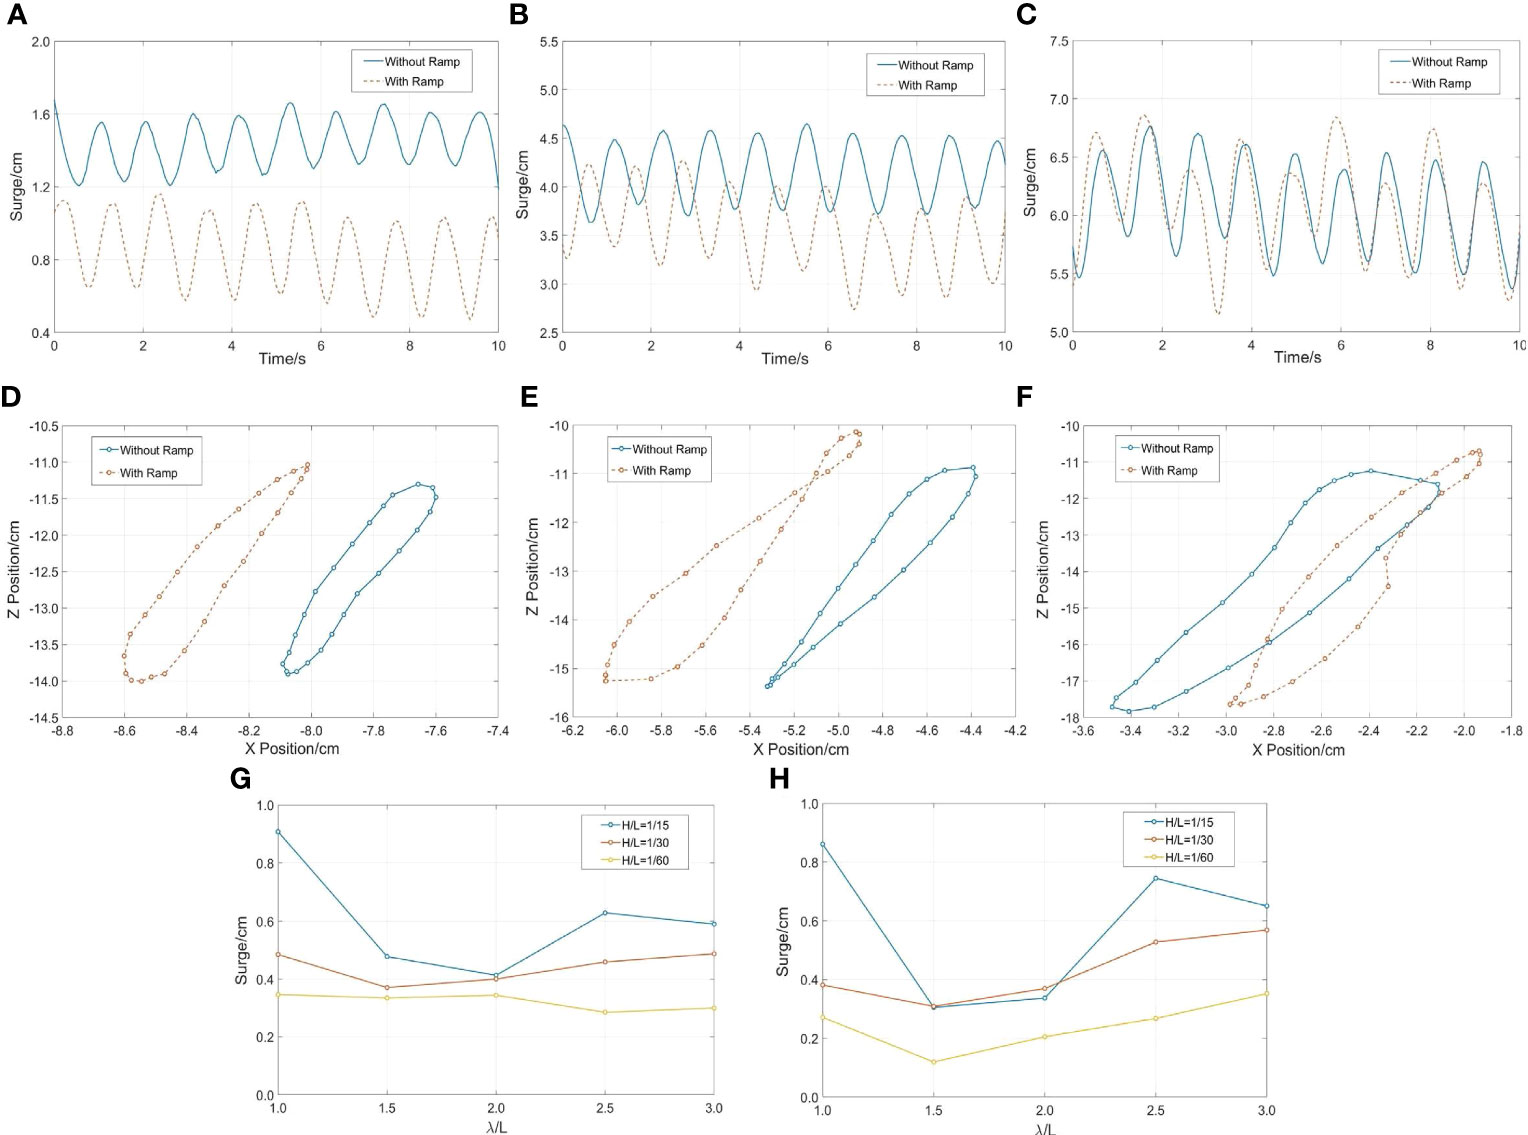
Figure 3 Time histories of the surge motion, trajectories of the cage and dependence of the amplitude of the surge motion on wavelength under different wave steepness: (A, D) H/λ=1/60, λ/L=3; (B, E) H/λ=1/30, λ/L=3; (C, F) H/λ=1/15, λ/L=3, (G) without ramp, (H) with ramp.
As shown in the Figure 3, we compare the amplitudes of the surge motion under different wave conditions. It can be observed that the surge motion has evident nonlinearity when the effect of the ramp is not considered, which is caused by the material nonlinearity of the nylon cable. The nonlinear stretching mooring strength members develop a permanent, nonelastic length increase under the first loading and respond with nonlinear elastic stretching to applied tensions with a considerably higher elastic modulus at their second and subsequent load cycles (Walther and Gibson, 2000). This trend became increasingly significant as the wave steepness increased.
Figure 4 exhibits the time histories of the heave and the dependence of the heave amplitude on wavelength under different wave steepnesses. The amplitude of the heave motion response is positively correlated with the wave length. It reaches the maximum value of 3.70 cm when the wave steepness is 1/15 and wavelength is 1.8 m (λ/L = 3). In addition, the motion response is significantly affected by the wave steepness. When the wave steepness is 1/30, the maximum value is 2.62 cm. When the wave steepness is 1/60, the maximum value is 1.42 cm. In a word, when the wave steepness increases from 1/60 to 1/15, the motion responses of the cage are increased by 84.6% and 41.2%. This is because when the wavelength is fixed, the increase of the wave steepness causes a rise in the wave height. Considering the effect of ramp, the heave motion response of the cage shows the slightly decreasing trend. However, the phase changes significantly.
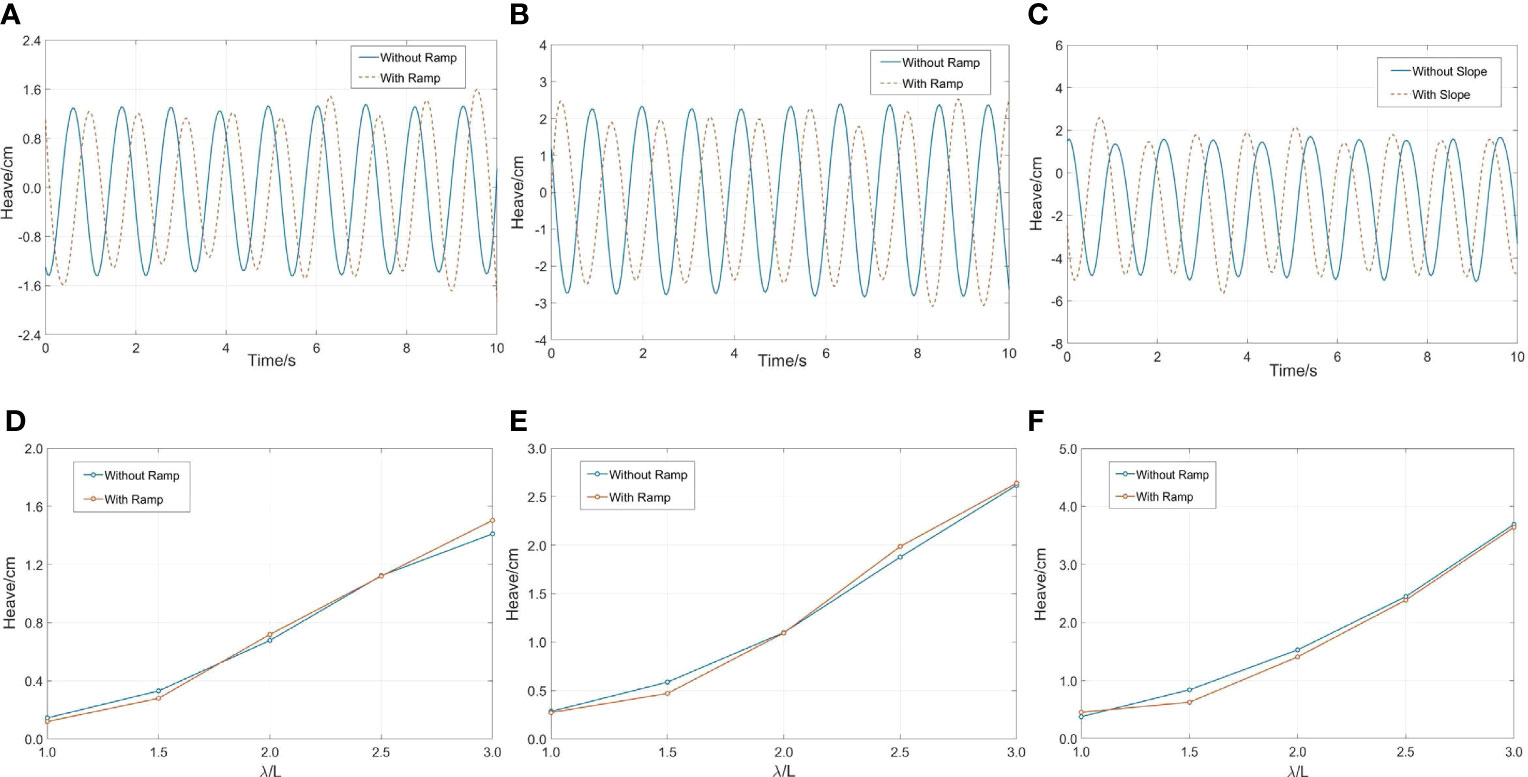
Figure 4 Time histories and dependence of the amplitude of the heave motion on wavelength under different wave steepness: (A, D) H/λ=1/60, λ/L=3; (B, E) H/λ=1/30, λ/L=3; (C, F) H/λ=1/15, λ/L=3.
As can be seen in Figure 5, the time histories and amplitudes of the pitch motion under different wave conditions were considered in the experiment. The motion characteristics of pitch are similar to those of heave, owing to their coupling. Considering the constant wave steepness, longer wavelengths cause greater motion response. When the wavelength is 1.8 m (λ/L = 3), the motion response reaches the maximum value of 8.19°. The influence of wave steepness on pitch motion cannot be ignored. Taking the maximum wavelength of 1.8 m as an example, the pitch motion of the cage has increased by 66.6% and 42.9% when the wave steepness increases from 1/60 to 1/15. Similar to the conclusion of heave motion, there is a slight decrease in the pitch amplitude because of the ramp.
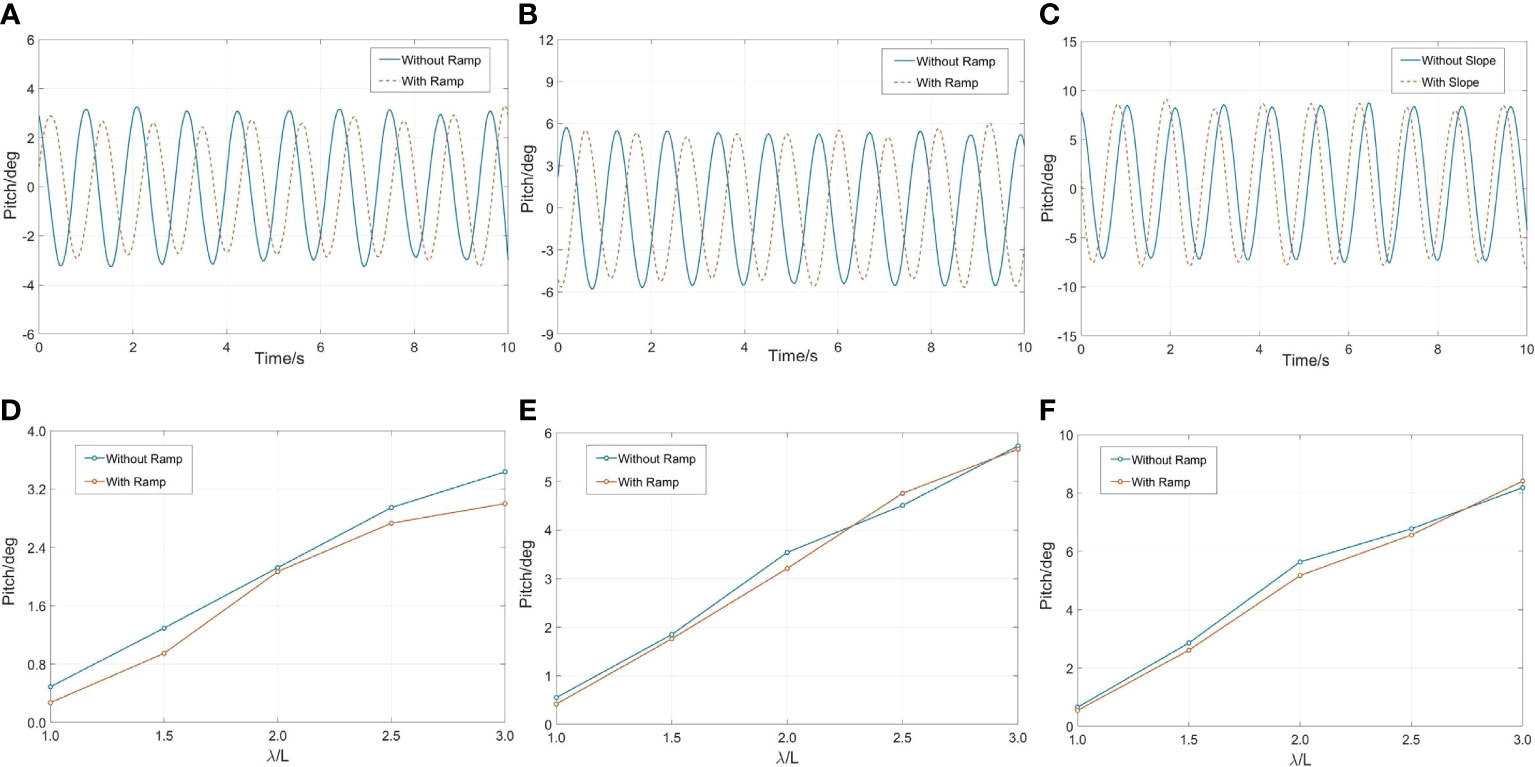
Figure 5 Time histories and the dependence of the amplitude of the pitch motion on wavelength under different wave steepness: (A, D) H/λ=1/60, λ/L=3; (B, E) H/λ=1/30, λ/L=3; (C, F) H/λ=1/15, λ/L=3.
In conclusion, surge and pitch motion responses are positively correlated with wavelength. A large pitch motion challenges the strength of the hinges connecting the floating frame. In addition, the initial drift distance in the horizontal direction and motion amplitude in the vertical direction of the cage increased as the wave steepness increased. Considering the influence of ramp on structure, the motion trajectory of the cage becomes more random, and the amplitude of heave and pitch motion decreases slightly.
3.1.2 Mooring loads
Figure 6 depicts the time histories and maximum value of the mooring force under different wave conditions. The peak value of the cable force is positively correlated with the incident wavelength. When the wave steepness was 1/15, and the wavelength was 1.8 m (λ/L = 3), the maximum cable force was 9.43 N. When the wave steepness was 1/30, the maximum value was 0.94 N. When the wave steepness was 1/60, the maximum value was 0.17 N. It can be concluded that large motion response caused by great wave steepness can lead to large cable force. Considering the influence of the ramp, the cable force of the cage was significantly increased. Taking the maximum wave steepness of 1/15 as an example, the cable force has increased by 74.5%, 45.6%, 25.5%, 20.0%, 15.1% with the wavelength growth. Therefore, the more reasonable design of the mooring system and the more reliable material of cable should be required for the cages anchored near the islands.
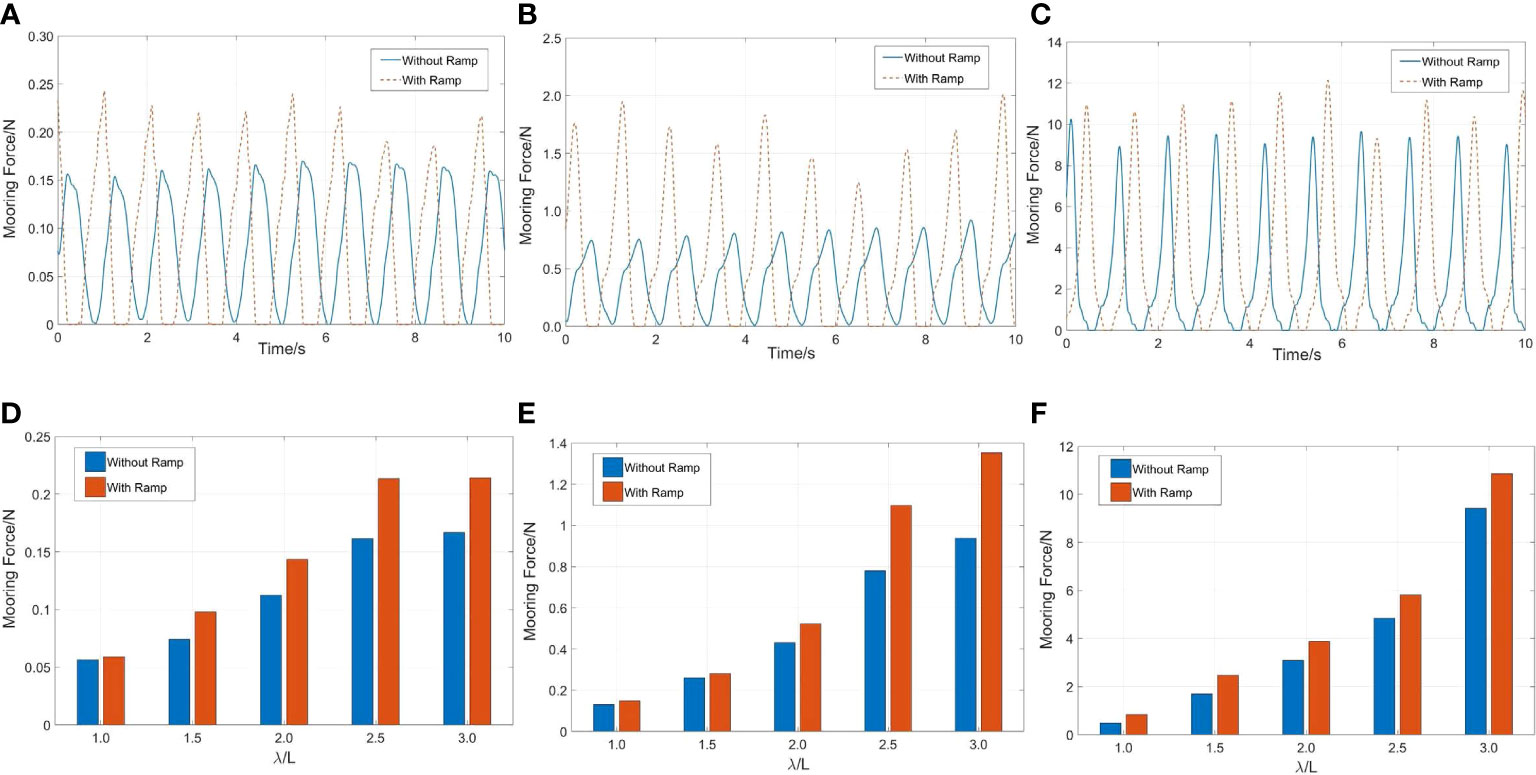
Figure 6 Time histories and the dependence of the peak value of the weather-side cable force on wavelength under different wave steepness:(A, D) H/λ=1/60, λ/L=3; (B, E) H/λ=1/30, λ/L=3; (C, F) H/λ=1/15, λ/L=3.
3.1.3 Wave elevations
The change in the wave surface is closely related to the safety of the cage. The change in the wave surface causes nonlinear motion of the cage, particularly for wave breaking. And the wave slamming occurring on the floating frame becomes more obvious under extreme wave conditions, which poses a challenge to the safety of the cage, as shown in Figure 2B.
Figures 7A–C shows time histories of the free-surface elevations in different net cages when the wavelength is 0.6 m (λ/L = 1) and the wave steepness is 1/15. The cage on the weather side is defined as Cage 1. The one on the lee side is called Cage 3. The middle one is called Cage 2. The wave response in the cage gradually decreases along the wave propagation direction. Compared with the other two cages, the wave surface in Cage 1 has stronger nonlinearity. This is because there is more significant wave reflection and breaking inside the cage when the incident wavelength is equal to the cage width, as shown in Figure 2C. In addition, the draft of the floating frame is much less than its width (Hdraft/L = 0.02). The wave energy gradually decreases along the wave propagation direction under the influence of turbulence. With the effect of the reflected waves generated by the ramp, the wave elevations have increased by 10.6% in Cage 1, 40.2% in Cage 2 and 38.4% in Cage 3. Compared with other positions, the wave response inside Cage 2 is the largest. And the wave surface inside Cage 1 exhibits stronger nonlinearity because of the ramp.
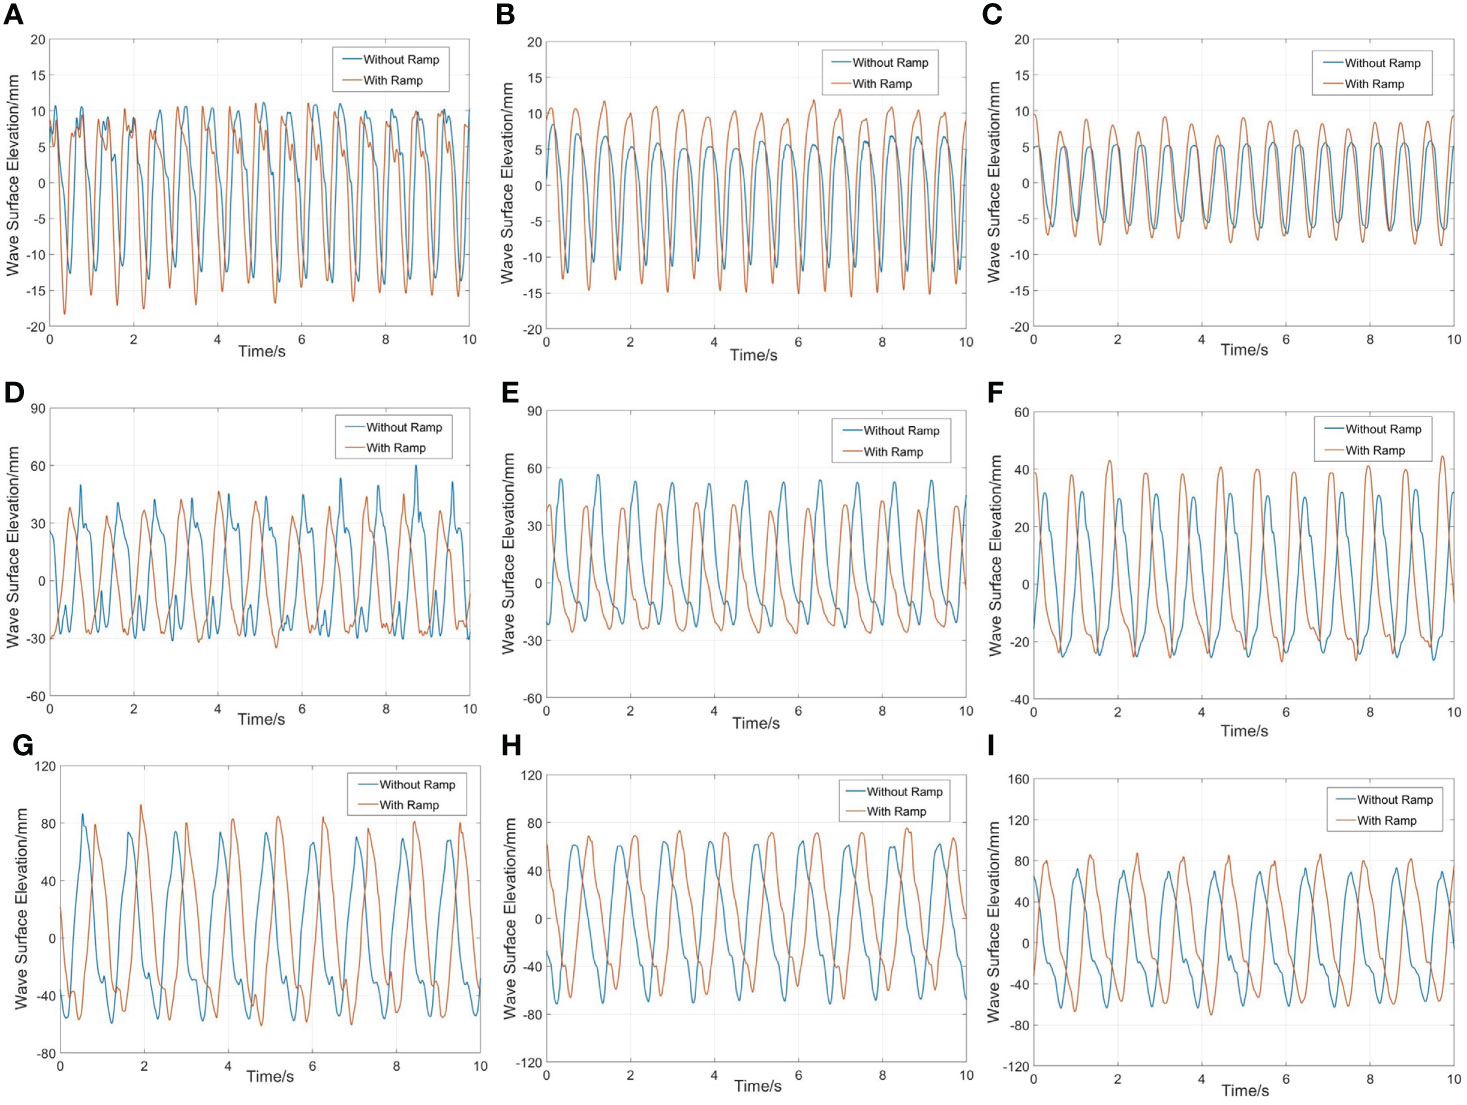
Figure 7 Time histories of the free-surface elevations in different net cages when the wave steepness is 1/15:(A) Cage 1, λ/L=1; (B) Cage 2, λ/L=1; (C) Cage 3, λ/L=1; (D) Cage 1, λ/L=2; (E) Cage 2, λ/L=2; (F) Cage 3, λ/L=2; (G) Cage 1, λ/L=3; (H) Cage 2, λ/L=3; (I) Cage 3, λ/L=3.
Time histories of the free-surface elevations in different net cages when the wavelength is 1.2 m (λ/L = 2) and the wave steepness is 1/15, as shown in Figures 7D–F. The wave response in Cage 1 is similar to Cage 2. The maximum difference of wave response between the two cages is 5.6%. There is smaller wave response in Cage 3. Considering the effect of the ramp, there are lower wave responses inside Cage 1 and Cage 2. Note that the opposite conclusion is obtained inside Cage 3. Compared to other positions, the wave response in Cage 1 is the largest.
Figures 7G-I depict time histories of the free-surface elevations in different net cages when the wavelength is 1.8 m (λ/L = 3) and the wave steepness is 1/15. As shown in the figure, the wave responses inside different cages are close, and the maximum difference in wave amplitudes is only 3.4% when ramp is not considered. The nonlinearity of the wave surface inside the cages is weak. Considering the effect of the ramp, the wave surface elevations inside three cages are increased. There is the largest wave response in Cage 3, and the wave response inside Cage 2 is the weakest.
3.2 Frequency domain analysis
In the last part, the data, including motion response, cable force, and wave response, are analyzed in the time domain. However, it cannot attain the characteristics of these data in the frequency domain Therefore, in this section, the fast Fourier transform (FFT) is used to conduct the frequency-domain analysis.
3.2.1 Spectrum analysis
Figures 8A–C depict the amplitude spectrum of the surge motion of the cage with different wavelengths. The wave steepness we considered in the figures is 1/15. Although high- and low-frequency components are involved, the surge motion response of the cage is dominated by the wave-frequency component. This is because the regular wave has a single frequency, and the wave load is concentrated on it. Regardless of the effect of the ramp, the high frequency motion accounts for 63.6% of the wave frequency motion when the wavelength is 1.2 m (λ/L = 2). Considering the effect of the ramp, the amplitude of low-frequency motion of the cage increases significantly. When the wavelength is 1.2 m (λ/L = 2), the amplitude of the low-frequency motion response of the cage with the ramp is three times higher than that without the ramp, and the wave frequency motion decreased by 20%. Low-frequency motion accounted for 54% of the wave frequency motion. The reason is that the low-frequency wave load of the cage is increased because of the superposition of the incident and reflected waves generated by the ramp. The natural frequency of the surge of the cage is low, and it easily resonates with the low-frequency wave load.
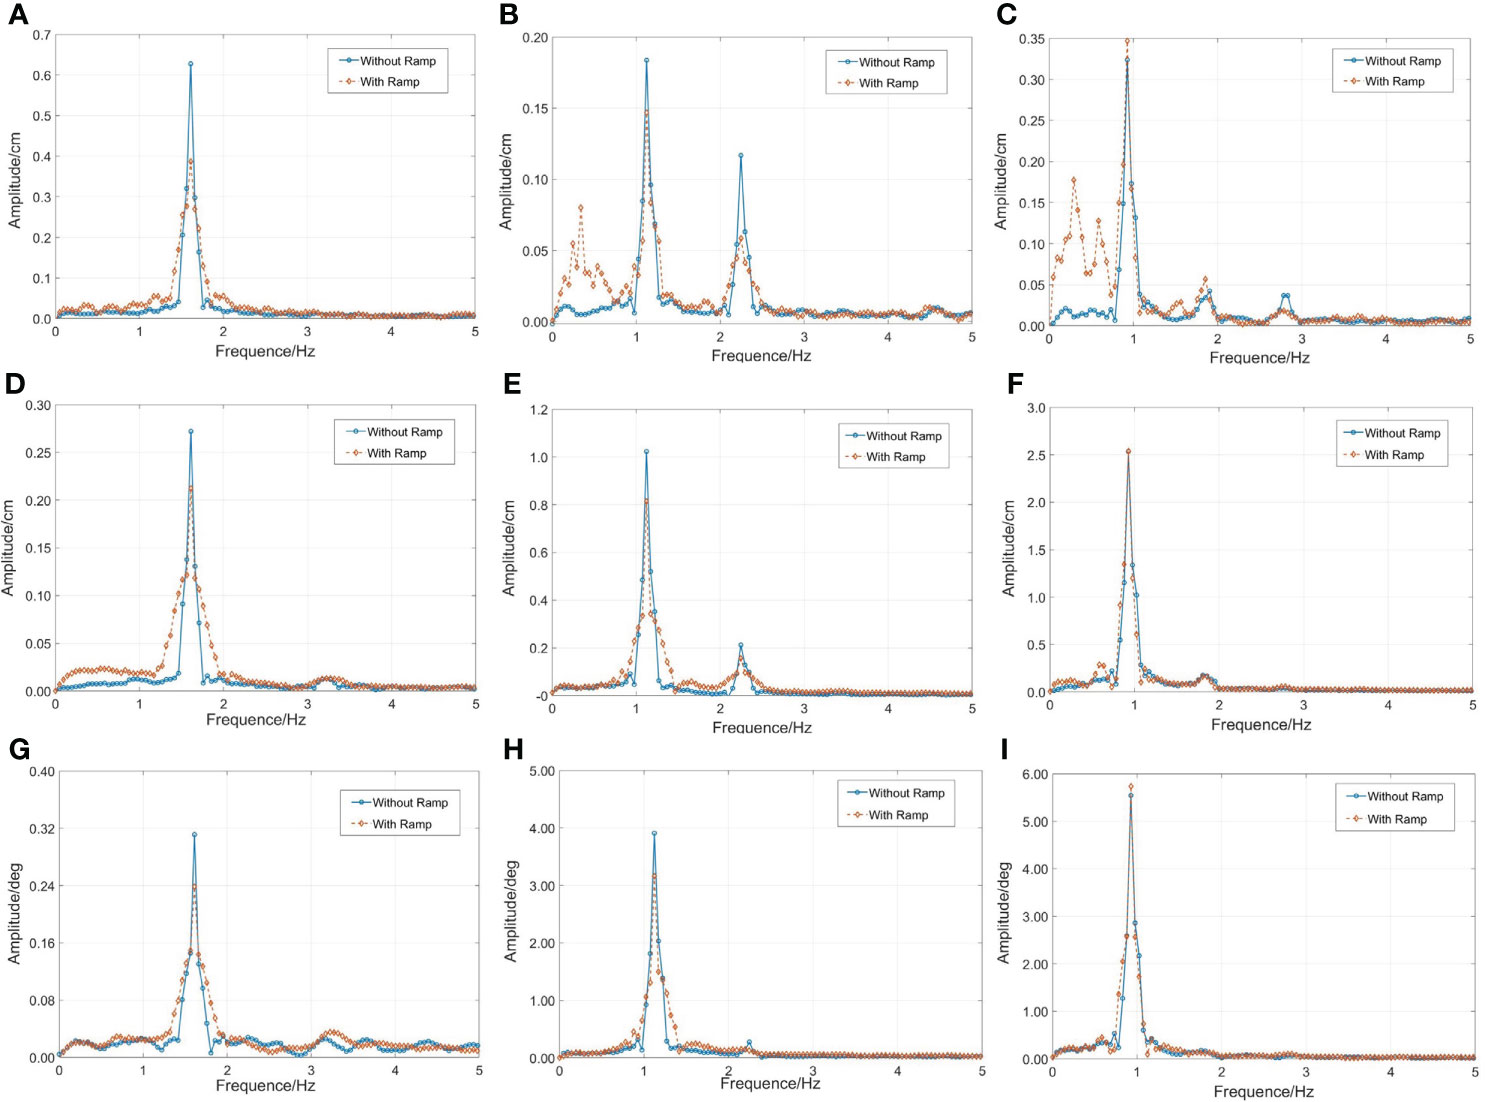
Figure 8 Amplitude spectra of the motion response of the cage with different wavelength when the wave steepness is 1/15: (A) λ/L=1, surge motion; (B) λ/L=2, surge motion (C) λ/L=3, surge motion; (D) λ/L=1, heave motion; (E) λ/L=2, heave motion (F) λ/L=3, heave motion; (G) λ/L=1, pitch motion; (H) λ/L=2, pitch motion (I) λ/L=3, pitch motion;.
Figures 8D–F depict the amplitude spectrum of the heave motion of the cage with different wavelength. The wave steepness we consider is 1/15. From Figures 8D–F motion response of the cage is dominated by the wave response component. The high frequency motion of the cage only accounts for 20% of the wave frequency motion at most when the wavelength is 1.2 m (λ/L = 2). Considering the effect of the ramp, the motion response of cage on wave frequency is reduced, which becomes less obvious with the increase of the wavelength. This is because the restoring force of the heave motion of the offshore platform is usually produced by the change in the drainage volume caused by the draught change of the platform. When the wavelength is short (λ/L = 1,2), the superposition of incident and reflected waves increases the draft of the floating frame. When the wavelength is long (λ/L = 3), the heave motion amplitude is 3.7 cm without the effect of the ramp and the draft depth of the floating frame water is 3 cm. The cage is placed completely underwater, as shown in Figure 2D. The motion response hardly changes because of the constant drainage volume.
Figures 8G–I depict the amplitude spectrum of the pitch motion of the cage with different wavelength. The wave steepness we consider is 1/15. Because of the coupling of the heave motion and pitch motion, the motion characteristic of pitch is similar to the heave.
Figure 9 shows the power spectrum of the mooring force at different wavelengths. The wave steepness we considered was 1/15. Although high and low components are involved, the mooring force of the cage is dominated by the wave frequency component. The effect of ramp on the wave frequency cable force is significantly greater than that it in other components. And the cable force in the low-frequency region increases because of the rise of motion amplitude in this part, as shown in the Figure 8. But the proportion of the low-frequency cable force to total cable force is significantly less than that of the wave frequency.
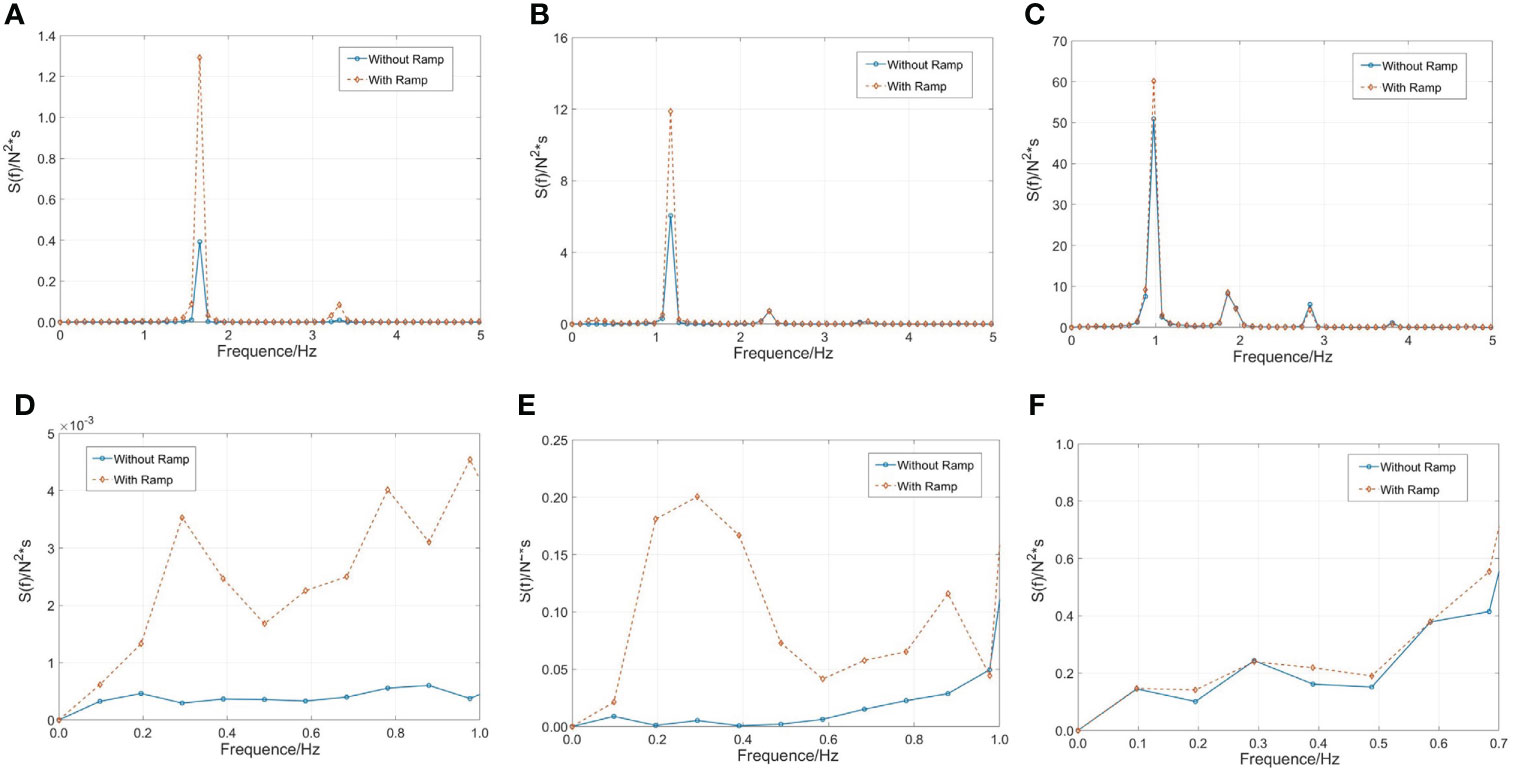
Figure 9 Power spectra of the mooring force with different wavelength:(A, D) λ/L=1, H/λ=1/15; (B, E) λ/L=2, H/λ=1/15; (C, F) λ/L=3, H/λ=1/15.
3.2.2 Free surface effects
In this section, we compare the energy spectra of wave response inside cages with different wavelengths. The wave steepness we consider is 1/15.Although higher-frequency components are involved, the wave responses inside frames are dominated by the wave-frequency component. The wave response is positively correlated with wavelength regardless of the effect of ramp. When the wave wavelength is equal to the span of the cage, the energy spectra of the wave response inside cages are shown in the Figures 10A, B. The presence of the ramp significantly increases the wave frequency component of wave response inside Cage 2 and Cage 3, but has slight effect on Cage 1. The wave response in Cage 1 increases by only 1.6%. Note that the wave response of the high-frequency components inside Cage 1 increases significantly, which is different from other cages. Wave reflection generated by ramp prompts wave breaking inside Cage 1, and the wave response is transferred from the wave frequency to the high frequency components.
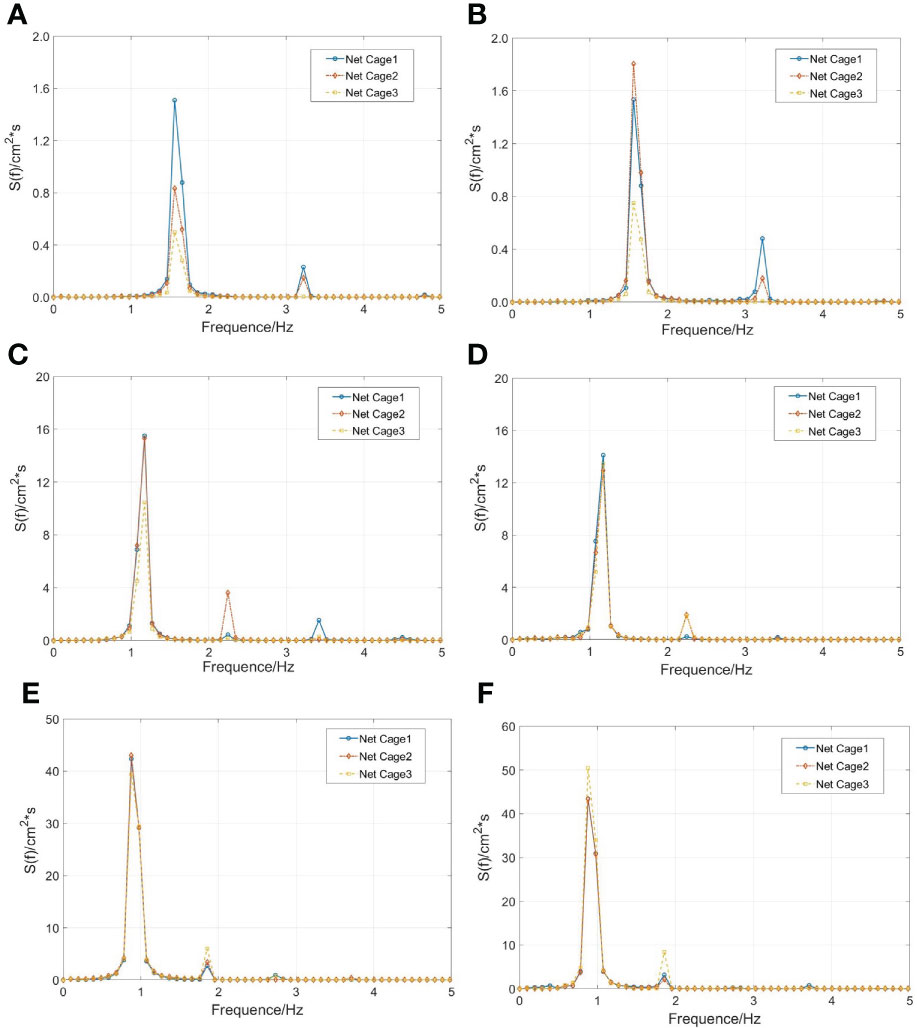
Figure 10 Energy spectra of wave elevations in the net cages when the wave steepness is 1/15: (A) λ/L=1, without ramp; (B) λ/L=1, with ramp; (C λ/L=2, without ramp; (D) λ/L=2, with ramp; (E) λ/L=3, without ramp; (F) λ/L=3, with ramp.
The wavelength we consider in the Figures 10C, D is 1.2m(λ/L=2). Considering the effect of the ramp, the wave responses of Cage 1 and Cage 2 are reduced by 8.9%. The wave responses of Cage 3 increased by 28.8%.
The wavelength we considered in Figures 10 E, F is 1.8 m (λ/L = 3). The effect of the ramp on Cage 3 is greater than that on Cage 1 and Cage 2. The wave response of the wave frequency component of Cage 3 has increased by 48.4%. As for other cages, it has only increased by 2.49% and 0.82%.
4 Conclusion
In this study, we analyze the hydrodynamic and wave field characteristics of a multi-body floating aquaculture platform under the influence of a ramp via physical model experiments. Dependence of motion response, cable force, as well as wave elevation on wave steepness, wavelength, and ramp influence is also analyzed. The innovation of this paper is to consider the influence of the sloping seabed on aquaculture facilities, which has been ignored in previous studies. The research results of this paper can provide a reference for the structure optimization and mooring system design of aquaculture facilities near islands.
(1) The motion response and cable force of the cage gradually increase with increasing wavelength and wave steepness. The wave response inside the cage is significantly correlated with the ratio of wavelength to cage width. Longer wavelengths generally result in larger wave responses.
(2) The effect of ramp on the surge motion response of the cage is greater than that of the heave and pitch motion. The low-frequency components of the surge motion response and mooring force become greater. As for the heave and pitch motion response, the amplitude has decreased on account of the growth of the structure draft. However, the effect of the ramp is limited owing to the low freeboard height of the structure.
(3) The cable force is significantly increased because of the presence of the ramp. Although the low-frequency components have risen with the increase of the surge response motion at low-frequency components, the wave frequency components are still the main part of the cable force.
(4) The presence of the ramp does not always increase the wave response inside the cage. When the wavelength is equal to the span of the cage, the wave breaking inside Cage 1 is promoted because of the ramp, and the wave response at high-frequency is increased. With a rise in the incident wave wavelength, the wave response inside Cage 3 is increased significantly.
Data availability statement
The raw data supporting the conclusions of this article will be made available by the authors, without undue reservation.
Author contributions
YZ: Conceptualization, Supervision, Project administration, Funding acquisition, Writing - review & editing. SX: Investigation, Data curation, Writing - original draft. CM: Conceptualization, Supervision, Writing - review & editing. All authors contributed to the article and approved the submitted version.
Funding
This work was financially supported by the National Key R&D Program of China (No. 2019YFD0900902); National Natural Science Foundation of China (Nos. 31972843); LiaoNing Revitalization Talents Program (Nos. XLYC907139); Dalian Technology Talents Program, projects No. 2020RQ107.
Conflict of interest
The authors declare that the research was conducted in the absence of any commercial or financial relationships that could be construed as a potential conflict of interest.
Publisher’s note
All claims expressed in this article are solely those of the authors and do not necessarily represent those of their affiliated organizations, or those of the publisher, the editors and the reviewers. Any product that may be evaluated in this article, or claim that may be made by its manufacturer, is not guaranteed or endorsed by the publisher.
References
Bai X., Zhao Y., Dong G., Bi C. (2018). Probabilistic analysis and fatigue life assessment of floating collar of fish cage due to random wave loads. Appl. Ocean Res. 81, 93–105. doi: 10.1016/j.apor.2018.09.018
Bi C.-W., Ma C., Zhao Y.-P., Xin L.-X. (2021). Physical model experimental study on the motion responses of a multi-module aquaculture platform. Ocean Eng. 239, 109862. doi: 10.1016/j.oceaneng.2021.109862
Bi C.-W., Zhao Y.-P., Dong G.-H., Xu T.-J., Gui F.-K. (2017). Numerical study on wave attenuation inside and around a square array of biofouled net cages. Aquacultural Eng. 78, 180–189. doi: 10.1016/j.aquaeng.2017.07.006
Bi C.-W., Zhao Y.-P., Dong G.-H., Zheng Y.-N., Gui F.-K. (2014). A numerical analysis on the hydrodynamic characteristics of net cages using coupled fluid–structure interaction model. Aquacultural Eng. 59, 1–12. doi: 10.1016/j.aquaeng.2014.01.002
Buchner B. (2006). The motions of a ship on a sloped seabed. International Conference on Offshore Mechanics and Arctic Engineering, 47462, 339–347. doi: 10.1115/OMAE2006-92321
Chen H., Christensen E. D. (2016). Investigations on the porous resistance coefficients for fishing net structures. J. Fluids Structures 65, 76–107. doi: 10.1016/j.jfluidstructs.2016.05.005
De Hauteclocque G., Rezende F. V., Giorgiutti Y., Chen X.-B. (2009). “Wave kinematics and seakeeping calculation with varying bathymetry,” in ASME 2009 28th International Conference on Ocean, Offshore and Arctic Engineering. (Honolulu, Hawaii, USA.) 515–523.
Ding J., Xie Z., Wu Y., Xu S., Qiu G., Wang Y., et al. (2020). Numerical and experimental investigation on hydroelastic responses of an 8-module VLFS near a typical island. Ocean Eng. 214, 107841. doi: 10.1016/j.oceaneng.2020.107841
FAO (2018). The state of world fisheries and aquaculture 2018-meeting the sustainable development goals (Rome, Italy: Food and Agriculture Organization of the United Nations).
Feng A., Bai W., Price W. G. (2017). Two-dimensional wave radiation and diffraction problems in a flat or sloping seabed environment. J. Fluids Structures 75, 193–212. doi: 10.1016/j.jfluidstructs.2017.09.001
Feng A., Cai H., You Y. (2019). Freely floating body motion responses induced by wave and current in seabed conditions. Ocean Eng. 172, 396–406. doi: 10.1016/j.oceaneng.2018.12.002
Feng A., Chen K., You Y., Jiang S.-C. (2021). Three dimensional numerical modelling for wave radiation problem under arbitrary seabed condition. Ocean Eng. 230, 108885. doi: 10.1016/j.oceaneng.2021.108885
Feng A., Price W. G. (2018). Numerical simulations of the hydrodynamic responses of a body interacting with wave and current over a sloping seabed. Appl. Ocean Res. 79, 184–196. doi: 10.1016/j.apor.2018.08.004
Ferreira M. D., Newman J. N. (2009). Diffraction effects and ship motions on an artificial seabed. Proc. 24th Int. Workshop Water Waves Floating Bodies, Zelenogorsk, Russia.
Fredriksson D. W., Decew J., Swift M. R., Tsukrov I., Chambers M. D., Celikkol B. (2004). The design and analysis of a four-cage grid mooring for open ocean aquaculture. Aquacultural Eng. 32, 77–94. doi: 10.1016/j.aquaeng.2004.05.001
Gao J., Ma X., Dong G., Chen H., Liu Q., Zang J. (2021). Investigation on the effects of Bragg reflection on harbor oscillations. Coast. Eng. 170, 103977. doi: 10.1016/j.coastaleng.2021.103977
Gao J., Ma X., Zang J., Dong G., Ma X., Zhu Y., et al. (2020). Numerical investigation of harbor oscillations induced by focused transient wave groups. Coast. Eng. 158 103670. doi: 10.1016/j.coastaleng.2020.103670
Gui F., Li Y., Dong G., Guan C. (2006). Application of CCD image scanning to sea-cage motion response analysis. Aquacultural Eng. 35, 179–190. doi: 10.1016/j.aquaeng.2006.01.003
Journee J. M. J., Massie W. W., Delft University of Technology, F. O. C. E., Geosciences, Huijsmans, R. H. M, Delft University Of Technology, F. O. M, Maritime & Engineering M (2000). Offshore hydromechanics (Netherlands: TU Delft).
Kim Y. (2013). Numerical analysis on floating-body motion responses in arbitrary bathymetry. Ocean Eng. 62, 123–139. doi: 10.1016/j.oceaneng.2013.01.012
Knysh A., Coyle J., Decew J., Drach A., Swift M. R., Tsukrov I. (2021). Floating protective barriers: Evaluation of seaworthiness through physical testing, numerical simulations and field deployment. Ocean Eng. 227, 108707. doi: 10.1016/j.oceaneng.2021.108707
Lader P. F., Fredheim A. (2006). Dynamic properties of a flexible net sheet in waves and current–a numerical approach. Aquacultural Eng. 35, 228–238. doi: 10.1016/j.aquaeng.2006.02.002
Lee C.-W., Kim Y.-B., Lee G.-H., Choe M.-Y., Lee M.-K., Koo K.-Y. (2008). Dynamic simulation of a fish cage system subjected to currents and waves. Ocean Eng. 35, 1521–1532. doi: 10.1016/j.oceaneng.2008.06.009
Liu H.-F., Bi C.-W., Zhao Y.-P. (2020). Experimental and numerical study of the hydrodynamic characteristics of a semisubmersible aquaculture facility in waves. Ocean Eng. 214 107714. doi: 10.1016/j.oceaneng.2020.107714
Ma C., Bi C.-W., Xu Z., Zhao Y.-P. (2022a). Dynamic behaviors of a hinged multi-body floating aquaculture platform under regular waves. Ocean Eng. 243, 110278. doi: 10.1016/j.oceaneng.2021.110278
Ma C., Zhao Y.-P., Xu Z., Bi C.-W. (2022b). Experimental investigation on the wave performance with the interference of floating aquaculture cages in single and tandem arrangements. Ocean Eng. 262, 112255. doi: 10.1016/j.oceaneng.2022.112255
Ning D., Liang C., Chen L., Zhang C. (2022). Numerical investigation on the propagation and evolution of focused waves over a sloping bed. Ocean Eng. 250, 111035. doi: 10.1016/j.oceaneng.2022.111035
Qin H., Xu Z., Li P., Yu S. (2020). A physical model approach to nonlinear vertical accelerations and mooring loads of an offshore aquaculture cage induced by wave-structure interactions. Ocean Eng. 197, 106904. doi: 10.1016/j.oceaneng.2019.106904
Savitzky A., Golay M. J. E. (1964). Smoothing and differentiation of data by simplified least squares procedures. Analytical Chem. 36, 1627–1639. doi: 10.1021/ac60214a047
Shen Y., Firoozkoohi R., Greco M., Faltinsen O. M. (2021). Experimental investigation of a closed vertical cylinder-shaped fish cage in waves. Ocean Eng. 236, 109444. doi: 10.1016/j.oceaneng.2021.109444
Tsukrov I., Eroshkin O., Fredriksson D., Swift M. R., Celikkol B. (2003). Finite element modeling of net panels using a consistent net element. Ocean Eng. 30, 251–270. doi: 10.1016/S0029-8018(02)00021-5
Walther J. A., Gibson P. T. (2000). Final report on testing of stretch rubber hoses (Huntington Beach, CA: Tension Member Technol.).
Xu T.-J., Dong G.-H., Zhao Y.-P., Li Y.-C., Gui F.-K. (2012). Numerical investigation of the hydrodynamic behaviors of multiple net cages in waves. Aquacultural Eng. 48, 6–18. doi: 10.1016/j.aquaeng.2011.12.003
Yang P., Liu X., Wang Z., Zong Z., Tian C., Wu Y. (2019). Hydroelastic responses of a 3-module VLFS in the waves influenced by complicated geographic environment. Ocean Eng. 184, 121–133. doi: 10.1016/j.oceaneng.2019.05.020
Yang H., Xu Z., Bi C., Zhao Y.-P. (2022). Numerical modeling of interaction between steady flow and pile-net structures using a one-way coupling model. Ocean Eng. 254, 111362. doi: 10.1016/j.oceaneng.2022.111362
Zhao Y.-P., Li Y.-C., Dong G.-H., Gui F.-K., Teng B. (2007). A numerical study on dynamic properties of the gravity cage in combined wave-current flow. Ocean Eng. 34, 2350–2363. doi: 10.1016/j.oceaneng.2007.05.003
Keywords: multi-body floating aquaculture platform, physical model approach, seabed topography, wave-structure interaction, regular wave
Citation: Zhao Y, Xie S and Ma C (2022) Experimental investigations on the hydrodynamics of a multi-body floating aquaculture platform exposed to sloping seabed environment. Front. Mar. Sci. 9:1049769. doi: 10.3389/fmars.2022.1049769
Received: 21 September 2022; Accepted: 13 October 2022;
Published: 28 October 2022.
Edited by:
Morten Omholt Alver, Norwegian University of Science and Technology, NorwayReviewed by:
Aichun Feng, Shanghai Jiao Tong University, ChinaJunliang Gao, Jiangsu University of Science and Technology, China
Copyright © 2022 Zhao, Xie and Ma. This is an open-access article distributed under the terms of the Creative Commons Attribution License (CC BY). The use, distribution or reproduction in other forums is permitted, provided the original author(s) and the copyright owner(s) are credited and that the original publication in this journal is cited, in accordance with accepted academic practice. No use, distribution or reproduction is permitted which does not comply with these terms.
*Correspondence: Chao Ma, ZGx1dG1jMzdAbWFpbC5kbHV0LmVkdS5jbg==