- 1School of Mathematics and Information Science, Weifang University, Weifang, China
- 2Research & Development Department, Acoustic Signal and Electronics Science and Technology Corporation, Lanzhou, China
Synthetic aperture sonar (SAS) can provide high-resolution underwater images. Traditional fast imaging algorithms designed for multi-receiver synthetic aperture sonar (MSAS) are complex because the point target reference spectrum (PTRS) deduction and imaging algorithm development are complicated. This paper proposes an imaging algorithm for the MSAS system to solve this issue. The proposed method first approximates the two-round slant range based on the phase center approximation method. The PTRS, including the quasi-monostatic and bistatic deformation terms, can be easily deduced. After compensating for the bistatic deformation term based on the interpolation and complex multiplication with the preprocessing step, the MSAS imagery can be simplified to the focus of the traditional monostatic SAS. Therefore, the conventional imaging algorithms designed for traditional monostatic SAS can be used directly. The proposed method providing high-resolution imaging results is more efficient than the traditional methods.
1. Introduction
The complex ocean environment (Hunter, 2006; Davis et al., 2009; Xia et al., 2016; Zhang et al., 2020) makes its observation challenging. Therefore, underwater imaging is essential for scientists and engineers working in ocean engineering. Currently, the high-resolution imaging equipment named synthetic aperture sonar (SAS) (Gough and Hawkins, 1996; Gough and Hawkins, 1997; Gough and Hawkins, 1998; Zhang and Ying, 2022; Dillon and Steele, 2022; Yang and Liu, 2022) can generate high-resolution images. Compared with traditional imaging sonar, such as side scan and multibeam sonar (Cutrona, 1975), SAS can provide high resolution in the along-track dimension independent of the frequency and detection range. Therefore, the SAS image can be used for seabed mapping (Barclay et al., 2005; Tan et al., 2019) and target detection (Dobeck, 1999; Rankin et al., 1999; Cong et al., 2000; Gough et al., 2006), such as searching for shipwrecks, airplane wrecks (LeHardy and Larsen, 2015), and pipelines (Sæbø et al., 2010).
Synthetic aperture image formation is a crucial technique for the SAS system. The monostatic SAS transmitter is still used as the receiver. The point target reference spectrum (PTRS) can be easily deduced using the stationary phase method. Based on the PTRS of the monostatic SAS, fast imaging algorithms such as the range-Doppler (RD) algorithm (Zhong and Liu, 2006; Neo et al., 2008; Wu et al., 2014; Zhang et al., 2017b), chirp scaling (CS) algorithm (Zhong and Liu, 2009; Zhong and Liu, 2010; Zhang et al., 2013), and range migration algorithm (RMA) (Liu et al., 2009; Shin and Lim, 2009; Zhang et al., 2021c) can be easily designed. For pulsed sonar, a longer detection range in the cross-track dimension requires a larger pulse repetition interval (PRI). However, higher resolution in the along-track dimension requires a lower PRI. Therefore, there is a significant contradiction between the cross-track dimension mapping swath and the along-track dimension resolution.
A multi-receiver synthetic aperture sonar (MSAS) (Rolt and Schmidt, 1992; Gough and Miller, 2003; Zhang et al., 2014a; Zhang et al., 2021c), which includes a single transmitter and many receivers in the along-track dimension, is proposed to solve this problem. MSAS can provide a wider mapping swath at a given resolution than the monostatic SAS system. Unfortunately, the use of the MSAS system involves two major challenges. Firstly, the two-round slant range of MSAS is characterized by double square root terms, which makes it difficult to deduce the PTRS of MSAS based on the stationary phase method (Wang et al., 2008; Wang et al., 2011). Secondly, all of the imaging algorithms have been designed for the monostatic SAS system and cannot be directly used for MSAS systems. To deduce the PTRS based on the stationary phase method, several approximations, including the Taylor approximation of the two-round slant range and Loffeld’s bistatic formula (LBF) (Loffeld et al., 2004; Zhang et al., 2021b), are used.
In addition, the imaging algorithms used for monostatic SAS are further extended to the MSAS system. In general, these extensions can be grouped into two classes. The first involves developing a new algorithm according to the RD, CS, and RMA. This operation often employs the series approximation of PTRS, which is exceedingly tedious. The other involves directly using the monostatic SAS system imaging algorithms after converting the MSAS data into a monostatic SAS-equivalent signal. The second approach is much easier to achieve when comparing the advantages and disadvantages of both methods. The PTRS of MSAS must be decomposed into a quasi-monostatic term and a bistatic deformation term in order to directly use the imaging algorithms designed for monostatic SAS. After compensating for the bistatic deformation term, traditional imaging algorithms can be used directly.
Based on the assumption that the transmitter and the receiver contribute equally to the Doppler phase in the along-track dimension, Loffeld et al. (2004) developed a PTRS (often called LBF) that can be decomposed into a quasi-monostatic term and a bistatic deformation term. The bistatic deformation term of LBF depends significantly on the range, instantaneous frequency, and Doppler frequency. The sub-block processing method (Zhang et al., 2019) in the cross-track dimension is usually exploited to cancel this term; therefore, the sub-block width determines the imaging performance. In other words, a wider sub-block width reduces performance, while a narrower width increases performance. Unfortunately, the use of a narrow sub-block width is time-consuming.
In general, there is a significant contradiction between imaging performance and efficiency when the LBF is used. The phase center approximation (PCA) method (Gough et al., 2000; Gough and Hayes, 2005) supposes an element located at the midpoint between the transmitter and the receiver. This element is equivalent to a monostatic transducer used for signal transmission and reception. However, this operation results in an approximation error, called the PCA error (Zhang et al., 2021a). Traditional methods do not compensate for this approximation error, and image distortion is introduced at a close range. Some methods neglect the stop-and-hop error (Zhang et al., 2017a; Zhang et al., 2018), seriously affecting long-range SAS imaging results.
This paper presents an imaging method based on the PCA method. Firstly, the two-round slant range was approximated by the second-order Taylor approximation and inverse Taylor approximation. Then, the slant range equivalent to the traditional monostatic SAS was obtained. Because the PTRS of the monostatic SAS can be easily obtained, the stationary phase method was exploited to deduce the PTRS of MSAS, including the quasi-monostatic and bistatic deformation terms. After compensating for the bistatic deformation term, the MSAS data were converted into monostatic SAS-equivalent data, considered the input to the RD algorithm in this paper. Lastly, simulations were performed to validate the proposed method. The remainder of this paper is organized as follows. Section 2 discusses the imaging geometry. Section 3 describes the proposed method. In Section 4, the simulations are described in detail. Finally, the last section summarizes the conclusions of this study.
2. MSAS imaging geometry
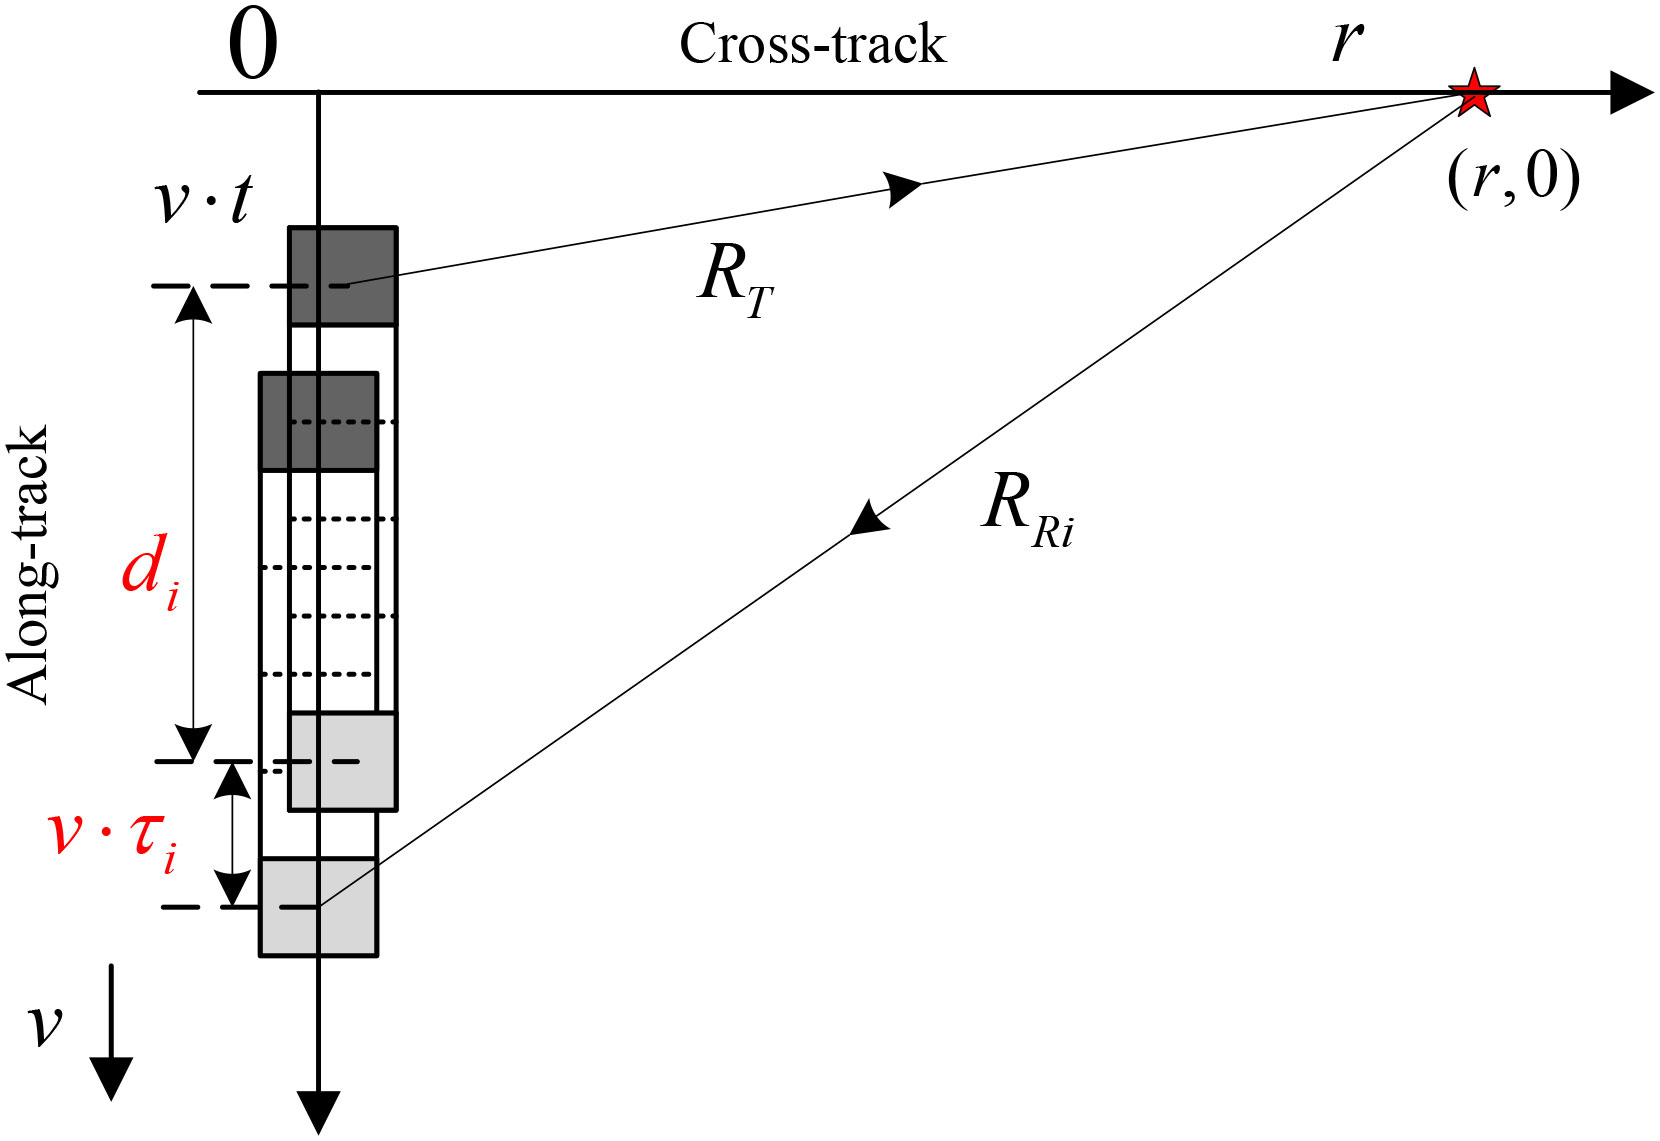
Figure 1 shows the MSAS imaging geometry. The sonar system is towed in the along-track direction, and the horizontal axis is in the cross-track direction. The fast time is denoted by τ and the slow time by t. An ideal target was assumed in this imaging scenario. The coordinate in the cross-track dimension is r, while that in the along-track dimension is 0. The transmitter and receiver arrays were deployed in the along-track dimension, where the black rectangle is the transmitter and the remaining rectangles are the receivers, which were uniformly spaced at equal distances. The distance between the transmitter and the ith receiver is di, where i ( i∈[1,M] ) is the receiver index. M is the total number of receivers.
Based on Figure 1, the two-round slant range between the transmitter to the target and back to the ith receiver is
In Equation 1, is the distance between the transmitter and the target. The distance between the target and the ith receiver is denoted by , where v is the velocity of the sonar platform and c is the sound velocity in water. Traditional methods neglect the stop-and-hop approximation (Zhang et al., 2017a) on the SAS system because traditional SAS systems work with low resolution and narrow mapping swath. A lot of high-resolution SAS systems with wide mapping swaths are currently being developed. If the stop-and-hop error is neglected, distortions such as higher side lobes and along-track shifting are introduced into the SAS image. Compared with the traditional signal model, Equation 1 considers the influence of the stop-and-hop approximation (Zhang et al., 2017a) on the SAS system.
The SAS system often uses a chirp signal. The received signal of the ith receiver is given by
In Equation 2, the transmitted chirp is denoted by p(τ) . The beam pattern of the SAS system is denoted by ωa(t) . Because ωa(t) does not affect the SAS focusing, it is suppressed in the following discussions. The carrier frequency is fc . Because the two-round slant range in Equation 1 has two square root terms, it is challenging to deduce the PTRS of MSAS using the stationary phase method.
3. MSAS imaging algorithm
3.1. MSAS PTRS
The PTRS (Wu et al., 2011) should be obtained first to develop the MSAS imaging algorithm. Based on Equation 1, the second-order Taylor expansion is used, and the result is
With the inverse Taylor expansion, Equation 3 can be further reformulated as
The square root term in Equation 4 is similar to the slant range of the monostatic SAS system. The second term in Equation 4 denotes the error introduced by PCA and the stop-and-hop approximation. With the second term in Equation 4 compensated by the preprocessing, the following work focuses on the MSAS data using the traditional imaging algorithms of a monostatic SAS system.
The current work deduces the PTRS. Starting with Fourier transformation (FT) in the cross-track dimension for the echo signal (Equation 2),
In Equation 5, P(fτ) is the spectrum of the transmitted chirp signal. The instantaneous frequency is denoted by fτ . Performing an FT in the along-track dimension for Equation 5,
In Equation 6, the Doppler frequency is denoted by ft , and the synthetic aperture time is represented by Ts . The exponential phase in Equation 6 is further denoted by
Performing the stationary phase method (Wang et al., 2009) on Equation 7 yields
In Equation 8, the stationary point is denoted by ti . Based on Equation 4, Equation 8 is then reformulated as
The solution to Equation 8 is expressed as
Substituting Equation 10 into Equation 7, we obtain the PTRS phase given by
Inspection of Equation 11 reveals that the first term is similar to the PTRS of traditional monostatic SAS. The spatial sampling of each receiver causes the second term. The third term denotes the azimuthal shifting caused by the stop-and-hop approximation. The last term is the Doppler error and micro-range migration caused by the PCA and stop-and-hop errors. Based on the idea of the monostatic conversion-based method, the phase error related to the displaced distance, di , is the bistatic deformation term, which is
The remaining phase denotes the quasi-monostatic term given by
Subsequently, Equation 11 can be further reformulated as
It is apparent from Equation 14 that the MSAS imagery can be converted into monostatic SAS focusing after compensating for the bistatic deformation term, Ψi(fτ,ft;r;di) .
3.2. MSAS imagery
The MSAS imagery includes two primary operations. The first operation compensates for the bistatic deformation term, Ψi(fτ,ft;r;di), and is called preprocessing. The second operation conducts the MSAS data focusing based on the quasi-monostatic term.
The compensation of the bistatic deformation term is now discussed. The first step is the compression in the cross-track dimension. The matched filtering function is written as
In Equation 15, the superscript asterisk denotes the complex conjugate operation.
The second step is the compensation of the Doppler phase, the first term in Equation 12, in the two-dimensional (2D) time domain. The filtering function is expressed as
The second step corrects the micro-range migration, the second term in Equation 12, which is caused by the PCA and stop-and-hop errors. From Equation 12, the micro-range migration in the 2D time domain corresponding to the second term in the 2D frequency domain is given by
The term shown in Equation 17 is range-variant. Interpolation is exploited to correct the micro-range migration.
The third step of the preprocessing operation compensates for the spatial sampling error, the last term in Equation 12. This can be achieved by a complex multiplication in the cross-track time, along-track Doppler domain. The filtering function is expressed as
The last step is the recovery of the chirp characteristic. Filtering is conducted in the cross-track frequency domain, and the filtering function directly uses the spectrum of the transmitted signal.
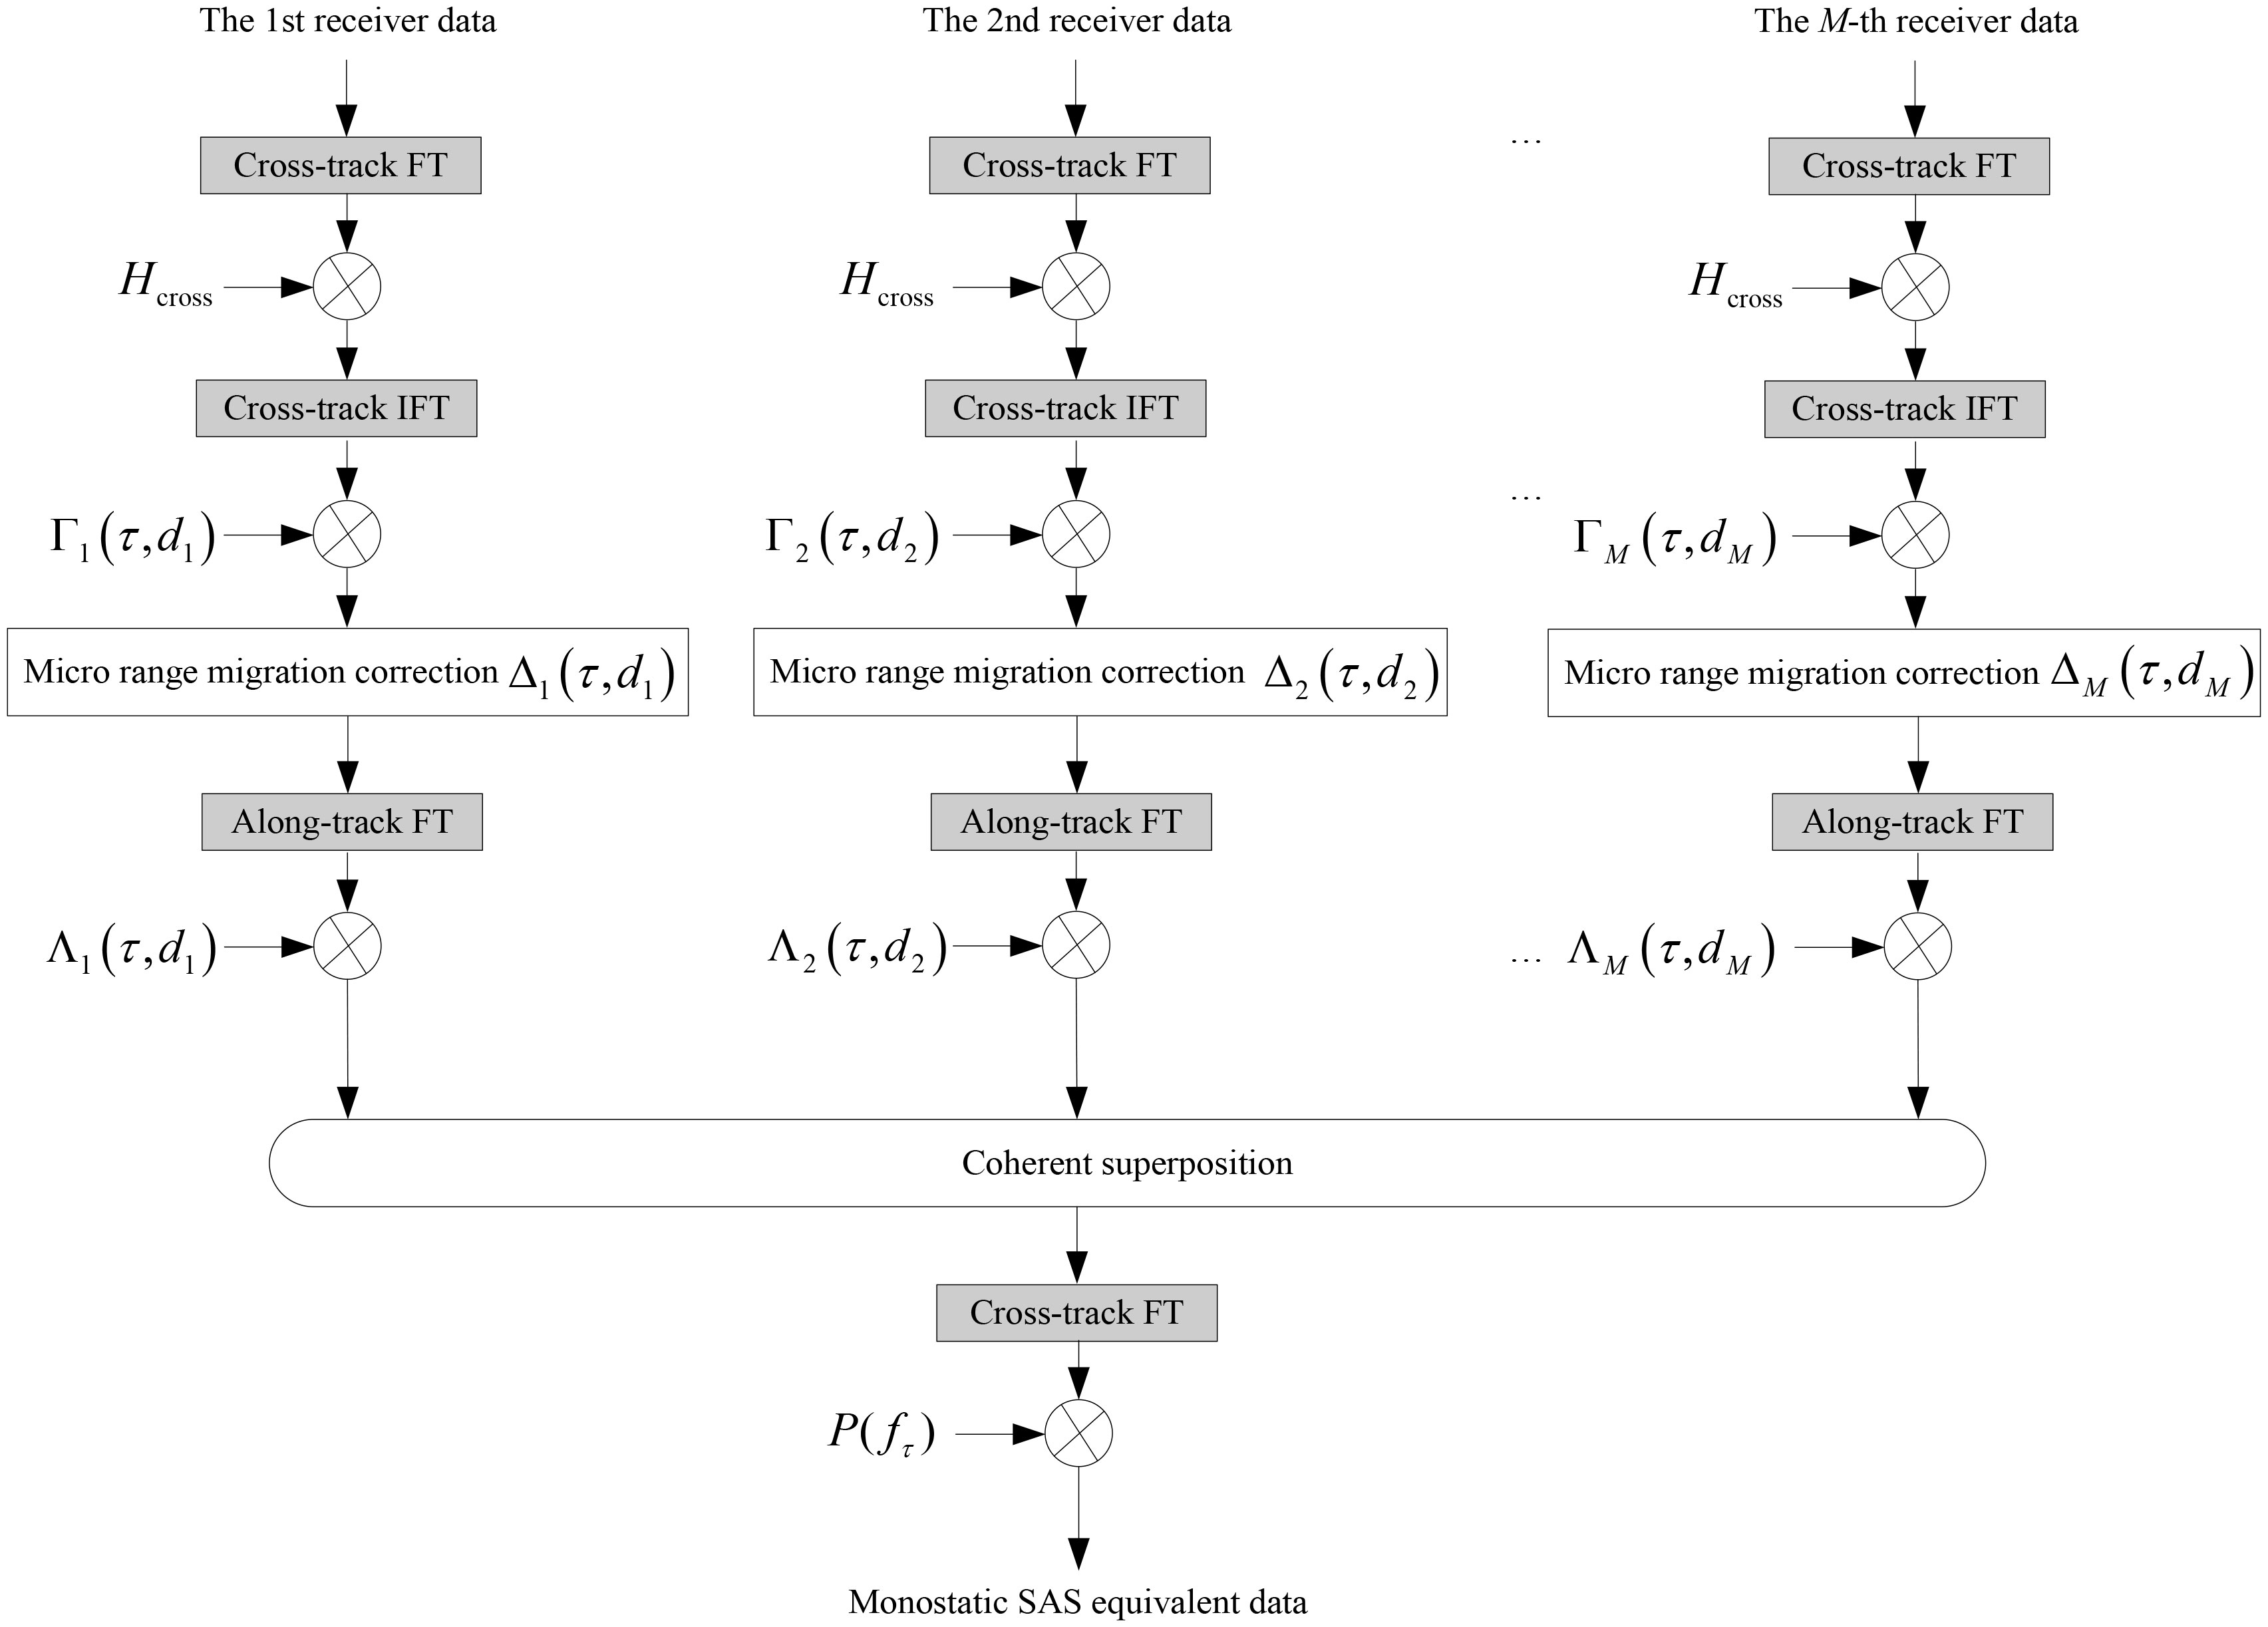
A block diagram of the preprocessing operation is depicted in Figure 2 based on the steps discussed above.
After conducting the preprocessing operations, the remaining work involves MSAS focusing using the RD algorithm based on the quasi-monostatic term in Equation 13. The use of the RD algorithm is enabled by approximating the first term in Equation 13 by the second-order Taylor expansion. After the series approximation, Equation 13 is reformulated as
Where
The first term in Equation 19 denotes the along-track modulation, the second term is the range migration, and the third term denotes the cross-track modulation. The last term is the along-track shifting.
The first step in the RD algorithm requires performing the cross-track compression in the 2D frequency domain based on the third term in Equation 19. Because the third term in Equation 19 is slightly range-variant, this term can be compensated using the sub-block processing method (Zhang et al., 2019). For the nth sub-block, the filtering function is expressed as
Where
In Equation 21, the subscript n ( n∈[1,N] ) is the sub-block index and N is the total number of sub-blocks. In Equation 22, γ is the chirp rate of the transmitted signal and rn is the center range of the nth sub-block. In practice, Equation 21 is also called the secondary range compression (SRC), which is range-variant. To some degree, the phase error within each sub-block width should not exceed π/16 , and this can be expressed as |γe(ft;rn)−γe(ft;rn±0.5Δr)|<π/16 , where Δr is the sub-block width. The sub-block width can be easily determined with this method. In general, the SRC depends on the range, to some extent. The data can now be coarsely segmented into several sub-blocks in the cross-track dimension.
The second term in Equation 19 denotes the range migration, which can be corrected by interpolation in the range-Doppler domain. Based on the second term in Equation 19, the range migration in the cross-track time, along-track Doppler domain is denoted by
After this step, the coupling between the cross-track and along-track dimensions can be decoupled. Subsequently, the along-track compression can be performed based on the first term in Equation 19. The matched filtering function in the along-track dimension is denoted by
The last step involves correcting the along-track shifting based on the last term in Equation 19. The filtering function is given by
Correction of the along-track shifting can also be carried out with the along-track compression. A block diagram based on the RD algorithm discussed above is shown in Figure 3.
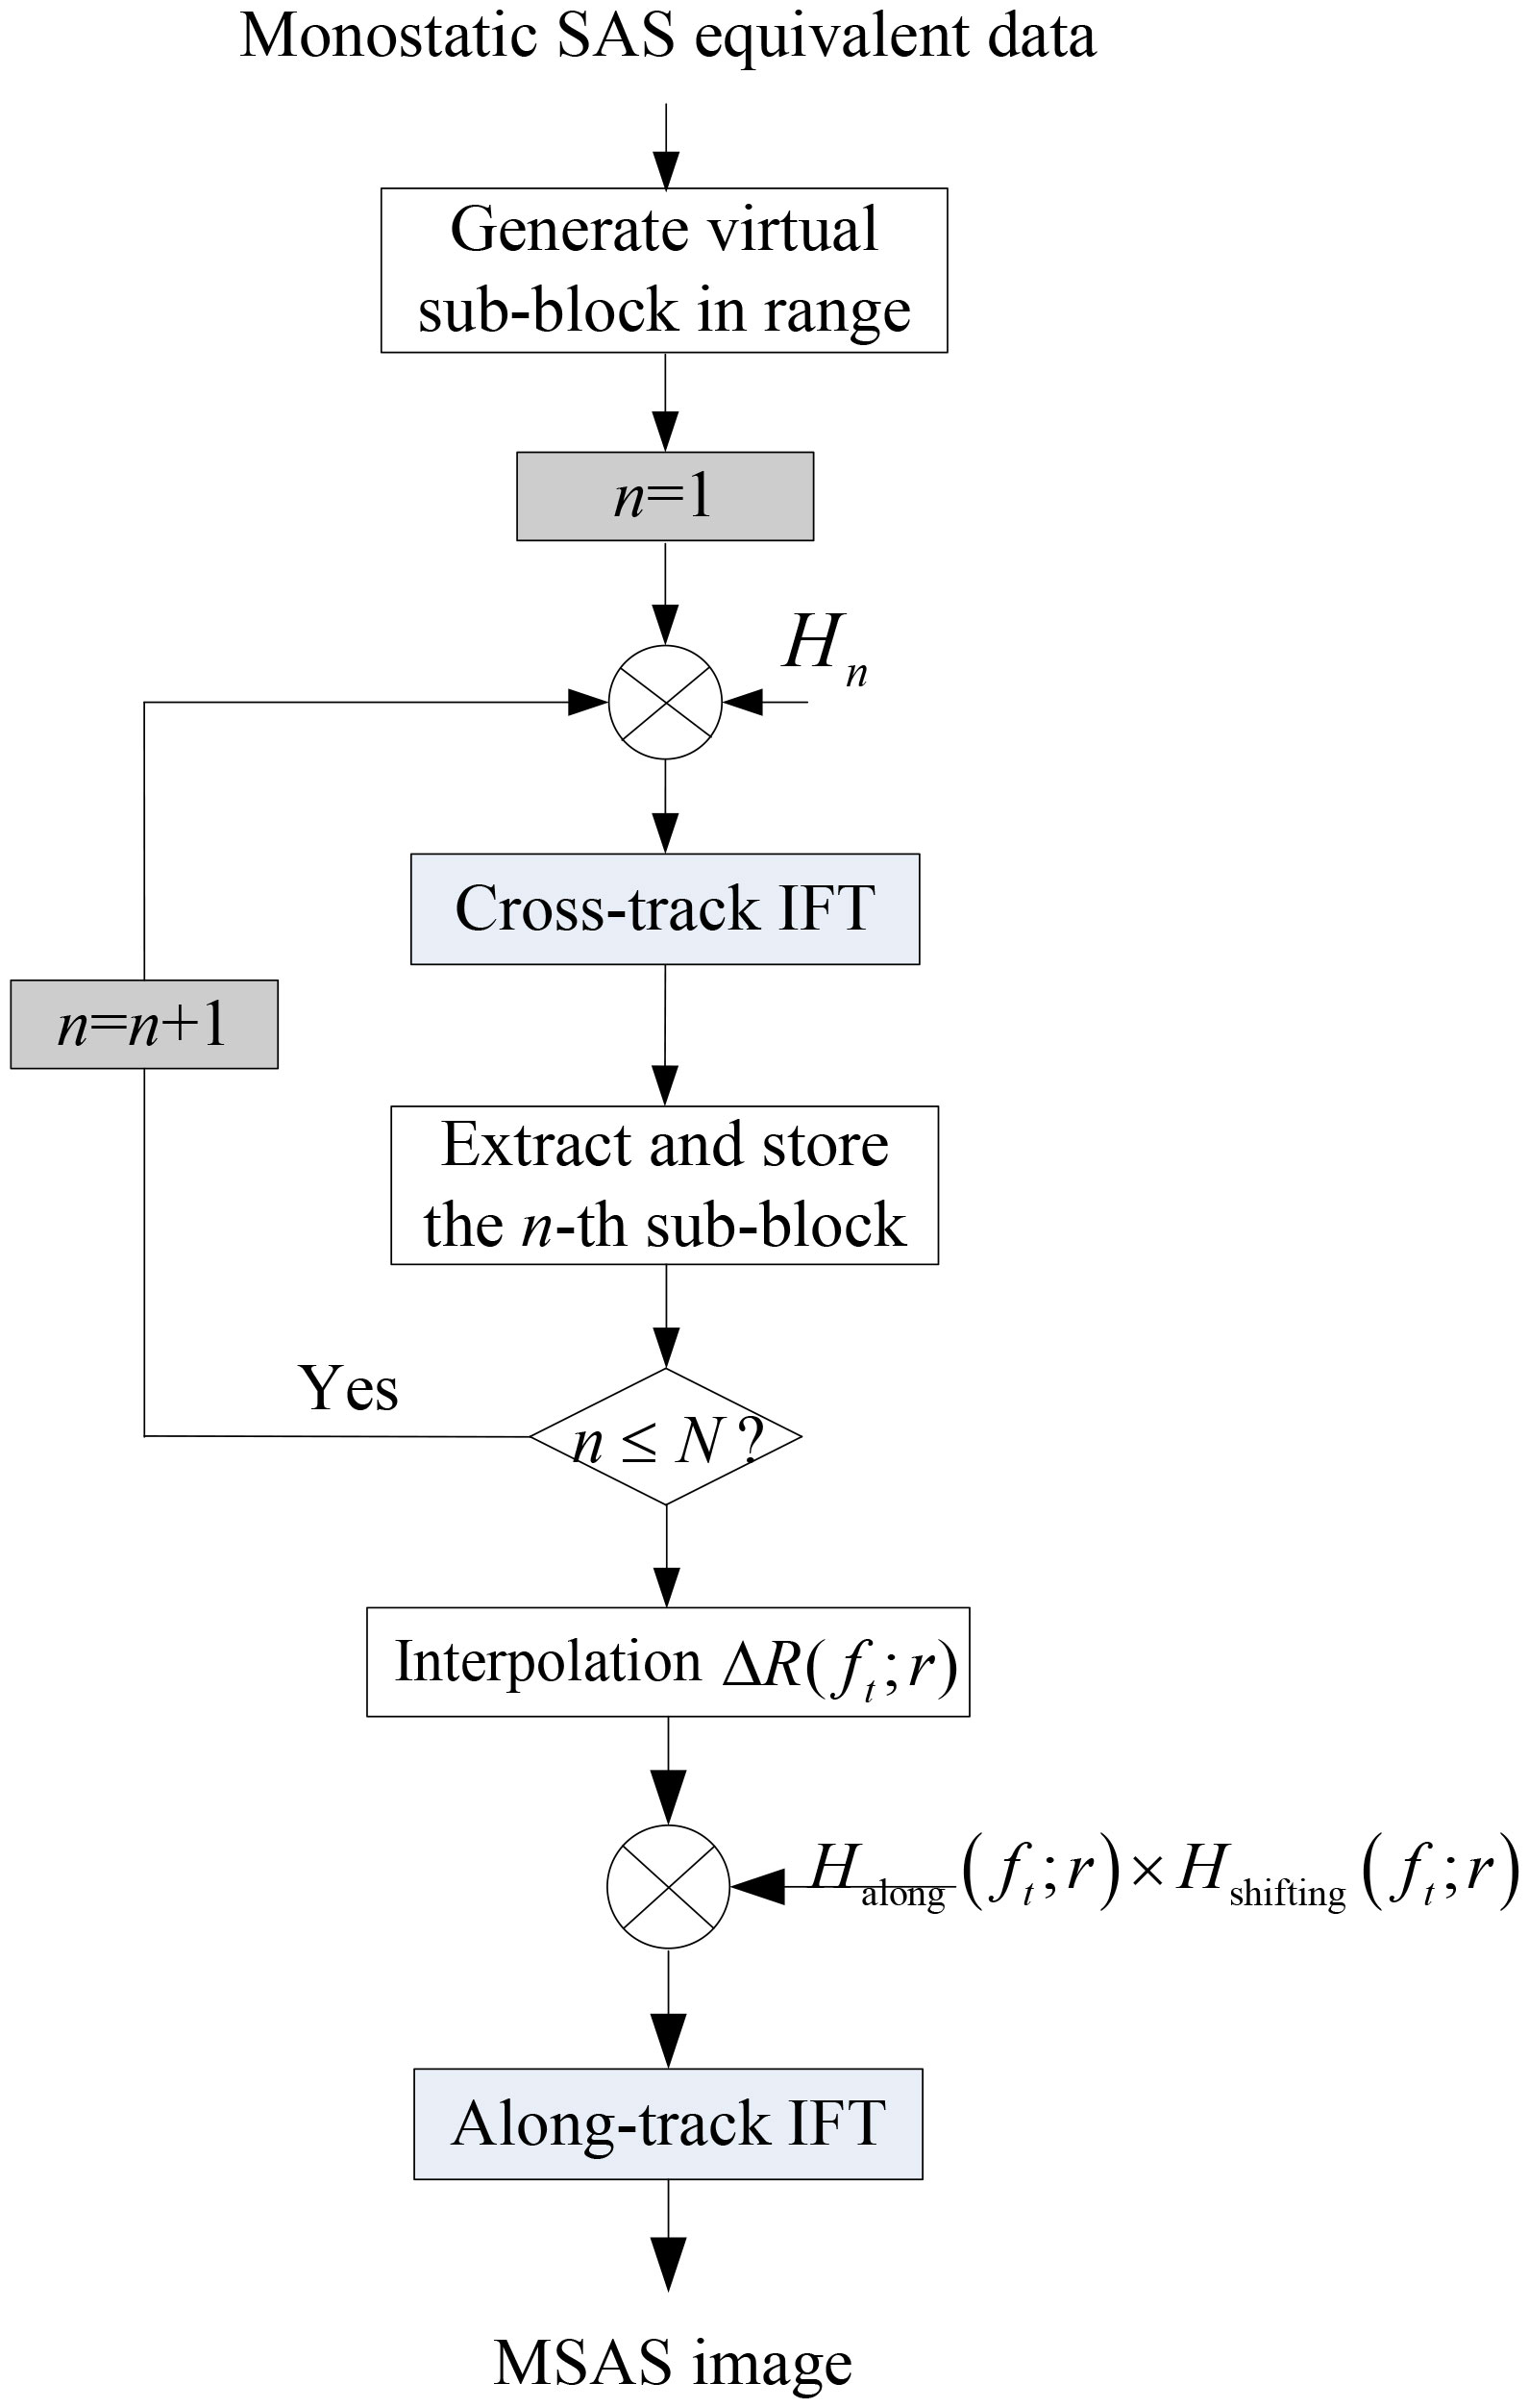
Figure 3 Block diagram of the multiple-receiver synthetic aperture sonar (MSAS) range-Doppler (RD) algorithm.
4. Simulation results
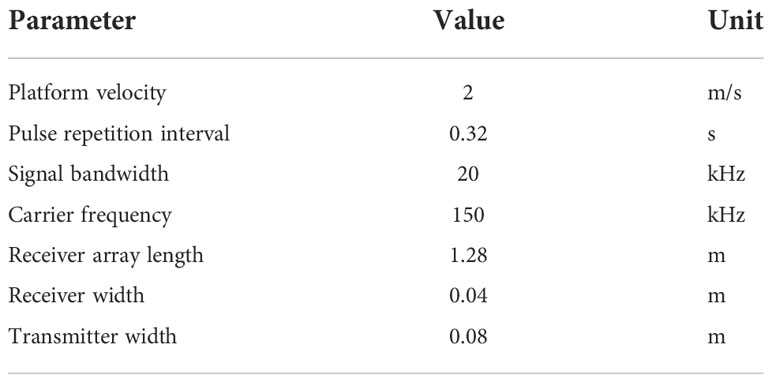
The simulations presented in this section validate the proposed method. The MSAS parameters are listed in Table 1, which indicates that there are 32 receivers.
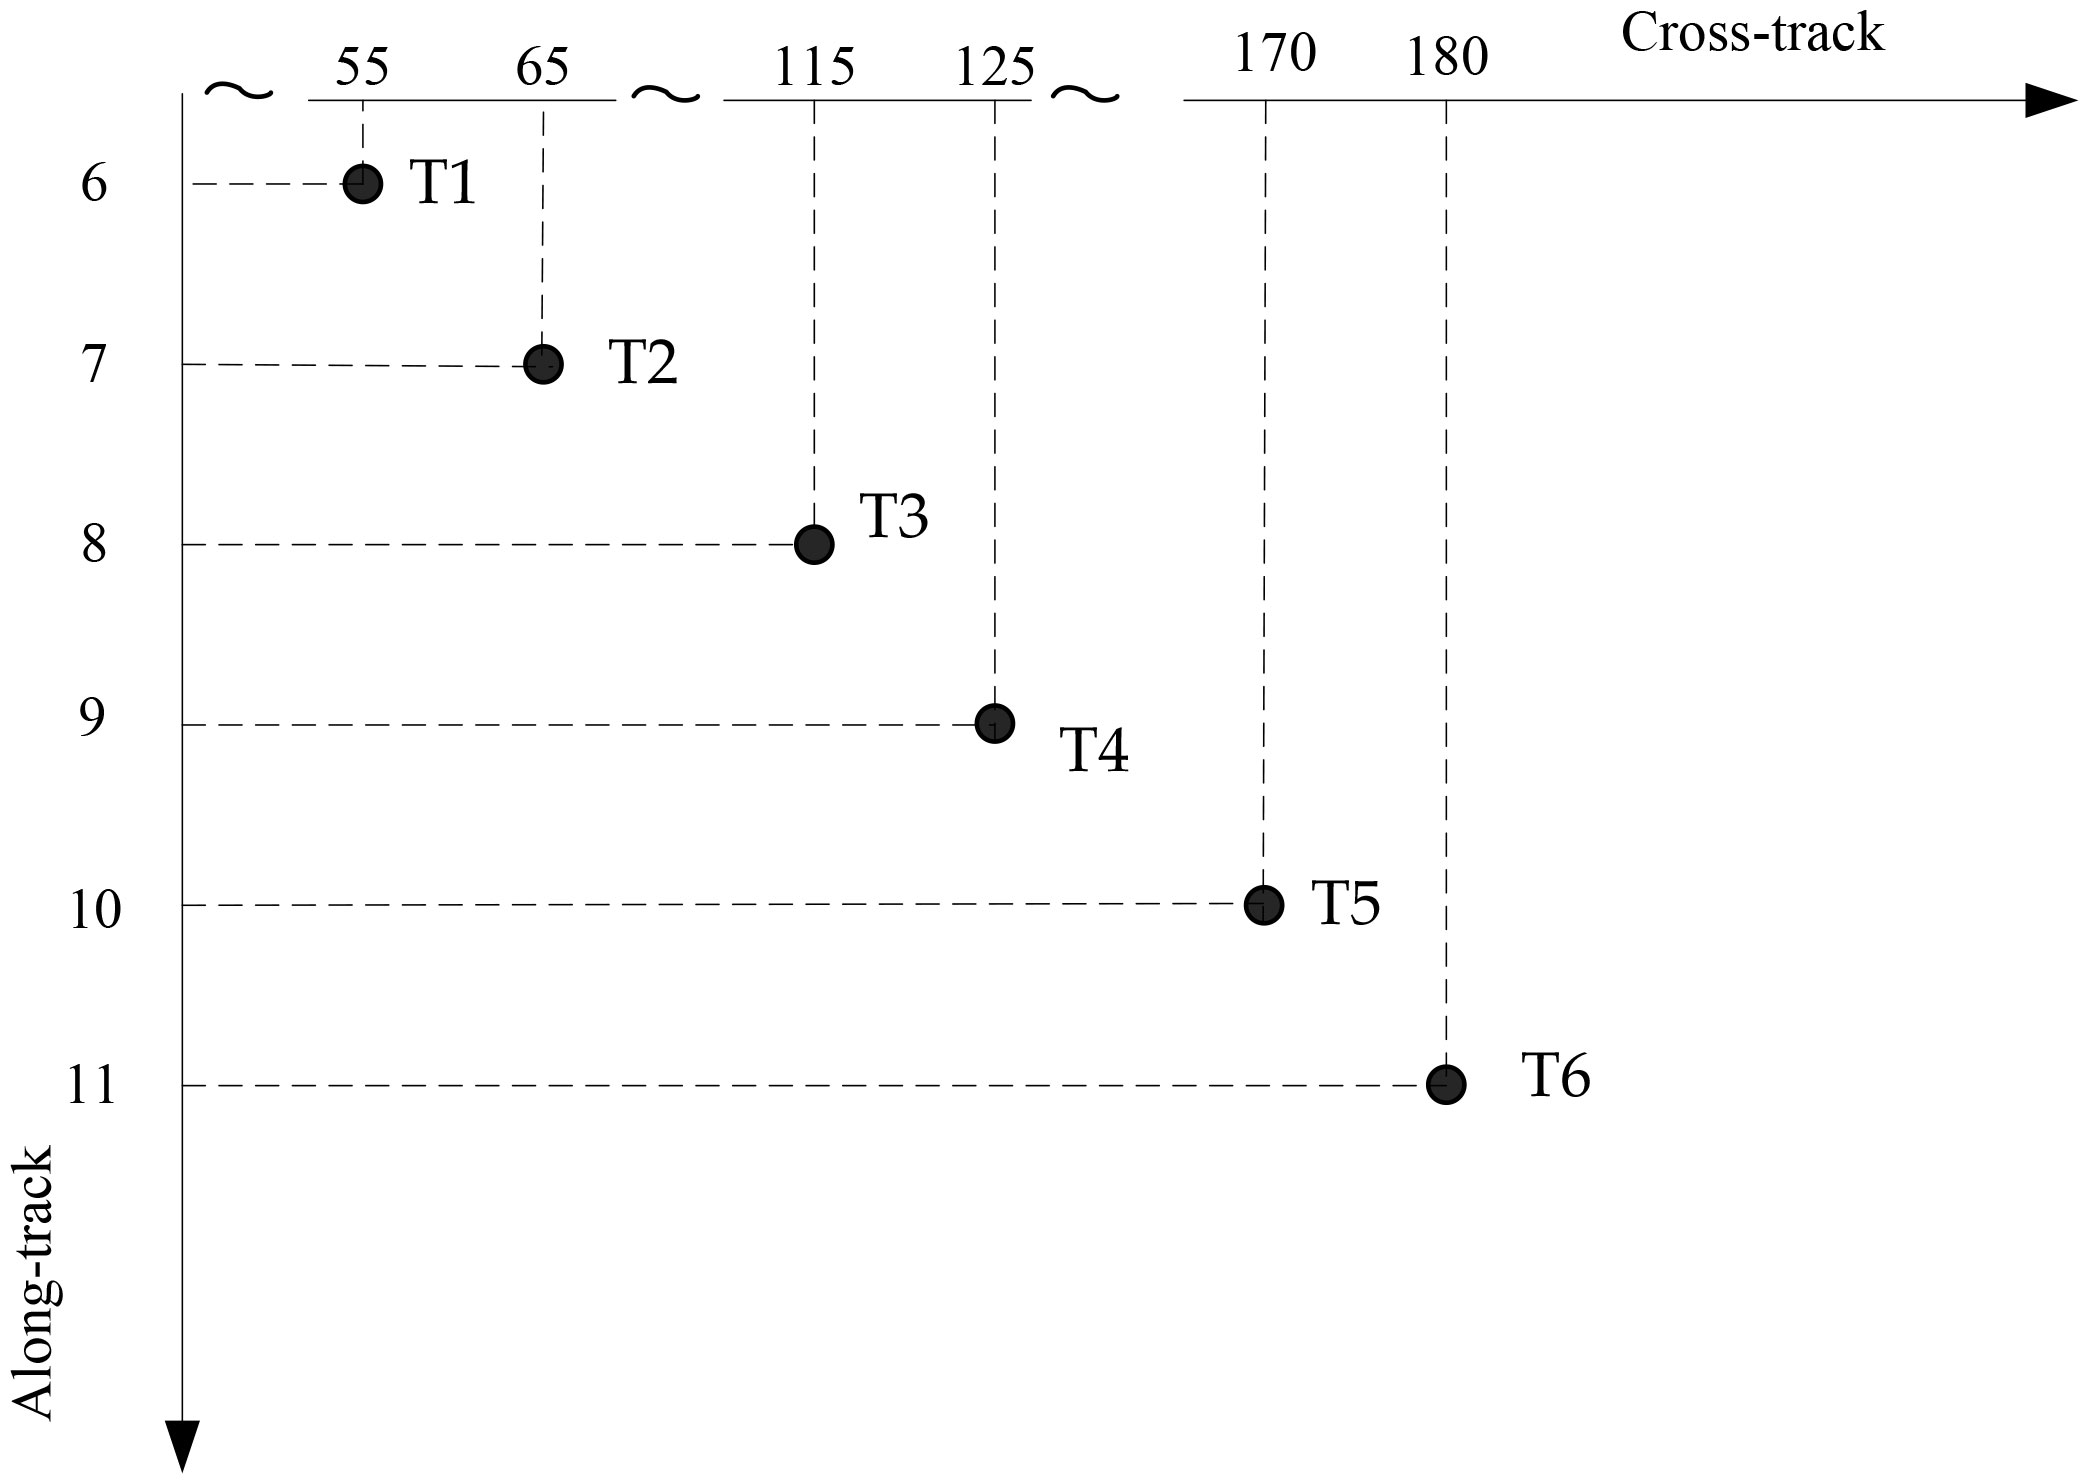
There are six ideal point targets in the imaging scenario depicted in Figure 4. These targets are numbered T1, T2, …, and T6 to simplify the description.
The back-projection (BP) algorithm (Zhang et al., 2014b; Wang et al., 2015) can provide high-performance results based on the interpolation theory and is therefore used as the benchmark. After focusing the simulated MSAS data, the imaging results from the proposed method are shown in Figures 5A, B shows the results from the BP algorithm. Comparing the imaging results of the proposed method to those of the BP algorithm (Zhang et al., 2014b), it can be seen that the performance of the proposed method is very similar to that of the BP algorithm, indicating that the proposed method can accurately reconstruct the targets.
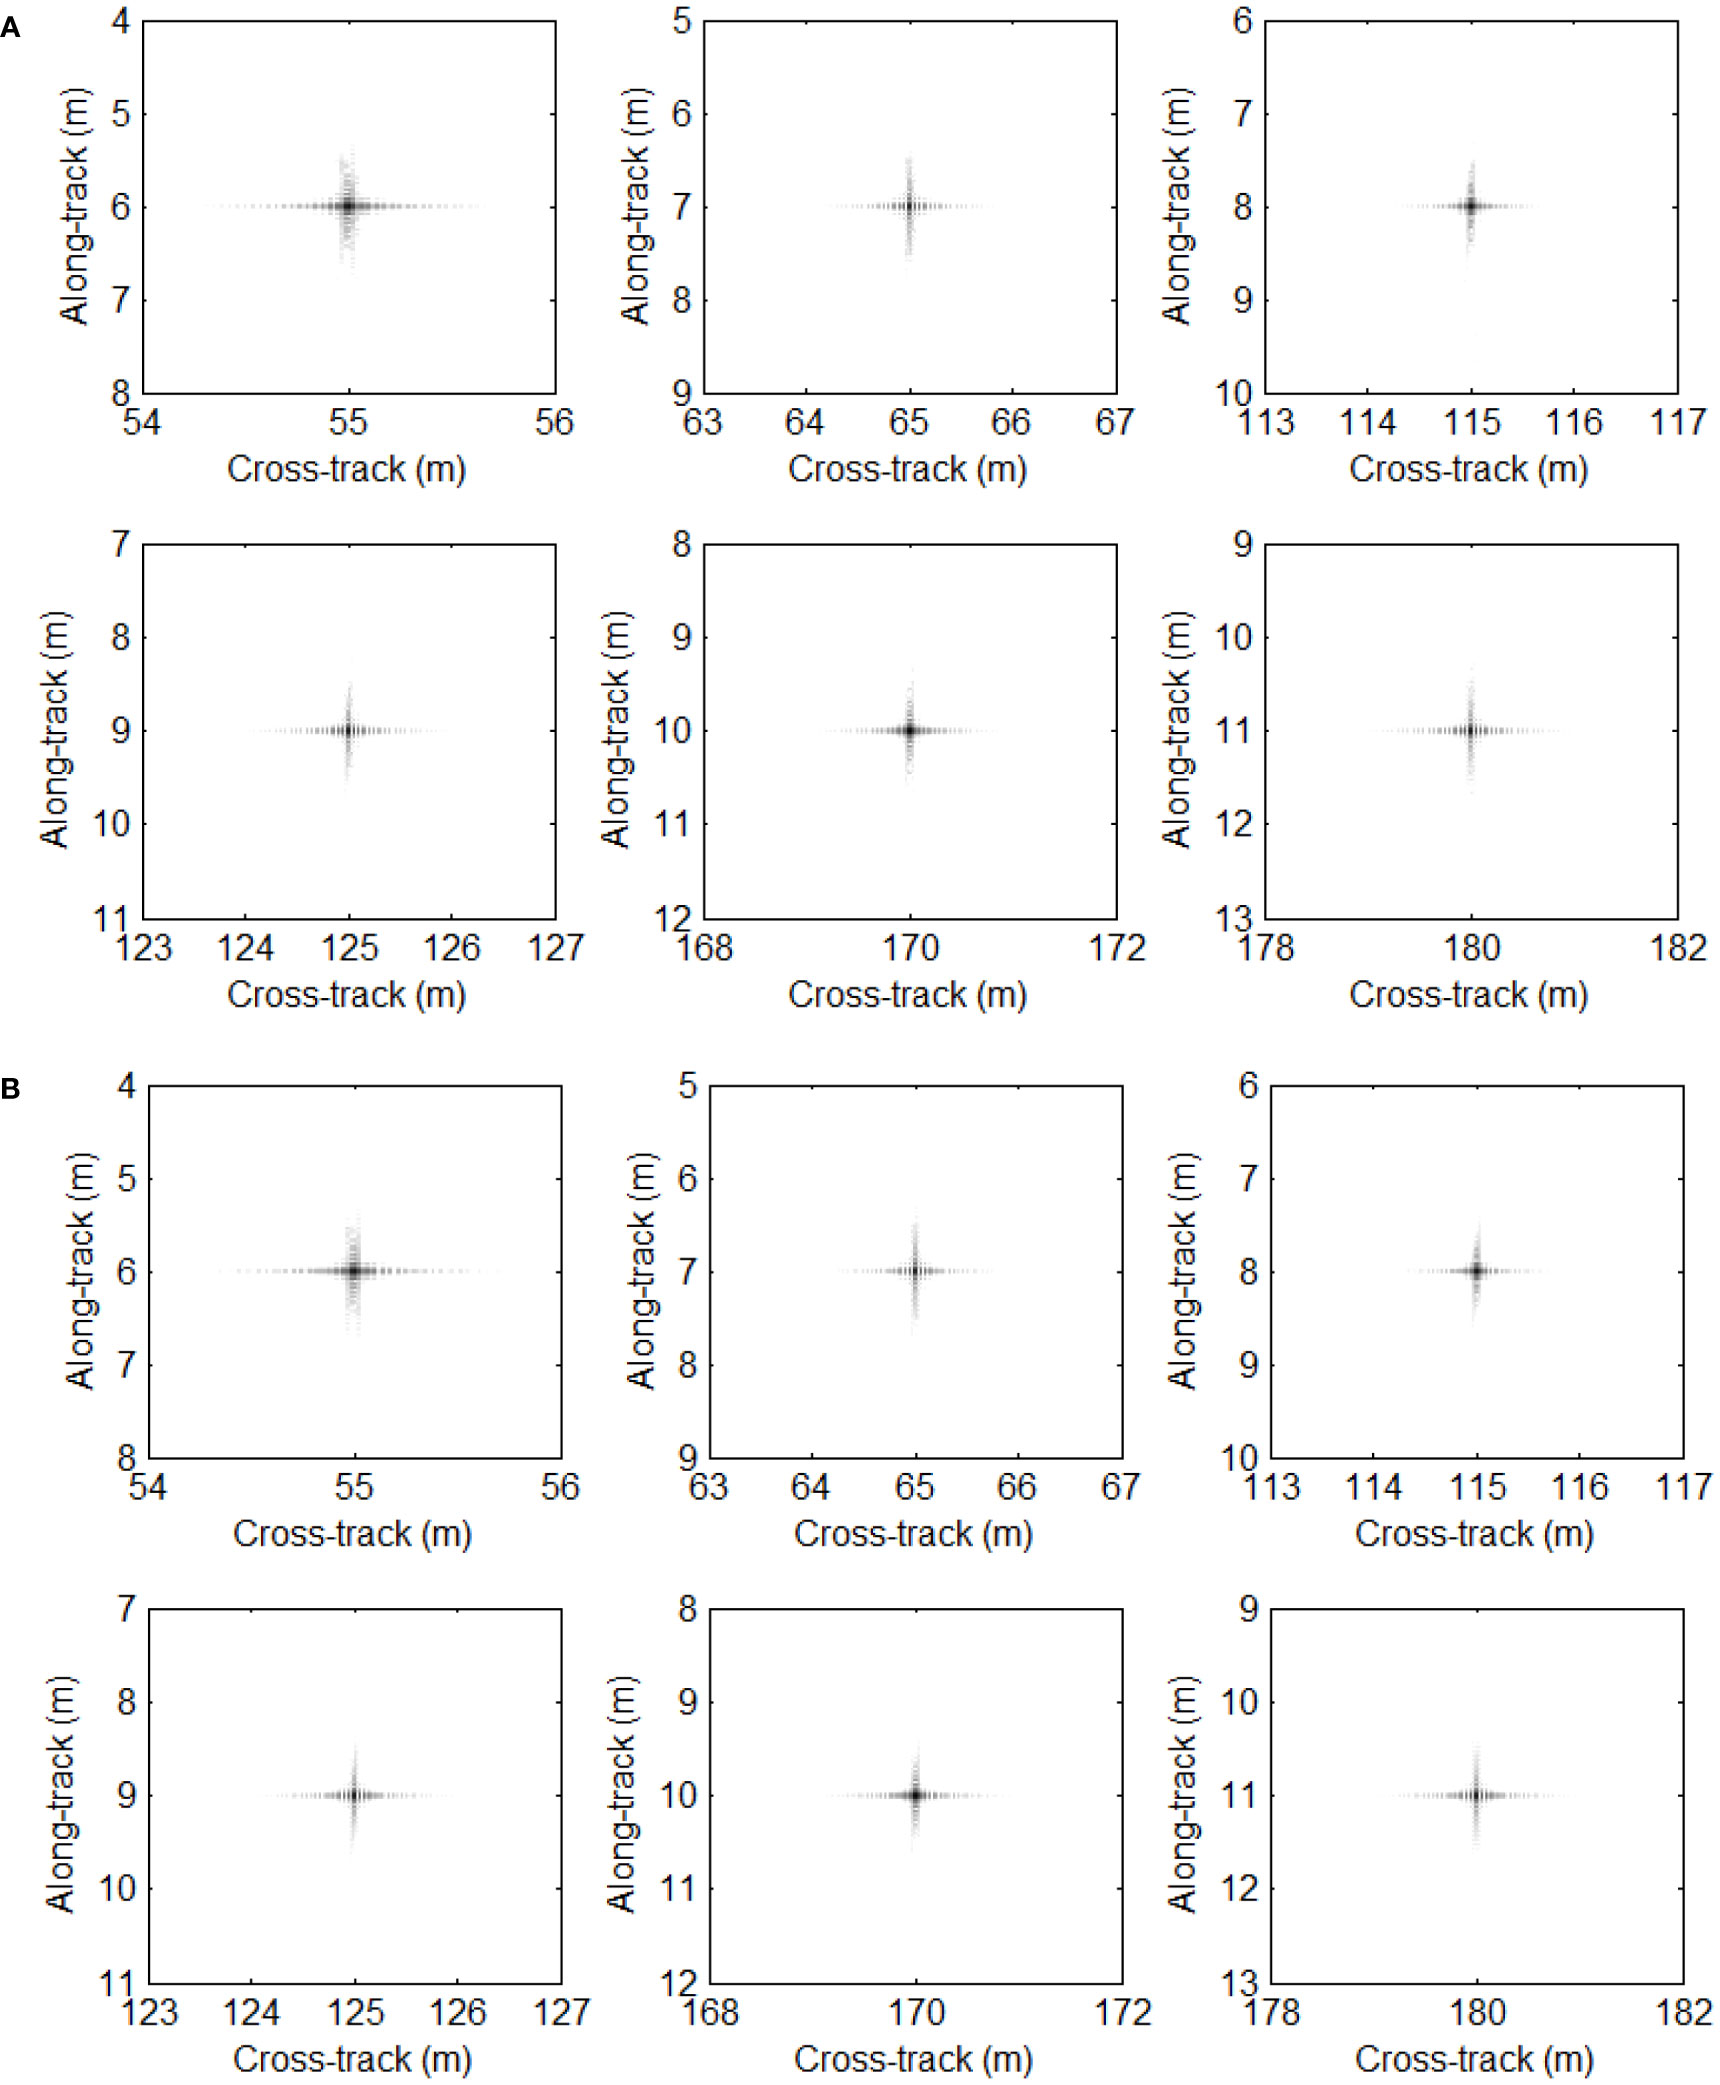
Figure 5 Imaging results using simulated data. (A) Proposed method. (B) Back-projection (BP) algorithm.
The along-track slices are shown in Figure 6. It is readily apparent that the along-track slices of the present method agree well with the slices from the BP algorithm. These results further confirm our conclusion that the present method can accurately recover the targets.
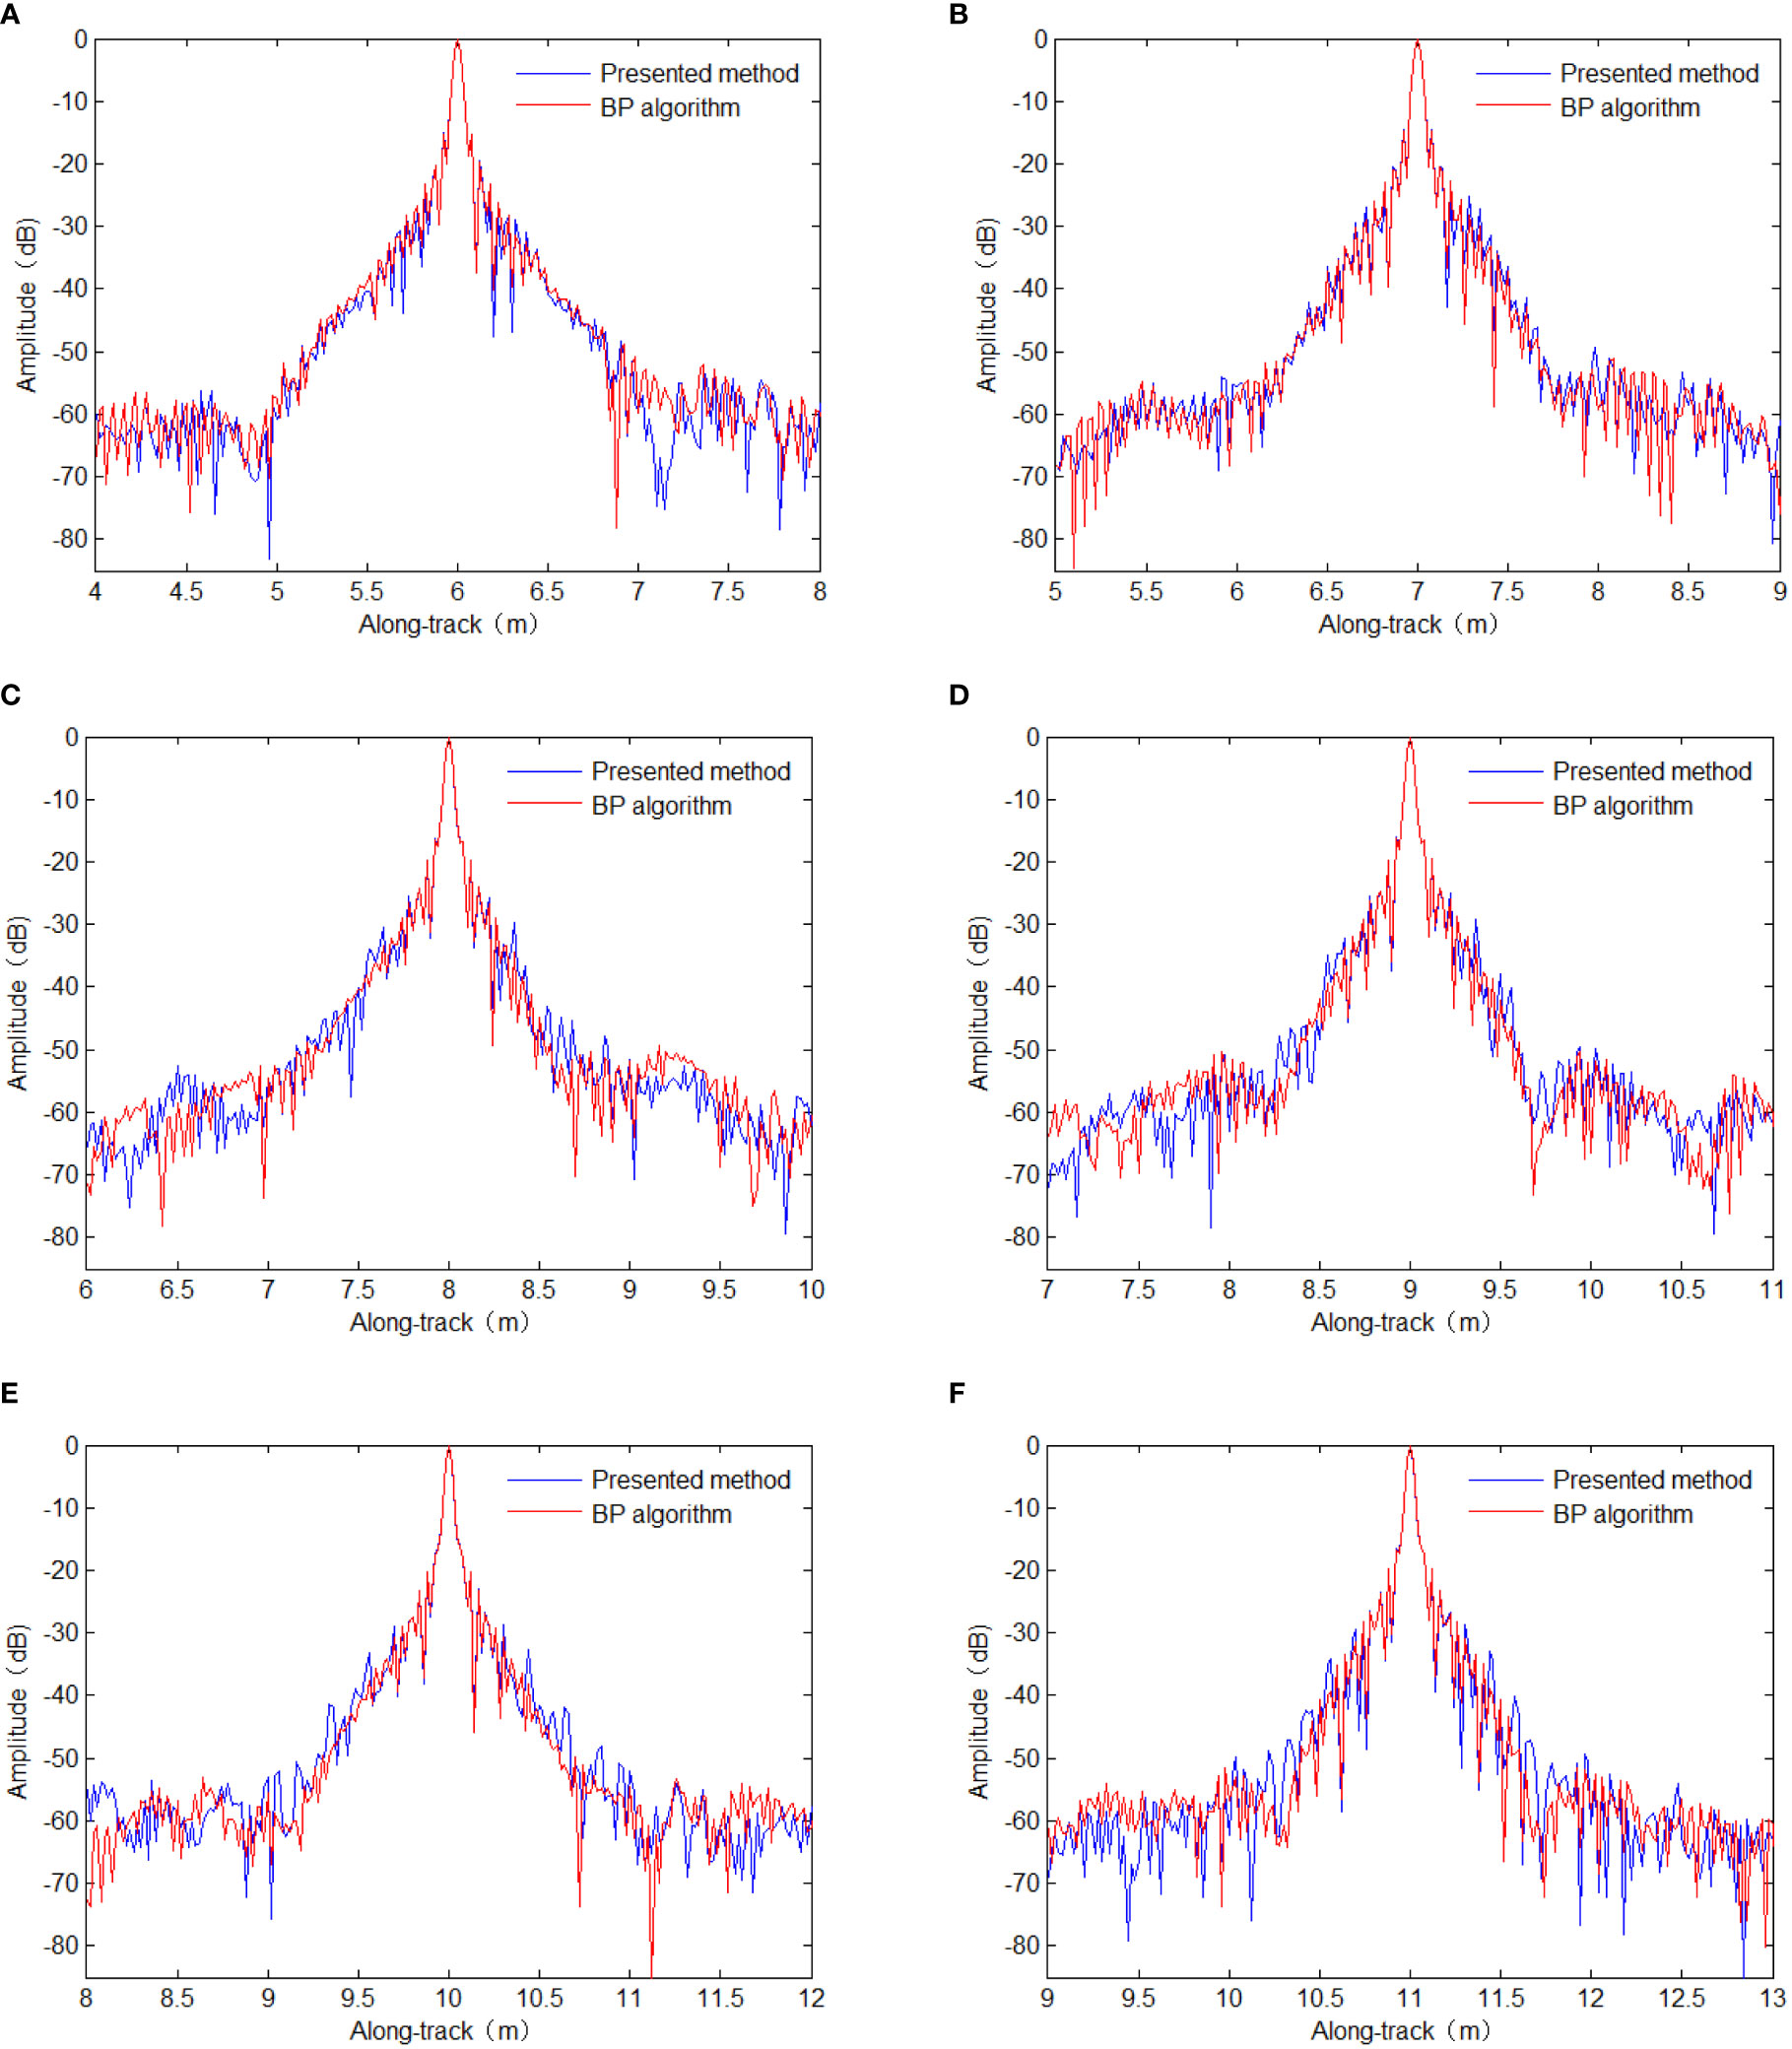
Figure 6 Along-track slices of the focused targets. (A) T1. (B) T2. (C) T3. (D) T4. (E) T5. (F) T6. BP, back-projection.
Figure 7 shows the along-track resolution and peak side lobe ratio (PSLR) of the focused targets. These results show that the proposed method can obtain high-resolution imaging results consistent with those of the BP algorithm.
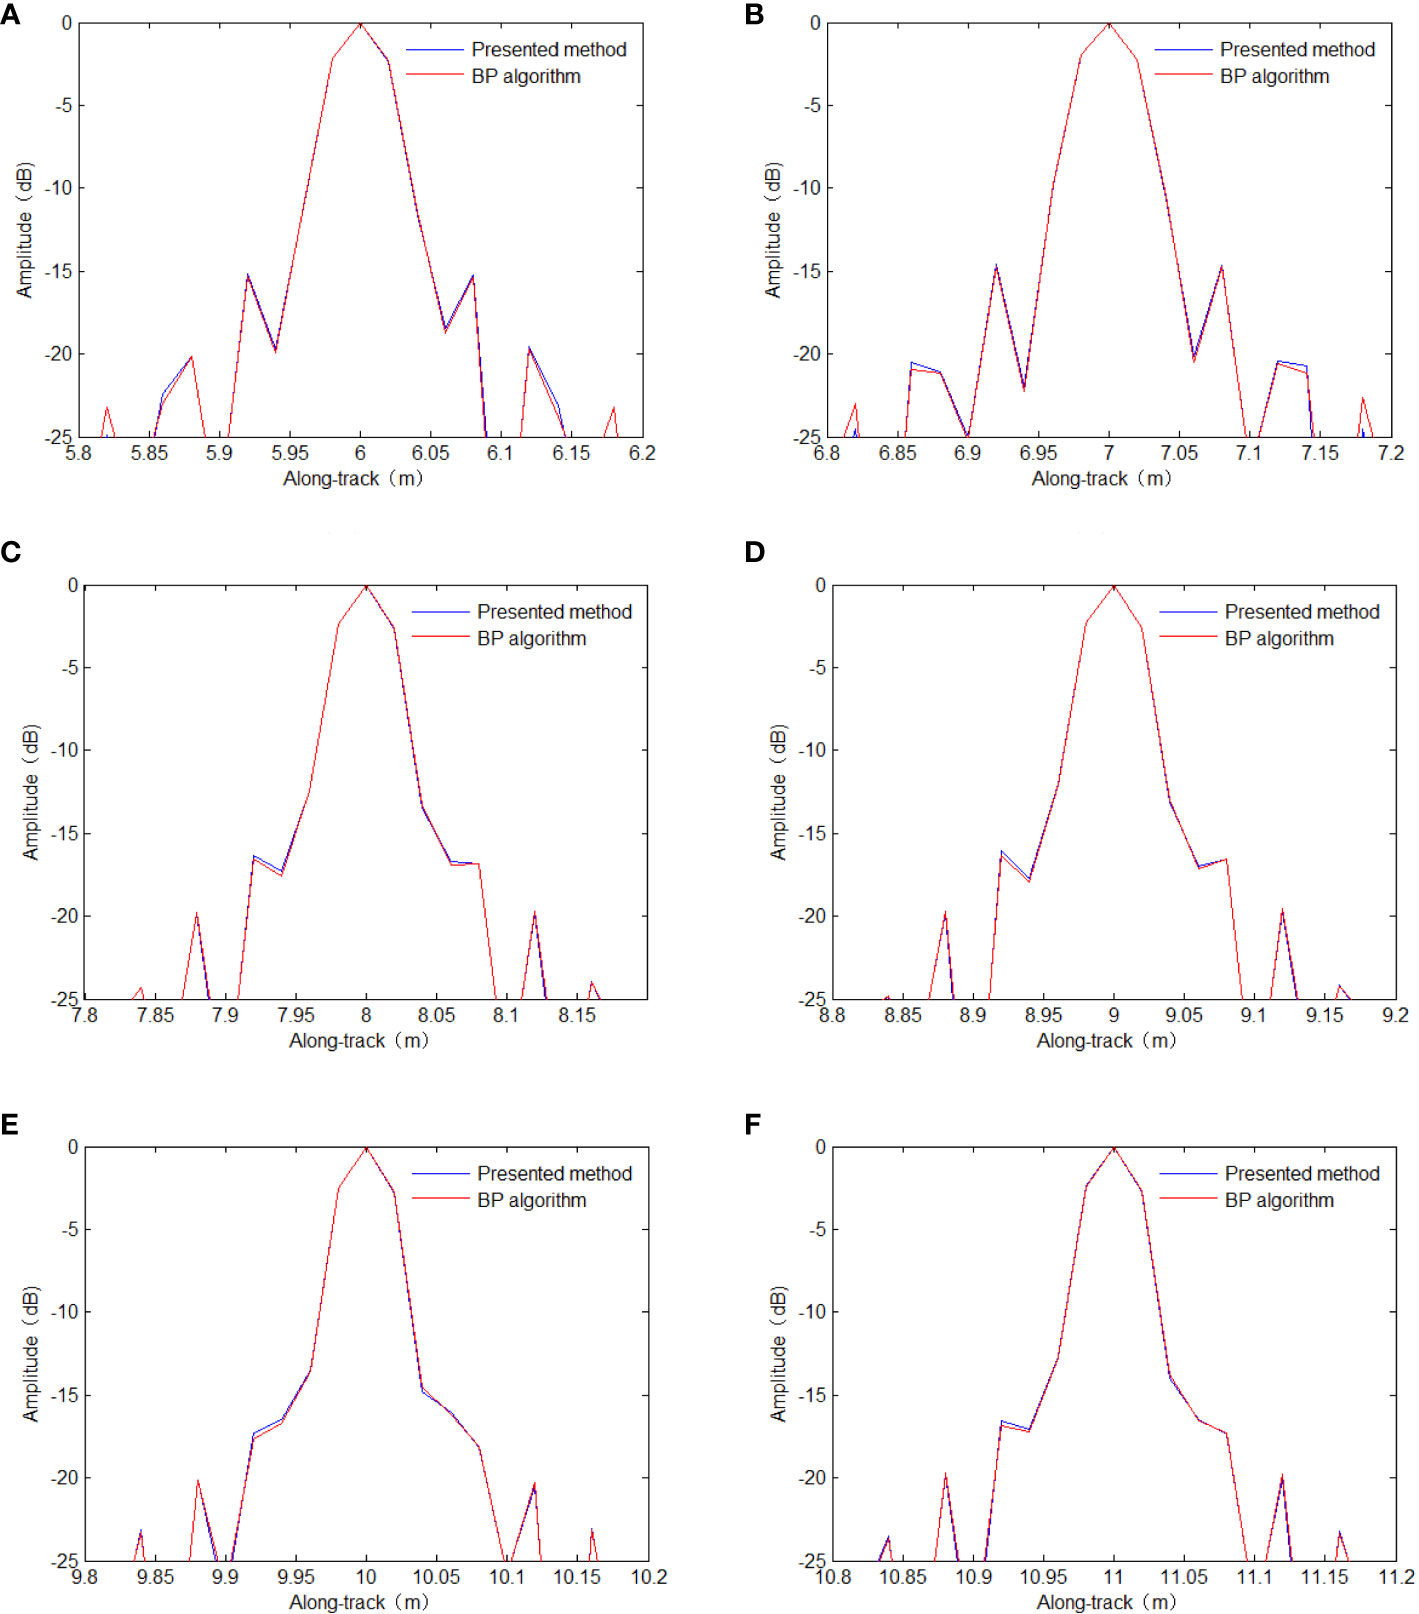
Figure 7 Along-track resolution. (A) T1. (B) T2. (C) T3. (D) T4. (E) T5. (F) T6. BP, back-projection.
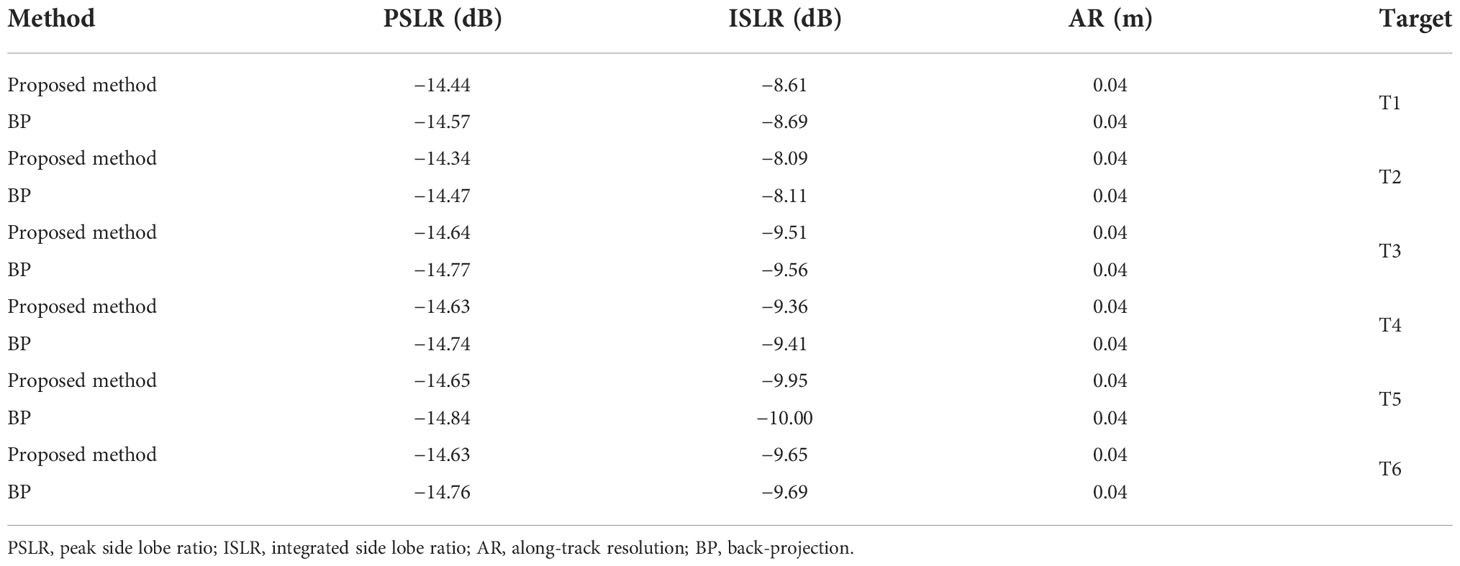
The PSLR, integrated side lobe ratio (ISLR), and the along-track resolution (AR) were calculated to further evaluate the imaging performance of the proposed method. The quality parameters of the proposed method are listed in Table 2, indicating that the difference in the PSLRs between the proposed method and the BP algorithm was about 0.19 dB. The difference in the ISLRs between the proposed method and the BP algorithm was about 0.08 dB. The degradation in the quality parameters was very modest, and the performance loss can be neglected. Both methods obtained essentially the same along-track resolution. Therefore, it can be concluded that the proposed method can focus the targets well. Furthermore, the proposed method can obtain high-resolution imaging results similar to those of the BP algorithm.
5. Processing results for real data
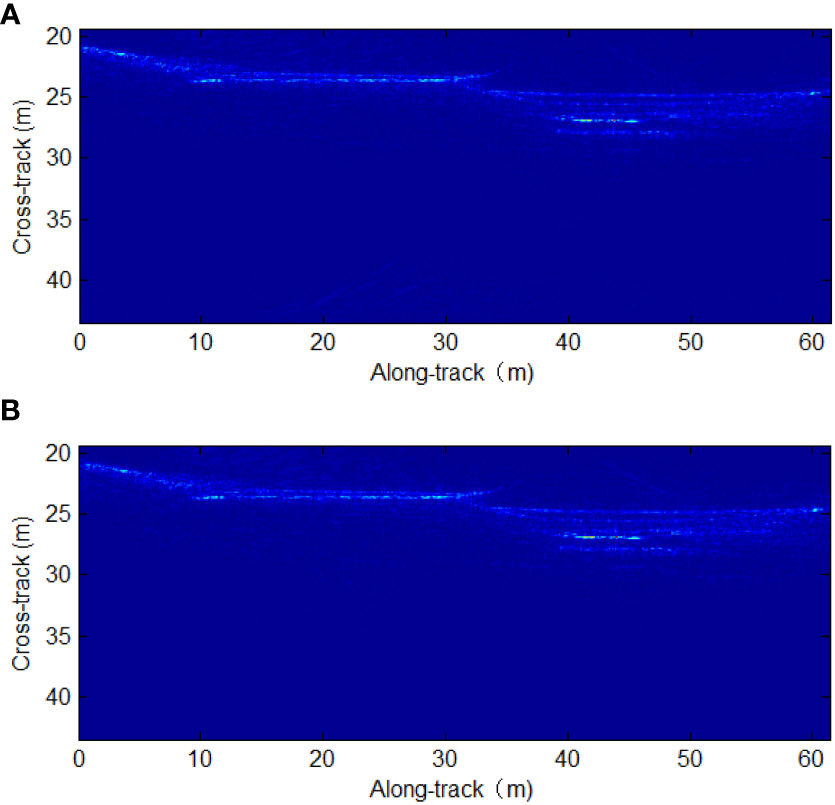
In this section, real data were used to verify the proposed method. The real data included 800 sampling points in the range dimension. Because the BP algorithm is considered precise, the BP results were again used as the benchmark. Figure 8A depicts the results of the proposed method, while Figure 8B shows the results of the BP algorithm. It can be observed that the proposed method can obtain nearly the same results as the BP algorithm.
Table 3 lists the processing times of the proposed method and the BP algorithm, which showed that the BP algorithm is extremely time-consuming. However, the proposed method can significantly improve the imaging efficiency by a factor of 62 in terms of the processing speed. Consequently, it is concluded that the proposed method can accurately focus the targets without loss of imaging performance. In addition, the imaging efficiency can be improved using the proposed method.
6. Conclusions
MSAS imagery is challenging because the two-round slant range is characterized by double square root terms. The method proposed in this paper transforms the two-round slant range into a single square root term based on the second-order Taylor expansion and inverse Taylor expansion to solve this problem. Subsequently, the PTRS can be decomposed into quasi-monostatic and bistatic deformation terms. The bistatic deformation term can be canceled with the preprocessing step based on complex multiplication, interpolation, coherent superposition, and dechirping operations. Consequently, the MSAS data can be considered a monostatic SAS-equivalent signal, which is used as the input to an RD algorithm. Considering the cross-track variance of the SRC, this paper exploits the sub-block processing method in the cross-track dimension. The proposed method can generate high-resolution results very similar to those of the BP algorithm benchmark in a significantly shorter processing time. Simulations using a simulated imaging scenario and real sonar data further validated the proposed method.
Data availability statement
The raw data supporting the conclusions of this article will be made available by the authors, without undue reservation.
Author contributions
PH and PY designed the study, wrote the manuscript, managed communication between the authors, and analyzed the data. All authors contributed to the article and approved the submitted version.
Funding
This work was supported by the Natural Science Foundation of Shandong Province (grant no. ZR2019MA022) and the Enterprise Marine Project (grant no. 20210701).
Acknowledgments
The authors thank the reviewers and editors for their valuable comments that helped improve this paper.
Conflict of interest
PY is employed by the Acoustic Signal and Electronics Science and Technology Corporation.
The remaining author declares that the research was conducted in the absence of any commercial or financial relationships that could be construed as a potential conflict of interest.
Publisher’s note
All claims expressed in this article are solely those of the authors and do not necessarily represent those of their affiliated organizations, or those of the publisher, the editors and the reviewers. Any product that may be evaluated in this article, or claim that may be made by its manufacturer, is not guaranteed or endorsed by the publisher.
References
Barclay P. J., Hayes M. P., Gough P. T. (2005). “ML estimation of seafloor topography using multi-frequency synthetic aperture sonar,” in Europe Oceans. (Brest, France: IEEE), vol. 1, 579–584. doi: 10.1109/OCEANSE.2005.1511779
Cong W., Huo G., Zheng Y. (2000). “Anti-reverberation target detection and identification in synthetic aperture sonar,” in Proceedings of the 2000 international symposium on underwater technology (Cat. No.00EX418). (Tokyo, Japan: IEEE), 54–61. doi: 10.1109/UT.2000.852515
Cutrona L. J. (1975). Comparison of sonar system performance achievable using synthetic aperture techniques with the performance achievable by more conventional means. J. Acoust. Soc Am. 58, 336–348. doi: 10.1121/1.380678
Davis B. J., Gough P. T., Hunt B. R. (2009). Modeling surface multipath effects in synthetic aperture sonar. IEEE J. Ocean. Eng. 34, 239–249. doi: 10.1109/JOE.2009.2017796
Dillon J., Steele S. (2022). “Square SAS: multi-aspect imaging with a towed synthetic aperture sonar,” in Oceans. (Chennai, India: IEEE), 2022 1–6. doi: 10.1109/OCEANSChennai45887.2022.9775390
Dobeck G. J. (1999). “Fusing sonar images for mine detection and classification,” in Detection and remediation technologies for mines and minelike targets IV. (Orlando, FL: SPIE), 602–614. doi: 10.1117/12.357082
Gough P. T., Hawkins D. W. (1996). “On the use of mapping operators in SAR and SAS,” in Conference record of the thirtieth asilomar conference on signals, systems and computers. (Pacific Grove, CA: IEEE) vol. 81, 86–89. doi: 10.1109/ACSSC.1996.600834
Gough P. T., Hawkins D. W. (1997). Imaging algorithms for a strip-map synthetic aperture sonar: minimizing the effects of aperture errors and aperture undersampling. IEEE J. Ocean. Eng. 22, 27–39. doi: 10.1109/48.557537
Gough P. T., Hawkins D. W. (1998). “A short history of synthetic aperture sonar. IGARSS ‘98. sensing and managing the environment,” in 1998 IEEE international geoscience and remote sensing. symposium proceedings. (Cat. No.98CH36174). (Seattle, WA, USA: IEEE), vol. 2, 618–620. doi: 10.1109/IGARSS.1998.699529
Gough P. T., Hayes M. P. (2005). “Fast Fourier techniques for SAS imagery,” in MTS/IEEE oceans conference. (Brest, France: IEEE), 563–568. doi: 10.1109/OCEANSE.2005.1511776
Gough P. T., Hayes M. P., Wilkinson D. R. (2000). “An efficient image reconstruction algorithm for a multiple hydrophone array synthetic aperture sonar,” in Proceedings of the 5th European conference on underwater acoustics (ECUA2000) (Lyon: Luxembourg: Office for Official Publications of the European Communities), 395–400.
Gough P. T., Miller M. A. (2003). “The SAR map-drift algorithm extended for a multi-hydrophone SAS,” in Oceans 2003: Celebrating the Past. Teaming toward the future (IEEE cat. No.03CH37492). (San Diego, CA, USA: IEEE), vol. 5, 2427–2432. doi: 10.1109/OCEANS.2003.178292
Gough P. T., Noonchester M. A., Hunter A. J., Hayes M. P. (2006). “Towards multi-frequency imaging and analysis of sub-surface targets using SAS,” in Oceans 2006. (Boston, MA, USA: IEEE). doi: 10.1109/OCEANS.2006.306797
Hunter A. (2006). Underwater acoustic modeling for synthetic aperture sonar (Christchurch, New Zealand: University of Canterbury).
LeHardy P. K., Larsen J. (2015). “Deepwater synthetic aperture sonar and the search for MH370,” in MTS/IEEE oceans conference. (Washington, DC, USA: IEEE), 1–4. doi: 10.23919/OCEANS.2015.7401838
Liu B., Wang T., Wu Q., Bao Z. (2009). Bistatic SAR data focusing using an omega-K algorithm based on method of series reversion. IEEE Trans. Geosci. Remote Sens. 47, 2899–2912. doi: 10.1109/TGRS.2009.2017522
Loffeld O., Nies H., Peters V., Knedlik S. (2004). Models and useful relations for bistatic SAR processing. IEEE Trans. Geosci. Remote Sens. 42, 2031–2038. doi: 10.1109/TGRS.2004.835295
Neo Y. L., Wong F. H., Cumming I. G. (2008). Processing of azimuth-invariant bistatic SAR data using the range doppler algorithm. IEEE Trans. Geosci. Remote Sens. 46, 14–21. doi: 10.1109/TGRS.2007.909090
Rankin W., Cooper M. T., Wood J. L., Lathrop J. D. (1999). “Demonstration of advanced underwater sensors for military and civilian applications,” in Detection and remediation technologies for mines and minelike targets IV (Orlando, FL: SPIE), 647–660. doi: 10.1117/12.357047
Rolt K. D., Schmidt H. (1992). Azimuthal ambiguities in synthetic aperture sonar and synthetic aperture radar imagery. IEEE J. Ocean. Eng. 17, 73–79. doi: 10.1109/48.126956
Sæbø T. O., Callow H. J., Hagen P. E. (2010). “Pipeline inspection with synthetic aperture sonar,” in The 33th Scandinavian symposium on physical acoustics (Geilo, Norway), 1–6. Available at: https://www.yumpu.com/en/document/read/22516981/pipeline-inspection-with-synthetic-aperture-sonar.
Shin H.-S., Lim J.-T. (2009). Omega-k algorithm for airborne spatial invariant bistatic spotlight SAR imaging. IEEE Trans. Geosci. Remote Sens. 47, 238–250. doi: 10.1109/TGRS.2008.2002954
Tan C., Zhang X., Yang P., Sun M. (2019). A novel sub-bottom profiler and signal processor. Sensors 19, 5052. doi: 10.3390/s19225052
Wang R., Deng Y., Loffeld O., Nies H., Walterscheid I., Espeter T., et al. (2011). Processing the azimuth-variant bistatic SAR data by using monostatic imaging algorithms based on two-dimensional principle of stationary phase. IEEE Trans. Geosci. Remote Sens. 49, 3504–3520. doi: 10.1109/TGRS.2011.2129573
Wang R., Loffeld O., Nies H., Knedlik S., Ender J. H. (2008). Chirp-scaling algorithm for bistatic SAR data in the constant-offset configuration. IEEE Trans. Geosci. Remote Sens. 47, 952–964. doi: 10.1109/TGRS.2008.2006275
Wang R., Loffeld O., Nies H., Medrano-Ortiz A., Knedlik S. (2009). Bistatic point target reference spectrum in the presence of trajectory deviations. IET Radar Sonar Navig. 3, 177–185. doi: 10.1049/iet-rsn:20080053
Wang X., Zhang X., Zhu S. (2015). “Upsampling based back projection imaging algorithm for multi-receiver synthetic aperture sonar,” in 2015 international industrial informatics and computer engineering conference (IIICEC). (Xi'an, China: Atlantis Press), 1610–1615. doi: 10.2991/iiicec-15.2015.355
Wu J. J., Yang J. Y., Huang Y. L., Liu Z., Yang H. G. (2011). A new look at the point target reference spectrum for bistatic SAR. Prog. Electromagn. Res. 119, 363–379. doi: 10.2528/PIER11050704
Wu Q., Zhang Y., Amin M., Himed B. (2014). Focusing of tandem bistatic SAR data using range Doppler algorithm. IEEE Radar Conference Cincinnati. (Cincinnati, OH, USA: IEEE) 927–931. doi: 10.1109/RADAR.2014.6875724
Xia X., Zhang X., Chen X. (2016). “Parameter estimation for Gaussian mixture processes based on expectation-maximization method,” in 2016 4th international conference on machinery, materials and information technology applications (ICMMITA 2016). (Xi’an, China: Atlantis Press), 519–523. doi: 10.2991/icmmita-16.2016.96
Yang P., Liu J. (2022). “Effect of non-unifrom sampling on sonar focusing,” in 2022 14th international conference on communication software and networks (ICCSN). (Chongqing, China: IEEE), 109–113. doi: 10.1109/ICCSN55126.2022.9817582
Zhang X., Chen X., Qu W. (2017a). “Influence of the stop-and-hop assumption on synthetic aperture sonar imagery,” in 2017 IEEE 17th international conference on communication technology (ICCT 2017). (Chengdu, China: IEEE), 1601–1607. doi: 10.1109/ICCT.2017.8359901
Zhang X., Dai X., Fang B. (2019). A range-Doppler imaging method for the multireceiver synthetic aperture sonar. Geomat. Inf. Sci. Wuhan Univ. 44, 1667–1673. doi: 10.13203/j.whugis20180076
Zhang X., Dai X., Yang B. (2018). Fast imaging algorithm for the multiple receiver synthetic aperture sonars. IET Radar Sonar Navig. 12, 1276–1284. doi: 10.1049/iet-rsn.2018.5040
Zhang X., Huang H., Ying W., Wang H., Xiao J. (2017b). An indirect range-Doppler algorithm for multireceiver synthetic aperture sonar based on Lagrange inversion theorem. IEEE Trans. Geosci. Remote Sens. 55, 3572–3587. doi: 10.1109/TGRS.2017.2676339
Zhang X., Liu Y., Deng X. (2021a). “Influence of phase centre approximation error on SAS imagery,” in 2021 IEEE the 6th international conference on computer and communication systems (ICCCS 2021) (Chengdu, China: IEEE), 352–356. doi: 10.1109/ICCCS52626.2021.9449222
Zhang X., Tang J., Ouyang J. (2014a). “Imaging processor for multi-receiver SAS in the presence of partially failed receivers,” in 2014 international conference on vehicle & mechanical engineering and information technology (VMEIT 2014). (Beijing, China: TTP), 2225–2228. doi: 10.4028/www.scientific.net/AMM.543-547.2225
Zhang X., Tang J., Wang F., Bai S., Liu D. (2014b). Accurate back projection imaging algorithm for multi-receiver SAS in engineering application. J. Nav. Univ. Eng. 26, 20–24. doi: 10.7495/j.issn.1009-3486.2014.02.005
Zhang X., Tang J., Zhang S., Zhong H. (2013). Chirp-scaling imaging algorithm for multi-receiver synthetic aperture sonar. Syst. Eng. Electron. 35, 1415–1420. doi: 10.3969/j.issn.1001-506X.2013.07.11
Zhang X., Wu H., Sun H., allying W. (2021b). Multireceiver SAS imagery based on monostatic conversion. IEEE J. Sel. Top. Appl. Earth Obs. Remote Sens. 14, 10835–10853. doi: 10.1109/JSTARS.2021.3121405
Zhang X., Ying W. (2022). Influence of the element beam pattern on synthetic aperture sonar imaging. Geomat. Inf. Sci. Wuhan Univ. 47, 133–140. doi: 10.13203/j.whugis20190148
Zhang X., Ying W., Liu Y., Deng X. (2021c). “Processing multireceiver SAS data based on the PTRS linearization,” in IEEE International geoscience and remote sensing symposium (IGARSS 2021). (Brussels, Belgium: IEEE), 5167–5170. doi: 10.1109/IGARSS47720.2021.9553688
Zhang X., Ying W., Yang P., Sun M. (2020). Parameter estimation of impulsive noise with class b model. IET Radar Sonar Navig. 14, 1055–1060. doi: 10.1049/iet-rsn.2019.0477
Zhong H., Liu X. (2006). “A fourth-order imaging algorithm for spaceborne bistatic SAR,” in 2006 IEEE international geoscience and remote sensing symposium (IGARSS). (Denver, CO, USA: IEEE), 1196–1199. doi: 10.1109/IGARSS.2006.309
Zhong H., Liu X. (2009). An extended nonlinear chirp-scaling algorithm for focusing large-baseline azimuth-invariant bistatic SAR data. IEEE Geosci. Remote Sens. Lett. 6, 548–552. doi: 10.1109/LGRS.2009.2021676
Keywords: synthetic aperture sonar, high-resolution, imaging algorithm, phase center approximation, imaging performance
Citation: Huang P and Yang P (2022) Synthetic aperture imagery for high-resolution imaging sonar. Front. Mar. Sci. 9:1049761. doi: 10.3389/fmars.2022.1049761
Received: 21 September 2022; Accepted: 23 November 2022;
Published: 16 December 2022.
Edited by:
Haixin Sun, Xiamen University, ChinaReviewed by:
Jiahua Zhu, National University of Defense Technology, ChinaWeitao Sun, The 54th Research Institute of China Electronics Technology Group Corporation, China
Copyright © 2022 Huang and Yang. This is an open-access article distributed under the terms of the Creative Commons Attribution License (CC BY). The use, distribution or reproduction in other forums is permitted, provided the original author(s) and the copyright owner(s) are credited and that the original publication in this journal is cited, in accordance with accepted academic practice. No use, distribution or reproduction is permitted which does not comply with these terms.
*Correspondence: Pan Huang, d2Z4eWhwQHdmdS5lZHUuY24=
 Pan Huang
 Peixuan Yang