 Toshiaki Shinoda
 Philippe Tissot
 Anthony Reisinger
95% of researchers rate our articles as excellent or good
Learn more about the work of our research integrity team to safeguard the quality of each article we publish.
Find out more
ORIGINAL RESEARCH article
Front. Mar. Sci. , 09 January 2023
Sec. Physical Oceanography
Volume 9 - 2022 | https://doi.org/10.3389/fmars.2022.1049550
This article is part of the Research Topic Understanding and Predicting the Gulf of Mexico Ocean Dynamics View all 15 articles
Mechanisms that generate subseasonal (1-2 months) events of sea level rise along the western Gulf Coast are investigated using the data collected by a dense tide gauge network: Texas Coastal Ocean Observation Network (TCOON) and National Water Level Observation Network (NWLON), satellite altimetry, and high-resolution (0.08°) ocean reanalysis product. In particular, the role of Loop Current and eddy shedding in generating the extreme sea level rise along the coast is emphasized. The time series of sea level anomalies along the western portion of the Gulf Coast derived from the TCOON and NWLON tide gauge data indicate that a subseasonal sea level rise which exceeds 15 cm is observed once in every 2-5 years. Based on the analysis of satellite altimetry data and high-resolution ocean reanalysis product, it is found that most of such extreme subseasonal events are originated from the anti-cyclonic (warm-core) eddy separated from the Loop Current which propagates westward. A prominent sea level rise is generated when the eddy reaches the western Gulf Coast, which occurs about 6-8 months after the formation of strong anti-cyclonic eddy in the central Gulf of Mexico. The results demonstrate that the accurate prediction of subseasonal sea level rise events along the Gulf Coast with the lead time of several months require a full description of large-scale ocean dynamical processes in the entire Gulf of Mexico including the characteristics of eddies separated from the Loop Current.
Global mean sea level (SL) rise has been estimated during the past decades based on tide-gauge observations. The rise is caused primarily by two factors related to global warming: the thermal expansion of sea water and the added water from melting land ice (IPCC, 2022). The advance of satellite altimetry in recent years has provided the opportunity to detect spatial differences of long-term SL change. Recent studies indicate that SL rise is not geographically uniform because of changes in atmospheric and oceanic circulations (e.g., Unnikrishnan and Shanker, 2007; Miline et al., 2009; Woodworth et al., 2009; Han et al., 2010; Ezer et al., 2013; Han et al., 2014). Areas along the coastlines of the Gulf of Mexico, and particularly the northwest portion of the basin, are experiencing significantly higher rates of relative SL rise due to large rates of subsidence (Wang et al., 2020) as compared to the global mean. As large industrial infrastructure and millions of people reside in these low-lying coastal regions, a small increase in SL will have substantial impacts on people’s lives including increased frequencies and expanses of flooding.
In addition to the long-term changes, coastal SL fluctuates substantially on relatively short time scales from hours to few months. Such SL rises include those associated with astronomical tides, storm surges, waves, and other atmospheric and oceanic processes. As the mean (or background) SL is rising as a result of global warming, it will become much easier for coastal flooding to occur due to relatively short-term SL rise events. For example, recent studies suggest that an increase in high-tide or clear-sky flooding started about two decades ago is growing rapidly in recent years as a result of mean SL rise, and it is likely that this type of coastal flooding will continue to grow over the coming years and decades (e.g., Sweet et al., 2021). For example, the number of high-tide flooding days per year along the western Gulf Coast has more than doubled over the past 30 years (Sweet et al., 2021).
The long-term increase of flooding caused by SL rise events can also arise from the changes in amplitude and frequency of short-term SL fluctuations themselves. For example, occurrence of strong land falling storms could be increased due to the global warming (IPCC, 2022). Recent studies suggest that strong winds associated with land-falling atmospheric river (AR) events cause a substantial SL rise along the US west coast which exceeds 50 cm (Shinoda et al., 2019). As frequency and intensity of ARs will be changing under a warming climate (e.g., Espinoza et al., 2018; O’Brien et al., 2021), AR-associated SL extreme events may increase in the future. Moreover, such short-term SL rise events are not cancelled out by the opposite change (SL drop events), changes in AR frequency could in turn impact the long-term SL changes including their trend. Accordingly, it is crucial to understand processes that control short-term SL rise events along the coast for both adaptation strategies for coastal flooding as well as future projections of coastal SL changes.
Previous studies suggest that large-scale dynamical processes over the open ocean area could largely impact SL rise along the coast on a variety of time scales (e.g., Ezer et al., 2013; Chen et al., 2015; Qiu et al., 2015; Minobe et al., 2017; Feng et al., 2022). For example, a significant portion of intraseasonal variability in SL anomalies along the east coast of Philippine is attributed to Rossby waves propagated from the tropical north Pacific (Chen et al., 2015), and local wind forcing may play a minor role during which the remote forcing largely affects the coastal SL. The importance of remote forcing for determining coastal SL changes on longer time scales has been also demonstrated for both western and eastern sides of continents (Minobe et al., 2017; Feng et al., 2022). Hence, these studies suggest that ocean dynamical processes originated from remote areas must be considered to understand the mechanisms controlling the coastal SL.
Although the Gulf Coast SL has been monitored for a long time period, physical processes that control the SL variability are not well understood. Since the Loop Current, which is part of the strong western boundary current of the north Atlantic subtropical gyre, is located near the Gulf Coast, ocean dynamical processes could be a primary factor in controlling the western and northern Gulf Coast SL on various time scales. Because of the high velocity of the Loop Current, the average SL across the current axis varies substantially. The SL inside of the Loop is about 80 cm higher than the outside of the Loop, which is associated with the thermocline depth variation of about 150-200 m (e.g., Maul, 1977; Shay et al., 2000). The Loop Current reveals large variability of its position. It occasionally extends northward around 29°N, reaching as north as the continental shelf in the northeast Gulf of Mexico (e.g., Wiseman and Dinnel, 1988; Leben, 2005; Schmitz et al., 2005). When extended, the Loop Current often sheds an anti-cyclonic eddy (e.g., Cochrane, 1972; Vukovich, 1995; Sturges and Leben, 2000). The anti-cyclonic eddy separated from the Loop Current moves westward with the speed of about 0.08-0.2 m/s (Elliott, 1982; Coats, 1992; Shay et al., 1998). The size (diameter) of the eddy can be about 200 to 400 km, and extends down to a depth of about 1000 m (e.g., Mooers and Maul, 1998). After the release of the anti-cyclonic eddy, the Loop Current changes its path, which flows almost directly to the Florida strait with a small meander.
Because of the substantial variations of the Loop Current path near the central Gulf Coast, its variability could directly influence near-shore sea surface height (SSH) around the northern Gulf Coast. In addition, the Loop Current variability and eddy shedding as discussed above could influence near-shore SSH around the western Gulf Coast. In particular, some of the strong anti-cyclonic eddies separated from the Loop Current often propagate westward all the way to the western part of Gulf Coast, which may result in SL fluctuations along the western Gulf Coast. However, the relation between ocean dynamical processes such as the Loop Current variability and eddy shedding and the Gulf Coast SL is still unclear.
As in most areas along the US coastline, the Gulf Coast SL fluctuates substantially on a variety of time scales. While previous studies documented long-term trends in the Gulf Coast SL (e.g., Boon et al., 2018), extreme SL rise events on the time scale shorter than seasonal (except that caused by hurricanes) have not been well documented, and physical processes that control such events are not well understood. Our analysis of tide gauge data along the western Gulf Coast indicates that such extreme SL rise events on the time scale of 1-2 months often occur. This study investigates physical processes that contribute to SL variations in the Gulf Coast and Gulf of Mexico on the subseasonal (1-2 months) time scale. A particular emphasis is given to the role of ocean dynamics in such SL rise events along western Gulf Coast areas, which are examined through the combined analysis of satellite altimeter, in-situ tide-gauge, and ocean reanalysis data.
Primary data sets used in this study are described in the following.
The Texas Coastal Ocean Observation Network (TCOON) (Rizzo et al., 2014) is a uniquely dense coastal network of scientific data collection platforms operated following National Ocean Service standards complementing the stations of the National Water Level Observation Network (NWLON). SL time series from 23 tide gauges along the Texas coast were processed (Figure 1). Eighteen of these stations are part of the TCOON while five stations are part of the NWLON. All stations are maintained to the same standards with similar instrumentation.
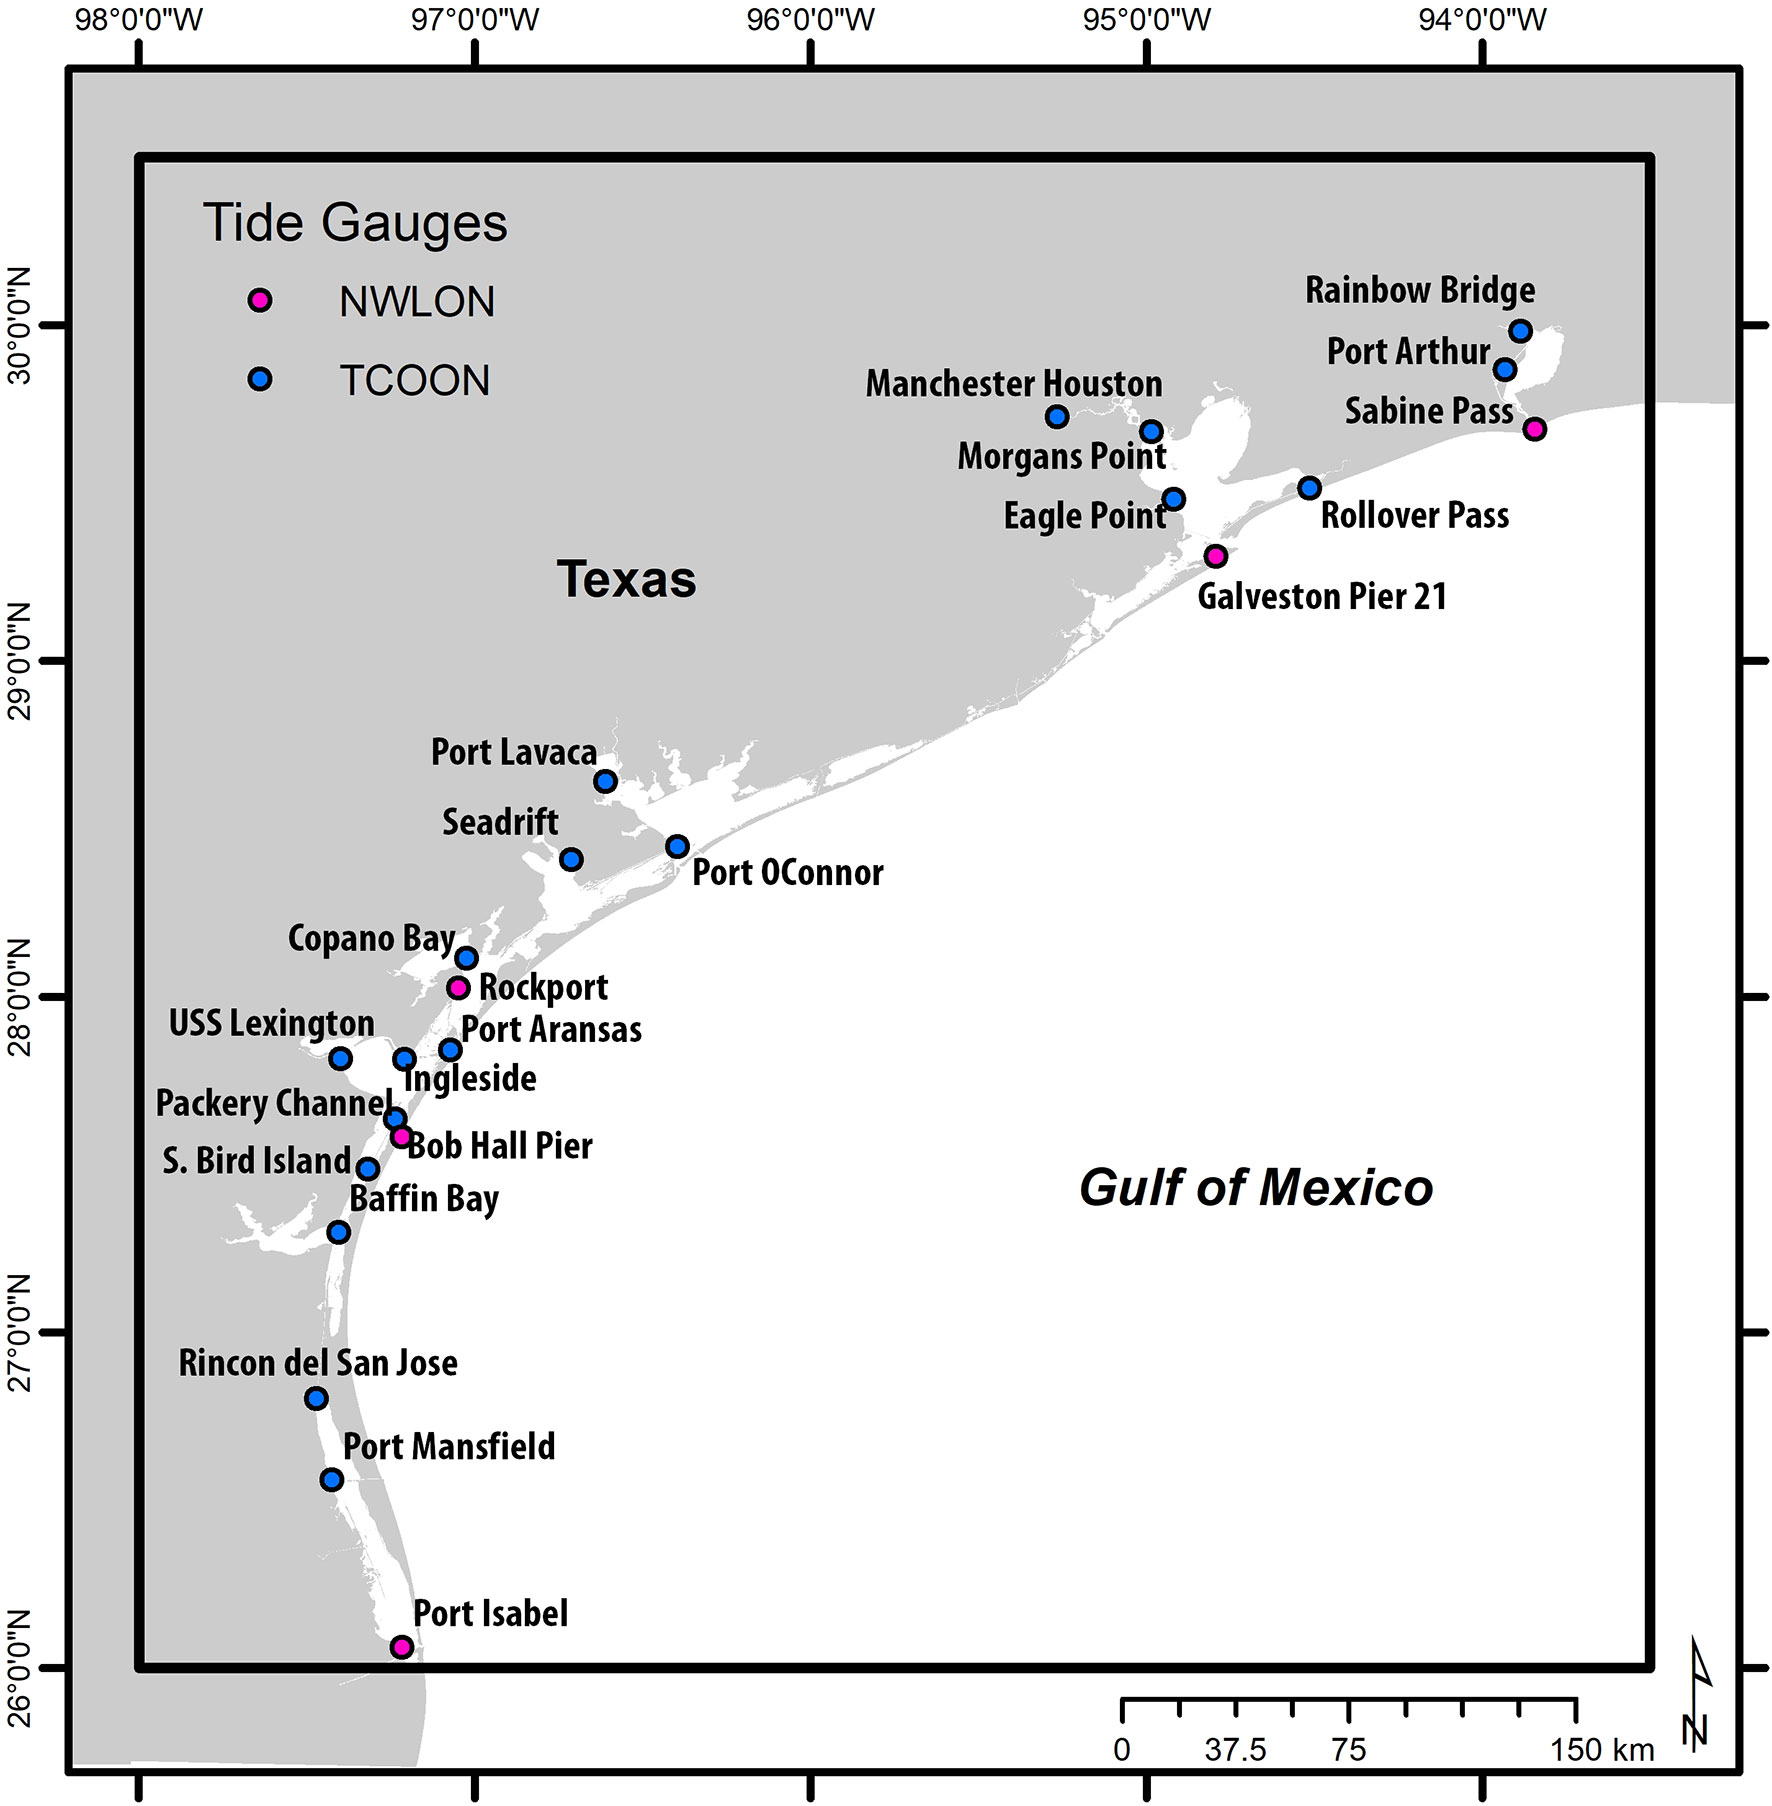
Figure 1 A map of TCOON and NWLON tide gauge stations. The rectangular box indicates the area used for calculating average winds.
Because of the exceptionally dense network of tide-gauge data along the coast, it is possible to distinguish between local and large-scale impacts. For example, there are spatial differences in local tidal dynamics, local wind pattern, river runoff, and the influence of complex bathymetry, besides the different rates of subsidence. The large-scale influence will be detected based on the comparison of the data from a number of stations along the coast. The estimated SL will be explained through examining processes relevant to large-scale oceanic and atmospheric variability.
The high-resolution global ocean reanalysis data set “GOFS 3.1: 41-layer HYCOM + NCODA Global 1/12° Reanalysis”, created by the US Navy’s operational Global Ocean Nowcast/Forecast System (Metzger et al., 2014), is used in this study. The system employs the 0.08° Hybrid Coordinate Ocean Model (HYCOM; Bleck, 2002) as an ocean model component, and in-situ and satellite data are assimilated through the Navy Coupled Ocean Data Assimilation (NCODA; Cummings and Smedstad, 2013). This reanalysis product is referred to as “HYCOM reanalysis” hereafter.
HYCOM, NCODA and the data assimilation method are explained here briefly, as the details are described in other papers (Bleck, 2002; Cummings and Smedstad, 2013; Helber et al., 2013; Metzger et al., 2014). The global HYCOM used in this study is eddy-resolving, in which the horizontal resolution is 0.08° at the equator. HYCOM is forced by surface forcing fields derived from coupled reanalysis products, the Climate Forecast System Reanalysis (CFSRV1; Saha et al., 2010) and Climate Forecast System Version 2 (CFSV2; Saha et al., 2014). The ocean data assimilated by NCODA include satellite-derived SSH, sea surface temperature (SST), sea ice concentration, in situ surface and subsurface temperature and salinity observations. The HYCOM/NCODA system uses synthetic temperature profiles derived from the Improved Synthetic Ocean Profile (ISOP; Helber et al., 2013). The ISOP is constructed at a given location by projecting satellite-derived SSH and SST downward from the surface using statistical relationships. In this study, the daily and monthly mean ocean velocity and SSH data for the period of 1994-2015 are used. HYCOM has been extensively used for simulations of upper ocean structure and circulations in the Gulf of Mexico (e.g., Chassignet et al., 2005; Zamudio and Hogan, 2008). Also, in the last several years, the HYCOM reanalysis has been validated extensively, including the coastal SL variations (e.g., Yu et al., 2015; Thoppil et al., 2016; Shinoda et al., 2019; Shinoda et al., 2020).
Satellite altimeter data obtained from Archiving, Validation, and Interpretation of Satellite Oceanographic data (AVISO) for the period 1994-2015 are used to monitor the variability of Loop Current and the associated eddy formation. Daily SSH data are provided on a 0.25° x 0.25° grid. Surface winds at 10 m height from CFSRV1 for the period of 1994-2010 and CFSV2 for the period of 2011- 2015 are used. The horizontal resolution of CFSRV1 (CFSV2) is 0.3125° (0.205°). These wind data sets are used to force HYCOM for creating the HYCOM reanalysis product.
The individual SL time series are processed to remove the variability associated with their respective weather and tidal forcings as well as their local vertical land motion. The magnitude of the vertical land motion can be important, with a large spatial variability along the Texas coast. The short term, hours to seasonal, SL dynamic varies substantially depending on the location within the study area. The tidal range is on the order of 20-30 cm along the shores of the Gulf of Mexico and decreases rapidly along ship channels and within the bays and estuaries. The tidal influence becomes insignificant in the Laguna Madre. Similarly high frequency weather forcings, including the passage of cold fronts influence bays, estuaries and lagunas differently, then the nearshore waters of the Gulf of Mexico. Within embayments or along the intracoastal waterway where many tide gauges are located, hourly SL changes are largely driven by weather forcings and the distance from the nearest pass or ship channel connecting the respective water bodies to the Gulf of Mexico. This high frequency variability is however not significant for the present study as monthly time series are computed by averaging out high frequency variability.
Hourly SLs measured relative to their respective station datums were downloaded for the period 1993-2017. The number of gaps in the time series was small for all stations, and gaps were left unfilled. Then monthly averages are computed to remove the high frequency influences of the local tides and weather driven changes. A monthly mean was computed for stations only if at least 90% of the hourly records was available. The seasonal cycle is computed individually and removed from the monthly time series for each station. The resulting time series are used to estimate the locations’ relative SL linear trends. The respective trends are then removed from the respective locations’ time series (Zervas et al., 2013). The values of relative SL trends range from 3 to 14 mm/yr. The processed individual locations’ time series are highly correlated. The mean of the correlation coefficients for all locations with respect to the mean is 0.95 and the individual correlation coefficients are at least 0.89. Thus the average time series of all TCOON and NWLON stations are adequate to quantify the oceanic signal for the western Gulf Coast.
The anomalies of SSH from AVISO and SSH and surface currents from the HYCOM reanalysis are calculated by subtracting the climatological seasonal cycle for the 1994-2015 period. The linear trend in anomalies of SSH and surface currents is removed. The anomalies of surface winds from CFSRV1 (CFSV2) are calculated by subtracting the climatological seasonal cycle for the 1994-2010 (2011–2015) period.
Figure 2 shows the time series of monthly average SL anomaly measured by TCOON and NWLON tide gauges. Although the time series is the average of 23 stations, large fluctuations of the SL anomalies, which exceeds 5 cm are frequently found every year for both positive and negative anomalies, with the standard deviation (STD) of 6.8 cm. In addition, the extreme SL rise which exceeds 15 cm (2.2*STD) are found once in 2-5 years. During 1994-2015, six of such extreme events are observed, and two of them exceed 20 cm (2.9*STD). There is not specific seasonality in the timing of these extreme events. Given that the study tide stations cover relatively large areas which span the entire Texas coast, it is expected that these extreme SL rise events are caused by oceanic and atmospheric processes which are on the scale larger than 100-200 km. Note that the time series in different areas of the Texas coast are very coherent at least for these extreme SL rise events (not shown).
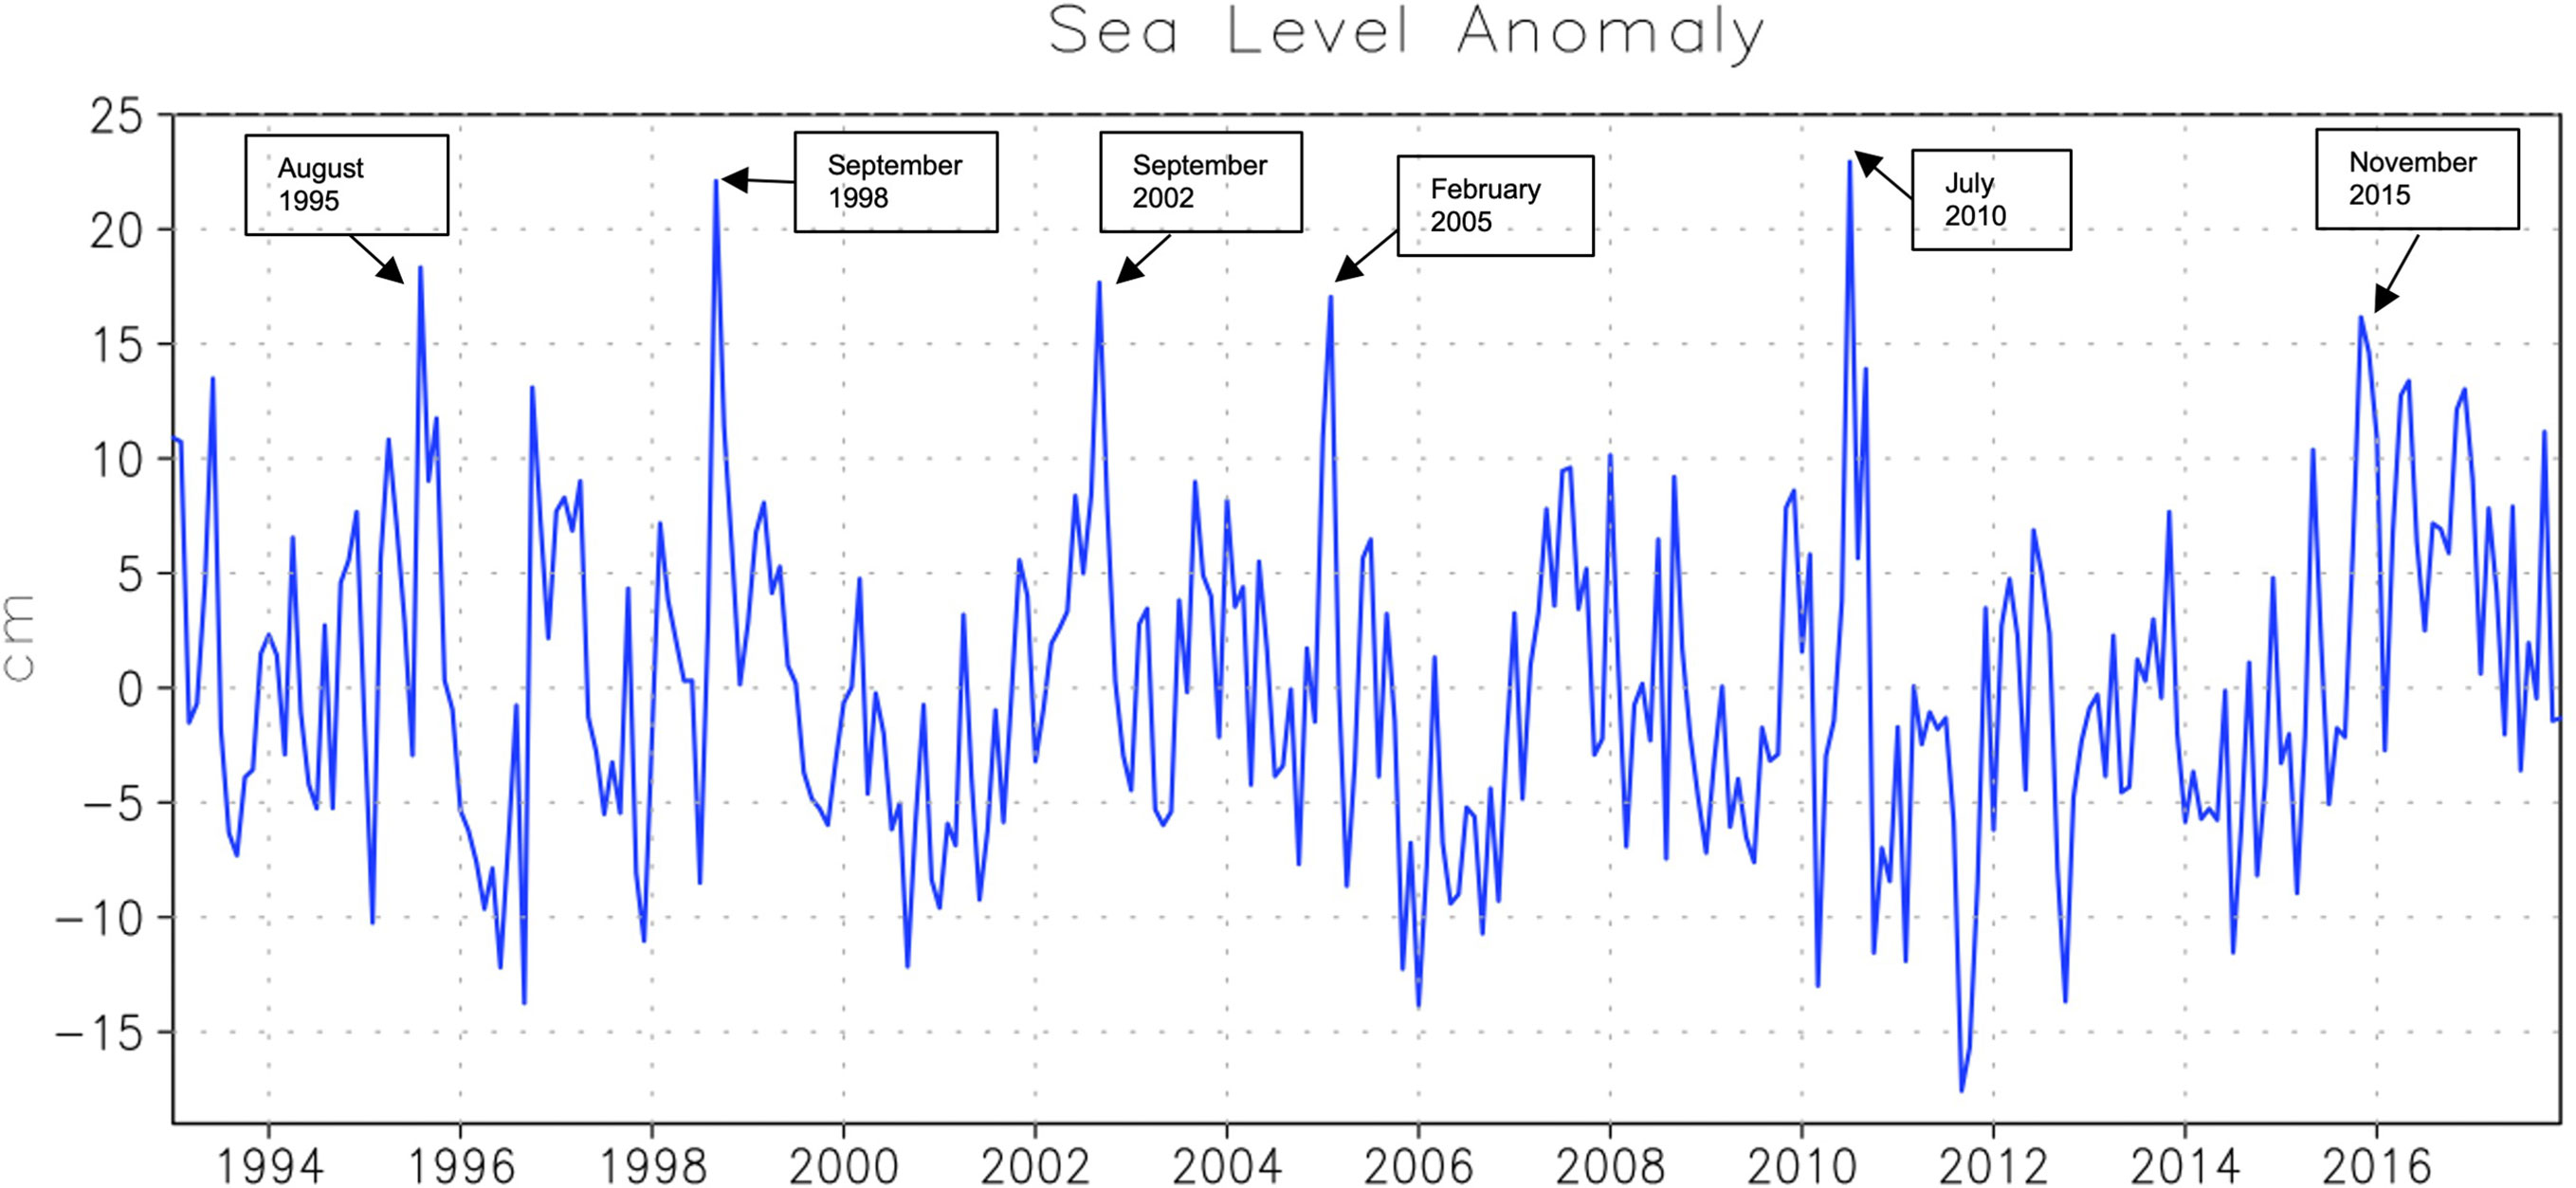
Figure 2 Time series of monthly mean sea level anomalies (cm) derived from the 23 study tide gauge stations.
In contrast to positive anomalies, the extreme events of the negative anomalies are not often found. The negative anomalies exceeded 15 cm only once during the 22-year period, but the negative anomalies larger than 5 cm last relatively longer time. For example, the negative SL anomaly of 5-10 cm is found more than 6 months in 1996.
The asymmetry of negative and positive anomalies is further demonstrated in the histogram of monthly SL anomalies (Figure 3). The distribution is positively skewed with the skewness of 0.38. The negative values of 2.0-5.6 cm range are most frequently found, and thus the peak value during extreme SL rise events relative to the normal (most frequently found) values are larger than the peak values of anomaly.
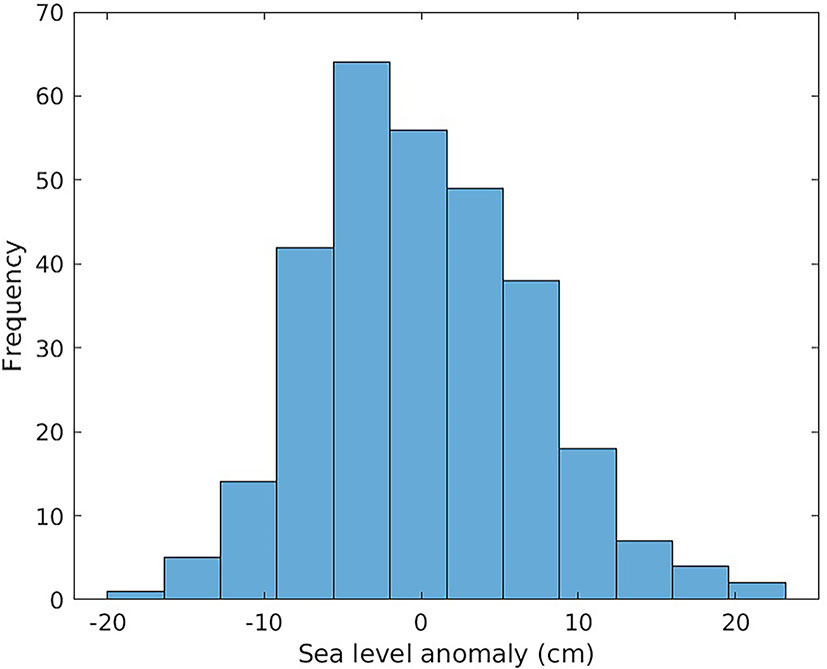
Figure 3 Histogram of monthly mean sea level anomalies (cm). Mean values of all tide gauge stations shown in Figure 1 are used.
In this study, we investigate the six extreme SL rise events identified from the TCOON and NWLON SL time series by comparing them with the large-scale ocean and atmospheric circulations. In particular, variability of SL and ocean circulations in the entire Gulf of Mexico during these events will be thoroughly described to elucidate the possible causes of such extreme SL rise events.
Figure 4 compares the time series of the sea level anomaly (Figure 4A) with those of the speed of anomalous winds (Figure 4B) and surface wind anomaly (Figure 4C) averaged over the area 98°W-93.5°W, 26°N-29.5°N (box area in Figure 1), which cover the almost entire TCOON and NWLON tide gauge stations. The correlation coefficients of SL anomalies with zonal wind anomalies (-0.24) and meridional wind anomalies (-0.24) are statistically significant, and the sign of the correlation is consistent with SL fluctuations driven by the along-shore wind stress since the northeasterly winds can generate coastal downwelling and thus SL rise. However, correlations are very weak and it is difficult to visually identify the similarity between the wind and SL variations. This suggests that while local wind variations affect the subseasonal SL fluctuations to some extent or during some periods, they are not the major factor that controls the overall subseasonal SL variations in this region. In particular, there are no obvious strong local wind events during the extreme SL rise events. Hence, other oceanic or atmospheric processes may cause most of the extreme SL rise events observed in this region.
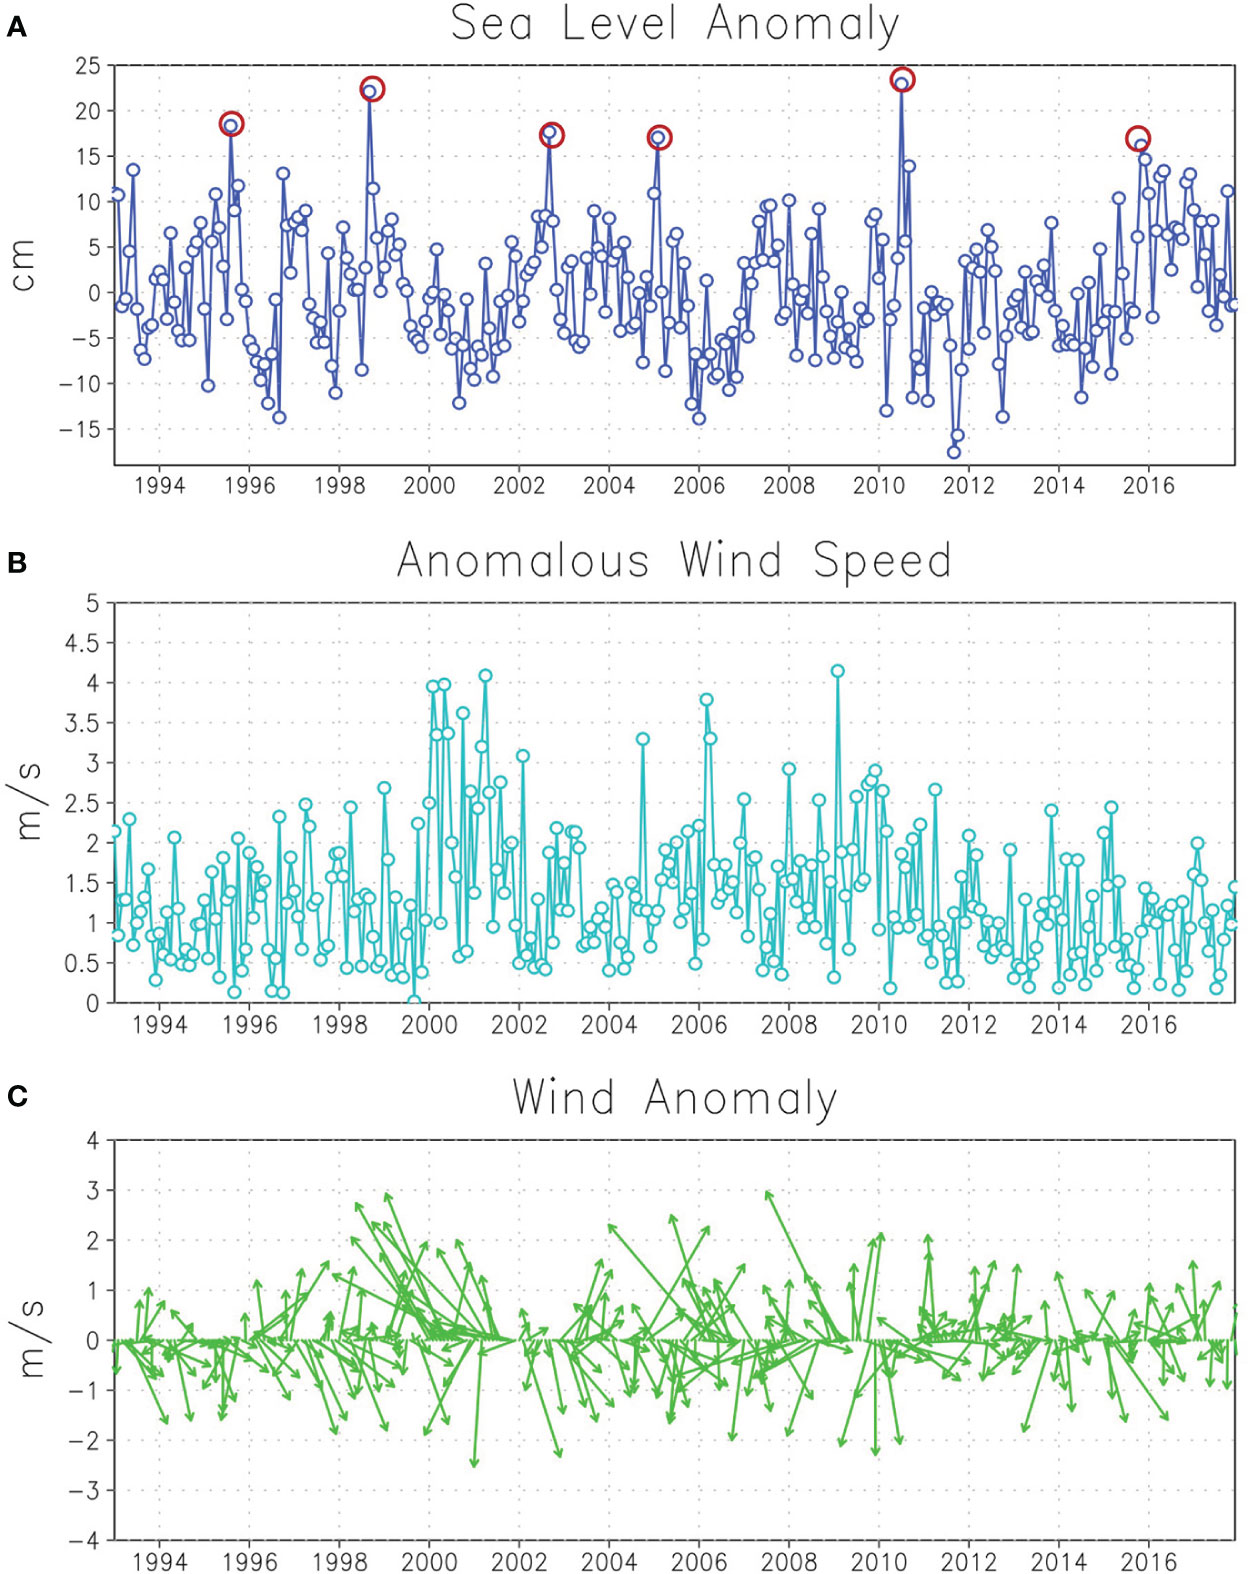
Figure 4 (A) Time series of monthly mean sea level anomalies (cm) derived from tide gauge measurements of 23 study stations. The time series are the same as those in Figure 2. (B) Time series of anomalous surface wind speed averaged over the area 98°W-94°W, 25°N-29.5°N (box area in Figure 1). The anomalous wind speed is calculated by average zonal and meridional wind anomalies. The wind data from CFSR and CFSV2 are used. (C) Same as (B) except for surface vector winds.
Figure 5A displays the SSH anomalies for the entire Gulf of Mexico during September 2002 when a peak of SL rise is found in the TCOON SL time series (Figure 2). The positive SSH anomalies are found along the western Gulf Coast which covers most of the areas of TCOON tide gauge stations. The SSH anomalies along the coast are connected to the high SSH anomaly centered around 24°N-25°N, 96°W, which extends to further east around 93°W. The spatial distribution of SSH along the coast measured by AVISO is very similar to those in the HYCOM reanalysis (Figure 5B), and thus the HYCOM reanalysis could be used to describe SSH and upper ocean currents during the period of SL rise events. It should be noted that a similar agreement of SSH between the AVISO and HYCOM reanalysis are evident in other periods of SL rise events, as will be shown in the following sections.
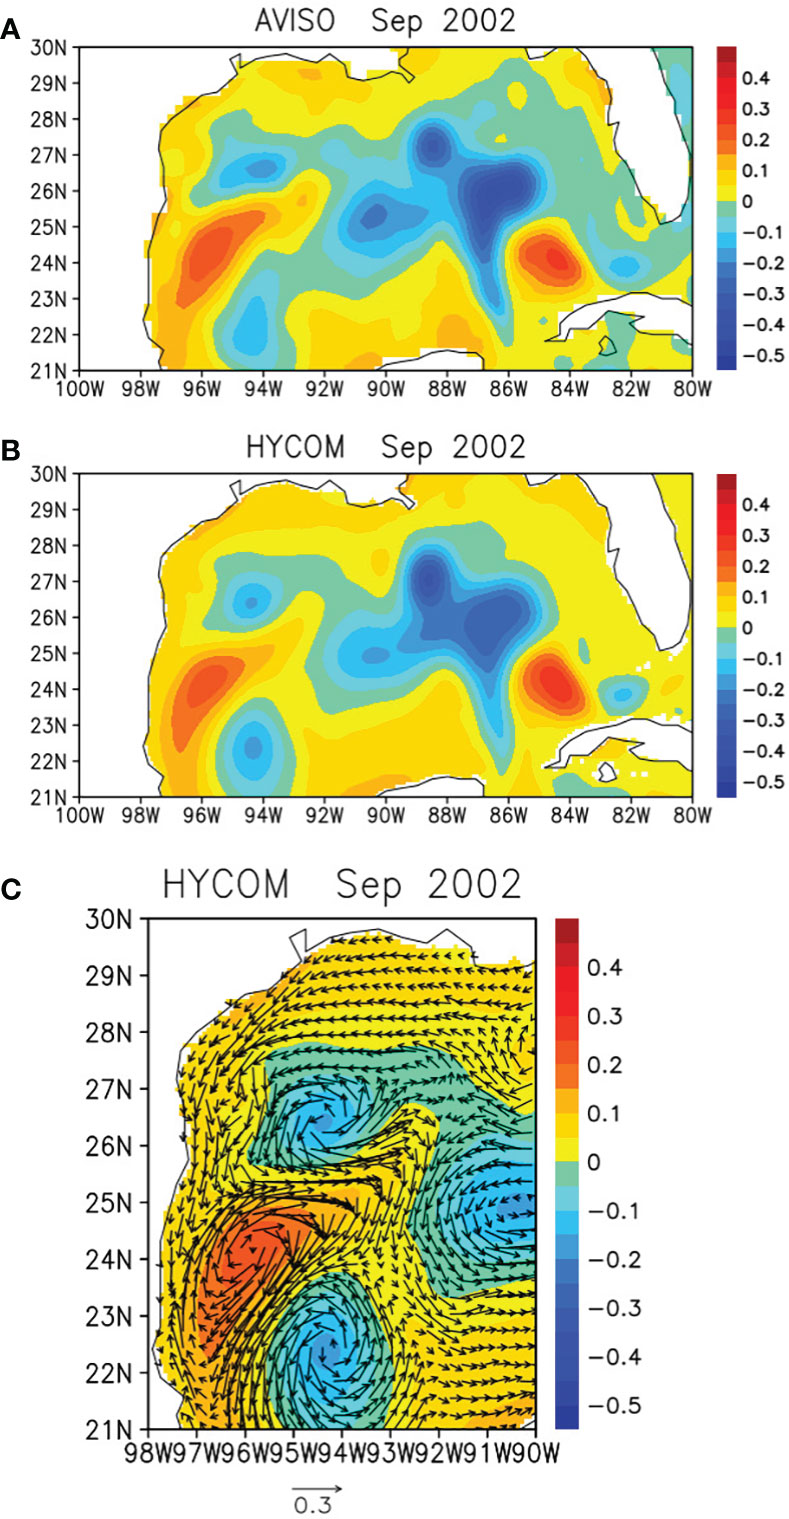
Figure 5 (A) Monthly mean SSH anomalies in the Gulf of Mexico in September 2022 derived from AVISO. (B) Same as (A) except for SSH anomalies from the HYCOM reanalysis. (C) SSH (shading) and surface currents (arrows) anomalies in September 2022 derived from the HYCOM reanalysis.
Surface current anomalies during this period from the HYCOM reanalysis is shown in Figure 5C. The high SSH anomalies connected to the western Gulf Coast SL rise are associated with the strong anti-cyclonic circulations. These anti-cyclonic circulations are connected to the southward surface currents along the coast all the way to around 29°N. Since the southward coastal current around 25°N-27°N is directly connected to the circulation in the eastern part of the anti-cyclonic eddy, a large meander of southward flow is evident. Near the coast around 24°N, the very narrow southward current is found while the anomalous northward currents associated with the anti-cyclonic eddy is located very close to the coast. The northward currents on the western side of the eddy are much narrower and weaker than southward currents on the eastern side of the eddy, suggesting that the eddy is interacting with the coast during this period and the western part of the eddy including anomalous northward currents are affected by the coast. The spatial pattern of these surface currents suggests that strong eastward currents on the northern side of the eddy located around 25°N-26°N largely influence the generation of the anomalous southward coastal currents (and thus high SL at the coast) in the area of TCOON tide gauge stations when the eddy reaches near the coast.
These circulation patterns such as a large meander of coastal currents is consistent with previous theoretical studies on the processes associated with on-shore movement of anti-cyclonic eddy (e.g., Isoda, 1996; Frolov et al., 2004). Also, it is indicated that the area of influence along the coast by the anti-cyclonic eddy is 2-3 times as large as the eddy size based on the idealized numerical model simulations (Isoda, 1996; Frolov et al., 2004). Hence an anticyclonic eddy with the horizontal scale (diameter) of 200-300 km could be sufficient to influence SL rise in large areas along the western Gulf Coast. However, the detailed dynamics associated with the interaction between eddies, coastal currents and SL such as the coastal circulation induced by eddies are complex (e.g., Nof, 1984). In addition, the bottom topography (continental shelf) may further impact the eddy-induced coastal circulations (e.g., Frolov et al., 2004; An and McDonald, 2005; Vic et al., 2015). For example, the idealized numerical model simulations suggest that a cyclonic eddy could be formed north of the anti-cyclonic eddy with the presence of continental slope (Frolov et al., 2004), which is consistent with the circulation pattern in Figure 5C. Further theoretical studies are necessary to fully describe coastal processes associated with on-shore movement of an anti-cyclonic eddy.
To identify the origin of the anti-cyclonic eddy centered around 24°N-25°N, 96°W near the western Gulf Coast in September, 2002 which is associated with the coastal SL rise event, the SSH anomaly fields of the entire Gulf of Mexico derived from AVISO is described from the early 2002 to the peak period (Figure 6, left panels). The positive SSH anomalies near the coast in September can be traced back to those in the north central Gulf of Mexico around 90°W-93°W, 26°N-27°N in February. These large positive SSH anomalies centered around 92°W, 26.5°N in February extend to the east and south all the way to 24°N, which includes the area inside of the Loop Current (Figure 6, right panels). These positive anomalies split in March, and the western portion of the anomalies farther move to the west around 94°W, 25°N in May. Then the SSH anomalies with the size of ~200-300 km are completely separated from the eastern portion in June, and the western portion of the separated anomalies reach the coast in September, which is connected to the high SSH along the coast. These variations of SSH measured by AVISO are very similar to those from HYCOM reanalysis (Figure 6, middle panels), suggesting that upper ocean currents associated with these SSH anomalies can be realistically described using the HYCOM reanalysis.
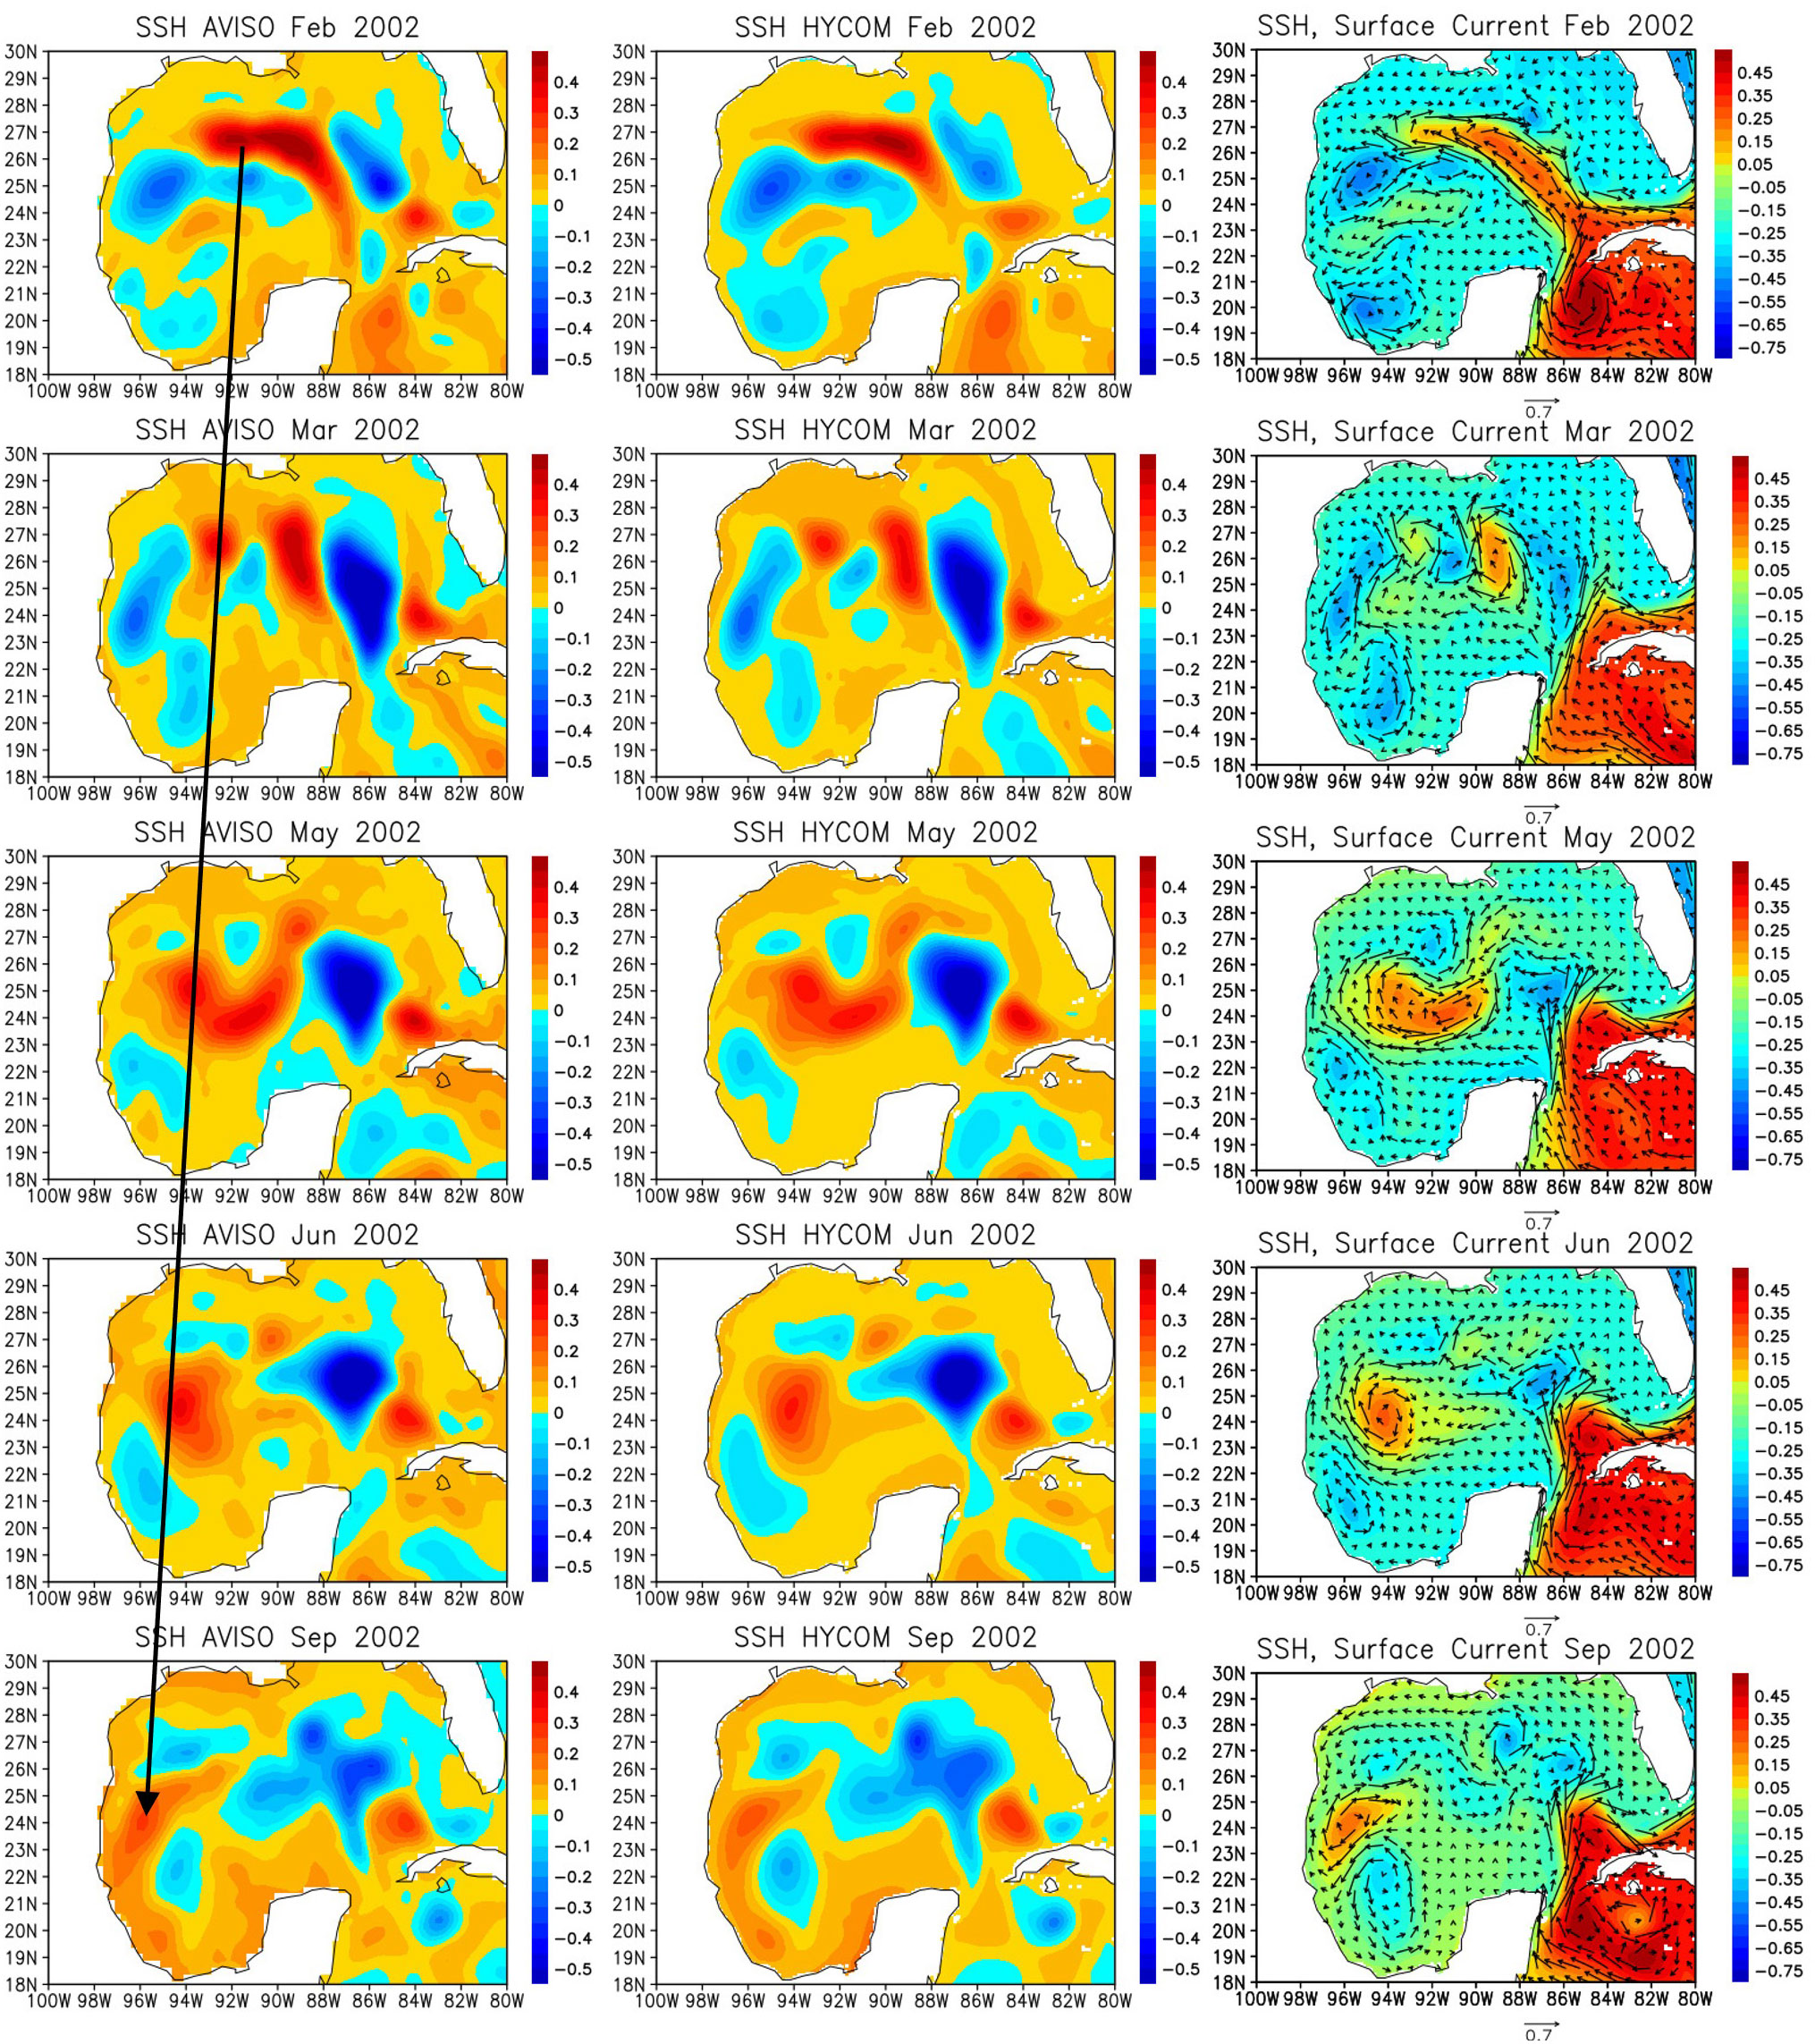
Figure 6 Left panels: SSH anomalies in February, March, May, June, and September, 2002 derived from AVISO. Middle panels: Same as left panels except for SSH anomalies derived from the HYCOM reanalysis. Right panels: Same as middle panels except for surface currents and SSH (total).
The variations of upper ocean currents during February-September 2002 are displayed in right panels of Figure 6. During February, the Loop Current is extended northwestward in which the northern edge reaches around 27°N, 93°W. In March, the two anti-cyclonic circulations centered around 89°W, 26°N and 93°W, 26°N associated with high SSH are evident, and these anti-cyclonic circulations are separated from the high SSH in the southern portion of the basin. In May, these two anti-cyclonic circulations are merged, and continue to move westward. The center of the anti-cyclonic circulations is found around 94°W-24.5°N in June, and the western portion of the circulation reaches the Gulf Coast in September. During March-September, the anti-cyclonic circulations associated with high SSH are clearly isolated from surroundings and their westward propagation is evident. Note that the southward current right near the coast around 23°N-24°N in September shown in Figure 5 exists in the total field, but it is not found in Figure 6 due to the narrow width.
To further elucidate the Loop Current phase transition between February and March 2002, the detailed SSH and surface currents during early 2002 when the anti-cyclonic eddy is generated are fully described (Figure 7). The northwestward extension of the Loop Current started in late January, and the current continues to extend by February 10. The anti-cyclonic eddies started to separate from the Loop Current in mid-February. Then the two anti-cyclonic eddies are almost separated from the Loop Current by February 28, and the Loop Current retracted to the south after the eddy shedding. In early March, two anti-cyclonic eddies (also called Loop Current Eddies) originally separated from the Loop Current (eddy shedding) become completely isolated in the central Gulf of Mexico.
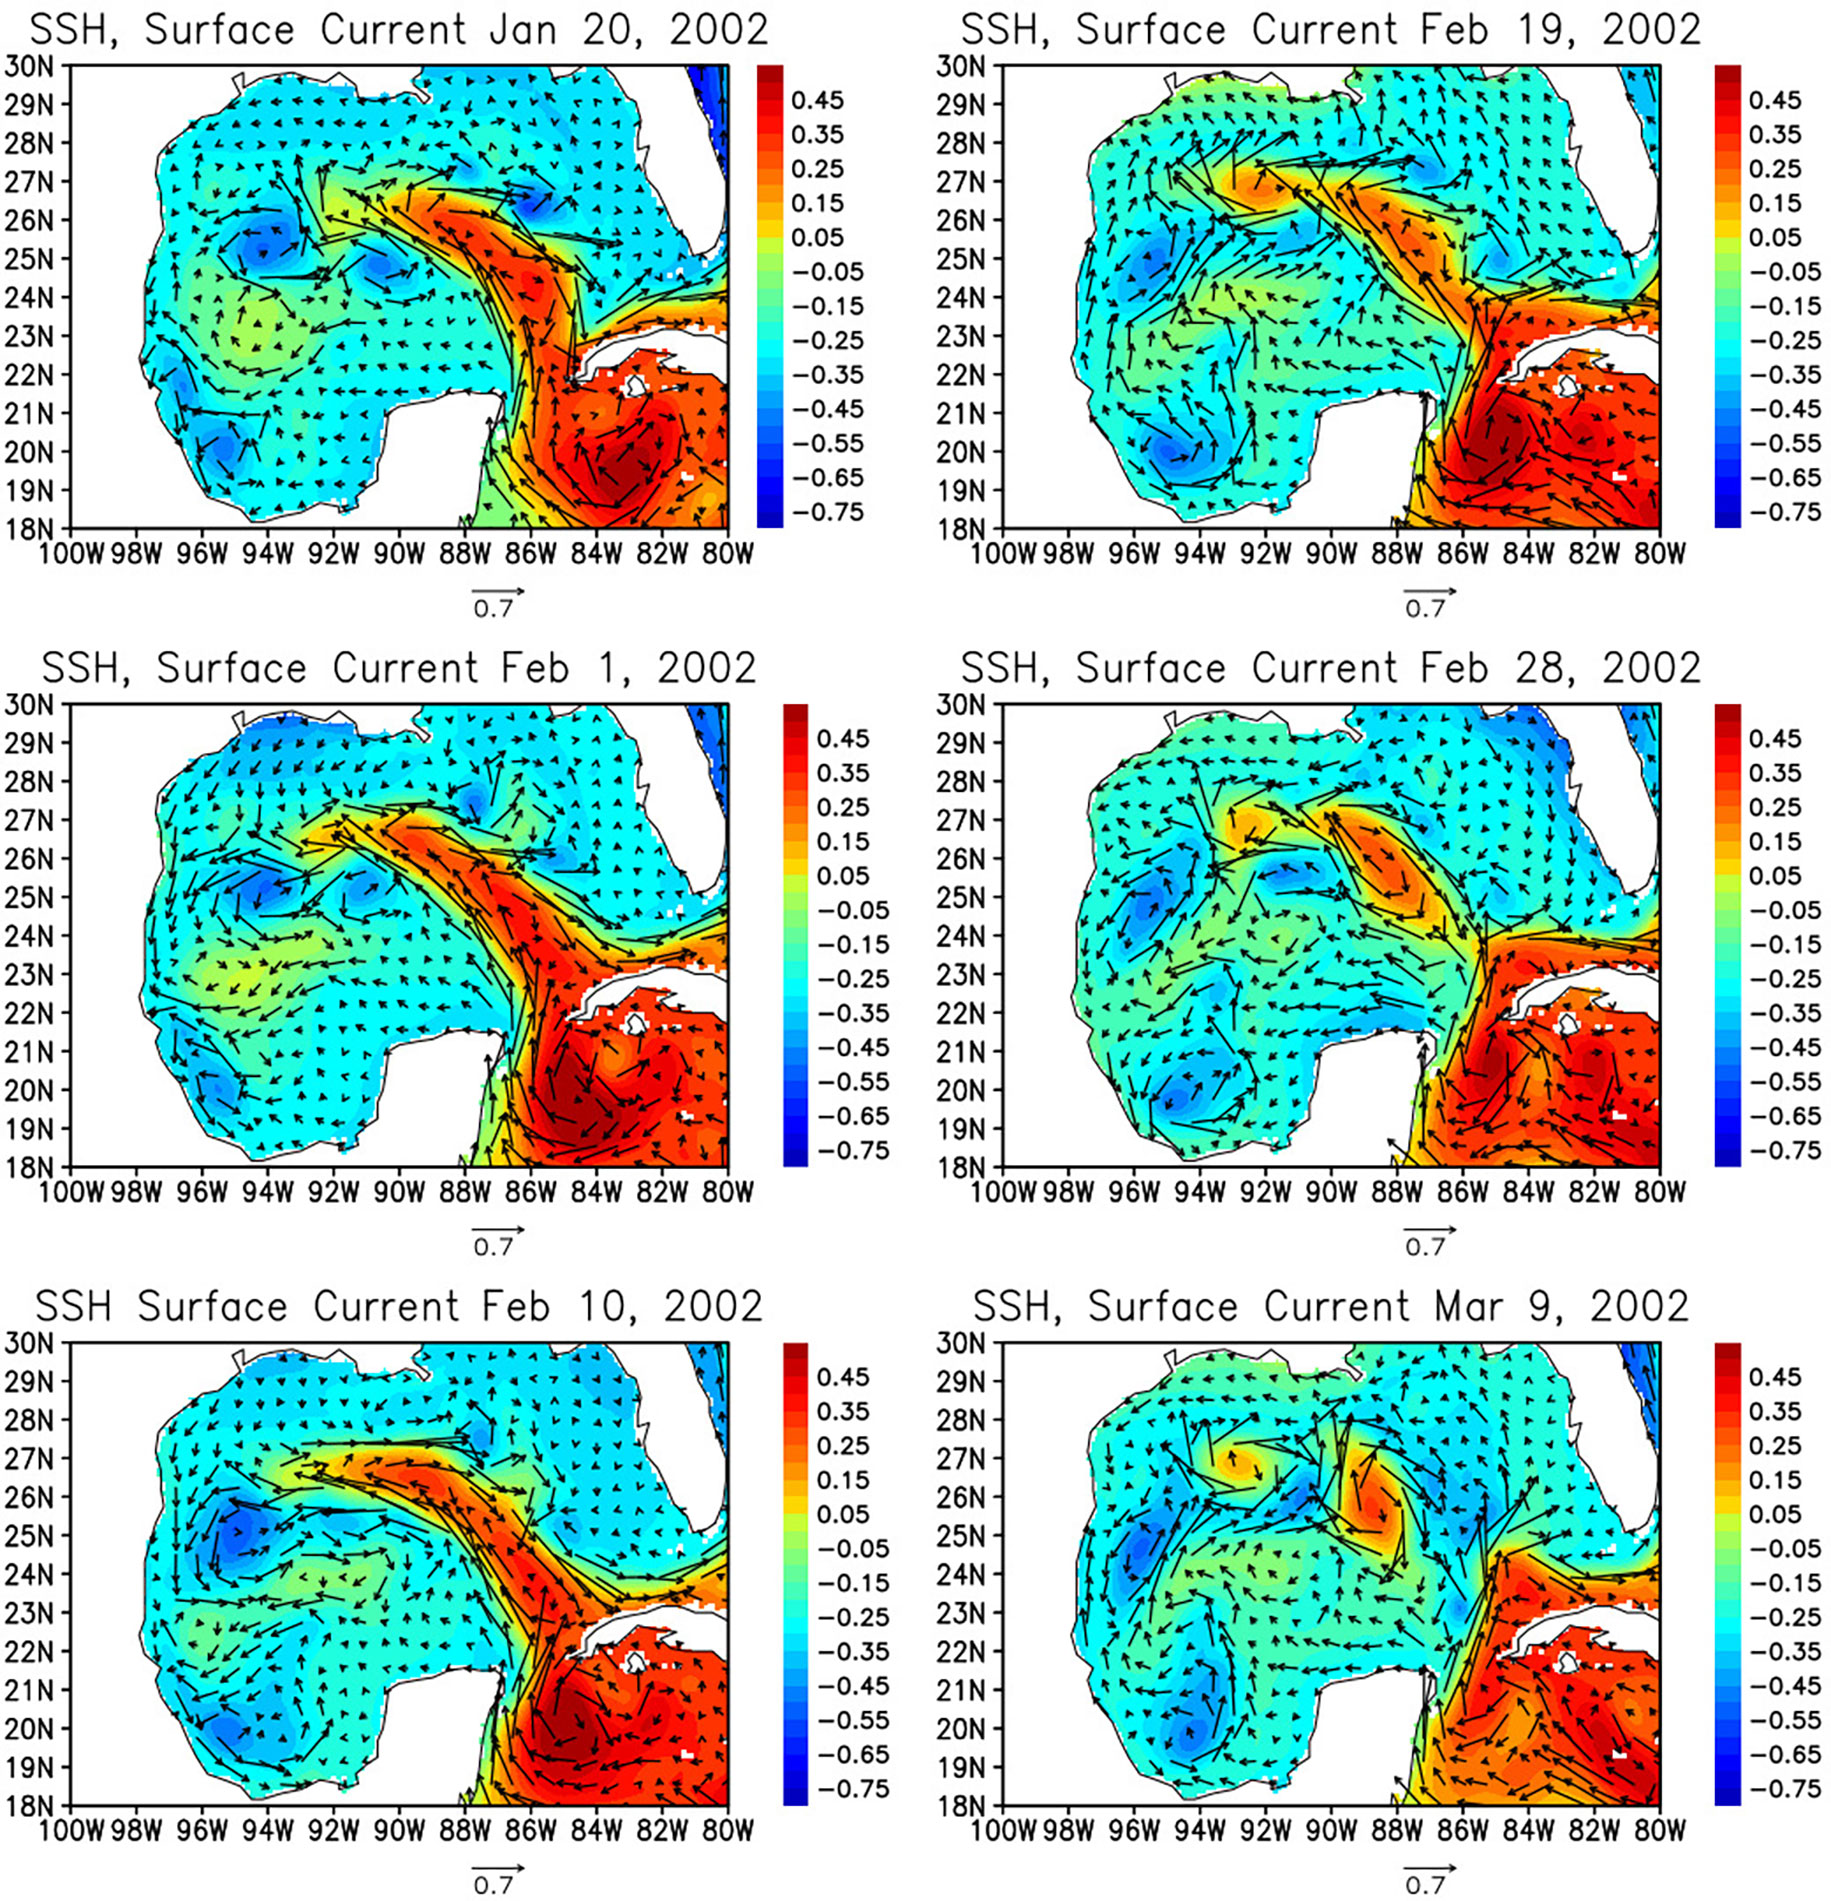
Figure 7 Surface currents (arrows) and SSH (shading) in January 20, February 1, 10, 19, 28, and March 9, 2002 derived from the HYCOM reanalysis.
It should be noted that local anomalous winds in the area of TCOON tide gauge stations during the peak period of this extreme SL rise event are cyclonic and northwesterly along the coast (Figure S1, Figure 4), which are somewhat favorable for the downwelling (SL increase). However, the direction of the wind anomalies is not along-shore since the zonal component is positive (0.35 m/s, westerly) although the southward component of about 2 m/s is observed (Figure S1, Figure 4). Also, the strength of the anomalous winds (~2.2 m/s for the area average) is not at all extreme (Figure S1, Figure 4). Hence, the contribution of the local winds is expected to be very minor for the SL rise event during this period.
The same analysis described in the previous section has been carried out for the period of the SL rise event observed in November 2015. The results are very similar to those for the 2002 event. Figure 8 shows the SSH and surface current anomalies from AVISO and HYCOM reanalysis in November 2015 when the SL anomalies from TCOON reach the peak value. The circulation patterns and SSH anomalies near the western Gulf Coast are similar to those during the 2002 event. The anti-cyclonic circulation around 25°N, 96°W is connected to southward alongshore currents. The southward along-shore currents north of the anti-cyclonic eddy directly flow towards the eastern side of the eddy, and thus a large meander of the southward currents is evident as the eddy moves close to the coast. The narrow southward currents right near the coast on the western side of the eddy are also evident in November. The anomalous SSH from the HYCOM reanalysis is consistent with that from the satellite altimeter measurements.
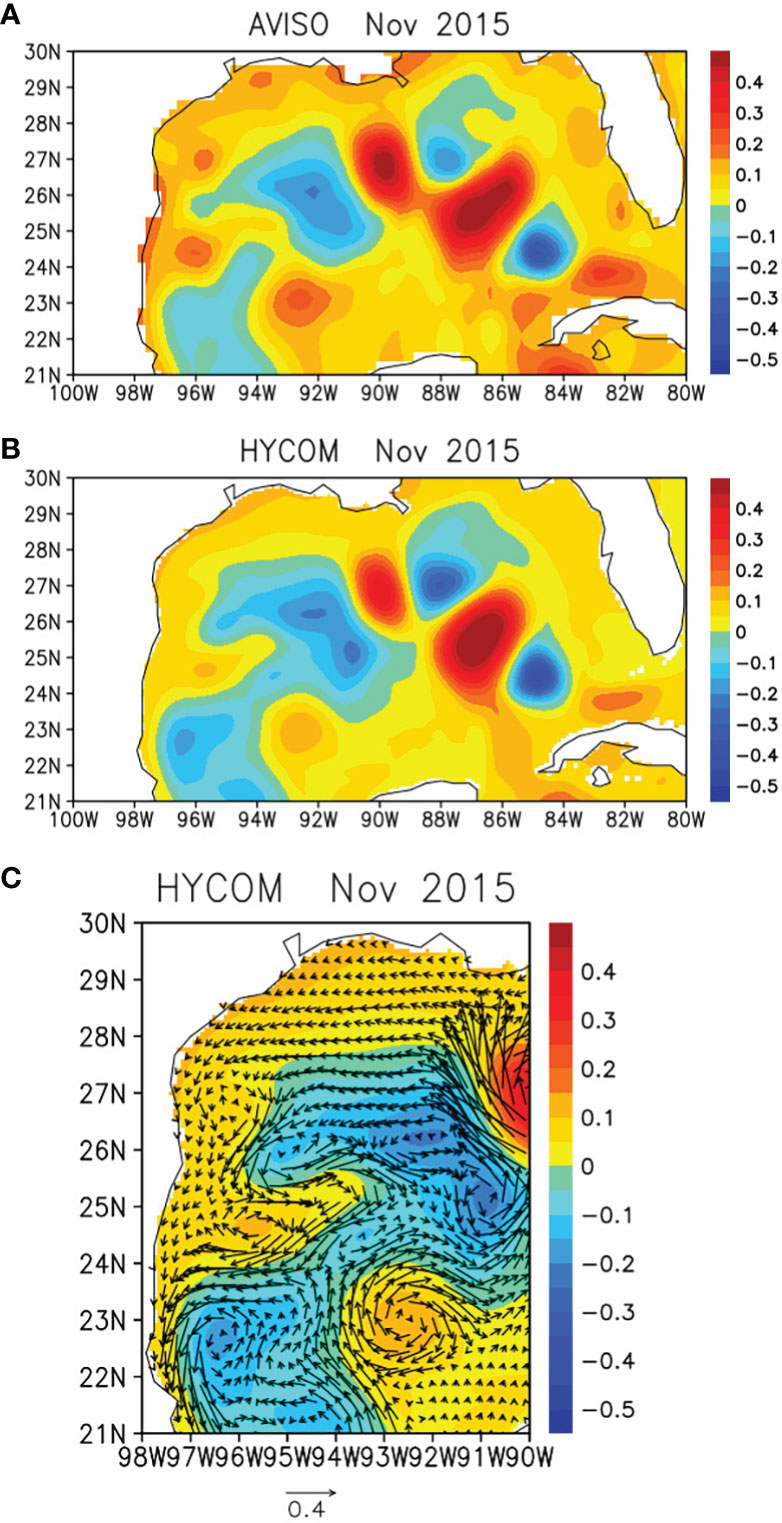
Figure 8 Same as Figure 5 except for November 2015.
The anti-cyclonic eddy near the western Gulf Coast in November can be traced back to the eddy shedding during April 2015 (Figure 9). The loop Current was extended to around 28°N in April, and eddies separated from the Loop Current split to three isolated eddies in June. Two of those eddies on the western side moved westward and merged in September during which the western edge of the eddy is very close to the coast. The western portion of the eddy reached the coast in November when the SL rise reveals the maximum value. As in the 2002 SL rise event, the anti-cyclonic eddy separated from the Loop Current is shown to contribute to the extreme SL rise event in 2015.
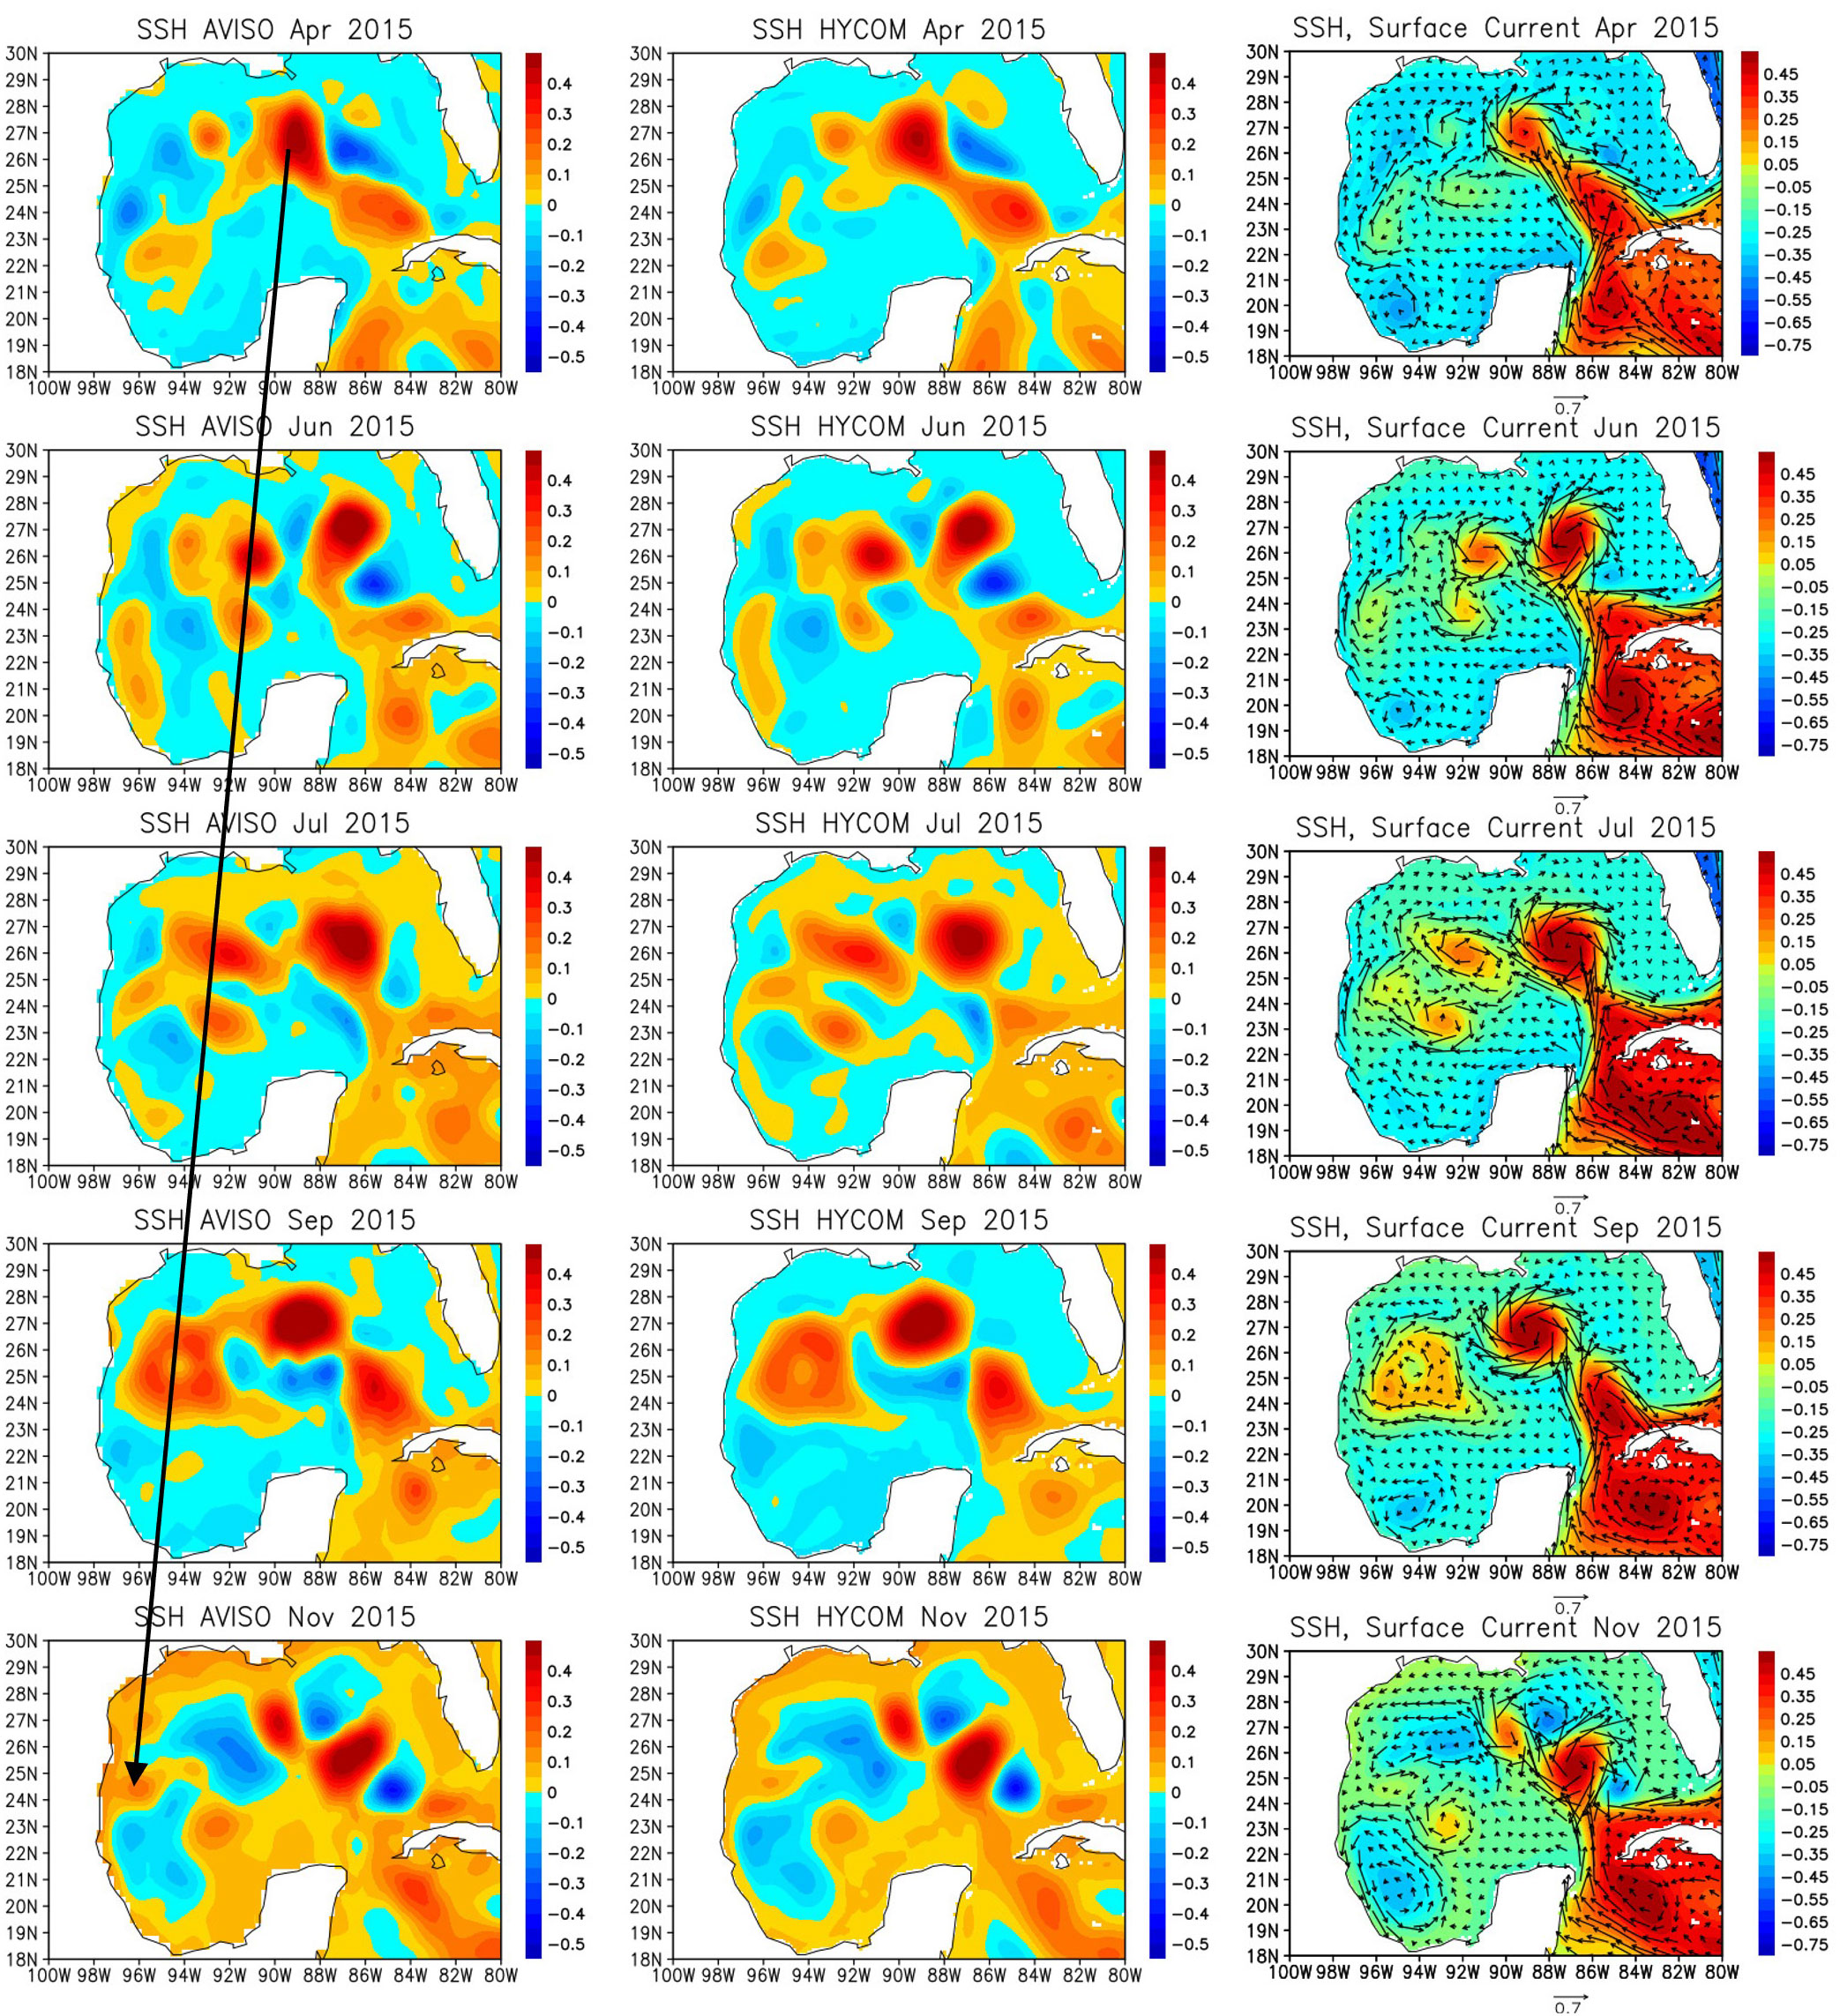
Figure 9 Same as Figure 6 except for April, June, July, September, and November 2015.
In addition to the eddy on the western side of the basin which propagated westward, another strong anti-cyclonic eddy in the northern Gulf of Mexico may also have contributed to this SL rise event (Figure 9). During April-June, the Loop Current Eddy splits into two eddies, and the eddy on the western side moved westward and affected SL in the western Gulf Coast as described above. The eddy on the eastern side moved slowly northwestward in June-September. In September-November, the eddy further splits into two eddies, and the one on the northwestern side moved further northwestward and the northern edge of the eddy reached the central Gulf Coast in November. The SSH anomalies along the coast spread to the western side, which appears to affect the SL rise along the western Gulf Coast. The direction of the spreading of SL anomalies are consistent with the coastal trapped waves (e.g., Adams and Buchwald, 1969; Gill and Clarke, 1974; Brink, 1991). However, it is difficult to detect the propagation of those waves in this case only from the available data. Previous observational studies reported that the phase peed of coastal trapped waves along the western Gulf Coast is about 4 m/s (Dubranna et al., 2011; Rivas, 2017). The high temporal and spatial resolutions of the data near the coast is required to detect such fast waves propagating through the short distance in this case.
The local wind forcing does not help to generate SL rise during this event (Figure S1). The winds in the western Gulf coast are predominantly easterlies, and the along-shore component is very small in the entire Texas coast.
Figure 10 shows The SSH and surface wind anomalies in July 2010 when the peak of SL anomaly from the TCOON data occurred. While the satellite-derived SSH shows the high positive anomaly along the Gulf Coast, anti-cyclonic eddies near the coast similar to those observed during the 2002 and 2015 events are not clearly evident. Although the same analysis for the 2002 and 2015 events described above are conducted, a significant contribution of eddies moved from the remote areas to the coastal SL rise is not identified during this event (not shown). Instead, the strong along-shore wind anomalies which are favorable for the SL rise (downwelling) are found almost the entire coastal areas in the western and northern Gulf Coast. Anomalous SL rise are found all the way to the west Florida coast. Since the SL fluctuations propagate westward as Kelvin or coastal trapped waves along the southern coast, the SL rise in the western Gulf Coast generated by local winds may not be recovered quickly. Hence, the large scale anomalous along-shore winds which cover the western and northern Gulf Coasts can maintain the SL rise in the western Gulf Coast for a relatively long time. Note that the anti-cyclonic eddy located around 96°W, 22.5°N in July, which appears to impinge on the shelf, and this eddy may have also contributed to maintain high SL along the coast. Note also that this eddy cannot be traced back directly to Loop Current Eddy shedding (not shown), and thus it seems to be developed locally in the western Gulf of Mexico
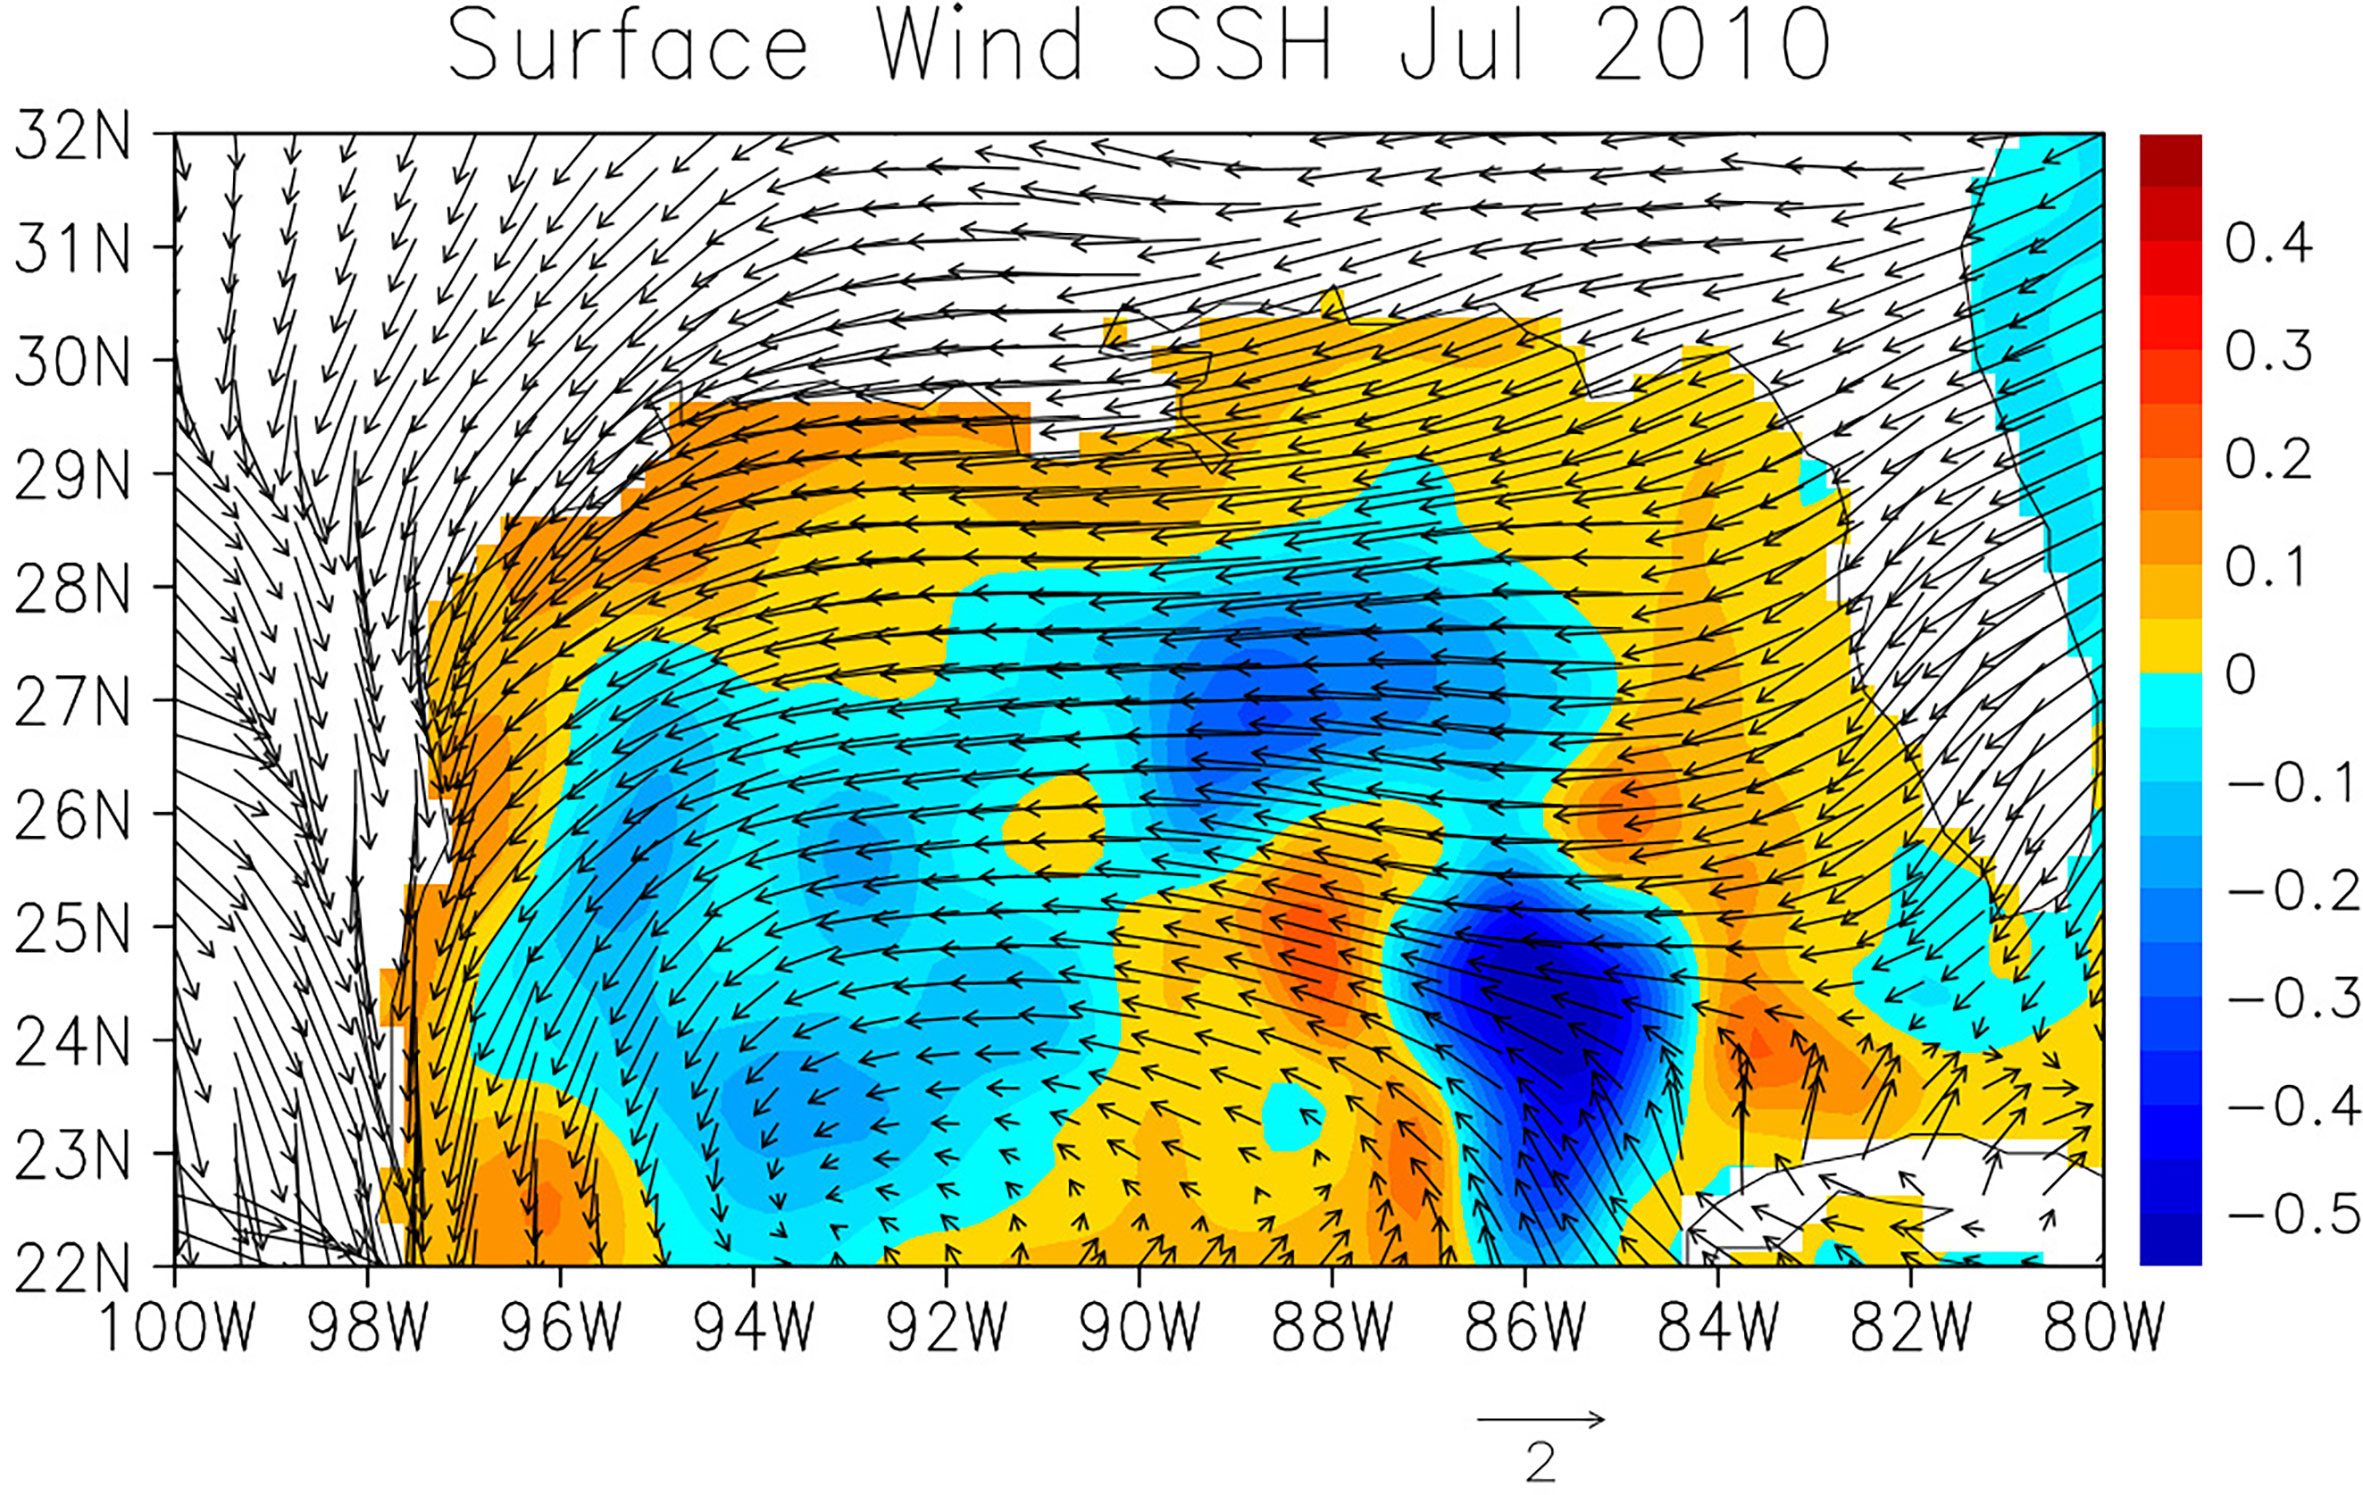
Figure 10 Anomalies of surface winds (arrows) and SSH (shading) from AVISO in July 2010.
An extreme SL rise event is observed in the mid-summer of 1995 in which the peak value is found in August (Figure 2). The westward movement of the anti-cyclonic eddy and its influence on the coastal SL is evident (Figure 11). However, during the peak period in August, the anti-cyclonic circulation associated with positive SSH anomalies near the center of the eddy is somewhat weaker compared to those in the 2002 and 2015 SL rise events. Although the positive SSH anomalies moved from the central Gulf of Mexico are connected to the SL rise along the coast, the eddy is located farther offshore about 4° from the coast.
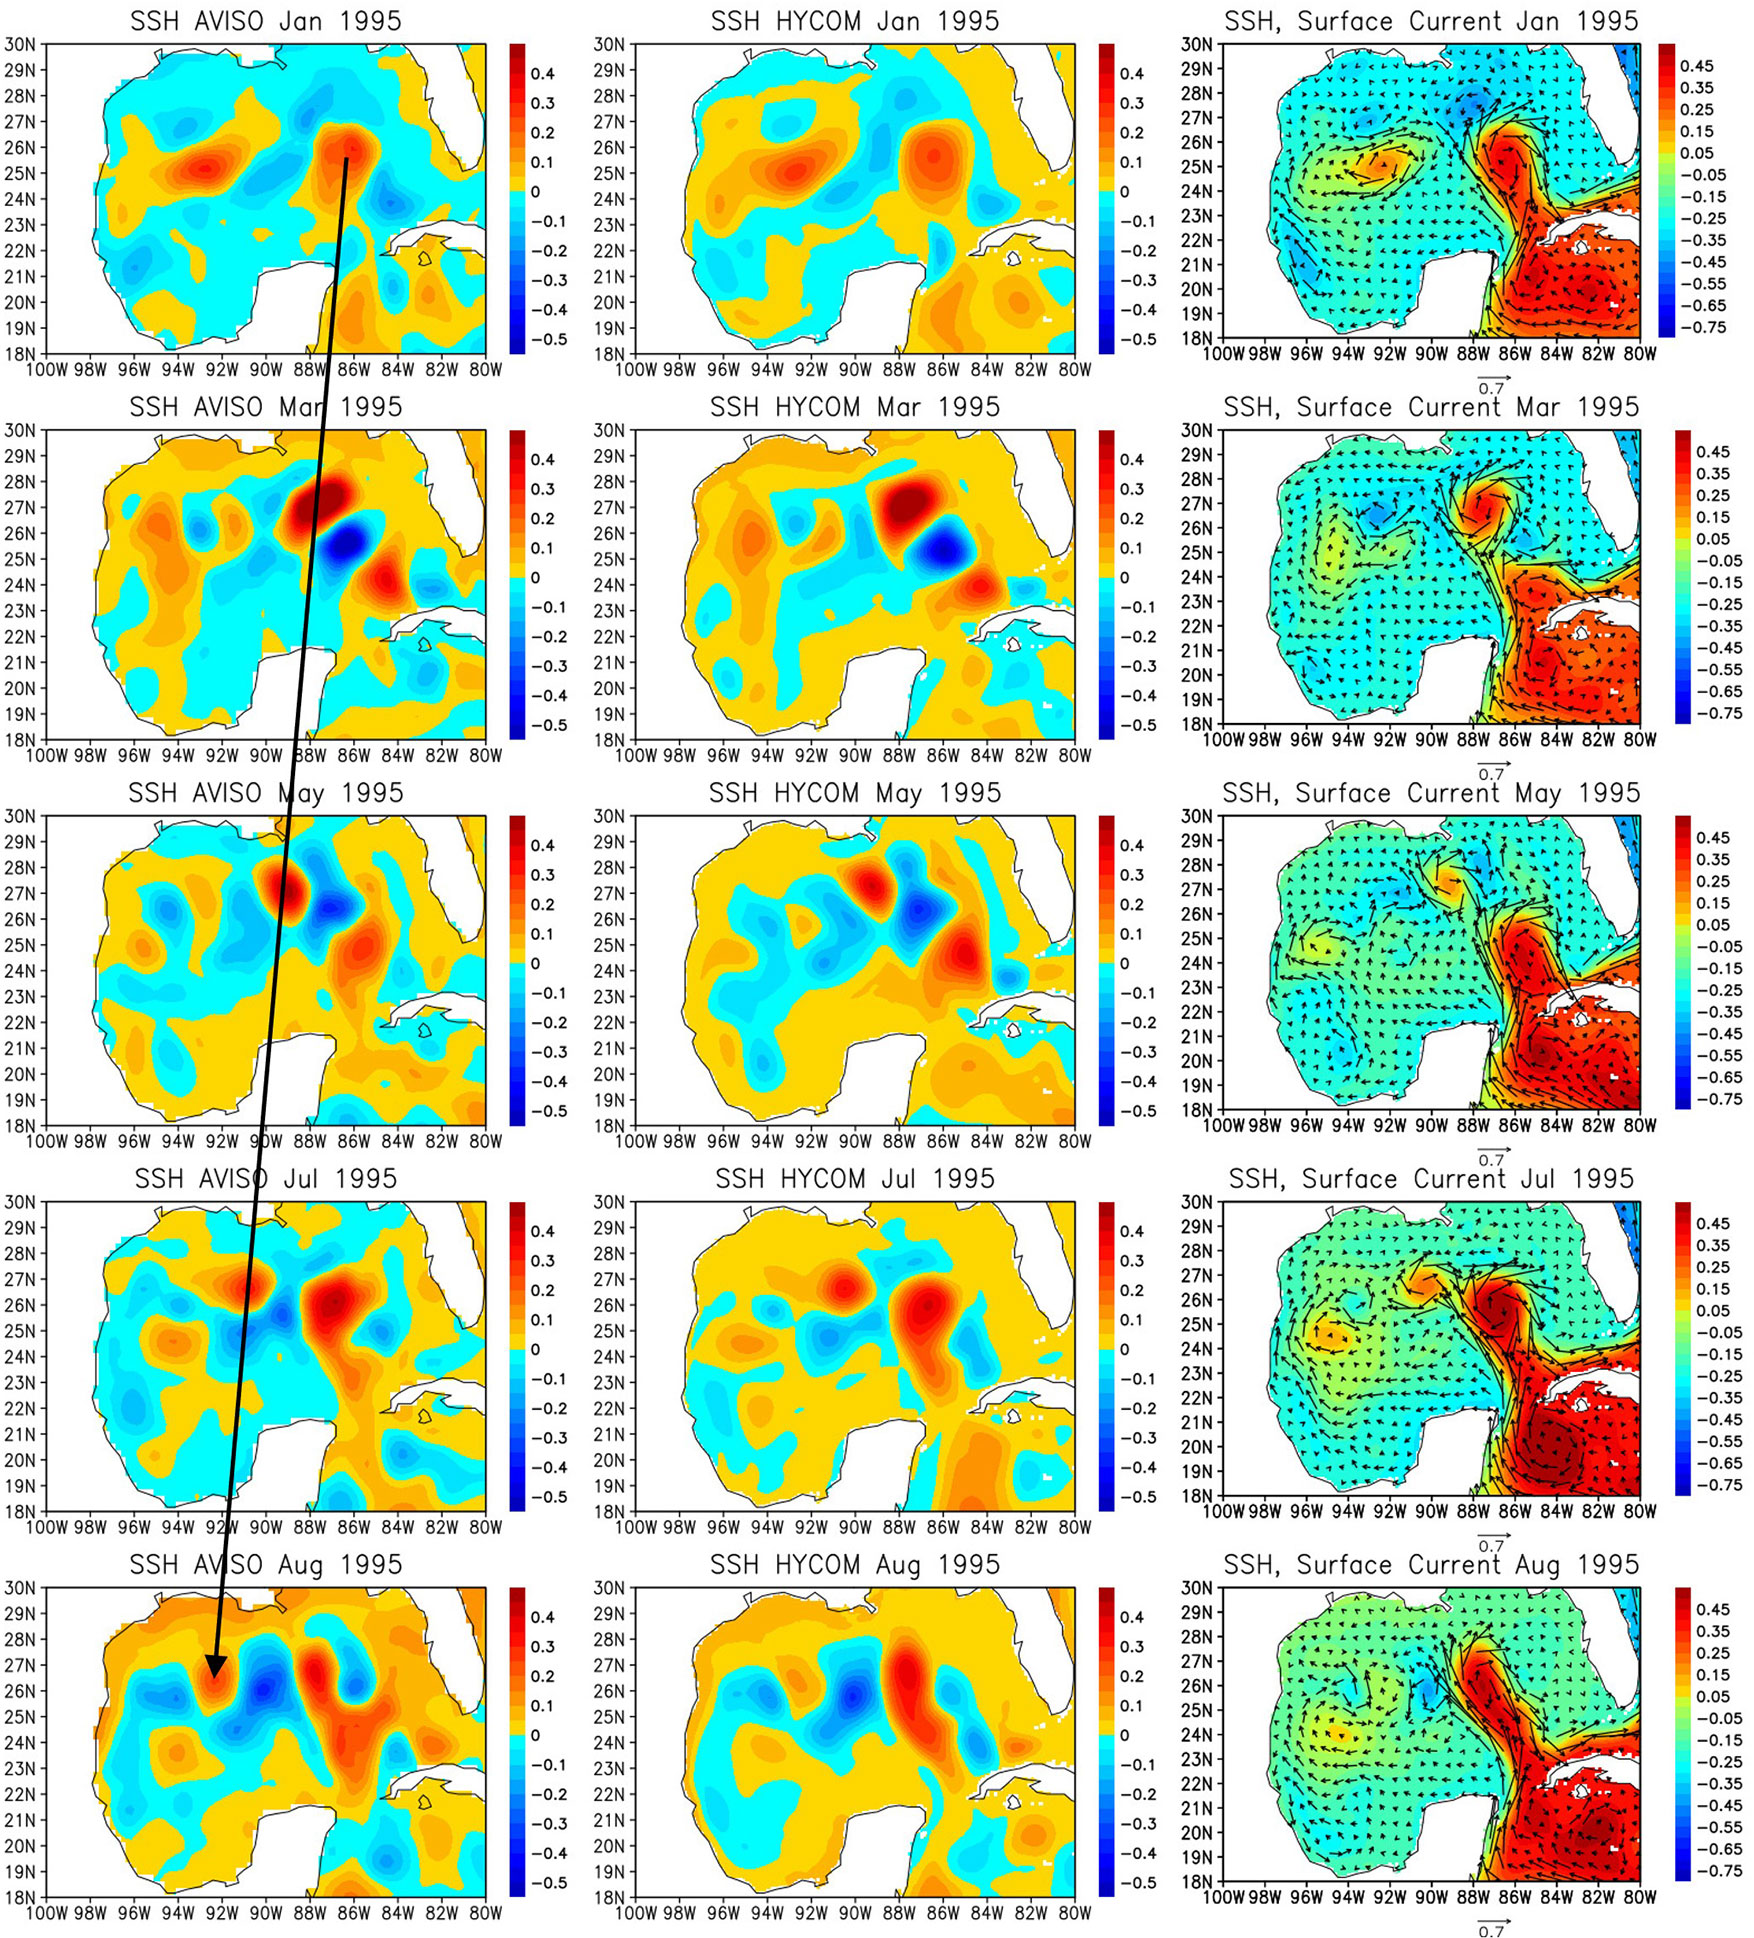
Figure 11 Same as Figure 6 except for January, March, May, July, and August, 1995.
During this period, there is another anti-cyclonic eddy located around 94°W, 24°N in August, which may have contributed to this SL rise event. This eddy was stronger in July and appears to start interacting with the coast (Figure 11 right panel). This eddy can be traced back to the eddy separated from the Loop Current before January 1995, which was located around 93°W, 25°N in January. Since this eddy is connected to high SL along the coast in July-August (Figure 11, left panel), it may have contributed to the SL rise event. However, the eddy is also located offshore about 3° from the coast, and thus other factors probably contribute to this SL rise event during this period.
Figure 12 shows the surface wind anomalies in August 1995. The anomalous northeasterly and northerly winds which are along-shore direction in the entire areas of TCOON stations are clearly evident. However, the anomalous alongshore winds are confined in the western portion of the Gulf Coast (compared to 2010 events in Figure 10), and thus these winds alone may not cause the extreme SL rise event. Hence, the analysis of winds and ocean circulations suggests that a combination of anti-cyclonic eddies originated from eddy shedding and the anomalous along-shore winds generates the SL rise event during this period.
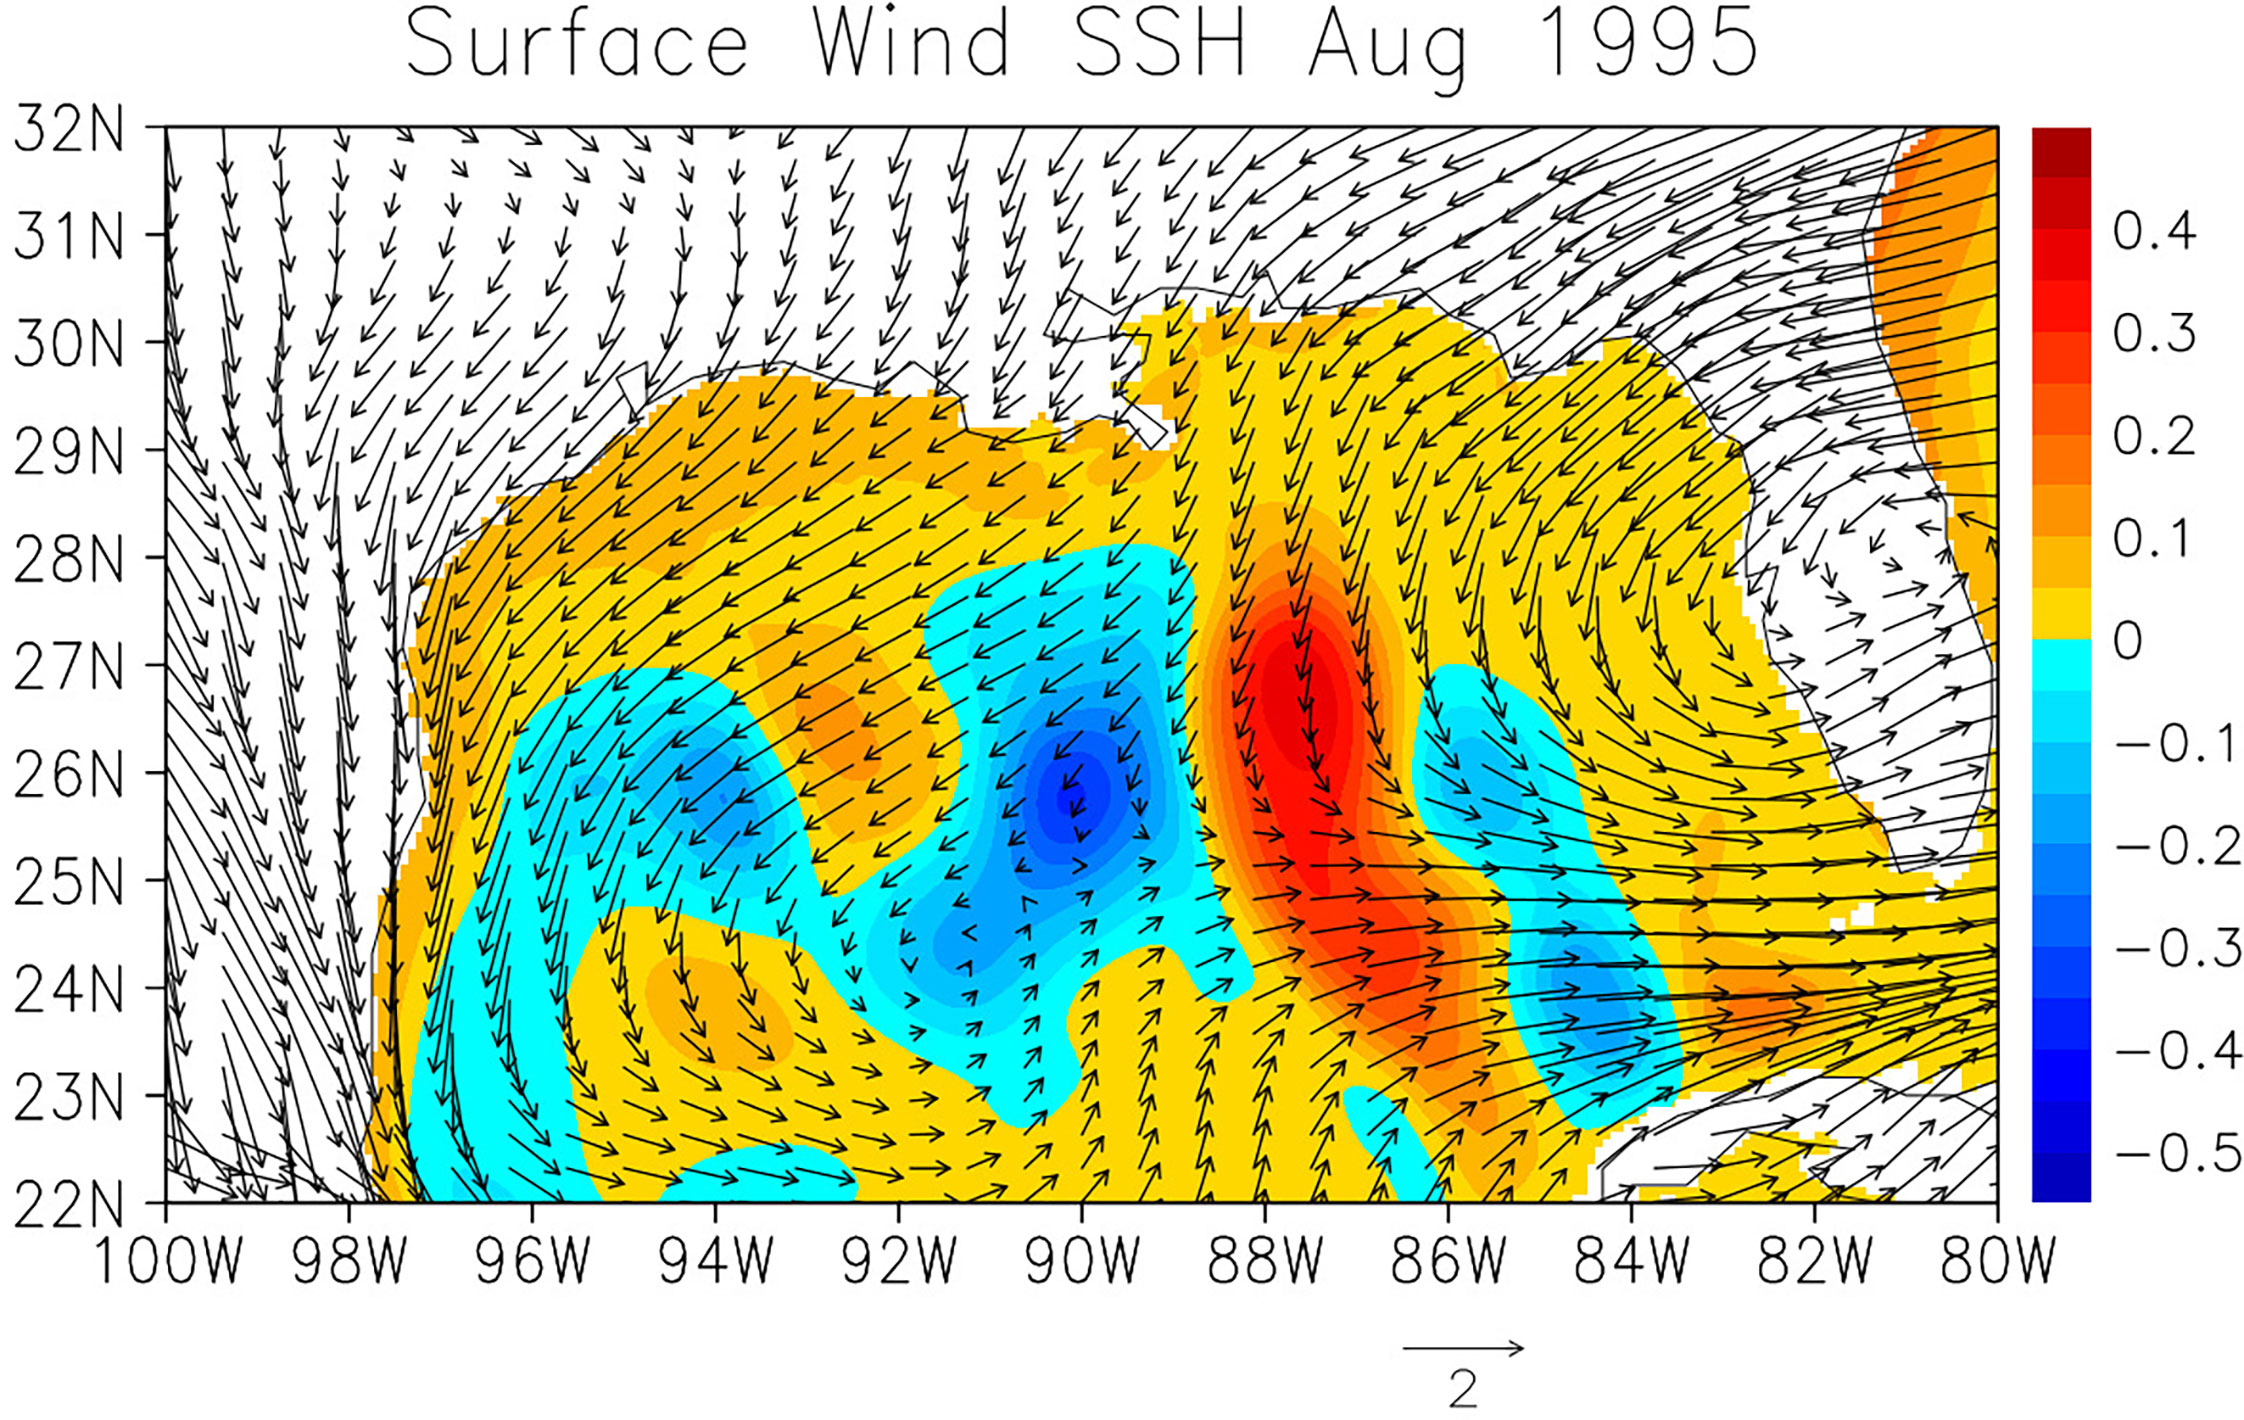
Figure 12 Same as Figure 10 except for August, 1995.
The same analysis described above is carried out for periods of all six SL rise events identified in the TCOON time series. Eddy shedding and subsequent westward movement of anti-cyclonic eddy is shown to contribute to the SL rise along the western Gulf Coast during the events in September 1998 and February 2005 (Figure S2, Figure S3). Table 1 summarizes the major physical processes that contribute to the SL rise events which include the period of eddy shedding. In five out of six events, anti-cyclonic eddies originated from eddy shedding of the Loop Current contribute to the SL rise. This suggests that ocean dynamics play an important role in generating extreme SL rise events at least on the subseasonal time scale.
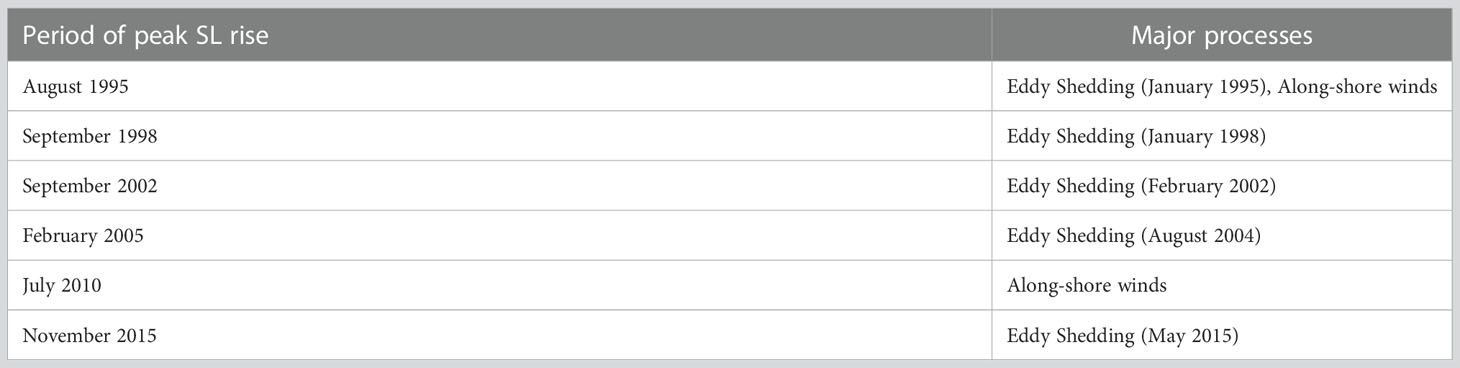
Table 1 Periods of extreme SL rise events and associated major processes.
The eddy shedding occurs 6-8 months before the peak SL rise in the western Gulf Coast. Hence, the information on the variability of Loop Current and eddy shedding such as the location and strengths of anti-cyclonic eddy several months in advance could help to predict the SL rise along the western Gulf Coast. Although not all eddies separated from the Loop Current affect the Gulf Coast SL rise events, the results at least suggest that the accurate prediction of the ocean circulations in the entire Gulf of Mexico is necessary for the accurate forecast of coastal SL rise event with the lead time of several months.
Oceanic and atmospheric processes that generate subseasonal sea level (SL) rise events along the western Gulf Coast are investigated using Texas Coastal Ocean Observing Network (TCOON) and National Water Level Observation Network (NWLON) tide gauge data, the high-resolution (0.08°) ocean reanalysis, surface winds from the reanalysis, and satellite altimetry data. The time series of SL measured by TCOON and NWLON indicates that SL in the western Gulf Coast varies substantially on the subseasonal time scale. In particular, extreme subseasonal SL rise events which exceed 15 cm are observed once in every 2-5 years. The results indicate that most of such extreme subseasonal events are originated from the warm core anti-cyclonic eddy separated from the Loop Current which propagates westward. The anti-cyclonic eddies then reach the western Gulf Coast, resulting in prominent SL rise which lasts about 1-2 months. While the local wind forcing in the western Gulf Coast does not show extreme values and only weakly correlated, the analysis also suggests that large-scale along-shore winds over the entire western and northern Gulf Coast can cause such extreme SL rise events.
The results indicate that extreme SL rise events occur about 6-8 months after a strong anti-cyclonic eddy is formed by eddy shedding in the central Gulf of Mexico. Hence, the large-scale ocean circulations in the Gulf of Mexico needs to be monitored well to accurately predict the SL rise in the western Gulf of Mexico with the lead time of several months. In other words, the information of the ocean variability in the central Gulf of Mexico may help improve the SL prediction in the Gulf Coast. However, it is still a major challenge to predict the behavior of separated eddies including their westward movement. In general, the strong eddies separated from the Loop Current move westward, and some of the strong eddies are evident until they reach the western coast, resulting in generating the coastal SL rise. However, the behavior of the Loop Current Eddies are often complex. As shown in the several examples in this study, eddies sometimes split to multiple eddies or merge with other eddies, and their strength changes substantially during the westward movement. These variations are determined by a combinations of different processes including internal ocean variability, the effect of atmospheric forcing and the large-scale ocean circulation. It is still unclear whether such detailed behavior of eddy movement is predictable, and the accurate prediction of strength and location of eddies at least requires further improvement of ocean component in the prediction system.
The results suggest that some of the SL events are caused by a combination of eddy-shedding and local wind forcing near the coast. However, the relative importance of these processes cannot be quantified based only on the data analyses. A numerical modeling study is necessary to further quantify the physical processes that cause SL rise events. For example, sensitivity simulations of ocean model in which the anomalous wind forcing is removed could isolate the impact of ocean dynamics. Further studies using high-resolution numerical experiments which can adequately resolve the coastal SL fluctuation are necessary to isolate and quantify key physical processes.
In this study, physical processes associated with only extreme SL rise events are discussed. While the dominant processes that contribute to such extreme events could be identified, smaller SL rise events of about 10 cm are frequently observed in the western Gulf Coast. However, it is difficult to identify dominant processes that cause such events. Many SL rise events with such magnitude may be caused by a combination of multiple processes. In the western Gulf of Mexico, eddy activity is relatively high, and mesoscale and submesoscale eddies are often observed. Although these eddies may not be as strong as the warm-core eddies generated through eddy shedding, weaker eddies may still influence SL along the coast. Since smaller fluctuations of SL are caused by these oceanic processes as well as atmospheric forcing such as along-shore winds, it is difficult to fully identify all physical processes associated with subseasonal SL fluctuations only from the available data. In particular, high-resolution data near the coast are required to adequately resolve the variability caused by coastal processes. As the higher resolution satellite-derived SL will become available from SWOT (Surface Water Ocean Topography) mission (e.g., Wang et al., 2018) in coming years, such data may provide useful information for the further study of coastal SL variations.
The analysis of TCOON and NWLON data indicates that the SL time series are positively skewed. The possible reason could be the asymmetry of cyclonic and anti-cyclonic eddies in the western portion of Gulf of Mexico. Because of the asymmetry of eddy separation processes from the Loop Current, more anti-cyclonic eddies are found in the western Gulf of Mexico, while more cyclonic eddies are evident in the eastern Gulf of Mexico (e.g., Vukovich, 2007). The frequent influence of anti-cyclonic eddies on western Gulf Coast SL may result in skewed distribution of SL anomalies at the coast.
The Loop Current is part of the western boundary current connected to Gulf Stream, and thus it is part of the upper branch of the Atlantic Meridional Overturning Circulation (AMOC). Recent studies suggest that the AMOC is changing in a warming climate (e.g., Liu et al., 2017; Boers, 2021), and thus it is expected that the behavior of the Loop Current including its strength, frequency of eddy shedding, the strength and location of anti-cyclonic rings separated from the Loop Current will be changing in the coming decades. Such changes may influence the skewness of the SL anomaly distribution, and it may in turn affect the longer-term variation of the coastal SL through the skewness changes. Hence, understanding the dynamics of long-term changes in the Loop Current strength and its impact on eddy shedding is crucial for the future SL projection along the Gulf Coast.
The original contributions presented in the study are included in the article/Supplementary Material. Further inquiries can be directed to the corresponding author.
TS conceived the idea and designed and performed most of the analysis. PT and AR contributed to complete the analysis of TCOON data. TS wrote the paper, and other co-authors assisted in writing it. All authors contributed to the article and approved the submitted version.
TS acknowledges support from NOAA Grant NA17OAR4310256 and DOD Grant W911NF-20-1-0309. PT acknowledges support from the National Science Foundation award 2019758.
The authors declare that the research was conducted in the absence of any commercial or financial relationships that could be construed as a potential conflict of interest.
All claims expressed in this article are solely those of the authors and do not necessarily represent those of their affiliated organizations, or those of the publisher, the editors and the reviewers. Any product that may be evaluated in this article, or claim that may be made by its manufacturer, is not guaranteed or endorsed by the publisher.
The Supplementary Material for this article can be found online at: https://www.frontiersin.org/articles/10.3389/fmars.2022.1049550/full#supplementary-material
Adams J. K., Buchwald V. T. (1969). The generation of continental shelf waves. J. Fluid Mech. 35, 815–826.
An B. W., McDonald N. R. (2005). Coastal currents and eddies and their interaction with topography. Dynamics Atmospheres Oceans 40, 237–253. doi: 10.1016/j.dynatmoce.2005.04.002
Bleck R. (2002). An oceanic general circulation model framed in hybrid isopycnic-Cartesian coordinates. Ocean Model. 4, 55–88. doi: 10.1016/S1463-5003(01)00012-9
Boers N. (2021). Observation-based early-warning signals for a collapse of the Atlantic meridional overturning circulation. Nat. Climate Change 11, 680–688. doi: 10.1038/s41558-021-01097-4
Boon J. D., Mitchell M., Loftis J. D., Malmquist D. L. (2018). Anthropocene Sea level change: A history of recent trends observed in the U.S. East, gulf, and West coast regions. special report in applied marine science and ocean engineering (SRAMSOE) no. 467 (Virginia Institute of Marine Science, William & Mary). doi: 10.21220/V5T17T
Brink K. H. (1991). Coastal-trapped waves and wind-driven currents over the continental shelf. Annu. Rev. Fluid Mech. 23, 389–412.
Chassignet E. P., Hurlburt H. E., Smedstad O. M., Barron C. N., Ko D. S., Rhodes R. C., et al. (2005). “Assessment of ocean data assimilative systems in the Gulf of Mexico using ocean color,” in AGU monograph “New developments in the circulation of the Gulf of Mexico, vol. Vol. 161 . Eds. Sturges W., Fernandez L.-.(AGU, Washington DC), pp 87–pp100.
Chen X., Qiu B., Cheng X., et al. (2015). Intra-seasonal variability of pacific-origin sea level anomalies around the Philippine archipelago. J. Oceanogr, 71, 239–249. doi: 10.1007/s10872-015-0281-9
Coats D. A. (1992). “The loop current,” in In the physical oceanography of the U.S. Atlantic and Eastern Gulf of Mexico, U.S. dept of the interior, mineral management service, Atlantic OCS region. Eds. Milliman J. D., Imamura E.(Herndon, Va.), Chapter 6.
Cochrane J. D. (1972). “Separation of an anticyclone and subsequent developments in the loop current, (1969),” in Contributions on the physical oceanography of the Gulf of Mexico. Eds. Capurro L. R. A., Reid J. L. (Houston, Texas: Gulf Publishing Co.), 91–106.
Cummings J. A., Smedstad O. M. (2013). “Variational data assimilation for the global ocean,” in Data assimilation for atmospheric, oceanic and hydrologic applications, vol. Vol. II). (Springer Berlin Heidelberg), 303–343. doi: 10.1007/978-3-642-35088-7
Dubranna J., Pérez-Brunius P., López M., Candela J. (2011). Circulation over the continental shelf of the western and southwestern Gulf of Mexico. J. Geophys. Res. 116, C08009. doi: 10.1029/2011JC007007
Espinoza V., Waliser D. E., Guan B., Lavers D. A., Ralph F. M. (2018). Global analysis of climate change projection effects on atmospheric rivers. Geophys Res. Lett. 45 (9), 4299–4308. doi: 10.1029/2017GL076968
Ezer T., Atkinson L. P., Corlett W. B., Blanco J. L. (2013). Gulf stream's induced sea level rise and variability along the U.S. mid-Atlantic coast. J. Geophys. Res. 118 (2), 685–697. doi: 10.1002/jgrc.20091
Feng X., Shinoda T., Han W. (2022). Topographic trapping of the leeuwin current and its impact on the Ningaloo Niño. J. Climate. doi: 10.1175/JCLI-D-22-0218.1
Frolov S. A., Sutyrin G. G., Rowe G. D., Rothstein M. (2004). Loop current eddy interaction with the Western boundary in the Gulf of Mexico. J. Phys. Oceanogr. 34, 2223–2237. doi: 10.1175/1520-0485(2004)034<2223:LCEIWT>2.0.CO;2
Gill A. E., Clarke A. J. (1974). Wind-induced upwelling, coastal currents and sea-level changes. Deep-Sea Res. 21, 325–345.
Han W., Meehl G. A., Hu A., Alexander M., Yamagata T., Yuan D., et al. (2014). Intensification of decadal and multi-decadal sea level variability in the western tropical pacific during recent decades. Clim. Dyn. 43, 1357–1379. doi: 10.1007/s00382-013-1951-1
Han W., Meehl G. A., Rajagopalan B., Fasullo J., Hu A., Lin J., et al. (2010). Patterns of Indian ocean sea level change in a warming climate. Nat. Geosci 3, 546-550. doi: 10.1038/NGEO901
Helber R. W., Townsend T. L., Barron C. N., Dastugue J. M., Carnes M. R. (2013). Validation test report for the improved synthetic ocean profile ( ISOP ) system. Part I : Synthetic Profile Methods and. NRL Memo. Rep., 1–6.
IPCC (2022). “Climate change 2022: Impacts, adaptation, and vulnerability,” in Contribution of working group II to the sixth assessment report of the intergovernmental panel on climate change. Eds. Pörtner H.-O., Roberts D. C., Tignor M., Poloczanska E. S., Mintenbeck K., Alegría A., Craig M., Langsdorf S., Löschke S., Möller V., Okem A., Rama B. (Cambridge University Press).
Isoda Y. (1996). Interaction of a warm eddy with the coastal current at the eastern boundary area in the tsushima current region. Continental Shelf Reseacrh 16, 1149–1163. doi: 10.1016/0278-4343(95)00057-7
Leben R. R. (2005). “Altimeter-derived loop current metrics,” in Circulation in the Gulf of Mexico: Observations and models, geophys, vol. vol. 161 . Eds. Sturgesand W., Lugo-Fernandez A.(AGU, Washington, D. C), 181–201.
Liu W., Xie S.-P., Liu Z., Zhu J. (2017). Overlooked possibility of a collapsed Atlantic Meridional Overturning Circulation in warming climate. Science Adv. 3, e1601666. doi: 10.1126/sciadv.1601666
Maul G. A. (1977). The annual cycle of the gulf loop current, part I: Observations during a one-year time series. J. Mar. Res. 35, 29–47.
Metzger J. E., Smedstad O. M., Thoppil P. G., Hurlburt H. E., Cummings J. A., Wallcraft A. J., et al. (2014). US Navy operational global ocean and Arctic ice prediction systems. Oceanography 27, 32–43. doi: 10.5670/oceanog.2014.66
Miline G. A., Gehrels W. R., Hughes C. W., Tamisiea M. E.. (2009). Identifying the causes of sea-level change. Nature. Geosci. 2, 471–478. doi: 10.1038/ngeo544
Minobe S., Terada M., Qiu B., Schneider N. (2017). Western Boundary sea level: a theory, rule of thumb, and application to climate models. J. Phys. Oceanogr. 47 (5), 957–977. doi: 10.1175/JPO-D-16-0144.1
Mooers C. N. K., Maul G. A. (1998). “Intra-americas Sea circulation,” in The Sea, vol. Vol. 11 . Eds. Brink K. H., Robinson A. R. (NY: John Wiley), pp.183–pp.208.
Nof D. (1984). On the interaction between thin isolated eddies and longshore currents. J. Phys. Oceanogr 14, 125–137.
O’Brien T. A., et al. (2021). Increases in future AR count and size: Overview of the ARTMIP tier 2 CMIP5/6 experiment. JGR-Atmosphere 127, e2021JD036013. doi: 10.1029/2021JD036013
Qiu B., Chen S., Wu L., Kida S. (2015). Wind- versus eddy-forced regional sea level trends and variability in the north pacific ocean. J. Climate 28, 1561–1577.
Rivas D. (2017). Wind-driven coastal-trapped waves off southern tamaulipas and northern veracruz, western Gulf of Mexico, during winter 2012–2013. Estuar. Coast. Shelf Sci. 185, 1–10. doi: 10.1016/j.ecss.2016.12.002
Rizzo J., Tissot P., Duff S. (2014). The Texas coastal ocean observation network. 2014 Oceans - St. John's. doi: 10.1109/OCEANS.2014.7003131
Saha S., Moorthi S., Pan H.-L., Wu X., Wang J., Nadiga S., et al. (2010). The NCEP climate forecast system reanalysis. Bull. Amer. Meteor. Soc 91, 1015.1057. doi: 10.1175/2010BAMS3001.1
Saha S., Moorthi S., Wu X., Wang J., Nadiga S., Tripp P., et al. (2014). The NCEP climate forecast system version 2. J. Climate 27, 2185–2208. doi: 10.1175/JCLI-D-12-00823.1
Schmitz, Biggs D. C., Lugo-Fernandez A., Oey L.-Y., Sturges W.. (2005). “A synopsis of the circulation in the Gulf of Mexico and on its continental margins,” in Circulation in the Gulf of Mexico: Observations and models, geophysical mongraphs series. Eds. Sturges W. T., Lugo-Fernandez A. (Washington DC: American Geophysical Union), 11–29. doi: 10.1029/161GM03
Shay L. K., Goni G. J., Black P. G. (2000). Effects ofa warm oceanic feature on hurricane opal. Mon. Wea. Rev. 128, 1366–1138. doi: 10.1175/1520-0493(2000)128<1366:EOAWOF>2.0.CO;2
Shay L. K., Mariano A. J., Jacob S. D., Ryan E. H. (1998). Mean and near-inertial ocean current response to hurricane Gilbert. J. Phys. Oceanogr 28 (5), 858–889. doi: 10.1175/1520-0485(1998)028<0858:MANIOC>2.0.CO;2
Shinoda T., Han W., Zamudio L., Feng X. (2020). Influence of atmospheric rivers on the leeuwin current system. Clim. Dyn. 54, 4263–4277. doi: 10.1007/s00382-020-05228-z
Shinoda T., Zamudio L., Guo Y., Metzger E. J., Fairall C. (2019). Ocean variability and air-sea fluxes produced by atmospheric rivers. Sci. Rep 9. doi: 10.1038/s41598-019-38562-2
Sturges W., Leben R. (2000). Frequency of ring separations from the loop current in the Gulf of Mexico: A revised estimate. J. Phys. Oceanogr. 30, 1814–1818.
Sweet W., Dusek G., Carbin G., Marra J., Marcy D., Simon S. (2021). 2019 state of U.S. high tide flooding with a 2020 outlook (NOAA Technical Report NOS CO-OPS 092). doi: 10.1175/1520-0485(2000)030<1814:FORSFT>2.0.CO;2
Thoppil P. G., Metzger E. J., Hurlburt H. E., Smedstad O. M., Ichikawa H. (2016). The current system east of the Ryukyu islands as revealed by a global ocean reanalysis. Prog. Oceanogr. 141, 239–258. doi: 10.1016/j.pocean.2015.12.013
Unnikrishnan A. S., Shanker D. (2007). Are sea-level-rise trends along the coasts of north Indian ocean consistent with global estimate? Global Planet. Change 57, 301–307. doi: 10.1016/j.gloplacha.2006.11.029
Vic C., Roullet G., Capet X., Carton X. J., Molemaker M. J., Gula J.. (2015). Eddy- topography interactions and the fate of the Persian gulf outflow. J. Geophys Res. Oceans Wiley-Blackwell 120 (10), 6700–6717. doi: 10.1002/2015JC011033
Vukovich F. M. (1995). An updated evaluation of the loop currents eddy shedding frequency. J. Geophys. Res. 100, 8655–8659. doi: 10.1029/95JC00141
Vukovich F. M. (2007). Climatology of ocean features in the Gulf of Mexico using satellite remote sensing data. J. Phys. Oceanogr. 37, 689–707. doi: 10.1175/JPO2989.1
Wang J., Fu L.-L., Qiu B., Menemenlis D., Farrar J. T., Chao Y., et al. (2018). An observing system simulation experiment for the calibration and validation of the surface water and ocean topography sea surface height measurement using in-situ platforms. J. Atmos. Oceanic Technol 35, 281-297. doi: 10.1175/JTECH-D-17-0076.1
Wang G., Zhou X., Wang K., Ke X., Zhang Y., Zhao R., et al. (2020). GOM20: A stable geodetic reference frame for subsidence, faulting, and Sea-level rise studies along the coast of the Gulf of Mexico. Remote Sens. 12 (3), 350. doi: 10.3390/rs12030350
Wiseman W. J. Jr, Dinnel S. P. (1988). Shelf current near the mouth of the Mississippi river. J. Phys. Oceanogr 18 (9), 1287–1291. doi: 10.1175/1520-0485(1988)018<1287:SCNTMO>2.0.CO;2
Woodworth P. L., White N. J., Jevrejeva S., Holgate S. J., Church J. A., Ghrels W. R., et al. (2009). Evidence for the acceleration of sea level on multi-decade and century time scales. Int. J. Climatol. 29, 777–789.
Yu Z., Metzger E. J., Thoppil P., Hurlburt H. E., Zamudio L., Smedstad O. M., et al. (2015). Seasonal cycle of volume transport through kerama gap revealed by a 20-year global HYbrid coordinate ocean model reanalysis. Ocean Model. 96, 203–213. doi: 10.1016/j.ocemod.2015.10.012
Zamudio L., Hogan P. (2008). Nesting the Gulf of Mexico in Atlantic HYCOM: Oceanographic processes generated by hurricane Ivan. Ocean Modeling 21, 106–125. doi: 10.1016/j.ocemod.2007.12.002
Keywords: sea level rise, Gulf Coast, Loop Current, Gulf of Mexico, subseasonal variability, eddy shedding
Citation: Shinoda T, Tissot P and Reisinger A (2023) Influence of Loop Current and eddy shedding on subseasonal sea level variability along the western Gulf Coast. Front. Mar. Sci. 9:1049550. doi: 10.3389/fmars.2022.1049550
Received: 20 September 2022; Accepted: 12 December 2022;
Published: 09 January 2023.
Edited by:
Eric Chassignet, Florida State University, United StatesReviewed by:
Nektaria Ntaganou, Florida State University, United StatesCopyright © 2023 Shinoda, Tissot and Reisinger. This is an open-access article distributed under the terms of the Creative Commons Attribution License (CC BY). The use, distribution or reproduction in other forums is permitted, provided the original author(s) and the copyright owner(s) are credited and that the original publication in this journal is cited, in accordance with accepted academic practice. No use, distribution or reproduction is permitted which does not comply with these terms.
*Correspondence: Toshiaki Shinoda, dG9zaGlha2kuc2hpbm9kYUB0YW11Y2MuZWR1
Disclaimer: All claims expressed in this article are solely those of the authors and do not necessarily represent those of their affiliated organizations, or those of the publisher, the editors and the reviewers. Any product that may be evaluated in this article or claim that may be made by its manufacturer is not guaranteed or endorsed by the publisher.
Research integrity at Frontiers
Learn more about the work of our research integrity team to safeguard the quality of each article we publish.