 Bingjian Liu1,2
 Jiasheng Li1,2
 Kun Zhang1,3
 Ying Peng1,2
 Yifan Liu1,2
 Xun Jin1,2
 Sixu Zheng1,2Yunpeng Wang1,2
 Liqin Liu1,2
 Zhenming Lü1,2
 Shufei Zhang4
 Li Gong1,2*
- 1National Engineering Laboratory of Marine Germplasm Resources Exploration and Utilization, Zhejiang Ocean University, Zhoushan, China
- 2National Engineering Research Center for Facilitated Marine Aquaculture, Marine Science and Technology College, Zhejiang Ocean University, Zhoushan, China
- 3College of Life Science, Hunan Normal University, Changsha, China
- 4Guangdong Provincial Key Laboratory of Fishery Ecology and Environment, South China Sea Fisheries Research Institute, Chinese Academy of Fisheries Sciences, Guangzhou, Guangdong, China
Uncovering the fine-scale genetic structure has been long recognized as a key component in policymaking for the management of marine fisheries. Many species of Clupeiformes have suffered declines owing to overexploitation and habitat destruction. In this study, twenty polymorphic microsatellite markers were used to evaluate the genetic diversity and population structure of Konosirus punctatus, a pelagic fish of economic and ecological importance in the Northwestern Pacific Ocean. Although most of the variance occurred within individuals, significant differentiation (FST = 0.00384~0.19346) was shown in wild K. punctatus populations. Population structure analyses revealed five genetically divergent clades in K. punctatus in the Northwestern Pacific. Significant isolation by distance and one potentially outlier locus were revealed in K. punctatus, suggesting that interactions between historical climate shifts and environmental factors may contribute to the present-day genetic architecture. In summary, these results provided new perspectives on the population genetic structure of K. punctatus, facilitating the development of effective management strategies for this species.
Introduction
Ignorance of population structure in fisheries management might lead to unintended risks of overfishing (Ying et al., 2011). For the past few decades, researchers have increasingly recognized the importance of uncovering the fine-scale genetic structure as well as the local adaptation of marine fish, especially for species of high economic and ecological importance (Laikre et al., 2005; Casey et al., 2016). This ultimately improves the spatial delineation of marine protected areas and fishery stocks. Marine ecosystems are traditionally regarded to be highly interconnected (Cano et al., 2008). However, the view on the population structure of marine fish with high gene flow has changed significantly over the past decade. Growing genomic studies of marine fish populations reveal a complex picture of spatial genetic differentiation not only at macrogeographic but also microgeographic scales (Hess et al., 2013; Guo et al., 2016; Liu et al., 2016).
Clupeiformes, including over 400 species, largely contribute to global food security and ecological balance (SOFIA, 2018; Birge et al., 2021). Traditional viewpoints of life history characteristics of Clupeiformes, such as early age of maturation and high fecundity, have hindered the management of these species (Birge et al., 2021). Besides, Tenualosa reevesii (Clupeiformes: Clupeidae) was declared to be functionally extinct (Zhang et al., 2020) and Coilia nasus (Clupeiformes: Engraulidae) populations have sharply declined (Xue et al., 2019) due to overexploitation and habitat destruction. After trials of the partial fishing ban, the Chinese government issued a ten-year fishing ban plan on the total basin of the Yangtze River from 2020 (Wang et al., 2022). Thus, it is particularly important to implement continuous fisheries monitoring for stocks that are under fishing pressure. The dotted gizzard shad, Konosirus punctatus (Clupeiformes: Clupeidae), is an economically important pelagic fish species and is widely distributed along the coasts of the Northwestern Pacific (Zhang, 2001). K. punctatus is a euryhaline species that migrates into shallower brackish water for breeding from April to August, and takes two years to reach adulthood (Myoung and Kim, 2014). K. punctatus is regarded as one of the most abundant fishery resources in the coastal regions of the Northwestern Pacific. However, the annual global capture production of this species is showing a prominent decline, from an annual production of 23,707 tonnes in 1995 to 4,200 tonnes in 2020 (FAO, 2022). In addition, the wild populations of K. punctatus in some areas have shown obvious degradation of biological characteristics such as miniaturization and early sexual maturity due to overfishing as well as the degradation of estuarine ecosystems (Gao et al., 2019). In addition, this commercially important species is regarded as the base of the coastal marine food web and serve as a major prey source for numerous predators, playing a critical role in the energy flow as well as nutrient recycling (Zhang, 2001). Therefore, it is essential to investigate the genetic diversity and population structure of K. punctatus for the designation of management and conservation units.
Previous studies based on mtDNA data indicated that the wild K. punctatus in the Northwestern Pacific comprised distinct lineages (Gwak et al., 2015; Song et al., 2016; Liu et al., 2020). These studies improved the understanding of the genetic structure of K. punctatus populations in the Northwestern Pacific, but mtDNA markers may not be able to uncover the fine population structure of marine fish due to limited resolution. Hence, a comprehensive population genetic analysis of K. punctatus is still needed to assess patterns of population genetic divergence throughout its distribution. Microsatellites (simple sequence repeats, SSRs) are codominant markers, which are present in both coding and non-coding regions and characterized by a high degree of length polymorphism (Zane et al., 2002). Besides, microsatellites are widely used in population genetic studies of marine organisms as a result of a good balance between polymorphism and labor cost (Abdul-Muneer, 2014).
In this study, we describe the genetic diversity and population structure of wild K. punctatus from the Pacific Northwest coast using twenty polymorphic microsatellite markers. Such genetic information will improve conservation as well as sustainable fisheries management policies of K. punctatus in the Northwestern Pacific.
Materials and methods
Sampling and DNA extraction
A total of 247 wild K. punctatus individuals were collected for population analysis from 12 geographical locations (Figure 1; Supplementary Table S1), including ten locations along the coast of China (Dandong: DG; Qinhuangdao: QHD; Dongying: DY; Laizhou: LZ; Rizhao: SRZ; Lvsi: LS; Zhoushan: ZS; Wenzhou: WZ; Sanwei: SW; Zhongshan: GS), one location from Korea (Jeolla: HQ), and one location from Japan (Saga: RZ). Caudal fin or muscle was sampled from each fish and genomic DNA was extracted using the standard phenol-chloroform method. The extracted DNAs were checked using 1.5% agarose gel electrophoresis and then stored at -20°C until use.
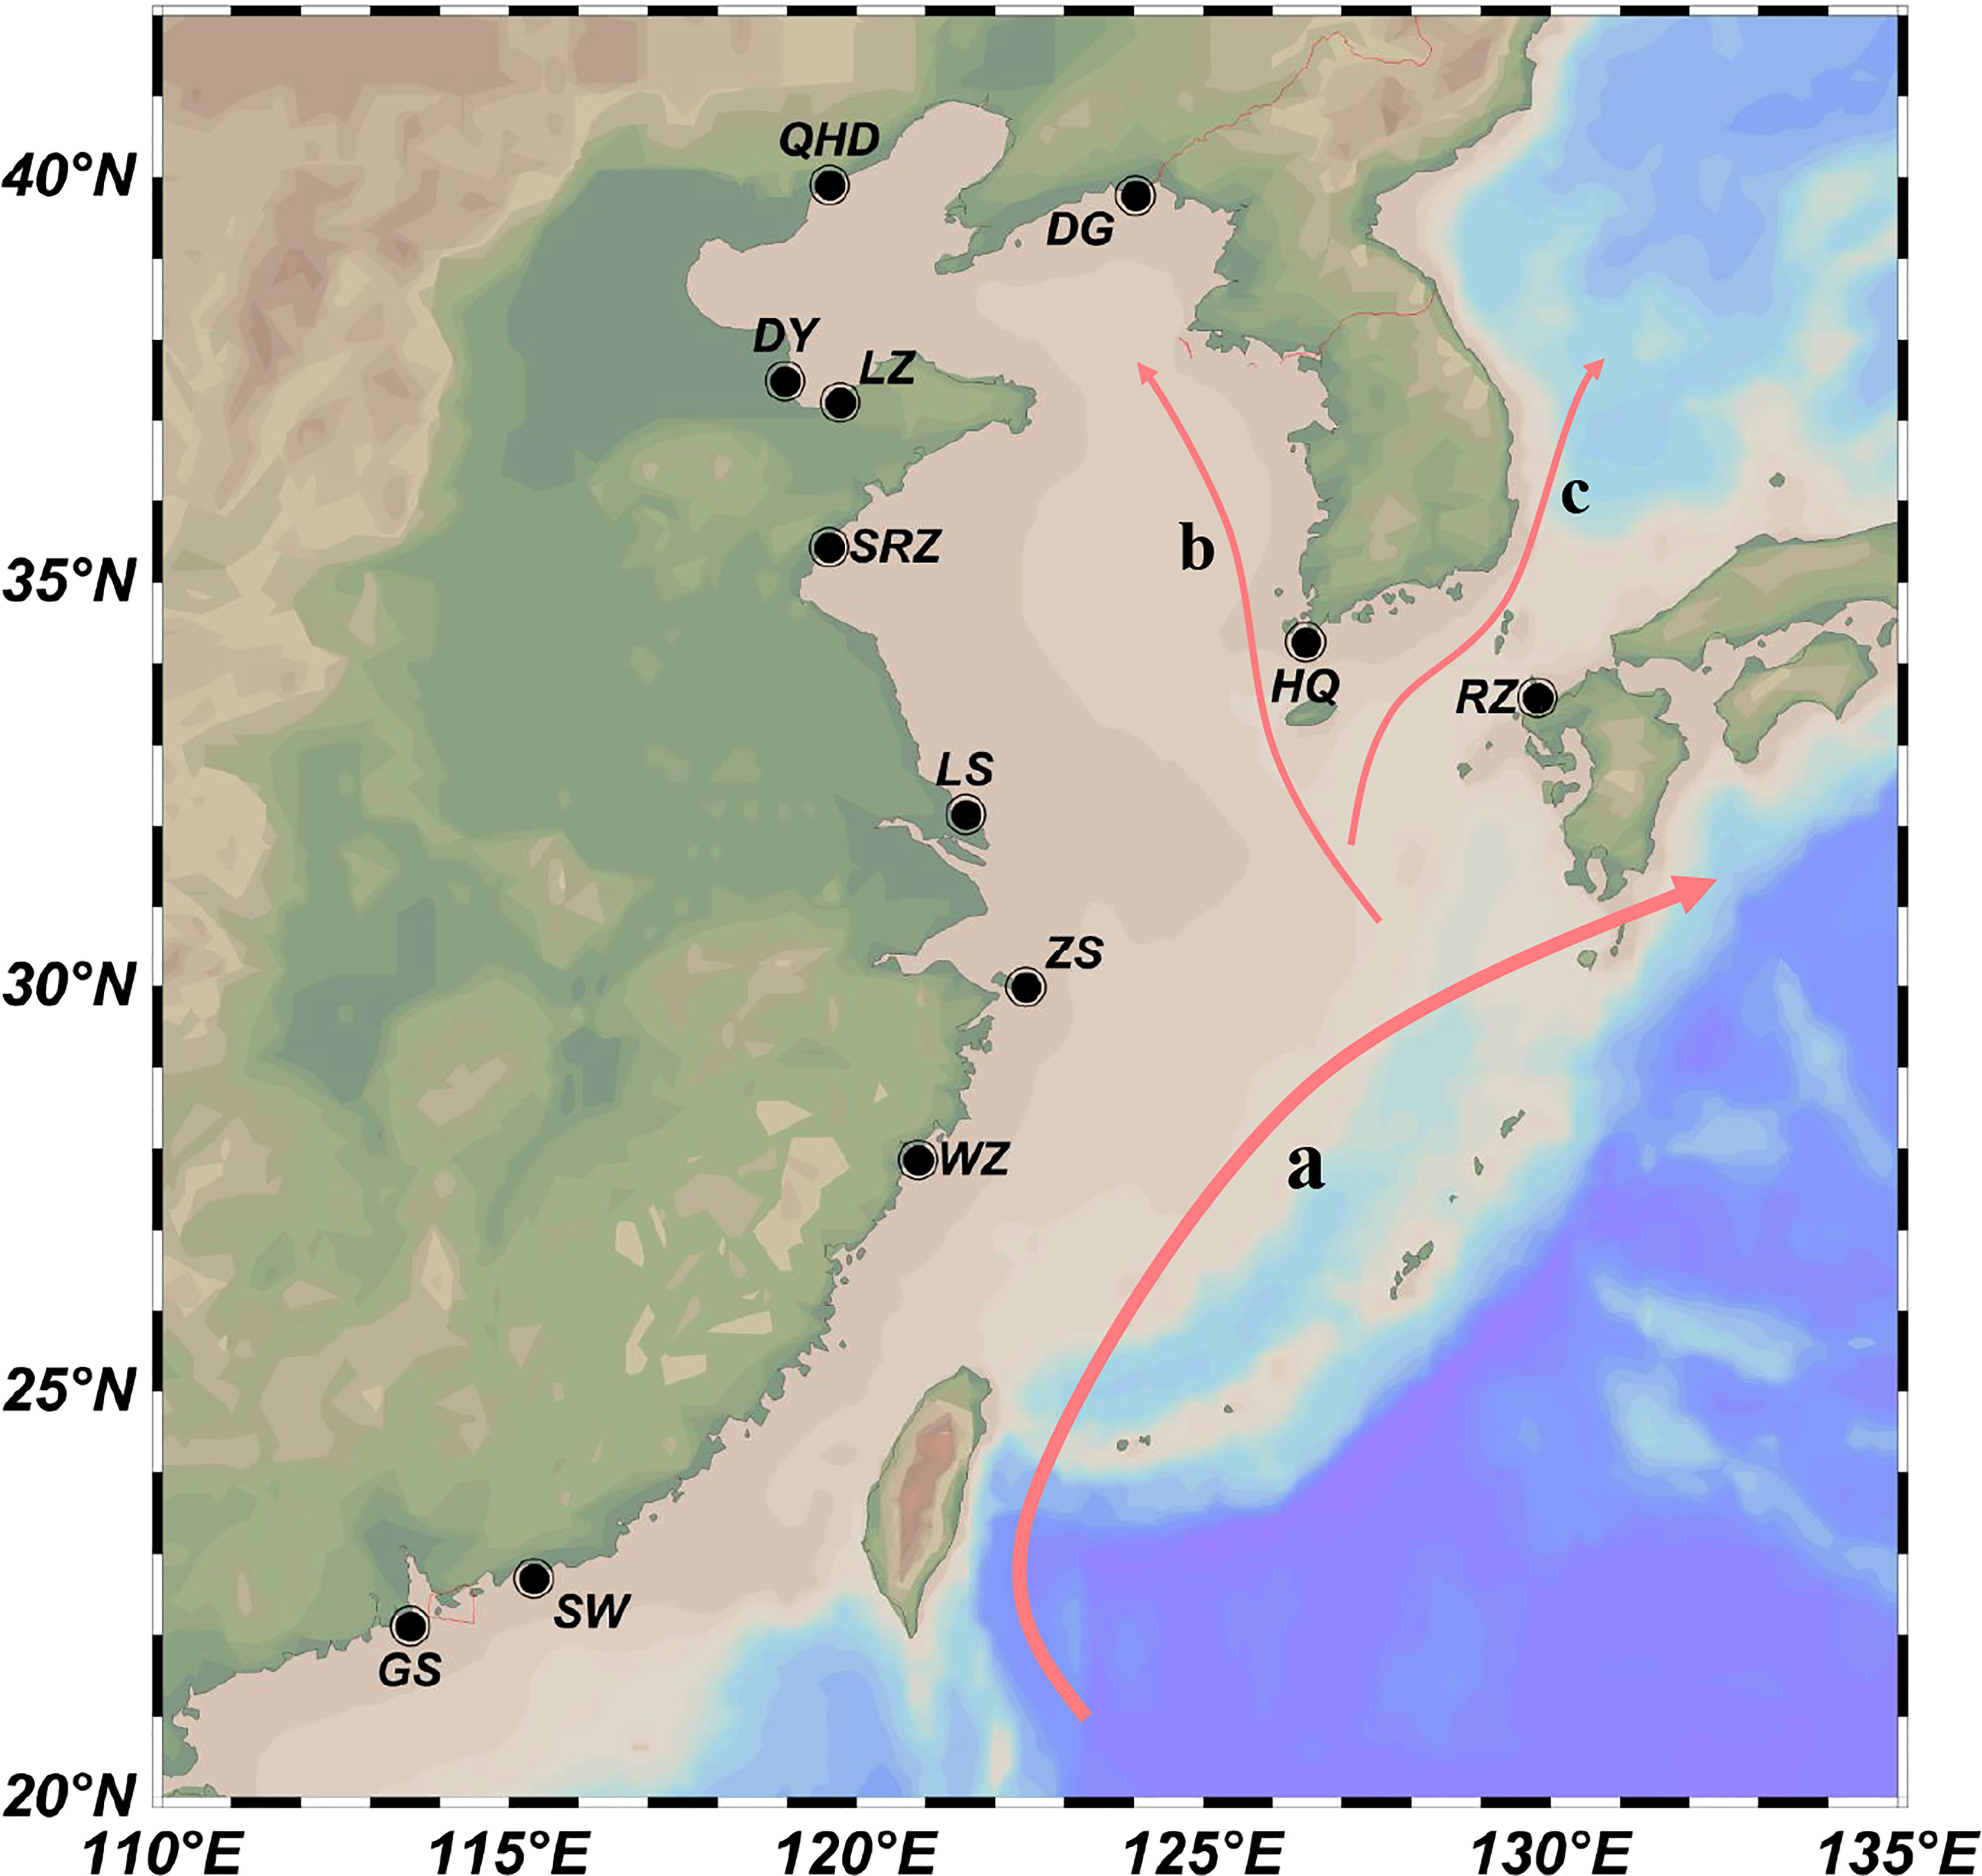
Figure 1 Schematic map of sampling locations along the coastal waters of Northwestern Pacific. 247 individuals of K punctatus from 12 geographic locations (RZ, HQ, DG, QHD, DY, LZ, SRZ, LS, ZS, WZ, SW, and GS) were collected for microsatellite amplification. The arrows denote the prevailing ocean currents: (A) Kuroshio Current; (B) Yellow Sea Warm Current; (C) Tsushima Current.
Microsatellite genotyping
All K. punctatus individuals were genotyped using the only available microsatellite markers (kpun01~kpun20) developed from a reference genome of K. punctatus (Supplementary Table S2) (Liu et al., 2022). The fluorescent primers were labeled with the fluorescent dye (FAM, HEX, or TAMRA) in the forward primers of each locus. PCRs were carried out in 10 µl reaction volumes containing 5 μl Master Mix, 3.5 double-distilled H2O, 1 µl genomic DNA, 0.25 µl of forward primers, and 0.25 µl of reverse primers. PCR amplification was performed with the following conditions: 1) initial denaturation of 4 min at 94°C; 2) followed by 35 cycles of denaturing at 94°C for 30s; 3) annealing at 50~60°C for 30s; 4) extension at 72°C for 25s; 5) final extension of 10 min at 72°C. The PCR products were sent to Sangon Biotech (Shanghai) Co., Ltd for genotyping by capillary electrophoresis using GS 500 ladder as reference. The product size and genotypes of all samples were determined and manually corrected using GeneMarker v2.2 (Hulce et al., 2011).
Genetic diversity and population structure
The number of alleles per locus (N), polymorphic information content (PIC), and null allele frequency values (Fnull) of each locus were calculated by Cervus v3.0.7 (Kalinowski et al., 2007). Cervus v3.0.7 (Kalinowski et al., 2007) was also used to estimate departures from Hardy-Weinberg equilibrium (HWE) with Bonferroni correction for evaluating the significance of HWE deviations. The effective number of alleles (Ne), observed heterozygosity (Ho), expected heterozygosity (He), and F-statistics (FIS, FIT, and FST) of each locus were calculated using GenAlEx 6.51b2 (Peakall and Smouse, 2012). Linkage disequilibrium (LD) between loci was tested using Genepop v4.7.5 (Rousset, 2008) with the Markov chain method (10,000 dememorization steps, 100 batches, 5,000 interactions), and a Bonferroni correction for multiple testing was then applied. Allelic richness (AR) and inbreeding coefficient (FIS) of each population was calculated by FSTAT v2.9.4 (Goudet, 2001). The observed number of alleles (Na), effective number of alleles (Ne), observed heterozygosity (Ho), and expected heterozygosity (He) of each population were estimated using GenAlEx 6.51b2 (Peakall and Smouse, 2012).
Pairwise FST values between populations were obtained using Arlequin v3.5.1.2 (Excoffier and Lischer, 2010) with 10,000 permutations. GenAlEx 6.51b2 (Peakall and Smouse, 2012) was used to calculate the Nei’s genetic distance (DA) (Nei et al., 1983) between populations. The unweighted pair group method with arithmetic mean (UPGMA) tree was constructed using MEGA X (Kumar et al., 2018) based on Nei’s genetic distance and visualized through the online tool iTOL (https://itol.embl.de/) (Letunic and Bork, 2021). The Mantel test performed in GenAlEx 6.51b2 (Peakall and Smouse, 2012) was used to detect the correlation between Nei’s genetic distances versus geographic distances (km) and Nei’s genetic distances versus environmental distances with 10,000 permutations. Four factors (annual mean temperature, mean monthly temperature, annual mean salinity, and mean monthly salinity) of each sampling site were selected as representative of environmental factors. The environmental distance matrix was calculated based on the Euclidean distance using NTSYS-pc v2.10 (Exeter software, USA). Principal coordinate analysis (PCoA) based on genetic distance was conducted using GenAlEx 6.51b2 (Peakall and Smouse, 2012). The software STRUCTURE v2.3.4 (Pritchard et al., 2000) was applied to carry out a Bayesian clustering analysis based on microsatellite genotypes. Admixture model was used, assuming correlated allele frequency, with the option of “with no prior knowledge of sampling locations”. K value ranged from 1 to 12 with a burn-in period of 100,000 and a run length of 1,000,000, and ten replicates were run for each K. The optimum number of K was determined by Evanno’s method implemented on Structure Harvester website (Earl and VonHoldt, 2012). The program Clumpp v1.1.2 (Jakobsson and Rosenberg, 2007) was used to align the 10 repetitions, and the results were then graphically displayed by the program Distruct v1.1 (Rosenberg, 2004). To test the partitioning of genetic variation within and among populations, a hierarchical analysis of molecular variance (AMOVA) was performed using the software Arlequin v3.5.1.2 (Excoffier and Lischer, 2010) with 10,000 permutations. For AMOVA hierarchical analysis, populations were grouped by four scenarios inferred from population structure analysis: (1) two groups including northern (RZ, HQ, DG, QHD, LZ, DY, SRZ, LS, ZS, WZ) and southern (SW, GS) groups; (2) three groups including Chinese (QHD, LZ, DY, SRZ, LS, ZS, WZ, SW, GS), Korean (HQ, DG) and Japanese (RZ) lineages; (3) three groups including northern (RZ, HQ, DG, QHD, LZ, DY, SRZ, LS, ZS, WZ), southern-a (SW) and southern-b (GS) groups; (4) five groups including northern-a (RZ), northern-b (HQ, DG), northern-c (QHD, LZ, DY, SRZ, LS, ZS, WZ), southern-a (SW) and southern-b (GS) groups.
The software BOTTLENECK v1.2.02 (Piry et al., 1999) was used to assess the occurrence of demographic bottlenecks in each population. The Two-phase Mutation (TPM) and the Stepwise mutation (SMM) models were used to test for heterozygosity excess. Overall, 1,000 simulations were run for both models, setting the proportion of one-step mutations at 70%, and the variance of multi-step mutations at 30% for the TPM. One-tail Wilcoxon sign-ranked tests were used to test for heterozygosity excess as recommended by Piry et al. (1999) when less than 20 loci are available. In addition, mode-shift tests were used to identify potential bottlenecks by visualizing the allele frequency (Cornuet and Luikart, 1996).
Outlier test
Two approaches were applied to detect loci that potentially depart from neutral expectations. We used the hierarchical method developed by Excoffier et al. (2009) and implemented in Arlequin v3.5.1.2 (Excoffier and Lischer, 2010). This method assumes a hierarchical island model of migration between structured populations. 100,000 coalescent simulations were performed, assuming 50 groups and 100 demes per group. The observed data from each locus were compared with the simulated distribution, and a particular locus was classified as a significant outlier if it lay outside the 99% confidence envelope. A Bayesian method implemented in BAYESCAN 2.1 (Foll and Gaggiotti, 2008) was also applied to test for signatures of selection. We ran 20 pilot runs of 5000 iterations and an additional burn-in of 500,000 iterations with a thinning interval of 20 and a final sample size of 50,000. The threshold false discovery rate (FDR) was set at 1% to reduce statistical errors due to multiple testing.
Results
Genetic diversity
The genetic diversity indices of the twenty microsatellite loci used in this study are shown in Table 1. A total of 589 alleles were detected in 247 individuals, with an average value of 29.20 alleles per locus. The locus Kpun03 showed the highest number of effective alleles (8.598), while the lowest number of effective alleles (2.582) was detected in Kpun05. The average number of observed heterozygosity varied from 0.480 (Kpun17) to 0.870 (Kpun09) with an average of 0.694, and the expected heterozygosity ranged from 0.585 (Kpun05) to 0.876 (Kpun09) with an average of 0.773. All loci were highly polymorphic (PIC > 0.500), ranging from 0.660 (kpun5) to 0.916 (kpun09). Deviation from HWE was detected in nine loci (Kpun01, Kpun05, Kpun08, Kpun11, Kpun12, Kpun15, Kpun16, Kpun17, Kpun20) with Bonferroni correction. Null alleles occurred in all loci, with two microsatellite loci showing high null allele frequencies (Fnull > 0.2) and seven loci showing moderate null allele frequencies (0.1 < Fnull < 0.2). No linkage disequilibrium was detected between pairs of loci after the Bonferroni correction. The genetic diversity of each sampled population is presented in Table 2. The mean allelic richness was 9.117 and ranged from 8.350 (QHD) to 9.729 (GS). The average number of observed alleles varied from 8.350 in QHD to 11.750 in GS with an average of 10.246, whereas the average number of effective alleles ranged from 4.515 in RZ to 6.122 in DG with an average of 5.447. The average Ho and He were 0.753 and 0.810, respectively.
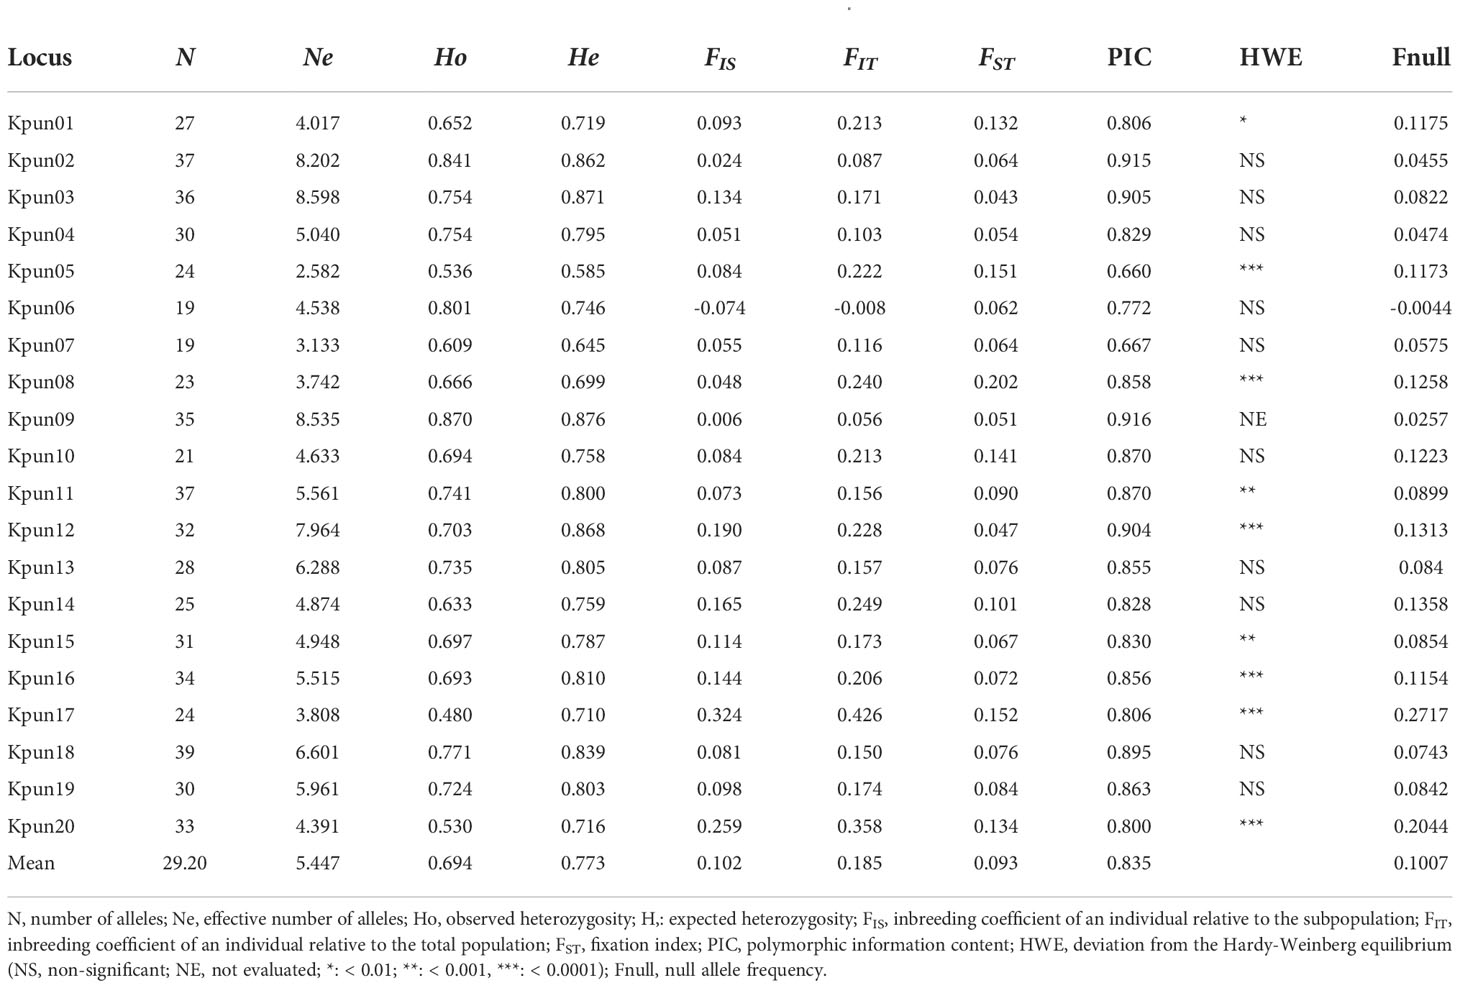
Table 1 Genetic diversity of 20 polymorphic microsatellite markers for K. punctatus.
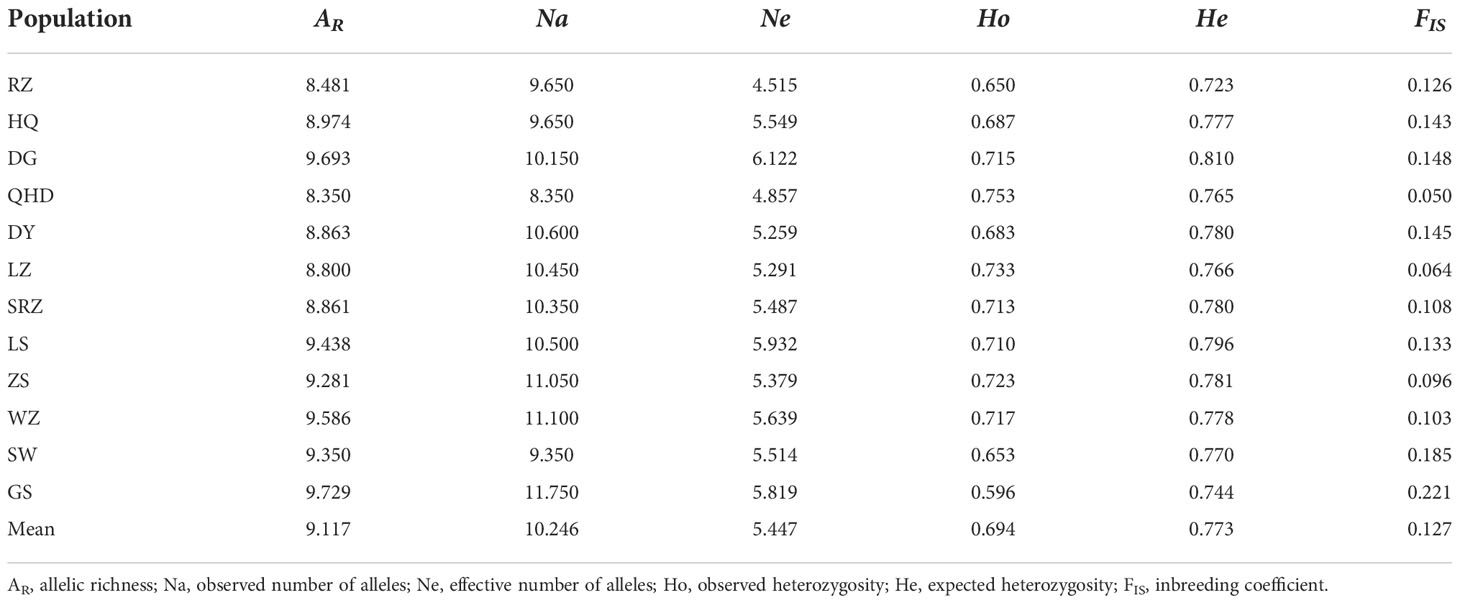
Table 2 Genetic diversity statistics of twelve K. punctatus populations using 20 microsatellite markers.
Detection of loci under putative selection
The test implemented in Arlequin indicated four loci (Kpun01, Kpun05, Kpun08, Kpun10) were outliers for divergent selection (upper bound of null distribution), whereas kpun12 was an outlier for balancing selection (lower bound of null distribution) (Figure 2A). The BayeScan test supported three outlier loci (Kpun12, Kpun16, and Kpun18) (Figure 2B). Thus, the locus Kpun12 found by both methods was regarded as a potential outlier for balancing selection. Potential effects of natural or hitchhiking selection on microsatellite loci may obscure inferred patterns of neutral demographic processes (Nielsen et al., 2006). We conducted subsequent population analyses using (i) all loci and (ii) excluding the outlier locus.
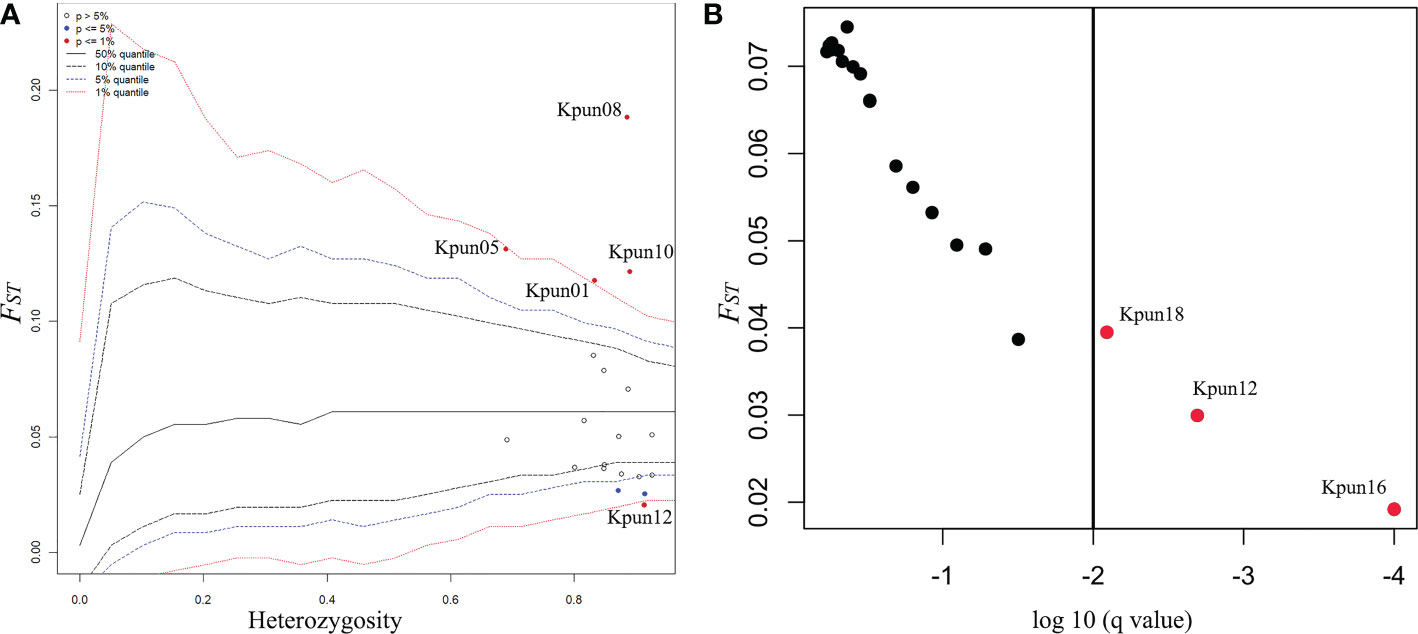
Figure 2 Plots of results of outlier tests. (A) The hierarchical island model test for selection completed using the program Arlequin. FST is plotted against expected heterozygosity. Confidence intervals limits for FST estimated in relation to heterozygosity are dashed lines. Each marker is a circle. Significant outlier loci at 5% and 1% level are shown in blue and red circles, respectively. Red dots are regarded ad outlier loci. (B) The Bayesian test for selection completed using the program BayeScan. The red dots on the right side of the vertical line are above a 0.99 probability of being candidates of selection.
Demographic history of K. punctatus
One-tail Wilcoxon rank tests for heterozygosity excess were not statistically significant for both TPM and SMM in each population (Table 3). Besides, the allele frequencies of all populations showed normal ‘L’ shaped distribution of the mode-shift test (Supplementary Figure S1). Both tests indicated that all populations f K. punctatus did not experience demographic bottlenecks.
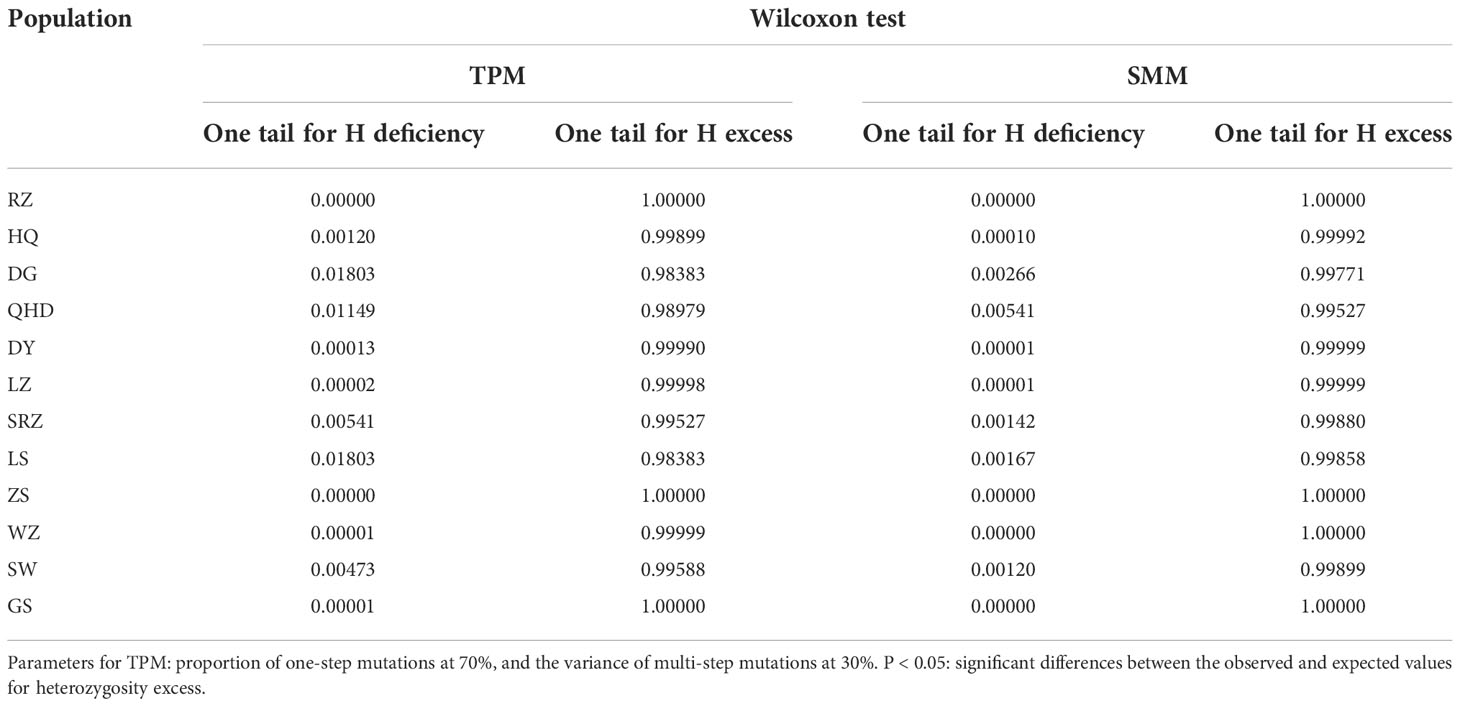
Table 3 Bottleneck analysis of 12 K. punctatus populations using neutral microsatellite markers under the two-phase mutation model (TPM) and stepwise mutation model (SMM).
Genetic differentiation and genetic structure
Using all microsatellite loci, we revealed a highly significant population structure of K. punctatus. The pairwise FST using all microsatellite loci varied from 0.00384 (between ZS and WZ) to 0.19346 (between RZ and GS) (Table 4). The Mantel test for isolation by distance demonstrated that there was a highly significant correlation between genetic distances and geographical distances (R2 = 0.5266, P < 0.001) of K. punctatus along the Pacific Northwest coast (Figure 3A). A significant correlation between genetic distances and environmental distance (R2 = 0.2996, P = 0.011) was also revealed by the Mantel test (Figure 3B). The UPGMA tree (Figure 4A) and PCoA (Figure 4B) analysis separated GS and SW (southern group) from others (northern group). The second principal coordinate, which explains 3.76% of the total variation, tended to subdivide the northern group into western (RZ, HQ, DG) and eastern (all the other) populations (Figure 4B), which was supported by the UPGMA tree (Figure 4A). A similar genetic structure was shown by the STRUCTURE clustering algorithm (Figure 4C). Based on the ΔK values. a prevailing signal for K = 5 and a comparatively weak signal for K = 2 were obtained (Supplementary Figure S2). When K = 2, these samples of K. punctatus could be divided into two main groups (northern and southern groups) (Figure 4C). For K = 5, populations were grouped into five genetic clusters, which were denoted as north-a (RZ), north-b (HQ and DG), north-c (QHD, DY, LZ, SRZ, LS, ZS, and WZ), south-a (SW), and south-b (GS) (Figure 4C). The AMOVA demonstrated that the variance among populations (7.69%) was strongly lower than within populations (92.31%), resulting in moderate genetic differentiation (FST = 0.07693) (Table 5). Assuming two genetic pools (northern and southern groups), the AMOVA analysis also showed that the variance within populations (87.51%) was higher than the variance existing among populations within groups (5.22%) and among groups (7.72%) (Table 5). The variance among groups rose to (10.79%) when populations were subdivided into five genetic pools, based on Bayesian clustering results (Table 5). This overall pattern did not change when excluding the outlier locus (Supplementary Figures S3, S4).
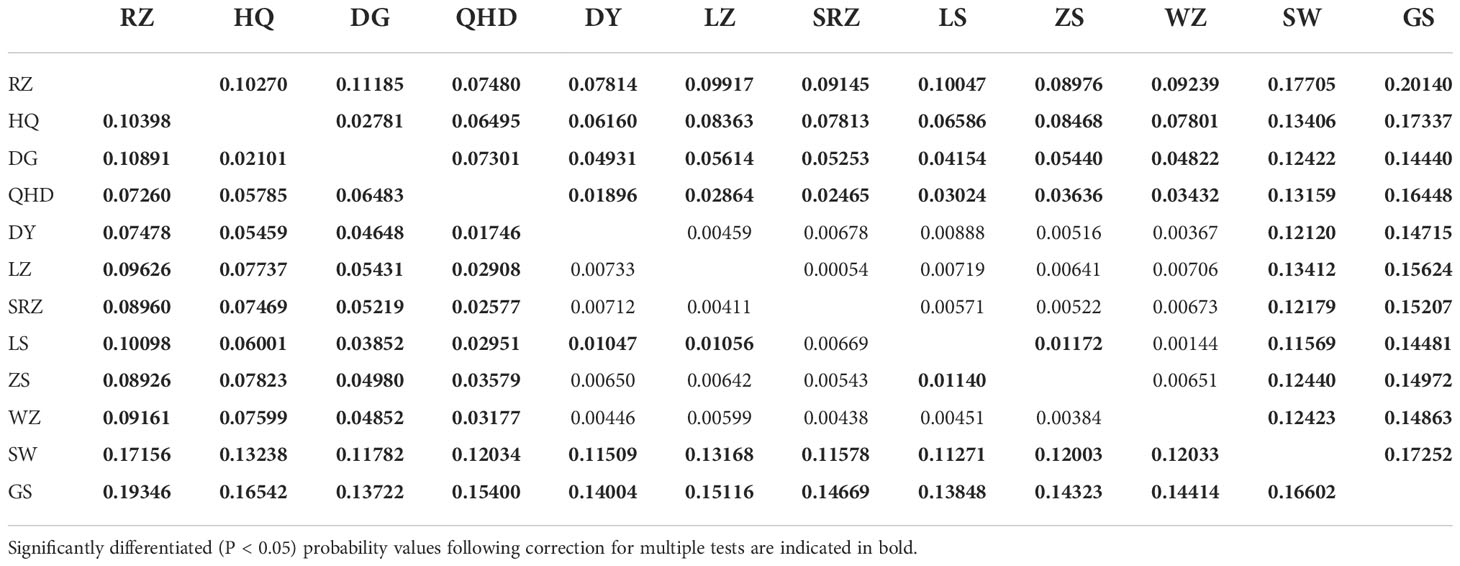
Table 4 Pairwise FST values using all loci (below diagonal) and Pairwise FST values using neutral loci (above diagonal) among populations of K. punctatus.
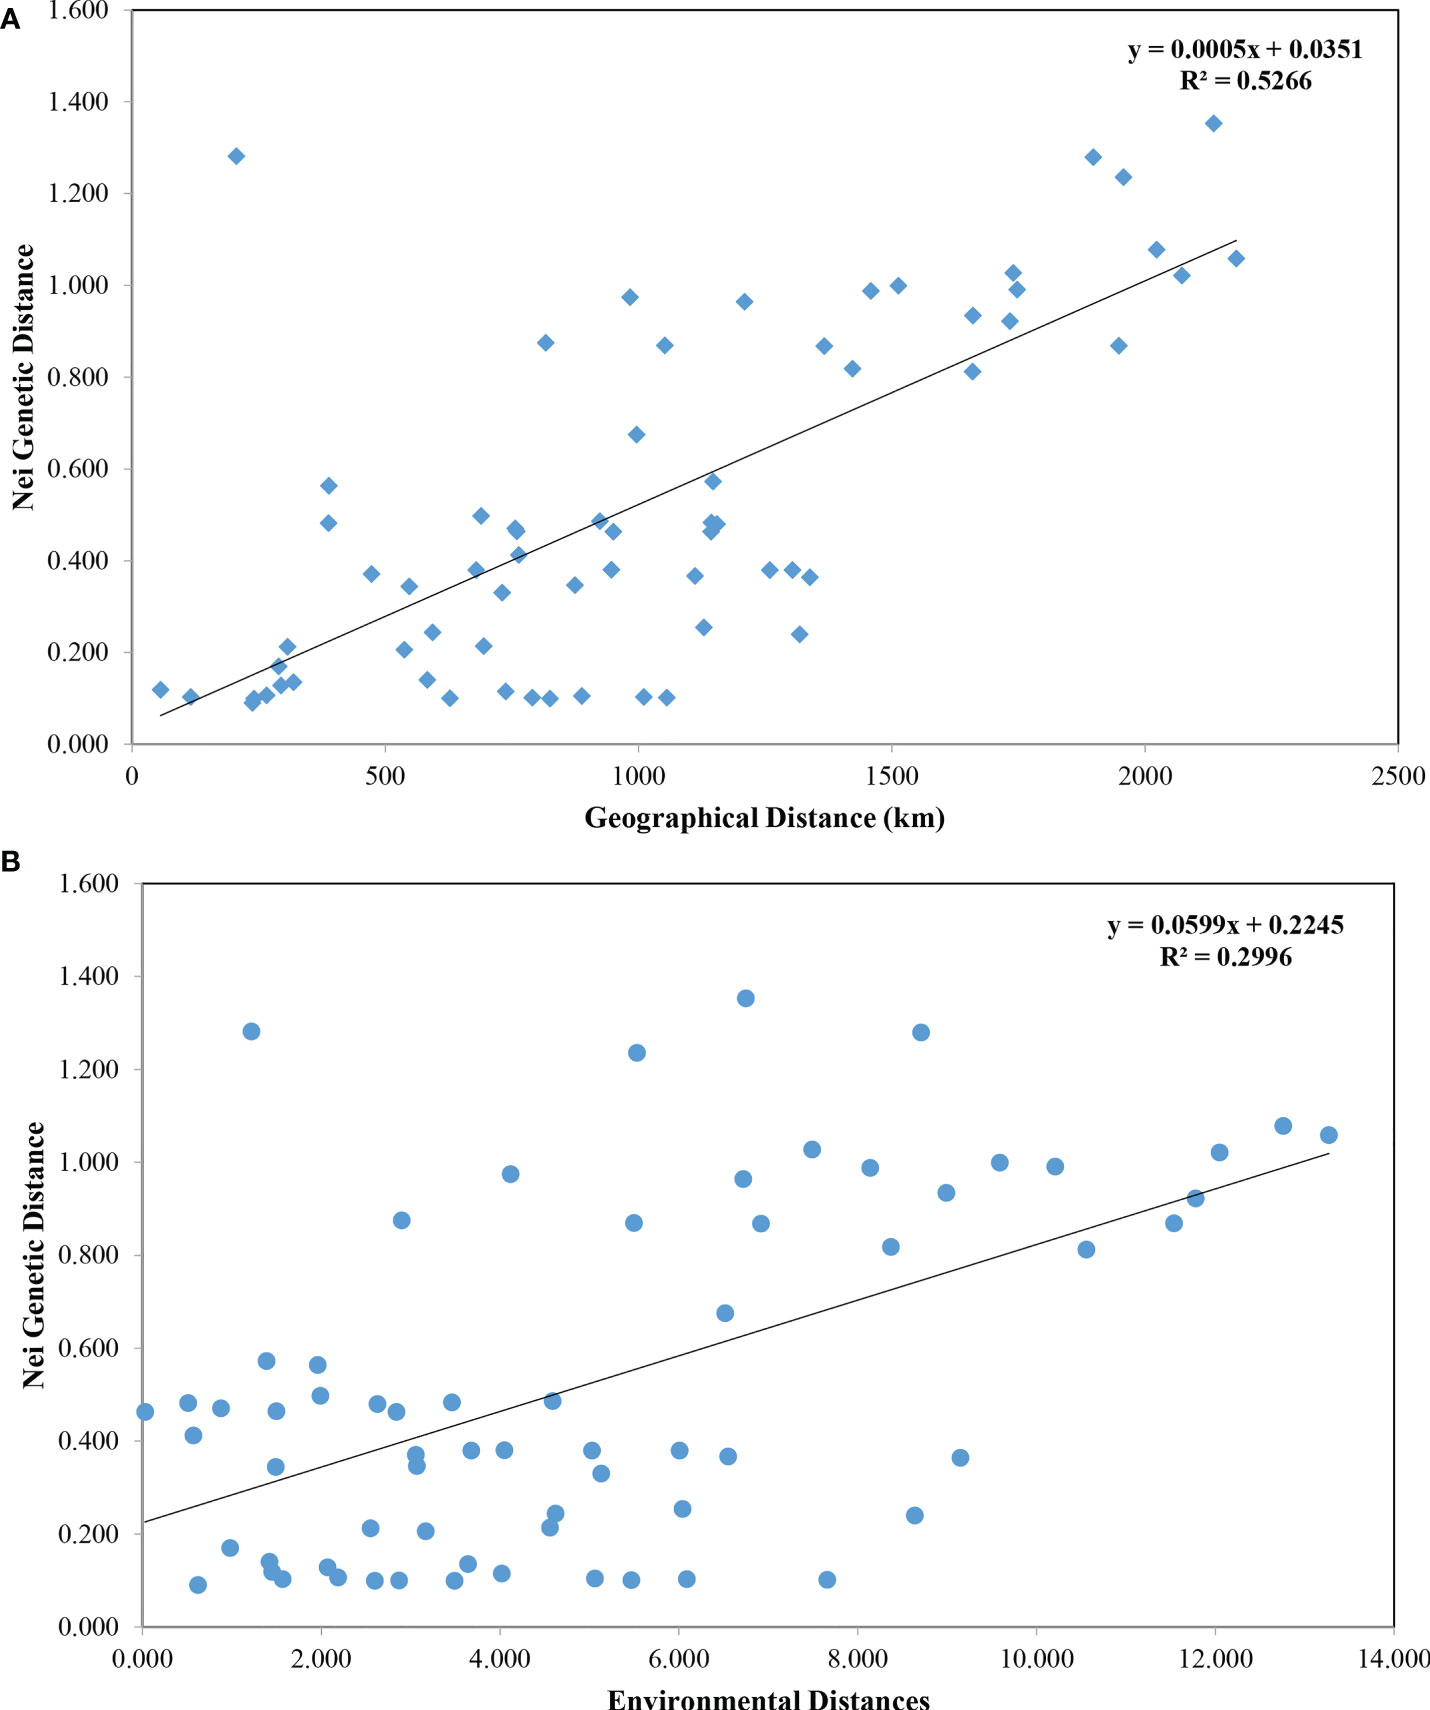
Figure 3 Mantel test using all microsatellite markers. (A) The Mantel test was performed to test the occurrence of a positive correlation between Nei’s genetic distances and geographic distances. The genetic and geographic distance were significantly correlated (R2 = 0.5266, p < 0.001). (B) The Mantel test was performed to test the occurrence of a positive correlation between Nei’s genetic distances and environmental distances. The genetic and environmental distances were significantly correlated (R2 = 0.2996, p = 0.011).
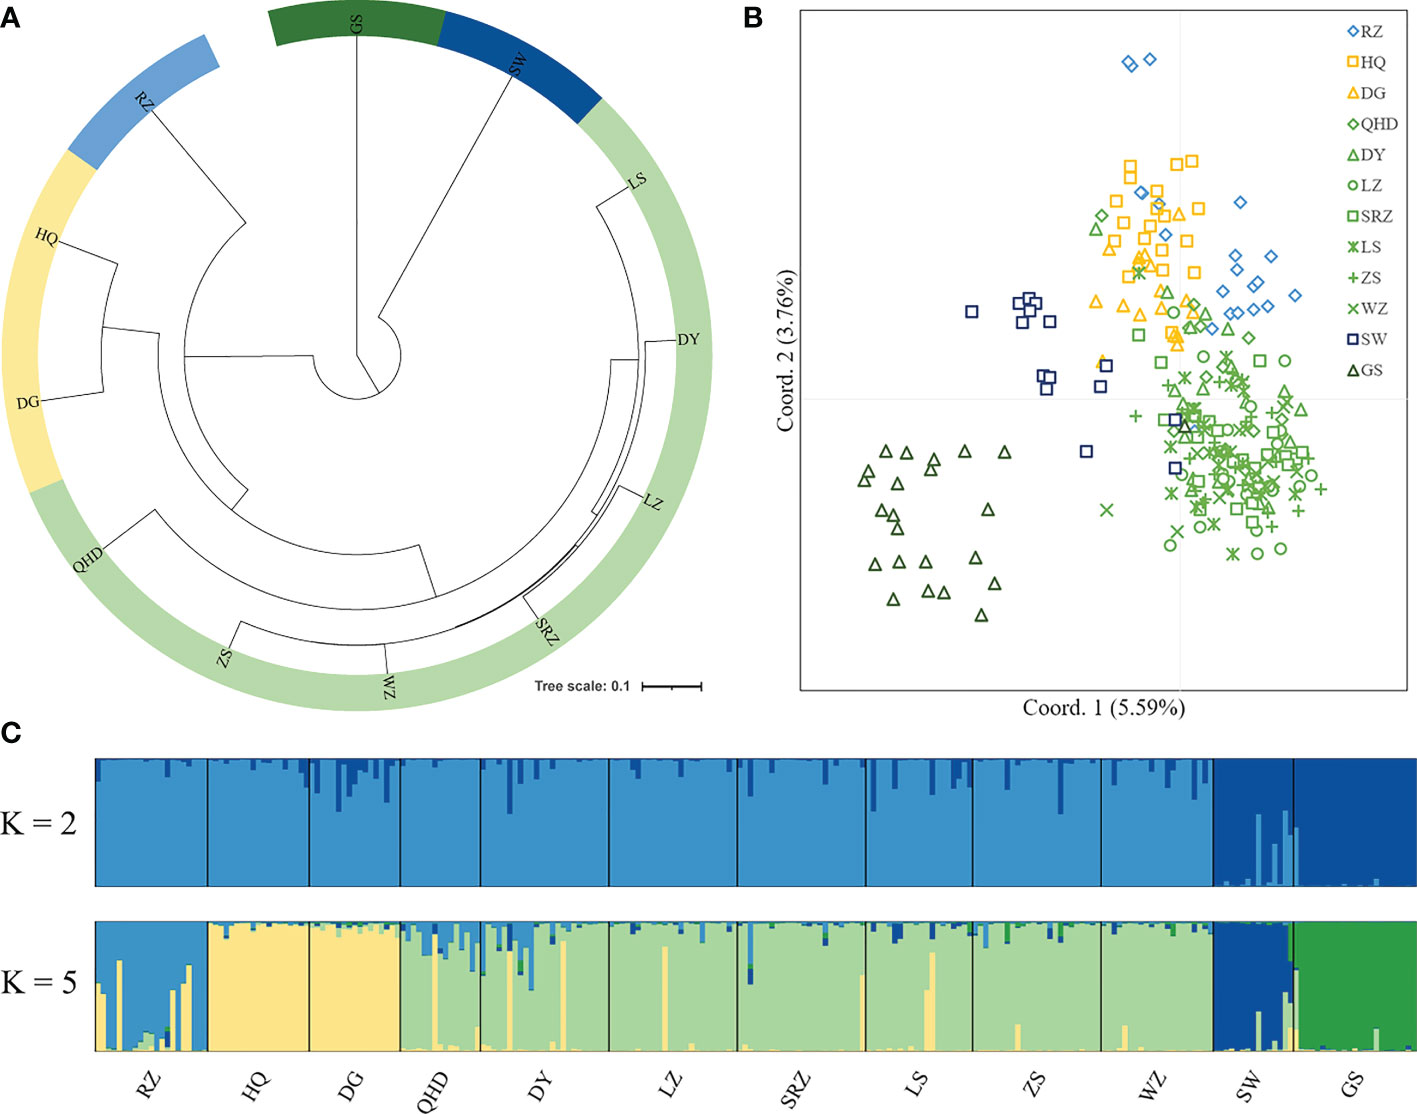
Figure 4 Population genetic structure of 12 wild K. punctatus using all microsatellite markers. Dandong: DG; Qinhuangdao: QHD; Dongying: DY; Laizhou: LZ; Rizhao: SRZ; Lvsi: LS; Zhoushan: ZS; Wenzhou: WZ; Sanwei: SW; Zhongshan: GS; Jeolla: HQ; Saga: RZ. (A) The unweighted pair group method with arithmetic mean (UPGMA) tree inferred from Nei’s genetic distance. (B) Principal coordinate analysis (PCoA) based on genetic distance. Percentage values represent variation justified by each axis. (C) Population structure obtained from STRUCTURE analysis. Individuals are represented by vertical bars. Different colors in the same individual indicate the percentage of the genome shared with each cluster according to the admixture proportions. The y-axis represents the probability to belong to a certain cluster, while the x-axis represents each population delimited by a black solid vertical line.
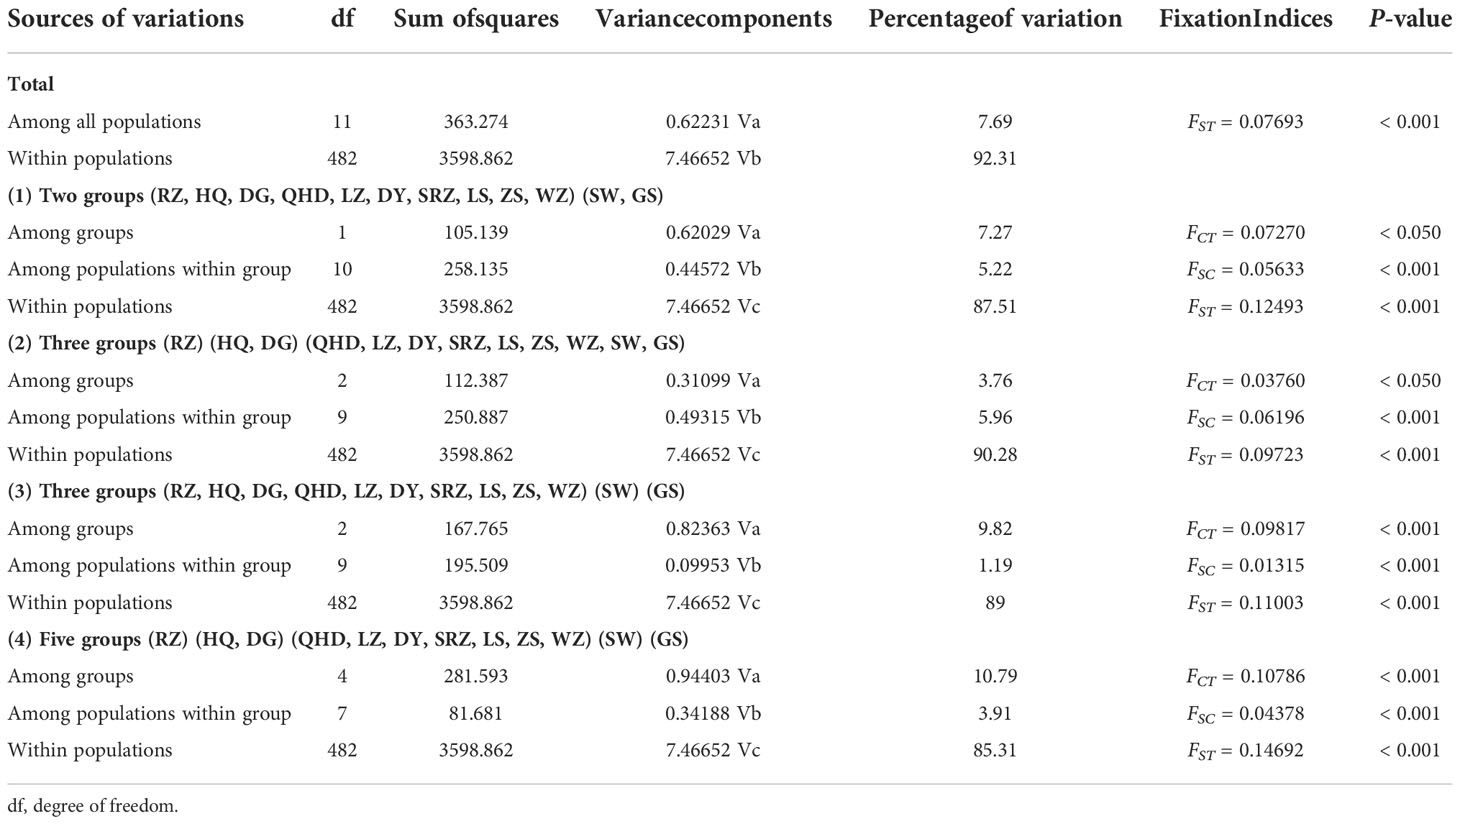
Table 5 Analysis of molecular variance (AMOVA) of K. punctatus populations using all microsatellite markers.
Discussion
Assessment of microsatellite markers
Genome-wide genetic information can help us better understand the population structures of organisms. Previous genetic approaches, based on mtDNA markers, may not be able to reveal the true population structure of K. punctatus due to limited resolution. Microsatellite DNA markers are particularly useful in monitoring genetic variability due to their inherent high mutation rates and thus have also been successfully applied to the management of fisheries species (Abdul-Muneer, 2014). In this study, twenty microsatellite markers were used to reveal the population structure of K. punctatus in the Northwest Pacific. All these microsatellite markers showed high polymorphism (PIC > 0.500, mean PIC = 0.835) (Table 1). Nine microsatellite loci significantly departed from HWE due to heterozygote deficiencies (Table 1). Probable reasons could include genetic drift, inbreeding, selection, and the presence of null alleles. Notwithstanding we cannot completely rule out that factors such as the Wahlund effect and selection might have resulted in heterozygote deficits, the presence of null alleles seems to be the most likely explanation for that. Besides, null alleles seem to be particularly common in populations with highly effective population sizes (Chapuis and Estoup, 2007), such as in commercially important fish (Song et al., 2019; Wang et al., 2021; Saillant et al., 2022). Even though null allele frequencies recorded at nine loci were > 0.1 (Table 1), these loci were retained in further analyses as they are unlikely to significantly bias the accuracy of assignment tests and the patterns of population differentiation (Carlsson, 2008). Also the locus Kpun12, which was detected as a potential outlier for selection (Figure 2), was retained for downstream analyses as the overall genetic patterns were not affected by its exclusion (Supplementary Figures S3, S4).
Population genetic diversity
A high level of genetic diversity (mean AR = 9.117 and man He = 0.773) was observed in wild K. punctatus populations along the Pacific Northwest coast (Table 2), which was consistent with the previous result based on mtDNA markers (Bingjian Liu et al., 2020). Similar high genetic diversity was also reported in other economically important marine fish, such as Lateolabrax maculatus (Wei Wang et al., 2021), Setipinna tenuifilis (Li et al., 2022), and Lutjanus argentimaculatus (Vineesh et al., 2022). The average number of alleles per locus of K. punctatus (29.20) was relatively higher than that of other Clupeiformes, such as Coilia nasus (10.65) (Yang et al., 2014), Clupea pallasii (10.50) (Semenova et al., 2015), and Engraulis ringens (11.53) (Ferrada-Fuentes et al., 2018). The high genetic diversity indices typically indicate either large population sizes and/or high mutation rates (Kimura, 1979). Since mutation rates are generally similar among closely related species (Terekhanova et al., 2017), long-term large population sizes of K. punctatus could be largely responsible for the high genetic diversity.
Population structure of K. punctatus
In this study, genetic differentiation coefficient values (Table 4) and population structure analysis (Figure 4) identified a high divergence between northern and southern groups. Fishes in the coastal waters of China are expected to show little intraspecific genetic structure due to the lack of obvious physical barriers (Han et al., 2008). Nevertheless, different fish stocks may respond differently to fluctuations of environmental factors such as temperature and salinity gradients. For example, satellite remote sensing data from 2010 to 2020 indicated that the monthly average sea surface temperature (SST) of GS was 13.27°C higher than that of DG (Supplementary Figure S5). The positive correlation between genetic and ecological distances evidenced by the Mantel test may support an isolation by environment model (Figure 3B), indicating that local adaptation may influence spatial genetic structure. In addition, one microsatellite marker that departed from neutrality in K. punctatus may be due to the hitchhiking effect of neighboring genes subjected to local adaptation (Figure 2). Therefore, variations in temperature and other environmental factors among populations of K. punctatus may contribute to population structures. The same geographic patterns were detected for other marine fishes such as Setipinna tenuifilis (Peng et al., 2021) and Sillago japonica (Han et al., 2021).
Many authors have argued that the Pleistocene climate oscillations had profound effects on the current phylogeographic pattern and genetic structure of marine species (Maggs et al., 2008; Larmuseau et al., 2009). In this study, three lineages (Chinese, Japanese and Korean lineages) were identified within the northern group using bayesian clustering analysis (Figure 4C). The Mantel test indicated a significant positive relationship between genetic and geographic distances (R2 = 0.5266, P < 0.001), supporting the isolation-by-distance model (Figure 3A). In addition, subdividing populations into these three lineages in AMOVA analysis increased the variance among groups (10.79%) (Table 5), suggesting that the gene flow among these lineages was influenced. Previous studies had shown that the divergence time for the Chinese and Japanese clades was estimated to be 1,420 kya (Song et al., 2016), and the Korean and Japanese lineages diverged about 240~320 kya (Gwak et al., 2015), coinciding well with the geological events. The drop in sea levels during the ice age restricted gene flow, which may underlie the different lineages of K. punctatus. Besides, ocean currents can form fronts between different water masses, which may act as barriers to gene flow, leading to genetic heterogeneity among continuously distributed populations (Saunders et al., 1986). The Korean Peninsula is surrounded by three seas including the Japan Sea, the East China Sea, and the Yellow Sea, which represents three contiguous but distinct ecosystems (Rebstock and Kang, 2003). For example, under the influence of mixed tides of surface and bottom seawater, a tidal front is formed near the southwest coast of the Korean Peninsula, which may act as an incomplete physical barrier, thereby limiting the connection of K. punctatus between the western coast of Korean Peninsula and the Japan Sea (Han et al., 2019).
In addition to geological events and fronts, physiological features and life history traits of species may be related to the formation of their genetic structure (Duminil et al., 2007). K. punctatus generally does not migrate long distances, but rather between spawning and wintering grounds (Chen, 1991). Hence, the different wintering grounds and migration routes may contribute to the divergence of K. punctatus between the northern and southern groups. In addition, the spawning and nursery areas of K. punctatus were distributed in estuarine areas of high primary productivity (Myoung and Kim, 2014). To enhance survival and retention, the larvae of K. punctatus may choose a dispersal strategy that minimizes offshore transfer rather than drifting in the open ocean (Gwak et al., 2015; Song et al., 2016), which may lead to moderate genetic differentiation of K. punctatus on each side of the Yellow Sea. The limited dispersal in K. punctatus was strongly supported by the Mantel test for isolation by distance (Figure 3A). Moreover, extensive introgression was observed in all coastal waters (Figure 4C). Given the clear population structure, secondary contact after differentiation seems to be a plausible explanation. Interestingly, a high genetic differentiation was detected between SW and GS although SW and GS (both southern populations) were geographically close. Liu et al. (2020), who analyzed four southern populations using mtDNA, found that GS was genetically divergent from their southern counterparts, indicating the concordance between mitochondrial and nuclear microsatellite markers. Further studies using more different southern geographic samples are required to define the diversity of the southern group.
Conclusions
This is the first study applying microsatellite markers to depict the population genetics of K. punctatus. The twenty microsatellite loci developed from a reference genome displayed high polymorphism and thus proved as ideal markers. The wild populations of K. punctatus in the Northwestern Pacific showed high genetic diversity, which might be attributed to its large population size. The significant genetic differentiation and previously unidentified genetic pattern in wild K. punctatus populations may be the result of the interaction between historical climate shifts and contemporary factors (e.g., temperature gradient). Overall, our results could improve our understanding of the fine-scale population genetic structure of K. punctatus and advance the spatial delineation of marine protected areas and fishery stocks.
Data availability statement
The datasets presented in this study can be found in online repositories. The names of the repository/repositories and accession number(s) can be found below: https://figshare.com/, https://figshare.com/s/46cf39eaa8bca2f04344.
Ethics statement
All procedures in this study were performed under the guidelines of the Regulations for the Administration of Laboratory Animals (Decree No. 2 of the State Science and Technology Commission of the People’s Republic of China, November 14, 2008), and were approved by the Animal Ethics Committee of Zhejiang Ocean University (Zhoushan, China).
Author contributions
BL, JL, KZ, YP, YL, and LG conceived and designed the research. BL, JL, KZ, YP, YL, XJ, SXZ, YW, LL, ZL, SFZ, and LG conducted experiments, analyzed data, and wrote the manuscript. The authors critically reviewed and approved the manuscript.
Funding
The study was supported by the National Natural Science Foundation of China (NSFC) (NO.41806156), Zhejiang Provincial Natural Science Foundation of China (LY22D060001 & LY20C190008), Science and Technology Project of Zhoushan (2020C21016), Fund of Guangdong Provincial Key Laboratory of Fishery Ecology and Environment (FEEL-2021-8), Basic Scientific Research Operating Expenses of Zhejiang Provincial Universities (2021JZ003).
Conflict of interest
The authors declare that the research was conducted in the absence of any commercial or financial relationships that could be construed as a potential conflict of interest.
Publisher’s note
All claims expressed in this article are solely those of the authors and do not necessarily represent those of their affiliated organizations, or those of the publisher, the editors and the reviewers. Any product that may be evaluated in this article, or claim that may be made by its manufacturer, is not guaranteed or endorsed by the publisher.
Supplementary material
The Supplementary Material for this article can be found online at: https://www.frontiersin.org/articles/10.3389/fmars.2022.1048279/full#supplementary-material
References
Abdul-Muneer P. (2014). Application of microsatellite markers in conservation genetics and fisheries management: Recent advances in population structure analysis and conservation strategies. Genet. Res. Int. e691759. doi: 10.1155/2014/691759
Birge T., Ralph G., Di Dario F., Munroe T., Bullock R., Maxwell S., et al. (2021). Global conservation status of the world's most prominent forage fishes (Teleostei: Clupeiformes). Biol. Conserv. 253, 108903. doi: 10.1016/j.biocon.2020.108903
Cano J. M., Shikano T., Kuparinen A., Merilä J. (2008). Genetic differentiation, effective population size and gene flow in marine fishes: implications for stock management. J. Integr. Field Biol. 5, 1–10.
Carlsson J. (2008). Effects of microsatellite null alleles on assignment testing. J. Heredity 99 (6), 616–623. doi: 10.1093/jhered/esn048
Casey J., Jardim E., Martinsohn J. T. (2016). The role of genetics in fisheries management under the EU common fisheries policy. J. fish Biol. 89 (6), 2755–2767. doi: 10.1111/jfb.13151
Chapuis M.-P., Estoup A. (2007). Microsatellite null alleles and estimation of population differentiation. Mol. Biol. Evol. 24 (3), 621–631. doi: 10.1093/molbev/msl191
Cornuet J. M., Luikart G. (1996). Description and power analysis of two tests for detecting recent population bottlenecks from allele frequency data. Genetics 144 (4), 2001–2014. doi: 10.1093/genetics/144.4.2001
Duminil J., Fineschi S., Hampe A., Jordano P., Salvini D., Vendramin G. G., et al. (2007). Can population genetic structure be predicted from life-history traits? Am. Nat. 169 (5), 662–672. doi: 10.1086/513490
Earl D. A., VonHoldt B. M. (2012). STRUCTURE HARVESTER: a website and program for visualizing STRUCTURE output and implementing the evanno method. Conserv. Genet. Resour. 4 (2), 359–361. doi: 10.1007/s12686-011-9548-7
Excoffier L., Hofer T., Foll M. (2009). Detecting loci under selection in a hierarchically structured population. Heredity 103 (4), 285–298. doi: 10.1038/hdy.2009.74
Excoffier L., Lischer H. E. (2010). Arlequin suite ver 3.5: a new series of programs to perform population genetics analyses under Linux and windows. Mol. Ecol. Resour. 10 (3), 564–567. doi: 10.1111/j.1755-0998.2010.02847.x
FAO (2022). Konosirus punctatus ternminck & Schlegel,1846 (Rome: Fisheries and Aquaculture Division).
Ferrada-Fuentes S., Galleguillos R., Canales-Aguirre C. B., Herrera-Yañez V. (2018). Development and characterization of thirty-two microsatellite markers for the anchovy, engraulis ringens jenyns 1842 (Clupeiformes, engraulidae) via 454 pyrosequencing. Latin Am. J. Aquat. Res. 46 (2), 452–456. doi: 10.3856/vol46-issue2-fulltext-19
Foll M., Gaggiotti O. (2008). A genome-scan method to identify selected loci appropriate for both dominant and codominant markers: a Bayesian perspective. Genetics 180 (2), 977–993. doi: 10.1534/genetics.108.092221
Gao W., Li Y., Zhang H., Xu Y., Wang S., Wang Z., et al. (2019). Changes and analysis of konosirus punctatus resources in hebei offshore waters in summer. Fish. Hebei 6, 16–21. doi: 10.3969/j.issn.1004-6755.2019.06.009
Goudet J. (2001) FSTAT, a program to estimate and test gene diversities and fixation indices. 2.9. Available at: http://www.unil.ch/softwares/fstat.html.
Guo B., Li Z., Merilä J. (2016). Population genomic evidence for adaptive differentiation in the Baltic Sea herring. Mol. Ecol. 25 (12), 2833–2852. doi: 10.1111/mec.13657
Gwak W.-S., Lee Y.-D., Nakayama K. (2015). Population structure and sequence divergence in the mitochondrial DNA control region of gizzard shad konosirus punctatus in Korea and Japan. Ichthyological Res. 62 (3), 379–385. doi: 10.1007/s10228-014-0450-7
Han Z.-Q., Gao T.-X., Yanagimoto T., Sakurai Y. (2008). Deep phylogeographic break among white croaker pennahia argentata (Sciaenidae, perciformes) populations in north-western pacific. Fish. Sci. 74 (4), 770–780. doi: 10.1111/j.1444-2906.2008.01588.x
Han Z.-Q., Guo X.-Y., Liu Q., Liu S.-S., Zhang Z.-X., Xiao S.-J., et al. (2021). Whole-genome resequencing of Japanese whiting (Sillago japonica) provide insights into local adaptations. Zoological Res. 42 (5), 548. doi: 10.24272/j.issn.2095-8137.2021.116
Han S.-Y., Kim J.-K., Tashiro F., Kai Y., Yoo J.-T. (2019). Relative importance of ocean currents and fronts in population structures of marine fish: a lesson from the cryptic lineages of the hippocampus mohnikei complex. Mar. Biodiver. 49 (1), 263–275. doi: 10.1007/s12526-017-0792-2
Hess J. E., Campbell N. R., Close D. A., Docker M. F., Narum S. R. (2013). Population genomics of p acific lamprey: adaptive variation in a highly dispersive species. Mol. Ecol. 22 (11), 2898–2916. doi: 10.1111/mec.12150
Hulce D., Li X., Snyder-Leiby T., Liu C. S. (2011). GeneMarker® genotyping software: Tools to increase the statistical power of DNA fragment analysis. J. Biomolecular Techniques JBT 22, S35–S36.
Jakobsson M., Rosenberg N. A. (2007). CLUMPP: a cluster matching and permutation program for dealing with label switching and multimodality in analysis of population structure. Bioinformatics 23 (14), 1801–1806. doi: 10.1093/bioinformatics/btm233
Kalinowski S. T., Taper M. L., Marshall T. C. (2007). Revising how the computer program CERVUS accommodates genotyping error increases success in paternity assignment. Mol. Ecol. 16 (5), 1099–1106. doi: 10.1111/j.1365-294X.2007.03089.x
Kimura M. (1979). The neutral theory of molecular evolution. Sci. Am. 241 (5), 98–129. doi: 10.1038/scientificamerican1179-98
Kumar S., Stecher G., Li M., Knyaz C., Tamura K. (2018). MEGA X: Molecular evolutionary genetics analysis across computing platforms. Mol. Biol. Evol. 35 (6), 1547–1549. doi: 10.1093/molbev/msy096
Laikre L., Palm S., Ryman N. (2005). Genetic population structure of fishes: implications for coastal zone management. AMBIO: A J. Hum. Environ. 34 (2), 111–119. doi: 10.1579/0044-7447-34.2.111
Larmuseau M. H., Van Houdt J. K., Guelinckx J., Hellemans B., Volckaert F. A. (2009). Distributional and demographic consequences of pleistocene climate fluctuations for a marine demersal fish in the north-eastern Atlantic. J. Biogeogr. 36 (6), 1138–1151. doi: 10.1111/j.1365-2699.2008.02072.x
Letunic I., Bork P. (2021). Interactive tree of life (iTOL) v5: an online tool for phylogenetic tree display and annotation. Nucleic Acids Res. 49 (W1), W293–W296. doi: 10.1093/nar/gkab301
Li J., Liu B., Chen S., Peng Y., Zhang K., Huang W., et al. (2022). Development and characterization of seventeen novel microsatellite markers in common hairfin anchovy (Setipinna tenuifilis) using third-generation sequencing technology. J. Appl. Ichthyol. 38 (4), 462–467. doi: 10.1111/jai.14335
Liu B.-J., Zhang B.-D., Xue D.-X., Gao T.-X., Liu J.-X. (2016). Population structure and adaptive divergence in a high gene flow marine fish: the small yellow croaker (Larimichthys polyactis). PloS One 11 (4), e0154020. doi: 10.1371/journal.pone.0154020
Liu B.-J., Zhang K., Zhang S.-F., Liu Y.-F., Li J.-S., Peng Y., et al. (2022). Chromosome-level genome assembly of the dotted gizzard shad (Konosirus punctatus) provides insights into its adaptive evolution. Zoological Res. 43 (2), 217. doi: 10.24272/j.issn.2095-8137.2021.351
Liu B., Zhang K., Zhu K., Shafi M., Gong L., Jiang L., et al. (2020). Population genetics of konosirus punctatus in Chinese coastal waters inferred from two mtDNA genes (COI and cytb). Front. Mar. Sci. 7, 534. doi: 10.3389/fmars.2020.00534
Maggs C. A., Castilho R., Foltz D., Henzler C., Jolly M. T., Kelly J., et al. (2008). Evaluating signatures of glacial refugia for north Atlantic benthic marine taxa. Ecology 89 (sp11), S108–S122. doi: 10.1890/08-0257.1
Myoung S. H., Kim J.-K. (2014). Genetic diversity and population structure of the gizzard shad, konosirus punctatus (Clupeidae, Pisces), in Korean waters based on mitochondrial DNA control region sequences. Genes Genomics 36 (5), 591–598. doi: 10.1007/s13258-014-0197-6
Nei M., Tajima F., Tateno Y. (1983). Accuracy of estimated phylogenetic trees from molecular data. J. Mol. Evol. 19 (2), 153–170. doi: 10.1007/BF02300753
Nielsen E. E., Hansen M. M., Meldrup D. (2006). Evidence of microsatellite hitch-hiking selection in Atlantic cod (Gadus morhua l.): implications for inferring population structure in nonmodel organisms. Mol. Ecol. 15 (11), 3219–3229. doi: 10.1111/j.1365-294X.2006.03025.x
Peakall R., Smouse P. E. (2012). GenAlEx 6.5: Genetic analysis in Excel. Population genetic software for teaching and research--an update. Bioinformatics 28 (19), 2537–9. doi: 10.1093/bioinformatics/bts460
Peng Y., Li J., Zhang K., Liu Y., Li X., Zhang H., et al. (2021). Identification of a large dataset of SNPs in hair-fin anchovy (Setipinna tenuifilis) based on RAD-seq. Anim. Genet. 52 (3), 371–374. doi: 10.1111/age.13062
Piry S., Luikart G., Cornuet J. M. (1999). Computer note. BOTTLENECK: a computer program for detecting recent reductions in the effective size using allele frequency data. J. heredity 90 (4), 502–503. doi: 10.1093/jhered/90.4.502
Pritchard J. K., Stephens M., Donnelly P. (2000). Inference of population structure using multilocus genotype data. Genetics 155 (2), 945–959. doi: 10.1093/genetics/155.2.945
Rebstock G. A., Kang Y. S. (2003). A comparison of three marine ecosystems surrounding the Korean peninsula: Responses to climate change. Prog. Oceanogr. 59 (4), 357–379. doi: 10.1016/j.pocean.2003.10.002
Rosenberg N. A. (2004). DISTRUCT: A program for the graphical display of population structure. Mol. Ecol. Notes 4 (1), 137–138. doi: 10.1046/j.1471-8286.2003.00566.x
Rousset F. (2008). genepop’007: A complete re-implementation of the genepop software for windows and Linux. Mol. Ecol. Resour. 8 (1), 103–106. doi: 10.1111/j.1471-8286.2007.01931.x
Saillant E. A., Luque P. L., Short E., Antoni L., Reynal L., Pau C., et al. (2022). Population structure of blackfin tuna (Thunnus atlanticus) in the western Atlantic ocean inferred from microsatellite loci. Sci. Rep. 12 (1), 1–9. doi: 10.1038/s41598-022-13857-z
Saunders N. C., Kessler L. G., Avise J. C. (1986). Genetic variation and geographic differentiation in mitochondrial DNA of the horseshoe crab, limulus polyphemus. Genetics 112 (3), 613–627. doi: 10.1093/genetics/112.3.613
Semenova A., Stroganov A., Afanasiev K., Rubtsova G. (2015). Population structure and variability of pacific herring (Clupea pallasii) in the white Sea, barents and kara seas revealed by microsatellite DNA analyses. Polar Biol. 38 (7), 951–965. doi: 10.1007/s00300-015-1653-8
SOFIA F. (2018). The state of world fisheries and aquaculture 2018-meeting the sustainable development goals (Rome: Fisheries and Aquaculture Department, Food and Agriculture Organization of the United Nations).
Song N., Gao T., Ying Y., Yanagimoto T., Han Z. (2016). Is the kuroshio current a strong barrier for the dispersal of the gizzard shad (Konosirus punctatus) in the East China Sea? Mar. Freshw. Res. 68 (5), 810–820. doi: 10.1071/MF16114
Song N., Yin L., Sun D., Zhao L., Gao T. (2019). Fine-scale population structure of collichtys lucidus populations inferred from microsatellite markers. J. Appl. Ichthyol. 35 (3), 709–718. doi: 10.1111/jai.13902
Terekhanova N. V., Seplyarskiy V. B., Soldatov R. A., Bazykin G. A. (2017). Evolution of local mutation rate and its determinants. Mol. Biol. Evol. 34 (5), 1100–1109. doi: 10.1093/molbev/msx060
Vineesh N., Shihab I., Akhilesh K., Sajeela K., Muktha M., Gopalakrishnan A. (2022). Is Lutjanus argentimaculatus genetically connected along the Arabian Sea and Bay of Bengal? A study using microsatellite markers. Aquaculture 562, 738863. doi: 10.1016/j.aquaculture.2022.738863
Wang W., Ma C., Ouyang L., Chen W., Zhao M., Zhang F., et al. (2021). Genetic diversity and population structure analysis of lateolabrax maculatus from Chinese coastal waters using polymorphic microsatellite markers. Sci. Rep. 11 (1), 1–11. doi: 10.1038/s41598-021-93000-6
Wang H., Wang P., Xu C., Sun Y., Shi L., Zhou L., et al. (2022). Can the “10-year fishing ban” rescue biodiversity of the Yangtze River? The Innovation 3 (3), 100235. doi: 10.1016/j.xinn.2022.100235
Xue D.-X., Yang Q.-L., Li Y.-L., Zong S.-B., Gao T.-X., Liu J.-X. (2019). Comprehensive assessment of population genetic structure of the overexploited Japanese grenadier anchovy (Coilia nasus): implications for fisheries management and conservation. Fish. Res. 213, 113–120. doi: 10.1016/j.fishres.2019.01.012
Yang Q., Gao T., Liu J.-X. (2014). Development and characterization of 17 microsatellite loci in an anadromous fish coilia nasus. Conserv. Genet. Resour. 6 (2), 357–359. doi: 10.1007/s12686-013-0093-4
Ying Y., Chen Y., Lin L., Gao T. (2011). Risks of ignoring fish population spatial structure in fisheries management. Can. J. Fish. Aquat. Sci. 68 (12), 2101–2120. doi: 10.1139/f2011-116
Zane L., Bargelloni L., Patarnello T. (2002). Strategies for microsatellite isolation: a review. Mol. Ecol. 11 (1), 1–16. doi: 10.1046/j.0962-1083.2001.01418.x
Zhang S. (2001). Fauna sinica: Osteichthyes, acipenseriformes, elopiformes, clupeiformes, gonorhynchiformes, Unknown.
Keywords: Konosirus punctatus, microsatellites, genetic diversity, population structure, outliers
Citation: Liu B, Li J, Zhang K, Peng Y, Liu Y, Jin X, Zheng S, Wang Y, Liu L, Lü Z, Zhang S and Gong L (2022) Population structure and genetic diversity in wild dotted gizzard shad (Konosirus punctatus) revealed by microsatellite markers. Front. Mar. Sci. 9:1048279. doi: 10.3389/fmars.2022.1048279
Received: 19 September 2022; Accepted: 17 November 2022;
Published: 01 December 2022.
Edited by:
Anna Rita Rossi, Sapienza University of Rome, ItalyReviewed by:
Ioannis A. Giantsis, University of Western Macedonia, GreecePiero Cossu, University of Sassari, Italy
Copyright © 2022 Liu, Li, Zhang, Peng, Liu, Jin, Zheng, Wang, Liu, Lü, Zhang and Gong. This is an open-access article distributed under the terms of the Creative Commons Attribution License (CC BY). The use, distribution or reproduction in other forums is permitted, provided the original author(s) and the copyright owner(s) are credited and that the original publication in this journal is cited, in accordance with accepted academic practice. No use, distribution or reproduction is permitted which does not comply with these terms.
*Correspondence: Li Gong, Z29uZ2xpMTAyN0AxNjMuY29t