 Shaowei Zhang
 Chuan Tian
 Fenghua Zhou
95% of researchers rate our articles as excellent or good
Learn more about the work of our research integrity team to safeguard the quality of each article we publish.
Find out more
ORIGINAL RESEARCH article
Front. Mar. Sci. , 04 January 2023
Sec. Ocean Observation
Volume 9 - 2022 | https://doi.org/10.3389/fmars.2022.1048048
This article is part of the Research Topic Deep-Sea Observation Equipment and Exploration Technology View all 16 articles
For long-term mooring buoy observatories in the deep sea far from the coasts, we design the hybrid system, named Mooring Buoys Observation System with Benthic Electro-optical-mechanical Cable (MBOSBC). The Electro Optical Mechanical (EOM) cable connects the sea surface buoy, and benthic observation node, as the transmission link of information and power. Different from the traditional buoy mooring, Mooring Buoys Observation System needs to accomplish the energy and data transmission between the seabed and the sea surface. The EOM cable is utilized for mooring, and it is the crucial link to ensure the long-term and effective work of the system and energy / data transmission. EOM cable plays the role of mooring tether of MBOSBC. Since the EOM cable has to experience higher loads under most environmental conditions for long terms. It is often happened that, the EOM cable is not broken, but the power supply core wire and signal wire have broken or failed, while the buoy is subjected to wind, wave and current load. This puts forward the requirements for the design of bearing load and mooring style for the mooring EOM cable. This paper gives the idea of mooring design of buoy, and this paper provide the design criteria of the single point mooring buoy with EOM cable. We compare the dynamics properties and mooring line type under different external environmental load, and the mooring style is optimized. Finally, the dynamic properties and mooring line type during the system deployment process is discussed.
Seafloor observatories are used to gather information about the physical, chemical, and geological processes that occur on the seafloor. They can monitor environmental processes, including changes to the ocean climate, ocean upwelling, eddies, seismicity, geomagnetic variations, temperature, salinity, currents, and gas over the long term. First, these observatories produce a large amount of multidisciplinary ocean data for scientists in real time. The NEPTUNE Ocean Observatory in Canada is the most representative example of such state-of-the-art marine technology. Second, seafloor observatories have potential applications for the offshore operations of the oil and gas industry. Third, seafloor observatories support maritime security. For example, seafloor observatories with seafloor hydrophone arrays can track and identify surface vessels, autonomous underwater vehicles, and cetaceans.
Cabled seafloor observatories have been developed by Canada, USA, and Japan. These systems transmit power to an underwater junction box from a shore station through an electro-optical-mechanical (EOM) cable. Thus, the EOM cable and junction box connect the shore station with the sensors and instruments. However, there are huge costs for manufacturing the EOM cable and launching and maintaining the system. Also, it is difficult to change or adjust the position of the seafloor junction box once the system has been completely constructed. So, a cabled seafloor observatory is not easily moved, for example, in response to an emergency event. Such surface and seafloor observatories are restricted to regions close to the coast rather than in the deep sea far from the shore.
However, renewable energy generators, such as wind turbines and solar panels, make it possible to deploy seafloor observatories far from the coast. The data can be transferred from the seabed via an EOM cable and relayed to a satellite. The EOM cable is used to transfer data and power between a benthic node and a moored buoy. Such moored-buoy seafloor observatories can provide real-time, synchronized, three-dimensional data from observations of the sea surface and the seafloor (Smith et al., 2018; Trowbridge et al., 2019). There are, however, several problems with moored-buoy seafloor observatories. The EOM cable hangs in the water due to its net buoyancy. Thus, it has to endure dynamic conditions for a long time. It is difficult to get continuous high-bandwidth communications. A very-small-aperture terminal can provide a bandwidth of up to 1 Mbps. Finally, the power supply is limited by how many solar panels and wind turbines can be equipped on the buoy, which depends on the size of and available space on the buoy.
It would be useful to establish a regional system of ocean observatories that can be relocated in response to an emergency event. We developed the Moored-Buoy Observation System with a Benthic Electro-optical-mechanical Cable (MBOSBC). This system can be used to make supplementary observations that complement those made by traditional buoys or a seafloor observation network. MBOSBC has a surface buoy, mooring cable, and benthic node to realize three-dimensional observations of the sea surface and seabed. The system connects the observation nodes through the mooring cable. The mooring cable transfers energy and data while also mooring the sea surface buoy. Acoustic communication is used to supplement the cable communication from the benthic node to the sea surface. Such ocean buoys mainly collect data on temperature, salinity, ocean currents, waves, and oceanographic meteorology. They are deployed in regions with a depth of less than 1000 m. The data collected provide support for research into the ocean climate and physical ocean processes, such as ocean circulation, internal isolation waves, upwelling, and other ocean phenomena. The buoy in MBOSBC not only makes sea surface observations but also transfers energy to the seabed and information from it. The data collected are transmitted back to the shore base via a satellite. For example, a buoy has been designed as a communication intermediary. It collects data from an autonomous underwater vehicle and seafloor benthic platform through acoustic communication (Detrick et al., 2000; Favali et al., 2006).
CUMAS (Cabled Underwater Module for Acquisition of Seismological data) has been deployed in Campi Flegrei caldera (Pozzuoli, southern Italy) at a depth of 100 m (Iannaccone et al., 2009; De Martino et al., 2014). It extends the land surveillance network into the large marine sector of the caldera. CUMAS, developed for monitoring a volcano in shallow water, adopts a mixed solution. It has an elastic-beacon buoy consisting of a pole (of about 40 m in length) with a linear polyethylene float, which contains polyurethane foam for buoyancy. The buoy weighs 7 tons. A purely mechanical anti-torsion wire connects the buoy to a concrete boulder on the seabed, which acts as ballast (17 tons). A multidisciplinary observatory installed on the seafloor is connected to the buoy via a separate electromechanical (EM) cable, which is used for deployment and recovery and transferring power and data. Data with GPS locations are sent to the shore monitoring site via a Wi-Fi link operating at 5 GHz. This mooring method is suitable for shallow water applications up to depths of about 400–500 m. If this method is utilized for mooring in the deep sea, the optical cable and anchor chain can easily become entangled, which may lead to fracturing of the optical core and system failure.
The prototype MBARI Ocean Observatory System (MOOS) (Chaffey et al., 2001; Chaffey et al., 2005; Hamilton and Chaffey, 2005) has a 3-m-diameter buoy, an ocean benthic platform, and EOM cable. It has been deployed in the deep ocean in depths of up to 4000 m. The EOM cable transmits power and data between seafloor instruments and the buoy. The surface buoy can generate up to 40 W of power with a horizontal-axis wind turbine and a solar panel. The EOM cable and the seafloor junction box are connected to a remotely operated underwater vehicle with a wet-mateable electro-optical connector.
The Dynamics of Earth and Ocean Systems observatory (DEOS) (Detrick et al., 2000) has a moored discus buoy connected by an electro-optic cable to instruments on the seafloor. C-Band satellite telemetry is utilized in DEOS for continuous high-bandwidth communication (64–128 kbps or higher). The buoy has a diesel generator, which supplies enough power (up to 1000 W) for the benthic node.
An acoustic link between the sea surface and the seafloor is less complicated than a cable but has lower data rates and an inability to provide power to the seafloor. CSnet’s Offshore Communication Backbone (OCB) will initially serve as the Tsunami Warning and Early Response system of Cyprus (TWERC). OCB can operate at depths of 3000 m. It is designed to support a modular architecture, linking together several buoys (Clark et al., 2009; Clark, 2010; Georgiou et al., 2010; Clark and Kocak, 2011). The OCB consists of a buoy, a buoy riser cable (for mooring, power, and communications), anchor, seafloor cable, and four seafloor nodes. The surface buoy has a C-band satellite antenna, which provides a data bandwidth in excess of 2 Mbps. The buoy is powered by a diesel electrical generator that produces 1000 W of power for the seafloor equipment. The seafloor junction box has wet-mateable “plug-in” ports.
The Coastal Surface Mooring Buoy System developed by the Ocean Observatories Initiative (OOI) is maintained as part of the Regional Cable Array (Smith et al., 2018). The maximum launch depth is 588 m. This system has a surface buoy with a 3-m-tall tower, a near-surface instrument frame (NSIF), which is at a depth of 7 m, and a multifunction node on the sea bottom. These three components are connected by an EM cable, which transfers information and power between the sea bottom and surface. The buoy is moored to a metal-armored EM cable instead of an EOM cable. The data transmission technology between the seafloor and the surface is based on DSL. The EM stretch hose used is designed to stretch 2.5 times its length in a typhoon without disrupting its ability to transfer data or power. It is suitable for mooring, as the stretching decreases the dynamic tension.
Satellite communication offers a low-bandwidth communications path for the buoys, whereas the optical fiber in the EOM cable provides high-bandwidth communications from the seafloor to the sea surface. The cable utilized in MOOS is different from that used for a cabled seafloor observation network. The traditional EOM cable in a seafloor network is armored with steel wire and lies static on the sea bottom. However, an armored EOM cable is not suitable for mooring a buoy in the deep sea. Because the net buoyancy of the buoy is limited, the EOM cable has to have net buoyancy, so that it will hang in the water for a long time. This kind of EOM cable requires high strength, excellent bending ability, watertight performance, and good wear resistance. Vectran fibers, nylon, and polyester are selected as the strength member of the cable. The properties of EOM cables with different strength materials are compared in the literature (Hamilton et al., 2003; Paul et al., 2003; Han and Grosenbaugh, 2006; Grosenbaugh et al., 2006), especially the static and dynamic responses of a mooring EOM cable.
Tethering is simpler in shallow seas (Iannaccone et al., 2009; De Martino et al., 2014). The anchoring rope and coaxial cable are linked together as the mooring component (Makris et al., 2014). However, it is difficult to utilize this kind of mooring method in the deep sea since it is hard to launch and recover the system because the anchor chain and cable are entangled together.
The cables used in MOOS have Vectran fibers as the load-bearing layer. These have neutral buoyancy. Optical fibers are used for communication. Thus, neutral-buoyancy EOM cables are used for mooring. To reduce the effect of loads generated by waves and winds at the sea surface, a 24-m-long retractable rubber snubber connects the MOOS buoy and the Vectran cable as a buffer link (Hamilton and Chaffey, 2005). For data and power transmission, electric wire is spirally wound around a rubber tube at a certain spiral angle. Tests have demonstrated that the snubber absorbs the bearing tension in the EOM cable. EOM Offshore has designed a special retractable snubber for the cables in the OOI moored-buoy observation system. The snubber can extend up to twice its original length. Thus, it buffers the load from the buoy to the mooring cable. The cable in a moored-buoy observation system has to be different from that used for a traditional buoy, which is moored with a chain, nylon rope, or polyurethane rope. The extension ratio of nylon rope is about 20%, which has a significant buffering effect on the load induced by the heaving movement of the buoy. When an EOM cable is pulled by an external load, its maximum extension and contraction should not exceed 0.5% (Frye et al., 2004). Otherwise, the external load will break the electric wire or optical fiber, causing system failure.
When we deploy MBOSBC, the buoy is generally deployed first, then we lay the mooring cable with a winch, and finally we deploy the benthic node. When the benthic node is deployed from a scientific research ship, it drops to the seafloor quickly, and the tension is quickly transmitted to the sea surface buoy. Driven by the drag force from the mooring cable, the sea surface buoy will move rapidly in the horizontal plane. As a result, the mooring tension and the shape of the mooring line will also change fast. The dynamic tension during deployment increases with the deployment depth and, correspondingly, as the distance between the buoy and the benthic node increases. Moreover, the horizontal speed of the scientific research ship will also increase the dynamic tension. Thus, deployment is a fast and unstable process. The buoy may be pulled under the surface and sink.
In this paper, we design MBOSBC as a seafloor and sea surface observatory in the South China Sea. It can make observations of ocean meteorology, physical processes in the ocean, and the water quality at the sea surface and seafloor. MBOSBC has a moored buoy and a benthic node connected by an EOM cable. The moored buoy makes observations, generates power, and transmits data. The benthic node collects information about ocean physical processes and video images of the seafloor. Furthermore, the benthic node is the anchor for the moored buoy. Therefore, this paper first describes the background in the design of MBOSBC system. We then design the mooring approach. We analyze static mooring loads under different external environments. The influence of the length and position of a rubber snubber on the mooring force is discussed. Moreover, we assess the dynamic load under the influence of winds, waves, and currents. We also analyze the dynamic characteristics of the buoy during deep-sea deployment, especially the shape of the mooring line and the horizontal speed of the buoy after the benthic node is launched from a scientific research ship. The research results may provide guidance in the deployment of the system.
MBOSBC is designed for regional observatories off the coast in the South China Sea. It combines seafloor and sea surface instruments to provide a broad spectrum of environmental, meteorological, and hydrological measurements, including water temperature, pressure, salinity, current, wind speed and direction, air temperature, relative humidity, barometric pressure, and chemistry. We integrated a seafloor video module, which has an LED light for camera illumination, camera, CTD, and acoustic Doppler current profiler, to verify the power capacity of MBOSBC and its radio transmission capability (Zhang et al., 2018). The overall system architecture is shown in Figure 1A). It has three main parts: moored buoy, benthic node, and EOM cable. The moored buoy makes observations of the sea surface, transfers data, and generates energy. The benthic node contains a junction box, the oceanographic instruments, the seafloor video module, and the buoy anchor block. The junction box contains systems for power management, control, data acquisition, and monitoring the status of the seafloor junction box. The EOM cable moors the sea surface buoy to the benthic node.
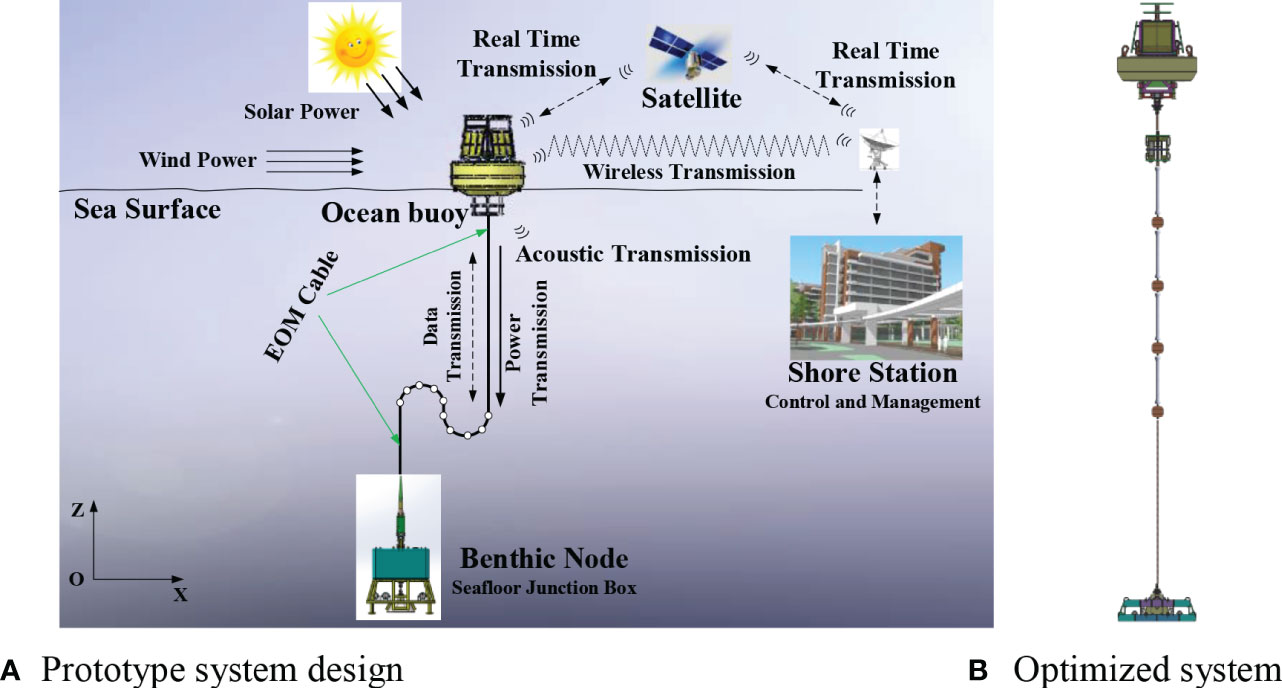
Figure 1 Design of MBOSBC. (A) Prototype system design (B) Optimized system.
Initially, we used a metal-armored EOM cable and a Vectran cable in experiments with the prototype system in shallow water, as shown in Figure 1A). To resolve the problems identified in the experiments, we optimized the system, as shown in Figure 1B). We discuss the mooring design in this paper.
The moored buoy is a rigid structure made of AISI-304 stainless steel. Its main diameter is 3 m, and its weight in air is 4.2 tons. It is shown in Figure 1A). A watertight tank surrounds the center of the buoy. The electronic instruments are mounted in the watertight tank. The buoy has 24 rechargeable batteries (2 V and 500 Ah each), which are connected to eight solar panels and a wind turbine. Since the watertight tank is cylindrical, we arranged the batteries in a cube with four rows and five columns. Another four batteries were placed at the centers of the four vertical sides of the cube. Twelve of these batteries were connected in series to offer 24 V as the bus voltage. Then, the two groups were connected in parallel to offer 24 V 1000 Ah storage for the whole buoy system. A DC/DC converter connected the batteries and buoy control module to offer 12V, 24V, 5V, and 3.3 V (DC) for the sensors. Each solar panel produced a nominal 100 W and had dimensions 1200 mm × 540 mm.
The benthic observation node is also shown in Figure 1A). Its maximum working depth is 1000 m. The junction box has a titanium cylinder that holds the power supply. A second titanium cylinder holds the data communication and control equipment. The mass of the junction box is less than 150 kg in air, and it is surrounded by a cage. The junction box hosts several instruments, including a seafloor video imaging module, CTD, and acoustic Doppler current profiler.
The base area of the cage is 2.25 m × 2.25 m, and it has a height of 2.53 m. The seafloor junction box and the video module are fixed to the grid of the cage. The diameter of the two titanium cylinders holding the junction box is 320 mm, and their length is 1060 mm. The DC/DC converter, data sampler, and transmission module are fixed separately into the two titanium cylinders.
The benthic observation node is the seafloor anchor. The cage used to hold the scientific instruments has a mass of 1 ton in air. The anchor block at the bottom center of the cage has a mass of 3 tons in air, which is sufficient to moor the buoy. To recover the MBOSBC, the anchor block can be released by an acoustic release.
Our goal is to moor the system at a depth of 1000 m with an EOM cable. A traditional EOM cable is armored with metal (A302351, Rochester Engineered EOM Cable; Figure 2). The EOM cable has a diameter of 17.30 mm, and a breaking strength of 204.6 kN. Its weight in water is 9.050 kN/km. We deployed the system in shallow coastal water to test the communications. It is composed of three optical fibers and three #11 AWG copper wires, as shown in Figure 2A).
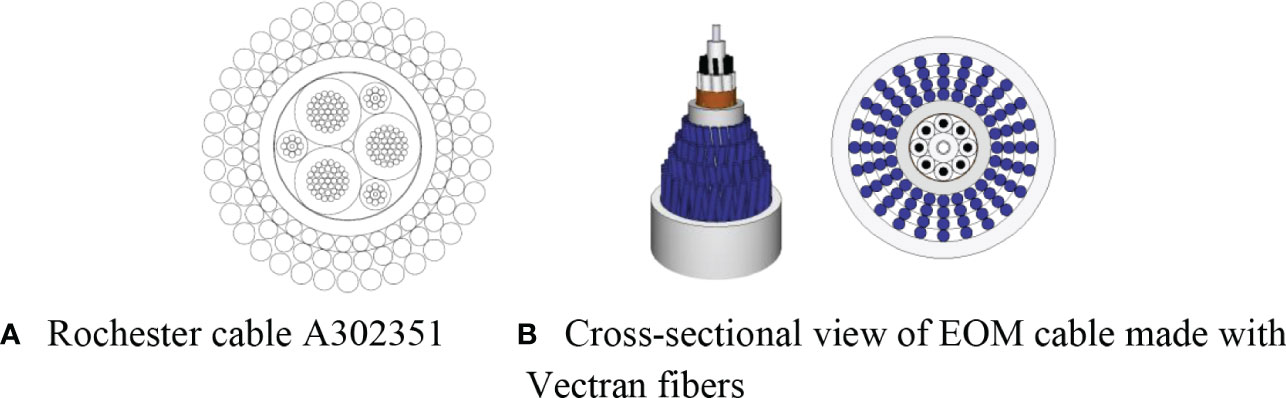
Figure 2 Design of mooring EOM cable. (A) Rochester cable A302351 (B) Cross-sectional view of EOM cable made with Vectran fibers.
If we replace the mooring chain with the A302351 cable, then the 1400 m of cable will have a mass of 1267 kg in air, which will have a significant effect on the stability of the buoy. The weight of the armored cable may drag the buoy under the water surface, which may lead to loss of the buoy. Thus, it is not suitable to deploy the system at a depth of 1000 m. For a deep-sea buoy, we have to select an EOM cable with net buoyancy rather than this armored mooring cable. Thus, an EOM cable with net buoyancy is utilized for single-point mooring in MBOSBC.
We designed a net buoyancy EOM cable that has four optical fibers with watertight connectors and eight #18 AWG copper wires, as shown in Figure 2B). Two optical fibers are utilized for data transmission, and two copper wires are utilized for power transmission. The diameter of the EOM cable is 30 mm, its breaking strength is 200 kN, and its weight in water is 0 ± 2.0 N/m.
It has Vectran fibers as the strength member. The conductors and optical fibers are in the core and surrounded by Vectran fibers. The Vectran fibers [blue circles in Figure 2B)] are arranged in four layers. The outer bedding braid layer is made from polyester, which protects the Vectran fibers from abrasion.
In the initial design of the prototype system, we utilized hybrid mooring methods with the A302351 cable and an anchor chain twisted together. We laid out the system near the shore and recovered it to verify the feasibility of the system. Then, we designed the deep-sea single-point mooring mode. We used Vectran fibers as the bearing layer, as shown in Figure 2B). The tension in the cable was measured to be as high as 280 kN. However, during the test, we found that the cable has poor scalability. Moreover, the manufacturing process is complex. We also discovered that the Vectran-fiber material has poor seawater corrosion resistance. The outer sheath of the optical cable is hard and wears quickly. When the outer sheath breaks, the Vectran fibers become corroded by seawater. As a result, the tethering force is greatly reduced and no longer meets the mooring requirements. Communications via the optical fibers in the EOM cable failed in each test. Thus, considering the problems we found in the near shore experiments, we decided to analyze the mooring dynamics and to redesign the mooring system with a rubber snubber and EM cable.
In addition, for the initial design, the frame for the benthic node was made of AISI-316 stainless steel. It was too heavy, so we added a huge amount of buoyant material to the top of the frame. Thus, the benthic node would rise to the sea surface with the buoyancy force if the anchor block were released from the benthic node. However, in this design, the weight of the seafloor node is still too high. Therefore, in our subsequent optimized design, a cylinder made from an aluminum alloy was used as the frame for the benthic node. This reduces the weight of the system, since the density of the aluminum alloy is much less than that of stainless steel. Moreover, the aluminum alloy cylinder can be utilized as a buoyancy compartment. It provides enough buoyancy for the benthic node to rise to the surface, which avoids the need to include additional buoyancy material.
Table 1 gives the specifications of buoy-moored seafloor observatory systems. Overall, the tensile strength of Vectran-fiber EOM cable is sufficient for mooring, as shown by Yu et al. (2020). However, in our actual tests, the performance of the Vectran-fiber EOM cable was not as good as we expected, mainly in the following aspects:
1. The elasticity of Vectran-fiber EOM cable is poor, which may lead to loss of communications due to failure of the optical fibers.
2. The outer sheath of Vectran-fiber EOM cable is relatively soft, and it is easily scratched by the seabed.
3. Vectran-fiber EOM cable is not sufficiently waterproof. The tensile strength of Vectran fiber decreases if it is immersed in seawater, which can occur if the cable sheath becomes scratched.
4. The slip ring can cause a short circuit. So, we need a flexible connection between the buoy and the cable.
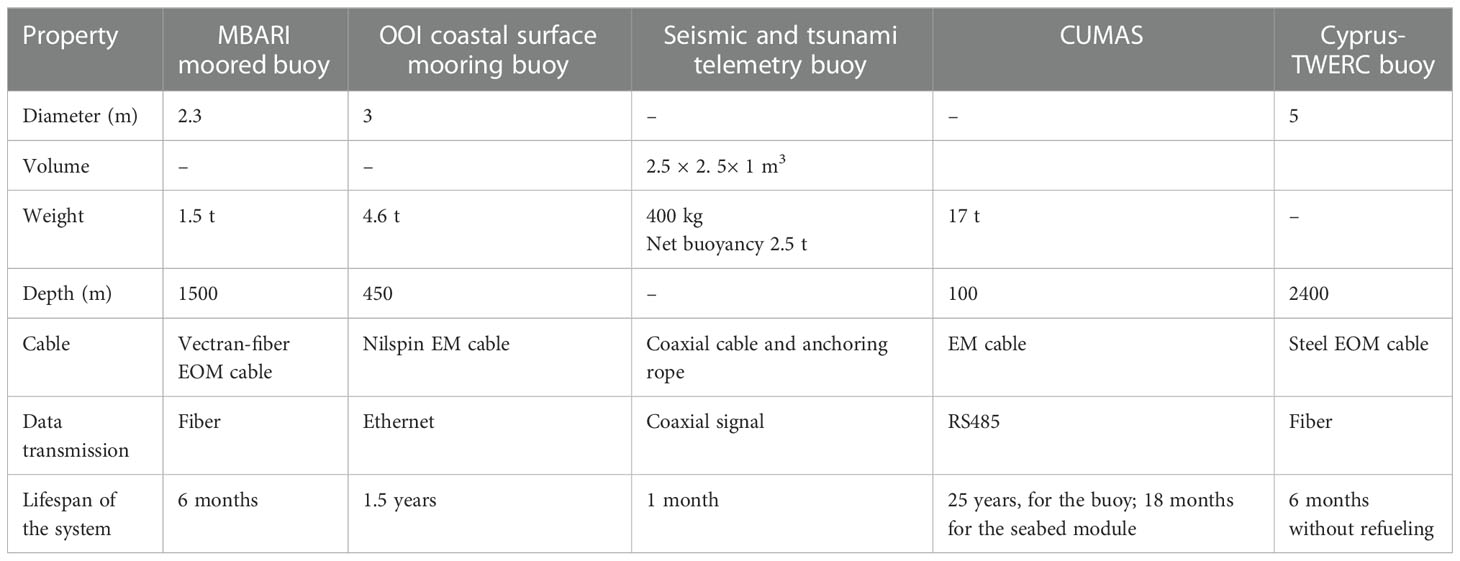
Table 1 Specifications of buoy-moored seafloor observatory systems.
Thus, we decided to use a combination of nylon EM cable and Nilspin EM cable for buoy mooring in our subsequent designs. We optimized the mooring components and carried out a dynamic simulation of the mooring system as follows:
1. We choose nylon EM cable and Nilspin EM cable for mooring, as they were sufficiently waterproof. Optical fiber was no longer utilized for the cabled communications.
2. To increase the flexibility of the mooring system, we connected the buoy and the EM cable with a snubber. We analyzed the dynamic properties of the mooring system under the influence of wind, waves, and currents.
3. We optimized the length of the snubber by measuring the cable tension in the mooring system with different lengths of snubber.
4. During a deep deployment, the mooring cable and benthic node pull on the surface buoy. Thus, we theoretically analyzed the speed of the surface buoy during deployment and identified the maximum and when this occurred. This information allows us to understand the movement of the buoy during deployment. Thus, we can use small boats to counter the pull on the buoy.
The properties of the components of a mooring cable are listed in Table 2. The dynamics of the mooring cable for a buoy closely depends on deployment depth. Thus, the diameter, mooring tension, and self-weight of the mooring cable need to be analyzed for the deployment depth. Moreover, the snubber is an important component for mitigating the impact of the external environmental load on the mooring cable. Thus, it is necessary to determine the best position and length of the EM cable and the snubber based on the results for different deployment depths and mooring dynamics. This will ensure that the EM cable meets the requirements for a moored buoy and for energy and data transmission. We evaluated mooring under tension. The external boundary conditions for the wind and waves are listed in Table 3. The current profile utilized is the maximum expected current, as given in Table 4.
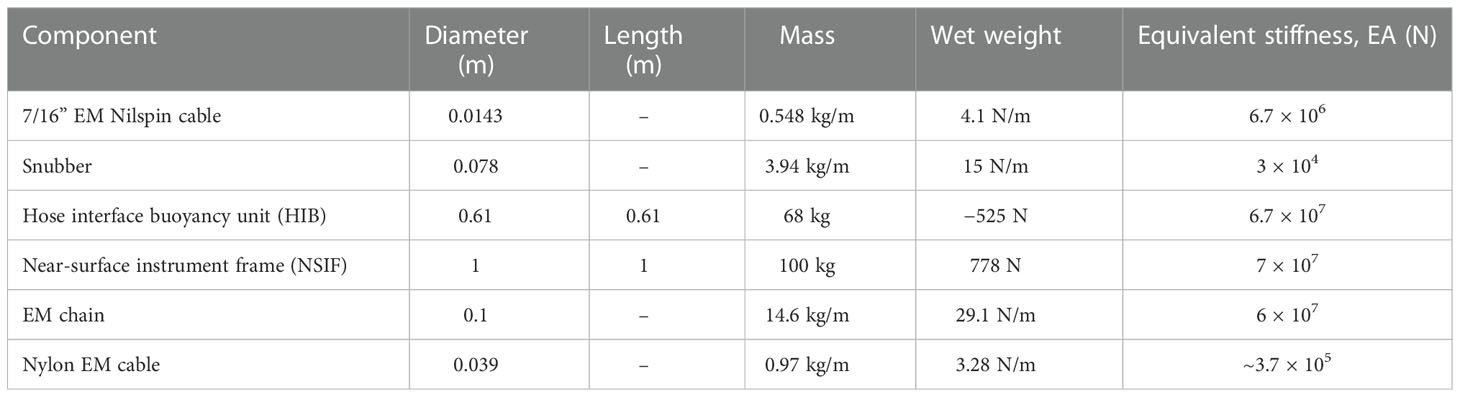
Table 2 Properties of mooring cable components.
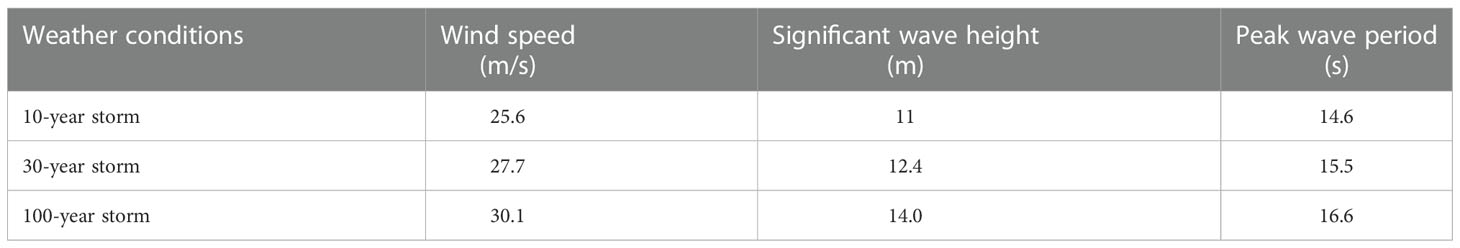
Table 3 Storm conditions: Wave height and period defines a modified Pierson–Moskowitz spectrum.

Table 4 Current profile.
In the mooring system, there is an EM chain near the buoy. It is connected to the NSIF. The mooring system then has four groups of a snubber and a hose interface buoyancy unit (HIB). Finally, an EM cable is connected to the benthic node. The length and buoyancy of each section are listed in Table 5.
Table 5 Components of the mooring system in order with the snubber near the buoy.
The mooring simulations are obtained with Woods Hole Oceanographic Institution (WHOI) cable, a software that is developed for calculating the static and dynamic response of moored oceanographic systems (Gobat and Grosenbaugh, 2000). The software utilizes the finite-difference time-domain (FDTD) method for the mathematical model of cable dynamics.
In the steady-state tension analysis, the whole system is considered to be deployed at a water depth of 1000 m. It needs to be able to withstand a 100-year storm. Both nylon EM cable and Nilspin EM cable are utilized for mooring traditional buoys. The difference between the two kinds of cable is that the equivalent stiffness (EA) of nylon rope is low and its extension ratio is large. The EA of the Nilspin EM cable is about ten times that of the nylon EM cable. The manufacturing process for nylon EM cable is more complex and more difficult. These tests allowed us to assess the influence of the material used to make the cable for a moored buoy.
In addition, the location of the snubber in the mooring system also has a great impact on the mooring tension. Since the buoy is the first node, it must bear external loads due to waves and winds. The tension load is transmitted to the seafloor. If the snubber is near the seafloor node (snubber down), the tension load is transmitted to the EM cable without being absorbed. In contrast, if the snubber is near the buoy (snubber up), some of the mooring load will be absorbed by the rubber snubber, so that changes in the mooring tension in the EM cable are more stable. Thus, we ran four steady-state stress analysis tests with either the nylon EM cable or the Nilspin EM cable and with the snubber near the buoy or above the benthic node, as shown in Table 6.
Table 6 Location of each component in the mooring system.
Figure 3 shows that the mooring lines with the Nilspin EM cable have steeper slopes, mainly because the extension ratio of Nilspin is smaller than that of a nylon EM cable. The location of the snubber also has an impact on the mooring line. For the nylon EM cable, if the snubber is near the seafloor, the slope is steeper near the seafloor than near the sea surface. The length of each mooring line is different. How much they stretch depends on the stiffness of the cable material. However, if the snubber is near the buoy, the mooring tension transmitted to the EM cable is absorbed, for both kinds of EM cable, so the overall mooring line stretches more, mainly due to the extension of the snubber.Table 7 and Figure 4 show that, in the steady-state tension analysis, although both types of cable are connected to the snubber, the mooring force with the Nilspin EM cable is obviously greater than that with the nylon EM cable. The maximum tension with the Nilspin EM cable is about 2 tons, while for the nylon EM cable it is less than 1.3 tons. The variation in the tension in the nylon EM cable with depth is very small, as its elasticity absorbs the resistance generated by the ocean current. Moreover, the nylon EM cable has a low retraction rate but a long length. The rubber snubber has twice the retraction rate but is shorter. The mooring tension in the Nilspin EM cable decreases gradually from the sea surface to the benthic node, but the ability of the Nilspin EM cable to cope with the ocean current is worse.
Figure 3 Shape of the mooring line for a wind speed of 30 m/s, wave speed of 14 m/s, and peak wave period of 16.6 s for different configurations of the mooring line.
Table 7 Comparison of the mooring tension for different cable materials and snubber locations.
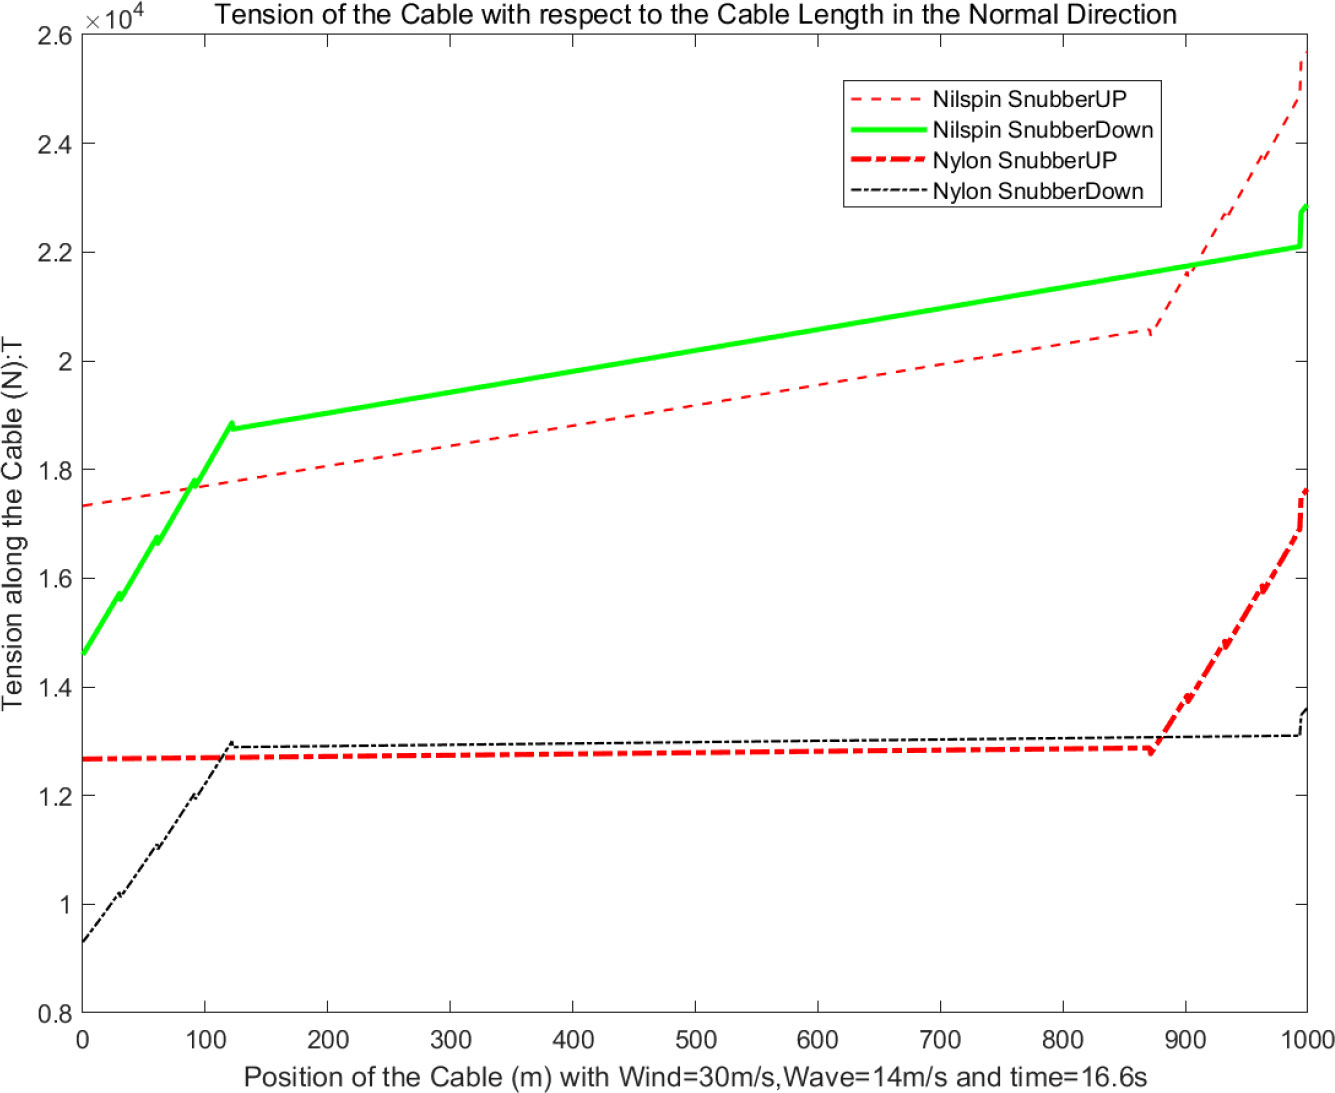
Figure 4 Steady-state tension along the cable for a wind speed of 30 m/s, wave speed of 14 m/s, and peak wave period of 16.6 s for different configurations of the mooring line.
Introducing snubbers and HIBs reduces the mooring tension. The mooring tension has a small bend in the HIB section because the HIB is a rigid connection in the buoy block. Both ends of each HIB are connected to a snubber. This explains the influence of the stiffness of the mooring material.
In conclusion, the snubber should be close to the buoy, so that the mooring tension generated by the external load can be absorbed by the snubber before it is transmitted to the EM cable. This reduces the mooring tension in the cable. In particular, the load-bearing tension in the Nilspin EM cable is greatly reduced. Comparing nylon and Nilspin, it seems that nylon is more suitable for the EM cable due to its stiffness and flexibility (extension ratio 20%). A traditional buoy is moored with nylon rope because of its high extension ratio, which means that the mooring tension is basically constant with respect to depth. However, this is a drawback for the optical core and electric core wire (extension ratio less than 0.5%), which are the media for energy and information transmission. Another advantage of the Nilspin EM cable is its mature manufacturing process. Thus, the Nilspin EM cable is a good choice for the moored buoy in our application.
In the next set of simulations, we compare the EM mooring cable with and without a snubber. The snubber is installed near the buoy. For the tests without the snubber, the snubber is replaced by EM cable. Figure 5 compares the shape of the mooring line and the mooring tension for mooring lines with and without a snubber. The ranges for the mooring tension are given in Table 7.
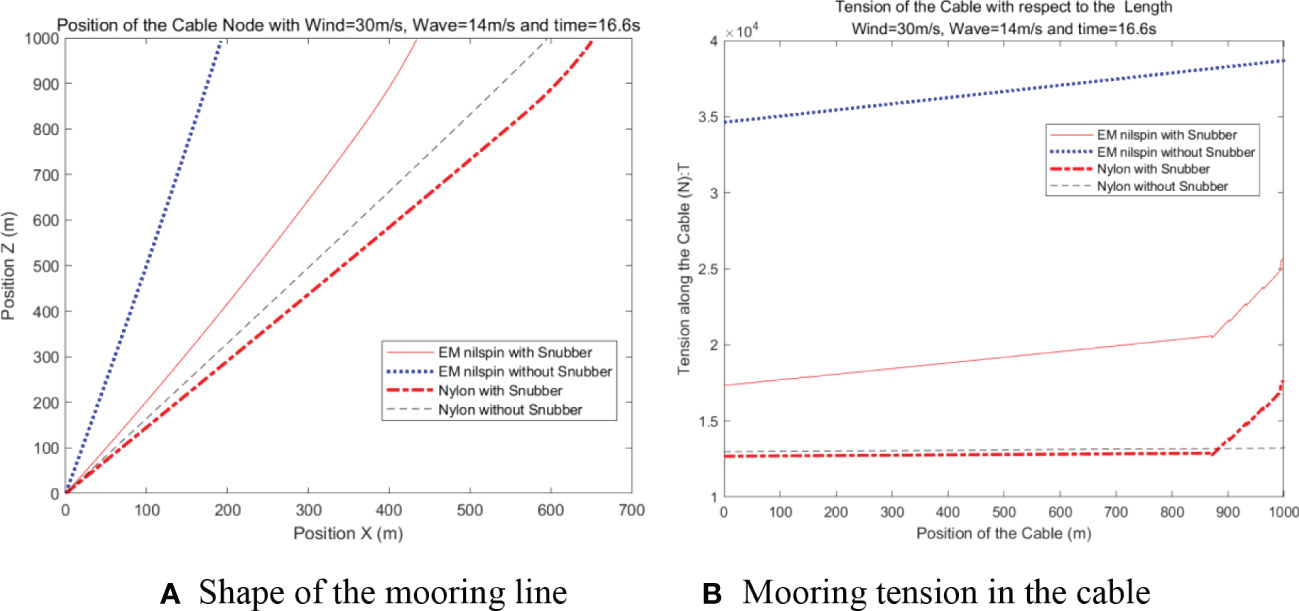
Figure5 Steady-state tension analysis for a wind speed of 30 m/s, wave speed of 14 m/s, and peak wave period of 16.6 s for mooring lines with and without a snubber. (A) Shape of the mooring line (B) Mooring tension in the cable.
For the combined mooring method with the nylon EM cable and snubber, in the steady state, the overall change in the mooring tension is small compared with no snubber. For the Nilspin EM cable, the combined mooring method reduces the mooring tension by 50% compared with no snubber. From the tests described here and in Section 3.1, we conclude that the best mooring components are the Nilspin EM cable and a snubber and that the snubber should be near the buoy. In the following section, we discuss the dynamic properties of the mooring system.
The shape of the mooring line is shown in Figure 6 for different weather conditions for a Nilspin cable with the snubber up. The current and wind are continuous loads, so the slope of the mooring line is steeper when there is no wind or ocean current. It is obvious that the wind increases the mooring tension, as also indicated by Table 8. However, waves are a periodic load. So, the steady-state mooring tension is the same with or without waves if the wind and current are the same, as shown in Figure 7. Therefore, the influence of waves is not reflected in this steady-state mooring tension analysis.
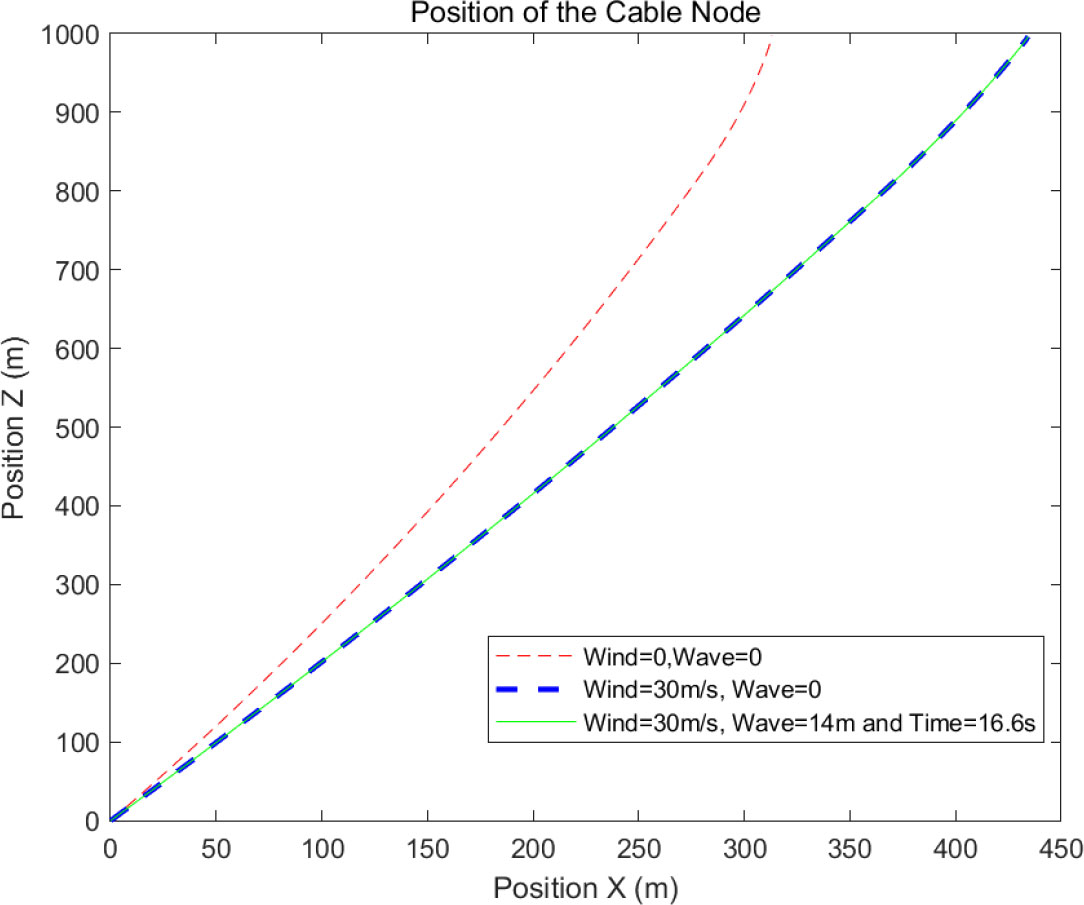
Figure 6 Shape of the mooring line for different weather conditions for a Nilspin cable with the snubber up.
Table 8 Comparison of the mooring tension in a Nilspin EM cable with the snubber up for different weather conditions .
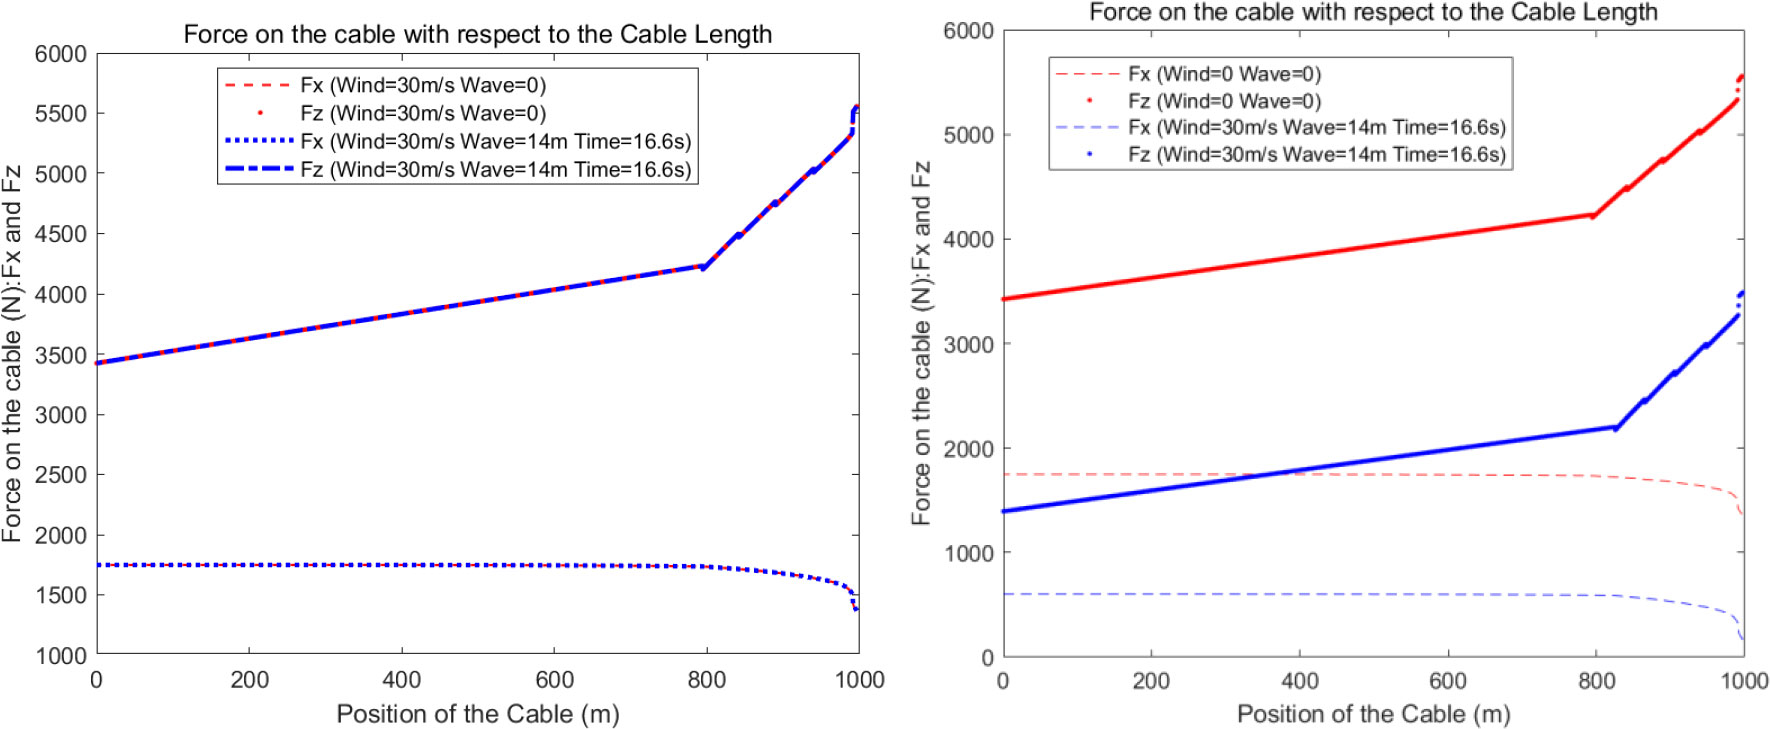
Figure 7 Mooring tension along the vertical direction Fz and horizontal direction Fx for different weather conditions for a Nilspin cable with the snubber up.
Table 8 lists the wave height and period and also the wind speed for different storms. The next set of tests used the combined mooring method with the Nilspin EM cable and snubber. The mooring tension increases as the wind speed increases, as shown in Figure 8. Comparing a 10-year storm with a 100-year storm, the maximum mooring tension in the Nilspin EM cable increases by about (2.06 – 1.78)/1.78 = 15.7%. In contrast, the maximum mooring tension of the snubber increases by (2.56 – 2.33)/2.33 = 9.9%.
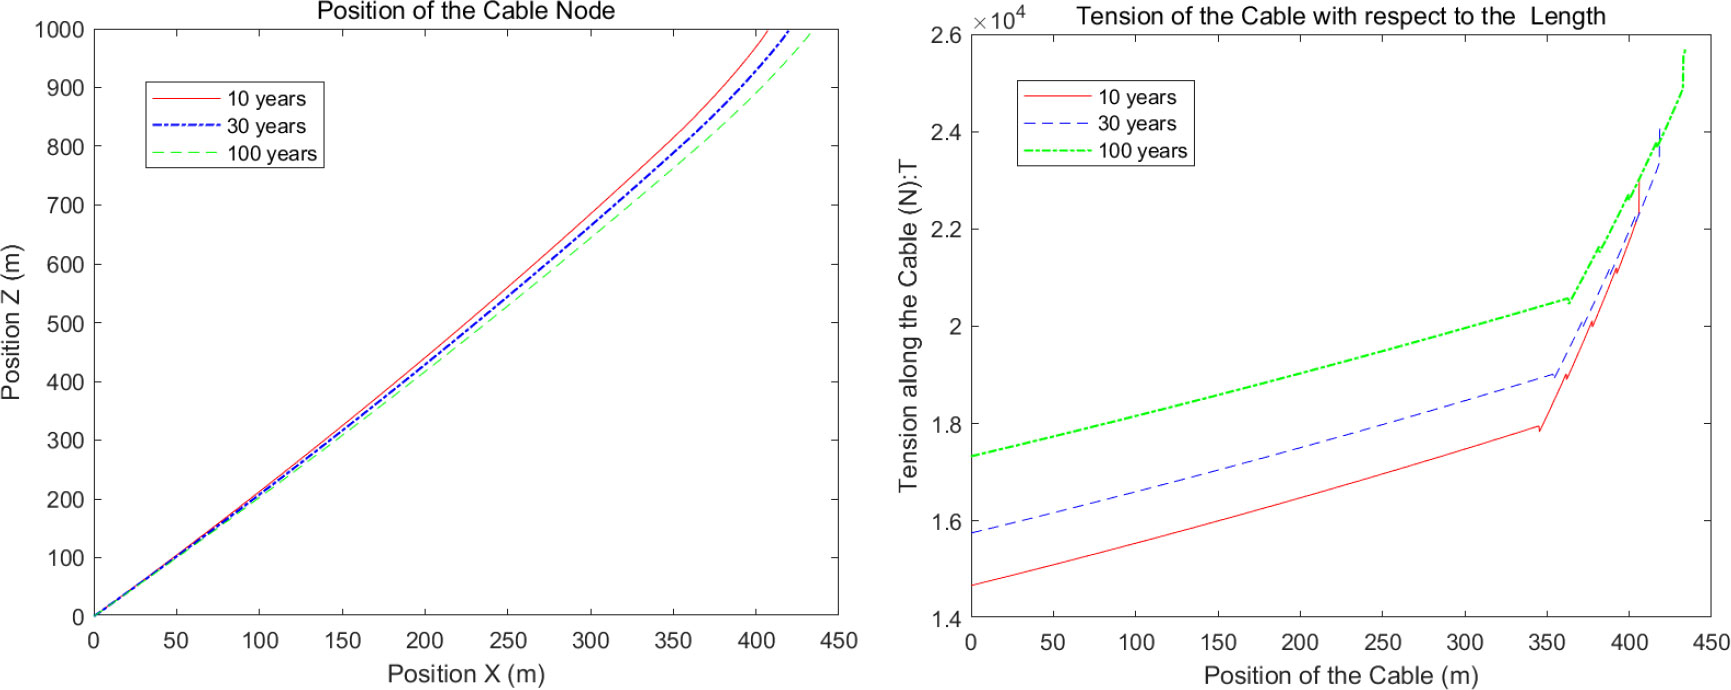
Figure8 Shape of the mooring line and mooring tension for a Nilspin EM cable with the snubber up for different storms.
A steady-state analysis can study only the influence of wind and current on the mooring system, as these two kinds of external load are continuous rather than dynamic. However, the external load for waves is periodic. Thus, a dynamic analysis of the mooring system is very important for selecting the best configuration of the mooring segments.
Regular waves can be simplified as sine waves. The parameters of the waveform include the height and period. The acceleration and velocity of water particles in a wave vary with time. Thus, there are dynamic changes in the tension and position of the mooring system. The purpose of the snubber is just to absorb this dynamic load. Therefore, this section studies the dynamic characteristics of mooring tension. The characteristic parameters of the external load are a wind speed of 30.1 m/s, a wave height of 14.0 m, and a wave period of 16.6 s. The simulations are carried out with the assumption that the system is deployed with a depth of 1000 m. The mooring-line configuration is shown in Table 5.
Figure 9 shows that the tension at the buoy is basically the same as that at the NSIF. The maximum tension at the buoy is 3.02 tons, and the maximum tension in the EM cable is 2.22 tons. Each snubber acts as a buffer by absorbing some of the mooring tension from the buoy.
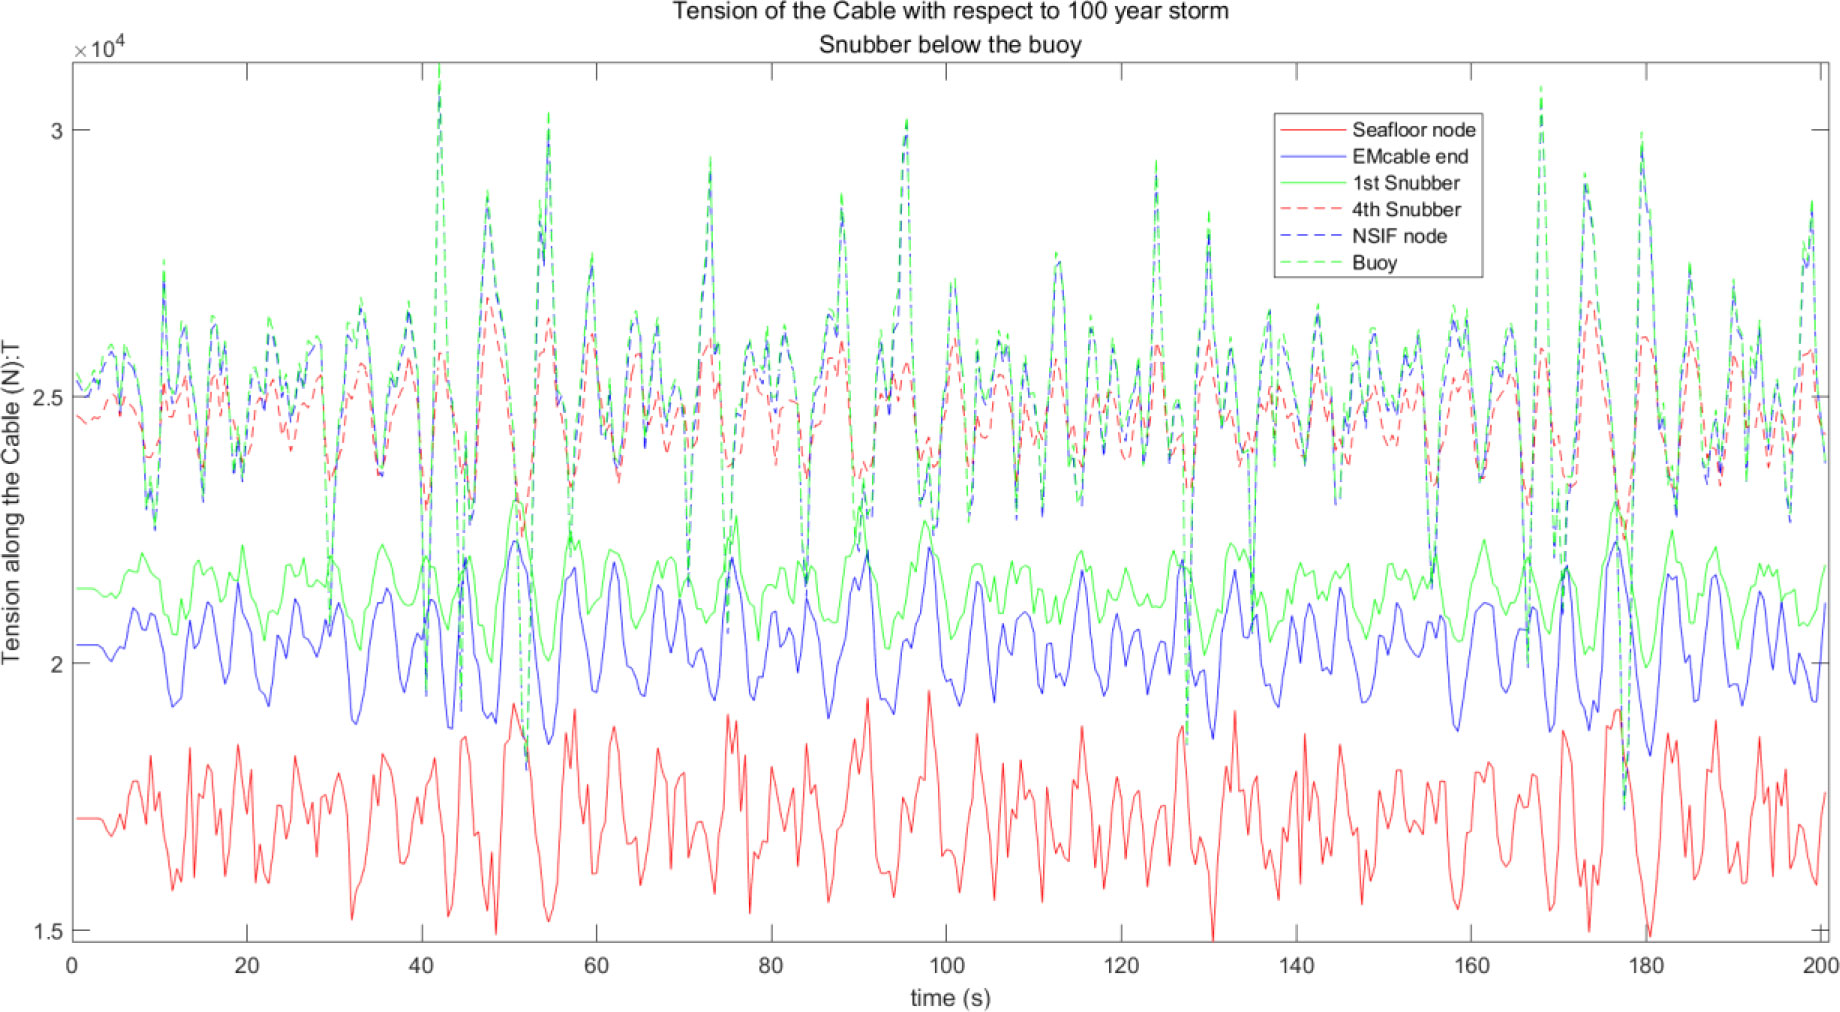
Figure 9 Dynamic tension for various components for a Nilspin cable with the snubber up.
For the dynamic tension load, Table 9 gives the mean, maximum, and standard deviation of the mooring tension for each main component with the snubber up or down. The table also shows an approximate linear relation between the three tensions.
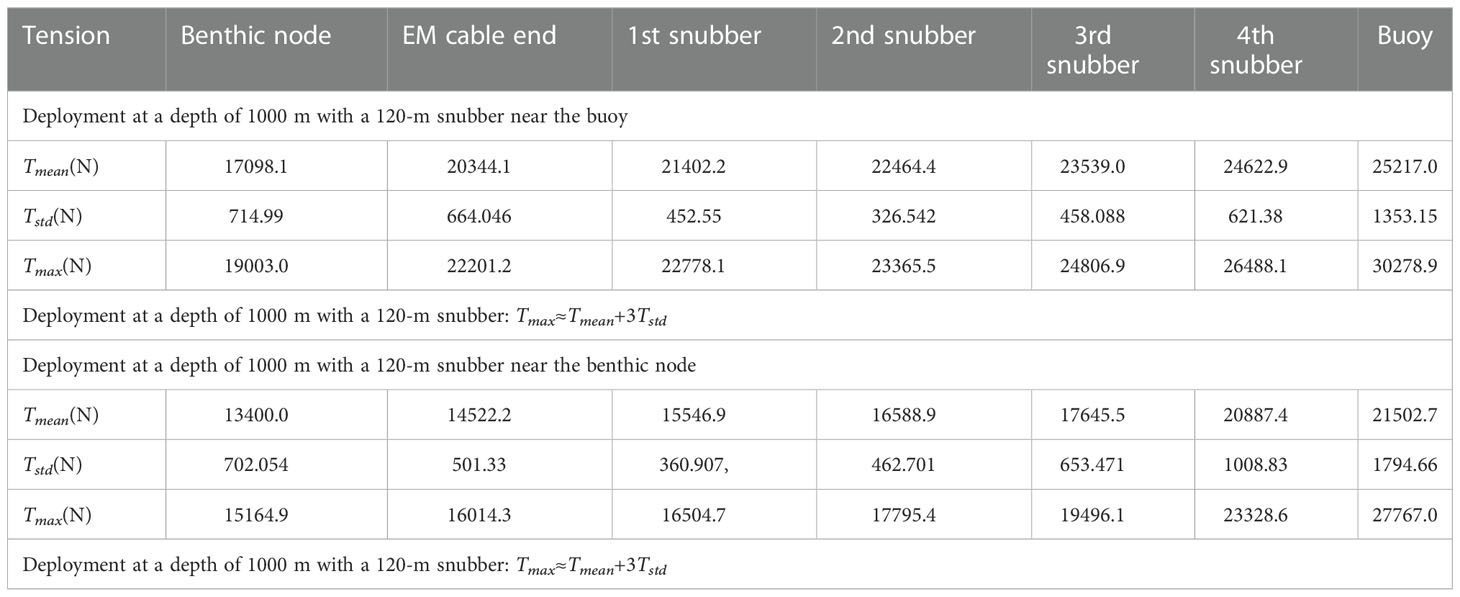
Table 9 Tension from the dynamic analysis for the snubber in different positions.
When there are waves, the dynamic load varies over time. The maximum dynamic load determines the maximum bearing capacity required by the Nilspin EM cable. However, changing the position of the snubbers in the mooring system changes the maximum tension in the EM cable, as found by the steady-state analysis. Therefore, in this section, we use the mooring-line configuration of Table 5 except that the snubbers are near the benthic node. The other parameters are the same as those in Section 4.1.
Figure 10 shows that in this mooring-line configuration, the maximum load on the buoy is 2.77 tons and the maximum load on the Nilspin EM cable is 1.57 tons. The expected load on the Nilspin EM cable is basically the same as that on the buoy. The load on the Nilspin EM cable is much larger than that in Section 4.1. The snubber can absorb the tension, but it reduces the tension load only on the benthic node. The impact load on the buoy is directly transmitted to the Nilspin EM cable. The snubber does not absorb the dynamic tension from the buoy, because the Nilspin EM cable is directly connected to the buoy whereas the snubber is near the seafloor. It is not between the buoy and the EM cable. This dynamic analysis again indicates that each snubber absorbs some of the tension load. The tension in the EM cable can be significantly reduced if the snubber is near the buoy.
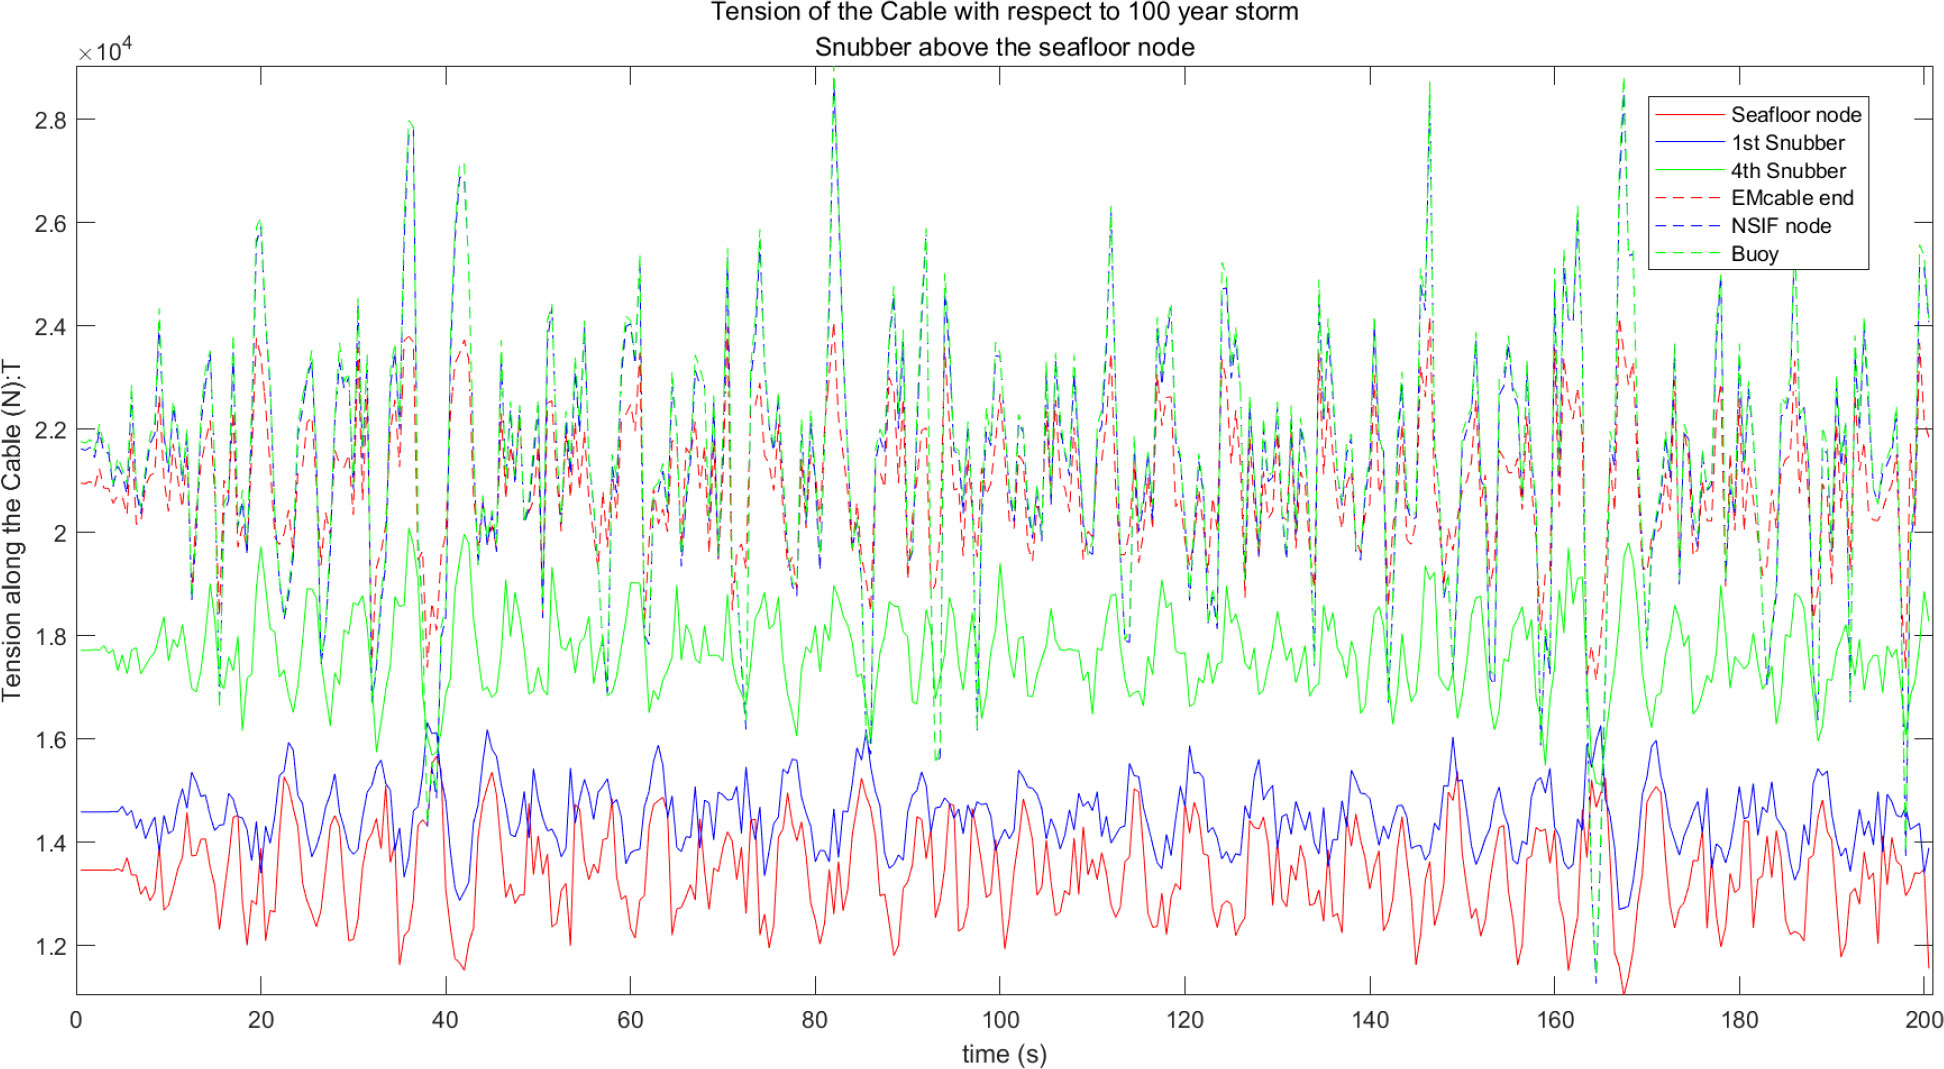
Figure 10 Dynamic tension for various components for a Nilspin cable with the snubber down.
The function of the snubber is described above. In this section, we compare mooring-line configurations with different lengths of snubber: 40, 120, 240, or 360 m. The basic mooring-line configuration is given in Table 5. We also analyze a mooring-line configuration with Nilspin EM cable of length 1200 m, but without a snubber, as the snubber in Table 5 is replaced by the Nilspin EM cable. The external load is for a 100-year storm.
The shape of the mooring line is shown in Figure 11, and the mooring tension is plotted in Figure 12. As the snubber becomes longer, the slope of the mooring line becomes less steep and the mooring tension in the Nilspin EM cable falls and becomes smoother. Table 10 gives the mean, maximum, and standard deviation of the tension for the main components for different lengths of snubber. The table also gives approximate linear relations between the three tensions.
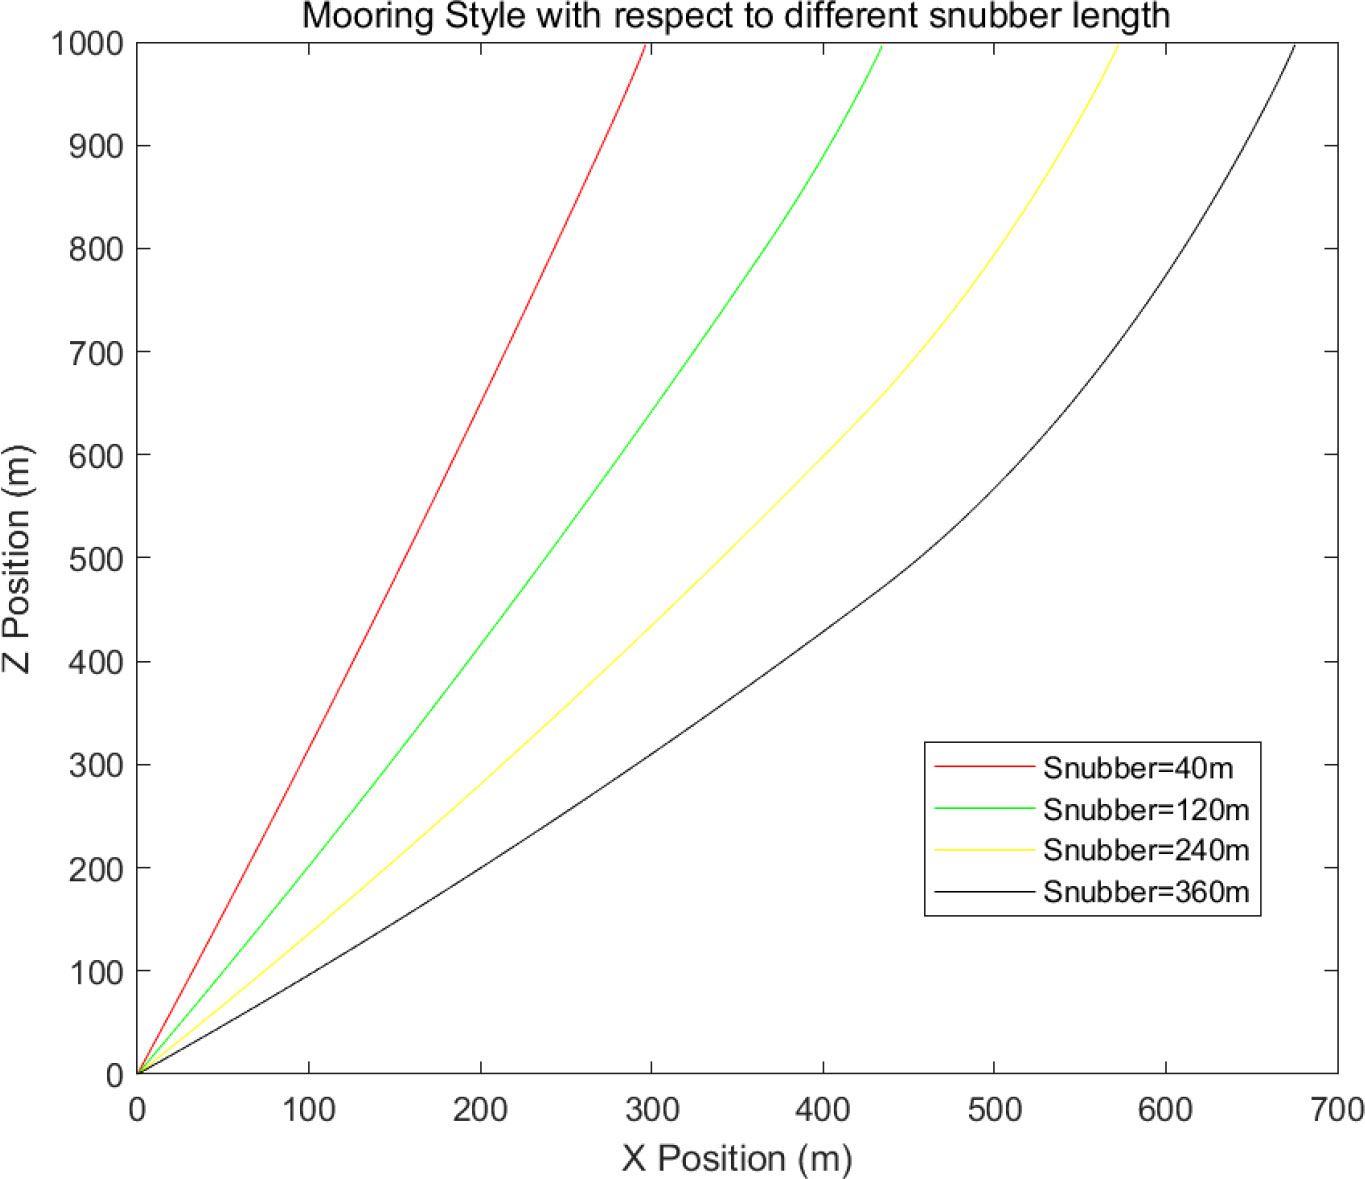
Figure 11 Shape of the mooring line for different lengths of snubber for a Nilspin cable with the snubber up.
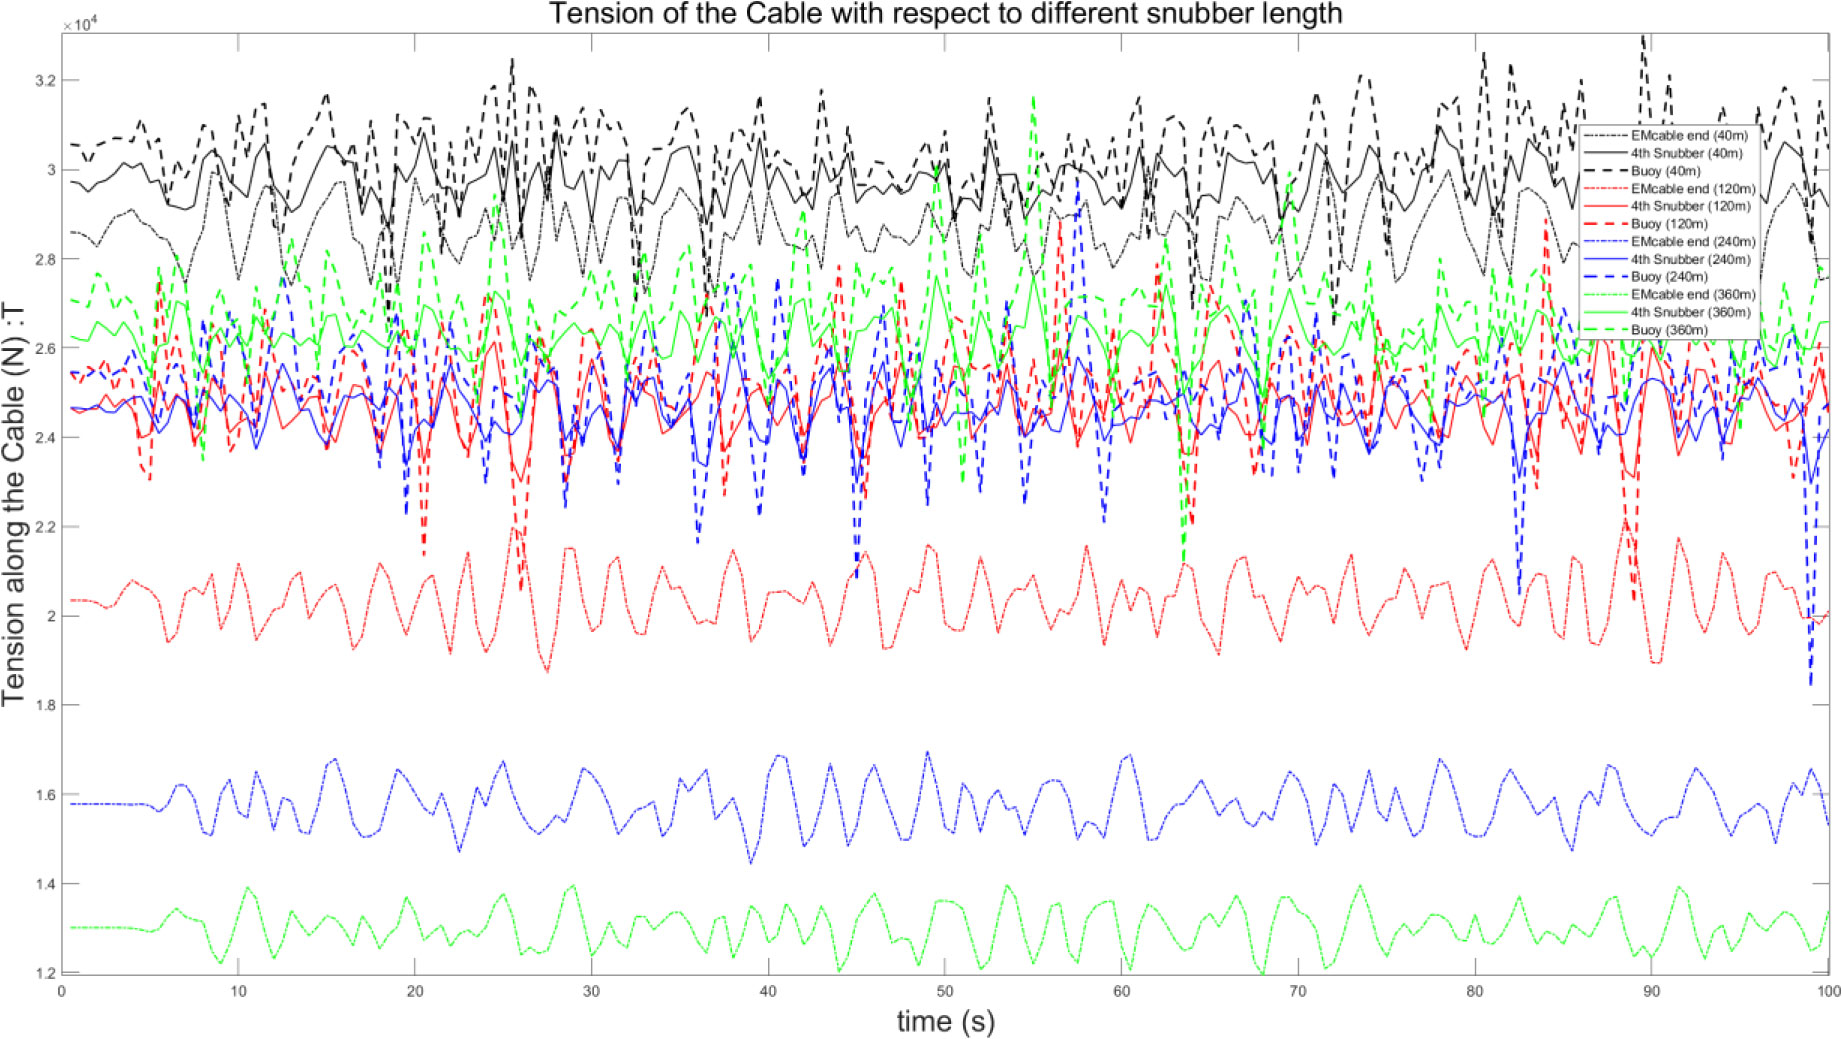
Figure 12 Dynamic tension for various components for different lengths of snubber for a Nilspin cable with the snubber up.
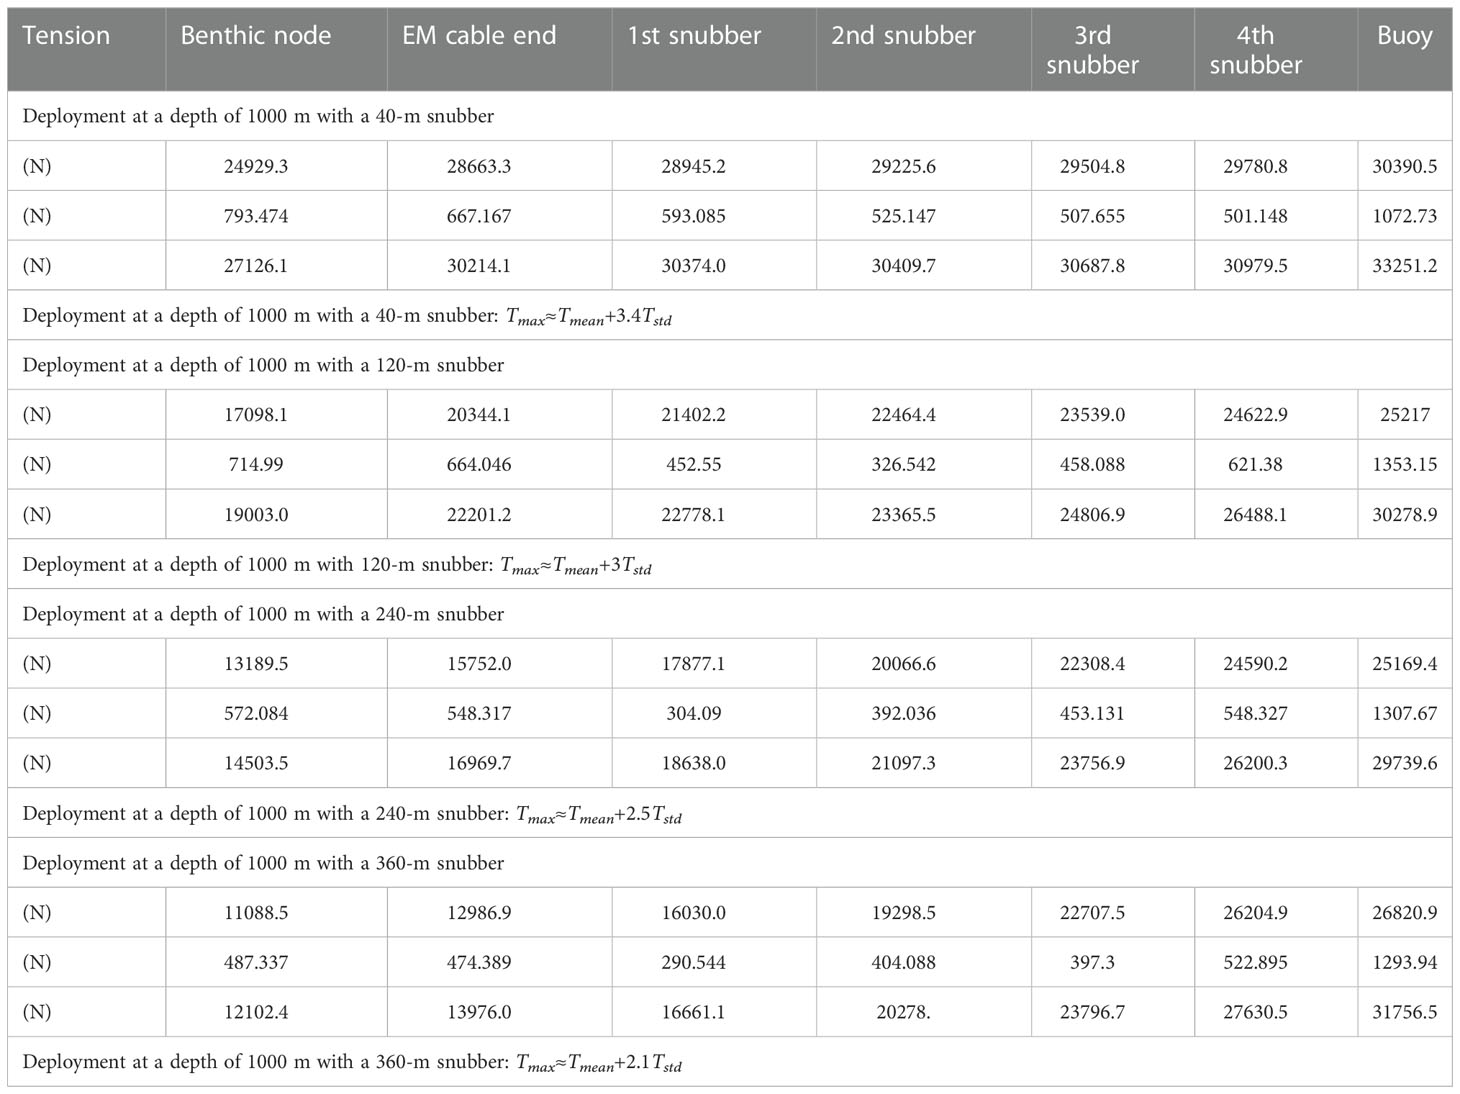
Table 10 Tension from the dynamic analysis for different lengths of snubber.
With an increase of the length of the snubber, the difference between the mean tension and the maximum tension becomes smaller. This confirms the results in Figure 4, which indicates that the mooring tension is basically constant for a nylon EM mooring cable. A snubber with a length of 30 m has a low elastic stiffness. Moreover, it is more difficult to install and recover the mooring system if the snubber is too long.
The approximate relations among the mean, maximum, and standard deviation of the tension are important in our choice of the Nilspin EM cable. The maximum operating tension of the cable should be greater than the maximum obtained in the dynamic analysis. This maximum usually lasts for a short time and is related to the wave period. The normal working tension is roughly the mean obtained by the dynamic analysis. The standard deviation of the tension verifies the results of vibration tests of the EM cable carried out by the manufacturer.
We simulated the steady state of the mooring system for the working depth of water. The snubber is an elastic buffer in the mooring module. It reduces the tension in the mooring cable from the buoy. It can be seen from Figure 4 that the snubber does not have a particularly large impact on the mooring force in the steady state. We had to decide whether to utilize Nilspin cable or nylon cable in the main mooring module. We chose Nilspin cable because nylon cable undergoes too much elastic deformation so that it is not suitable as an EM tether. Moreover, the nylon EM cable is difficult to manufacture.
We next analyzed the dynamic properties of a mooring tether made from Nilspin cable with a load due to ocean winds, waves, and currents. We had to decide whether the snubber should be near the sea surface buoy or near the benthic node, based on minimizing the tension in the snubber. Lastly, we had to consider the length of the snubber. Theoretically, the longer the snubber is, the better. However, the diameter of the snubber is relatively large. If the snubber is too long, it would be difficult to deploy the buoy and mooring system. Based on all these factors, we chose a suitable snubber and a suitable configuration, which can satisfy the dynamic mooring load.
In this section, we simulate and analyze the dynamic properties during deployment. We usually adopt the method “buoy first, benthic node last” (Figure 13). Thus, we deploy the buoy with a frame and then the mooring line, and lastly, we deploy the benthic node from a ship into the sea. The difference between gravity and buoyancy is large, because the buoy is moored with a gravity anchor not a gripping anchor. Thus, the wet weight of the benthic node is 3 tons. When the benthic node is released from the A frame, its downward acceleration is due to the difference between gravity and buoyancy. It accelerates until the wet weight of the benthic node, the tension in the mooring cable, and the drag force of the benthic node become balanced. Since the shape of the mooring line varies continuously until the benthic reaches the seafloor, such a balance may not be achieved. However, as the downward speed of the benthic node increases, the drag force also increases, so the maximum mooring tension may not be reached before the benthic node reaches the seafloor. This depends on the deployment depth, so we have to simulate these conditions to find the maximum mooring tension. Since the shape of the mooring line changes as the benthic node descends, the buoy will move rapidly on the sea surface toward the benthic node. Thus, we have to find the threshold mooring tension at which the buoyancy is insufficient and the buoy will sink into the water. Note that the mooring tension is not vertical, so that the buoy is inclined backward as it moves across the water surface. The deck of the buoy may be submerged in water, which may reduce its stability.
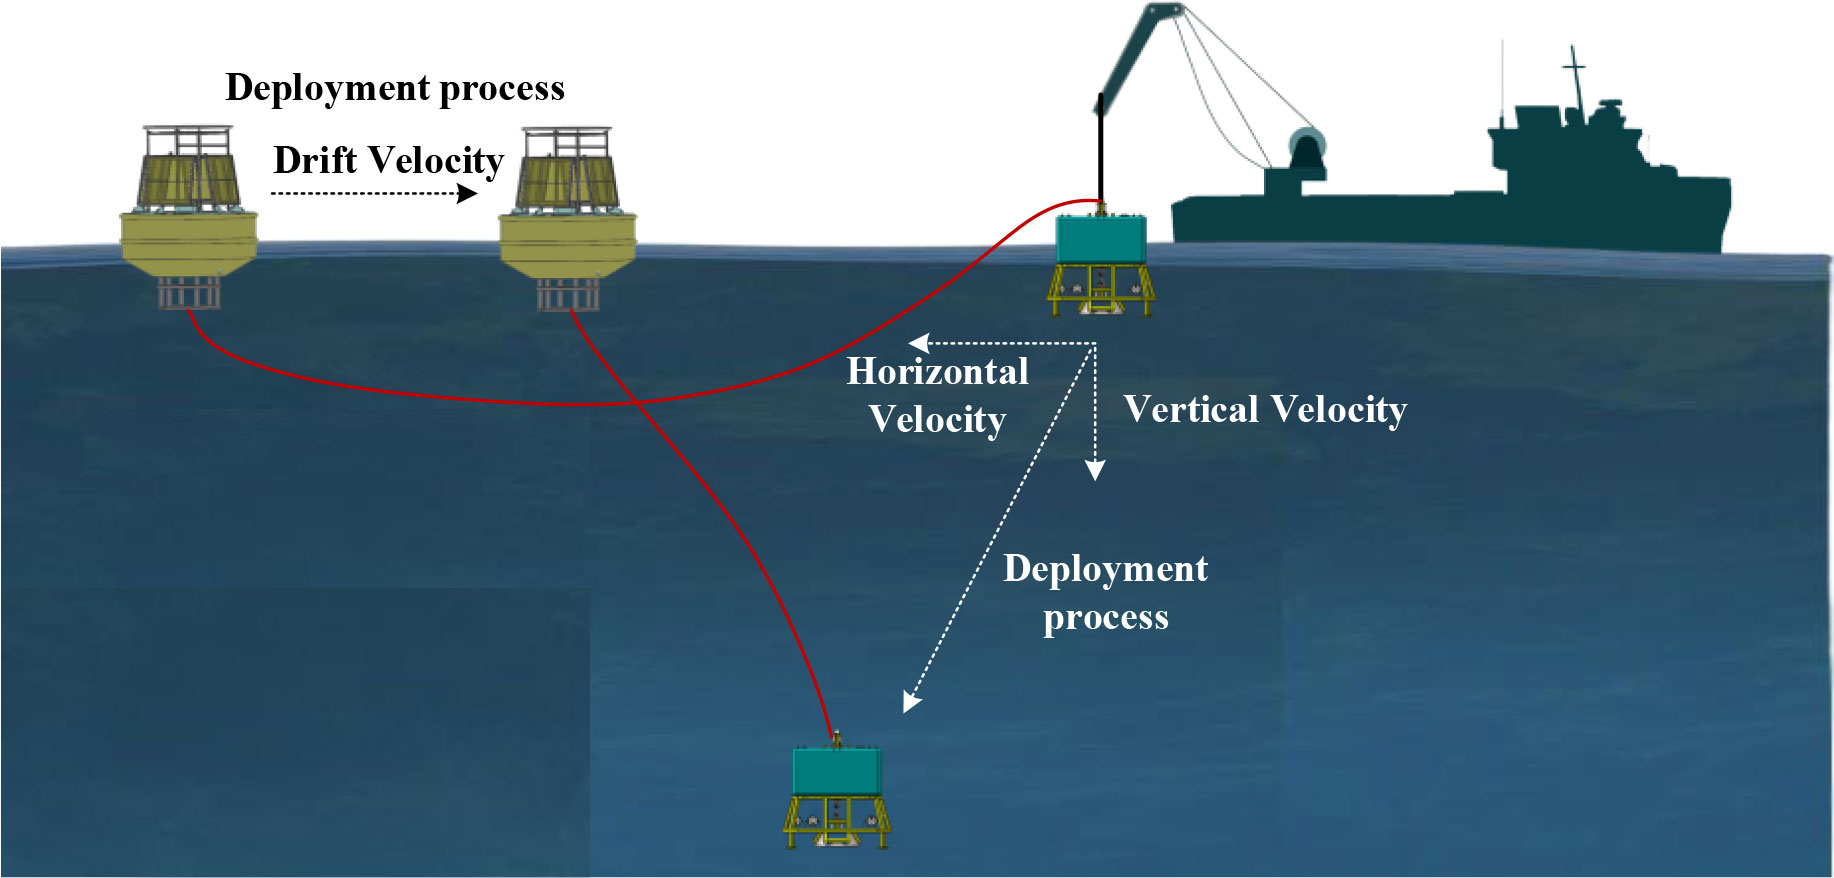
Figure 13 Motion of the buoy, mooring line, and benthic node during system launch.
When the benthic node is released from the scientific research ship, it is assumed that the buoy and the ship are stationary. When it is first dropped, the benthic node has its maximum acceleration but zero velocity. At this moment, the distance between the buoy and the benthic node is a maximum. The velocity of the benthic node in the horizontal and vertical directions increases due to its acceleration. However, the buoy moves toward the benthic node with horizontal velocity only, since the mooring tension along the vertical direction is absorbed by the reserve buoyancy of the buoy. In this chapter, we analyze the change in the shape of the mooring line and the velocities of the buoy and benthic node.
The shape of the mooring line during deployment is shown in Figure 14, and the velocities of the buoy and benthic node are plotted in Figure 15. Figure 15 indicates that it takes 3 min from being released for the benthic node to reach the seafloor. The maximum mooring force is 32.7 kN, which occurs at 101 s. When the benthic node reaches the seafloor, the mooring tension gradually falls. Finally, the mooring tension achieves a steady state due to the action of the ocean current, if there are no winds or waves. As the benthic node descends, the buoy moves 331 m in the horizontal direction and the benthic node 218 m. The maximum speed of the benthic node in the vertical direction is 9.26 m/s and the maximum speed in the horizontal direction is 2.05 m/s, which occurs about 10 s after deployment. The maximum speed of the buoy in the horizontal direction is 1.68 m/s, which occurs after about 146 s.
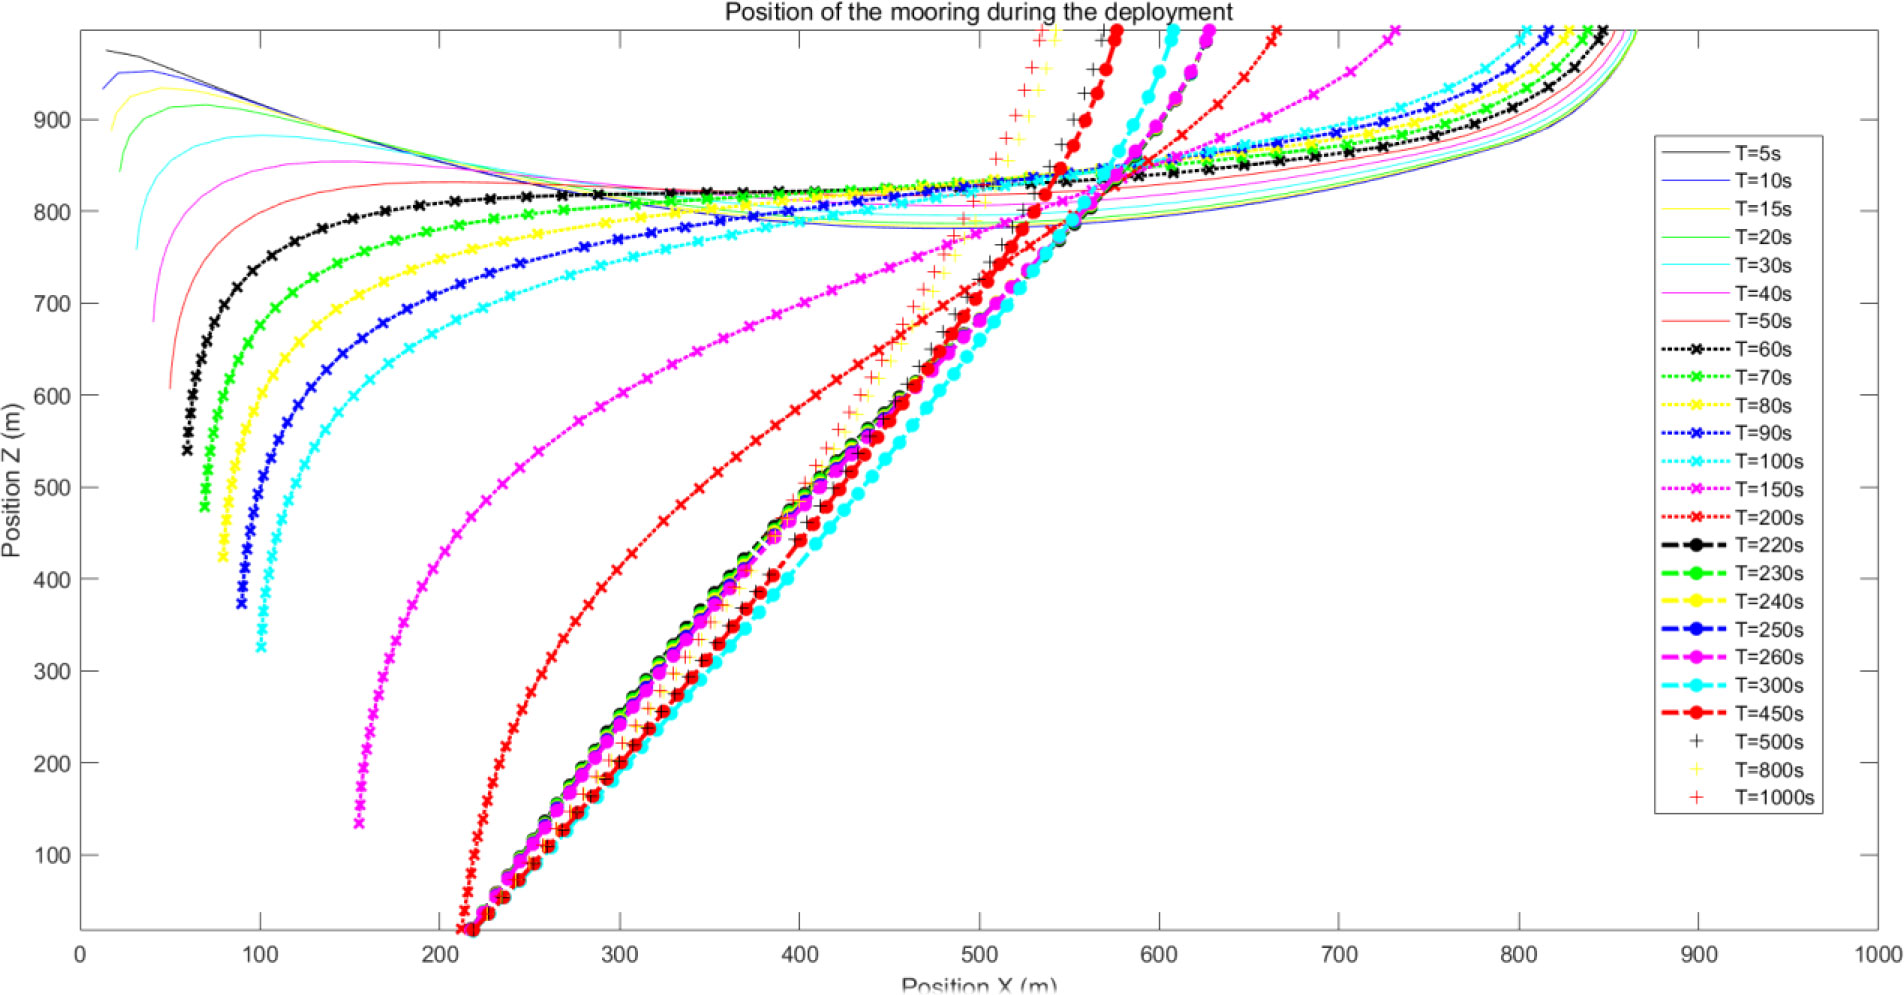
Figure 14 Change in the shape of the mooring line during deployment.
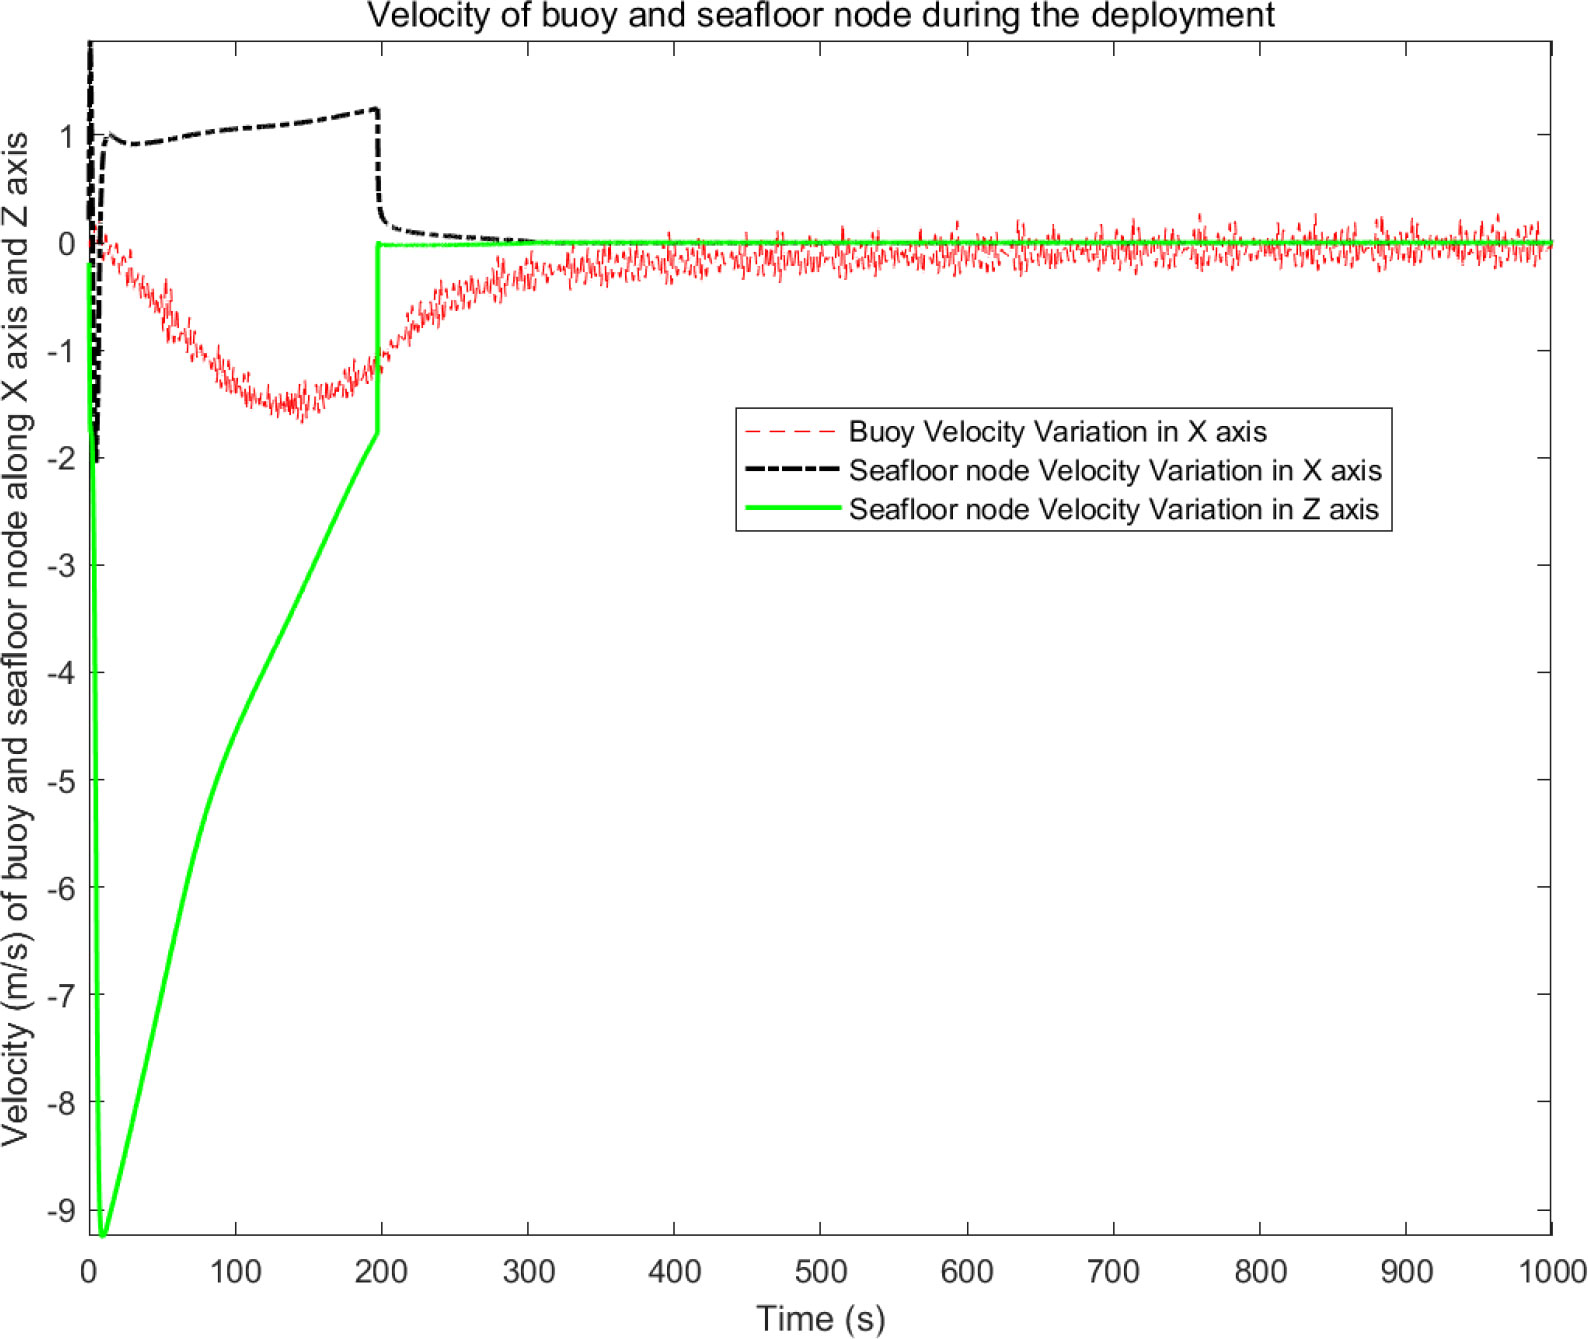
Figure 15 Velocities of the buoy and benthic node during system deployment.
This simulation suggests that if the buoy does not have enough buoyancy to balance the vertical component of the mooring tension, we will have to use an auxiliary boat to hold the buoy up and prevent it from sinking into the water.
In this paper, we optimized the mooring EM cable for the future MBOSBC. Nylon rope is a good choice for a traditional buoy due to its low wet weight and high extension ratio (about 20%). The expansion can absorb the load from the surface buoy, which reduces the maximum mooring tension. However, it is not a good choice for an EM cable, since the extension ratio of the electric core and optical fiber core (0.5%) does not match that of the nylon material. Moreover, the manufacturing process for a nylon EM cable is too complex and difficult, so we adopted the Nilspin EM cable for mooring the buoy.
Then, we analyzed the combined mooring method with Nilspin EM cable and a snubber. The snubber has a low elastic stiffness, so that it absorbs the dynamic load generated by waves. This combination reduces the stiffness of the mooring line and improves its flexibility. The length of a single snubber is about 30 m. Considering the difficulty of system deployment, we selected four segments for the mooring line.
An analysis of the mooring tension for different mooring-line configurations and external environmental loads showed that winds and ocean currents are the main factors affecting the steady-state mooring tension, which is important in designing an EM cable. The influence of ocean waves on the mooring system was assessed with a dynamic analysis. The periodic wave motion caused the buoy to move, putting a load on the mooring line. In the combined mooring method, the snubber absorbed some of the dynamic load. Once the load had dissipated, the stored tension due to elastic deformation was released and the snubber returned to its original state. The load due to wave motion was isolated by the snubber, which reduced the mooring tension in the Nilspin EM cable so that it remained within a relatively stable range. This tension is the working load on the Nilspin EM cable, and the snubber compensates for the poor flexibility of a Nilspin EM cable. From the dynamic analysis, we inferred a relation among the mean, standard deviation, and maximum of the tension. Based on this, we chose the design values and requirements for the EM cable, especially the duration of the maximum tension. This may serve as a good reference for the duration of the maximum tension in an EM cable.
We analyzed the dynamics of the buoy during system deployment as the benthic node sinks from the water surface to the seabed. If the benthic node is too heavy, it will have an excessive vertical velocity. The mooring tension is transmitted to the buoy, which moves rapidly toward the benthic node in the horizontal plane. If the reserve buoyancy of the buoy is insufficient, we will need to pull the buoy up with an auxiliary ship to prevent it from being pulled into the sea.
The raw data supporting the conclusions of this article will be made available by the authors, without undue reservation.
Conceptualization and Simulation, S.W Zhang and F.H Zhang writing-review and editing, S.W Zhang and C. Tian. Application, F.H Zhang and C. Tian. All authors contributed to the article and approved the submitted version.
This work is supported by the State Key Laboratory of Tropical Oceanography, South China Sea Institute of Oceanology, Chinese Academy of Sciences (Project No. LTO 2207), the Natural Science Foundation of China (Grant No. 51809255: Research on tracking strategy of ocean cold eddy-upwelling with autonomous underwater vehicles), the National Natural Science Foundation of China, and the National Key Research and China Strategic Priority Research Program of the Chinese Academy of Sciences (Grant No. XDA13030301).
The authors would like to thank the reviewers for their careful work.
The authors declare that the research was conducted in the absence of any commercial or financial relationships that could be construed as a potential conflict of interest.
All claims expressed in this article are solely those of the authors and do not necessarily represent those of their affiliated organizations, or those of the publisher, the editors and the reviewers. Any product that may be evaluated in this article, or claim that may be made by its manufacturer, is not guaranteed or endorsed by the publisher.
Chaffey M., Bird L., Erikson J., Graybeal J., Hamilton A., Headley K., et al. (2005). “MBARI’s buoy-based seafloor observatory design,” in Proceedings of IEEE OCEANS 2005, Washington, DC, USA (18-23 Sept), Proceedings of OCEANS 2005 MTS/IEEE - Project ENDEAVOR: Distributed Modeling for Advanced Marine Vehicle Performance Analysis, 4, 1975–1984.
Chaffey M., Mellinger E., Walter P. (2001). “Communications and power to the seafloor: MBARI’s ocean observing system mooring concept,” in Proceedings of MTS/IEEE oceans 2001, (Honolulu, HI, USA: An Ocean Odyssey), 2473–2481. doi: 10.1109/OCEANS.2001.968389
Clark A. M. (2010). CSnet’s offshore communications backbone in Cyprus. Touch Briefings Explor. Prod. 9 (1), 1–4. doi: 10.23919/OCEANS.2011.6107087
Clark A. M., Kocak D. M. (2011). “Installing undersea networks and ocean observatories: The CSnet offshore communications backbone (OCB),” in Proceedings of IEEE OCEANS 2011, Waikoloa, HI (19-22 Sept), OCEANS\"11 MTS/IEEE KONA - Highlights of renewable energy studies and research in the bureau of ocean energy management, regulation and enforcement, 1–9. doi: 10.23919/OCEANS.2011.6107087
Clark A. M., Kocak D. M., Martindale K., Woodroofe A. (2009). “Numerical modeling and hardware-in-the-loop simulation of undersea networks, ocean observatories and offshore communications backbones,” in Proceedings of MTS/IEEE oceans 2009 conference (Bremen, Germany, IEEE OCEANS 2009 Conference Europe: Biloxi, MS), 26–29. doi: 10.23919/OCEANS.2009.5422204
De Martino P., Guardato S., Tammaro U., Vassallo M., Iannaccone G. (2014). A first GPS measurement of vertical seafloor displacement in the campi flegrei caldera (Italy). J. Volcanol Geotherm Res. 276, 145–151. doi: 10.1016/j.jvolgeores.2014.03.003
Detrick R., Frye D., Collins J., Gobat J., Grosenbaugh M., Petit R., et al. (2000). DEOS moored buoy observatory design study (Arlington, VA: National Science Foundation/Ocean Sciences Division).
Favali P., Beranzoli L., D’anna G. (2006). A fleet of multi parameter observatories for geophysical and environmental monitoring at seafloor. Ann. Geophys. 49, 659–680. doi: 10.4401/ag-3126
Frye D., Hamilton A., Paul W., Chaffey M., et al. (2004). Deepwater mooring designs for ocean observatory science. Mar. Technol. Soc J. 38 (2), 7–20. doi: 10.4031/002533204787522857
Georgiou G., Clark A. M., Zodiatis G., Hayes D., Glekas D. (2010). “Design of a prototype tsunami warning and early response system for Cyprus – TWERC,” in IEEE OCEANS, vol. 24–27. (Sydney), 1–5.
Gobat J. I., Grosenbaugh M. A. (2000). WHOI cable v2.0: Time domain numerical simulation of moored and towed oceanographic systems. Woods Hole Oceanographic Inst.,Woods Hole MA Tech Rep. WHOI 2000-08, 2000.
Grosenbaugh M. A., Paul W., Frye D., Farr N. (2006). Development of synthetic fiber-reinforced electro-optical-mechanical cables for use with moored buoy observatories. IEEE J. Oceanic Eng 31 (3), 574–583. doi: 10.1109/JOE.2005.850937
Hamilton A., Chaffey M. (2005). “Use of an electro-optical-mechanical mooring cable for oceanographic buoys: Modeling and validation,” in Proceedings of the 24th International Conference on Offshore Mechanics and Arctic Engineering, Halkidiki, Greece (12-17, June), 24th International Conference on Offshore Mechanics and Arctic Engineering: Volume 1, 1–7.
Hamilton J. A., Chaffey M., Mellinger E., Erickson J., McBride L. (2003). “Dynamic modeling and actual performance of the MOOS test mooring,” in Proceedings of OCEANS(San Diego, CA), 2574–2581.
Han S. M., Grosenbaugh M. A. (2006). On the design of single-point cable-linked moorings for ocean observatories. IEEE J. Oceanic Eng 31 (3), 585–597. doi: 10.1109/JOE.2005.850917
Iannaccone G., Guardato S., Vassallo M., Elia L., Beranzoli L. (2009). A new multidisciplinary marine monitoring system for the surveillance of volcanic and seismic areas. Seismol Res. Lett. 80 (2), 203–213. doi: 10.1785/gssrl.80.2.203
Makris J., Papoulia J., Tsambas A. (2014). A real-time seismic and tsunami network in the kyparissiakos gulf, Greece. Bollettino di Geofisica Teorica ed Applicata 55 (2), 561–587. doi: 10.4430/bgta0120
Paul W., Bentley D., Chaffey M., Frye. D.. (2003). “Electrical and electro-optical mooring links for buoy based ocean observatories,” in Proceedings of the 2003 International Conference on Physics and Control - Volume 3." Saint Petersburg, Russia (20-22 Aug. ), International Conference on Physics & Control IEEE Computer Society, 201–206. doi: 10.1109/SSC.2003.1224142
Smith L. M., Barth J. A., Kelley D. S., Plueddemann A., Rodero I., Ulses G. A., et al. (2018). The ocean observatories initiative. Oceanography 31 (1), 16–35. doi: 10.5670/oceanog.2018.105
Trowbridge J., Weller R., Kelley D., Dever E., Plueddemann A., Barth J. A., et al. (2019). The ocean observatories initiative. Front. Mar. Sci. 6, 1–23. doi: 10.3389/fmars.2019.00074
Yu J., Zhang S., Yang W., Xin Y., Gao H. (2020). Design and application of buoy single point mooring system with electro-optical-mechanical (EOM) cable. J. Mar. Sci. Eng 8 (672), 1–25. doi: 10.3390/jmse8090672
Keywords: ocean buoy mooring, EOM cable, single point mooring, oceanographic moorings, snubber rubber cable
Citation: Zhang SW, Tian C and Zhou FH (2023) Design and optimization of buoy mooring with single-point cable for seafloor observatories. Front. Mar. Sci. 9:1048048. doi: 10.3389/fmars.2022.1048048
Received: 19 September 2022; Accepted: 15 December 2022;
Published: 04 January 2023.
Edited by:
Dongxiao Zhang, Cooperative Institute for Climate, Ocean and Ecosystem Studies/University of Washington and NOAA/Pacific Marine Environmental Laboratory, United StatesReviewed by:
Shaoqiong Yang, Tianjin University, ChinaCopyright © 2023 Zhang, Tian and Zhou. This is an open-access article distributed under the terms of the Creative Commons Attribution License (CC BY). The use, distribution or reproduction in other forums is permitted, provided the original author(s) and the copyright owner(s) are credited and that the original publication in this journal is cited, in accordance with accepted academic practice. No use, distribution or reproduction is permitted which does not comply with these terms.
*Correspondence: Shaowei Zhang, enN3c2lhQDEyNi5jb20=; emhhbmdzaGFvd2VpQGlkc3NlLmFjLmNu; Chuan Tian, dGlhbmNAaWRzc2UuYWMuY24=; Fenghua Zhou, emhvdWZoQHNjc2lvLmFjLmNu
Disclaimer: All claims expressed in this article are solely those of the authors and do not necessarily represent those of their affiliated organizations, or those of the publisher, the editors and the reviewers. Any product that may be evaluated in this article or claim that may be made by its manufacturer is not guaranteed or endorsed by the publisher.
Research integrity at Frontiers
Learn more about the work of our research integrity team to safeguard the quality of each article we publish.