
95% of researchers rate our articles as excellent or good
Learn more about the work of our research integrity team to safeguard the quality of each article we publish.
Find out more
ORIGINAL RESEARCH article
Front. Mar. Sci. , 25 November 2022
Sec. Marine Biogeochemistry
Volume 9 - 2022 | https://doi.org/10.3389/fmars.2022.1047126
This article is part of the Research Topic Biogeochemical, Ecological and Biophysical Dynamics in the Kuroshio, Oyashio and Their Extension Regions View all 17 articles
 Chunqian Li1,2†
 Shibin Zhao3,4,5†Chenglun Zhang2
 Meng Li1
 Jinjia Guo1
 Natasha T. Dimova6Tong Yang1Wen Liu3,4,5
 Guangquan Chen7Huaming Yu8
 Bochao Xu3,4*
Radon is an excellent natural tracer for studying various geophysical processes. In the past centuries, radon isotopes measurement approaches for marine research have been fully developed but still suffer limitations. Here we present the setup and validation of an improved continuous online measurement system (PIC-ORn) to measure dissolved radon in the surface ocean and other water bodies. We demonstrated that the PIC measurement efficiency is ~2 times higher than a RAD7 and is less affected by relative humidity and produces reliable results. Laboratorial measurements indicated that the new PIC-ORn system responded timely to the change of radon activities in water. The new system was successfully deployed during a cruise to the northwest Pacific Ocean in June 2021. Despite low radon-in-water activities, the results obtained by the new PIC-ORn system matched the traditional measurement systems within the estimated uncertainties. The PIC-ORn detector takes advantage of higher efficiency, lower cost, and power consumption, and is less affected by air moisture. The new system does not rely on drying units, further reducing on-site supervision, which would benefit the researches in submarine groundwater advection and diffusion and ocean-atmosphere gas exchange.
Natural radon isotopes can be used as tracers of various chemical and physical processes in the environment. Because the half-lives of 219Rn (t1/2 = 3.96 s) and 220Rn (t1/2 = 55.6 s) are so short, it is difficult to measure them precisely. However, 222Rn (t1/2 = 3.83 d) is often measured and has been widely employed for studies such as upwelling and downwelling (Sarmiento et al., 1976), air-sea interactions (Broecker and Kaufman, 1970; Broecker and Peng, 1971), diffusion from sediments (Corbett et al., 1998), earthquake prediction (Kuo et al., 2010; Chen et al., 2018a) and submarine groundwater discharge (SGD) (Null et al., 2012; Prakash et al., 2018; Santos et al., 2021). Simultaneous measurements of radon and other natural gases (such as CO2 and CH4) were used recently to delineate the significance of SGD and thus better understand carbon and nutrient biogeochemical transformations (Santos et al., 2012; Schubert and Paschke, 2015; Chen et al., 2018b; Chen et al., 2022).
Radon isotopes measurement approaches for marine research have been fully developed in the past centuries. For grab samples, the radon in water is traditionally trapped via a radon extraction line system and transferred to Lucas alpha scintillation cells followed by measurement by a counting system after being sealed for 3 hours to allow the 222Rn progenies (218Po, 214Po) to reach radioactive equilibrium (Stinger and Burnett, 2004). This method benefits by having maximum measurement efficiencies approaching 300% which was widely used in multiple international research programs including GEOSECS, TTO and GEOTRACES (Broecker et al., 1967; Key et al., 1979; Xu et al., 2022). This approach, however, is time consuming and may present numerous logistical difficulties. Most recently, continuous measurement of radon was achieved by combining a commercial radon-in-air analyzer RAD7 (Durridge, Inc., USA) with a water/gas exchanger (RAD AQUA) (Burnett and Dulaiova, 2003). In this approach, radon is continuously degassed from a water stream and circulated in a closed air loop with a RAD7 counting chamber. After reaching an air-water equilibrium, such a system allows continuous on-site radon monitoring in surface waters (Burnett et al., 2001; Wang et al., 2019). Another approach uses a RAD7 connected to a small (40 or 250 mL) glass bottle (RAD-H2O system) that provides a portable on-site method for measuring radon samples with relatively high activities, such as groundwater or some river waters (Lee and Kim, 2006). Note that the passivated implanted planar silicon alpha detector that used in the RAD7 is sensitive to humidity in its chamber. An extra drying unit is always need to remove moisture from the air stream to meet the requirement that the relative humidity in the RAD7 chamber remains below 10%, typically less than 6% (Burnett et al., 2001; Xu et al., 2010). Although a humidity correction for the RAD7 could be automatically made by the Capture softer provided by Durridge, the data precision will be partly degraded compared with readings taken in dry conditions.
A technological advance for radon measurements that is independent of some of the above limitations suggests using a pulsed ionization chamber (PIC) (Curtiss and Davis, 1943; Seo and Kim, 2021; Zhao et al., 2022). The PIC sensor measures charge pluses created during air ionization by α-particles generated by radon. Compared to other radon detectors, such as semiconductors and scintillators, almost all generated α-particles can be deposited in the ionization chamber and counted, so the absolute detection efficiency is much higher than other conventional methods (Gavrilyuk et al., 2015). Liu et al. (2022) reported that by changing the relative humidity from<5% to 65%, the counting efficiency of the PIC sensor is not significantly affected by air moisture. A drying unit is not a necessary part while utilizing a PIC sensor, which not only helps to reduce the total volume of the system, but offers a possibility for a long-term radon field monitoring with less on-site supervision.
We present here a miniaturized, inexpensive active PIC Oceanic Rn monitor (“PIC-ORn”) with high efficiency and sensitivity, which provides an alternative method for the surface seawater survey of radon. The new PIC-ORn system requires minimal operator intervention and produces high-resolution readings, thereby overcoming some of the disadvantages of the currently available instrumentation.
The PIC-ORn onboard measurement system consists of two main components: (i) a commercially available water-gas equilibrator (RAD AQUA, Durridge, In., USA) for radon-gas extraction from the pumped seawater connected via closed air loop to (ii) a PIC-ORn detector (described in detail in section 2.2) for radon-in-air activity measurements (Figure 1). The RAD AQUA water-gas equilibrator (also called exchanger) has been widely used in conjunction with RAD7 radon analyzers for on-site radon surveys and time-series observations (Burnett and Kim, 2001; Dulaiova et al., 2005; Chanyotha et al., 2018). Other gas extraction modules, such as membrane contactors, can also be used for this purpose (Schubert et al., 2008; Petra and Aleš, 2019). During operation, the equilibrated radon-in-air is circulated through an air filter (with 0.45 μm pore size) to prevent dust particles and radon Po-daughters from entering the measurement system. Then the air is directed to the measurement system via an internal air pump and is returned to the RAD AQUA exchanger. A one-way valve in the air stream just upstream of the RAD AQUA is used to prevent unanticipated water backup causing damage to the detector (Figure 1). The measured radon-in-air activities can easily convert into to corresponding radon-in-water activity through a specific radon partitioning coefficient which is dependent upon the temperature and salinity of the water (Schubert et al., 2012). The temperature and salinity are parameters that are routinely measured during oceanic surveys.
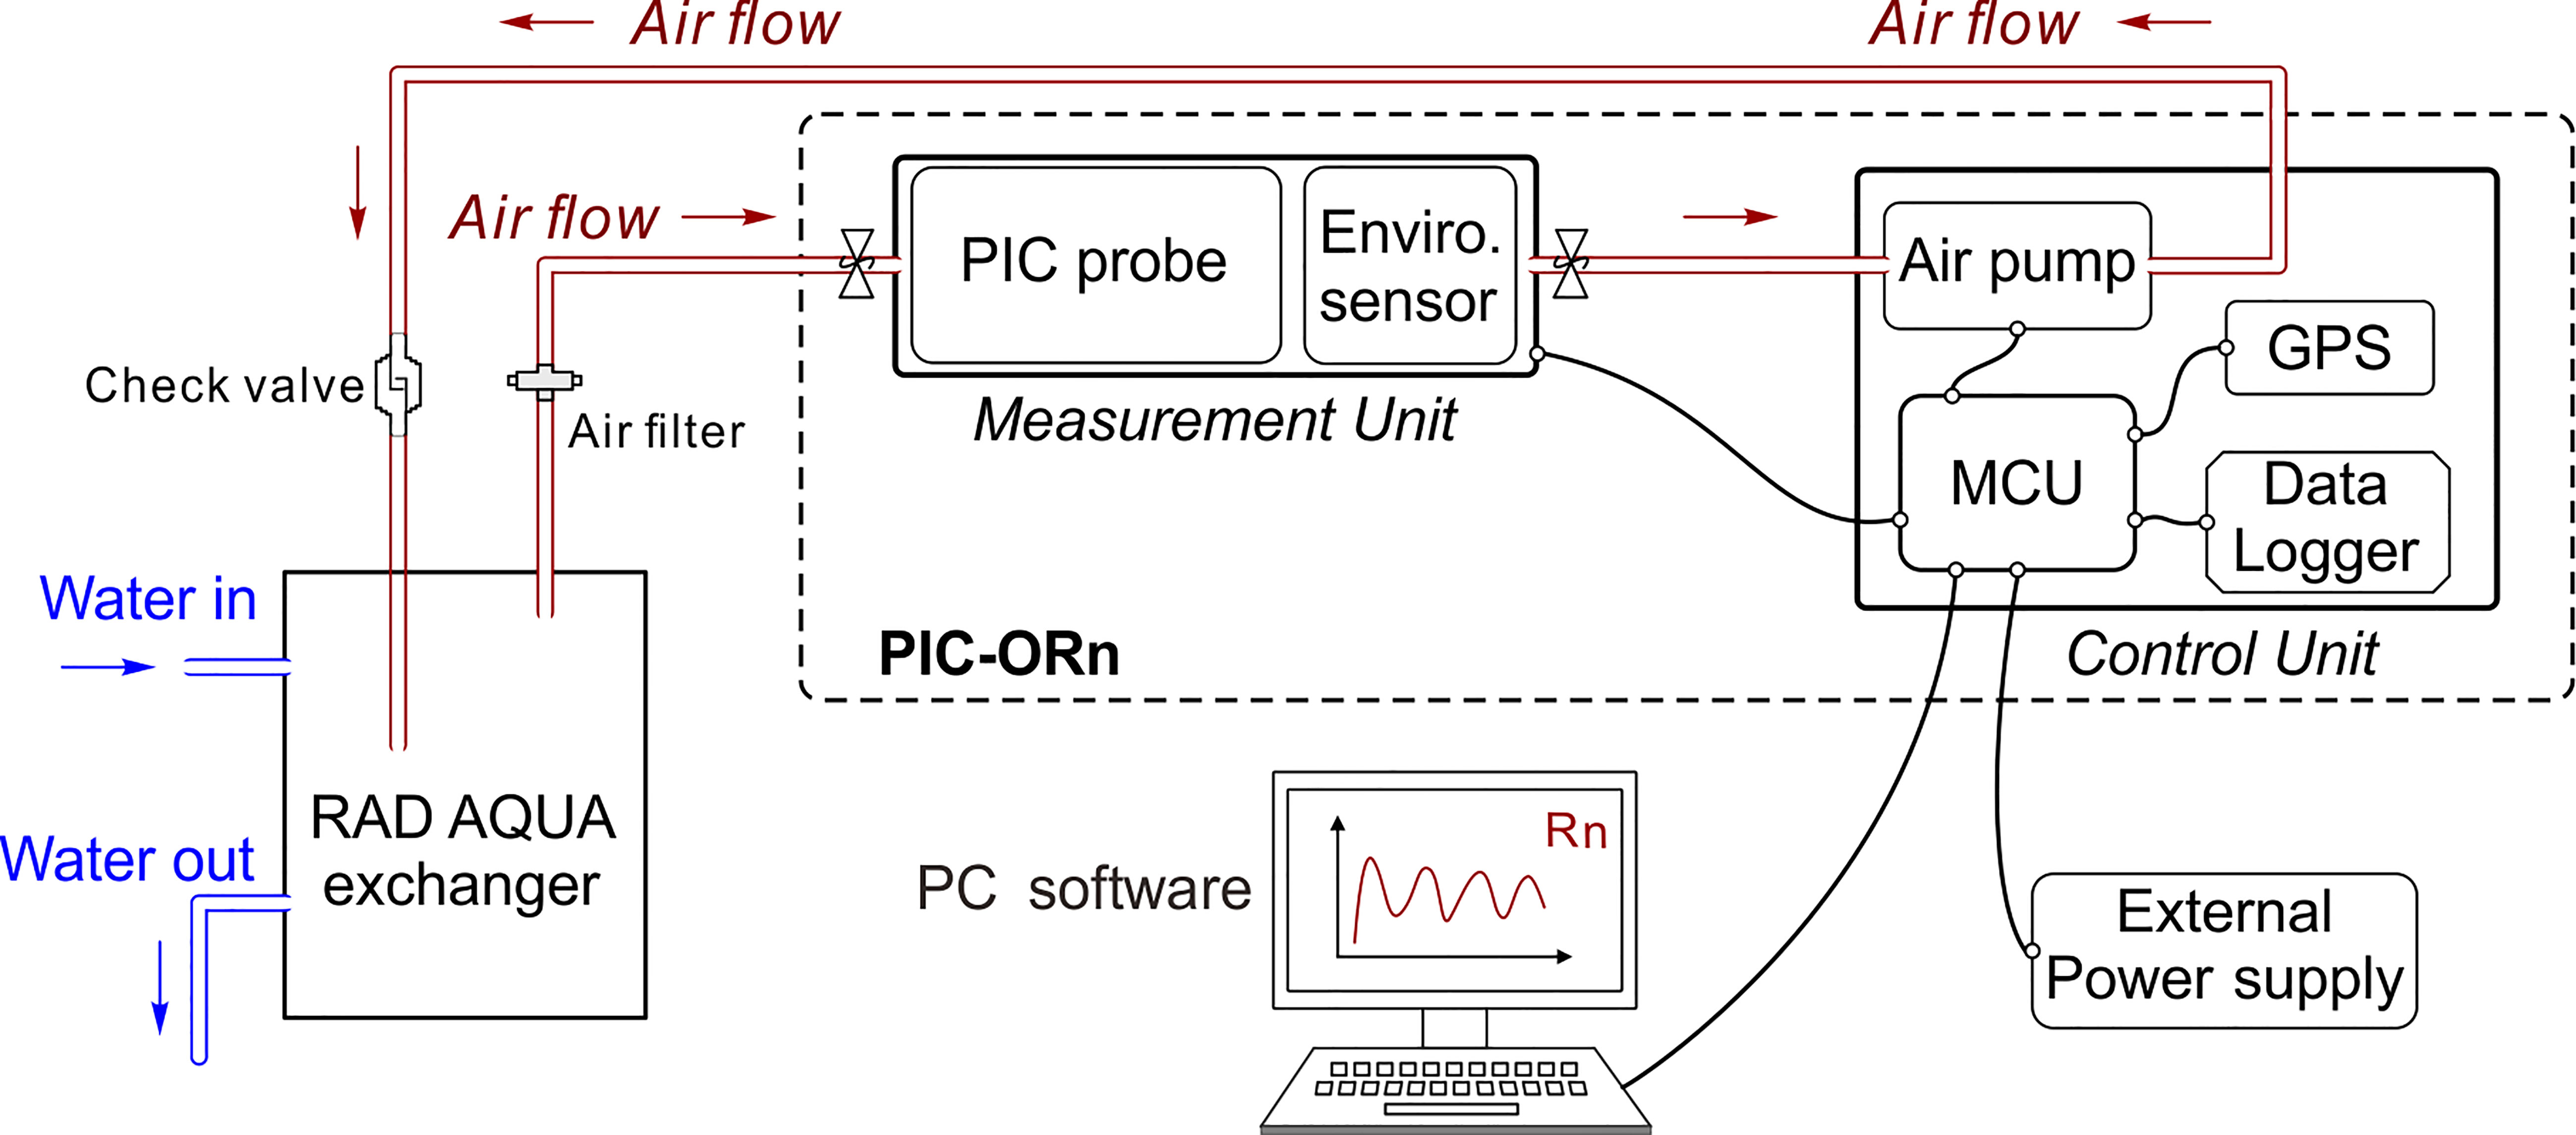
Figure 1 Schematic diagram of an automated radon measurement system for continuous measurements of radon-in-water. Everything inside the dotted lines is the PIC-ORn detector, which consists of the measurement and control units. Equilibrated air from the RAD AQUA exchanger is directed to the measurement unit via a diaphragm air pump. Every ten minutes or other manually set-up interval, the combined information including radon activity, temperature, humidity, pressure, and GPS locations are stored in the data logger and/or transmitted from the microcontroller unit (MCU) inside the PIC-ORn detector to a self-programed PC software. One can download all the data afterwards if a computer is not readily available on field site.
The PIC-ORn system is designed in two separate sections: the control unit and the measurement unit (Figure 1). This design is convenient and avoids any electrical noise interference generated by the control unit and from the vibration caused by the diaphragm air pump to the measurement unit. The entire system can be powered by either 12 V batteries or AC via an eight-core watertight cable. Real-time interactive communication between PIC-ORn and the ship-based PC is accomplished through a USB cable. Fitting on the measurement and control chambers are IP67 waterproof grade, meeting the requirements of long-term continuous field survey monitors.
The control unit is composed of a microcontroller (MCU), a data logger, a diaphragm air pump, and a GPS module. The built-in MCU is the core of the PIC-ORn detector, which provides the appropriate power to the other devices and contains the command control and data transmission between the PIC-ORn and the PC software. For each integration time (minimum at 1 minute), the combined information, including radon activity, temperature, humidity, pressure, and GPS locations, are transmitted from the MCU to the PC interfaced by the program software. A data logger (a TF card) automatically stores the dataset once the MCU receives the data. The data can be revised and downloaded using a remote terminal via WiFi. An STM32F103 chip (STMicroelectronics Inc., Italy) was selected as the MCU. This chip contains multiple serial interfaces and general-purpose input/output (GPIO) ports and has the advantages of low cost and power consumption. The ATK1218-BD positioning module (Xingyi Electronic Technology Co., Ltd, China) is used to obtain longitude and latitude coordinates during the radon survey measurements. This module has dual positioning functions from both GPS and Beidou systems, which have an update rate of up to 20 Hz with a positioning accuracy of up to 2.5 m circular error probability (CEP). The KLC-2 micro diaphragm air pump (Kamoer Company, China) provides a maximum airflow rate of 1.5 L/min, which guarantees a rapid equilibrium of radon-gas between air and water phases. It has the advantages of a large voltage regulation range, low heating effect, low noise, and long service life.
The measuring unit can be sealed with an air inlet port and an air outlet port, in which a PIC radon probe (HS Radon Co., China, or FT-lab Co., Korea) and an environmental sensor are assembled. This commercially available radon probe with an active volume of 0.2 L is used to monitor the radon-in-air activities. It has a power consumption of about 1 W (12 V DC, 0.065 A) with an operating temperature from 10 °C to 40 °C. We used a BME680 sensor (Bosch Company, Germany) to monitor air temperature, humidity, and pressure simultaneously. The sensor uses an I2C interface, an onboard power supply voltage stabilizing chip, and a level chip with good compatibility. When the sampling rate is set at 1 Hz, the current consumption is only 3.7 microamperes.
Based on a conceptual diagram of the hardware system (Figure 2A), we designed the hardware circuit board and packaged the electronic control system (Figure 2B). The total power consumption of PIC-ORn with the air pump running is approximately 5 W.
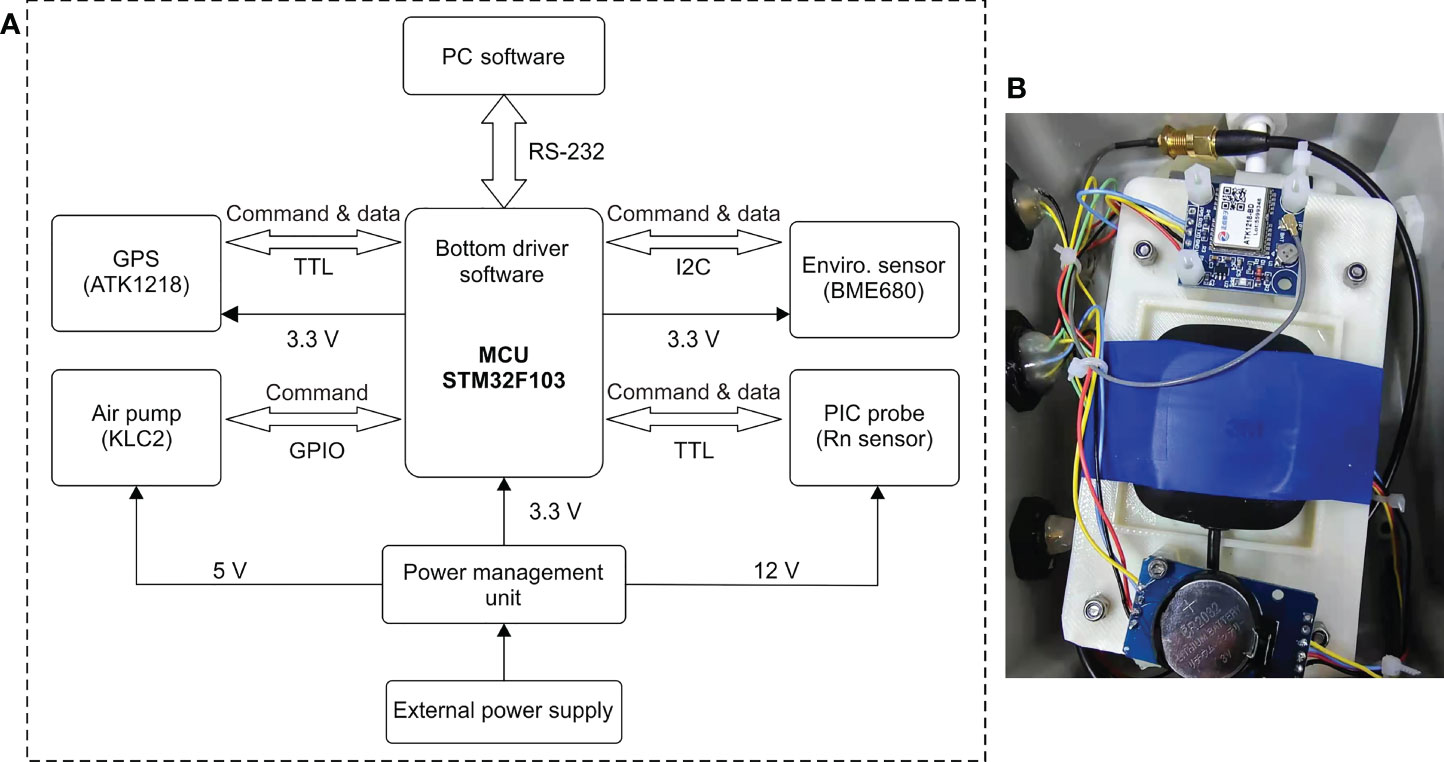
Figure 2 (A) A conceptual diagram of the hardware system. (B) A picture of our packaged electronic control system.
We developed a PC Software package (“Radon-Survey-Software v2.0”) to run the command control, real-time data display, and storage of the PIC-ORn detector data. A corresponding Embedded Software was implanted into the MCU of the PIC-ORn to control each sensor, acquire data, and interact with the PC Software, based on the RS-232 Modbus protocols with the baud of 19200 bps.
The Embedded Software on the MCU is programmed with C-language based on Keil software platform. The control flow diagram of PC Software and Embedded Software were shown respectively (Figure 3). The PC Software is programed based on Visual Studio 2017 platform with C-language which has a concise user interface. The control commands can be easily sent to the PIC-ORn by clicking corresponding buttons. The menu functions of the PC Software include communication setting, system configuration, diagram display, status display, and air pump setting, etc. After the connectivity between PC Program and PIC-ORn established, the PC Software can further configure the PIC-ORn system with different manual set-up, including device reset, single data acquisition, data save, algorithm optimization, and data type selection. The operation mode of air pump can be set as on, off, automatic or periodical modes, which improves the adaptability of the PIC-ORn detector to meet various requirements during survey measurements with different radon activities. The radon concentration reported by the PIC-ORn detector can be displayed in diagram display area of the PC Software in real time. The software can conduct preliminarily data analysis such as full screen views, clipped views, single point display and data smoothing.
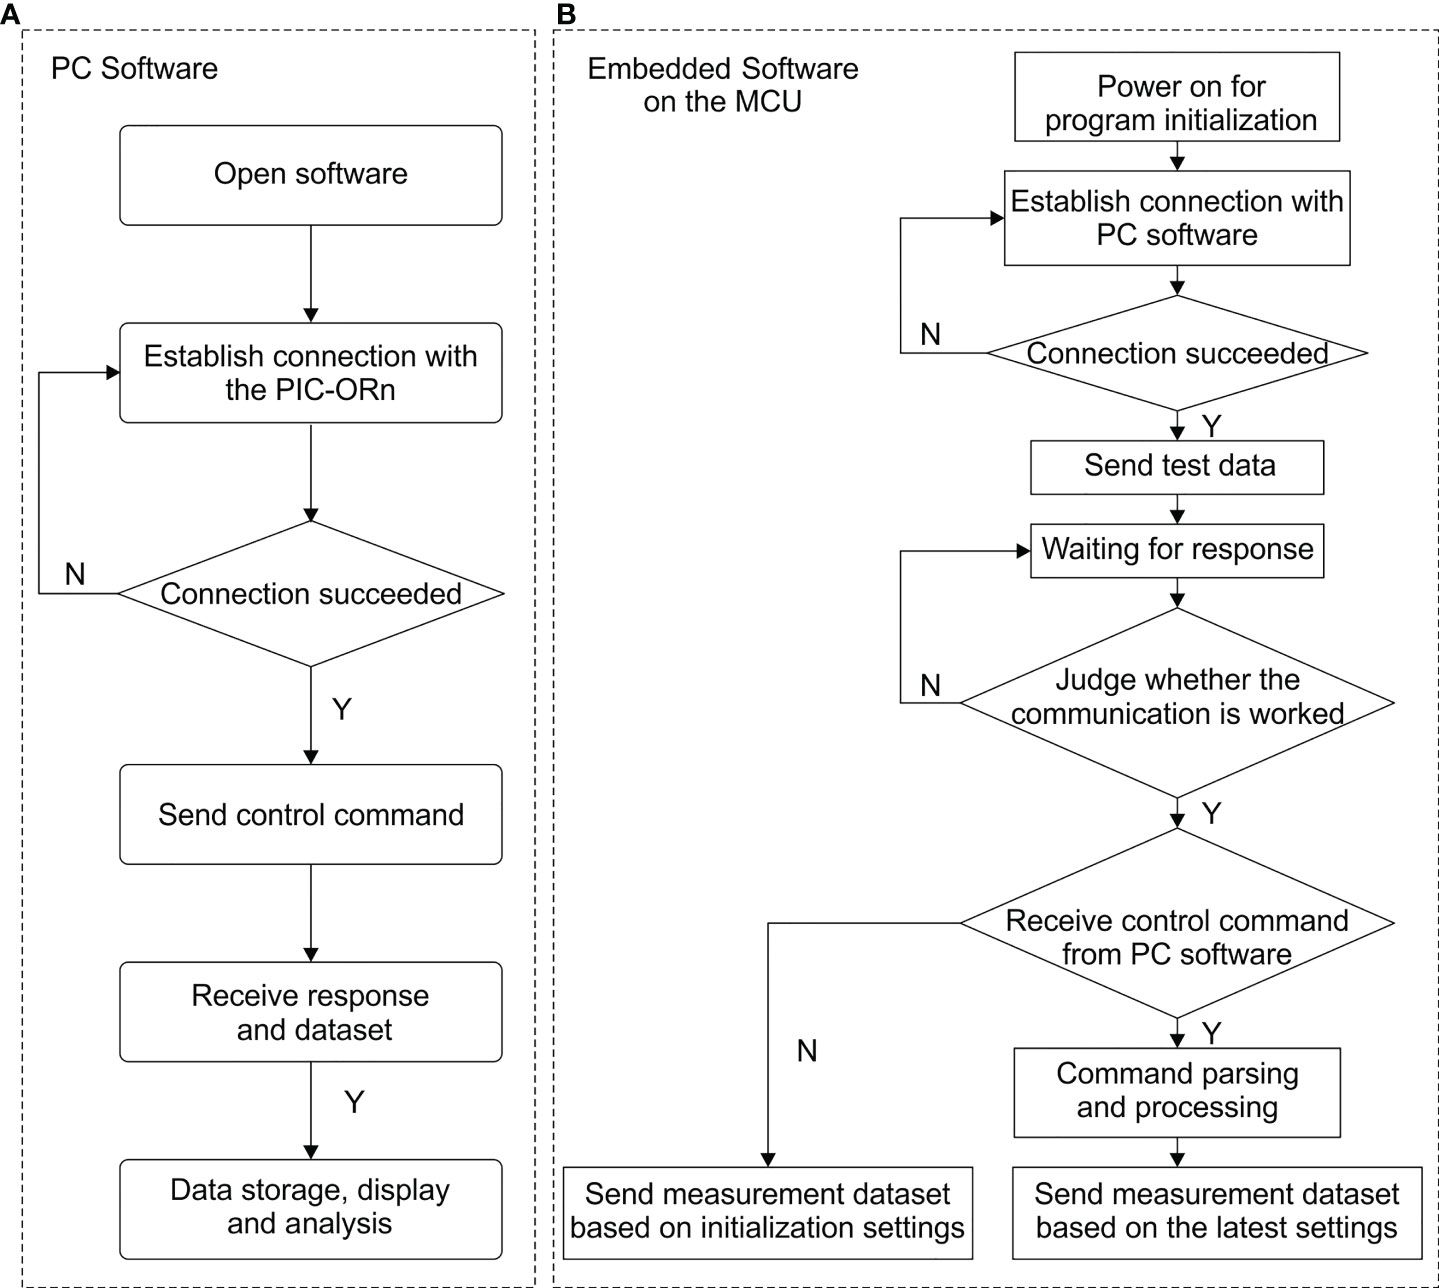
Figure 3 Control flow charts of the PC Software (A) and Embedded Software on the MCU (B), respectively.
Any gas leakage in the system will affect the radon measurement accuracy and sensitivity. A routine leak check was conducted by injecting high purity helium gas into the system until the inner pressure increased to 130 Kpa, ~30% higher than atmospheric pressure (i.e., 101 Kpa). A long-time monitor of air pressure, humidity, and temperature was conducted at 10-min intervals via the internal BME680 sensor. The results show that the above parameters remained constant for 17 hours after the air inlet and outlet valves were closed, proving the monitor’s airtightness (Figure 4A). Any residual radon gas in the system was also removed during the helium purging process. This provided an excellent opportunity to check the background of the system. The background of the PIC sensor averaged at 0.37 ± 0.80 Bq/m3 (n=102, Figure 4B), about two times higher than a typical RAD7 background (0.2 Bq/m3) but still very low. Slight variations were observed during the background test may be due to some unanticipated circuit noise signals. The inherent background of RAD7 rises due to the 210Pb (t1/2 = 22.3 yr) deposition on its probe as service time increases. However, this not a problem for a PIC since radon radioactive progenies can never be counted. Based on these results, the detection limit of the PIC sensor is estimated at 2.7 Bq/m3 (Currier, 1968).
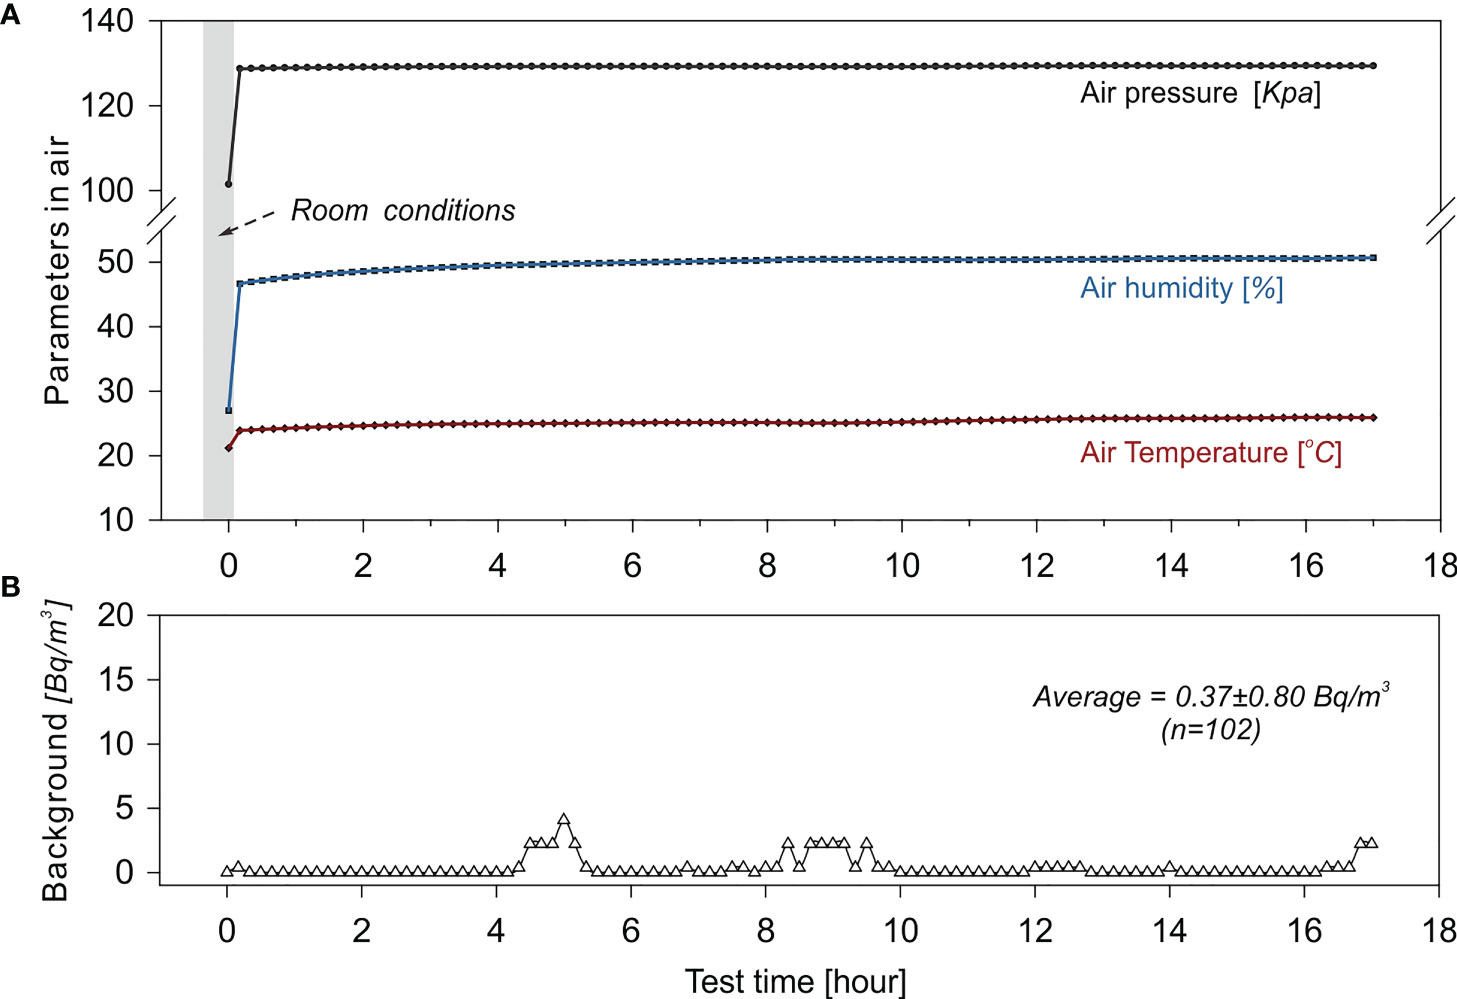
Figure 4 (A) The internal pressure of the PIC sensor injected with up to 130 Kpa with pure helium gas. After the air inlet and outlet valves of the PIC sensor were closed, the air pressure, humidity and temperature were monitored simultaneously for 17 hours via the BME 680 sensor installed inside the instrument. (B) The background radon activities of the PIC sensor over a 17-hour period.
The measurement efficiency of the PIC-ORn detector was standardized against a recently calibrated RAD7. A rock standard sample (Durridge, Inc., USA) with known radon activity was prepared as the radon source by being sealed for over one month to allow 222Rn to equilibrate with the 226Ra in the rock. The radon was introduced to the calibration system and create a peak signal via PIC-ORn’s internal air pump. The system was run for five minutes to let radon gas homogeneously mix inside. We held the air flow for another five minutes to allow the complete decay of 220Rn (t1/2 = 55.6 s) as well as 219Rn (t1/2 = 3.96 s) after removal of the radon source. A desiccant column was connected to the system to ensure that the air relative humidity is below 10% since high moisture can affect the sensitivity of RAD7’s semiconductor detector. The RAD7 and PIC detectors were connected in series with each other and the rock sample and the counting intervals for both instruments were set to 30 min. The radon activity (counts per minute, cpm) of a rock standard sample we used was 32.7 ± 2.8 cpm and 59.5 ± 2.6 cpm measured by the RAD7 and PIC-ORn detectors, respectively. The errors represent 2-σ uncertainties. These results, expressed in terms of radon sensitivity at 0.012 cpm/(Bq/m3) for the PIC detector and 0.0065 cpm/(Bq/m3) for the RAD7 indicates that the measurement efficiency of the PIC-ORn detector was approximately 1.8-fold of the RAD7 detector used in this case.
We conducted an indoor-tank laboratory experiment for more than 24 hours to compare PIC-ORn to the commercial RAD AQUA-RAD7 setup. We used two tanks (3 meters in length and width) filled with water: tank #1 was filled to 1 meter depth with “old” water, while tank #2 was filled with the same water up to 3 meter depth. To ensure that the water in the tanks has background levels of radon equilibrated with radon in the atmosphere, we kept the waters in the tanks for >30 days while continuously aerating them. We deployed a submersible pump to provide a steady water flow into a RAD AQUA exchanger at a rate of 2 L/min. Radon activities were then measured both by the PIC-ORn and RAD7 systems setup in series. We set both instruments to collect data in 10-min counting intervals and measured the “background” activity in the aged water for about 30 min. After that, we started filling the tank with tap water (groundwater source) known to have high radon levels. After 6 hours of data acquisition, we ceased input of the high radon tap water, and continued to monitor radon in the tank water for another 17 hours. Finally, we moved both systems to tank #2 which was filled with low radon-aged water. The radon-in-water data were characterized using a 1-h interval averaging approach to smooth out the statistical scatters.
During the tank experiment, the PIC-ORn was controlled by user-customized software, and the data transmission as well as data storage worked without any issues. As the first tank started filling up, the radon-in-water activities measured by both PIC-ORn and RAD7 rapidly rose from an initial background level of 20 Bq/m3 to over 300 Bq/m3 (Figure 5A). After the groundwater input was ceased, within 17 hours monitoring period we observed a gradual decreasing trend of radon activities due to radon escape into the atmosphere as well as decay loss. We also found a rapid decline in radon-in-water concentrations after these two systems were moved to the 2nd tank that contained aged low-radon waters (Figure 5A). The responses of the two radon-detection systems were almost identical when switching between tank waters with different radon activities (Figure 5A). Based on statistical analysis, we found that the testing results of the PIC-ORn were consistent with the RAD7 (R2 =0.98, Figure 5B). Due to higher measurement efficiency of PIC, The error bars of the PIC-ORn were generally smaller than the RAD7 within 1-σ uncertainties.
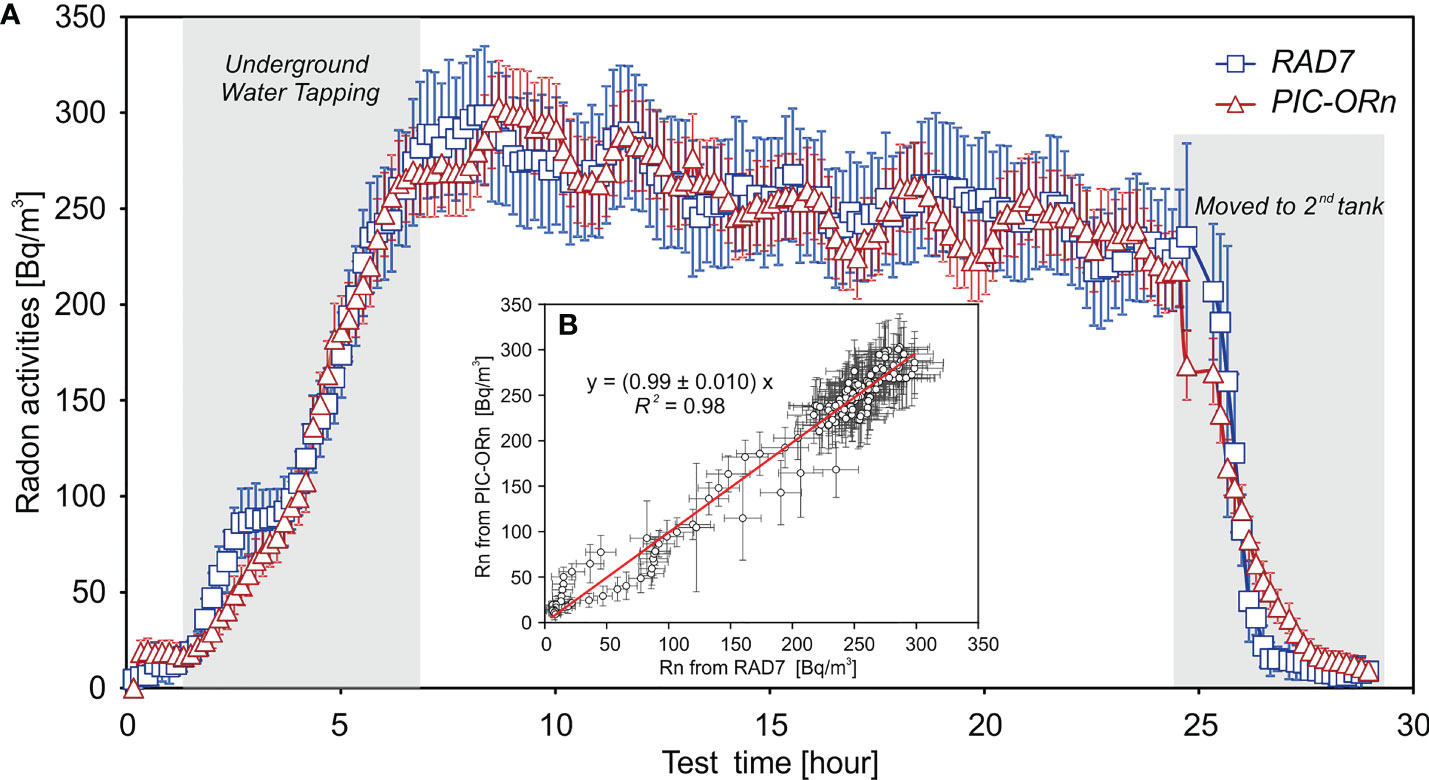
Figure 5 (A) A continuous laboratorial measurements via a commercial RAD AQUA-RAD7 system (blue squares) and the PIC-ORn (red triangles). (B) Scatter plot of the radon-in-water activities measured by the PIC-ORn versus the RAD7. The error bars represent the 1-σ uncertainties based on counting statistics.
The PIC-ORn system was deployed on the R/V Dongfanghong 3 during a cruise to the northwest Pacific Ocean in June 2021. Surface seawater was continuously delivered into the RAD AQUA exchanger through the ship-based submersible water supply system. The water flow rate was set to 3 L/min and the air flow rate at 1.5 L/min during the entire period, as recommended by Dimova et al. (2009). Radon was measured both by the PIC-ORn and a RAD AQUA-RAD7 system setup in series. To meet the RH requirement of RAD7 (<10%), the airstream was dried by passing through a large laboratorial desiccant column that filled with 8-mesh CaSO4-CoCl2 drierite (W. A. Hammond, Co., USA). Since the expected radon in surface ocean water was relatively low, the integration measurements intervals of the PIC and RAD7 system were set at 1 hour to reduce the analytical uncertainties. A portable temperature probe (HOBO data logger) was attached to monitor the temperature variations at the air/water interface of the RAD AQUA with 30-min intervals. The radon-in-air activities (Cair) measured by the PIC-ORn and RAD AQUA-RAD7 systems were then converted to corresponding radon-in-water activities (Cwater) by applying the temperature radon partition coefficient (Kw/air) via the following equation 1 (Weigel, 1978; Schubert et al., 2012).
To further verify the accuracies of PIC-ORn system results, seven discrete grab samples were collected during the cruise period in 6 L HDPE bottles equipped with a three-port screw-on cap. The radon activity of each water sample was immediately measured on-board by using a four-port Rn extraction line system and Lucas cell counting following the method described by Stringer and Burnett (2004). The system was calibrated using NIST-traceable 226Ra standard solutions several times on each of four ports, with an average uncertainty below 10%. The radon-in-water concentrations (Cwater) could be calculated with the following equation:
where CPM is the radon in counts per minute for a measurement period of 100 minutes; E is the calibrated efficiencies of each port of the Lucas cell counting system (cpm/Bq); and V is the water sample volume (m3).
During the survey experiments, the radon activities in surface seawater measured by PIC-ORn ranged from 0.80 Bq/m3 to 7.4 Bq/m3 (i.e., 0.048-0.44 dpm/L) with an average of 3.7 ± 1.4 Bq/m3 (n=96). The radon distribution showed a typical trend of lower concentrations in the open ocean and higher concentrations in coastal regions, such as the South Yellow Sea area (Figure 6). This is relevant to more terrestrial inputs in shallow areas, such as riverine input, pore-water exchange, and submarine groundwater discharge, which result in relatively high radon activities (Kim et al., 2005; Liu et al., 2017; Wang et al., 2021).
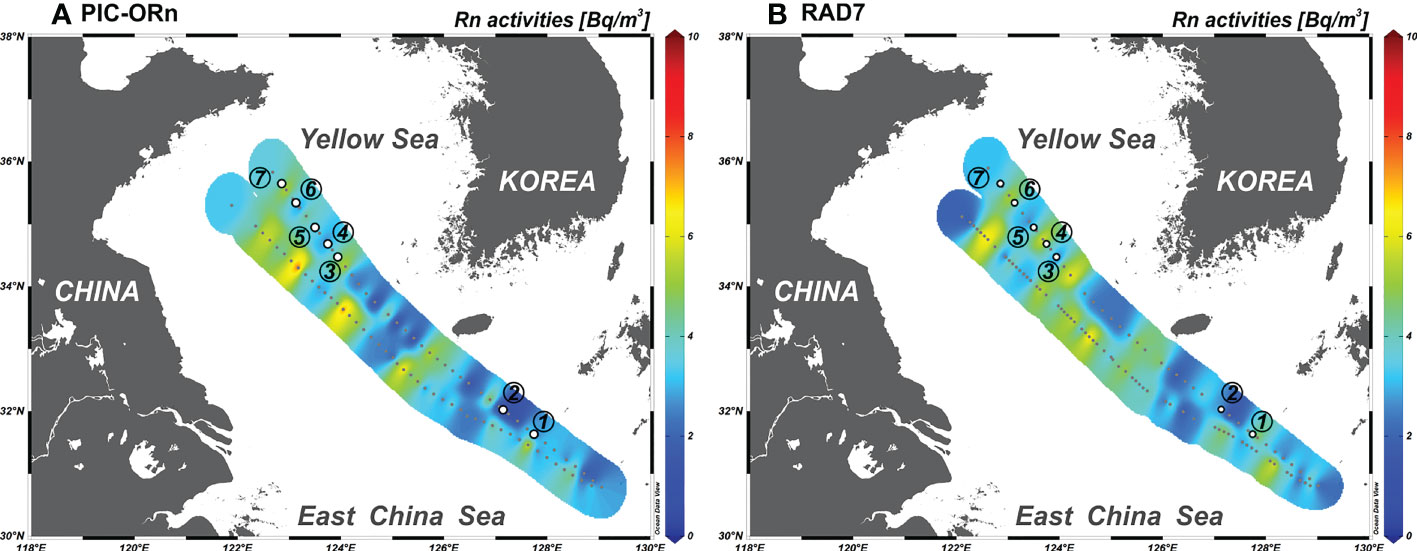
Figure 6 Distributions of dissolved radon activities measured by the PIC-ORn (A) and RAD7 (B) in surface waters of the northwest Pacific Ocean in June 2021, respectively. The circled numbers 1-7 represent discrete grab samples collected and measured via Lucas cell counting to compare with the automated systems.
Despite the very low activities, the radon results for both automated systems were consistent with the Lucas cell results within the estimated 1-σ uncertainties (Figure 7). Whether the instrumentation is portable and whether operations require less manual supervision need to be considered when a user conduct radon survey measurements in the field or on a boat. The laboratory radon determination using a Rn-gas extraction line and Lucas cell counting, as a traditional method in the last century, has an advantage of high efficiency (up to three hundred percent) which results in lower counting uncertainty (<10%, Figure 7). However, a big disadvantage of this method is the fewer data point collection and heavy operator involvement. Additionally, many extra parts needed for this system make it difficult to carry, such as a vacuum pump, compressed helium, Lucas cells, photomultiplier tubes, and liquid nitrogen (or dry ice for the cold trap) (Peterson et al., 2009). The RAD AQUA-RAD7 system currently provides a much portable approach for continuous radon survey measurements. The RAD7 is a high performance instrument that can discriminate different alpha-emitting energies from radon and thoron radioactive progenies. Specific alpha particles end up in its specific windows (A-H) in each measurement. A useful software (“Capture” provided by Durridge) is also available for free, which would help user to simplify the transfer of data from the RAD7 to a terminal computer. However, the RAD7 suffers from two dominating drawbacks: (i) relatively low inherent measurement efficiency of RAD7’s semiconductor alpha detector; (ii) maintain low internal relative humidity while operates since the detector efficiency is affected by moisture. The field results of the RAD7 shown much larger uncertainties (~50%, Figure 7) compared to the PIC-ORn method. Dulaiova et al. (2005) shown that with multiple RAD7 detectors coupled, it could achieve greater efficiency and throughput for assessment of radon in the coastal ocean.
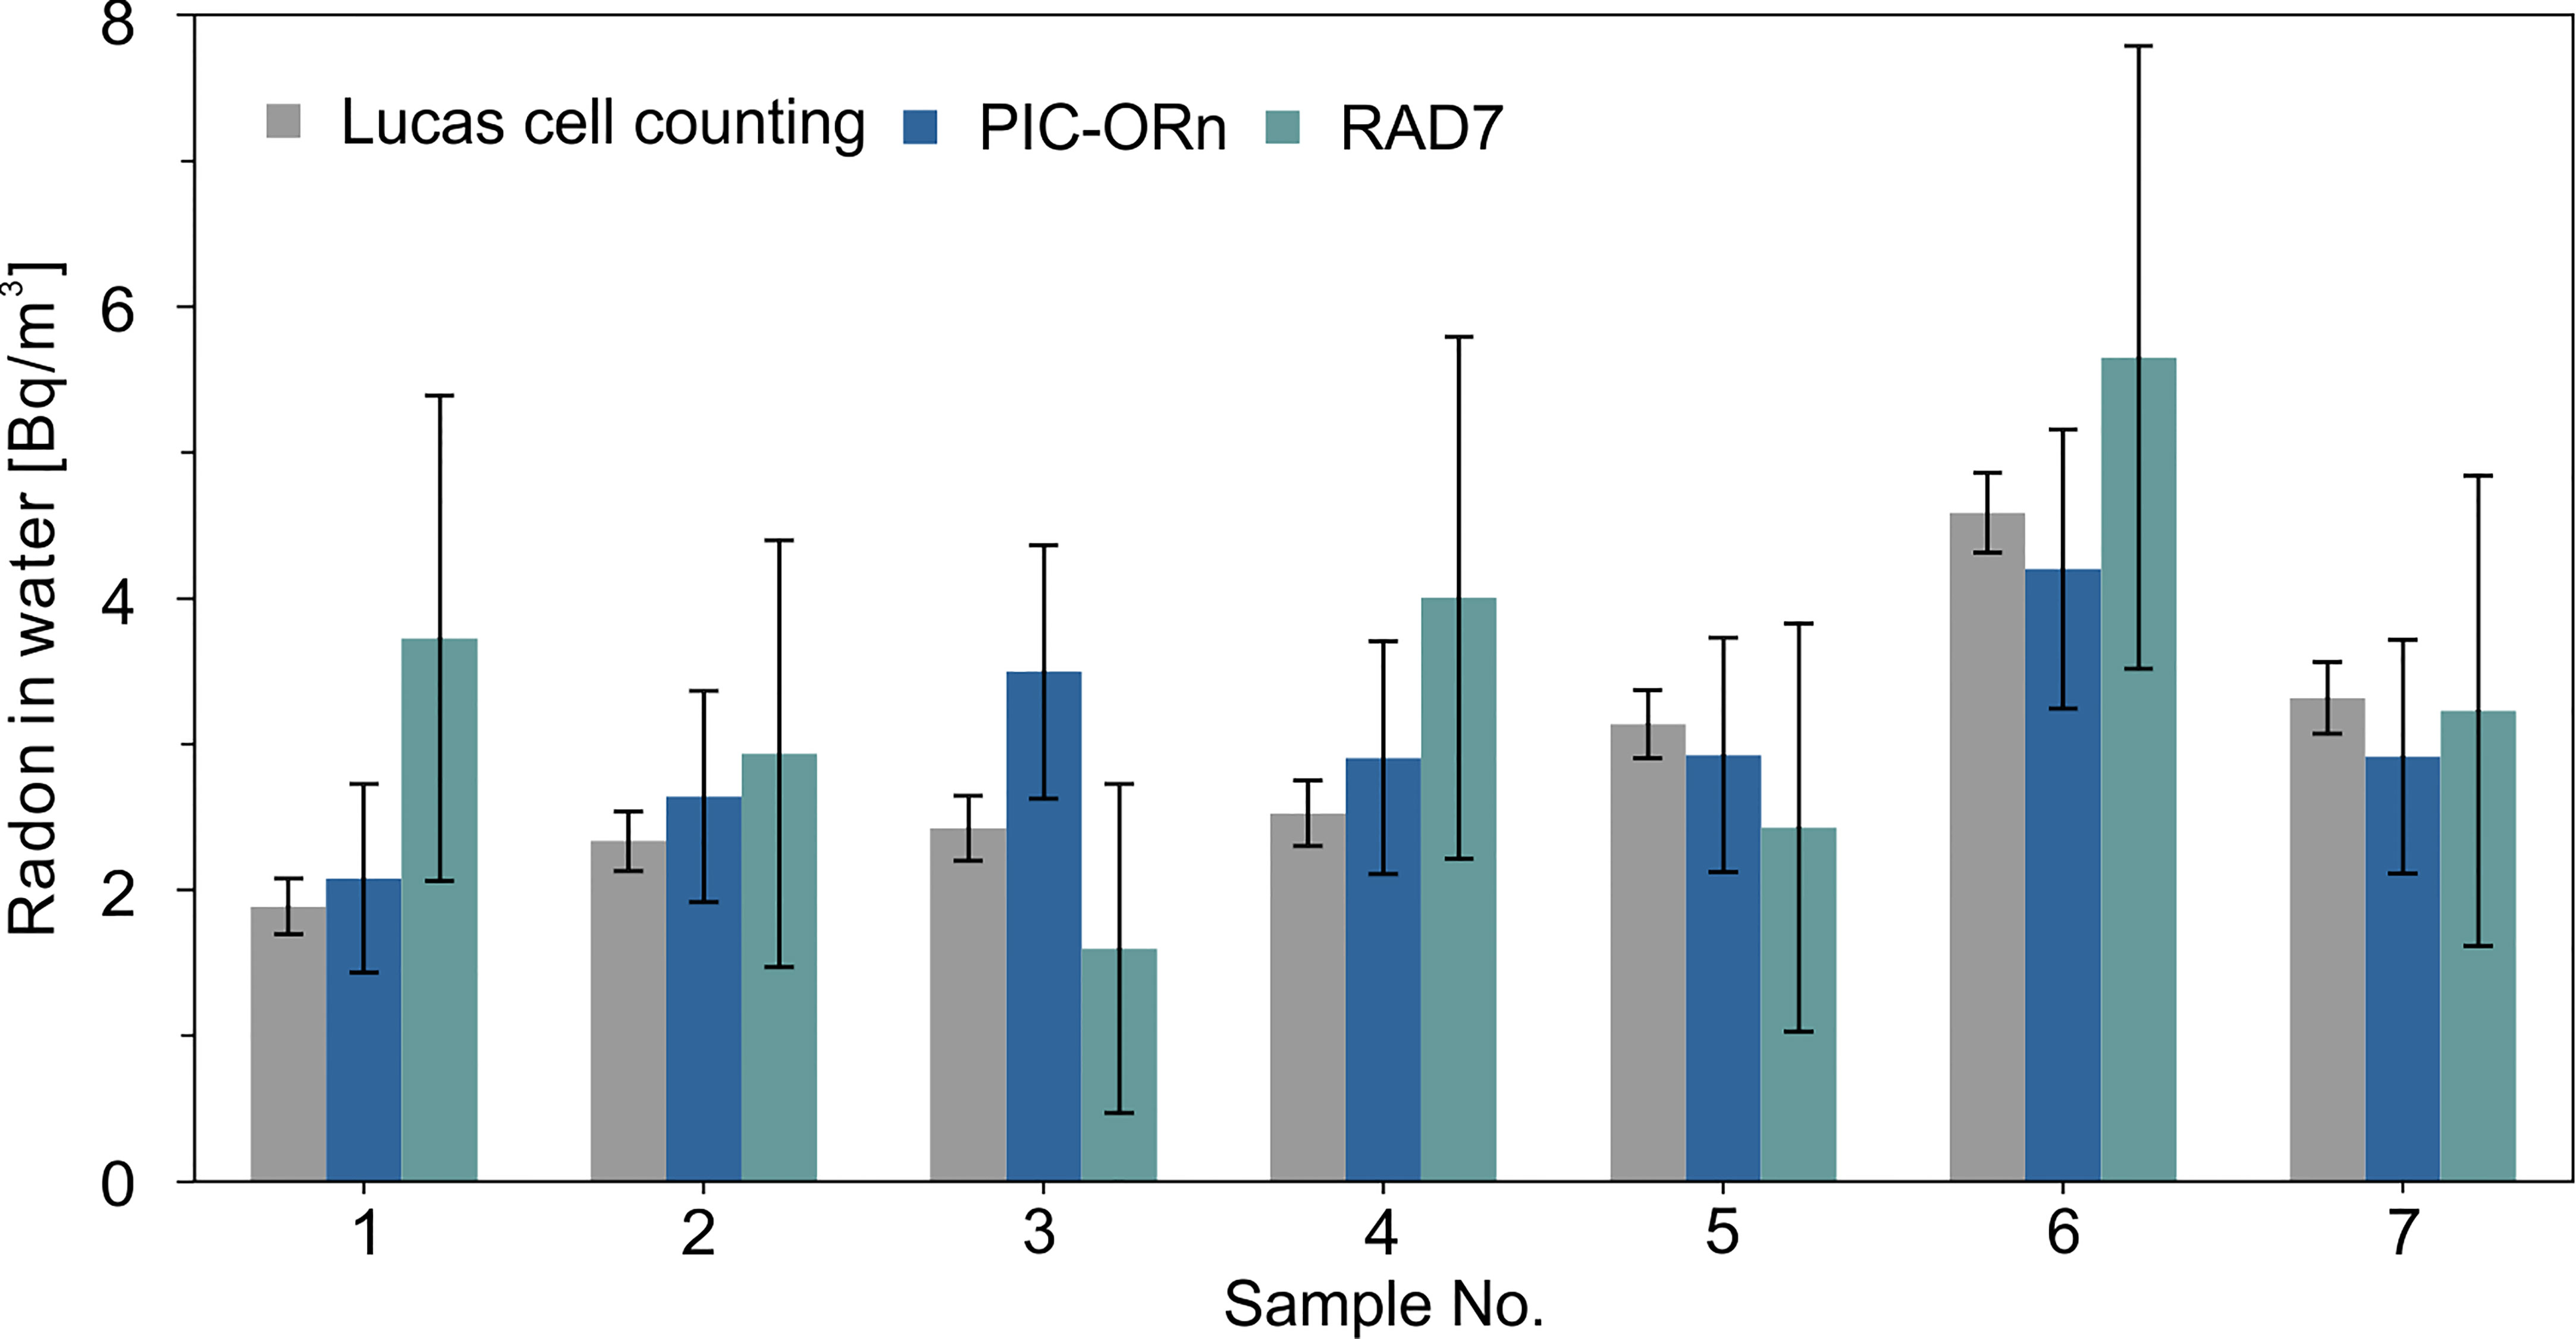
Figure 7 Seven surface seawater samples were collected during the boat survey (the locations of the sampling points are shown on Figure 6). Bar diagram shows the radon in surface water results from a comparison between three independent techniques: a radon-gas extraction line combined with Lucas cell counting (grey), the PIC-ORn detection system (blue) and the RAD7 systems (green). The error bars represent the 1-σ uncertainties based on counting statistics.
In comparison, the new automatic continuous radon survey measurement system (PIC-ORn) we present here overcomes some of above limitations versus above two conventional radon-in-water measurement techniques and builds in with customized hardware and software. The new system has relatively higher uncertainties (<30%, Figure 7) compared to the Rn line (<10%) but benefits of automatic measurements. We demonstrated that the PIC measurement efficiency is ~2 times higher than a RAD7 and is less affected by relative humidity and produces reliable results. The uncertainties are uniformly lower for the PIC relative to the RAD7. It does not rely on a drying unit and has low power consumption, further reducing manual supervision when applies it to continuously measure dissolved radon in the surface ocean and other water bodies. Customized software interfaces the combined survey measurements for radon activity, temperature, humidity, pressure, GPS continuously stored in a data logger and/or be transmitted to a PC onboard. The new software also allows radon concentrations can be viewed in real time. We thus believe that the PIC-ORn system offers the user the most benefit for automatically continuous radon survey because one can start the measurement at one’s convenience and leave it counting as long as necessary to achieve the desired monitoring time and uncertainty level.
The PIC-ORn detection system was applied for continuous radon measurements in surface water and good agreements among three different approaches achieved. The measurement efficiency of single PIC sensor is about two times higher than a RAD7 detector. Further higher efficiency can be accomplished with PIC-ORn system by adding more PIC sensors. However, air volume dilution and delayed equilibrium should be carefully considered on this occasion. Presumably, a PIC-ORn detector could be used with various sized sampling bottles for grab sample determination of radon in water. The next step would be to mate the PIC-ORn approach to a good oceanographic pump, add a marine GPS module with depth sounder. In this manner, one could do depth profiles by sending the pump to different depths of interest, quickly measure the radon activities in the ocean anywhere. Research in submarine groundwater advection and diffusion and ocean-atmosphere gas exchange will benefit from utilizing this system.
The original contributions presented in the study are included in the article/supplementary material. Further inquiries can be directed to the corresponding author.
CL and SZ performed the system setup, data processing and drafted the original manuscript. These two authors contributed equally to this work. CZ, ML, JG and HY helped with instrument upgrade and method improvement. ND and BX revised the manuscript many times. TY, WL, and GC were involved in sample collection field works and data interpretation. All authors have read and agree to the published version of the manuscript.
The authors from Ocean University of China were funded by the Natural Science Foundation of China (U22A20580, 41876075, 42130410), and Fundamental Research Funds for the Central Universities China (201962003 and 202072001).
We thank William C. Burnett from Florida State University and Guebuem Kim from the Seoul National University for providing valuable insights.
The authors declare that the research was conducted in the absence of any commercial or financial relationships that could be construed as a potential conflict of interest.
All claims expressed in this article are solely those of the authors and do not necessarily represent those of their affiliated organizations, or those of the publisher, the editors and the reviewers. Any product that may be evaluated in this article, or claim that may be made by its manufacturer, is not guaranteed or endorsed by the publisher.
Broecker W. S., Kaufman A. (1970). Near-surface and near-bottom radon results for the 1969 north pacific geosecs station. J. Geophys. Res. 75, 7679–7681. doi: 10.1029/JC075i036p07679
Broecker W. S., Li Y. H., Cromwell J. (1967). Radium-226 and radon-222: concentration in Atlantic and pacific oceans. Science. 158.3806, 1307–1310. doi: 10.1126/science.158.3806.1307
Broecker W. S., Peng T. H. (1971). The vertical distribution of radon in the bomex area. Earth Planet Sc Lett. 11, 99–108. doi: 10.1016/0012-821X(71)90149-X
Burnett W. C., Dulaiova H. (2003). Estimating the dynamics of groundwater input into the coastal zone via continuous radon-222 measurements. J. Environ. Radioactiv. 69, 21–35. doi: 10.1016/S0265-931X(03)00084-5
Burnett W. C., Kim G., Lane-Smith D. (2001). A continuous monitor for assessment of 222Rn in the coastal ocean. J. Radioanal Nucl. Ch. 249, 167–172. doi: 10.1023/A:1013217821419
Chanyotha S., Sola P., Kritsananuwat R., Lane-Smith D., Burnett W. C. (2018). Improved measurements of thoron (220Rn) in natural waters. J. Radioanal Nucl. Ch. 318, 777–784. doi: 10.1007/s10967-018-6110-z
Chen Z., Li Y., Liu Z., Wang J., Zhou X., Du J. (2018a). Radon emission from soil gases in the active fault zones in the capital of China and its environmental effects. Sci. Rep-Uk. 8, 16772. doi: 10.1038/s41598-018-35262-1
Chen X., Santos I. R., Call M., Reithmaier G. M. S., Maher D., Holloway C., et al. (2018b). The mangrove CO2 pump: Tidal driven pore-water exchange. Limnol. Oceanogr. 66, 1563–1577. doi: 10.1002/lno.11704
Chen X., Santos I. R., Hu D., Zhan L., Zhang Y., Zhao Z., et al. (2022). Porewater exchange flushes blue carbon from intertidal saltmarsh sediments into the sea. Limnol. Oceanogr. Lett. doi: 10.1002/lol2.10236
Corbett D. R., Burnett W. C., Cable P. H., Clark S. B. (1998). A multiple approach to the determination of radon fluxes from sediments. J. Radioanal Nucl. Ch. 236, 247–252. doi: 10.1007/BF02386351
Currier L. A. (1968). Limits for quantitative detection and quantitative determination. application to radiochemistry. Anal. Chem. 40 (3), 586–593. doi: 10.1021/es902045c
Curtiss L. F., Davis F. J. (1943). A counting method for the determination of small amounts of radium and of radon. J. Res. Natl. Bureau Stand. 31, 181–190. doi: 10.6028/jres.031.007
Dulaiova H., Peterson R., Burnett W. C., Lane-Smith D. (2005). A multi-detector continuous monitor for assessment of 222Rn in the coastal ocean. J. Radioanal Nucl. Ch. 263, 361–363. doi: 10.1007/s10967-005-0063-8
Gavrilyuk Y. M., Gangapshev A. M., Gezhaev A. M., Etezov R. A., Kazalov V. V., Kuzminov V. V., et al. (2015). High-resolution ion pulse ionization chamber with air filling for the 222Rn decays detection. Nucl. Inst Methods Phys. Res. A. 801, 27–33. doi: 10.1016/j.nima.2015.08.034
Key R. M., Brewer R. L., Stockwell J. H., Guinasso N. L. (1979). And schink, d Some improved techniques for measuring radon and radium in marine sediments and in seawater. R. Mar. Chem. 7, 251–264. doi: 10.1016/0304-4203(79)90042-2
Kim G., Ryu J., Yang H., Yun S. (2005). Submarine groundwater discharge (SGD) into the yellow Sea revealed by 228Ra and 226Ra isotopes: Implications for global silicate fluxes. Earth Planet Sc Lett. 237, 156–166. doi: 10.1016/j.epsl.2005.06.011
Kuo T., Lin C., Chang G., Fan K., Cheng W., Lewis C. (2010). Estimation of aseismic crustal-strain using radon precursors of the 2003 M 6.8, 2006 M 6.1, and 2008 M 5.0 earthquakes in eastern Taiwan. Nat. Hazards. 53, 219–228. doi: 10.1007/s11069-009-9423-y
Lee J., Kim G. (2006). A simple and rapid method for analyzing radon in coastal and ground waters using a radon-in-air monitor. J. Environ. Radioactiv 89 (3), 219–228. doi: 10.1016/j.jenvrad.2006.05.006
Liu W., Li C., Cai P., Zhao S., Guo J., Burnett W. C., et al. (2022). Quantifying 224Ra/228Th disequilibrium in sediments via a pulsed ionization chamber (PIC). Mar. Chem. 245, 104160. doi: 10.1016/j.marchem.2022.104160
Liu J., Su N., Wang X., Du J. (2017). Submarine groundwater discharge and associated nutrient fluxes into the southern yellow Sea: A case study for semi-enclosed and oligotrophic seas-implication for green tide bloom. J. Geophys. Res: Oceans. 122, 139–152. doi: 10.1002/2016JC012282
Null K. A., Dimova N. T., Knee K. L., Esser B. K., Swarzenski P. W., Singleton M. J., et al. (2012). Submarine groundwater discharge-derived nutrient loads to San Francisco bay: Implications to future ecosystem changes. Estuaries Coasts. 35, 1299–1315. doi: 10.1007/s12237-012-9526-7
Peterson R. N., Burnett W. C., Dimova N., Santos I. R. (2009). Comparison of measurement methods for radium-226 on manganese-fiber. Limnol Oceanogr.: Methods 7, 196–205. doi: 10.4319/lom.2009.7.196
Petra V., Aleš F. (2019). Continuous radon-in-water monitoring-comparison of methods under laboratory conditions and results of in situ measurements. Radiat. Prot Dosim. 186, 406–412. doi: 10.1093/rpd/ncz241
Prakash R., Srinivasamoorthy K., Gopinath S., Saravanan K., Vinnarasi F., Ponnumani G., et al. (2018). Radon isotope assessment of submarine groundwater discharge (SGD) in coleroon river estuary, Tamil nadu, India. J. Radioanal Nucl. Ch. 317, 25–36. doi: 10.1007/s10967-018-5877-2
Santos I. R., Chen X., Lecher A. L., Sawyer A. H., Moosdorf N., Rodellas V., et al. (2021). Submarine groundwater discharge impacts on coastal nutrient biogeochemistry. Nat. Rev. Earth Environ. 2, 307–323. doi: 10.1038/s43017-021-00152-0
Santos I. R., Maher D. T., Eyre B. D. (2012). Coupling automated radon and carbon dioxide measurements in coastal waters. Environ. Sci. Technol. 46, 7685–7691. doi: 10.1021/es301961b
Sarmiento J. L., Feely H. W., Moore W. S., Bainbridge A. E., Broecker W. S. (1976). The relationship between vertical eddy diffusion and buoyancy gradient in the deep sea. Earth Planet Sc Lett. 32, 357–370. doi: 10.1016/0012-821X(76)90076-5
Schubert M., Paschke A. (2015). Radon, CO2 and CH4 as environmental tracers in groundwater/surface water interaction studies-comparative theoretical evaluation of the gas specific water/air phase transfer kinetics. Eur. Phys. J. Special Topics. 224, 709–715. doi: 10.1140/epjst/e2015-02401-4
Schubert M., Paschke A., Lieberman E., Burnett W. C. (2012). Air-water partitioning of 222Rn and its dependence on water temperature and salinity. Environ. Sci. Technol. 46, 3905–3911. doi: 10.1021/es204680n
Schubert M., Schmidt A., Paschke A., Lopez A., Balcázar M. (2008). In situ determination of radon in surface water bodies by means of a hydrophobic membrane tubing. Radiat. Meas. 43, 111–120. doi: 10.1016/j.radmeas.2007.12.017
Seo J., Kim G. (2021). Rapid and precise measurements of radon in water using a pulsed ionization chamber. Limnol Oceanogr.: Methods 19, 245–252. doi: 10.1002/lom3.10419
Stinger E. C., Burnett C. W. (2004). Sample bottle design improvements for radon emanation analysis of natural waters. Health Phys. 6, 642–646. doi: 10.1097/01.HP.0000137181.53428.04
Wang X., Chen X., Liu J., Zhang F., Li L., Du J. (2021). Radon traced seasonal variations of water mixing and accompanying nutrient and carbon transport in the yellow-bohai Sea. Sci. Total Environ. 784, 147161. doi: 10.1016/j.scitotenv.2021.147161
Wang X., Li H., Zhang Y., Qu W., Schubert M. (2019). Submarine groundwater discharge revealed by 222Rn: comparison of two continuous on-site 222Rn-in-water measurement methods. Hydrogeol J. 27, 1879–1887. doi: 10.1007/s10040-019-01988-z
Xu B., Burnett W. C., Lane-Smith D., Yu Z. (2010). A simple laboratory-based radon calibration system. J. Radioanal Nucl. Ch. 283 (2), 457–463. doi: 10.1016/j.earscirev.2022.103956
Keywords: radon, surface ocean water, PIC, continuous measurements, RAD7
Citation: Li C, Zhao S, Zhang C, Li M, Guo J, Dimova NT, Yang T, Liu W, Chen G, Yu H and Xu B (2022) Further refinements of a continuous radon monitor for surface ocean water measurements. Front. Mar. Sci. 9:1047126. doi: 10.3389/fmars.2022.1047126
Received: 17 September 2022; Accepted: 09 November 2022;
Published: 25 November 2022.
Edited by:
Tibor Kovács, University of Pannonia, HungaryReviewed by:
Masahiro Hosoda, Hirosaki University, JapanCopyright © 2022 Li, Zhao, Zhang, Li, Guo, Dimova, Yang, Liu, Chen, Yu and Xu. This is an open-access article distributed under the terms of the Creative Commons Attribution License (CC BY). The use, distribution or reproduction in other forums is permitted, provided the original author(s) and the copyright owner(s) are credited and that the original publication in this journal is cited, in accordance with accepted academic practice. No use, distribution or reproduction is permitted which does not comply with these terms.
*Correspondence: Bochao Xu, eHViY0BvdWMuZWR1LmNu
†These authors have contributed equally to this work
Disclaimer: All claims expressed in this article are solely those of the authors and do not necessarily represent those of their affiliated organizations, or those of the publisher, the editors and the reviewers. Any product that may be evaluated in this article or claim that may be made by its manufacturer is not guaranteed or endorsed by the publisher.
Research integrity at Frontiers
Learn more about the work of our research integrity team to safeguard the quality of each article we publish.