 Patrick Eskuche-Keith
 Simeon L. Hill
 Philip Hollyman
 Michelle L. Taylor
 Eoin J. O’Gorman
- 1School of Life Sciences, University of Essex, Colchester, United Kingdom
- 2British Antarctic Survey, Cambridge, United Kingdom
Food web interactions govern how ecosystems respond to climate change and biodiversity loss. Modularity, where subgroups of species interact more often with each other than with species outside their subgroup, is a key structural feature which has been linked to food web stability. We sought to address the lack of understanding of how modularity varies among ecosystems by comparing the structure of four highly resolved marine food webs, using a simulated annealing algorithm to identify network modules and Random Forest models to predict the distribution of species across modules based on a set of eight functional traits. Modules in two offshore networks were partitioned largely by trophic level, creating an interdependence among them, whereas modules in two semi-enclosed bays were generally separated into energy channels with less trophic separation and containing distinct basal resources, providing greater redundancy in the flow of energy through the network. Foraging habitat and mobility predicted module membership in all networks, whilst body mass and foraging strategy also differentiated modules in the offshore and bay ecosystems, respectively. Environmental heterogeneity may be a key factor driving the differences in modularity and the relative importance of functional traits for predicting module membership. Our results indicate that, in addition to overall network modularity, the trophic structure of modules within food webs should be considered when making inferences about ecosystem stability.
1. Introduction
The current global rate of species extinctions is unprecedented (Ceballos et al., 2015), and there is concern that biodiversity loss will reduce ecosystem functioning and services (Schmid et al., 2009; Tilman et al., 2014). Species interaction networks are key to understanding the ecosystem-level consequences of biodiversity loss, with certain network structures helping to limit the spread of perturbations through the ecosystem (Bruder et al., 2019; Clark et al., 2020). Food webs provide tractable representations of species interactions and thereby allow us to compare the key structural features of communities that may confer stability (Ives and Carpenter, 2007; Rooney and McCann, 2012). One such stabilising feature is modularity, which is the presence of subgroups (modules) of species that interact often or strongly with one-another but have few or weak connections to species outside their subgroup (Krause et al., 2003). Modularity is believed to enhance food web stability by restricting the propagation of extinctions after a perturbation, thus buffering the wider network against disruption (Thébault and Fontaine, 2010; Stouffer and Bascompte, 2011). While common network-level properties, such as connectance or mean trophic level, are scale-dependent (Wood et al., 2015; Galiana et al., 2021), modularity is uncorrelated with species richness (Rivera-Hutinel et al., 2012; Montoya et al., 2015), facilitating structural comparisons across networks. Studies of modularity to date have generally quantified modularity in single food webs and with a variety of underlying methods, which precludes direct comparison of results across ecosystems (e.g., Rezende et al., 2009; D’Alelio et al., 2019). Assessing modularity in networks with different species assemblages would help to identify generalisable patterns in the distribution of modules, providing insight into the underlying drivers of stability.
Physical and environmental variables play a key role in determining food web structure, with habitat heterogeneity shown to increase network complexity and niche availability (Tews et al., 2004; Kortsch et al., 2019). The diversity of ecological niches and refuges present in intertidal and coastal regions may therefore increase modularity compared with more uniform offshore areas. Differences in environmental factors such as temperature and depth may also drive structural contrasts between ecosystems (Gibert, 2019; López-López et al., 2021). For example, the historically stable temperatures of Antarctic waters and their relative biotic isolation from other oceans (Murphy et al., 2007; Morley et al., 2020), might lead to less modular networks compared to lower latitudes.
Functional traits provide a framework for describing community structure, as the match between consumer and resource traits determines the distribution of feeding interactions (Bartomeus et al., 2016). A key trait underlying trophic interactions in marine systems is body size, and the relative size of consumers to their resources has been recognised as a potentially key determinant of species organisation into modules (Rezende et al., 2009; Gravel et al., 2013). The consumer-resource body mass ratio generally declines with increasing consumer size due to the higher energy demands of larger organisms, which leads to a greater reliance on proportionally larger prey (Arim et al., 2007). As larger organisms usually occur higher in the food web, the result is a negative relationship between consumer trophic level and consumer-resource body mass ratio: a macroecological pattern which is consistently found in different food webs (Jonsson et al., 2005; Tucker and Rogers, 2014). This indicates that body size could also determine the distribution of modules across trophic levels. Previous research has suggested that the level of diet contiguity in the food web may determine modularity, with modules in some networks displaying trophic clustering such that they encompass a relatively limited range of trophic levels and have low overlap of trophic levels between modules (Guimera et al., 2010; Kortsch et al., 2015). Other traits may also play an important role, with foraging habitat determining the spatial distribution of species and thus their likelihood of interacting (Rezende et al., 2009; Kortsch et al., 2019). Mobility and feeding mode also contribute to the trophic role of species within networks, by determining their activity levels and the types of resources they consume (Lazzaro et al., 2009; Gilabert et al., 2019). In fact, it has been proposed that modules in some networks represent semi-isolated energy channels, whereby energy flows from a distinct set of basal resources to an assemblage of higher consumers with a particular set of functional traits (Gauzens et al., 2015; Rodriguez et al., 2022). Clearly, despite the consensus that modularity acts to stabilise food webs, there are contrasting viewpoints on what the key determinants of modularity are and how modules are distributed within communities.
In this study, we compared the modular structure of the four most highly resolved marine food webs currently available. We quantified how differences in their spatial distribution and constituent taxonomic groups translate into the organisation of modules and the relative importance of functional traits for predicting module membership. Our primary research objectives were 1) to determine whether there are differences in the organisation of modules between networks; 2) to identify which functional traits can be used to predict the species that are included in each module.
2. Materials and methods
2.1. Study systems
Based on a review of marine food webs in the GATEWAy (Brose et al., 2019) and ECOWeB (Cohen, 2010) databases and the wider literature, we identified just four systems in which the overwhelming majority of nodes were highly resolved to genus or species level (excluding a handful of cryptic taxa and basal groups such as sediment and detritus). Aggregation of taxa in the other networks could mask potential modules and introduce methodological biases (Krause et al., 2003), so they were not considered here. The four chosen food webs represent a range of locations from the high Antarctic (Weddell Sea), and (sub)Antarctic (Scotia Sea), to temperate (Lough Hyne) and Arctic (Kongsfjorden). The networks differ in their size (number of nodes and links), spatial extent (including depth), and functional groups (Table 1). The Scotia Sea food web was obtained from the British Antarctic Survey’s UK Polar Data Centre (López-López et al., 2021), while the remaining webs were extracted from the GATEWAy database (Brose et al., 2019). Each of these networks was compiled through a combination of direct observation and diet analysis of organisms within the focal ecosystem, and wider literature research to characterise the diet of organisms in other regions or for closely related taxa. Following Grilli et al. (2016), we removed cannibalistic links in order to focus on interspecific interactions.

Table 1 Characteristics of the four study systems.
2.2. Module identification
The modularity of each food web was calculated with a Simulated Annealing algorithm using the ‘netcarto’ function in the R package ‘rnetcarto’ (Doulcier and Stouffer, 2015). This algorithm uses a probabilistic procedure whereby nodes are initially partitioned into arbitrary modules and then iteratively moved into different modules until the maximum modularity is obtained (Guimerà and Nunes Amaral, 2005; Chen et al., 2014). Modularity ranges from -1 to +1, with negative and positive values indicating a less and more modular structure than expected at random, respectively (Newman and Girvan, 2004; Newman, 2006). One hundred simulations were conducted per network to assess the variability in outputs resulting from the stochastic component of the algorithm.
2.3. Functional traits
Eight functional traits were selected to investigate the partitioning of species into modules (Table 2). These traits were chosen because they could be easily identified and generalised across all species in the four ecosystems. For each species, body mass estimates were derived from the original food web studies, and the remaining trait values were assigned based on data obtained via literature review, assessment of images, and diet compositions.
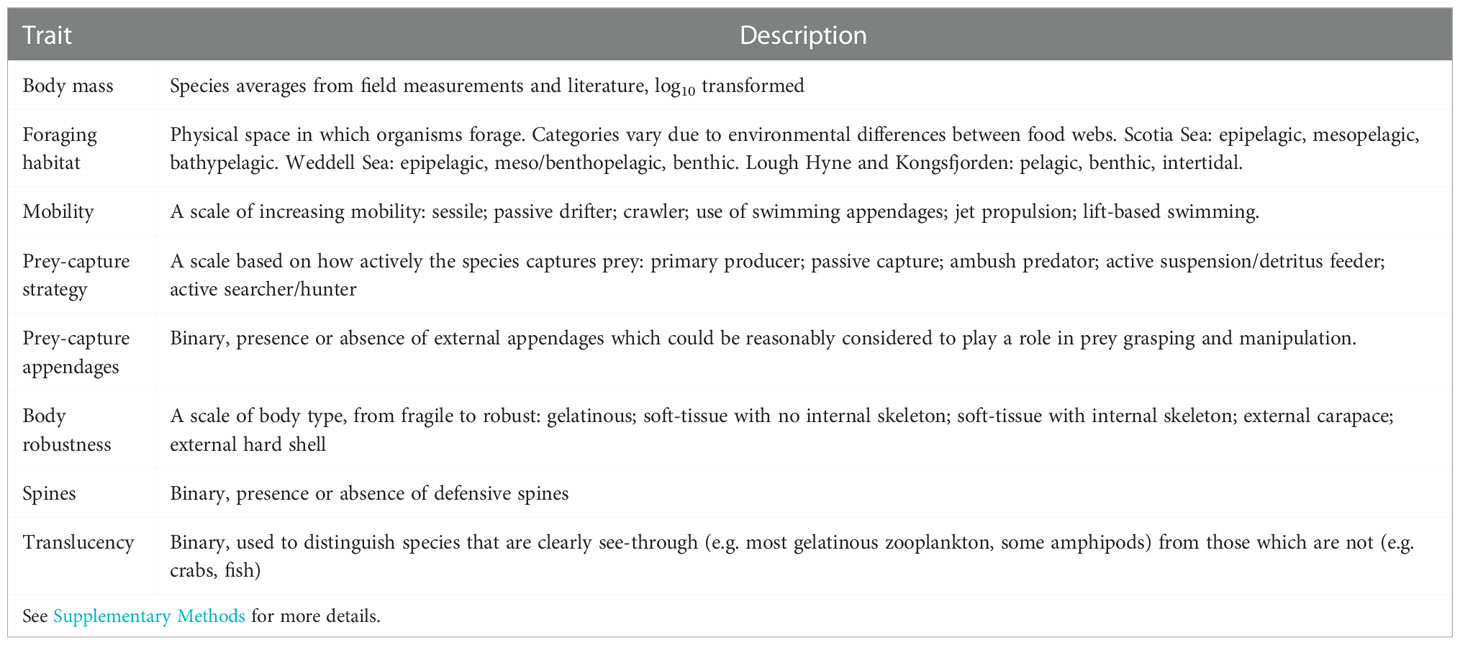
Table 2 Functional traits identified for each species in the four food webs.
2.4. Statistical analysis
All analyses were conducted in R 4.1.0 (R Core Team, 2022). Differences in the modular structure of each network were investigated by comparing the distribution of node-level metrics (prey averaged trophic level, body mass, generality, vulnerability, and omnivory) across modules. The data did not conform to normality and homogeneity of residuals, and so non-parametric Kruskal-Wallis tests were performed followed by post-hoc Dunn tests with a Bonferroni correction.
We used Random Forest (RF) models to investigate the relative roles of the functional traits in explaining the modular structure of each network. The RF model is a machine learning classification tool which uses bootstraps of the data to predict observations and provide a measure of the relative importance of predictor variables (Cutler et al., 2007). A benefit of RF models is that they make no prior assumptions about the distribution of response or predictor variables and can handle datasets containing multiple data types (Cutler et al., 2007). We implemented the conditional RF algorithm using the ‘cforest’ function in the R package ‘party’ (Hothorn et al., 2005), which relies on a conditional inference framework and is unbiased in cases where predictors have a highly variable number of categories or are correlated (Strobl et al., 2007; Strobl et al., 2008). For each food web, we implemented a cross-validation approach by randomly sub-sampling 70% of the data for model calibration and then making predictions from the remaining 30%. This process was repeated 20 times to give an indication of the variability in the classification accuracy and relative importance of each functional trait. The predictive ability of the models was assessed using the average True Skill Statistic (TSS), which represents the proportion of successful predictions versus false predictions, with values of 0 and 1 indicating completely random and perfect predictions, respectively (Allouche et al., 2006).
To further investigate the role of body size (specifically, whether size-structured feeding is related to modularity), we used analysis of covariance (ANCOVA) to test the relationship between consumer-resource body mass ratio and consumer trophic level, while distinguishing between trophic links occurring within or between different modules. The average consumer-resource body mass ratio of each consumer species was used as the dependent variable to avoid any confounding effects resulting from the fact that some consumers had many resources while others had very few. The main and interactive effects of consumer trophic level and link position (within or between modules) were the explanatory variables. Weighted Generalised Least Squares models were used, with an exponential variance structure by trophic level to account for heterogeneity in the model residuals.
3. Results
The Scotia Sea network represents a pelagic system, dominated by phytoplankton, gelatinous zooplankton, crustaceans, and fish, while benthic taxa are excluded due to the lack of available information on benthic communities. The Weddell Sea has a similar functional group composition, though it also includes many benthic species including sessile sponges, mobile detritivores, and demersal fish, in addition to incorporating mammals and seabirds. Both Lough Hyne and Kongsfjorden include a variety of benthic, intertidal and pelagic species, including macroalgae, sponges, crustaceans, and fish, in addition to seabirds and mammals. The Weddell Sea, Lough Hyne and Kongsfjorden food webs have similar maximum trophic levels (5.1, 4.6 and 4.8, respectively), while the Scotia Sea has a maximum trophic level of 6.1. The trophic distribution of species is similar in the Weddell Sea, Lough Hyne and Kongsfjorden, with most species found between trophic levels 2 and 4, while in the Scotia Sea, species are distributed quite evenly between trophic levels 2 and 5 (Figure 1). The trophic distribution of body masses is similar in all networks, with larger organisms found at higher trophic levels (Figure 1).
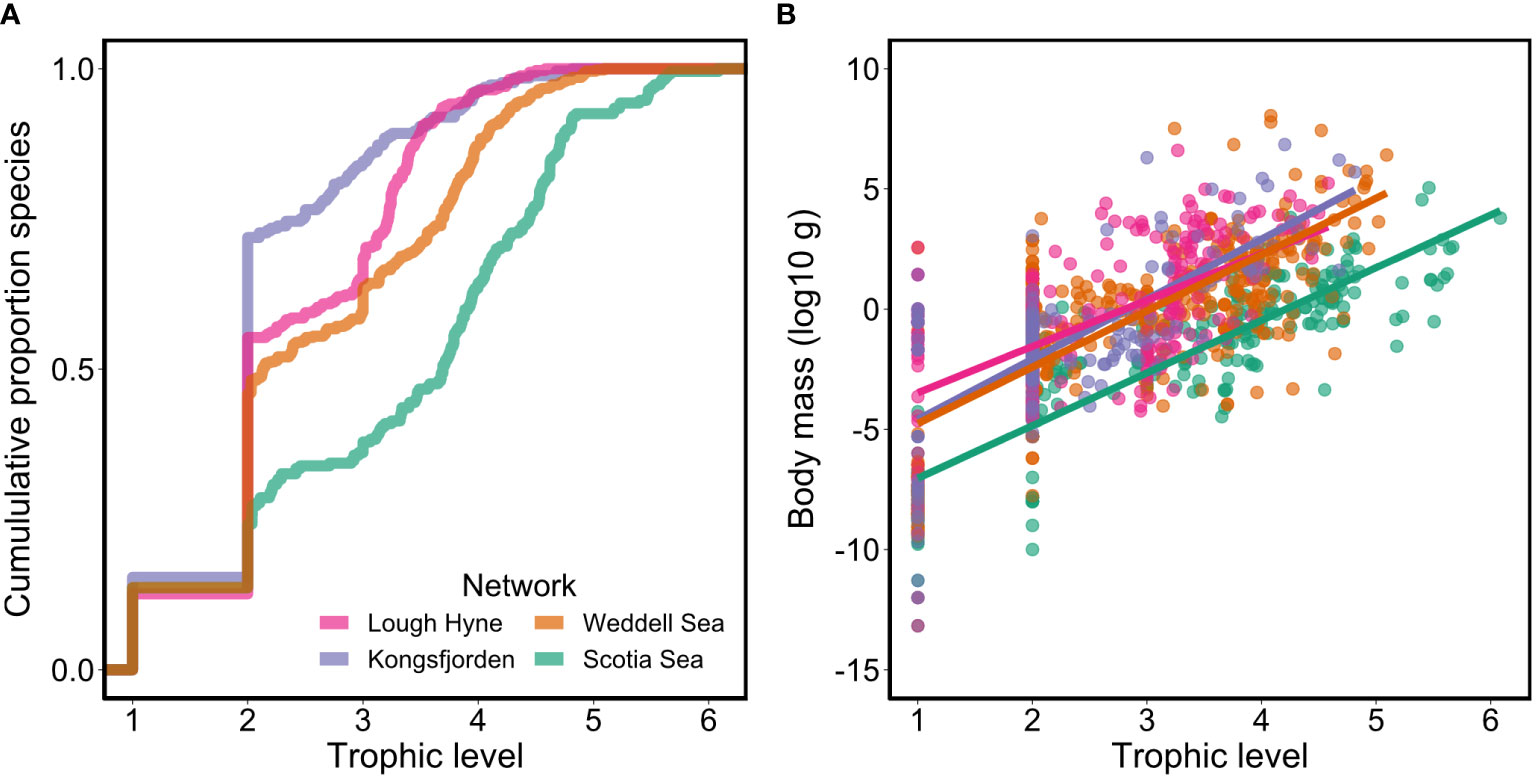
Figure 1 Plots of (A) the cumulative proportion of species across trophic levels, and (B) the distribution of body masses at each trophic level, coloured by network.
3.1. Module identification
Modularity was significantly different between all four food webs ( = 374.80, p< 0.001; Dunn’s test: p< 0.001). Three modules were identified in the Scotia Sea and Weddell Sea networks (Modularity = 0.157 ± 0.007 and 0.319 ± 0.002, respectively), while five were found in Lough Hyne and Kongsfjorden (Modularity = 0.404 ± 0.009 and 0.496 ± 0.005, respectively) (Figure 2). Energy flow between modules in the Scotia Sea and Weddell Sea was generally one-sided, with the majority of links between any pair of modules flowing in the same direction, whereas flows were more two-sided in Lough Hyne and Kongsfjorden (Figure 2). These results were deemed to be representative of the 100 Simulated Annealing runs, with at least 95% of within-module interactions found to be consistent across runs in each network (see Supplementary Methods for details of the Simulated Annealing result selection process and robustness).
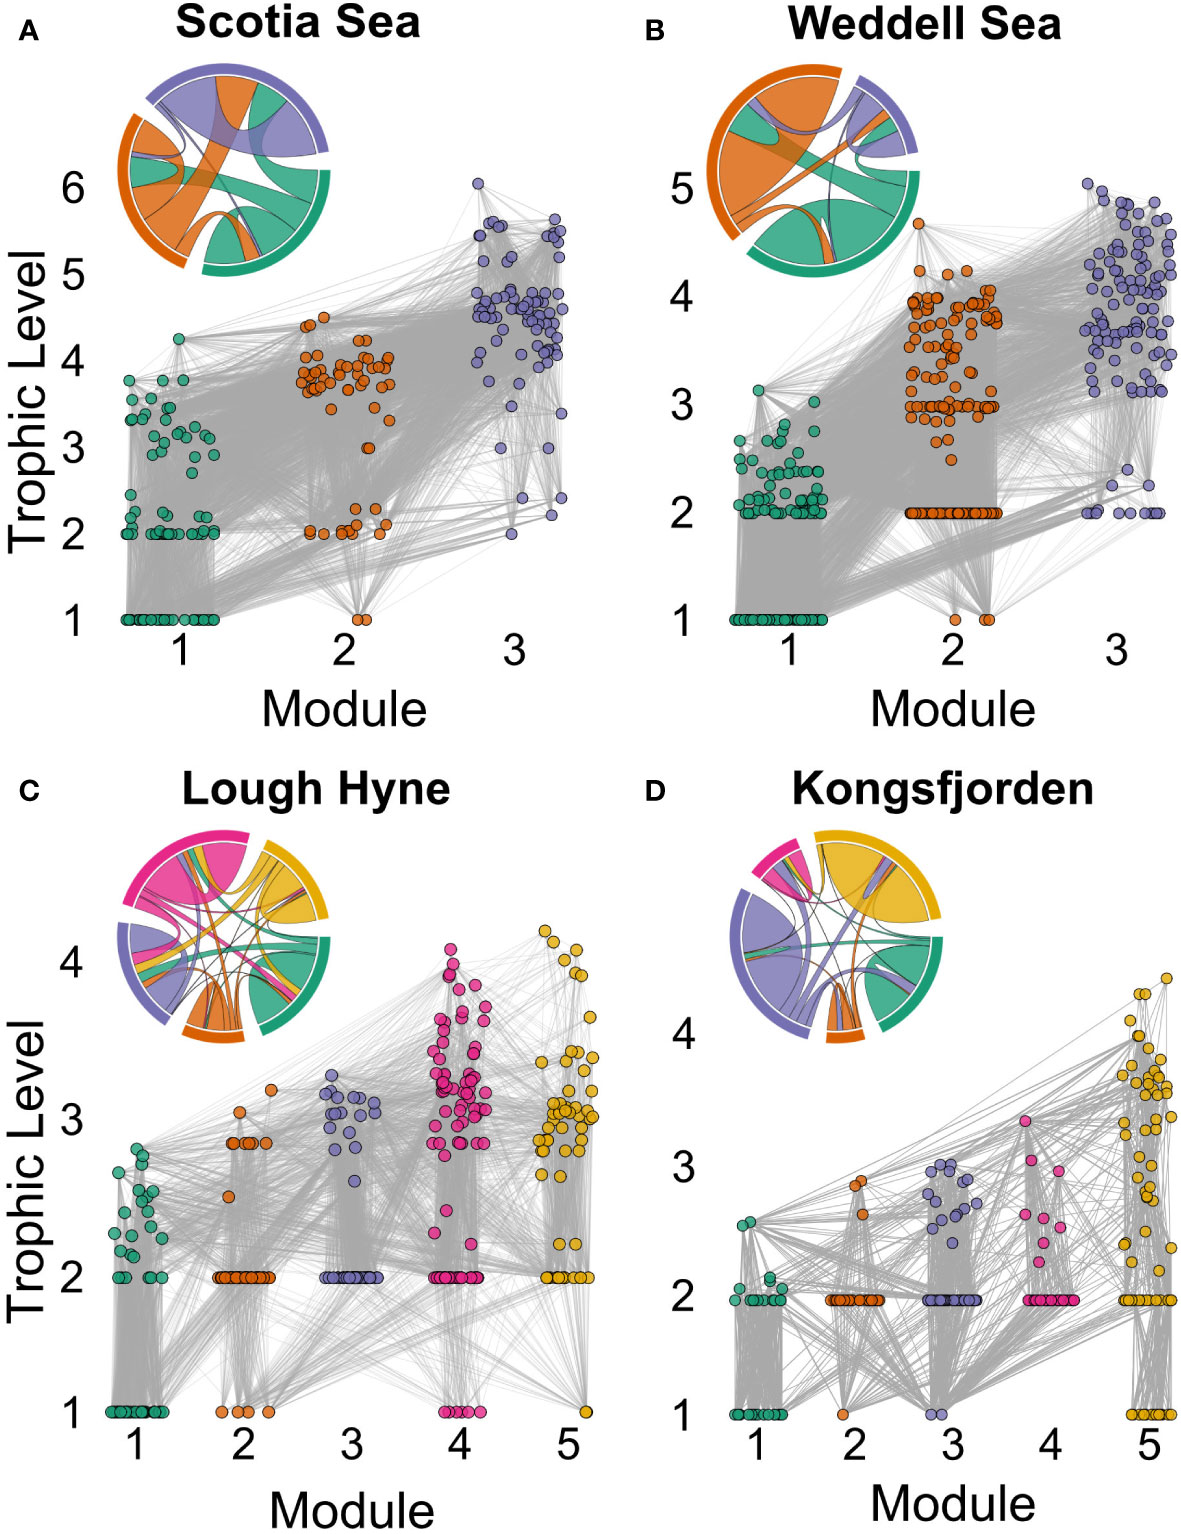
Figure 2 Modular structure of the four studied food webs: (A) Scotia Sea; (B) Weddell Sea; (C) Lough Hyne; (D) Kongsfjorden. Networks are plotted with nodes coloured and positioned along the x- and y-axes according to module and trophic level, respectively. Inset chord diagrams display the distribution of interactions within and between modules, with chord thickness proportional to the number of links and colour indicating the source module of the interactions.
Some of the networks displayed similarities in the distribution of species across modules. In both the Scotia Sea and Weddell Sea there was a basal module that contained most (>90%) of the basal resources, being made up largely of epipelagic phytoplankton and crustaceans, and a top predator module that was made up primarily of fish and squid (in addition to marine mammals and seabirds in the Weddell Sea) (Figures 3A, B). The main difference between these networks was the remaining module, which was composed primarily of gelatinous organisms and crustaceans in the Scotia Sea and benthic taxa such as echinoderms, sponges, and bryozoans in the Weddell Sea (Figures 3A, B). In both Lough Hyne and Kongsfjorden, basal resources were present in four out of five modules. In both networks there was a macrophyte module consisting largely of seaweeds and sessile algae and a module containing many benthic and intertidal amphipods, while fishes were distributed across all modules (Figures 3C, D). Both food webs contained a benthic consumer module consisting mainly of gastropods, crustaceans, and worms, and a sessile filter-feeding module composed mostly of sponges and bryozoans in Lough Hyne and of bivalves and barnacles in Kongsfjorden (Figures 3C, D). The final module in both networks was largely made up of bentho-pelagic organisms (Figures 3C, D).
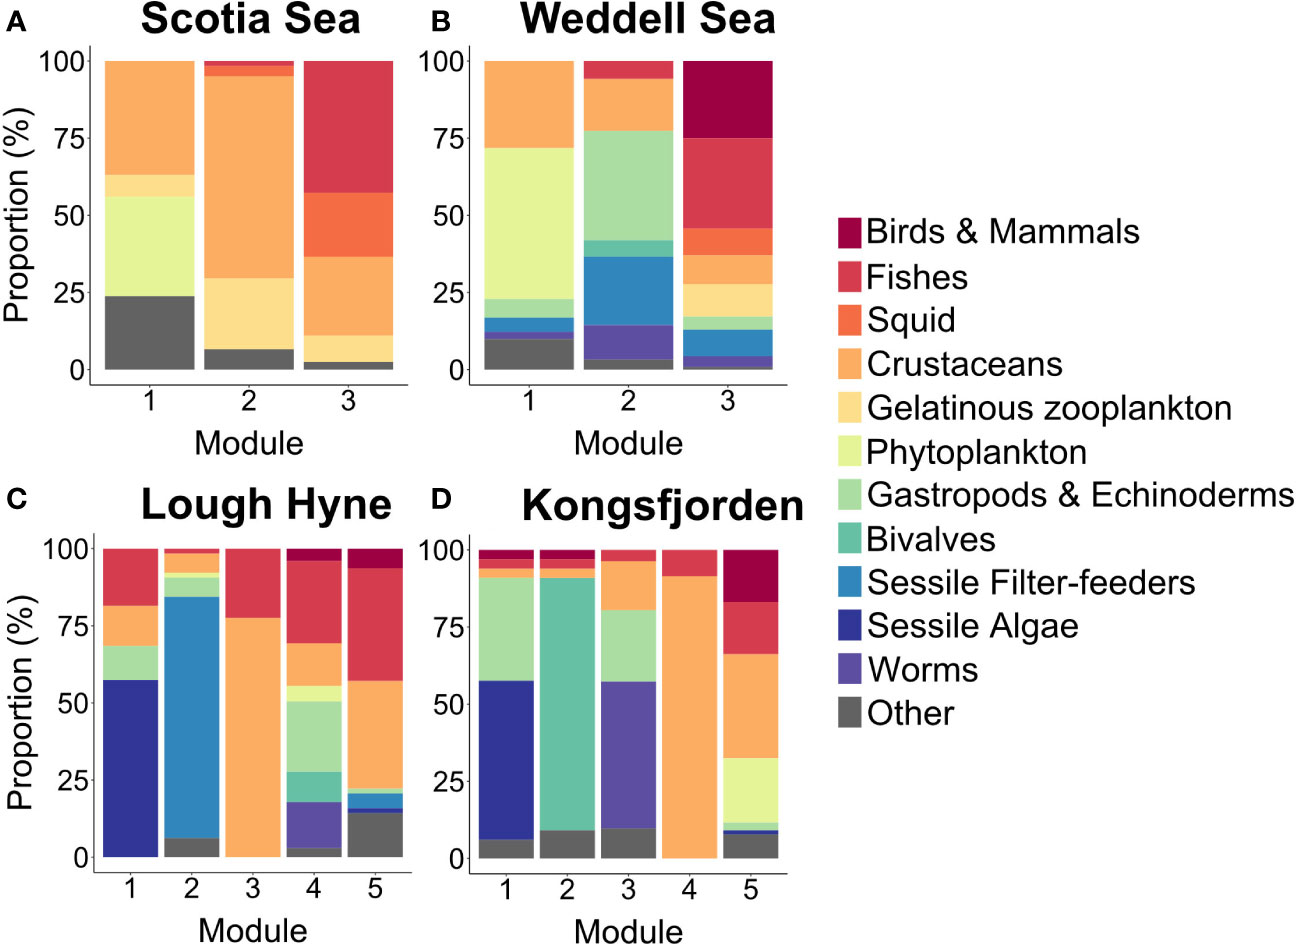
Figure 3 The relative proportion of different taxonomic groups within each module in the four food webs: (A) Scotia Sea; (B) Weddell Sea; (C) Lough Hyne; (D) Kongsfjorden. Species were initially grouped by taxonomy and then groups with few individuals were either combined (if they had similar ecology) or were assigned to the group “Other”. See Supplementary Data for an overview of species in each group.
3.2. Module topology
There was a significant difference in trophic level between modules in each of the food webs (Scotia Sea: = 147.16, p< 0.001; Weddell Sea: = 192.56, p< 0.001; Lough Hyne, = 86.643, p< 0.001; Kongsfjorden, = 16.57, p = 0.002; Figure 4). In the Scotia Sea and Weddell Sea, trophic level was significantly different among all three modules (Dunn’s test: p< 0.001), while in Lough Hyne and Kongsfjorden significant differences were only found between certain module pairs. The mean difference in trophic level between all possible species pairs which belong to separate modules was greater in the Scotia Sea (1.62, SE = 0.009) and Weddell Sea (1.43, SE = 0.004) than in Lough Hyne (0.70, SE = 0.004) and Kongsfjorden (0.44, SE = 0.005), and this pattern was retained after accounting for the effects of the differing number of modules and maximum trophic level in each network (see Supplementary Results). This highlights the greater trophic clustering of modules that is present in the Scotia Sea and Weddell Sea compared with Lough Hyne and Kongsfjorden. A comparison of the distribution of trophic levels for each module across all Simulated Annealing runs suggested that these results are robust to changes in the number of modules or distribution of nodes between modules (see Supplementary Methods). Results for the other node-level metrics (i.e. generality, vulnerability, and omnivory) generally reflect the distribution of modules across trophic levels in these networks, with clear differences between modules for the Scotia Sea and Weddell Sea, but not for Lough Hyne and Kongsfjorden (Supplementary Figures S3–S5).
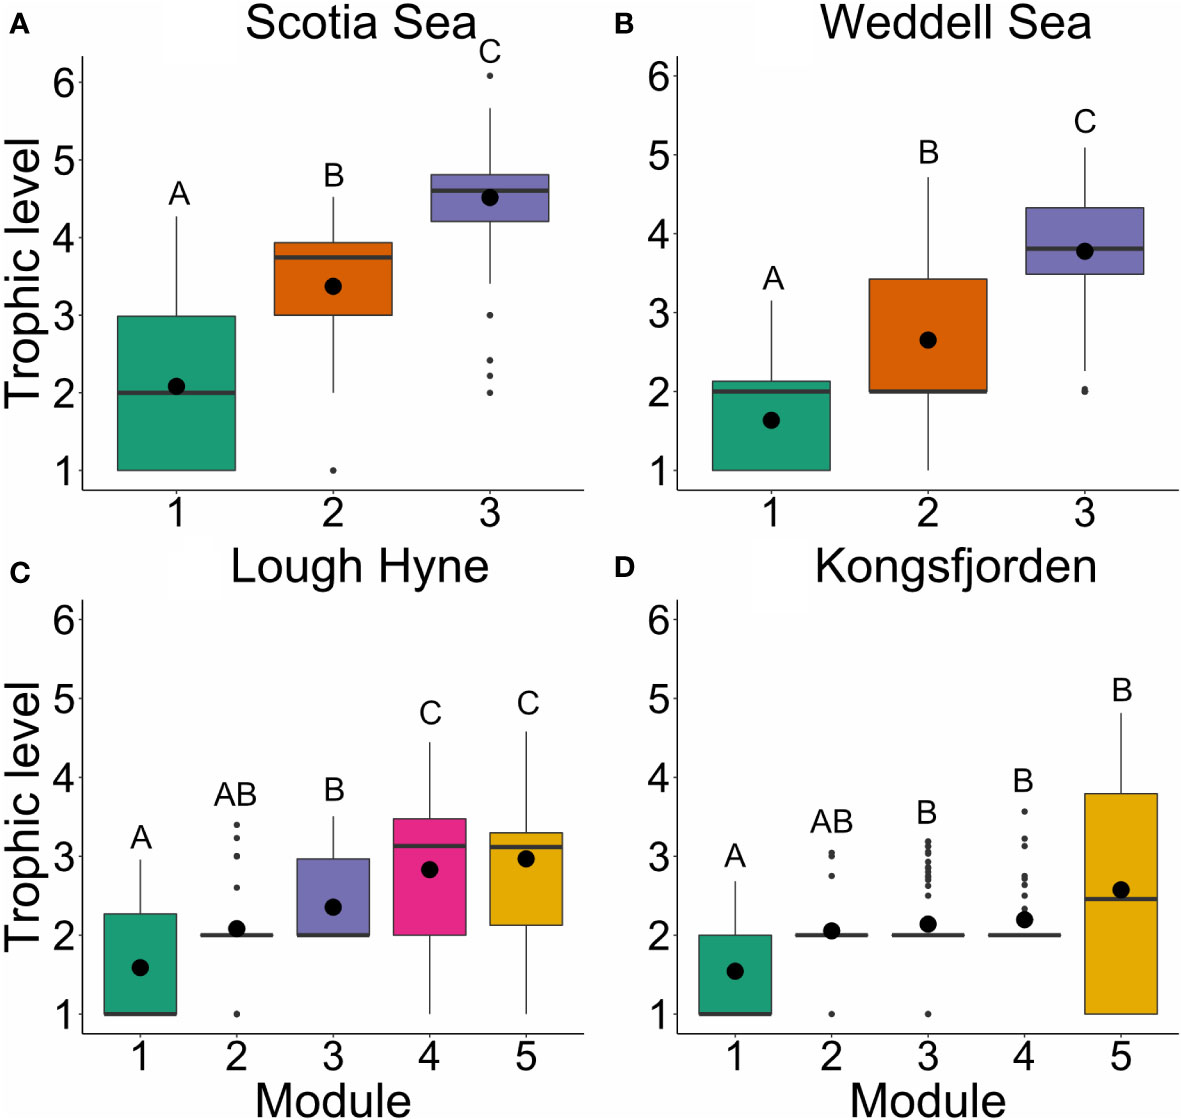
Figure 4 Boxplots of prey-averaged trophic level across modules within each network: (A) Scotia Sea; (B) Weddell Sea; (C) Lough Hyne; (D) Kongsfjorden. Large black points indicate the mean, thick horizontal lines represent the median, boxes indicate the interquartile range, whiskers are 1.5 × the interquartile range, and outliers beyond this range are indicated as small black points. Boxes not sharing a common letter are significantly different from one another using a Dunn’s test (p < 0.05).
3.3. Functional traits
The Random Forest models performed well at predicting module membership from the functional traits, as evidenced by their high TSS scores (>0.56; Figure 5). Body mass was a key trait for predicting module membership in the Scotia Sea, accounting for ~30% of overall importance, followed by habitat, mobility, feeding appendages, and translucency, which all had similar values of importance (Figure 5A). In the Weddell Sea, mobility and habitat together accounted for almost 60% of importance, and body mass was also valuable (~13% of importance, Figure 5B). In Lough Hyne and Kongsfjorden, mobility, capture strategy and habitat accounted for ~60% of the total importance, while body mass represented<10% of overall importance (Figures 5C, D).
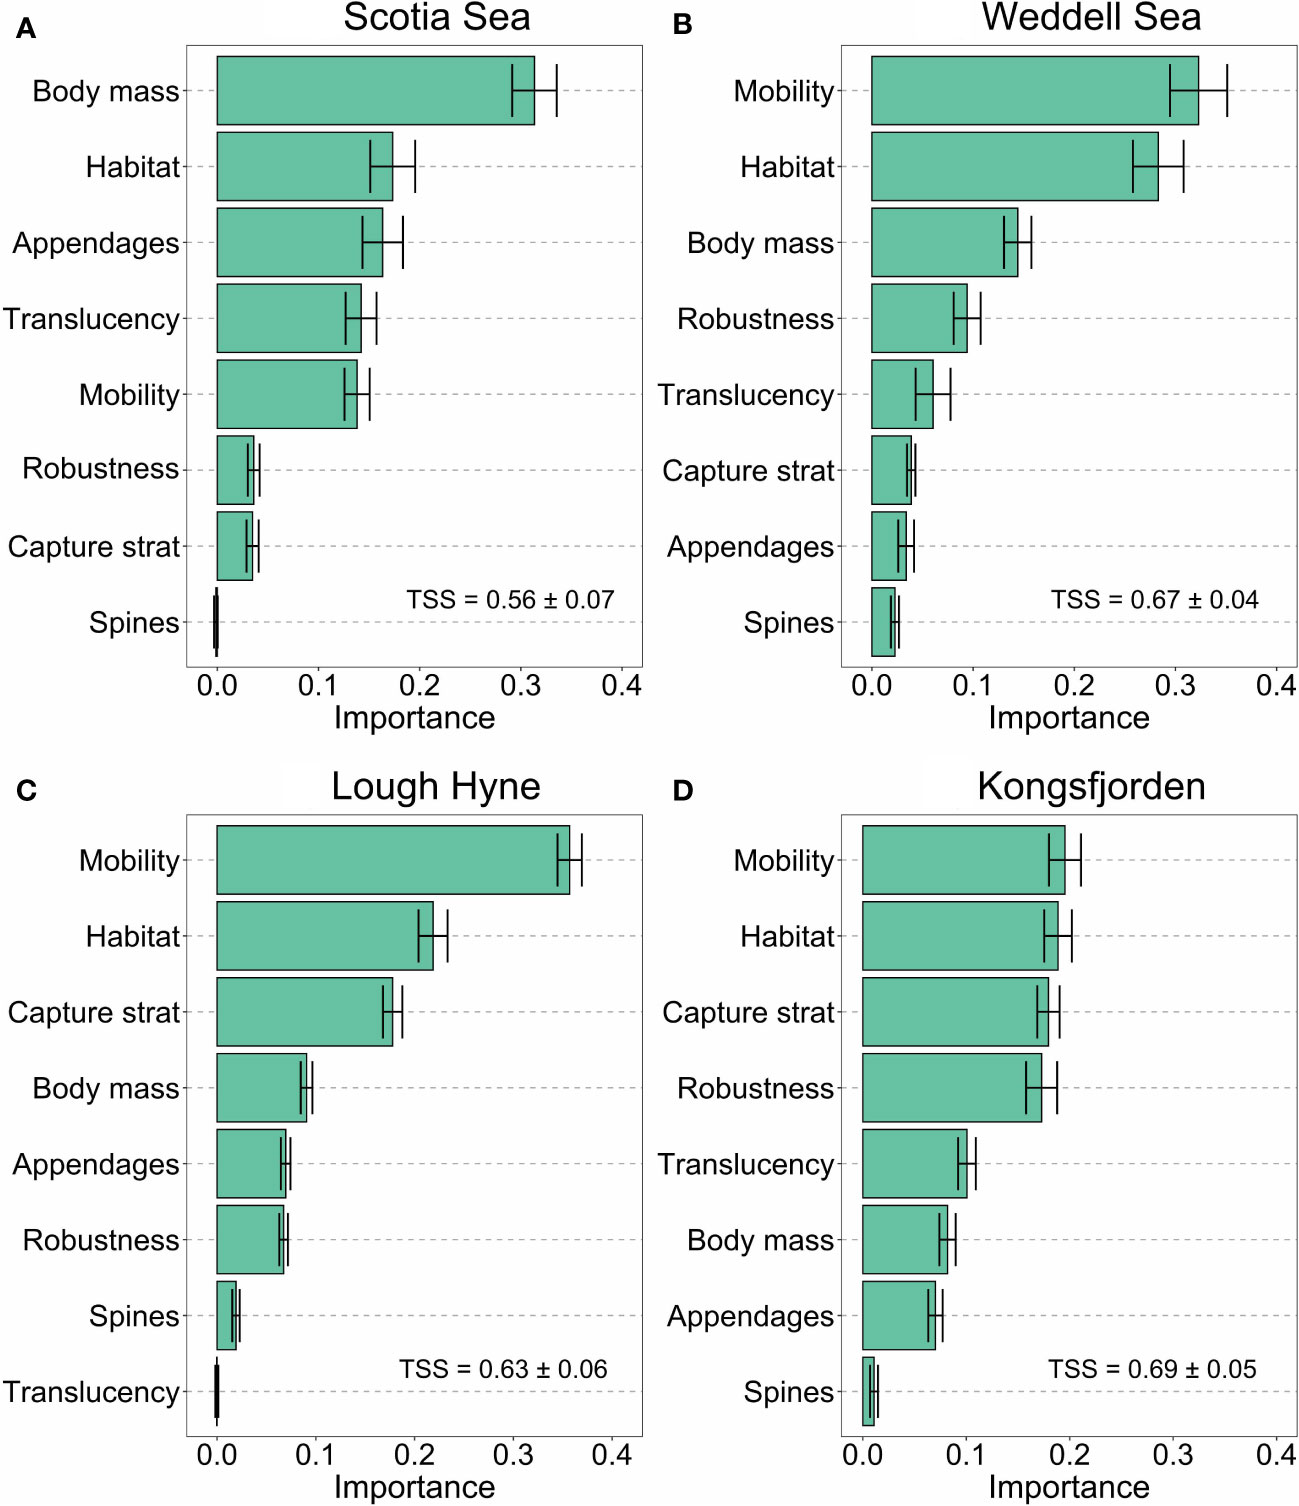
Figure 5 Relative importance of each functional trait (as a proportion of the summed importance of all traits) for classifying species into modules, as identified by Random Forest models for each network: (A) Scotia Sea; (B) Weddell Sea; (C) Lough Hyne; (D) Kongsfjorden. Error bars are the 95% confidence intervals resulting from 20 cross-validations of the importance of each trait. True Skill Statistics (TSS) values indicate the predictive performance of the model.
The importance of body mass in the Scotia Sea and Weddell Sea RF models is reflected in the distribution of sizes across modules. There was a significant difference in body mass among all modules in the Scotia Sea ( = 113.75, p< 0.001; Figure 6A) and Weddell Sea ( = 191.09, p< 0.001; Figure 6B). While the distribution of body masses was also significantly different between some modules in Lough Hyne and Kongsfjorden ( = 27.634, p< 0.001, and = 32.414, p< 0.001, respectively), modules were not as obviously separated according to body mass as in the other webs (Figures 6C, D), which also reflects the results of the RF models. A comparison of the distribution of body mass values in each module across all Simulated Annealing runs suggested that these results are robust to changes in the number of modules or distribution of nodes between modules (see Supplementary Methods). See Supplementary Figures S6–S12 for a description of the distribution of the remaining traits across modules in each network.
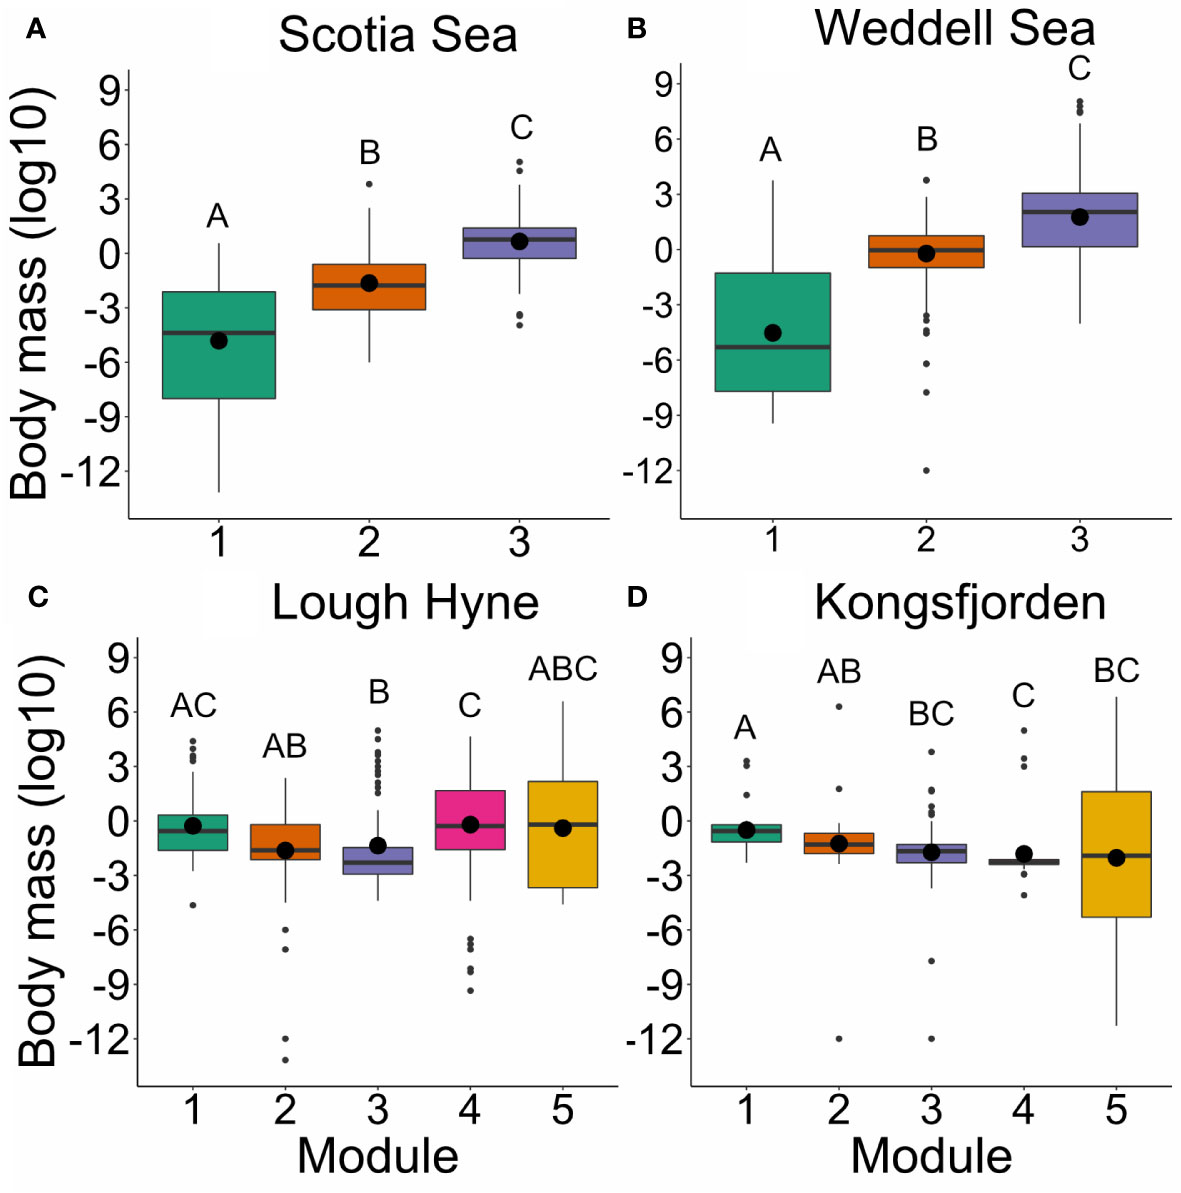
Figure 6 Boxplots of body mass across modules within each network: (A) Scotia Sea; (B) Weddell Sea; (C) Lough Hyne; (D) Kongsfjorden. Large black points indicate the mean, thick horizontal lines represent the median, boxes indicate the interquartile range, whiskers are 1.5 × the interquartile range, and outliers beyond this range are indicated as small black points. Boxes not sharing a common letter are significantly different from one another using a Dunn test (p < 0.05).
There were some key differences in the distribution of consumer-resource body mass ratios among networks (Figure 7). There was a significant interaction between consumer trophic level and link position in the Scotia Sea (F1,338 = 29.76, p< 0.001) and Weddell Sea (F1,643 = 44.53, p< 0.001). In both, consumer-resource body mass ratio declined more steeply with consumer trophic level for interactions within modules than for interactions between modules (Scotia Sea: within, p< 0.001, r2 = 0.35; between: p = 0.807; Weddell Sea: within, p< 0.001, r2 = 0.50; between, p< 0.001) (Figures 7A, B). In contrast, no significant interaction between consumer trophic level and link position was observed in Lough Hyne (F1,447 = 0.01, p = 0.919) or Kongsfjorden (F1,326 = 0.39, p = 0.531). Instead, consumer-resource body mass ratio declined significantly with increasing consumer trophic level regardless of link position in both Lough Hyne (F1,449 = 106.80, p< 0.001, r2 = 0.20) and Kongsfjorden (F1,328 = 142.66, p< 0.001, r2 = 0.27; Figures 7C, D).
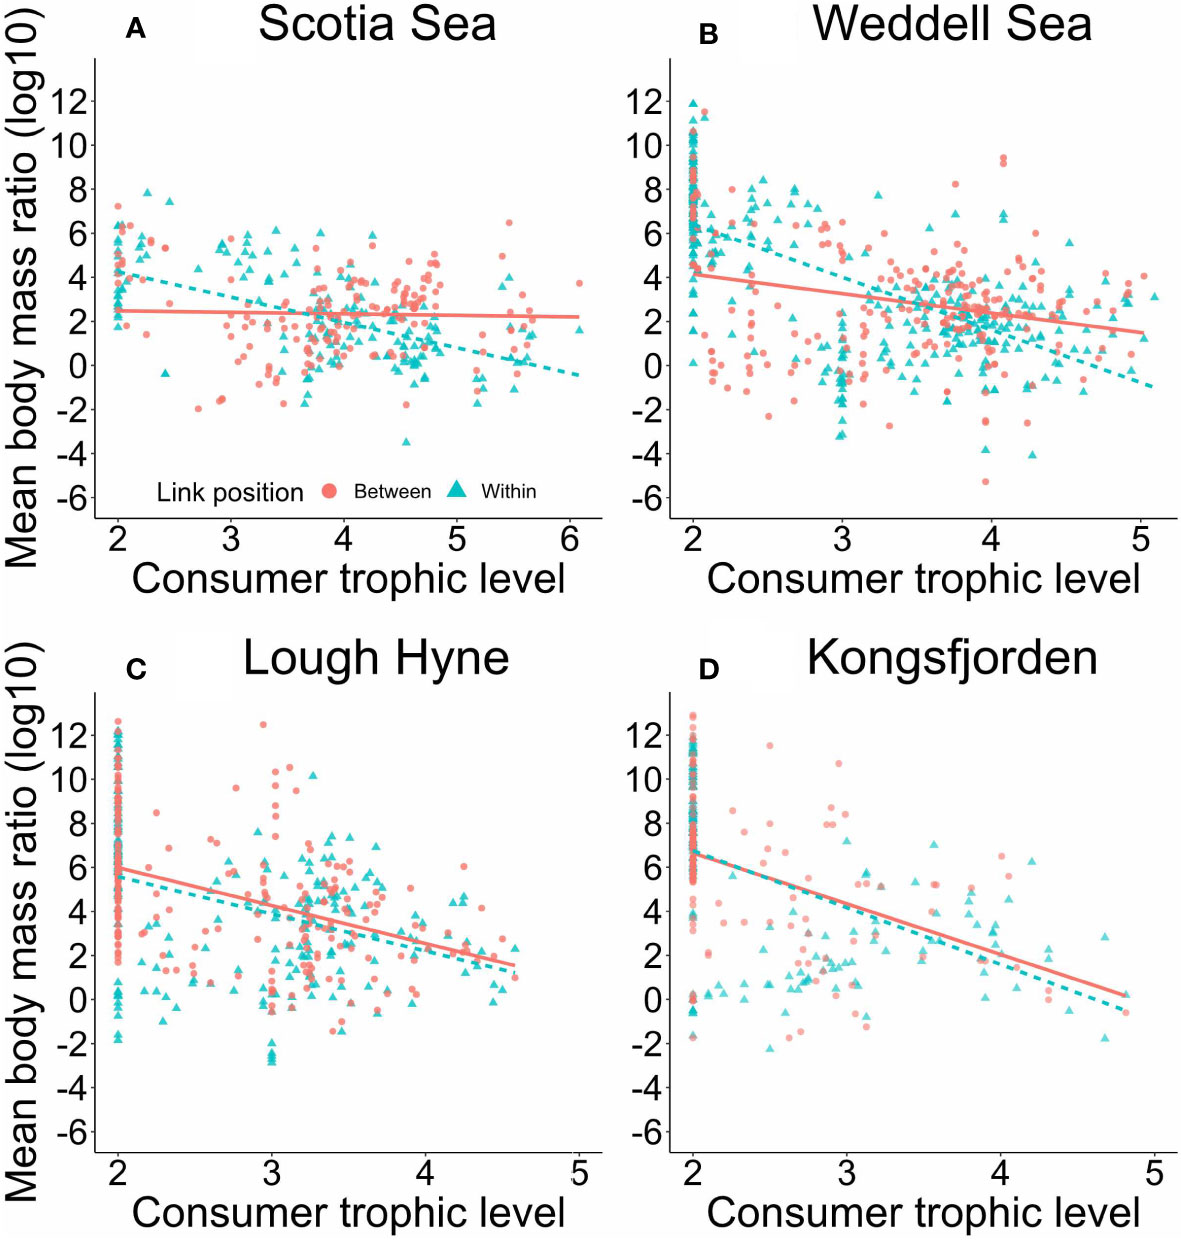
Figure 7 Average body mass ratio of every consumer to each of its resources, plotted against the trophic level of the consumer, for each network: (A) Scotia Sea; (B) Weddell Sea; (C) Lough Hyne; (D) Kongsfjorden. Point shape and colour indicate whether the focal interaction occurred among species within the same module, or between modules. There was an interactive effect of consumer trophic level and link position on consumer-resource body mass ratio for the Scotia Sea (within: y = 6.62 – 1.17x, p< 0.001, r2 = 0.35; between: y = 2.48 – 0.04x, p = 0.807, r2 = 0.01) and Weddell Sea (within: y = 11.77 – 2.59x, p< 0.001, r2 = 0.50; between: y = 5.27 – 0.70x, p< 0.001, r2 = 0.10). There was only a significant main effect of consumer trophic level on consumer-resource body mass ratio for Lough Hyne (y = 9.22 – 1.71x, p< 0.001, r2 = 0. 20) and Kongsfjorden (y = 11.64 – 2.47x, p< 0.001, r2 = 0.27).
4. Discussion
This study provides insight into the patterns and drivers of modularity in marine food webs. We found two distinct ways in which modules were organised: (1) a strong differentiation by trophic level in the Weddell Sea and Scotia Sea, matching the trophic clustering of modularity described for other food webs (Guimera et al., 2010; Kortsch et al., 2015); and (2) multiple modules spanning from distinct basal resources to higher trophic levels in Lough Hyne and Kongsfjorden, resembling the description of modules as energy channels (Gauzens et al., 2015; Zhao et al., 2018). Our results also confirm the importance of body mass and foraging habitat for determining modularity (Krause et al., 2003; Rezende et al., 2009), whilst highlighting the added importance of mobility and prey capture strategy. The strong size-structuring of modules in the Weddell Sea and Scotia Sea leads to shallower trends in consumer-resource body mass ratios with consumer trophic level for interactions between modules than those within modules. This represents a disruption to the macroecological pattern of declining consumer-resource body mass ratios with consumer trophic level observed in many food webs (Jonsson, 2014; Tucker and Rogers, 2014), suggesting that feeding interactions between modules are occurring at sub-optimal size ratios. In contrast, Lough Hyne and Kongsfjorden display weak size-structuring and show a declining relationship between consumer-resource body mass ratios and consumer trophic level both for interactions occurring within and between modules. Our results suggest contrasting mechanisms underlying the structure of marine food webs in different regions, which may affect their stability in the face of global change.
4.1. Drivers of structural differences
Strong spatial and temporal variability in abiotic conditions, such as temperature, desiccation, and salinity, can drive differentiation of ecological niches and patterns of species zonation, particularly in intertidal ecosystems (Gingold et al., 2010; Kraan et al., 2013; Gallucci et al., 2020). Intertidal and benthic community composition is also shaped by habitat heterogeneity, which determines the distribution of traits such as mobility and feeding mode (Pacheco et al., 2011; Buhl-Mortensen et al., 2012; Srinivas et al., 2020). In contrast, offshore ecosystems are generally considered less complex with major structuring environmental gradients (e.g. light, temperature, pressure) changing predictably with depth (López-López et al., 2021), and may therefore display stronger size-structuring of trophic interactions. As the breadth of available niches increases with environmental, habitat, and resource heterogeneity, food webs may become more modular and separated into distinct energy channels. In highly heterogeneous environments, module membership may therefore be determined primarily by traits specific to the environmental niche, such as prey capture strategy and mobility, rather than by more general structuring factors such as body mass. Below, we explore this hypothesis in the context of our focal food webs.
The Scotia Sea network represents a pelagic oceanic ecosystem, and the Weddell Sea network represents a deep shelf system incorporating both pelagic and benthic shelf species. The offshore nature of these networks means that basal resources are limited largely to phytoplankton and detritus, with both networks excluding the pronounced heterogeneity of the intertidal zone. The Antarctic Circumpolar Current also provides these Southern Ocean ecosystems with relatively stable and predictable oceanographic conditions (Murphy et al., 2007; Morley et al., 2020), which might help to drive the similarity in modular organisation. Both ecosystems experience a high degree of connectivity, with large-scale diurnal vertical migrations in the Scotia Sea and strong bentho-pelagic coupling in the Weddell Sea (Piatkowski et al., 1994; La Mesa et al., 2019; Pineda-Metz, 2020). This may result in a stronger interdependence between modules in both ecosystems, as the deeper top-predator modules rely on the energy generated in the near-surface basal resource modules, linked via the diurnal migrators or bentho-pelagic couplers. This might reduce the influence of factors like habitat heterogeneity and prey capture strategy, with depth-based foraging habitat and size-based prey-handling constraints becoming the primary factors structuring modularity in both networks. The additional importance of mobility in the Weddell Sea largely reflects the distinct locomotory methods used in the different modules, i.e., sessile or crawling organisms in the benthic module, drifting phytoplankton and primary consumers with appendages in the epipelagic basal module, and mobile swimmers in the top predator module.
In contrast, Lough Hyne and Kongsfjorden are semi-enclosed coastal ecosystems which encompass both the intertidal and subtidal zones and experience high environmental variability. Kongsfjorden is subject to significant seasonal inputs of terrestrial nutrients (Calleja et al., 2017; Retelletti Brogi et al., 2019), and experiences strong gradients in turbidity, temperature, and salinity due to glacial inputs and influxes from the West Spitsbergen Current (Hop et al., 2002; Calleja et al., 2017). As a result, there are significant differences in community composition and abundance at different locations within the fjord (Hop et al., 2002; Calleja et al., 2017). Lough Hyne experiences high terrestrial nutrient loads (Jessop et al., 2011), in addition to significant pH gradients, high variability in water temperature, and seasonal hypoxia at depth (Bell, 2002; Sullivan et al., 2014), which are also likely to drive spatial contrasts in community structure. The presence of the physically complex and variable intertidal zone, and the fluctuating environmental conditions may promote the differentiation of ecological niches. This could drive the diversity of energy channels centred around different types of basal resources, supporting species with a mix of foraging behaviours, mobilities, and habitat traits (Gauzens et al., 2015; Rodriguez et al., 2022).
4.2. Implications for food web stability
Modules partially isolate sections of the food web from one another, and thereby reduce the propagation of perturbations and maintain the functioning of the wider network (Stouffer and Bascompte, 2011). Previous studies have used overall network modularity to make inferences regarding their stability and functioning (e.g., Stouffer and Bascompte, 2011; Grilli et al., 2016; D’Alelio et al., 2019), but there has been little consideration of how the positioning of modules across trophic levels might alter stability. Our results suggest that, in networks with strong trophic clustering of modules, inter-module energy flows will be key to maintaining consumer populations and providing top-down regulation. Any perturbation affecting species in one module will have consequent effects on those in other modules, thus undermining the potential stabilising effect of modularity. The trophic clustering of modules also has implications for stabilising consumer-resource mass ratios, which are generally greatest near the base of the food web and decrease at higher trophic levels (Jonsson, 2014; Tucker and Rogers, 2014). This is because larger consumers need to consume larger prey to maximise energy intake and handling efficiency, such that optimal prey size gets closer to the size of the predator as its trophic level increases (Costa, 2009). We found this pattern only exists for interactions within modules in networks that exhibit strong trophic (size) structuring of modularity, while many interactions between modules may be allometrically sub-optimal. For example, a predator in a lower-level module may be too small to handle prey from a higher-level module, while prey in lower-level modules may be too small to provide enough energy for predators in higher-level modules. This may reduce the redundancy of alternative pathways for energy flow in the food web by constraining consumers largely to within-module prey choices. Furthermore, the allometric scaling of metabolism and consumption rates means that consumer-resource body mass ratios can determine the strength of trophic interactions (Emmerson and Raffaelli, 2004; Vucic-Pestic et al., 2010). An environmental perturbation which results in prey loss from a given module may therefore have a strong destabilising effect as predators are forced to feed on sub-optimal prey sizes to compensate, thereby also disrupting the distribution of strong and weak interactions within the food web.
In contrast, food webs with modules that represent semi-isolated food chains may be more robust to perturbations, as species extinctions in a given module will not impact the supply of energy to species in other modules. This structure maintains the negative relationship between consumer-resource mass ratio and consumer trophic level, regardless of whether consumers interact with resources within or between modules, because such modules encompass species at a broad range of trophic levels and body masses. This means consumers are allometrically unconstrained in their ability to feed on species in different modules and may be able to adapt their feeding behaviour in response to perturbations within their own module. For example, while the loss of key basal resources from an individual module could have detrimental consequences for the specialised primary consumers in that module, higher predators may be able to maintain sufficient energy intake by feeding on species from other modules. This is analogous to fast and slow energy channels coupled by mobile predators, which promote stability by generating asynchronously fluctuating resources that dampen variation in consumer populations (Rooney et al., 2008; McCann and Rooney, 2009). The stabilising effect of modular energy channels could be tested by simulating food webs with different distributions of modules and running analyses such as sequential node deletions to compare the relative effects of overall modularity and module distribution on network robustness (Dunne et al., 2004). It is important that such analyses incorporate link weighting and indirect effects such as population dynamics to avoid the underestimation of secondary extinctions (Zhao et al., 2016).
4.3. Further considerations
We provide an exploration of the potential mechanisms underlying the modular structure of marine food webs, but more highly resolved networks across a range of ecosystem types are necessary to generalise our results. While most nodes were resolved to the genus or species level, a small minority of basal and consumer groups in each network were subject to greater aggregation. It has previously been suggested that certain topological metrics such as linkage density and mean chain length are sensitive to the level of aggregation employed, though there has been no explicit investigation of the effects on modularity (Martinez, 1993). However, it has also been demonstrated that there is no consistent relationship between species richness and modularity at different scales (Montoya et al., 2015); This suggests that slight underestimations of the number of species (and links) resulting from species aggregation are unlikely to have a material impact on the resulting modular structure of our focal networks.
A further unknown is the effect of different data compilation approaches on network structure. Each of the focal food webs was compiled using species- and region -specific diet information, but also broader literature sources spanning variable taxonomic and spatial resolutions, which increases the level of uncertainty over some interactions. However, modularity has been found to be relatively robust to variation in sampling effort (Rivera-Hutinel et al., 2012), and each of the focal ecosystems has been subject to extensive long-term sampling whereby the ecology of most constituent species is well understood. The underlying core species list and structure of each of our focal networks is therefore likely to be robust to minor variation in the distribution and number of interactions and nodes. We encourage researchers to provide information regarding the number of data sources used to determine the diet composition of each species and some indication of sampling completeness (e.g. yield-effort curves), and to ensure minimal and comparable levels of taxonomic aggregation, as these efforts will facilitate the assessment of the comparability of network structures (Martinez, 1993; Gauzens et al., 2013). While network size alone does not drive modularity (Rivera-Hutinel et al., 2012; Montoya et al., 2015), contrasts between our study datasets may have arisen from a combination of natural and arbitrary differences in the scale at which the network is considered. In this study, the two offshore food webs had arbitrary differences in their boundaries and constituent species (e.g. omission of the sea floor, marine mammals, and seabirds in the Scotia Sea), but their modular structure was still consistent, which provides some confidence in our ability to detect overarching trends despite methodological differences. Food web modules have been found to represent distinct functional groups (i.e. groups of species with similar ecological functions such as pollination, herbivory, predation etc.; Montoya et al., 2015). Therefore, there is a risk that omitting species with certain characteristics when describing food webs means we only capture part of the processes structuring ecosystems, and that our perception of modularity or stability is influenced by the scale at which the network is considered. This is a topic which merits further investigation and should certainly be discussed when comparing networks.
5. Conclusion
This study provides insight into the underlying drivers of modularity in marine food webs through the comparison of multiple highly resolved networks. Modules in relatively stable offshore environments appear to be structured largely by body mass, while those in more heterogeneous coastal and intertidal settings are organised according to the broader diversity of ecological niches and feeding modes. The resulting differences in modular structure (i.e. trophic clustering of modules versus differentiation into energy channels) could underpin ecosystem responses to species loss and other perturbations, and suggests that traditional modularity metrics do not fully represent the stability of food webs. Further testing of the link between the distribution of modules and the degree of network robustness (e.g., using simulated networks and species extinction scenarios) will ensure that we continue to make progress towards gaining a comprehensive understanding of the underlying determinants of network stability.
Data availability statement
The original contributions presented in the study are included in the article/Supplementary Material. Further inquiries can be directed to the corresponding author.
Author contributions
Study conceived by PE-K, EO'G, and SH. Analyses conducted by PE-K. All authors contributed to the article and approved the submitted version.
Funding
This work was supported by the Natural Environment Research Council and the ARIES Doctoral Training Partnership [grant number NE/S007334/1]. SH was supported by the UKRI Natural Environment Research Council (NERC) through the British Antarctic Survey (BAS) ALI-Science Southern Ocean ecosystems project.
Conflict of interest
The authors declare that the research was conducted in the absence of any commercial or financial relationships that could be construed as a potential conflict of interest.
Publisher’s note
All claims expressed in this article are solely those of the authors and do not necessarily represent those of their affiliated organizations, or those of the publisher, the editors and the reviewers. Any product that may be evaluated in this article, or claim that may be made by its manufacturer, is not guaranteed or endorsed by the publisher.
Supplementary material
The Supplementary Material for this article can be found online at: https://www.frontiersin.org/articles/10.3389/fmars.2022.1046150/full#supplementary-material
References
Allouche O., Tsoar A., Kadmon R. (2006). Assessing the accuracy of species distribution models: prevalence, kappa and the true skill statistic (TSS). J. Appl. Ecol. 43 (6), 1223–1232. doi: 10.1111/j.1365-2664.2006.01214.x
Arim M., Bozinovic F., Marquet P. A. (2007). On the relationship between trophic position, body mass and temperature: reformulating the energy limitation hypothesis. Oikos 116 (9), 1524–1530. doi: 10.1111/j.0030-1299.2007.15768.x
Bartomeus I., Gravel D., Tylianakis J. M., Aizen M. A., Dickie I. A., Bernard-Verdier M. (2016). A common framework for identifying linkage rules across different types of interactions. Funct. Ecol. 30 (12), 1894–1903. doi: 10.1111/1365-2435.12666
Bell J. J. (2002). Morphological responses of a cup coral to environmental gradients. Sarsia 87 (4), 319–330. doi: 10.1080/00364820260400825
Brose U., Archambault P., Barnes A. D., Bersier L.-F., Boy T., Canning-Clode J., et al. (2019). Predator traits determine food-web architecture across ecosystems. Nat. Ecol. Evol. 3 (6), 919–927. doi: 10.1038/s41559-019-0899-x
Bruder A., Frainer A., Rota T., Primicerio R. (2019). The importance of ecological networks in multiple-stressor research and management. Front. Environ. Sci. 7. doi: 10.3389/fenvs.2019.00059
Buhl-Mortensen L., Buhl-Mortensen P., Dolan M. F. J., Dannheim J., Bellec V., Holte B. (2012). Habitat complexity and bottom fauna composition at different scales on the continental shelf and slope of northern Norway. Hydrobiologia 685 (1), 191–219. doi: 10.1007/s10750-011-0988-6
Calleja M. L., Kerhervé P., Bourgeois S., Kędra M., Leynaert A., Devred E., et al. (2017). Effects of increase glacier discharge on phytoplankton bloom dynamics and pelagic geochemistry in a high Arctic fjord. Prog. Oceanogr. 159, 195–210. doi: 10.1016/j.pocean.2017.07.005
Ceballos G., Ehrlich P. R., Barnosky A. D., García A., Pringle R. M., Palmer T. M. (2015). Accelerated modern human–induced species losses: Entering the sixth mass extinction. Sci. Adv. 1 (5), e1400253. doi: 10.1126/sciadv.1400253
Chen M., Kuzmin K., Szymanski B. K. (2014). Community detection via maximization of modularity and its variants. IEEE Trans. Comput. Soc. Syst. 1 (1), 46–65. doi: 10.1109/tcss.2014.2307458
Clark J. S., Scher C. L., Swift M. (2020). The emergent interactions that govern biodiversity change. Proc. Natl. Acad. Sci. 117 (29), 17074–17083. doi: 10.1073/pnas.2003852117
Cohen J. E. (2010). Ecologists’ Co-operative web bank. version 1.1. machine-readable database of food webs. New York: The Rockefeller University.
Costa G. C. (2009). Predator size, prey size, and dietary niche breadth relationships in marine predators. Ecology 90 (7), 2014–2019. doi: 10.1890/08-1150.1
Cutler D. R., Edwards T. C., Beard K. H., Cutler A., Hess K. T., Gibson J., et al. (2007). Random forests for classification in ecology. Ecology 88 (11), 2783–2792. doi: 10.1890/07-0539.1
D’Alelio D., Hay Mele B., Libralato S., Ribera d’Alcala M., Jordan F. (2019). Rewiring and indirect effects underpin modularity reshuffling in a marine food web under environmental shifts. Ecol. Evol. 9 (20), 11631–11646. doi: 10.1002/ece3.5641
Doulcier G., Stouffer D. (2015). Rnetcarto: Fast Network Modularity and Roles Computation by Simulated Annealing. R package version 0.2.4.). CRAN package repository.
Dunne J., Williams R., Martinez N. (2004). Network structure and robustness of marine food webs. Mar. Ecol. Prog. Ser. 273, 291–302. doi: 10.3354/meps273291
Emmerson M. C., Raffaelli D. (2004). Predator-prey body size, interaction strength and the stability of a real food web. J. Anim. Ecol. 73 (3), 399–409. doi: 10.1111/j.0021-8790.2004.00818.x
Galiana N., Barros C., Braga J., Ficetola G. F., Maiorano L., Thuiller W., et al. (2021). The spatial scaling of food web structure across European biogeographical regions. Ecography 44 (5), 653–664. doi: 10.1111/ecog.05229
Gallucci F., Christofoletti R. A., Fonseca ,. G., Dias G. M. (2020). The effects of habitat heterogeneity at distinct spatial scales on hard-Bottom-Associated communities. Diversity 12 (1), 39. doi: 10.3390/d12010039
Gauzens B., Legendre S., Lazzaro X., Lacroix G. (2013). Food-web aggregation, methodological and functional issues. Oikos 122 (11), 1606–1615. doi: 10.1111/j.1600-0706.2013.00266.x
Gauzens B., Thebault E., Lacroix G., Legendre S. (2015). Trophic groups and modules: two levels of group detection in food webs. J. R Soc. Interface 12 (106), 20141176. doi: 10.1098/rsif.2014.1176
Gibert J. P. (2019). Temperature directly and indirectly influences food web structure. Sci. Rep. 9 (1), 1–8. doi: 10.1038/s41598-019-41783-0
Gilabert O. R., Navia A. F., de la Cruz-Agüero G., Molinero J. C., Sommer U., Scotti M. (2019). Body size and mobility explain species centralities in the gulf of California food web. Community Ecol. 20 (2), 149–160. doi: 10.1556/168.2019.20.2.5
Gingold R., Mundo-Ocampo M., Holovachov O., Rocha-Olivares A. (2010). The role of habitat heterogeneity in structuring the community of intertidal free-living marine nematodes. Mar. Biol. 157 (8), 1741–1753. doi: 10.1007/s00227-010-1447-z
Gravel D., Poisot T., Albouy C., Velez L., Mouillot D. (2013). Inferring food web structure from predator-prey body size relationships. Methods Ecol. Evol. 4 (11), 1083–1090. doi: 10.1111/2041-210x.12103
Grilli J., Rogers T., Allesina S. (2016). Modularity and stability in ecological communities. Nat. Commun. 7 (1), 12031. doi: 10.1038/ncomms12031
Guimerà R., Nunes Amaral L. A. (2005). Functional cartography of complex metabolic networks. Nature 433(7028), 895–900. doi: 10.1038/nature03288
Guimera R., Stouffer D. B., Sales-Pardo M., Leicht E. A., Newman M. E. J. (2010). Origin of compartmentalization in food webs. Ecology 91 (10), 2941–2951. doi: 10.1890/09-1175.1
Hop H., Pearson T., Hegseth E. N., Kovacs K. M., Wiencke C., Kwasniewski S., et al. (2002). The marine ecosystem of kongsfjorden, Svalbard. Polar Res. 21 (1), 167–208. doi: 10.3402/polar.v21i1.6480
Hothorn T., Bühlmann P., Dudoit S., Molinaro A., van der Laan M. J. (2005). Survival ensembles. Biostatistics 7 (3), 355–373. doi: 10.1093/biostatistics/kxj011
Ives A. R., Carpenter S. R. (2007). Stability and diversity of ecosystems. Science 317, 58–61. doi: 10.1126/science.1133258
Jessop M., McAllen R., O’Halloran J., Kelly T. (2011). “Nutrient and ecosystem dynamics in ireland’s only marine nature reserve (NEIDIN),” in EPA STRIVE programme 2007–2013. (School of Biological, Earth and Environmental Sciences, University College Cork).
Jonsson T. (2014). Trophic links and the relationship between predator and prey body sizes in food webs. Community Ecol. 15 (1), 54–64. doi: 10.1556/comec.15.2014.1.6
Jonsson T., Cohen J. E., Carpenter S. R. (2005). Food webs, body size, and species abundance in ecological community description. Adv. Ecol. Res. 36 (36), 1–84. doi: 10.1016/S0065-2504(05)36001-6
Kortsch S., Primicerio R., Aschan M., Lind S., Dolgov A. V., Planque B. (2019). Food-web structure varies along environmental gradients in a high-latitude marine ecosystem. Ecography 42 (2), 295–308. doi: 10.1111/ecog.03443
Kortsch S., Primicerio R., Fossheim M., Dolgov A. V., Aschan M. (2015). Climate change alters the structure of arctic marine food webs due to poleward shifts of boreal generalists. Proc. R. Soc. B: Biol. Sci. 282 (1814), 20151546. doi: 10.1098/rspb.2015.1546
Kraan C., Aarts G., Piersma T., Dormann C. F. (2013). Temporal variability of ecological niches: a study on intertidal macrobenthic fauna. Oikos 122 (5), 754–760. doi: 10.1111/j.1600-0706.2012.20418.x
Krause A. E., Frank K. A., Mason D. M., Ulanowicz R. E., Taylor W. W. (2003). Compartments revealed in food-web structure. Nature 426 (6964), 282–285. doi: 10.1038/nature02115
La Mesa M., Piepenburg D., Pineda-Metz S. E. A., Riginella E., Eastman J. T. (2019). Spatial distribution and habitat preferences of demersal fish assemblages in the southeastern weddell Sea (Southern ocean). Polar Biol. 42 (5), 1025–1040. doi: 10.1007/s00300-019-02495-3
Lazzaro X., Lacroix G., Gauzens B., Gignoux J., Legendre S. (2009). Predator foraging behaviour drives food-web topological structure. J. Anim. Ecol. 78 (6), 1307–1317. doi: 10.1111/j.1365-2656.2009.01588.x
López-López L., Genner M. J., Tarling G. A., Saunders R. A., O’Gorman E. J. (2021). Ecological networks in the Scotia Sea: Structural changes across latitude and depth. Ecosystems 25(2), 457–470. doi: 10.1007/s10021-021-00665-1
Martinez N. D. (1993). Effects of resolution on food web structure. Oikos 66, 403–412. doi: 10.2307/3544934
McCann K. S., Rooney N. (2009) The more food webs change, the more they stay the same. Philos. Trans. R. Soc. B: Biol. Sci. 364(1524), 1789–1801 doi: 10.1098/rstb.2008.0273
Montoya D., Yallop M. L., Memmott J. (2015). Functional group diversity increases with modularity in complex food webs. Nat. Commun. 6 (1), 7379. doi: 10.1038/ncomms8379
Morley S. A., Abele D., Barnes D. K. A., Cárdenas C. A., Cotté C., Gutt J., et al. (2020). Global drivers on southern ocean ecosystems: Changing physical environments and anthropogenic pressures in an earth system. Front. Mar. Sci. 7. doi: 10.3389/fmars.2020.547188
Murphy E. J., Watkins J. L., Trathan P. N., Reid K., Meredith M. P., Thorpe S. E., et al. (2007). Spatial and temporal operation of the Scotia Sea ecosystem: a review of large-scale links in a krill centred food web. Philos. Trans. R. Soc. B: Biol. Sci. 362 (1477), 113–148. doi: 10.1098/rstb.2006.1957
Newman M. E. (2006). Modularity and community structure in networks. PNAS 103 (23), 8577–8582. doi: 10.1073/pnas.0601602103
Newman M. E., Girvan M. (2004). Finding and evaluating community structure in networks. Phys. Rev. E Stat. Nonlin. Soft Matter Phys. 69 (2 Pt 2), 26113. doi: 10.1103/PhysRevE.69.026113
Pacheco A. S., González M. T., Bremner J., Oliva M., Heilmayer O., Laudien J., et al. (2011). Functional diversity of marine macrobenthic communities from sublittoral soft-sediment habitats off northern Chile. Helgoland Mar. Res. 65 (3), 413–424. doi: 10.1007/s10152-010-0238-8
Piatkowski U., Rodhouse P. G., White M. G., Bone D. G., Symon C. (1994). Nekton community of the Scotia Sea as sampled by the RMT 25 during austral summer. Mar. Ecol. Prog. Ser. 112, 13–28. doi: 10.3354/meps112013
Pineda-Metz S. E. A. (2020). Benthos-pelagos interconnectivity: Antarctic shelf examples. In: Jungblut S., Liebich V., Bode-Dalby M. (eds) YOUMARES 9 - The Oceans: Our Research, Our Future. Springer International Publishing211-223 (Springer International Publishing), 211–23. doi: 10.1007/978-3-030-20389-4_11
R Core Team (2022). R: Language and environment for statistical computing (Vienna, Austria: R Foundation for Statistical Computing). Available at: https://www.R-project.org/.
Retelletti Brogi S., Jung J. Y., Ha S. Y., Hur J. (2019). Seasonal differences in dissolved organic matter properties and sources in an Arctic fjord: Implications for future conditions. Sci. Total Environ. 694, 133740. doi: 10.1016/j.scitotenv.2019.133740
Rezende E. L., Albert E. M., Fortuna M. A., Bascompte J. (2009). Compartments in a marine food web associated with phylogeny, body mass, and habitat structure. Ecol. Lett. 12 (8), 779–788. doi: 10.1111/j.1461-0248.2009.01327.x
Rivera-Hutinel A., Bustamante R. O., Marín V. H., Medel R. (2012). Effects of sampling completeness on the structure of plant–pollinator networks. Ecology 93 (7), 1593–1603. doi: 10.1890/11-1803.1
Rodriguez I. D., Marina T. I., Schloss I. R., Saravia L. A. (2022). Marine food webs are more complex but less stable in sub-Antarctic (Beagle channel, Argentina) than in Antarctic (Potter cove, Antarctic peninsula) regions. Mar. Environ. Res. 174, 105561. doi: 10.1016/j.marenvres.2022.105561
Rooney N., McCann K. S. (2012). Integrating food web diversity, structure and stability. Trends Ecol. Evol. 27 (1), 40–46. doi: 10.1016/j.tree.2011.09.001
Rooney N., McCann K. S., Moore J. C. (2008). A landscape theory for food web architecture. Ecol. Lett. 11 (8), 867–881. doi: 10.1111/j.1461-0248.2008.01193.x
Schmid B., Balvanera P., Cardinale B. J., Godbold J., Pfisterer A. B., Raffaelli D., et al. (2009). “Consequences of species loss for ecosystem functioning: meta-analyses of data from biodiversity experiments,” in Biodiversity, ecosystem functioning, and human wellbeing: An ecological and economic perspective. Eds. Shahid Naeem D. E. B., Hector A., Loreau M., Perrings C. (Oxford Scholarship Online: Oxford University Press, Oxford), 14–29.
Srinivas T., Sukumaran S., Neetu S., Ramesh Babu K. (2020). Diversity and functional patterns of benthic amphipods in the coralline intertidal zones of a marine national park, India. Front. Mar. Sci. 7. doi: 10.3389/fmars.2020.589195
Stouffer D. B., Bascompte J. (2011). Compartmentalization increases food-web persistence. Proc. Natl. Acad. Sci. U.S.A. 108 (9), 3648–3652. doi: 10.1073/pnas.1014353108
Strobl C., Boulesteix A.-L., Kneib T., Augustin T., Zeileis A. (2008). Conditional variable importance for random forests. BMC Bioinf. 9 (1), 307. doi: 10.1186/1471-2105-9-307
Strobl C., Boulesteix A.-L., Zeileis A., Hothorn T. (2007). Bias in random forest variable importance measures: Illustrations, sources and a solution. BMC Bioinf. 8 (1), 25. doi: 10.1186/1471-2105-8-25
Sullivan T., Byrne C., Harman L., Davenport J., McAllen R., Regan F. (2014). Determination of spatial and temporal variability of pH and dissolved oxygen concentrations in a seasonally hypoxic semi-enclosed marine basin using continuous monitoring. Anal. Methods 6 (15), 5489–5497. doi: 10.1039/c3ay42162g
Tews J., Brose U., Grimm V., Tielbörger K., Wichmann M. C., Schwager M., et al. (2004). Animal species diversity driven by habitat heterogeneity/diversity: the importance of keystone structures. J. Biogeogr. 31 (1), 79–92. doi: 10.1046/j.0305-0270.2003.00994.x
Thébault E., Fontaine C. (2010). Stability of ecological communities and the architecture of mutualistic and trophic networks. Science 329, 853–856. doi: 10.1126/science.1188321
Tilman D., Isbell F., Cowles J. M. (2014). Biodiversity and ecosystem functioning. Annu. Rev. Ecol. Evol. System. 45, 471–493. doi: 10.1146/annurev-ecolsys-120213-091917
Tucker M. A., Rogers T. L. (2014). Examining predator–prey body size, trophic level and body mass across marine and terrestrial mammals. Proc. R. Soc. B: Biol. Sci. 281(1797), 20142103. doi: 10.1098/rspb.2014.2103
Vucic-Pestic O., Rall B. C., Kalinkat G., Brose U. (2010). Allometric functional response model: body masses constrain interaction strengths. J. Anim. Ecol. 79 (1), 249–256. doi: 10.1111/j.1365-2656.2009.01622.x
Wood S. A., Russell R., Hanson D., Williams R. J., Dunne J. A. (2015). Effects of spatial scale of sampling on food web structure. Ecol. Evol. 5 (17), 3769–3782. doi: 10.1002/ece3.1640
Zhao L., Zhang H., O’Gorman E. J., Tian W., Ma A., Moore J. C., et al. (2016). Weighting and indirect effects identify keystone species in food webs. Ecol. Lett. 19 (9), 1032–1040. doi: 10.1111/ele.12638
Keywords: energy channels, functional traits, stability, modules, network structure, trophic interactions, predator-prey mass ratio
Citation: Eskuche-Keith P, Hill SL, Hollyman P, Taylor ML and O’Gorman EJ (2023) Trophic structuring of modularity alters energy flow through marine food webs. Front. Mar. Sci. 9:1046150. doi: 10.3389/fmars.2022.1046150
Received: 16 September 2022; Accepted: 05 December 2022;
Published: 12 January 2023.
Edited by:
Alberto Basset, University of Salento, ItalyReviewed by:
Stuart James Kininmonth, The University of Queensland, AustraliaEdoardo Calizza, Sapienza University of Rome, Italy
Copyright © 2023 Eskuche-Keith, Hill, Hollyman, Taylor and O’Gorman. This is an open-access article distributed under the terms of the Creative Commons Attribution License (CC BY). The use, distribution or reproduction in other forums is permitted, provided the original author(s) and the copyright owner(s) are credited and that the original publication in this journal is cited, in accordance with accepted academic practice. No use, distribution or reproduction is permitted which does not comply with these terms.
*Correspondence: Patrick Eskuche-Keith, cC5rZWl0aEBlc3NleC5hYy51aw==