 Hongrui Zhang
 Ismael Torres-Romero
 Pien Anjewierden
 Madalina Jaggi
94% of researchers rate our articles as excellent or good
Learn more about the work of our research integrity team to safeguard the quality of each article we publish.
Find out more
METHODS article
Front. Mar. Sci., 22 December 2022
Sec. Marine Biogeochemistry
Volume 9 - 2022 | https://doi.org/10.3389/fmars.2022.1045634
This article is part of the Research TopicBiological Models for the Study of Ocean Acidification: From Molecules to EcosystemsView all 5 articles
Ocean acidification increases pCO2 and decreases pH of seawater and its impact on marine organisms has emerged as a key research focus. In addition to directly measured variables such as growth or calcification rate, stable isotopic tracers such as carbon isotopes have also been used to more completely understand the physiological processes contributing to the response of organisms to ocean acidification. To simulate ocean acidification in laboratory cultures, direct bubbling of seawater with CO2 has been a preferred method because it adjusts pCO2 and pH without altering total alkalinity. Unfortunately, the carbon isotope equilibrium between seawater and CO2 gas has been largely ignored so far. Frequently, the dissolved inorganic carbon (DIC) in the initial seawater culture has a distinct 13C/12C ratio which is far from the equilibrium expected with the isotopic composition of the bubbled CO2. To evaluate the consequences of this type of experiment for isotopic work, we measured the carbon isotope evolutions in two chemostats during CO2 bubbling and composed a numerical model to simulate this process. The isotopic model can predict well the carbon isotope ratio of dissolved inorganic carbon evolutions during bubbling. With help of this model, the carbon isotope evolution during a batch and continuous culture can be traced dynamically improving the accuracy of fractionation results from laboratory culture. Our simulations show that, if not properly accounted for in experimental or sampling design, many typical culture configurations involving CO2 bubbling can lead to large errors in estimated carbon isotope fractionation between seawater and biomass or biominerals, consequently affecting interpretations and hampering comparisons among different experiments. Therefore, we describe the best practices on future studies working with isotope fingerprinting in the ocean acidification background.
The ocean acidification problem is becoming more and more serious with the continuous increase of atmospheric CO2 from fossil fuel burning. Ocean acidification can be defined as the increase of dissolved CO2 (CO2(aq)) and consequent decrease of pH in seawater, with increases of dissolved inorganic carbon (DIC) but little variations in total alkalinity (Gattuso and Hansson, 2011). In the last two decades, thousands of studies have been carried out to study the ocean acidification effects on different marine organisms which have been reviewed and synthesized (e.g., Hoegh-Guldberg et al., 2007; Riebesell and Tortell, 2011; Meyer and Riebesell, 2015; Lemasson et al., 2017). These studies have shown that ocean acidification has complex effects on marine calcifiers (Figuerola et al., 2021), non-calcifying marine life (Hurd et al., 2019), and therefore profound impact on marine ecosystems and ocean carbon cycles (Mostofa et al., 2016). Over the past decade, more studies have employed isotopic methods in laboratory cultures to trace the ratio of stable isotopes. The variations of stable isotopes could reveal important physiological responses to ocean acidification beyond, for instance, growth rate, cell size, or elemental stoichiometry. Moreover, predicting these isotopic variations is crucial to calibrate new proxies for reconstructing the atmospheric CO2 concentration in geological history (Hopkinson et al., 2011; Wilkes et al., 2017; Nishida et al., 2020; Phelps et al., 2021; Remize et al., 2021).
Laboratory culture is a key method to study the physiological effect of ocean acidification on different marine life. There are multiple methods to achieve the target culture media CO2(aq) and carbonate chemistry depending on the objectives of the study. The principal methods are (1) manipulating pH by adding acid/base, (2) manipulating DIC through addition of HCO3- or CO32- and (3) bubbling (or aeration) a gas of desired pCO2 concentration (Gattuso et al., 2010). The method of bubbling cultures with CO2 requires gas mixing to obtain the desired CO2 level and humidification to prevent evaporation from culture media. Adding acid/base removes the mechanical stress upon cells from bubbles and benefits from relatively easy operations; however, it could cause shifts of alkalinity and does not reproduce the actual mechanism by which DIC concentration increases in the ongoing Ocean Acidification. Both bubbling and acid-base manipulation can well simulate the CO2 increase and pH decrease effects in laboratory culture, but the CO2 bubbling method has been preferred by some studies because it alone can perfectly replicate the current ocean acidification caused by anthropogenic CO2 without changing the seawater total alkalinity.
For the CO2 bubbling method, the guidebook by Riebesell et al. (2011), covering the methods of laboratory culture for ocean acidification research, highlighted the importance of pre-equilibrating the culture media to the required CO2 concentration by aerating it ‘for a few days’. Considering the wide range of culture vessel shapes and volumes among experiments, our question is how long culture media should be bubbled in order to reach an ordinary chemical and isotopic balance. Some published works mentioned the pre-bubbling durations, for example, the seawater was pre-bubbled for 2 days (Iglesias-Rodriguez et al., 2008), while most publications did not fully describe their methods. Moreover, the isotopic equilibration times are usually much longer than the ordinary chemical equilibration times, because, to reach isotopic equilibrium, each ion and molecule should be fully exchanged and come to equilibrium with other ions and molecules (Mills and Urey, 1940). For the works focusing on organic or carbonate carbon isotope fractionations under different CO2 levels, culture media with out of equilibrium or dynamic carbon isotope ratio of DIC could complicate or even preclude the interpretation of stable isotope fractionation signatures.
In this study, we provide a thorough characterization of the isotopic equilibration process in CO2 bubbling experiments and the factors that influence the carbon isotopic equilibration time, in order to clearly document the approaches needed to accurately infer carbon isotopic fractionations in experiments with bubbling. First, we compose numerical models to simulate chemical and isotopic equilibration during bubbling processes in two different systems and present the effects of seawater volume, gas exchange rate, and difference between the isotopic composition of the bubbled CO2 and that of the media’s DIC on the equilibration time. Secondly, we complete a series of bubbling experiments in a photobioreactor to test the performance of the model simulation. Finally, we evaluate the expected consequences of equilibration time in typical experimental bubbling setups for which carbon isotopic ratios of cultured biomass or biominerals have been reported. With the guide of this study, future works can trace the isotopic fingerprint of ocean acidification on marine biomass better.
We have conducted experiments in commercial photobioreactors of 1 L and 3 L (PBR FMT 150, Photon Systems International) designed for continuous culture. The aeration system allowed gas to first enter the bottom of a bottle with fresh media (‘bottle’ in Figure 1A), where gas humidification and the first exchange of gases occurred. The gas subsequently flowed out towards the photobioreactor where a sparging tube dispersed the bubbles, exchanging gases a second time. Finally, gas flowed to the waste bottle, and from there out of the system (Figure 1A). The photobioreactor compartments were monitored without inoculated cells in batch mode in order to assess the dynamics of the bubbling process itself. The two different photobioreactor sizes and CO2 concentrations employed in this study can be found in Table 1.
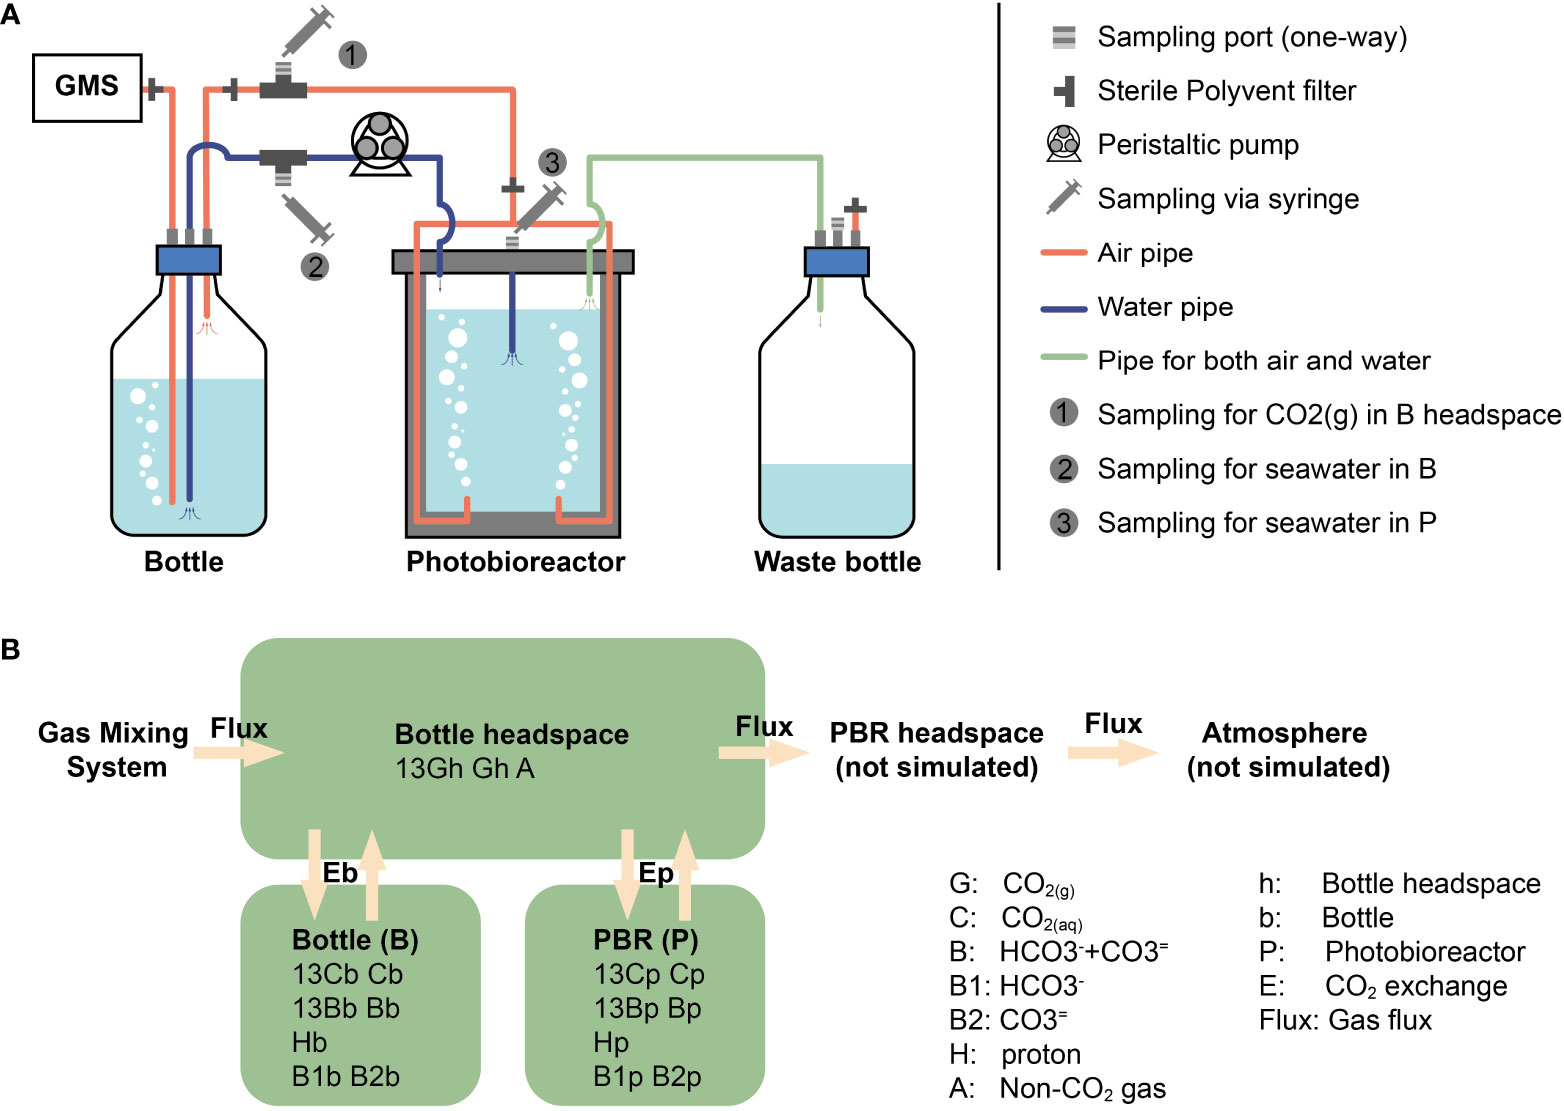
Figure 1 The photobioreactor system with CO2 bubbling and model structure. (A) The photobioreactor system in Climate Geology laboratory, ETH Zurich. GMS means Gas Mixing System. (B) Our model consists of three compartments: bottle headspace, bottle media and photobioreactor media (words in bold). PBR is the photobioreactor. The other terms are simulated amount/concentration of substance, in which capital letters represent substance and subscript letters are abbreviation for compartments.
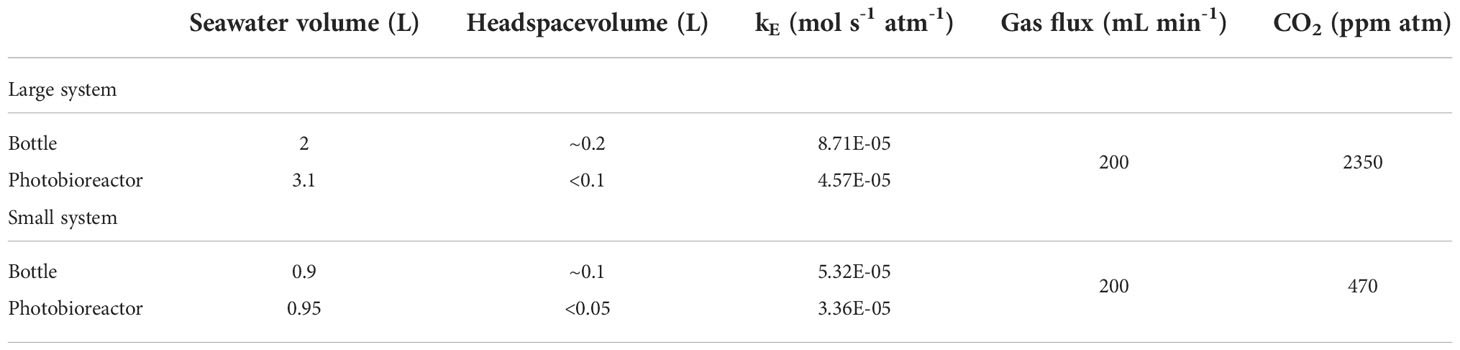
Table 1 Parameters for photobioreactor systems.
For the different CO2 concentration treatments, two compressed gases, pure CO2 with a δ13C of -2.8‰ (Vienna Pee Dee Belemnite, VPDB) and CO2-free synthetic air (Air Liquide), were mixed with a Gas Mixing System (GMS-150, Photon Systems Instruments). GMS output flow and pCO2 composition were further verified with a flowmeter and a cavity ringdown spectrometer isotopic and gas concentration analyzer (G2131-i, Picarro, Inc. USA). Measurements of the Picarro CO2 analyzer were corrected with CO2 mixtures with certified concentrations and isotopic composition (Air Liquide).
Photobioreactors and bottles were filled with K/2 media without Tris buffer which was made by artificial seawater (ASW) with nutrient and trace metals (Keller et al., 1987). For the convenience of description, the terms of media, ASW and seawater will be treated equally to the K/2 media in the following without specific mention. The detailed recipe is described in Appendix A. Prior to filtration, 10 L artificial seawater (ASW) was supplemented with 20.48 mL 2M Na2CO3 and 2.90 ml 37% HCl to raise alkalinity above 4 mmol kg-1 seawater. This operation of increasing alkalinity is specialized to maintain the growth pH in high CO2 treatment. The salinity of ASW would increase slightly from 34.97 to 35.53 g kg-1 and this increment in salinity could be ignored during the carbon system calculations.
Concentration of DIC in seawater and concentration and carbon isotope ratio of CO2 in headspace were monitored with an Apollo SciTech DIC-C13 Analyzer coupled to the Picarro CO2 analyzer using in-house NaHCO3 standards dissolved in deionized water at different known concentrations and δ13C values from -4.66 to -7.94‰. δ13C-DIC in media were measured with a Gas Bench II with an autosampler (CTC Analytics AG, Switzerland) coupled to ConFlow IV Interface and a Delta V Plus mass spectrometer (Thermo Fischer Scientific). The system and abovementioned in-house standards were calibrated using international standards NBS 18 (-5.014‰) and NBS 19 (+1.95‰). The analytical error for CO2(g) concentration is <20 ppm and that for DIC concentration and δ13C is <10 μM and 0.1‰, respectively.
Our initial δ13C of un-bubbled DIC (at t0) is -6.1 ± 0.2‰. Before and after the start of bubbling at a flow of 200 ± 20 mL min-1, both headspace and seawater media of the upstream bottle and the photobioreactor were sampled by a 50-mL syringe through one-way sampling ports. The sampling time in each experiment can be found in Tables 2, 3. To measure headspace CO2(g) that had been humidified and exchanged with bottle media, gas flow was directed into a syringe and 50 mL of gas were injected into the Picarro CO2 analyzer.
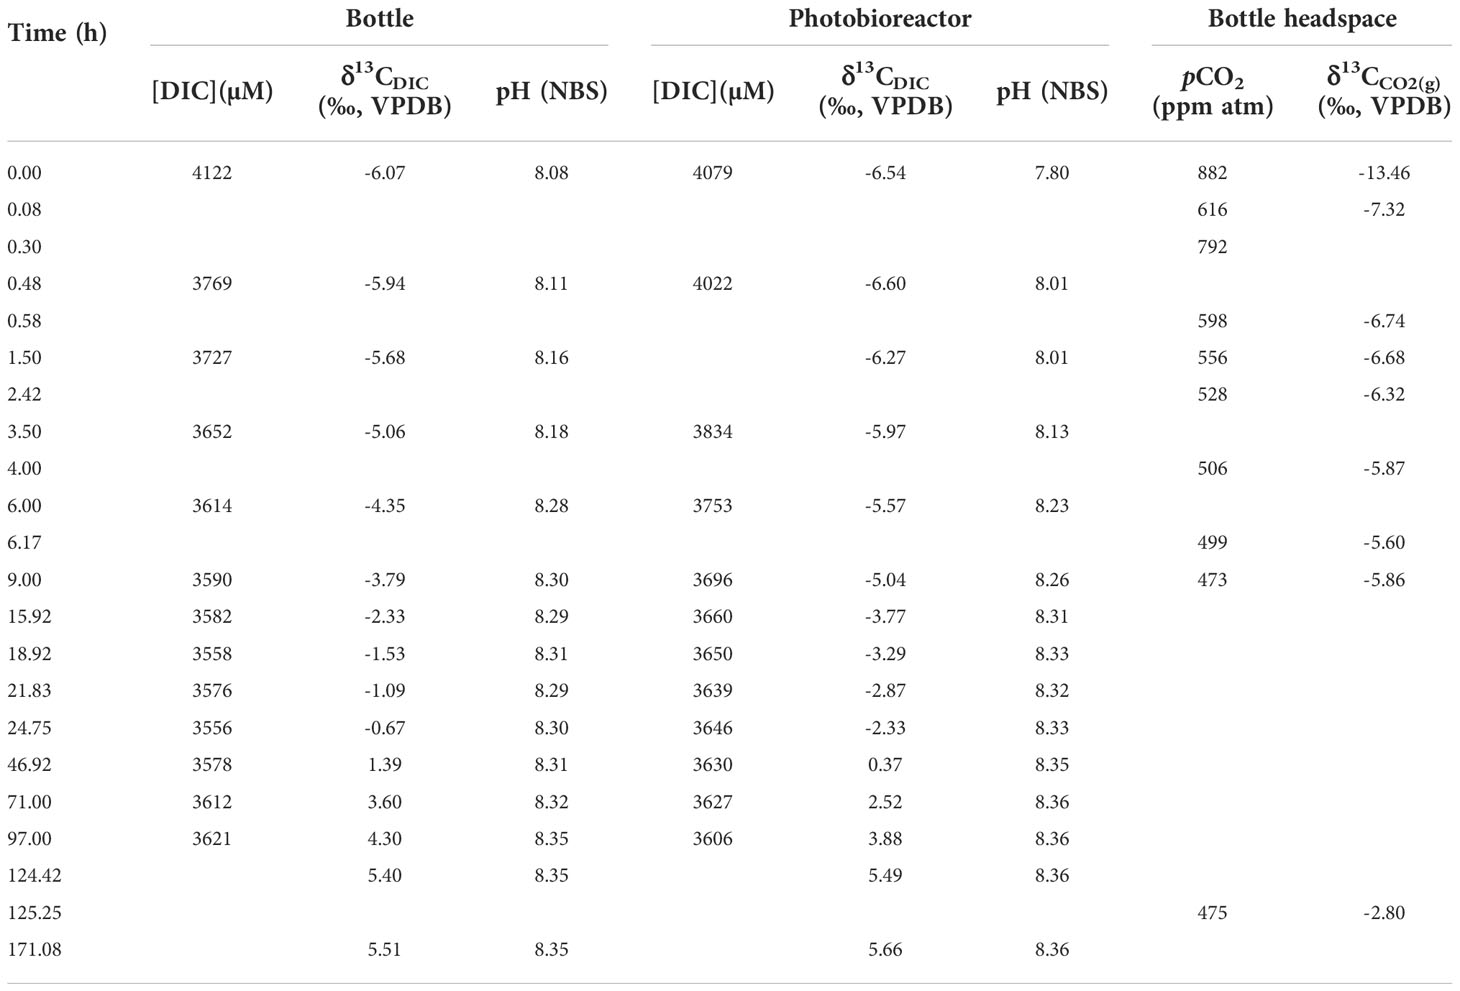
Table 2 DIC and CO2(g) in headspace measurements during small system bubbling.

Table 3 DIC and CO2(g) in headspace measurements during large system bubbling.
To measure seawater DIC, pH and δ13CDIC, 35 mL seawater were syringed out as depicted in Figure 1A. The first 5-10 mL out of 35 mL were routinely discarded to avoid mixing effects with dead volumes in the tubing. One mL was injected into He-flushed glass vials containing H3PO4 for the carbon isotope ratios measurements in Gas Bench. About 12 mL were injected into the glass vials without headspace, for DIC concentration measurements using Apollo analyzer, and 3.5 mL was consumed in each duplicate. There was no gas exchange between air and samples during the sampling of DIC and CO2. The remaining seawater in syringe (~15-20 mL) was then injected into a 50 mL centrifuge tube for pH measurement. The tube was covered with Parafilm M sealing film to reduce the CO2 exchanging between seawater and air. The pH of seawater was measured by a Mettler Toledo LE410 pH-probe calibrated with NBS standards (Mettler Toledo) resulting in an accuracy of ±0.01. Here it should be noted that high ionic strength calibration standards, such as standards in total scale, would be optimal for pH measurement in seawater (Kadis and Leito, 2010).
There are three important processes in DIC carbon isotope evolution simulations, (1) CO2 exchanging between gas (CO2(g)) and seawater (CO2(aq)), (2) DIC inter-reactions and (3) isotopic fractionation during the DIC reactions, which will be introduced separately in the following sections. Beside these three main processes, the sampling of DIC and gas in headspace can also play a minor role in DIC isotope evolution by decreasing the total amount of DIC and accelerating isotopic equilibrium. Thus, the decreasing of DIC volume and the loses of CO2(g) in headspace during sampling are also considered in our model. As described in the last section, the CO2 coming from the Gas Mixing System first goes into the bubbling in bottle, exchanging with DIC in bottle. Then CO2(g) goes out of the seawater in bottle into the bottle headspace. After that, CO2(g) goes into bubbles in photobioreactor exchanging with DIC in photobioreactor. However, in our model, bubbles in bottle and photobioreactor are combined with bottle headspace to reduce the calculation amount. Thereby, in practice, the simulated CO2(g) goes into headspace directly after flowing out of Gas Mixing System, and exchanges with DIC in bottle and photobioreactor together (Figure 1B). With these simplifications, there are only two degrees of freedom in our model: CO2 exchange rate constants (kE) in bottle and photobioreactor. Using a given combination of kE, the forward model runs ordinary differential equations (ODEs) toward steady state using the Matlab function ‘ode15s’, with seawater and CO2(g) composition in bottle, photobioreactor and bottle headspace as initial conditions. The notations and equations of the model are described in detail in the Appendix B, C, respectively. Fitting processes were carried out to estimate the exchange rate constants and gas flux. These processes were achieved by minimizing the difference between simulated carbon isotope ratios and measured values via the Matlab function ‘fmincon’.
The equilibrium between CO2(g) in headspace and CO2(aq) in seawater follows Henry’s law (Carroll et al., 1991). The net exchange rate (ER) between seawater and headspace follows the Fick’s diffusion law.
where the DCO2 is the diffusion coefficient which depends on temperature and pressure, A is the surface area and is the CO2 concentration gradient between seawater and headspace. In a bubbling system, the surface area depends on the number and size of bubbles, which are difficult to estimate (e.g. Martínez and Casas, 2012). Here, to simply our model, we define an exchange rate constant into the Equation 1, which is a function of bubble surface area, temperature and pressure. If the exchange flux from gas phase into seawater is defined as positive, then net CO2 exchange rate between gas and seawater can be described by kE (with a unit of mol s-1 atm-1 in this case) and the CO2 concentration difference between headspace and seawater by the following equation:
where the kH is the Henry’s Law constant, which depends on temperature and is 0.035 mol L-1 atm-1 at T =291.15K for this work. The pCO2h is the CO2 concentration in headspace, with a unit of atm. The CO2(aq) is the CO2 concentration in seawater, with a unit of mol L-1. Since the kE is difficult to calculate directly, we can estimate it by tracing the DIC carbon isotope evolution during bubbling, which will be described in Section 4.
The DICs inter-reactions in the seawater include:
The reaction rate constants follow definitions in Zeebe and Wolf-Gladrow (2001), where k+1 and k-1 are constants for hydration and dehydration reactions, k+4 and k-4 are for hydroxylation and dehydroxylation reactions and k+5 and k-5 are for CO32- and HCO3- exchanging. To increase the simulation efficiency, the conversions between HCO3- and CO32- are assumed to be instantaneous since they are about 8-9 orders of magnitudes higher than the reactions rate between CO2(aq) and HCO3- (Zeebe and Wolf-Gladrow, 2001). The hydrolysis reactions (Equation 6) are not simulated in our model in order to increase the simulation efficiency, but the protolysis reactions (Equation 5) are simulated to calculate H+ concentration and thereby simulate the dynamic seawater pH during CO2 bubbling.
The carbon isotope ratios of DIC and CO2(g) were shown as the relative abundance of 13C/12C in substance X (13Rx) compared with the ratio of 13C/12C in standard carbonate (13Rstd, VPDB in this study):
The main processes causing isotopic fractionation in our simulations are: (1) CO2(aq)-HCO3- inter-reactions and (2) CO2 diffusion in air and CO2 diffusion from gas phase into liquid phase. In our model, beside the concentrations of CO2(g), CO2(aq), HCO3- and CO32-, the concentrations of 13CO2(g), 13CO2(aq), H13CO3- and 13CO32- are also calculated. Isotopic fractionations are simulated by using larger or smaller reaction rate constants following Zeebe and Wolf-Gladrow (2001). A summary of reaction rate constants and fractionation factors can be found in Appendix Table B1. The reaction rates of DIC and CO2(g) with heavy carbon atoms are listed in Equation C1-C10.
In this work, the δ13CCO2(g) is about -2.8‰. The carbon isotope fractionation between CO2(g) and CO2(aq) is about 1.2‰ (CO2(g) is less enriched of 13C than CO2(aq)). The fractionation between CO2(aq) and HCO3- is about -9.8‰ at 291.15K (CO2(aq) is more depleted in 13C than HCO3-). The three DIC components vary with pH: the proportion of CO2(aq) decreases with increase of pH, while CO32- increases with the concomitant increase of pH. Since the HCO3- is the dominant component in seawater DIC, the value of carbon isotope fractionation between CO2(aq) and HCO3- is close to the one between CO2(aq) and total DIC (~0.3‰ difference when pH is around 8, Figure 2). In conclusion, ignoring the fractionation in CO2(g) diffusion, the carbon isotope ratios of DIC should be about 8.3‰ more positive than that of CO2(g), when they are in equilibrium, at our culture temperature and pH. In other words, the DIC carbon isotope ratio should be around 5.5‰ after equilibrium with CO2(g) given a temperature of 291.15K and δ13CCO2(g)= -2.8‰ for this work.
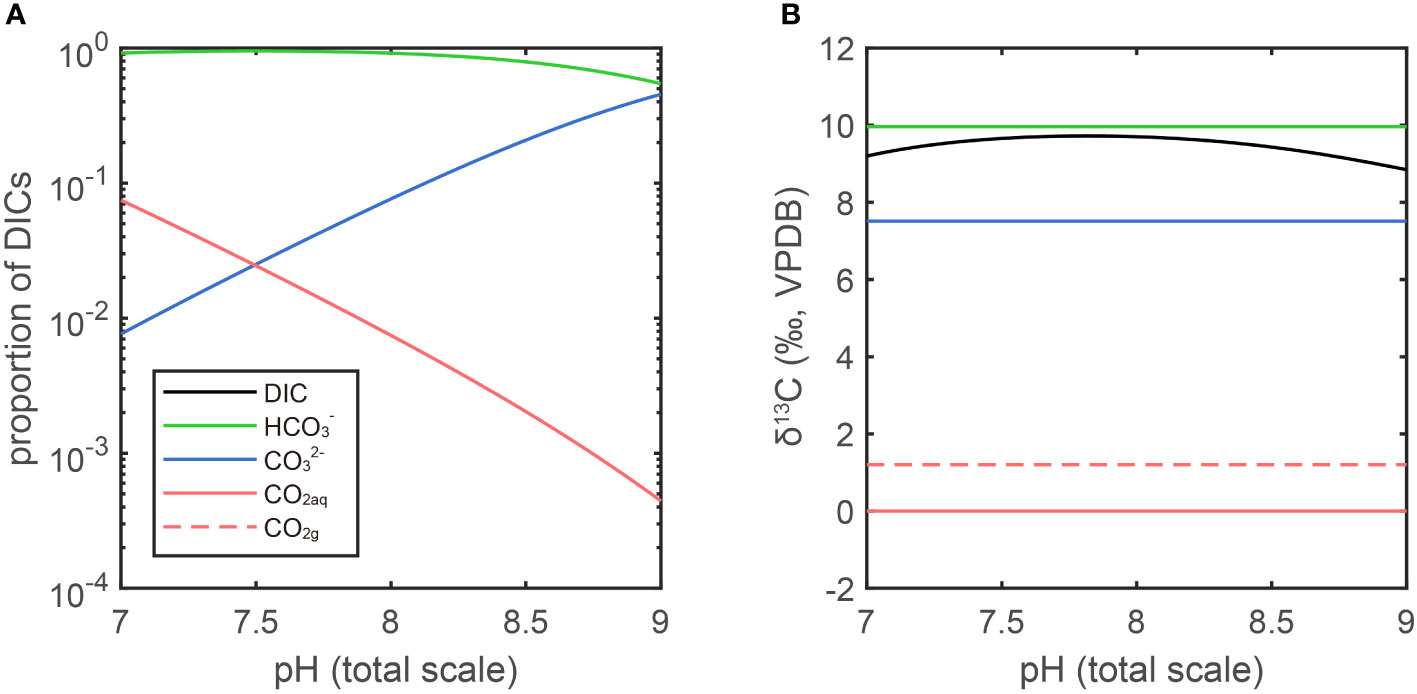
Figure 2 DIC proportion and isotope fractionation in different pH. (A) The ratio of the three components of DIC are plotted on a log scale in function of pH for a seawater at T = 291.15K and Salinity = 35‰. (B) The isotopic fractionations are calculated by the parameters in Table A1. The δ13CVPDB of CO2(aq) is arbitrarily set as 0‰ (red line). In isotopic equilibrium, the CO2(g) is heavier than CO2(aq) by 1.2‰, the HCO3- is heavier than CO2(aq) by 9.8‰ and CO32- is heavier than CO2(aq) by 7.4‰ (Zhang et al., 1995). The fractionation between total DIC and CO2(aq) is a function of pH as it determines the proportion of each DIC.
In this study, we carried out two experiments to estimate the CO2 exchange rate constants between gas and seawater. The fitting results of CO2 exchange rate constant (kE) are 8.71×10⁻⁵, 4.57×10⁻⁵, 5.32×10⁻⁵ and 3.36×10⁻⁵ mol s-1 atm-1 for large system bottle, large system photobioreactor, small system bottle and small system photobioreactor, respectively.
The δ13CDIC before bubbling are around -6.1‰ (-6.54~-5.65‰). With the onset of bubbling, δ13CDIC responded logarithmically, increasing fastest during the first hours and slowing the rate of increase in the following days. The δ13CDIC in both experiments did not increase further after reaching values around 5.5 ‰, about 8.3 ‰ higher than the CO2(g), which well fitted our prediction in the last section. The δ13CDIC reached equilibrium with CO2(g) at 6 days in low CO2 experiment with pCO2 = 470 ppm, while in the other experiment, the isotopic equilibrium was achieved at 5 days after bubbling. In our simulations, the carbon exchange rate between CO2(aq) and HCO3- is more than two orders of magnitude higher than the rate between CO2(g) and CO2(aq). Therefore, carbon isotope ratios of CO2(aq) (δ13CCO2(aq)) are almost parallel with δ13CDIC (dashed lines in Figure 3).
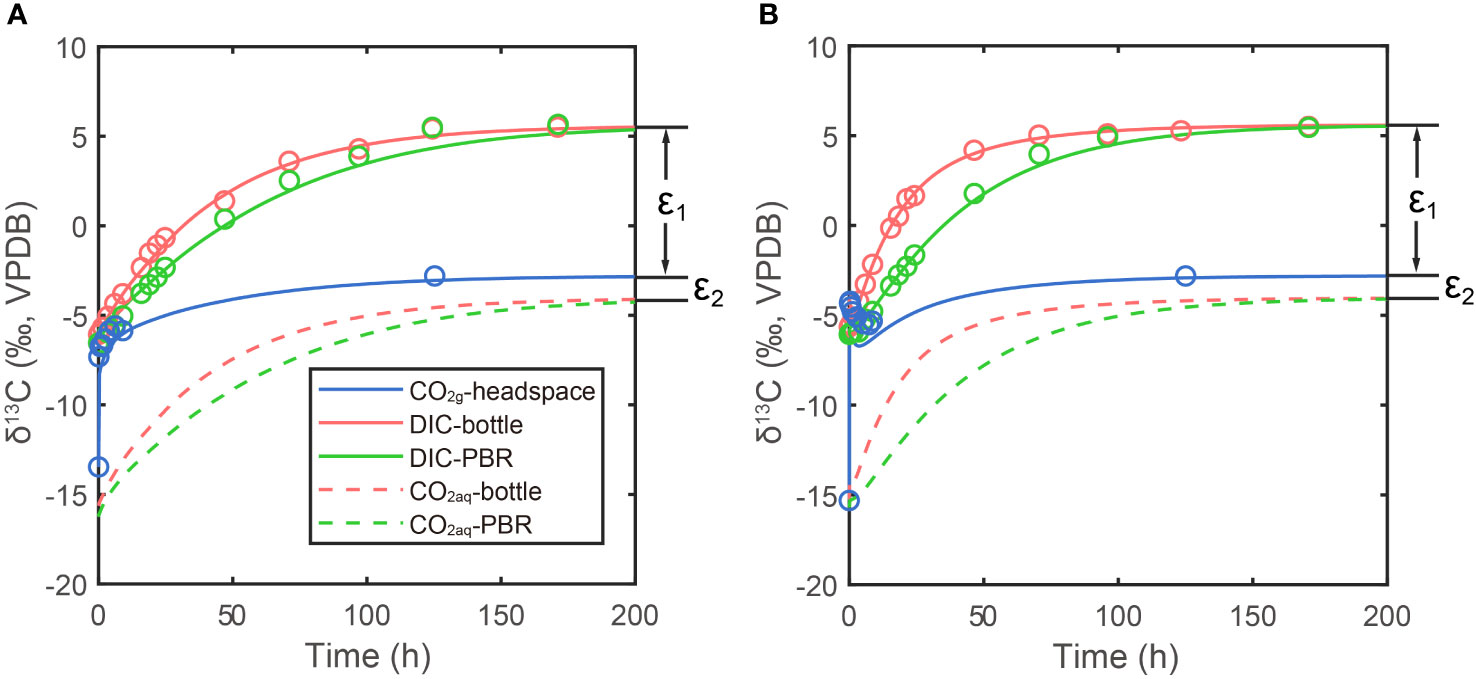
Figure 3 Measurements and simulations in two bubbling experiments: (A) lower CO2 experiment in small photobioreactor system; (B) higher CO2 experiment in large photobioreactor system. Lines are simulation results and dots are measured. Blue lines and dots are carbon isotope ratio of CO2(g) in headspace, red lines and dots are DIC carbon isotope in bottle and green lines and dots are DIC carbon isotope in photobioreactor (PBR in legend). Red and green dashed lines are simulated CO2(aq) carbon isotope ratios in bottle and photobioreactor, respectively. The ϵ1 and ϵ2 are carbon isotope fractionations between DIC and CO2(g) and CO2(g) and CO2(aq), respectively.
Compared to the continually increasing δ13CDIC and δ13CCO2(aq), the carbon isotope ratio of CO2 gas (δ13CCO2(g)) in bottle headspace interestingly showed more variations (blue dots in Figure 3). The initial value of δ13CCO2(g) was around -15‰, which is the atmosphere CO2 carbon isotope ratio in the poorly ventilated laboratory. There were sharp increases in δ13CCO2(g) from -15‰ to around -6‰, immediately after bubbling (-4.31‰ in high pCO2 experiment and -7.32‰ in low pCO2 experiment, only five minutes after bubbling). This was caused by the CO2 in bottle headspace being rapidly replaced by the new CO2 coming from the Gas Mixing System, which has a carbon isotope fingerprint of -2.8‰. With a fixed gas flux, this kind of rapid increase in δ13CCO2(g) was more significant in high CO2 concentration experiment (Figure 3B). The rapid increase of δ13CCO2(g) was then followed by a decrease of δ13CCO2(g), which was caused by CO2 exchanging between gas in headspace and DIC in seawater. In the large system, the CO2 exchange rate is about 640% higher than the rate in small system, due to the higher pCO2 and higher kE. Therefore, the 13C in CO2(g) went into DIC in seawater faster in the larger system, resulting in an about 1.2‰ decline in δ13CCO2(g) and also faster increases in δ13CDIC (Figure 3B). This complex pattern of δ13CCO2(g) was well simulated in our model (blue lines in Figure 3), though the simulation results are a bit lower value than measurements in high CO2 experiment. This could be caused by the combination of the bubbles in bottle and photobioreactor with the headspace in our model, resulting in a more significant decline in δ13CCO2(g) when CO2(g) begins to exchange with DIC.
To study the potential influence of experimental settings on equilibration time, a series of sensitivity tests are carried out by simulating the DIC evolution during bubbling. Here we define the ‘99% ordinary equilibration time’ as the time when [CO2(aq)] reach [CO2(aq) t=0] + 0.99([CO2(aq) t=∞] – [CO2(aq) t=0]). Similarly, the ‘99% carbon isotopic equilibration time’ is defined as the time when the DIC carbon isotope ratio reaches δ13CDIC t=0 + 0.99(δ13CDIC t=∞ - δ13CDIC t=0).
The first sensitivity test is the effect of CO2 gas exchange rate constant (kE) on equilibration time. Given a DIC concentration of 2200 μM and in a media volume of 1 L, and the initial carbon isotope difference between CO2(g) and DIC of 5‰ (δ13CCO2(g) - δ13CDIC t=0 = 5‰), both ordinary and isotopic equilibration time increase with a decreasing CO2 exchange rate constant (Figure 4A). Hence, we suggest that the CO2 exchange rate between gas and seawater is the first-order limitation of isotopic equilibration time.
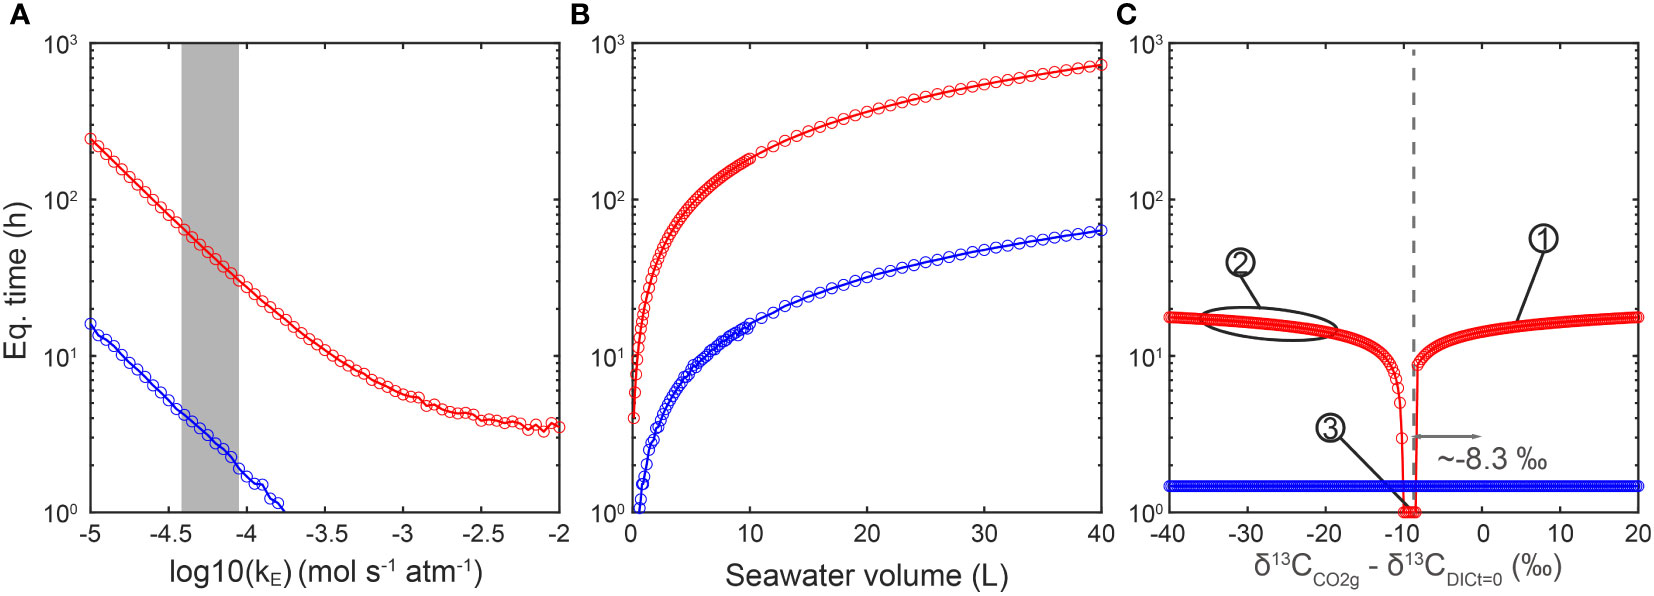
Figure 4 Sensitivity tests of different parameters effects on equilibration time. (A) Both isotopic (red) and chemical (blue) equilibration times decrease with the increase of gas exchange rate constant. The grey shaded area represents the estimated gas exchange rate constants in this work, ranging from 10-4.4 to 10-4.1 mol s-1 atm-1. (B) Both isotopic (red) and ordinary (blue) equilibration times increase with the increase of seawater volume. (C) The DIC carbon isotope reaches equilibrium faster when the carbon isotope ratio difference between DIC and CO2(g) is around 8.3‰ (same as the ϵ1 in Figure 3), which is the equilibrium fractionation between DIC and CO2(g) at 291.15K. The carbon isotope difference does influence equilibration time especially when the difference is between -20‰ and -8.3‰. Numbering illustrates isotopic ratio differences in representative experiments here and in published works: No. 1 marks a Δt=0 = 1.7‰ in kE measurement experiments in this study. No. 2 marks Δt=0 ranging from about -37 to -17‰ in several other works (e.g., Liu et al., 2018; Phelps et al., 2021). No. 3 marks a Δt=0 around -9‰ (Tchernov et al., 2014).
In the second simulation, the effect of culture media volume (or total DIC amount) was tested. Given a DIC concentration of 2200 μM, an initial carbon isotope difference between CO2(g) and DIC (Δt=0) as 5‰ (δ13CCO2(g) - δ13CDIC t=0 = 5‰) and a kE of 10-4 mol s-1 atm-1, both of ordinary and isotopic equilibration time show a linear increase with the seawater volume (Figure 4B). These simulations fit the expectation that, when the total DIC amount is higher, it will take longer to reach equilibrium in the system.
Finally, we evaluate the effect of initial carbon isotope difference between CO2(g) and DIC on equilibration time. The carbon isotope of CO2(g) was fixed in all simulations, but the initial carbon isotope ratio of DIC was varied, with initial carbon isotope difference ranging from -40 to 20‰. The DIC concentration was set as 2200 μM and the volume of media at 1 L. The simulation results in Figure 4C show that when the Δt=0 is ~-8.3‰, which is the equilibrium fractionation between CO2(g) and DIC at T = 291.15K, the DIC reaches isotopic equilibrium with CO2(g) even faster than the ordinary chemistry equilibrium. When the absolute isotopic difference (|Δt=0|) is larger, for example from -8.3 to -20‰, the isotopic equilibration time would increase exponentially. Another interesting observation is that, when the isotopic difference between CO2(g) and DIC is large enough, the time to reach isotopic equilibrium will not increase with the |Δt=0|. We suggest that this is the time cost for all carbon atoms in the DIC to fully exchange with carbon atoms in CO2(g). In contrast with the isotopic feature of seawater, the initial concentration of DIC and pH only have minor impacts on the equilibrium time, especially the isotopic equilibrium (Appendix E Figure E1).
In recent years, more laboratory culture works have focused on carbon isotope variations in biogenic carbonate or bulk/special organic carbon under ocean acidification scenarios. We consider the expected behavior of carbon chemistry equilibration in three types of published experimental setups, and implications for the estimation of carbon isotope fractionation between DIC and biomass or biominerals.
The longest equilibration time would be expected for systems in which CO2 is not bubbled directly but instead CO2(g) was pumped into the bottle headspace, such as described in a recent published laboratory culture study on coccolithophores (Phelps et al., 2021). In their 2.5 L volume vessels of 1 L approximately 2000 μM DIC, the isotopic difference between CO2 tank and the natural seawater media was not reported. Given natural seawater, the carbon isotope of DIC was likely in the range of 1 to 1.6‰ (Bidigare et al., 1997). Typical standard commercial CO2 gas cylinders produced from fossil fuel combustion around -37‰. The range of carbon isotope difference would be ~38‰ and the expected equilibrium δ13CDIC value after bubbling would be about -29‰. Measurement of δ13CDIC at the start and end of the 5 day duration of experiment showed the least negative values (-7 to -9‰) in the 200 ppm CO2 treatment and the most negative values (-15 to -17‰) in the 1000 ppm treatment (see Figure S8 in Phelps et al. (2021)). As the gas exchange rate constant should be the same between treatments, the gas exchange rate increases with the CO2 concentration (see the Equation 2 in Section 3). This would lead to the DIC carbon isotope value in the 1000 ppm treatment being closer to equilibrium (more negative) than that in the 200 ppm CO2 experiment. In this study, in order to minimize the impact of evolving δ13CDIC, the isotopic fractionation was calculated using the final DIC carbon isotope ratio of each experiment, as representative of the DIC in which most of the harvested culture biomass was produced. Therefore, in this case, even if the DIC carbon isotope ratios did not reach equilibrium with the CO2 gas, the fractionation results are still robust with help of DIC measurements. However, the disequilibrium between DIC and CO2(g) could add additional errors in ϵp calculations, because of the gradual negative shift of DIC carbon isotope over the course of the culture. Additionally, the carbon isotope exchange rate would be faster when there is more disequilibrium with CO2(g), resulting in a larger potential error in ϵp estimations (Figure 5A). In conclusion, even if the DIC carbon isotope ratios are measured carefully, it is still more optimal to ensure isotopic equilibrium in DIC for a stable δ13CDIC to reduce the potential error.
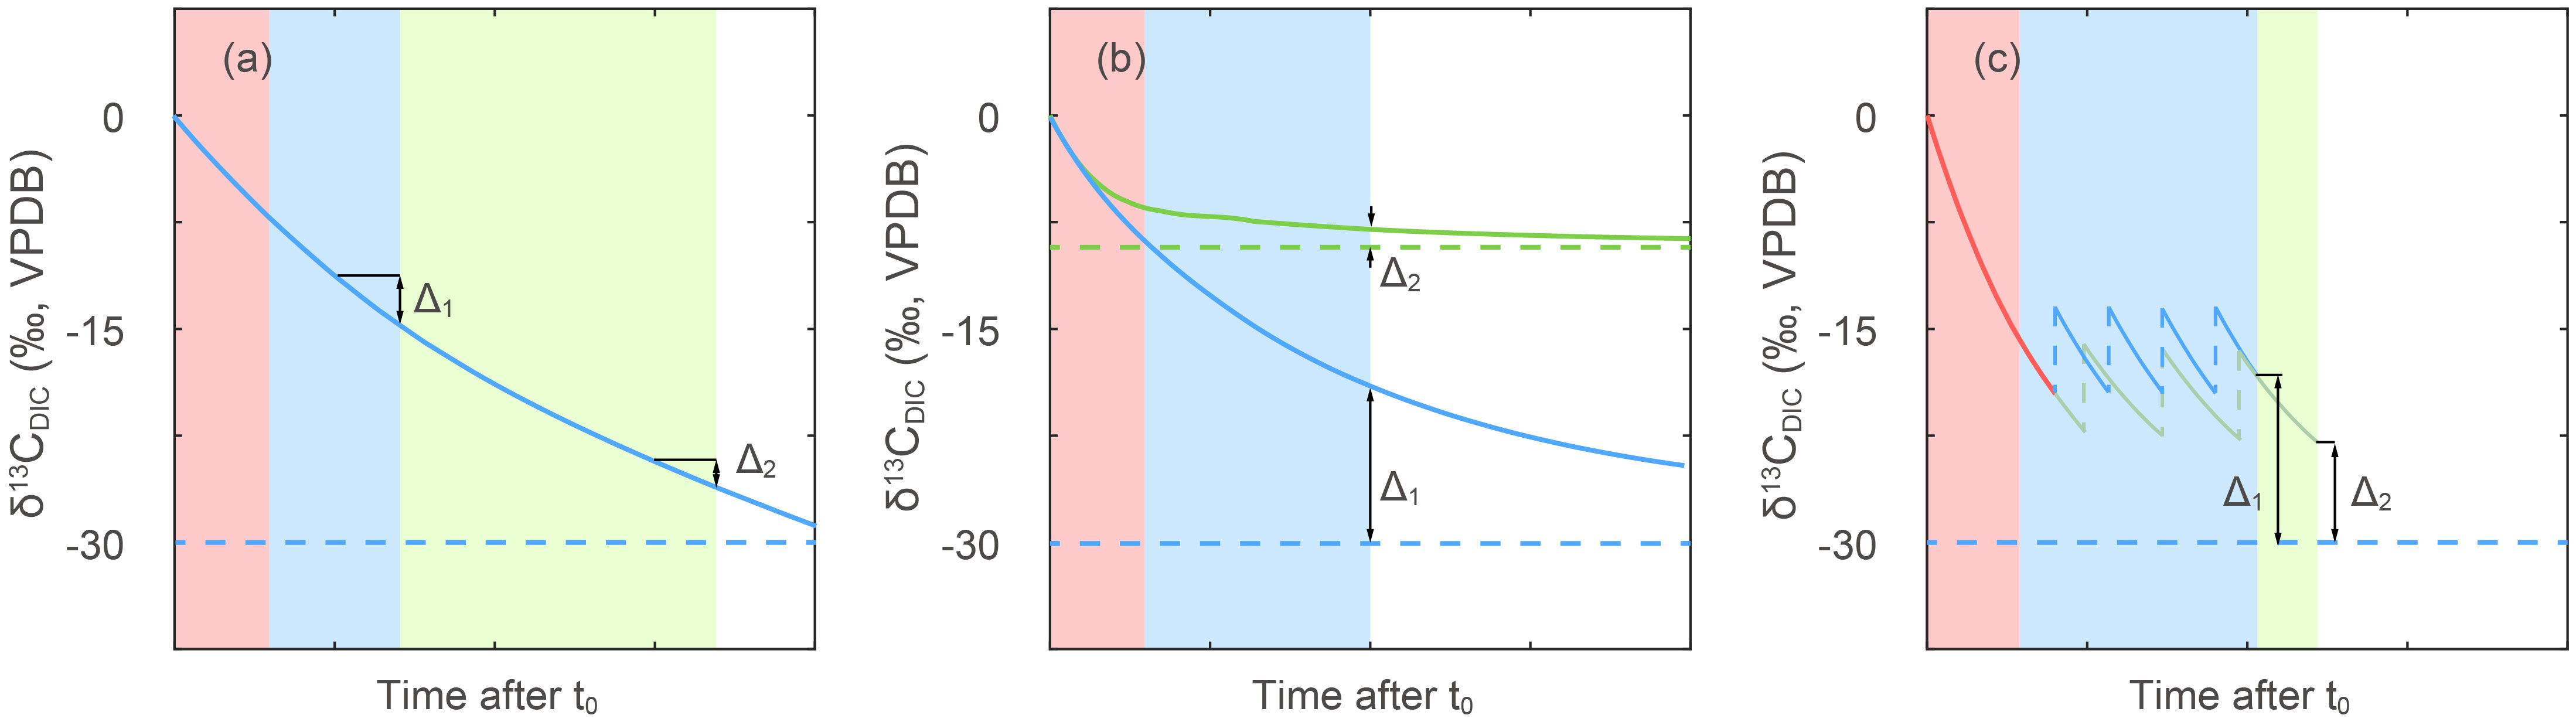
Figure 5 Concept model of isotopic disequilibrium effects in different experimental setups. Time advances from left to right in unspecified units since actual equilibration timescales depend on vessel dimensions and bubbling rate and surface area. Red shading areas represent the period in which media was bubbled before addition of cells. Blue and green shaded areas represent culture duration with bubbling. Horizontal dashed lines represent the δ13CDIC after reaching equilibrium with CO2(g), while solid lines give the time varying δ13CDIC for different scenarios detailed below. Blue lines are shown for the common situation of bubbling a media of initial δ13CDIC close to surface seawater (~0‰) with CO2(g) of ~-38 ‰. The Δ1 and Δ2 are used to illustrate potential errors in estimation of δ13CDIC, as detailed below. (A) Potential effect of the timing of sampling on the uncertainty in the δ13CDIC. Because cells are produced not only the last day, but also a period of time before harvest, if the δ13CDIC at time of cell harvest time was employed in fractionation calculation, the more rapid δ13CDIC evolution early in the experiment could lead to a larger error as (Δ1 vs Δ2). Different CO2 concentration treatments with different rates of reaching equilibrium, or different culture durations can cause differences in error as well as bias the estimation of δ13CDIC corresponding to period of cell production. (B) Comparison of the effect of δ13CCO2(g) of -38‰ (blue lines) vs ~-17‰ (green lines) on estimation of δ13CDIC. The DIC carbon isotope would reach equilibrium faster with a CO2(g) to DIC isotopic difference of around -8.3‰ leading to a smaller disequilibrium. This effect could be more serious when the DIC carbon isotope ratios are not measured. (C) The effect of dilution frequency on DIC carbon isotope evolution in continuous culturing set-ups. Blue and green lines present two different dilution treatments and red line represents δ13CDIC evolution before first dilution. The vertical dashed lines represent positive shifts in carbon isotope caused by dilutions with un-bubbled seawater. Higher dilution rate would lead to a larger disequilibrium as Δ1, if the seawater reservoir is not pre-bubbled to equilibrium with CO2(g), which could also increase the error of fractionations in continuous culture set-ups.
Shorter equilibration times would be expected in the cultures which are actively bubbled compared to cultures with only gas surface aeration. Remize et al. (2021) actively bubbled 2 L culture vessels of natural seawater of initially 750 μM DIC with an intensity of 5 bubbles per second. The isotopic difference between the CO2 tank (-37.7‰) and natural seawater media (5‰) would be 42‰ and the expected equilibrium value after bubbling would be ~-30.5‰ at Tk = 292K. Measurement of δ13CDIC every 4 days reveals δ13CDIC attained -31‰, the expected equilibrium value after around 20 days. The equilibration likely required >10 days due to a slow gas exchange rate resulting from low-intensity bubbling and low CO2 concentration. The δ13C of biomass sampled every 4 days throughout the experiment also evolves by 40‰ in parallel with the evolution of the δ13CDIC.
Another example using bubbling method is Liu et al. (2018), who studied the carbon isotopic fractionation of a coastal coccolithophore, Ochrosphaera neapolitana. However, instead of measuring DIC carbon isotope ratios directly, they calculated expected DIC carbon isotope ratios assuming equilibrium with CO2(g). Their carbon isotope fractionation results, in both calcite and organic carbon, were higher than other coccolithophores laboratory culture results (Rickaby et al., 2010; Hermoso et al., 2016; Stoll et al., 2019) by ~5–10‰. Moreover, they bubbled the DIC in three different CO2- groups by gas with three different carbon isotope ratios ranging from -15‰ to -37‰. This could cause differences in the extent of isotopic disequilibrium among the experiments, as shown in Figures 4C, 5B.
More complex situations arise with continuous culturing set-ups. An example would be bubbling of the culture vessel but not the inflow bottle, from which new media are pumped into the culture for (semi-)continuous dilution (Wilkes et al., 2017; Wilkes et al., 2018). In this system, the CO2 added was -38.6‰ for all cultures, and natural seawater (assumed to be about 1 to 1.6‰ as Bidigare et al. (1997)), in a 4 L culture vessel. The expected equilibrium δ13CDIC would be -30‰. Different dilution rates were employed to control algae growth rate. In such a system the DIC carbon isotope could be closer to equilibrium when the dilution rate is lower. From the observations, it appears that the DIC in high CO2 and low dilution rate treatments get closest to equilibrium (from the Table 1 in Wilkes et al. (2017)), while the faster dilution rate and lower CO2 are furthest from equilibrium (Figure 5C). Previous authors (Wilkes et al., 2017) suggested that differences in the bubbling regimen may have contributed to the very different results from continuous cultures of Hoins et al. (2016). In Hoins et al. (2016), the biomass carbon isotope fractionation shows a much narrower range, only from 9 to 12‰, compared to the 14 to 26 ‰ in Wilkes et al. (2017), even though the CO2 settings and cell growth rates in these two studies are similar. However, insufficient details are provided in the method of Hoins et al. (2016) to evaluate the role that isotopic equilibrium may have played in these divergent results, while the DIC carbon isotope ratios in Wilkes et al. (2017) were measured making the fractionation results more reliable.
Continuous cultures with faster equilibration are expected to result from using gas and media with a CO2(g) to DIC isotopic difference around -9 to -8‰ (varying with temperature), as discussed in Section 5.1. Tchernov et al. (2014) described a culture in which natural seawater in Gulf of Maine, ~1.2‰ at nearest station in GLODAP V2 (Olsen et al., 2016), was bubbled with atmospheric CO2 (~ -8.5‰), with expected equilibrium ranging from -7.6‰ at 26°C and -9.6‰ at 8°C (more equilibrium fractionations in different temperature can be found in Appendix D). The CO2(g) and DIC were close to reach isotopic equilibrium in this study. Therefore, although only the culture vessel not the media reservoir was bubbled, the equilibration time would have been very short (as seen in Figure 4C).
As discussed in the previous section, isotopic disequilibrium is likely to have happened widely in current carbon isotopic studies involving bubbling of cultures. Most ocean acidification studies did check the ordinary chemistry equilibrium carefully by monitoring the seawater pH or DIC concentration during bubbling. But the carbon isotopic equilibrium has often been ignored so far, which could be much slower than the ordinary equilibrium. Here we suggest that for all laboratory culture works on carbon isotope fractionation, measuring the DIC carbon isotope ratio directly is always very necessary, at least once at the beginning and again the end of culture, in case the DIC is in disequilibrium with CO2(g). We can estimate the isotope ratio at equilibrium quickly by δ13CCO2(g) – Δeq, where Δeq is the equilibrium carbon isotope fractionation between CO2(g) and DIC (defined as δ13CCO2(g)- δ13CDICeq, ~-8.3 when the temperature is about 291.15K and pH is around 7.8-8.2 in this study). The Δeq for different temperature and pH combinations have been listed in Table D1. If regular DIC carbon isotope measurements are not available, a safe solution could be pre-bubbling seawater for more than one week before carrying out any culture experiments. Even with measurements of DIC carbon isotope ratios, we still recommend that the DIC carbon isotope should reach (or be close to) isotopic equilibrium with CO2(g), to minimize the error in carbon isotope fractionation calculations. For continuous cultures, the media reservoir used for dilution should also be pre-bubbled to avoid huge carbon isotopic shifts during culture, which can also reduce the error. We also suggest that it is necessary to report, as detailed as possible, the culture methods, including the CO2(g) carbon isotope ratio, initial DIC carbon isotope ratio, pre-bubbling duration and dilution percentage, for the benefits of data comparison in future works.
For a chemostat system similar to the photobioreactor system employed in this work, both the ordinary and isotopic equilibriums are primarily limited by the CO2 exchange rate between the gas phase and liquid phase. As discussed in the sensitivity test results, increasing the kE can significantly accelerate the equilibration process. Firstly, exchange rate can be accelerated by increasing the gas flux. However, some large or fragile phytoplankton species, such as Trichodesmium erythraeum and dinoflagellate species, might be affected by the turbulence caused by bubbling (Hurd et al., 2009). Therefore, most studies employed a ‘gentle bubbling’, with a gas flux ranging from 100 mL min-1 to 300 mL min-1 for culture flasks in a few liters (e.g., Li et al., 2012; Gordillo et al., 2015). Additionally, it was also recommended to stop bubbling for the first day of incubation as the algae get acclimated (Shi et al., 2009). In conclusion, we should avoid increasing the gas exchange rate by increasing the gas flux, especially for algal cultures. Another way to accelerate equilibrium is using a gas-diffuser (also known as an air-stone), which could divide gas bubbles into a larger number of smaller bubbles significantly increasing the surface area between gas phase and seawater phase. Gas diffusers of plastic or glass are likely to provide the best option for gas diffusion in culture.
For studies evaluating vital effects in the oxygen isotope ratios of carbonate shells, such as coccoliths, the shells of foraminifera and bivalve, the oxygen isotope equilibrium between CO2(g) and water should be also considered. In theory, the oxygen isotope equilibrium should take longer to reach equilibrium than that of the carbon isotopes. This is because in a closed system the equilibration time for carbon isotopes is only 102 seconds, but the equilibration time for oxygen isotopes is about a few hours (Zeebe and Wolf-Gladrow, 2001). Previously, the oxygen isotope issue was ignored because the oxygen atom from water is dominant in a DIC-H2O system. For example, in 1 L seawater with [DIC] = 2.3 mM and pH = 8.2, there are only about 4.6×10⁻³ mol oxygen atoms derived from DIC but about 55 mol oxygen atoms from H2O. However, continuous CO2 bubbling will bring more oxygen atoms from CO2(g) into media. This will alter the seawater oxygen isotope ratio if the oxygen isotope in CO2(g) is not naturally equilibrium with the oxygen isotope ratio of H2O. Therefore, when biogenic carbonate oxygen isotope fractionation experiments are carried out using CO2 bubbling, cautions are advised that the water oxygen isotope results could be influenced by disequilibrium among CO2(g)-DIC-H2O.
During culturing, the biomass consumes DIC and nutrients continually, modifying the culture media chemical and isotopic composition. Historically, previous work had to employ dilute batch cultures to avoid large shifts in both DIC concentration and isotopic composition. Chemostat systems were designed to keep a stable cell growth environment with help of numerical models (e.g., Ajbar and Alhumaizi, 2011). With cell density, growth rate, PIC and POC per cell, it would be possible to simulate how cell growth influences the DIC concentrations and isotope ratios evolution in continuous cultures, and very low cell density may no longer be the only way to achieve an accurate estimation of isotopic fractionation and stable carbonate system. Carbon isotope fractionation results in batch culture can also be re-calculated more accurately by employing an isotopic model to simulate a dynamic DIC carbon isotope ratio, than simply using the DIC carbon isotope ratio at the end of culture.
The original contributions presented in the study are included in the article/Supplementary Material. Further inquiries can be directed to the corresponding author.
IT-R and HZ carried out the bubbling experiments. IT-R and PA measured carbon isotope with help from MJ in data calibration. HZ developed the numerical model. HZ and HS wrote the paper with input from other authors. All authors contributed to the article and approved the submitted version.
This study was supported by the Swiss National Science Foundation (Award 200021_182070 to HMS) and ETH Zurich (ETH03- 19-1 to HMS). “STATEMENT”. Statement: Open access funding provided by ETH Zurich.
The authors declare that the research was conducted in the absence of any commercial or financial relationships that could be construed as a potential conflict of interest.
All claims expressed in this article are solely those of the authors and do not necessarily represent those of their affiliated organizations, or those of the publisher, the editors and the reviewers. Any product that may be evaluated in this article, or claim that may be made by its manufacturer, is not guaranteed or endorsed by the publisher.
The Supplementary Material for this article can be found online at: https://www.frontiersin.org/articles/10.3389/fmars.2022.1045634/full#supplementary-material
Ajbar A., Alhumaizi K. (2011). Dynamics of the chemostat: A bifurcation theory approach (CRC Press). doi: 10.1201/b11073-6
Bidigare R. R., Fluegge A., Freeman K. H., Hanson K. L., Hayes J. M., Hollander D., et al. (1997). Consistent fractionation of 13C in nature and in the laboratory: Growth-rate effects in some haptophyte algae. Global Biogeochemical Cycles 11, 279–292. doi: 10.1029/96GB03939
Carroll J. J., Slupsky J. D., Mather A. E. (1991). The solubility of carbon dioxide in water at low pressure. J. Phys. Chem. Reference Data 20, 1201–1209. doi: 10.1063/1.555900
Figuerola B., Hancock A. M., Bax N., Cummings V. J., Downey R., Griffiths H. J., et al. (2021). A review and meta-analysis of potential impacts of ocean acidification on marine calcifiers from the southern ocean. Front. Mar. Sci. 8, 24. doi: 10.3389/fmars.2021.584445
Gattuso J.-P., Hansson L. (2011). Ocean acidification (Oxford University Press) doi: 10.1093/oso/9780199591091.001.0001.
Gattuso J.-P., Lee K., Rost B., Schulz K. (2010). Approaches and tools to manipulate the carbonate chemistry (Publications Office of the European Union) doi: 10013/epic.35259.d001.
Gordillo F. J., Aguilera J., Wiencke C., Jiménez C. (2015). Ocean acidification modulates the response of two Arctic kelps to ultraviolet radiation. J. Plant Physiol. 173, 41–50. doi: 10.1016/j.jplph.2014.09.008
Hermoso M., Chan I. Z. X., McClelland H. L. O., Heureux A. M. C., Rickaby R. E. M. (2016). Vanishing coccolith vital effects with alleviated carbon limitation. Biogeosciences 13, 301–312. doi: 10.5194/bg-13-301-2016
Hoegh-Guldberg O., Mumby P. J., Hooten A. J., Steneck R. S., Greenfield P., Gomez E., et al. (2007). Coral reefs under rapid climate change and ocean acidification. Science 318, 1737–1742. doi: 10.1126/science.1152509
Hoins M., Eberlein T., Grobetamann C. H., Brandenburg K., Reichart G. J., Rost B., et al. (2016). Combined effects of ocean acidification and light or nitrogen availabilities on 13C fractionation in marine dinoflagellates. PloS One 11, e0154370. doi: 10.1371/journal.pone.0154370
Hopkinson B. M., Dupont C. L., Allen A. E., Morel F. M. M. (2011). Efficiency of the CO2-concentrating mechanism of diatoms. Proc. Natl. Acad. Sci. 108, 3830–3837. doi: 10.1073/pnas.1018062108
Hurd C. L., Beardall J., Comeau S., Cornwall C. E., Havenhand J. N., Munday P. L., et al. (2019). Ocean acidification as a multiple driver: How interactions between changing seawater carbonate parameters affect marine life. Mar. Freshw. Res. 71, 263–274. doi: 10.1071/MF19267
Hurd C. L., Hepburn C. D., Currie K. I., Raven J. A., Hunter K. A. (2009). Testing the effects of ocean acidification on algal metabolism: Considerations for experimental designs 1. J. Phycology 45, 1236–1251. doi: 10.1111/j.1529-8817.2009.00768.x
Iglesias-Rodriguez M. D., Halloran P. R., Rickaby R. E., Hall I. R., Colmenero-Hidalgo E., Gittins J. R., et al. (2008). Phytoplankton calcification in a high-CO2 world. science 320, 336–340. doi: 10.1126/science.1154122
Kadis R., Leito I. (2010). Evaluation of the residual liquid junction potential contribution to the uncertainty in pH measurement: A case study on low ionic strength natural waters. Analytica chimica Acta 664, 129–135. doi: 10.1016/j.aca.2010.02.007
Keller M. D., Selvin R. C., Claus W., Guillard R. R. (1987). Media for the culture of oceanic ultraphytoplankton 1, 2. J. Phycology 23, 633–638. doi: 10.1111/j.1529-8817.1987.tb04217.x
Lemasson A. J., Fletcher S., Hall-Spencer J. M., Knights A. M. (2017). Linking the biological impacts of ocean acidification on oysters to changes in ecosystem services: A review. J. Exp. Mar. Biol. Ecol. 492, 49–62. doi: 10.1016/j.jembe.2017.01.019
Li W., Gao K., Beardall J. (2012). Interactive effects of ocean acidification and nitrogen-limitation on the diatom phaeodactylum tricornutum. PloS One 7, e51590. doi: 10.1371/journal.pone.0051590
Liu Y. W., Eagle R. A., Aciego S. M., Gilmore R. E., Ries J. B. (2018). A coastal coccolithophore maintains pH homeostasis and switches carbon sources in response to ocean acidification. Nat. Commun. 9, 2857. doi: 10.1038/s41467-018-04463-7
Martínez I., Casas P. (2012). Simple model for CO2 absorption in a bubbling water column. Braz. J. Chem. Eng. 29, 107–111. doi: 10.1590/S0104-66322012000100012
Meyer J., Riebesell U. (2015). Reviews and syntheses: Responses of coccolithophores to ocean acidification: A meta-analysis. Biogeosciences 12, 1671–1682. doi: 10.5194/bg-12-1671-2015
Mills G. A., Urey H. C. (1940). The kinetics of isotopic exchange between carbon dioxide, bicarbonate ion, carbonate ion and water1. J. Am. Chem. Soc. 62, 1019–1026. doi: 10.1021/ja01862a010
Mostofa K. M., Liu C.-Q., Zhai W., Minella M., Vione D., Gao K., et al. (2016). Reviews and syntheses: Ocean acidification and its potential impacts on marine ecosystems. Biogeosciences 13, 1767–1786. doi: 10.5194/bg-13-1767-2016
Nishida K., Chew Y. C., Miyairi Y., Hirabayashi S., Suzuki A., Hayashi M., et al. (2020). Novel reverse radioisotope labelling experiment reveals carbon assimilation of marine calcifiers under ocean acidification conditions. Methods Ecol. Evol. 11, 739–750. doi: 10.1111/2041-210X.13396
O'Leary M. H. (1988). Carbon isotopes in photosynthesis. BioScience 38, 328–336. doi: 10.2307/1310735
Olsen A., Key R. M., Van Heuven S., Lauvset S. K., Velo A., Lin X., et al. (2016). The global ocean data analysis project version 2 (GLODAPv2)–an internally consistent data product for the world ocean. Earth System Sci. Data 8, 297–323. doi: 10.5194/essd-8-297-2016
Phelps S. R., Hennon G. M. M., Dyhrman S. T., Hernández-Limón M. D., Williamson O. M., Polissar P. J. (2021). “Carbon isotope fractionation in noelaerhabdaceae algae in culture and a critical evaluation of the alkenone paleobarometer,” Geochem. Geophysics Geosystems. 22(7): e2021GC009657. doi: 10.1029/2021GC009657
Remize M., Planchon F., Loh A. N., Le Grand F., Mathieu-Resuge M., Bideau A., et al. (2021). Fatty acid isotopic fractionation in the diatom chaetoceros muelleri. Algal Res. 54, 102164. doi: 10.1016/j.algal.2020.102164
Rickaby R. E. M., Henderiks J., Young J. N. (2010). Perturbing phytoplankton: response and isotopic fractionation with changing carbonate chemistry in two coccolithophore species. Clim. Past 6, 771–785. doi: 10.5194/cp-6-771-2010
Riebesell U., Fabry V. J., Hansson L., Gattuso J.-P. (2011). Guide to best practices for ocean acidification research and data reporting (Office for Official Publications of the European Communities). doi: 10.1093/oso/9780199591091.003.0011
Riebesell U., Tortell P. D. (2011). “Effects of ocean acidification on pelagic organisms and ecosystems,” in Ocean acidification, 99–121. doi: 10.2777/66906
Shi D., Xu Y., Morel F. M. M. (2009). Effects of the pH/pCO2 control method on medium chemistry and phytoplankton growth. Biogeosciences 6, 1199–1207. doi: 10.5194/bg-6-1199-2009
Stoll H. M., Guitian J., Hernandez-Almeida I., Mejia L. M., Phelps S., Polissar P., et al. (2019). Upregulation of phytoplankton carbon concentrating mechanisms during low CO2 glacial periods and implications for the phytoplankton pCO2 proxy. Quaternary Sci. Rev. 208, 1–20. doi: 10.1016/j.quascirev.2019.01.012
Tchernov D., Gruber D. F., Irwin A. (2014). Isotopic fractionation of carbon in the coccolithophorid emiliania huxleyi. Mar. Ecol. Prog. Ser. 508, 53–66. doi: 10.3354/meps10840
Wilkes E. B., Carter S. J., Pearson A. (2017). CO2-dependent carbon isotope fractionation in the dinoflagellate alexandrium tamarense. Geochimica Cosmochimica Acta 212, 48–61. doi: 10.1016/j.gca.2017.05.037
Wilkes E. B., Lee R. B. Y., McClelland H. L. O., Rickaby R. E. M., Pearson A. (2018). “Carbon isotope ratios of coccolith–associated polysaccharides of emiliania huxleyi as a function of growth rate and CO 2 concentration,” in Organic Geochemistry 119(2018):1–10. doi: 10.1016/j.orggeochem.2018.02.006
Zeebe R. E., Wolf-Gladrow D. (2001). CO2 in seawater: equilibrium, kinetics, isotopes (Gulf Professional Publishing) doi: 10.1016/s0422-9894(01)x8001-x.
Keywords: carbon isotope, ocean acidification, laboratory culture, isotopic model, dissolved inorganic carbon (DIC)
Citation: Zhang H, Torres-Romero I, Anjewierden P, Jaggi M and Stoll HM (2022) The DIC carbon isotope evolutions during CO2 bubbling: Implications for ocean acidification laboratory culture. Front. Mar. Sci. 9:1045634. doi: 10.3389/fmars.2022.1045634
Received: 15 September 2022; Accepted: 29 November 2022;
Published: 22 December 2022.
Edited by:
Maria Cristina Gambi, Istituto Nazionale di Oceanografia e di Geofisica Sperimentale (Italy), ItalyReviewed by:
Lennart Jan De Nooijer, Royal Netherlands Institute for Sea Research (NIOZ), NetherlandsCopyright © 2022 Zhang, Torres-Romero, Anjewierden, Jaggi and Stoll. This is an open-access article distributed under the terms of the Creative Commons Attribution License (CC BY). The use, distribution or reproduction in other forums is permitted, provided the original author(s) and the copyright owner(s) are credited and that the original publication in this journal is cited, in accordance with accepted academic practice. No use, distribution or reproduction is permitted which does not comply with these terms.
*Correspondence: Hongrui Zhang, emhoQGV0aHouY2g=
Disclaimer: All claims expressed in this article are solely those of the authors and do not necessarily represent those of their affiliated organizations, or those of the publisher, the editors and the reviewers. Any product that may be evaluated in this article or claim that may be made by its manufacturer is not guaranteed or endorsed by the publisher.
Research integrity at Frontiers
Learn more about the work of our research integrity team to safeguard the quality of each article we publish.