 Qi Shen
 Qin Zhu
 Shuguang Liu3*
 Sha Lou
 Zhenchang Zhu
 Rui Yuan
- 1Key Laboratory of Estuarine and Coastal Project, Ministry of Transport, Shanghai Estuarine and Coastal Science Research Center, Shanghai, China
- 2Research Centre of Ecology & Environment for Coastal Areas and Deep Sea, Southern Marine Science and Engineering Guangdong Laboratory (Guangzhou), Guangzhou, China
- 3Department of Hydraulic Engineering, Tongji University, Shanghai, China
- 4Department of Ocean Science and Engineering, Shanghai Maritime University, Shanghai, China
Sedimentation is an important mechanism to mitigate the shrinking of tidal flat and to restore its ecological function by means of sand or mud nourishment. To explore the sedimentation of cohesive sediments, a seabed tripod observation system was deployed at the subtidal region of the Hengsha Shoal adjacent to the turbidity maximum zone of the Yangtze Estuary for 11 days. The results showed that the fine sediment with the median grain size around 8 mm occupied the whole water column. The seabed was in relative equilibrium state with the fluctuation of bed level smaller than 16 mm during the moderate wind condition while the seabed experienced a rapid erosion of 38mm and a successive intensive accretion of 68mm during the process of wind wave and swell. The bottom hydrodynamic at 0.3mab during the bed accretion was stronger than that during the bed erosion. The deposition process of cohesive sediments can be better described by the simultaneous deposition paradigm than that by the exclusive deposition paradigm according to the direct data-model comparison of the bed level changes, especially during the impact of fluid mud. Three possible reasons for the better performance of the simultaneous deposition paradigm were proposed. The first possibility is that the fine suspended sediments do maintain a continuous contact with the sediment bed since the direct bed level changes during our observation period has been well reproduced by the simultaneous deposition paradigm. The second possibility is the SSC-induced turbulence damping which facilitates the fine sediment settling in the form of cohesive sediment flocs, indicating the settling of sediments can’t be judged by the critical shear stress for deposition just based on the single particle grain size. The last possibility is the fluid mud-induced overestimated bed shear stress by using turbulent velocity fluctuation above the fluid mud-water interface, which produces excess sediment erosion waiting to be compensated by the simultaneous deposition paradigm. For practical modeling purposes, modeling under the simultaneous deposition paradigm can give satisfactory results for the sedimentation of cohesive sediment especially during the impact of wave or swell.
1 Introduction
Tidal flat, located at the forefront of the coastal estuary wetland, connects marine, terrestrial as well as freshwater ecosystems. As a key component of estuarine ecosystem, tidal flats provide important ecosystem services such as shoreline stabilization, storm and wave buffering, breeding and nursing ground as well as carbon sink (Costanza et al., 1997; Barbier et al., 2008; Cao et al., 2020; Li et al., 2021; Toniolo et al., 2021; Zhang et al., 2021). However, in recent years, tidal flats are under increasing threat from the anthropogenic interventions (e.g., upstream damming, land reclamations) and climate change (e.g., sea level rises, typhoon). For example, since 1990s, the land area in the Yangtze Estuary has increased by 10% (Zhang et al., 2020) while the growth rate of the subtidal zone of tidal flat, including the Hengsha Shoal which we studied in this paper, has decreased from 6.0 km2/year (1977-1994) to -6.2 km2/year (1994-2011) (Du et al., 2016). The weakened buffering capacity of tidal flats affects the estuarine land safety and wetland ecosystem stability (Ma et al., 2019; Kim et al., 2020).
Under these circumstances, sedimentation is an important mechanism to mitigate the shrinking of tidal flat and to restore the ecological function of tidal flat. Some practical approaches have been designed for utilizing sedimentation to prevent the erosion of tidal flats, which include soft solutions such as sand nourishments (Cooke et al., 2012; Van der Werf et al., 2015; Brand et al., 2022) and traditional hard solutions such as dikes, groins and seawalls (Kuang et al., 2019). Recently, some innovative underwater nourishments, which are located at the subtidal regions, such as the channel wall nourishment, the shoreface nourishment and the Mud Motor, have been proposed as a more simplified and economical process of nourishing, but the effect of nourishments on the local morphodynamics is still not well understood (Baptist et al., 2019; Huisman et al., 2019; Brand et al., 2022). Therefore, much more studies should be conducted on the sedimentation of cohesive sediments at the subtidal flat.
Previous studies pay much attention on the profile shape of the tidal flat and its long-term morphodynamics (Kirby, 2000; Yang et al., 2003; Friedrichs, 2011; Liu et al., 2011). Tidal current and wave are the two dominant forces that favor a dynamic equilibrium shore-normal convex-up and concave-up profile of tidal flats respectively (Friedrichs, 2011). The analytical result as well as the in-situ observation supports the trends that the net transport of suspended sediment at the tidal flat tends to be landward when being dominated by the tidal energy and to be seaward when being dominated by the wave energy (Janssen-Stelder, 2000; Yang et al., 2003; Friedrichs, 2011), which further contributes to the tidal flat erosion during periods of high waves alternating with tidal flat deposition in the presence of mainly tidal currents (Lee et al., 2004; Yang et al., 2008). Other studies concern about some local features of tidal flat and theirs morphodynamics process such as the development and migration of the tidal creek (Wang et al., 2020; Zhao et al., 2022), the morphodynamics impact of emergent vegetation (Sánchez et al., 2001; Temmerman et al., 2007; Schwarz et al., 2014) and the local sediment dynamics accompanied with its morphological impacts (Zhu et al., 2017; Zhu et al., 2019; Wang et al., 2020). Among theses, efforts have been made over the last two decades to measure the erosion threshold of sediments (see the summary by Hir et al., 2008). Recently, Zhu et al. (2019) highlighted the complexity in predicting the erosion of tidal flat due to needing a number of assumption and simplification and endeavored to evaluate the parameters for erosion rate formulation based on the local observation results.
In contrast to the number of studies on erosion properties, few field investigations have been conducted on sedimentation properties (Azhikodan and Yokoyama, 2018), which is the main concern of this paper. The sedimentation at the tidal flat is related to the sediment characteristics (settling velocity, critical shear stress for deposition), the near bed suspended sediment concentration (SSC) and the deposition paradigm. In coastal sedimentology and morphodynamics, especially for those fine sediment estuaries with median grain size (D50) finer than 63 µm, the settling velocity directly determines the vertical distribution of SSC and near-bed deposition flux (Wan et al., 2015). There are a number of factors controlling fine sediment settling velocity such as SSC, turbulence, temperature, salinity, floc size and density, mineral and organic compositions, biological coatings, and the concentration of positive ions in the suspension (Guan, 2003; Winterwerp and Kesteren, 2004). SSC is regarded as the active scalar of settling velocity and as one of the major determinants of fine sediment settling process (Gratiot et al., 2005; Manning et al., 2010). The fine sediments experiences two distinct settling processes with the increasing SSC, that are the accelerated flocculated settling when the SSC is below the certain limit and the decelerated hindered settling when the SSC is over this critical value (Whitehouse et al., 2000; Wan et al., 2015). The hindering effects that are observed under quiescent conditions when the concentration exceeds the certain limit (approximately 10 kg/m3) are reduced in highly turbulent conditions (Gratiot et al., 2005). Meanwhile, the bottom water turbulence will be suppressed if the near-bed high SSC prevails and generates a strong vertical stratification, which prevents the upper high tidal energy from being transferred into the water bottom and impacts the erosion and deposition of bed (Shen et al., 2020; Wu et al., 2022).
The critical shear stress for deposition could be another important factor controlling the sedimentation of tidal flat. In general, the critical shear stress for suspended sediment deposition is smaller than the erosion threshold, such that an intermediate range of bottom shear stresses can exist in which neither erosion nor deposition occurs (Sanford and Halka, 1993). However, the need of the deposition threshold for describing the near-bed deposition flux is still under debate, as there are two different paradigms of the erosion and deposition, the exclusive paradigm and the simultaneous paradigm (Sanford and Halka, 1993; Zhu et al., 2017; Dong et al., 2020). The exclusive paradigm suggests that the deposition in the bed occurs only when the bottom shear stress drops below the deposition threshold. In contrast, the simultaneous paradigm allows the deposition to take place at all times regardless of the deposition threshold. A distinct discrepancy of supporting each deposition paradigms has been found among the results from laboratory experiments (Partheniades, 1986; Lau and Krishnappan, 1994; Ha and Maa, 2009), field measurements (Kranck and Milligan, 1992; Sanford and Halka, 1993) and numerical simulations(Ao et al., 2010; Sanford, 2008; Shen et al., 2018; Dong et al., 2020), as the laboratory measurements often seem to support exclusive paradigm while field data or numerical simulation tend to support continuous deposition or the both respectively. Besides that, in natural environments, the combined effects of physical processes, geochemical properties, and biological activity complicate the determination of the critical shear stress for erosion and deposition (Grabowski et al., 2011), which makes the value of deposition threshold become quite variable (Dong et al., 2020).
Although the above studies broaden our knowledge of the morphodynamics of tidal flats, few attentions have been paid on the morphodynamics at the subtidal region of the tidal flat (Yang et al., 2003) and the sedimentation properties. Yang et al. (2003) had proposed to deem the tidal marshes, unvegetated tidal flats, and adjacent subtidal regions as a coupled system and examined its simultaneous response to storms. Recently, the cross-shore analysis on the turbulence, wave energy and sediment transport in the intertidal and shallow subtidal zones of sand beach system has been received increasing attention (Christensen et al., 2018; Christensen et al., 2019; Savige et al., 2021). Therefore, more efforts should be paid to study the sedimentation at the subtidal region of tide flat not only for enriching our knowledge of the sedimentation properties but also for better utilizing the underwater nourishment to mitigate the shrinking of tidal flat under the threat of global climate change.
In this paper, we set up a field campaign at the subtidal region of the Hengsha Shoal which is located near the estuarine turbidity maximum (ETM) of the Yangtze Estuary, China to study the sedimentation process during the impact of wind wave. Instruments with high vertical and temporal resolutions were deployed to capture the near bed SSC variation and the bed level changes for 11 days. Using the in-situ data, we reveal a phenomenon on the sedimentation with extreme high SSC at the subtidal region of the tidal flat under the impact of wave and discuss the performance of different deposition paradigms to estimate the near-bed deposition flux.
The paper is organized as follow. Section 2 gives an overview of the study area. The field campaign is described in Section 3. This section provides the definitions of variables and parameters calculated by the observed data as well. Results are shown in Section 4. The interpretation and discussion of the results follows in Section 5. Conclusions are drawn in Section 6.
2 Study area
In situ observations were conducted at the subtidal region of Hengsha Shoal, located near the ETM of the Yangtze Estuary, China (Figure 1A). The Yangtze Estuary is well-known for the considerable runoff from the Yangtze River, strong tides and high SSC. It has a three-tier bifurcation and four outlets to the East China Sea. They are the North Branch, the North Channel, the North Passage and the South Passage, respectively (Figure 1A). The average tidal range varies from 2.4 to 3.2 m, and the annual average freshwater discharge reaches 28,527 m3/s with the peak value above 50,000 m3/s during flooding season (Chen et al., 1999). Semi-diurnal tides and reciprocating tidal currents predominate in this estuary. The fluvial annual mean sediment discharge is approximately 0.486 billion tons before the 1990s (Milliman and Syvitski, 1991) and has been reduced to 0.123 billion tons after the operation of Three Gorges Dam in the Yangtze River in 2013 (Dai et al., 2018). In the Yangtze Estuary, the ETM zone is extremely large on a spatial scale, spreading over the entire mouth zone downstream from the south branch and inside the 10-m isobaths (Han and Lu, 2015). The maximum near-bed SSC at the ETM zone of Yangtze Estuary can reach above 40 kg/m3 during a tidal cycle (Lin et al., 2021). Controlled by the East Asian monsoon system, southeasterly winds dominate in summer in the Yangtze Estuary, with multi-year averages ranging between 3.5 and 4.5 m/s (Yang et al., 2008).
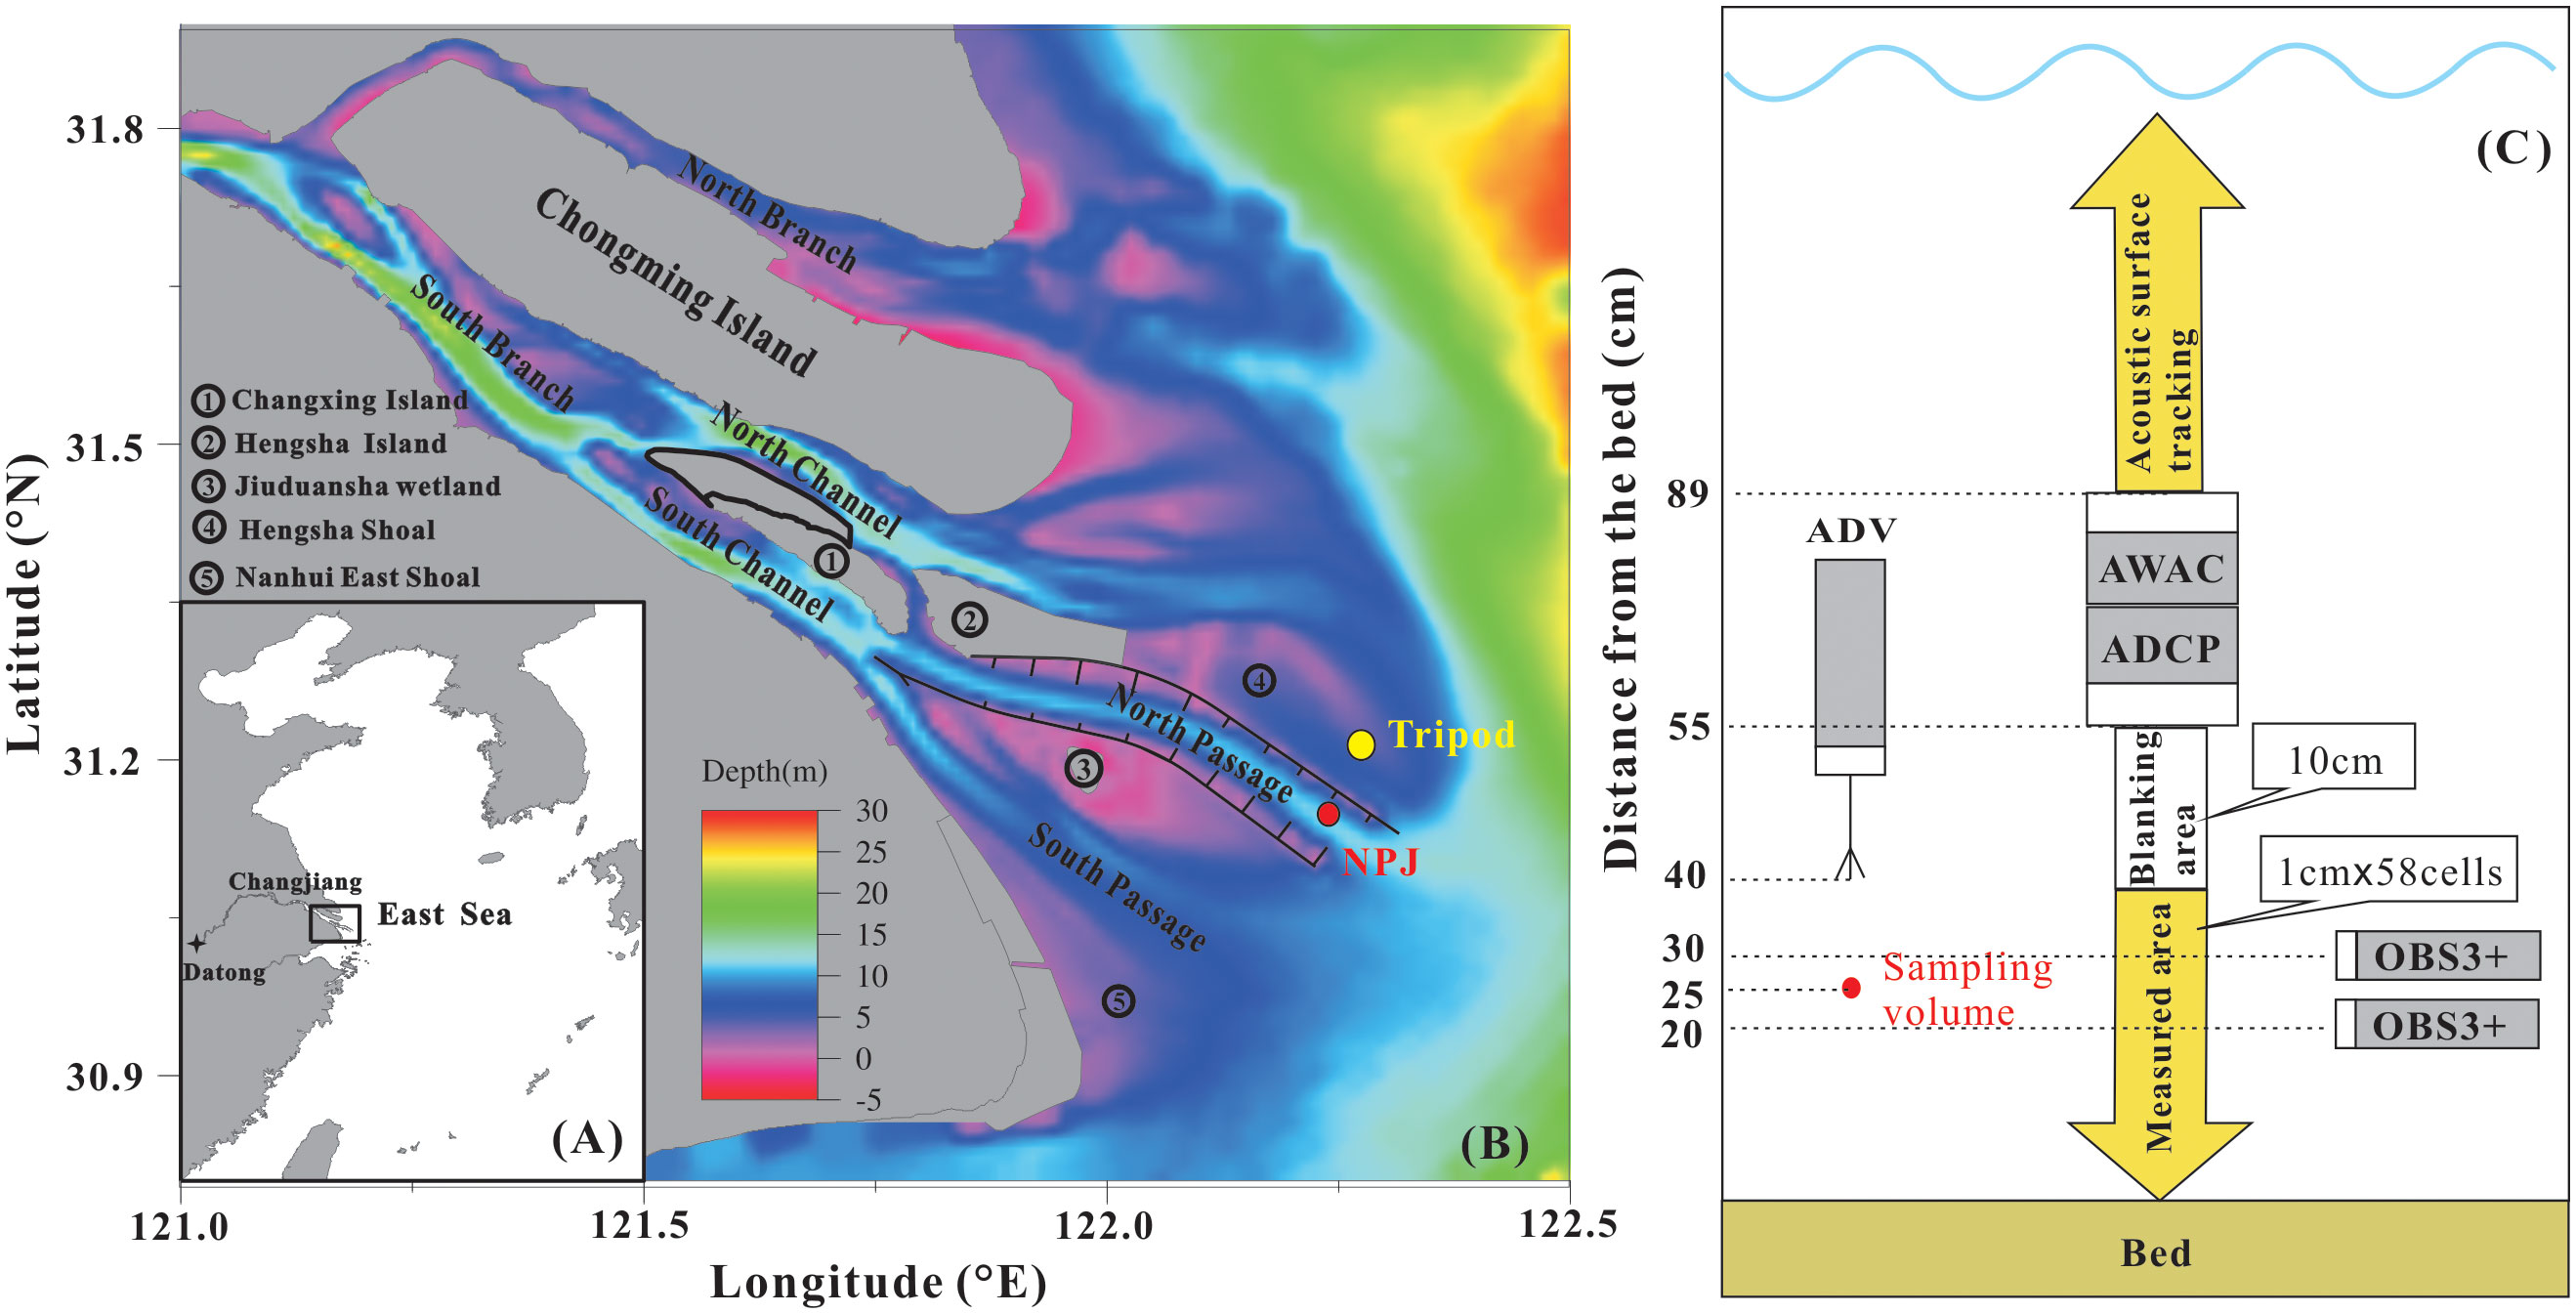
Figure 1 (A) Location of Yangtze Estuary. (B) Map of the Yangtze Estuary showing the observation sites by means of tripod. (C) Schematic representation of instrument deployment and location with respect to the seabed. The AWAC was used to obtain the wave parameters. the ADCP and the OBS3+ were used to measure velocity profiles and turbidity signal respectively. The ADV was deployed for the high-frequency sampling of velocity data at 8 Hz as well as the bed level change.
The Hengsha Shoal is located at the east end of the Hengsha Island, situated at the lower segment of the North Channel (Figure 1A). It is in a tongue-shaped distribution along the west east direction. As the forefront of Hengsha Island, the Hengsha Shoal is constantly under the impact of wind wave, tidal flow as well as the movement of ETM. After the implementation of the land reclamations in the intertidal zone of Yangtze Estuary, the depth-mean of tidally averaged SSC has been declined and the landward boundary of the ETM zone in the North Channel is moved seaward (Teng et al., 2021). The erosion in the subtidal region of Hengsha Shoal has been accelerated owing to the intertidal reclamations (Du et al., 2016). The bed elevation of our observation site was 4.9m below the mean sea level.
3 Material and methods
3.1 Data collection
Our observations, lasting for 11 days, were carried out from June 21 to July 2, 2019. The bed level changes in association with tides and waves were monitored by the tripod observation system. The tripod was mounted with one wave monitoring instrument, two current monitoring instruments and two water turbidity monitoring instruments (Figure 1B).
The wave height and wave period were collected by the Acoustic Wave and Current Meter (AWAC, Nortek AS, Norway) which tracked the surface fluctuations at a frequency of 2 Hz over a duration of 1024 s, yielding 2048 measurements per burst.
An Acoustic Doppler Current Profile (ADCP, 2.0 MHz high-resolution profiler, Nortek AS, Norway) was used to measure high-resolution 3D current velocity profiles. The burst interval was 4 min. Each velocity profile was the mean value collected at a frequency of 1 Hz over a duration of 30 s. The ADCP was attached to the tripod with the transmitters facing downwards and was located 55 cm above bed (ab). The blanking distance was 10 cm, and the cell size was set to 1 cm.
An Acoustic Doppler Velocimeter (ADV, 6.0 MHz Vector current meter, Nortek AS, Norway) was used to measure three-dimensional turbulent velocities in a 2.65 cm3 volume of water. The ADV was fixed firmly to a tripod, with the transmitters oriented downwards and the emitter positioned 40 cm ab. The sampled water volume, which was positioned 15 cm in front of the emitter, had a height of 25 cm. the ADV recorded 128 sets at a frequency of 8 Hz, resulting in a 15 second sampling duration every 4 min. The ADV recorded current data was discarded when the number of bad data (signal-to-noise ratio (SNR)< 20 or correlation coefficient (COR)< 70) reached 30% of the whole dataset.
Turbidity in the water column was measured every 4 min by using optical back-scatter sensors (OBS3+, Campbell Scientific,Inc, USA), with the probes positioned 20 cm and 30 cm ab. Turbidity signals from the OBS sensors were converted into SSC values via calibration with in situ sediment samples. The calibration experiment was carried out in the laboratory. Turbidity dataset was collected with different concentrated well-mixing water samples obtained by constantly adding sediment from in-situ sediment samples to clear water. At the same time, different concentrated water samples were filtered by 0.45-μm filters to obtain SSCs. Regression between SSC and OBS3+ derived turbidity yielded a correlation coefficient of 0.99 (Figure 2). As the regression figure showed that the relationship between turbidity signal strength (counts) and the SSC had two different characters that were the positive relationship and the negative relationship. The turbidity signal strength (counts) was increased with the SSC when the SSC was lower than 10kg/m3, which presents a positive relationship. While, when the SSC is greater than a certain value, the signal strength decreased dramatically with the increasing SSC, which presents a negative relationship. Due to the impact of extreme high SSC, the acoustic signal strength emitted from the ADCP was absorbed dramatically, which presented a sharp decrease of signal strength. Therefore, the negative relationship was used to estimate the SSC when the abnormal signal strength recorded by the ADCP was found.
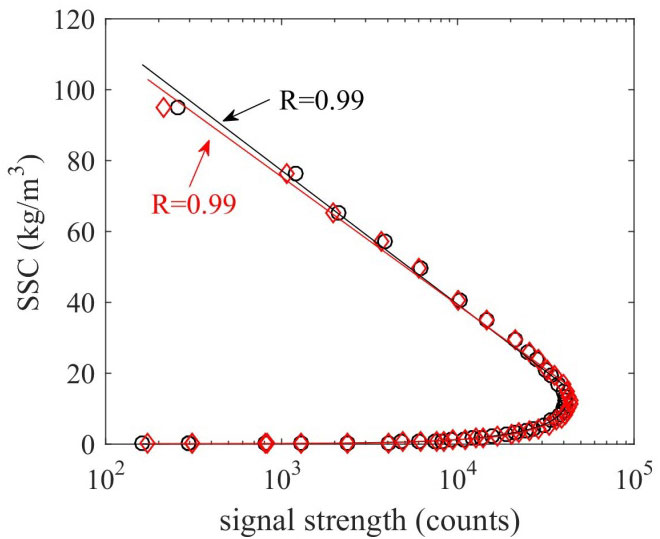
Figure 2 Regression relationship between the Obs3+’s signal strength and the SSC.
The bed level changes were obtained by the ADV’s measured distance between its probe to the sea bed (Andersen et al., 2007; Yu et al., 2017; Zhu et al., 2019). The ADV measured the distance between the transmitter and the sediment surface every 4 min with a high accuracy of ±1 mm. The wind velocity and direction were monitored at the NPJ station (Figure 1A).
3.2 Data analysis
3.2.1 Calculation of the bed shear stress
The total bed shear stress due to the combined wave-current action, τcw (N/m2), was calculated using the Grant and Madsen (1979) wave–current interaction model:
in which τw (N/m2) and τc (N/m2) are the wave- and current-induced bed shear stresses, respectively. φcw (°) is the angle between the current direction φc (°) and wave propagation direction φw (°). Four separate parameters are required to calculate total bed shear stress, that are τw , τc , φw and φc .
The wave-induced bed shear stress, τw , was obtained by analyzing surface-elevation monitoring data. Wave parameters (significant wave height Hs and significant wave period (Ts ) were derived from the monitored data recorded by AWAC via SUV method (Pedersen et al., 2007). At the edge of the wave boundary layer, the peak orbital excursion and peak orbital velocity can be express as:
in which k (=2π/L , is the wave length) is wave number (m-1), h is water depth (m) and ω is angular velocity (s-1). The time-averaged (over half a wave cycle) bed shear stress due to waves, τw (N/m2), can be expressed as (Van Rijn, 1993):
in which ρ is the water density, fw is the friction coefficient (-), which is determined by the diagram of hydraulic regimes of oscillatory flow (Van Rijn, 1993).
where (-) and (-) are the wave Reynolds number and relative roughness, respectively. ks (=2.5d50 ) is the Nikuradse roughness where d50 is the median grain size of the bed sediment, and υ (m2/s) is the kinematic viscosity of water.
Since the fluctuating velocities measured in the vertical dimension are assumed not to be contaminated by wave orbital motion (Kim et al., 2000; Andersen et al., 2007), the current-induced bed shear stress, τc , was estimated by the variability in turbulent velocity fluctuation in the vertical dimension, , via the following equation (Stapleton and Huntley, 1995):
Because the measured near-bed velocities can be affected by wave motion in tidal areas, wave-turbulence decomposition is applied (Zhu et al., 2016). We used the energy spectrum analysis (ESA) approach, which is a technique developed by Soulsby and Humphery (1990) to split the variance without separating the instantaneous time series. The current direction and the wave direction were obtained from the burst-mean velocities and decomposed wave orbital velocities, respectively (Zhu et al., 2016).
3.2.2 Bed level simulation
The bed level variation was determined by the rates of erosion, E, and deposition, D, in kg/m2/s:
where Δη is the bed level variation in the time period Δt , ρdry (kg/m3) is the dry density of surficial sediment. The dry density is set to 1400 kg/m3 in this paper, which is close to the value used by Zhu et al. (2017) in the Yangtze Estuary. The rates of erosion are estimated by the Ariathurai-Partheniades equation (Partheniades, 1965; Ariathurai, 1974):
where M (kg/m2/s) is the erosion constant, τcw (N/m2) is the total shear stress due to the combined effects of wave and current action, τe (N/m2) is the critical bed shear stress for erosion. The estimate of the erosion threshold remains a challenge since it depends on the grain size distribution (Shields, 1936), the chemical impacts of cohesive sediment (Taki, 2000) and the biological effects (Van Prooijen et al., 2011). Thus, in this paper, the erosion threshold was determined by comparing time series of the bed shear stress and bed level changes in high frequency (Andersen et al., 2007; Verney et al., 2007; Shi et al., 2015; Zhu et al., 2019).
The deposition rate, D, in eq.(7) was derived from the sediment flux at the bed according to the aforementioned two different deposition paradigms:
or
where cb (kg/m3) is the near bed suspended sediment concentration, ωs (m/s) is the group settling velocity of suspended sediment. During the period of accelerated flocculated settling, the group settling velocity of cohesive sediment is strongly dependent on the SSC and can be estimated as:
in which E1 and E2 are constants varying among estuaries (Whitehouse et al., 2000). As the sediment concentration is over a certain limit, the process of hindered settling must be accounted for estimating the near bed deposition flux. We followed the formula of Whitehouse et al. (2000) which considered the process of hindered settling.
de=lCE2/2,
,
where de is the effective diameter of a floc increasing with the volume concentration C=cb/ρs , ρs is the density of sediment, l is the length-scale, ρe =ρ+0.03(ρs−ρ) is the effective density of the floc and Cf is the volume concentration of floc. In the Yangtze Estuary, E1 and E2 can be set to 0.002 and 1.5, respectively (Zhu et al., 2017).
3.2.3 Gradient Richardson number
The gradient Richardson number (Ri) between 0.2 mab and 0.3 mab is calculated by the ratio of the square buoyancy frequency to the square vertical velocity shear (Dyer, 1986):
where g is the gravity acceleration (m/s2), ρc=ρ+(1−ρ/ρs)·SSC is the SSC-induced density (kg/m3), z is the height above the seabed. The velocities between 0.2mab and 0.3mab were obtained by the bottom ADCP profiles. The SSC at 0.2mab and 0.3mab was collected by the OBS3+. Based on the linear stability theory, the critical value for active mixing is Ric=0.25 . When Ri<0.25 , the flow is unstable and the mixing is enhanced. On the contrary, when Ri>0.25 , the flow is stable and the mixing is suppressed.
4 Results
4.1 Wind and wave
During the 264-h spring-neap tidal cycle, the wind and wave conditions were quite variable (Figures 3A, C). At first, prior to the hours 72 (Phase I, moderate wave), the prevailing wind direction was northeaster and the wind speed was generally moderate. The averaged wind velocity at the NPJ station during this period was 5.2 m/s and the averaged significant wave height (SWH) at the observation site was 0.5 m. During the period from the hours 72 to 120 (Phase II, wind wave), the southeaster wind prevailed and the wind speed was increased rapidly, with the maximum wind speed exceeding 12 m/s. The wind wave was correspondingly intensified, with the SWH increased up to 0.84 m at the observation site. During the period from the hours 120 to 168 (Phase III, swell), the wind speed was back to normal, with the minimum wind velocity being 0.6 m/s and the maximum wind velocity around 9.0 m/s. The averaged wind velocity during this period was 4.3 m/s and the wind direction was somewhat variable. In contrast to the weak wind speed, the wave dynamic was increased dramatically due to the impact of the swell. The strongest wave process was appeared in this field campaign, with the maximum SWH being 0.92 m and the longest significant waver period (SWP) around 8 s. After the impact of swell (Phase IV, hours from 168 to the end, moderate wave), the wind speed remained moderate in general. The wind direction shifted constantly and the wind wave was weak. The averaged wind speed was 5.2 m/s and the averaged SWH at the observation site was 0.4 m. The SWP during this period was fluctuated around the 4.4 s.
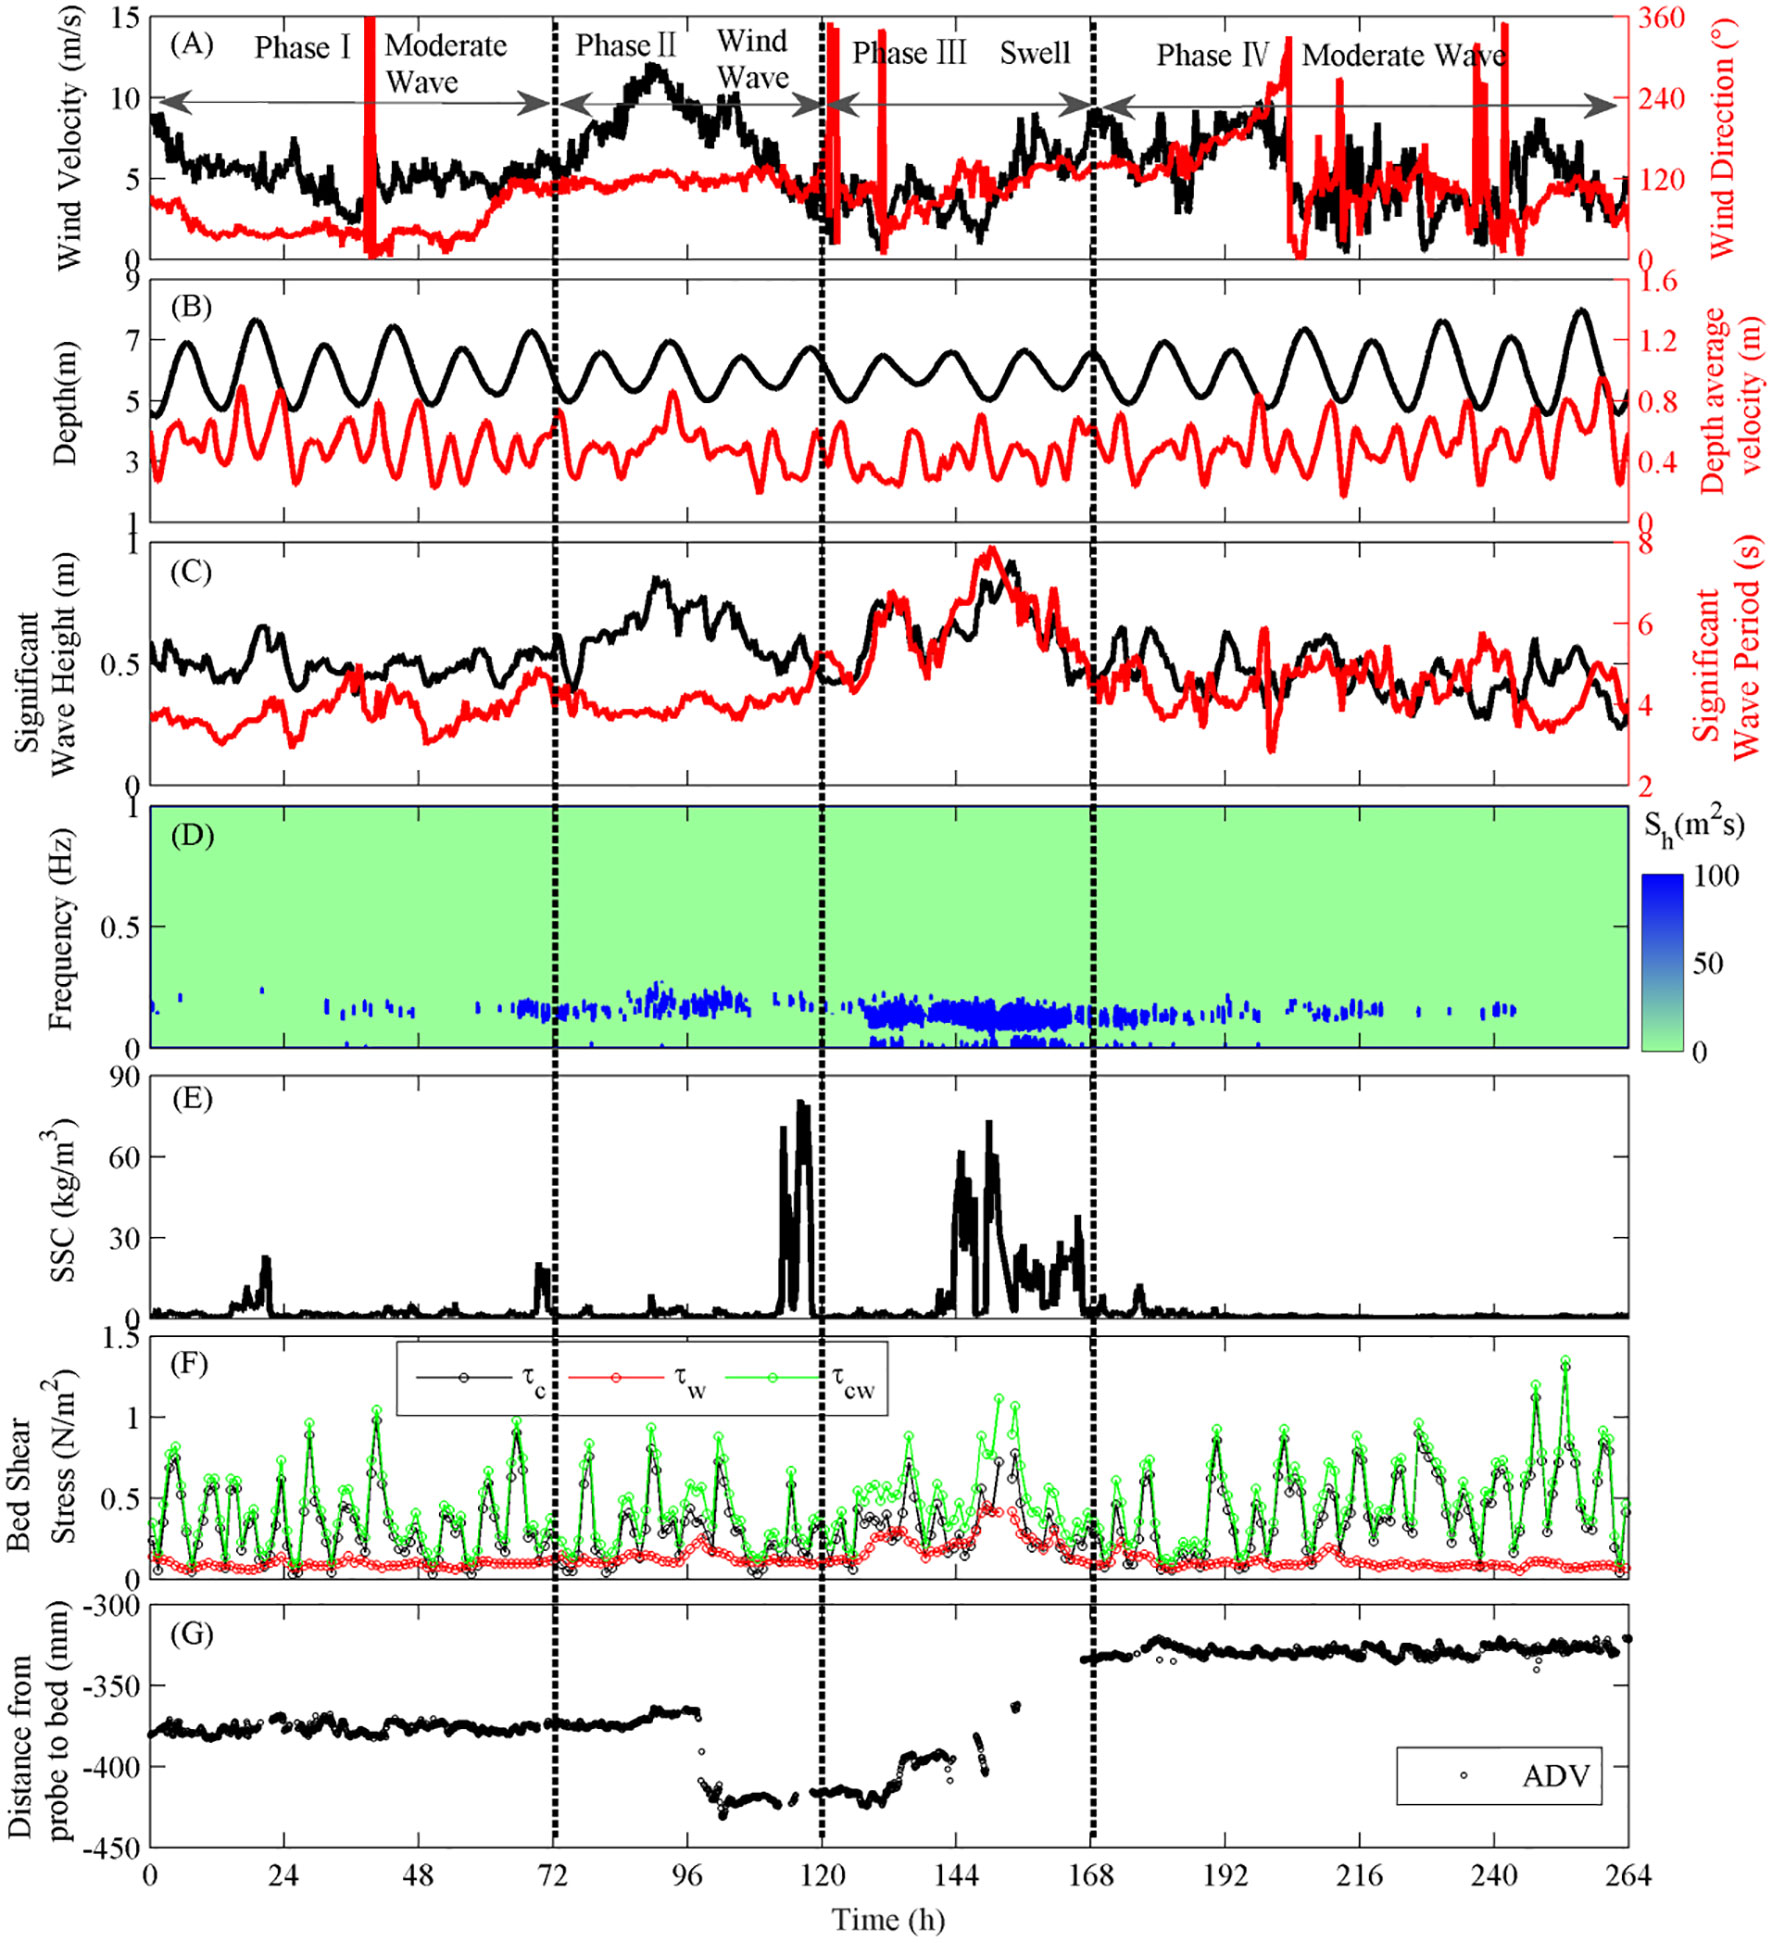
Figure 3 Time series of (A) wind velocity and direction, (B) water depth and depth-averaged current velocity, (C) SWH and SWP, (D) energy spectra of water level (Sh), (E) SSC at 0.2 mab, (F) wave/current-induced bed shear stresses (τw and τc , respectively) and total bed shear stress (τcw ) and (G) the bed level changes observed by ADV instrument.
4.2 Tidal current and bed shear stress
During the Phase I, the tide was on the transition from the spring tide into the neap tide. The depth-averaged current velocity at the observation site varied periodically between the 0.23 m/s and 0.9 m/s, with an averaged value of 0.51 m/s during this period (Figure 3B). Due to the moderate wind condition, no clear peak was seen in the water level energy spectrum (Figure 3D), which had also been observed at the intertidal flat of the Yangtze Estuary (Zhu et al., 2016). The wave-induced bed shear stress (τw ) was negligible, with the value less than 0.15 N/m2. The averaged total bed shear stress (τcw ) during this period was 0.4 N/m2 (Figure 3F).
During the Phase II, the tide dynamic became weaker. The depth-averaged current velocity was ranged from 0.19 m/s to 0.86 m/s, with an average value of 0.48 m/s (Figure 3B). In contrast to the weak tidal dynamics, a strong onshore wind prevailed, which generated significant wave dynamic at our observation site. A clear single-peak, occurred at a frequency around 0.18 Hz, was seen in the water level energy spectrum due to the impact of wind wave (Figure 3D). The wave-induced bed shear stress was increased to 0.26 N/m2, with an averaged value of 0.13 N/m2 during this period (Figure 3F). The averaged total bed shear stress during this period was 0.38 N/m2.
During the Phase III, the neap tide dominated and the wild wind calmed down. The depth-averaged current velocity was further decreased, ranging from 0.24 m/s to 0.7 m/s, with an average value of 0.42 m/s (Figure 3B). In contrast to the weak tide and wind, a strong wave process dominated this period due to the impact of the swell. A clear double-peak was found in the water level energy spectrum, of which the energy spectrum covering from 0.07Hz to 0.19 Hz was significantly enhanced (Figure 3D). The wave-induced bed shear stress was further increased to 0.46 N/m2, with an averaged value of 0.22 N/m2 during this period, which was stronger than the wave-induced bed shear stress during the Phase II (Figure 3F). The averaged current-induced bed shear stress during this period was 0.32 N/m2, which was a little greater than the averaged current-induced bed shear stress, around 0.28 N/m2, during the Phase II (Figure 3F). This phenomenon can be attributed to the extra turbulence increasing τc during the impact of wind or wave (Zhu et al., 2016). The averaged total bed shear stress during this period was 0.5 N/m2.
During the Phase IV, the tide was on the transition from the neap tide into the spring tide and a moderate wind prevailed. The depth-averaged current velocity was ranged from 0.17 m/s to 0.95 m/s, with an average value of 0.5 m/s (Figure 3B). Without the prominent impact of wave, the current-induced bed shear stress was increased in accordance to the tide dynamics (Figure 3F). The averaged total bed shear stress during this period was 0.5 N/m2.
4.3 Nearbed SSC and bed level changes
The time series of the nearbed SSC monitored at 0.2 mab and the corresponding bed level changes were shown in Figures 3E and G. During the Phase I, the SSC at 0.2 mab was generally lower than 5 kg/m3, except for the high SSC recorded at the hours 23 and hours 71. The averaged SSC during the flood tide and the ebb tide were 2.5 kg/m3 and 2.0 kg/m3 respectively. The averaged flood and ebb velocity was 0.47 m/s and 0.55 m/s, respectively. The variation of the SSC at 0.2mab was not in consistence with the variation of the current velocity, which presented the correlation coefficient between the SSC and current velocity lower than 0.2. The lower correlation coefficient indicated that the variation of the SSC at our observation site was not only related to the local sediment resuspension and deposition but also influenced by the advection of the SSC from the nearby ETM zone. This kind of phenomena was also reported in other high turbidity estuary like the Yellow River Delta (Zhang et al., 2022). Recently, Zhang et al. (2021) proposed a multiscale frequency superposition to qualitatively identify the horizontal advection of SSC. During the Phase I, no prominent erosion or deposition of seabed was found, with the bed level fluctuation smaller than 16 mm.
During the Phase II, a strong onshore wind produced a significant increasing of SWH. A prominent erosion of seabed occurred at the hours 96, with the erosion thickness around 38 mm, just when the SWH reached the maximum, which indicated that the wave-induced increase of shear stress triggered the prominent erosion of seabed. However, the corresponding SSC at the hours 96 didn’t reached the maximum during this Phase, with the value lower than 1 kg/m3. The extreme high SSC at 0.2 mab, with the value greater than 70 kg/m3, was appeared after the hours 108 when the wind wave had been diminished. The extreme high SSC lasting for 5.4 hours induced a slight deposition of seabed with the deposition thickness around 8.4 mm.
The neap tide interacting with the swell dominated the Phase III for two days. In the first day, from the hours 120 to the hours 144, the fluid mud (SSC >10 kg/m3) was not appeared although the SWH had been increased due to the impact of swell. The average SSC at 0.2 mab during the first day was 2.0 kg/m3. The bed level was fluctuated slightly during this period, which experienced the swell-induced slight seabed erosion of 8.2 mm from the hours 120 to the hours 130 and the succeeding seabed deposition of 29.8 mm from the hours 130 to the hours 135. The fluid mud appeared at the second day and could almost exist for the whole day except for some short intervals with total 5.75 hours. Due to the absorption of acoustic energy by the fluid mud, the bed level change observed by ADV instrument was missed except for the moments when the fluid mud moved outside our observation site. Thanks to the lower SSC, the ADV captured the trend of bed level variation during and after the impact of fluid mud. According to the measured bed level changes, the rapid seabed deposition of 62 mm during the impact of fluid mud occurred despite of the stronger bed shear stress which was equivalent to the bed shear stress during the Phase II and was stronger than that in the first day during the Phase III.
During the Phase IV, the fluid mud was dissipated and the tidal dynamics was continuously strengthened. Without the impact of wind wave or swell, the SSC at 0.2mab returned to normal and the seabed was in relative equilibrium state with the fluctuation of bed level smaller than 15 mm. The averaged SSC during the flood tide and the ebb tide were 1.17 kg/m3 and 0.7 kg/m3 respectively. The bed levels recorded before and after the impact of fluid mud indicated that the fluid mud tended to encourage the bed sedimentation.
4.4 Sediment properties
During a tidal cycle, the median grain size of nearbed suspended sediment varied between 6.6 μm and 10.2 μm, with the average value of 8 μm. Meanwhile, the averaged median grain size of near water surface suspended sediment was 7.9 μm. The grain size distribution of near bottom suspended sediment was quite close to that of near water surface suspended sediment, with a mud (below 62.5μm) content of over 91% (Figure 4). The median grain size of bed surficial sediment at our observation site was 67.3μm, with a mud content of 48% (Figure 4). Therefore, the fine sediment, not only occupying the whole water column but also representing nearly half of bed sediments, could be the major participant in determining the erosion or the deposition of seabed.
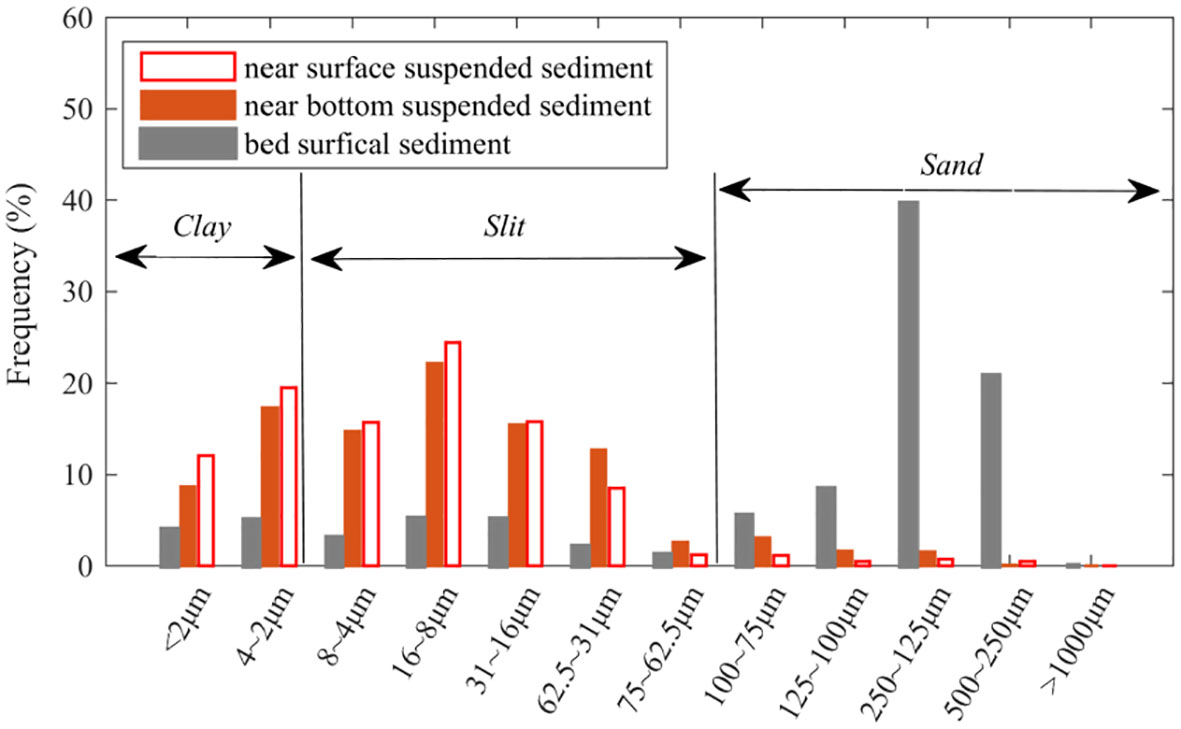
Figure 4 Grain size distribution of suspended sediment as well as the bed surficial sediment sampled at the observation site.
By comparing time series of the bed shear stress and bed level changes in high frequency, which had been captured by the ADV instrument, the critical bed shear stress for erosion (τe) and deposition (τd) was estimated (Andersen et al., 2007). We collected a number of critical bed shear stress, based on the moment when the state of seabed began to shift between the erosion and the deposition. The frequency distribution of the extracted critical bed shear stress during our observation period was shown in Figure 5. The estimated critical bed shear stress for erosion and deposition was 0.15 N/m2 and 0.13 N/m2 respectively, after averaging the top three high-frequency values. The critical bed shear stress for deposition was 0.87 times the critical bed shear stress for erosion (τd=0.87τe ). The estimated critical bed shear stresses for erosion and deposition were therefore applied to describe the bed surficial sediment movement at the subtidal region of Hengsha Shoal.
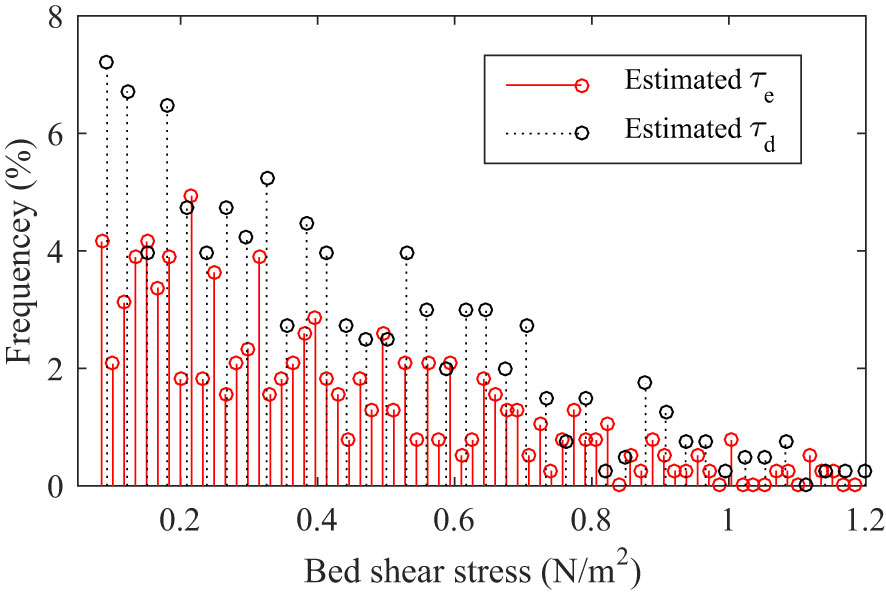
Figure 5 Frequency distribution of the estimated critical shear stress for erosion (τe) and deposition (τd) from the ADV-measured bed level variability.
5 Discussion
5.1 Performance of runs with different deposition model
It’s still under debate that whether the critical bed shear stress for deposition (τd) should be used to describe the physics of sedimentation even among the results of flume experiments (Partheniades, 1965; Krone, 1993; Winterwerp, 2007). The exclusive paradigm which believes that the sedimentation and erosion can’t occur simultaneously in cohesive sediment dynamics was first proposed by Partheniades (1965) according to the experiments carried in a rotating annular flume. In the deposition experiment, the annular flume was set to a specific rotating speed in order to make the mud suspension settle and reach an equilibrium state. After that, the remaining suspension was carefully exchanged with clear water while the flume was maintaining the same speed. It finds that the exchanged water remained clear, which contributes to the conclusion that the erosion does not occur with the deposition. However, in another deposition experiment conducted in a straight flume by using the labeled sediment particles, Krone (1993) found erosion and deposition must occur simultaneously, at least during part of the experiment.
In addition, the indoor experiment can’t well represent the unsteady hydrodynamics in estuary (Sanford and Halka, 1993). Therefore, runs with two different deposition models, the exclusive paradigm (Eq. 8,10) and the simultaneous paradigm (Eq. 8,9), for reproducing the bed level changes (Eq. 7) during our observation period were conducted to discuss the physics of sedimentation at the Yangtze Estuary directly. To fulfill this goal, the erosion constant shown in Eq. 8 should be estimated at first. In estuary, it is quite difficult to accurately calculate the erosion constant because it depends on the consolidation of bed, sediment composition, evolution of the sediment under the complex and mixed effects of the physical and biological interaction process. The typical value of this parameter was in the range of 10-6 to 10-3 kg/m2/s (Ge et al., 2015). And, according to previous studies (Kuang et al., 2013; Ge et al., 2015; Shen et al., 2018), the erosion rate in the Yangtze Estuary was in the range of 2.5×10⁻⁶ to 2×10⁻⁴ kg/m2/s. Due to the uncertainty of erosion constant, the erosion constants were determined in the range of 10-6 to 10-3 kg/m2/s through the process of calibration under two different deposition models during three different phase of our observation period that were the phase of calm wind (Phase I), the phase of wind wave and swell (Phase II and III) and another phase of calm wind (Phase IV) respectively. Meanwhile, the calibrated erosion constant, for example the Mex calibrated under the exclusive deposition model, was also used to predict the bed level changes under the simultaneous deposition model. All the information of running cases and parameter settings was shown in Table 1 and the performances of two different deposition models were shown in Figure 6 and Table 2. During the Phase I and IV, both the simultaneous paradigm and the exclusive paradigm, when using the calibrated erosion constant, could reproduce the relative bed level changes (Figures 6A, C). The RMSEs of case Ex-1 and Sim-1 were both smaller than 6mm (Table 2). However, the trend of this two deposition paradigms showed prominent difference, which showed that the simultaneous deposition paradigm reproduced the trend of the bed level change better than that of the exclusive deposition paradigm (Figures 6A, C). During the Phase II and III, the performance of the exclusive paradigm using the calibrated erosion constant (case Ex-1) was much worse than that of the simultaneous paradigm (case Sim-1), with the RMSE of case Ex-1 around 24.9mm which was bigger than the RMSE of case Sim-1 around 17.5mm (Table 2). Meanwhile, the correlation index of Sim-1and measured bed level change was 0.7 during the Phase II~III, which was quite bigger than the correlation index of Ex-1 with the value of 0.3. The most prominent disagreement between these two deposition paradigms occurred from the hour 144 to the hour 168 when the extreme high concentrated sediment clouds prevailed (Figure 3E). It indicated that the simultaneous deposition paradigm worked more efficiently to reproduce the bed level variation when the extreme high concentrated sediment clouds prevailed such as the mud fluid.
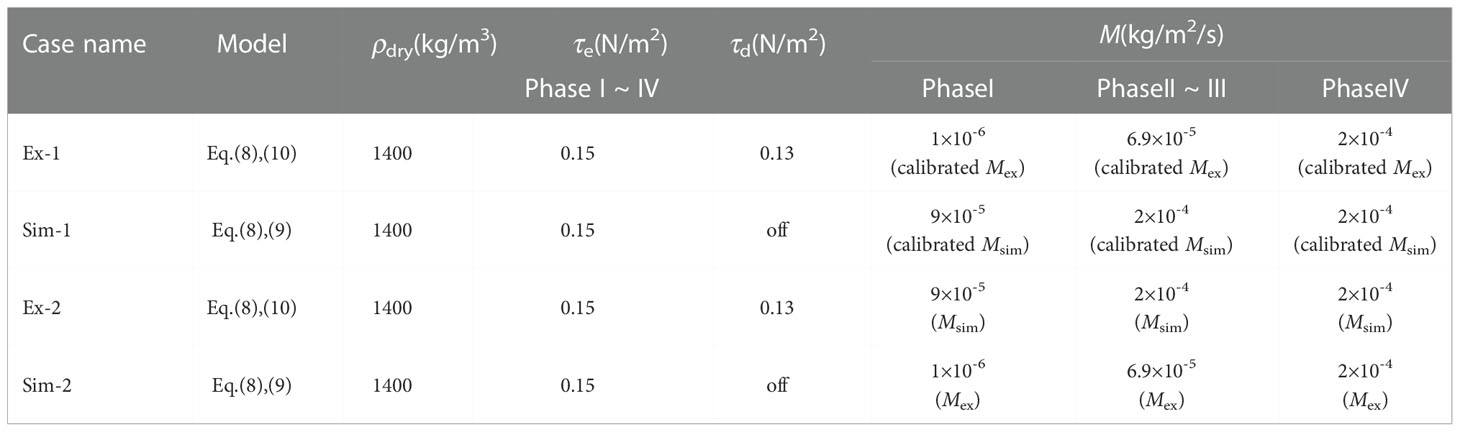
Table 1 Simulation codes with different conditions.
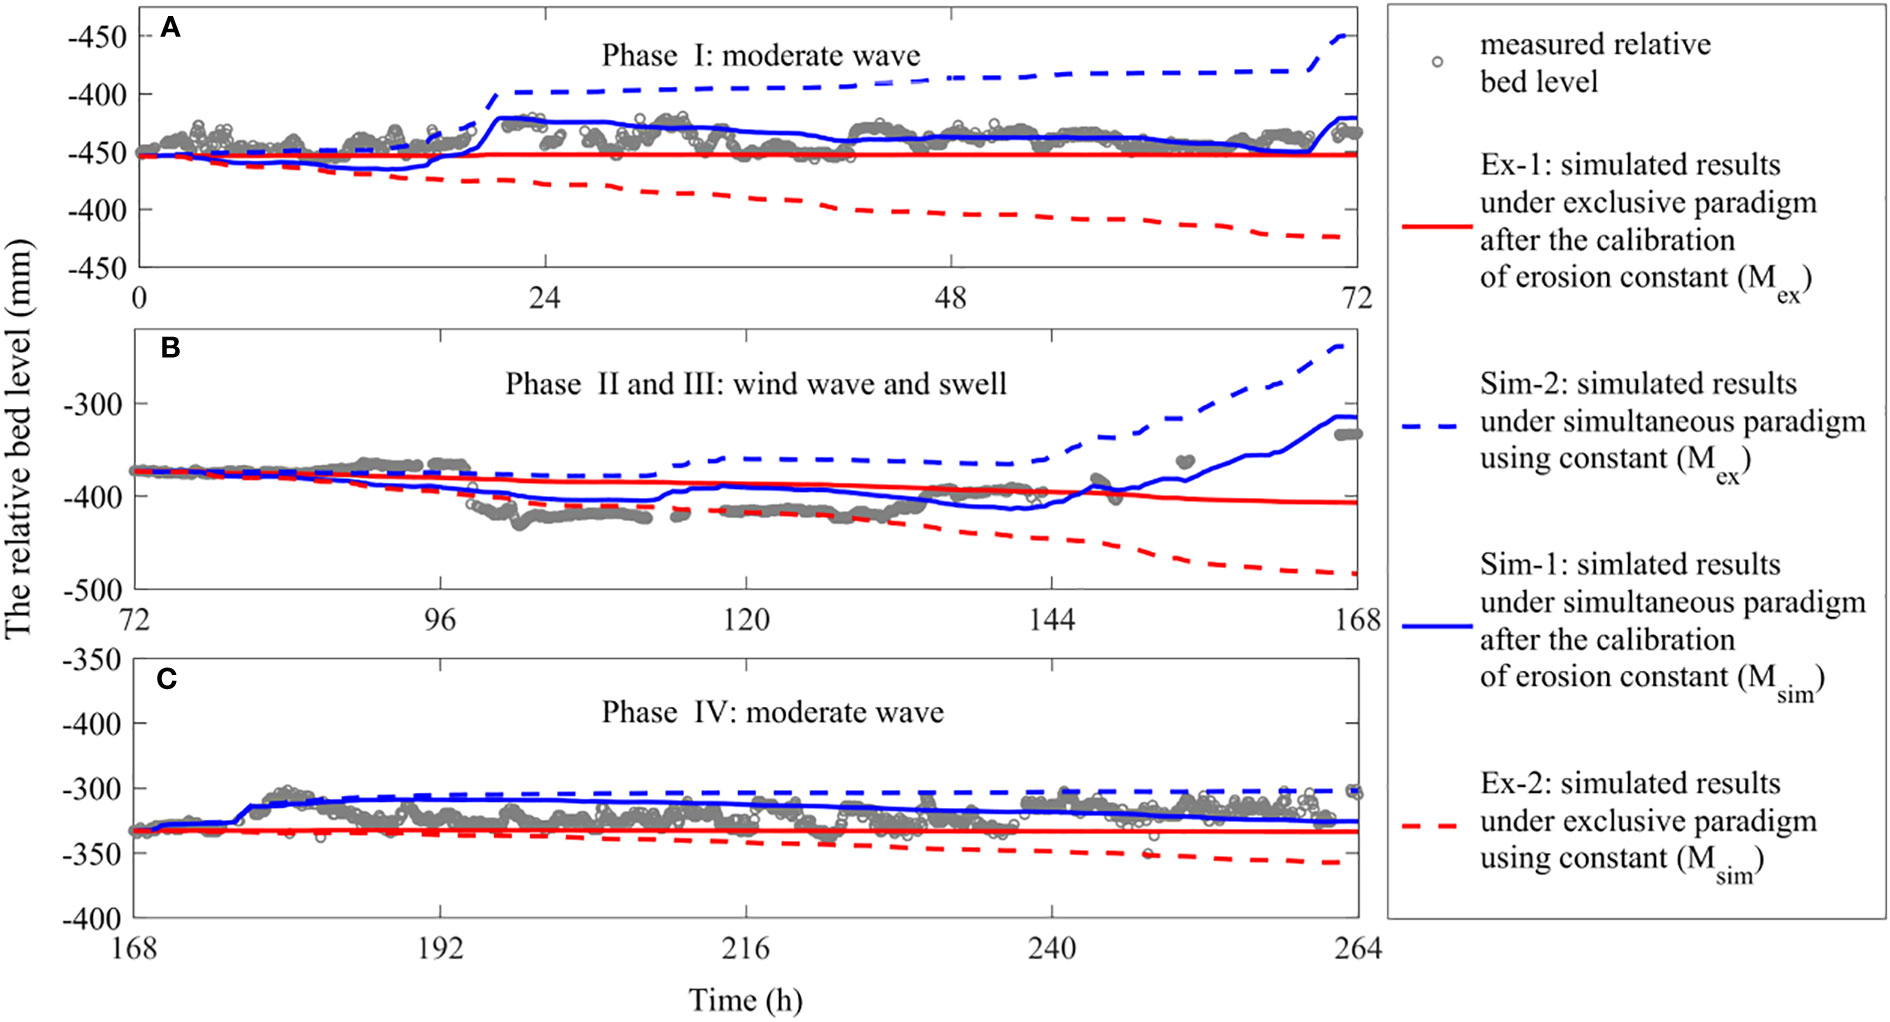
Figure 6 Performances of two different deposition paradigms during our observation period (Phase I: A, Phase II~III: B and Phase IV: C).
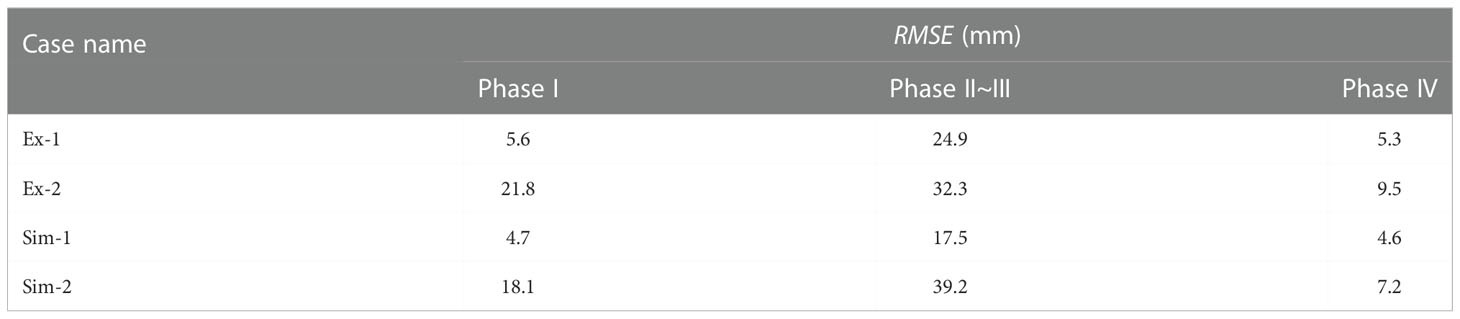
Table 2 Root-mean-square error of simulated results under two different deposition paradigms.
Besides that, the results also showed that the erosion constant played a vital role in determining the performance of each deposition models and the erosion constant didn’t remain constant during our observation period. The calibrated erosion constant adopted by both the exclusive deposition paradigm and the simultaneous deposition paradigm experienced almost the same changing process. From the Phase I to Phase III, the erosion constant was increased dramatically with the help of the wave (or swell) process (Table 1). The reason for explaining this increasing process can be attributed to the bed liquefaction due to the wave process (Lambrechts et al., 2010; Ren et al., 2020). From the Phase III to the Phase IV, the calibrated erosion constant was increased up to 2×10⁻⁴ kg/m2/s under the exclusive deposition paradigm while the calibrated erosion constant under the simultaneous deposition paradigm was remained unchanged, with the value of 2×10⁻⁴ kg/m2/s. Due to the poor performance of exclusive deposition paradigm during the Phase II and III (Figure 6B), the calibrated erosion Mex couldn’t well represent the erodibility of the sea bed. Therefore, it’s more acceptable that the erosion constant (Msim) was nearly unchanged from the Phase III to the Phase IV, according to the results of simultaneous deposition paradigm. The variation of erosion constant is related to the sediment property and the water content (Sanford and Maa, 2001). This unchanged characteristic could be explained by the newly deposited fine sediment whose water content was approximate to that of liquefied surficial sediments during the Phase III.
5.2 Deposition of cohesive sediments during the impact of swell
Generally, different formulations can be approximately equivalent when they are fit to a limit range of same data (Sanford and Halka, 1993). However, the formulations based on two different deposition paradigms can’t reach consensus when reproducing the observed bed level changes during the impact of swell (Phase III, Figure 6B). In response to this problem, a further investigation was carried out to analyze the hydrodynamic and mixing condition during the Phase III of our observation period (Figure 7, Figure 8).
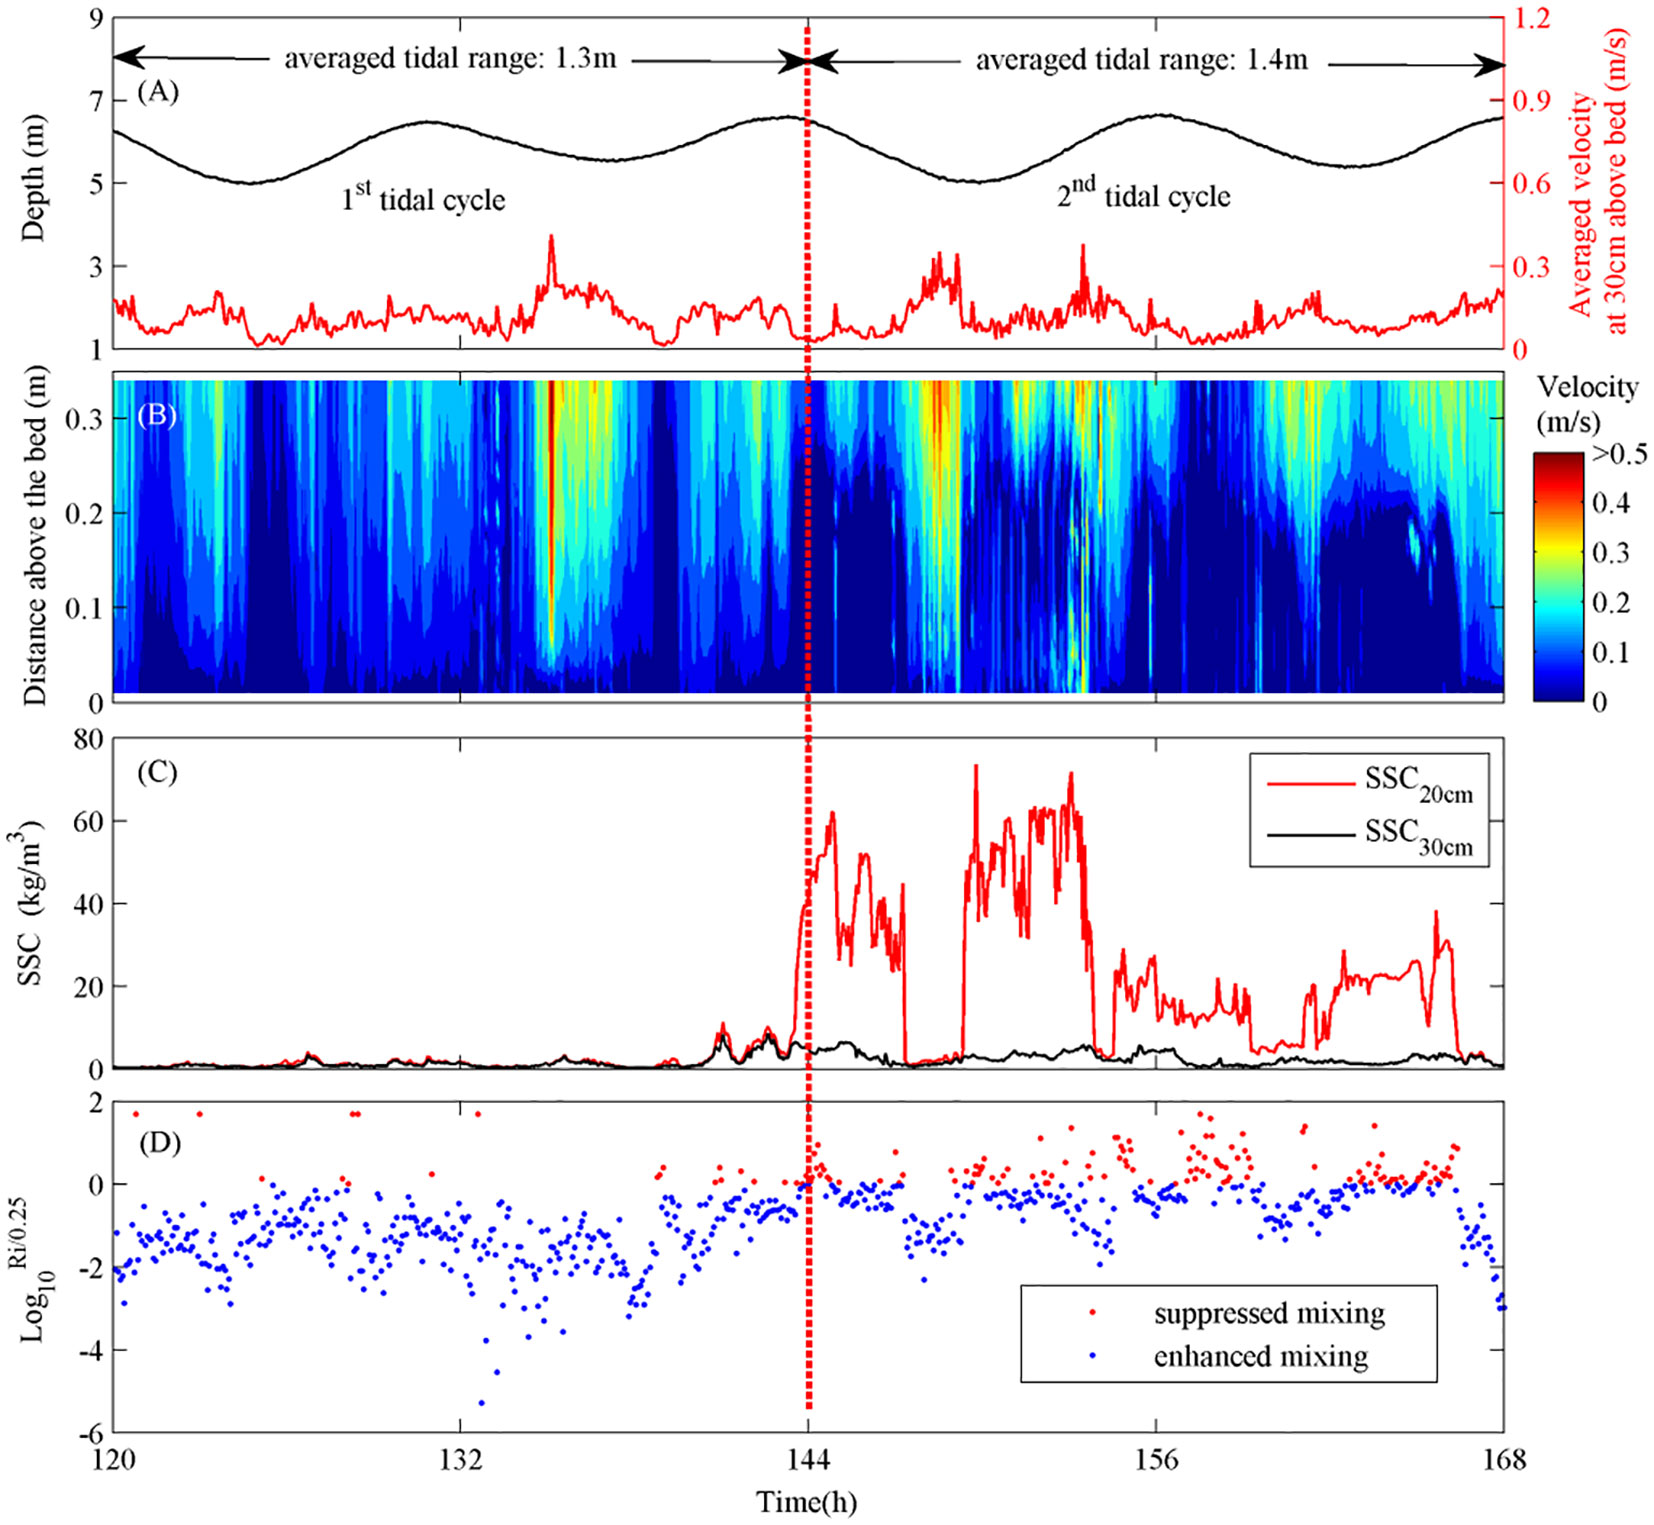
Figure 7 The hydrodynamic and mixing condition within 0.3 mab under the impact of fluid mud during our observation period (Phase III), which includes the times series of vertical-averaged velocity within 0.3 mab and the water depth (A), the profiles of current velocity within 0.3 mab (B), the SSC at 0.2 and 0.3 mab (C) and the mixing condition within 0.3 mab described by gradient Richardson number (D).
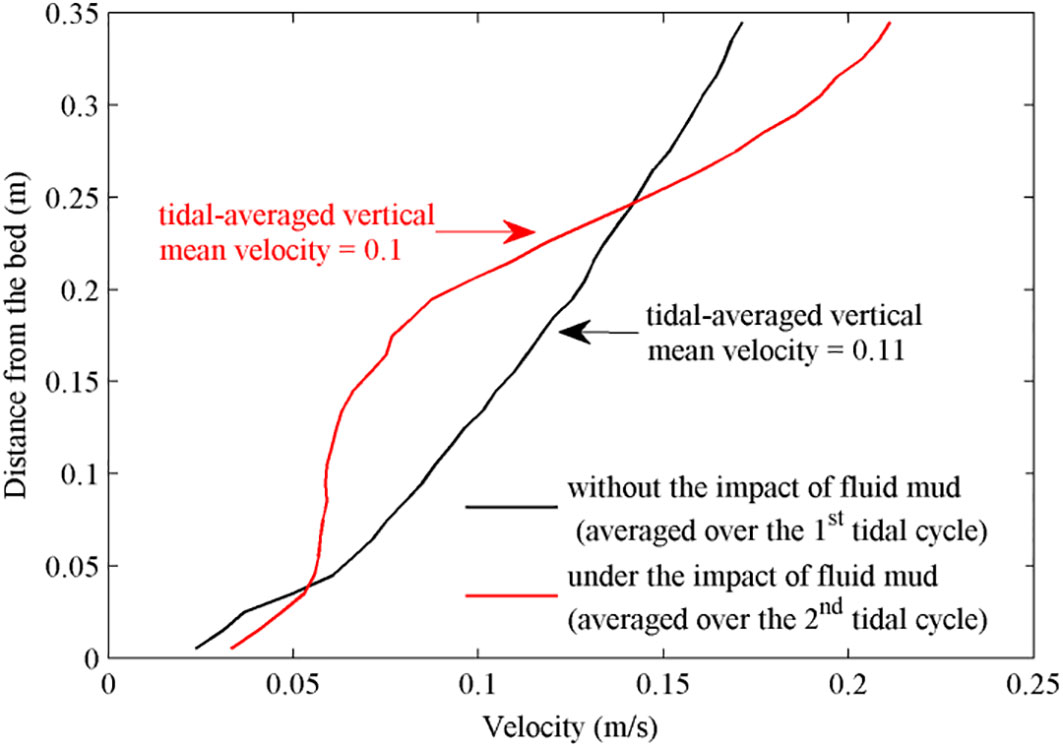
Figure 8 The tidal-averaged vertical profile of current velocity during the Phase III of our observation period.
With the help of down looking ADCP instrument (Figure 1C), the time series profiles of current velocity in 30cm above the bed as well as the vertical averaged velocity, which lasted for two tidal cycles, were shown in Figure 7B and Figure 7A respectively. It showed that the tidal dynamics in each tidal cycle were similar. The averaged tidal range was 1.3m during the first tidal cycle of Phase III and the averaged tidal range was 1.4m during the successive tidal cycle (Figure 7A). Meanwhile, the tidal-averaged vertical mean velocity was 0.11m/s and 0.1 m/s during the first and successive tidal cycle respectively (Figure 8). In most time of Phase III, the relatively stronger tidal velocity was stayed at the upper layer, while the velocity close to zero was located near the sea bed (Figure 7B). According to the linear wave theory, the observed swell-induced wave belonged to the shallow-water wave since the estimated wave length ranging from 25m to 52m was much greater than the critical influencing wavelength (= 2 times the water depth). Meanwhile, the breaking wave didn’t occur at our observation site because the ratio of the SWH to the water depth was less than 0.2, which was smaller than the critical wave breaking condition (=0.43, Wan et al., 2014) in the Yangtze Estuary. The swell-induced wave dynamic was a little bit enhanced since the SWH as well the SWP during the second tidal cycle (approximately hours 144 ~ 168, Figure 3F) were greater than those during the first tidal cycle (approximately hours 120 ~ 168, Figure 3F). Therefore, assuming the same tidal dynamic and enhancing wave force are dominated during these two tidal cycles, a relative tendency of bed erosion should be appeared at the successive tidal cycle when compared with the trend of bed variation during the first tidal cycle, which is supposed to be slowing down the rate of bed accretion or triggering the erosion of sea bed. However, the rate of bed accretion during the successive tidal cycle was much greater than that during the first tidal cycle (Figure 3G), indicating that other factor was responsible for the rapid bed accretion during the successive tidal cycle.
Based on the records of two OBS3+ instruments (Figure 1C), the mixing condition near bed was totally different during these two tidal cycles (Figure 7D). During the first tidal cycle, the SSCs at 0.2 mab and 0.3 mab were less than 10 kg/m3. The vertical difference of SSC between at 0.2 mab and at 0.3mab was negligible, which fostered a well mixing condition near bed (Figure 7D). While during the successive tidal cycle, the vertical difference of SSC between at 0.2 mab and at 0.3 mab was quite obvious owing to the appearance of the near bed fluid mud of which the thickness was less than 0.3m. A stronger SSC-induced vertical stratification was formed and existed almost within the whole successive tidal cycle, which made the mixing condition suppressed near the sea bed. The SSC-induced turbulent damping had been reported at indoors experiment (Li and Gust, 2010) as well as in other field investigations (Shen et al., 2020; Hao et al., 2022), which proposed that the SSC-induced vertical density stratification decreased vertical momentum exchange, prohibited the near bed sediment resuspension and facilitated sediment settling.
Our observation also found that the current velocity above the fluid mud, approximately higher than 0.25 mab, was greater than that without the impact of fluid mud (Figure 8). This phenomenon can be explained by the drag reduction due to the fluid mud suspensions achieved by reduced momentum exchanging and vertical mixing near the upper fluid mud-water interface (Li and Gust, 2010). On the contrary, the near bed current velocity under the impact of fluid mud, located from 0.05mab to 0.2mab, was much smaller than that without the impact of fluid mud (Figure 8). Compared with the flow velocity without the impact of fluid mud, the occurrence of smaller flow velocity under the impact of fluid mud was not only related to the decreased momentum exchanging at the upper water-mud interface but also associated with the increasing viscosity (Qian and Wan, 1983) as well as the change of the rheological behaviors (Wang and Winterwerp, 1992).
Therefore, in despite of the stronger wave dynamics, the rate of bed accretion was increased due to the SSC-induced turbulent damping, the increasing flow viscosity and the rheological behaviors of fluid mud during the second tidal cycle of Phase III.
5.3 Possible reasons for better performance of the simultaneous deposition paradigm
There are three possible reasons for explaining the better performance of the simultaneous deposition paradigm especially during the Phase II and III of our observation period.
The first possibility is that the fine suspended sediments do maintain a continuous contact with the sediment bed according to the results of flume experiment (Mehta and Partheniades, 1975; Krone, 1993; Winterwerp, 2007) and the model simulation (Sanford and Halka, 1993; Sanford, 2008; Dong et al., 2020). Winterwerp (2007) reexamined the original laboratory experiments behind the exclusive erosion and deposition idea (Einstein and Krone, 1962). He noticed that due to the larger time span of the flume experiment, the erosion flux was limited by the availability of erodible material. The experimental results could be equally well reproduced by allowing for continuous deposition but invoking a stochastic bed shear stress and a gradual strengthening of the bed. The so-called critical shear stress for deposition (τd) in fact represented the critical shear stress for erosion (τe) of freshly deposited sediment (Winterwerp, 2007). Sanford and Halka (1993) simulated the variation of total SSC in Chesapeake Bay under different paradigms of erosion and deposition of mud and pointed out the better performance of the simultaneous deposition paradigm possibly due to the complex in-situ field conditions that couldn’t be replicated in the laboratory experiments underlying the exclusive paradigm and the relatively weak representation of in-situ sediment behavior by a single sediment particle. Compared to the model-data comparison of SSC (Sanford and Halka, 1993; Dong et al., 2020), a more direct model-data comparison of relative bed level change in this paper was further supported the idea that the fine suspended sediments do maintain a continuous contact with the sediment bed in in-situ field conditions.
The second possibility is that the near bed high suspended sediment cloud suppresses the momentum exchange and facilitates the forming of cohesive sediment flocs. Since the fine sediments consume the turbulent energy to keep in suspension, the SSC-induced vertical stratification damps the turbulent energy and facilitates the fine sediment settling in the form of cohesive sediment flocs. According to the in-situ floc size measurement (Zhu et al., 2022), the floc size at the North Passage of Yangtze Estuary was 24~106μm under different turbulent shear stress, which was an order of magnitude larger than the particle grain size ranging from 5.8 to 10.6μm. The median grain size of nearbed suspended sediment at our observation site was quite close to the particle grain size measured by Zhu et al. (2022) (Figure 4). The critical SSC for maximum flocculation varies over a range of 1~30kg/m3 (Wu and Wang, 2004; Wan et al., 2015). Therefore, the critical shear stress for deposition of fine sediment particle (τd) may not be acceptable to judge the moment of bed accretion since the settling of cohesive sediment flocs could still occur when the bed shear stress is over the critical shear stress for deposition of fine sediment particle (τd).
The third possibility is the impact of nearbed high concentrated suspended sediment like fluid mud, which distorted the bottom logarithmic velocity distribution and weakened the bed shear stress. In many practical modelling (Delft Hydraulics, 2003; Lyu and Zhu, 2018; Shen et al., 2018), a logarithmic velocity distribution is used to estimate the bed shear stress since the turbulent bed boundary, usually occupying from several centimeter above bed to 20~30% of water depth, is well developed in nature conditions. Without the impact of fluid mud, the vertical distribution of current velocity 0.3mab fit the logarithmic distribution and the bed shear stress could be estimated by the variability in turbulent velocity fluctuation (Stapleton and Huntley, 1995) (black line, Figure 8). However, the extreme high SSC clouds like fluid mud, with the thickness smaller than 0.3m during our observation, distorted the logarithmic current profile. An overestimated bed shear stress by using turbulent velocity fluctuation at 0.3mab could happen since the current velocity was significantly enhanced above or decreased below the fluid mud-water interface (red line, Figure 8). Compared to the exclusive deposition model, the simultaneous deposition model produced more sediment deposition flux which offset the excessive sediment erosion due to the overestimated bed shear stress especially during the impact of fluid mud. Although a more detailed fluid mud model can be used to simulate the erosion and deposition flux during the impact of fluid mud (Ge et al., 2020), it will be quite complex and time-consuming since an extra fluid mud module should be added to well describe the physical process of fluid mud and the model resolution of vertical grid should be high enough to distinguish the thickness of fluid mud which could be smaller than 30cm during our observation. For practical modeling purposes, modeling under the deposition paradigm can give satisfactory results especially during the impact of wave or swell.
6 Conclusions
264-h spring-neap tidal cycle observation was deployed with a bottom tripod to study the sedimentation of cohesive sediments at the subtidal region of Hengsha Shoal, located near the ETM of the Yangtze Estuary, China. The tripod was mounted with one wave monitoring instrument (AWAC), two current monitoring instruments (ADCP and ADV) and two water turbidity monitoring instruments (OBS3+) in order to collect the information of the wave dynamic, the tidal current, the near bed SSC and the relative bed level changes. The observation period could be divided into four phases according to wind and wave conditions. During the Phase I and IV, a moderate wind prevailed and the tidal dynamic was on the transition between the spring tide and the neap tide. The SSC at 0.2mab was generally lower than 5 kg/m3 through most of the observation period. The seabed was in relative equilibrium state with the fluctuation of bed level smaller than 16 mm. During the Phase II and III, the neap tidal was accompanied with a significant process of wind wave and swell. A prominent erosion of sea bed, with the erosion thickness around 38 mm, was achieved at the hours 96 when the wind-wave induced SWH was increased to the maximum and the SSC at 0.2mab was still lower than 1 kg/m3. In contrast, a rapid seabed deposition of 62 mm from the hours 130 to the hours 135 was observed during the impact of fluid mud although the tidal current and swell-induced wave dynamic was much stronger than that during the erosion of sea bed at the hours 96.
According to the variation of relative bed level, the estimated critical bed shear stress for erosion and deposition was 0.15 N/m2 and 0.13 N/m2 respectively. The erosion constant didn’t remain unchanged during our observation period. The calibrated erosion constant during the Phase I based on the simultaneous deposition paradigm was 9×10⁻⁵ kg/m2/s due to the relatively consolidated surficial sediments while the calibrated erosion constant was increased up to 2×10⁻⁴ kg/m2/s due to the impact of wind wave during the Phase II and remain unchanged during the successive tidal cycle (Phase III~IV).
The sedimentation of cohesive sediments at our observation site was analyzed according to the comparison of in-situ relative bed level changes to the modeling results under the exclusive and simultaneous deposition paradigms. The results showed that the sedimentation under simultaneous deposition paradigm, which believed that the erosion and deposition of sediment must occur simultaneously, described the relative bed level changes better particularly during the impact of fluid mud. Three possible reasons for the better performance of the simultaneous deposition paradigm were suggested. The first possibility is that the fine suspended sediments do maintain a continuous contact with the sediment bed since not only the indirect variation of SSC came from original laboratory experiments behind the exclusive erosion and deposition idea (Einstein and Krone, 1962) but also the direct bed level changes during our observation period have been well reproduced by the simultaneous deposition paradigm. The second and third possibilities are attributed to the near bed high suspended sediment clouds like fluid mud which suppresses the momentum exchange and distorts the near bed logarithmic velocity distribution. The SSC-induced turbulence damping facilitates the fine sediment settling in the form of cohesive sediment flocs whose size can be an order of magnitude larger than the particle grain size in the Yangtze Estuary, indicating the settling of sediments can’t be judged by the critical shear stress for deposition just based on the single particle grain size. Meanwhile, an overestimated bed shear stress by using turbulent velocity fluctuation at 0.3mab could happen since the current velocity was significantly enhanced above or decreased below the fluid mud-water interface. Compared to the exclusive deposition model, the simultaneous deposition model produced more sediment deposition flux to offset the excessive sediment erosion due to the overestimated bed shear stress especially during the impact of fluid mud. For practical modeling purposes, modeling under the deposition paradigm can give satisfactory results especially during the impact of wave or swell.
Data availability statement
The raw data supporting the conclusions of this article will be made available by the authors, without undue reservation.
Author contributions
QS conducted filed observation, conceived the idea, analyzed the data and drafted the manuscript. QZ conceived the idea and analyzed the data. SGL reviewed and edited the manuscript. SL reviewed and edited the manuscript. HW reviewed and edited the manuscript. ZZ analyzed the data and reviewed the manuscript. BX conducted the field observation. RY reviewed and edited the manuscript. All authors contributed to the article and approved the submitted version.
Acknowledgments
Financial support for the study was provided by the National Natural Science Foundation of China (51961145106, U2040204, 51909038) and Shanghai Science and Technology Program Funds (21DZ1201002). We thank the reviewers for their valuable comments and suggestions.
Conflict of interest
The authors declare that the research was conducted in the absence of any commercial or financial relationships that could be construed as a potential conflict of interest.
Publisher’s note
All claims expressed in this article are solely those of the authors and do not necessarily represent those of their affiliated organizations, or those of the publisher, the editors and the reviewers. Any product that may be evaluated in this article, or claim that may be made by its manufacturer, is not guaranteed or endorsed by the publisher.
References
Andersen T. J., Fredsoe J., Pejrup M. (2007). In situ estimation of erosion and deposition thresholds by acoustic Doppler velocimeter (ADV). Estuarine Coast. Shelf Sci. 75 (3), 327–336. doi: 10.1016/j.ecss.2007.04.039
Ao C., Wang Z. B., De Vriend H. J., M.J.F. S. (2022). “A process-based approach to sediment transport in the Yangtze estuary,” in Conference on Coastal Engineering. Shanghai, China: Coastal Engineering Research Council. Available at http://journals.tdl.org/icce/index.php/icce/article/view/1387/pdf_352. accessed date: 20-11-2015.
Ariathurai C. (1974). A finite element model for sediment transport in estuaries (Berkley, USA: University of California).
Azhikodan G., Yokoyama K. (2018). Sediment transport and fluid mud layer formation in the macro-tidal chikugo river estuary during a fortnightly tidal cycle. Estuarine Coast. Shelf Sci. 202, 232–245. doi: 10.1016/j.ecss.2018.01.002
Baptist M. J., Gerkema T., van Prooijen B. C., van Maren D. S., van Regteren M., Schulz K., et al. (2019). Beneficial use of dredged sediment to enhance salt marsh development by applying a ‘Mud motor’. Ecol. Eng. 127, 312–323. doi: 10.1016/j.ecoleng.2018.11.019
Barbier E. B., Koch E. W., Silliman B. R., Hacker S. D., Wolanski E., Primavera J., et al. (2008). Coastal ecosystem-based management with nonlinear ecological functions and values. Science 319 (5861), 321–323. doi: 10.1126/science.1150349
Brand E., Ramaekers G., Lodder Q. (2022). Dutch Experience with sand nourishments for dynamic coastline conservation – an operational overview. Ocean Coast. Manage. 217, 106008. doi: 10.1016/j.ocecoaman.2021.106008
Cao W., Zhou Y., Li R., Li X. (2020). Mapping changes in coastlines and tidal flats in developing islands using the full time series of landsat images. Remote Sens. Environ. 239, 111665. doi: 10.1016/j.rse.2020.111665
Chen J., Li D., Chen B., Hu F., Zhu H., Liu C. (1999). The processes of dynamic sedimentation in the changjiang estuary. J. Sea Res. 41 (1), 129–140. doi: 10.1016/S1385-1101(98)00047-1
Christensen D. F., Brinkkemper J., Ruessink G., Aagaard T. (2018). Field observations of turbulence in the intertidal and shallow subtidal zones. Continental Shelf Res. 170, 21–32. doi: 10.1016/j.csr.2018.10.002
Christensen D. F., Brinkkemper J., Ruessink G., Aagaard T. (2019). Field observations of intra-wave sediment suspension and transport in the intertidal and shallow subtidal zones. Mar. Geology 413, 10–26. doi: 10.1016/j.margeo.2019.04.005
Cooke B. C., Jones A. R., Goodwin I. D., Bishop M. J. (2012). Nourishment practices on Australian sandy beaches: A review. J. Environ. Manage. 113, 319–327. doi: 10.1016/j.jenvman.2012.09.025
Costanza R., de Arge R., de Groot R., Farber S., Grasso M., Hannon B., et al. (1997). The value of the world's ecosystem services and natural capital. Nature 387 (6630), 253–260. doi: 10.1038/387253a0
Dai Z., Mei X., Darby S. E., Lou Y., Li W. (2018). Fluvial sediment transfer in the changjiang (Yangtze) river-estuary depositional system. J. Hydrology 566, 719–734. doi: 10.1016/j.jhydrol.2018.09.019
Delft Hydraulics (2003). Delft3D-FLOW: Simulation of multi-dimensional hydrodynamic flows and transport phenomena, including sediments. (Delft, The Netherlands: WL | delft hydraulics).
Dong H., Jia L., He Z., Yu M., Shi Y. (2020). Application of parameters and paradigms of the erosion and deposition for cohesive sediment transport modelling in the lingdingyang estuary, China. Appl. Ocean Res. 94, 101999. doi: 10.1016/j.apor.2019.101999
Du J.-L., Yang S.-L., Feng H. (2016). Recent human impacts on the morphological evolution of the Yangtze river delta foreland: A review and new perspectives. Estuarine Coast. Shelf Sci., 181, 160–169. doi: 10.1016/j.ecss.2016.08.025
Dyer K. R. (1986). Coastal and estuarine sediment dynamics (Chichester, Sussex(UK: John Wiley and Sons).
Einstein H. A., Krone R. B. (1962). Experiments to determine modes of cohesive sediment transport in salt water. J. Geophysical Res. 67 (4), 1451–1461. doi: 10.1029/JZ067i004p01451
Friedrichs C. T. (2011). “3.06 - tidal flat morphodynamics: A synthesis,” in Treatise on estuarine and coastal science. Eds. Wolanski E., McLusky D. (Waltham: Academic Press), 137–170.
Ge J., Chen C., Wang Z. B., Ke K., Yi J., Ding P. (2020). Dynamic response of the fluid mud to a tropical storm. J. Geophysical Research: Oceans 125 (3), e2019JC015419. doi: 10.1029/2019JC015419
Ge J., Shen F., Guo W., Chen C., Ding P. (2015). Estimation of critical shear stress for erosion in the changjiang estuary: A synergy research of observation, GOCI sensing and modeling. J. Geophysical Research: Oceans 120 (12), 8439–8465. doi: 10.1002/2015JC010992
Grabowski R. C., Droppo I. G., Wharton G. (2011). Erodibility of cohesive sediment: The importance of sediment properties. Earth-Science Rev. 105 (3), 101–120. doi: 10.1016/j.earscirev.2011.01.008
Grant W. D., Madsen O. S. (1979). Combined wave and current interaction with a rough bottom. J. Geophysical Research: Oceans 84 (C4), 1797–1808. doi: 10.1029/JC084iC04p01797
Gratiot N., Michallet H., Mory M. (2005). On the determination of the settling flux of cohesive sediments in a turbulent fluid. J. Geophysical Research: Oceans 110, C06004. doi: 10.1029/2004JC002732
Guan W. (2003). Transport and deposition of high-concentration suspension of cohesive sediment in a macrotidal estuary (Hong Kong: Hong Kong University).
Ha H. K., Maa J. P. Y. (2009). Evaluation of two conflicting paradigms for cohesive sediment deposition. Mar. Geology 265 (3), 120–129. doi: 10.1016/j.margeo.2009.07.001
Han Y. F., Lu C. T. (2015). Process research on estuarine turbidity maximum and mouth bar of Yangtze estuary after the improvement works. Proc. Eng. 116, 80–87. doi: 10.1016/j.proeng.2015.08.267
Hao W., Yaping W., Shu G., Fei X., Jieping T., Dezhi C. (2022). Fluid mud dynamics in a tide-dominated estuary: A case study from the Yangtze river. Continental Shelf Res. 232, 104623. doi: 10.1016/j.csr.2021.104623
Hir P. L., Cann P., Waeles B., Jestin H., Bassoullet P. (2008). “Chapter 11 erodibility of natural sediments: experiments on sand/mud mixtures from laboratory and field erosion tests,” in Proceedings in marine science. Eds. Kusuda T., Yamanishi H., Spearman J., Gailani J. Z. (Elsevier), 137–153. doi: 10.1016/S1568-2692(08)80013-7
Huisman B., Walstra D.-J., Radermacher M., De Schipper M., Ruessink G. (2019). Observations and modelling of shoreface nourishment behaviour. J. Mar. Sci. Eng. 7, 59. doi: 10.3390/jmse7030059
Janssen-Stelder B. (2000). The effect of different hydrodynamic conditions on the morphodynamics of a tidal mudflat in the Dutch wadden Sea. Continental Shelf Res. 20 (12), 1461–1478. doi: 10.1016/S0278-4343(00)00032-7
Kim S. C., Friedrichs C. T., Maa P. Y., Wright L. D. (2000). Estimating bottom stress in tidal boundary layer from acoustic Doppler velocimeter data. J. Hydraulic Engineering-ASCE 126 (6), 399–406. doi: 10.1061/(ASCE)0733-9429(2000)126:6(399)
Kim D., Jo J., Kim B., Ryu J., Choi K. (2020). Influence of dike-induced morphologic and sedimentologic changes on the benthic ecosystem in the sheltered tidal flats, saemangeum area, west coast of Korea. Environ. pollut. 257, 113507. doi: 10.1016/j.envpol.2019.113507
Kirby R. (2000). Practical implications of tidal flat shape. Continental Shelf Res. 20 (10), 1061–1077. doi: 10.1016/S0278-4343(00)00012-1
Kranck K., Milligan T. G. (1992). Characteristics of suspended particles at an 11-hour anchor station in San Francisco bay, California. J. Geophysical Research: Oceans 97 (C7), 11373–11382. doi: 10.1029/92JC00950
Krone R. B. (1993). “Sedimentation revisited,” in Nearshore and estuarine cohesive sediment transport. Ed. Mehta A. J. (American Geophysical Union, Coastal and Estuarine Studies), 108–125. doi: 10.1029/CE042p0108
Kuang C., Liu X., Gu J., Guo Y., Huang S., Liu S., et al. (2013). Numerical prediction of medium-term tidal flat evolution in the Yangtze estuary: Impacts of the three gorges project. Continental Shelf Res. 52, 12–26. doi: 10.1016/j.csr.2012.10.006
Kuang C., Mao X., Gu J., Niu H., Ma Y., Yang Y., et al. (2019). Morphological processes of two artificial submerged shore-parallel sandbars for beach nourishment in a nearshore zone. Ocean Coast. Manage. 179, 104870. doi: 10.1016/j.ocecoaman.2019.104870
Lambrechts J., Humphrey C., McKinna L., Gourge O., Fabricius K. E., Mehta A. J., et al. (2010). Importance of wave-induced bed liquefaction in the fine sediment budget of Cleveland bay, great barrier reef. Estuarine Coast. Shelf Sci. 89 (2), 154–162. doi: 10.1016/j.ecss.2010.06.009
Lau Y., Krishnappan B. (1994). Does reentrainment occur during cohesive sediment settling? J. Hydraulic Eng. 120 (2), 236–244. doi: 10.1061/(ASCE)0733-9429(1994)120:2(236)
Lee H. J., Jo H. R., Chu Y. S., Bahk K. S. (2004). Sediment transport on macrotidal flats in garolim bay, west coast of Korea: significance of wind waves and asymmetry of tidal currents. Continental Shelf Res. 24 (7), 821–832. doi: 10.1016/j.csr.2004.01.005
Li M. Z., Gust (2010). Boundary layer dynamics and drag reduction in flows of high cohesive sediment suspensions. Sedimentology 47 (1), 71–86. doi: 10.1046/j.1365-3091.2000.00277.x
Li H., Li L., Su F., Wang T., Gao P. (2021). Ecological stability evaluation of tidal flat in coastal estuary: A case study of liaohe estuary wetland, China. Ecol. Indic. 130, 108032. doi: 10.1016/j.ecolind.2021.108032
Lin J., van Prooijen B. C., Guo L., Zhu C., He Q., Wang Z. B. (2021). Regime shifts in the changjiang (Yangtze river) estuary: The role of concentrated benthic suspensions. Mar. Geology 433, 106403. doi: 10.1016/j.margeo.2020.106403
Liu X. J., Gao S., Wang Y. P. (2011). Modeling profile shape evolution for accreting tidal flats composed of mud and sand: A case study of the central jiangsu coast, China. Continental Shelf Res. 31 (16), 1750–1760. doi: 10.1016/j.csr.2011.08.002
Lyu H. H., Zhu J. R. (2018). Impact of the bottom drag coefficient on saltwater intrusion in the extremely shallow estuary. J. Hydrology 557, 838–850. doi: 10.1016/j.jhydrol.2018.01.010
Ma T., Li X., Bai J., Cui B. (2019). Impacts of coastal reclamation on natural wetlands in Large river deltas in China. Chin. Geographical Sci. 29 (4), 640–651. doi: 10.1007/s11769-019-1049-8
Manning A. J., Langston W. J., Jonas P. J. C. (2010). A review of sediment dynamics in the Severn estuary: Influence of flocculation. Mar. pollut. Bull. 61 (1), 37–51. doi: 10.1016/j.marpolbul.2009.12.012
Mehta A. J., Partheniades E. (1975). An investigation of the depositional properties of flocculated fine sediments. J. Hydraulic Res. 13 (4), 361–381. doi: 10.1080/00221687509499694
Milliman J., Syvitski J. (1991). Geomorphic tectonic control of sediment discharge to ocean – the importance of small mountainous rivers. J. Geology 100, 525–544. doi: 10.1086/629606
Partheniades E. A. (1965). Erosion and deposition of cohesive soils. Am. Soc. Civil Engineers 91 (1), 190–192. doi: 10.1061/JYCEAJ.0001165
Partheniades E. (1986). “A fundamental framework for cohesive sediment dynamics,” in Estuarine cohesive sediment dynamics. Ed. Mehta A. J. (Berlin: Springer), 219–250.
Pedersen T., Siegel E., Wood J. (2007). “Directional wave measurements from a subsurface buoy with an acoustic wave and current profiler (AWAC),” in Proceedings of the Oceans 2007. (Vancouver, BC: IEEE), 1–10. doi: 10.1109/OCEANS.2007.4449153
Ren Y., Xu G., Xu X., Zhao T., Wang X. (2020). The initial wave induced failure of silty seabed: Liquefaction or shear failure. Ocean Eng. 200, 106990. doi: 10.1016/j.oceaneng.2020.106990
Sánchez J. M., SanLeon D. G., Izco J. (2001). Primary colonisation of mudflat estuaries by spartina maritima (Curtis) fernald in Northwest Spain: vegetation structure and sediment accretion. Aquat. Bot. 69 (1), 15–25. doi: 10.1016/S0304-3770(00)00139-X
Sanford L. P. (2008). Modeling a dynamically varying mixed sediment bed with erosion, deposition, bioturbation, consolidation, and armoring. Comput. Geosciences 34 (10), 1263–1283. doi: 10.1016/j.cageo.2008.02.011
Sanford L. P., Halka J. P. (1993). Assessing the paradigm of mutually exclusive erosion and deposition of mud, with examples from upper Chesapeake bay. Mar. Geology 114, 37–57. doi: 10.1016/0025-3227(93)90038-W
Sanford L. P., Maa J. P. Y. (2001). A unified erosion formulation for fine sediments. Mar. Geology 179 (1), 9–23. doi: 10.1016/S0025-3227(01)00201-8
Savige T. R., Kowalczyk H. E. L., Fellowes T. E., Kennedy D. M. (2021). The role of seaward morphology on wave transformation onto and across a microtidal shore platform. Continental Shelf Res. 224, 104472. doi: 10.1016/j.csr.2021.104472
Schwarz C., Ye Q. H., van der Wal D., Zhang L. Q., Bouma T., Ysebaert T., et al. (2014). Impacts of salt marsh plants on tidal channel initiation and inheritance. J. Geophysical Research: Earth Surface 119 (2), 385–400. doi: 10.1002/2013JF002900
Shen Q., Huang W. R., Qi D. M. (2018). Integrated modeling of typhoon damrey's effects on sediment resuspension and transport in the north passage of changjiang estuary, China. J. Waterway Port Coast. Ocean Eng. 144 (6), 04018015. doi: 10.1061/(ASCE)WW.1943-5460.0000453
Shen Q., Huang W., Wan Y., Gu F., Qi D. (2020). Observation of the sediment trapping during flood season in the deep-water navigational channel of the changjiang estuary, China. Estuarine Coast. Shelf Sci. 237, 106632. doi: 10.1016/j.ecss.2020.106632
Shields A. (1936). “Application of similarity principles and turbulence research to bed-load movement,” in Mitteilungen der Preussischen Versuchsanstalt fur Wasserbau und Schifbau, Berlin. eds Ott W. P., van Uchelen J. C. (Pasadena, CA: California Institute of Technology).
Shi B. W., Wang Y. P., Yang Y., Li M. J., Li P., Ni W. F., et al. (2015). Determination of critical shear stresses for erosion and deposition based on in situ measurements of currents and waves over an intertidal mudflat. J. Coast. Res. 31, 1344–1356. doi: 10.2112/JCOASTRES-D-14-00239.1
Soulsby R. L., Humphery J. D. (1990). “Field observations of wave-current interaction at the Sea bed,” in Water wave kinematics. Eds. Tørum A., Gudmestad O. T. (Dordrecht: Springer, Netherlands), 413–428.
Stapleton K. R., Huntley D. A. (1995). Seabed stress determinations using the inertial dissipation method and the turbulent kinetic energy method. Earth Surface Processes Landforms 20 (9), 807–815. doi: 10.1002/esp.3290200906
Taki K. (2000). “Critical shear stress for cohesive sediment transport,” in Proceedings in marine science. Eds. McAnally W. H., Mehta A. J. (Elsevier), 53–61. doi: 10.1016/S1568-2692(00)80112-6
Temmerman S., Bouma T. J., Koppel J. V. D., Wal D. V. D., Vries M. B. D., Herman P. M. J. (2007). Vegetation causes channel erosion in a tidal landscape. Geology 35 (7), 631–634. doi: 10.1130/G23502A.1
Teng L., Cheng H., de Swart H. E., Dong P., Li Z., Li J., et al. (2021). On the mechanism behind the shift of the turbidity maximum zone in response to reclamations in the Yangtze (Changjiang) estuary, China. Mar. Geology 440, 106569. doi: 10.1016/j.margeo.2021.106569
Toniolo M. A., Seitz C., Perillo G. M. E. (2021). Origin and evolution of tidal depressions in a tidal flat and their role in carbon sequestration in the bahía blanca estuary (Argentina). Mar. Geology 436, 106467. doi: 10.1016/j.margeo.2021.106467
Van der Werf J., Reinders J., van Rooijen A., Holzhauer H., Ysebaert T. (2015). Evaluation of a tidal flat sediment nourishment as estuarine management measure. Ocean Coast. Manage. 114, 77–87. doi: 10.1016/j.ocecoaman.2015.06.006
Van Prooijen B. C., Montserrat F., Herman P. M. J. (2011). A process-based model for erosion of macoma balthica-affected mud beds. Continental Shelf Res. 31 (6), 527–538. doi: 10.1016/j.csr.2010.12.008
Van Rijn L. C. (1993). Principles of sediment transport in rivers, estuaries and coastal seas (Amsterdam, the Netherlands: Aqua Publication).
Verney R., Deloffre J., Brun-Cottan J. C., Lafite R. (2007). The effect of wave-induced turbulence on intertidal mudflats: Impact of boat traffic and wind. Continental Shelf Res. 27 (5), 594–612. doi: 10.1016/j.csr.2006.10.005
Wang X., Sun J., Zhao Z. (2020). Effects of river discharge and tidal meandering on morphological changes in a meso tidal creek. Estuarine Coast. Shelf Sci. 234, 106635. doi: 10.1016/j.ecss.2020.106635
Wang Z. B., Winterwerp J. C. (1992). A model to simulate the transport of fluid mud. tech. rep. Z163, WL | delft hydraulics (Delft, The Netherlands: WL | delft hydraulics).
Wan Y., Roelvink D., Li W., Qi D., Gu F. (2014). Observation and modeling of the storm-induced fluid mud dynamics in a muddy-estuarine navigational channel. Geomorphology 217, 23–36. doi: 10.1016/j.geomorph.2014.03.050
Wan Y., Wu H., Roelvink D., Gu F. (2015). Experimental study on fall velocity of fine sediment in the Yangtze estuary, China. Ocean Eng. 103, 180–187. doi: 10.1016/j.oceaneng.2015.04.076
Whitehouse R., Soulsby R., Roberts W., H. M., H.R. W. (2000). Dynamics of estuarine muds: a manual for practical applications (London: Thomas Telford Limited).
Winterwerp J. C. (2007). “On the sedimentation rate of cohesive sediment,” in Proceedings in marine science. Eds. Maa J. P. Y., Sanford L. P., Schoellhamer D. H. (Elsevier), 209–226. doi: 10.1016/S1568-2692(07)80014-3
Winterwerp J., Kesteren W. (2004). Introduction to the physics of cohesive sediment in the marine (Amsterdam: Elsevier), 576.
Wu W., Wang S. S. Y. (2004). Depth-averaged 2-d calculation of tidal flow, salinity and cohesive sediment transport in estuaries. Int. J. Sediment Res. 19 (3), 172–190. Available at: http://www.cqvip.com/QK/71135X/201107/11055782.html.
Wu H., Wang Y. P., Gao Xing S. F., Tang J. P., Chen D. Z (2022). Fluid mud dynamics in a tide-dominated estuary: A case study from the Yangtze River. Continental Shelf Res. 232, 104623.
Yang S.-L., Friedrichs C. T., Shi Z., Ding P.-X., Zhu J., Zhao Q.-Y. (2003). Morphological response of tidal marshes, flats and channels of the outer Yangtze river mouth to a major storm. Estuaries 26 (6), 1416–1425. doi: 10.1007/BF02803650
Yang S. L., Li H., Ysebaert T., Bouma T. J., Zhang W. X., Wang Y. Y., et al. (2008). Spatial and temporal variations in sediment grain size in tidal wetlands, Yangtze delta: On the role of physical and biotic controls. Estuarine Coast. Shelf Sci. 77 (4), 657–671. doi: 10.1016/j.ecss.2007.10.024
Yu Q., Wang Y., Shi B., Wang Y. P., Gao S. (2017). Physical and sedimentary processes on the tidal flat of central jiangsu coast, China: Headland induced tidal eddies and benthic fluid mud layers. Continental Shelf Res. 133, 26–36. doi: 10.1016/j.csr.2016.12.015
Zhang Y., Chen R., Wang Y. (2020). Tendency of land reclamation in coastal areas of shanghai from 1998 to 2015. Land Use Policy 91, 104370. doi: 10.1016/j.landusepol.2019.104370
Zhang M., Dai Z., Bouma T. J., Bricker J., Townend I., Wen J., et al. (2021). Tidal-flat reclamation aggravates potential risk from storm impacts. Coast. Eng. 166, 103868. doi: 10.1016/j.coastaleng.2021.103868
Zhang S., Nielsen P., Perrochet P., Jia Y. (2021). Multiscale superposition and decomposition of field-measured suspended sediment concentrations: Implications for extending 1DV models to coastal oceans with advected fine sediments. J. Geophysical Research: Oceans 126, e2020JC016474. doi: 10.1029/2020JC016474
Zhang S. T., Zhang Y. Q., Xu J. S., Guo L., Li G. X., Jia Y. G., et al. (2022). In situ observations of hydro-sediment dynamics on the abandoned diaokou lobe of the yellow river delta: Erosion mechanism and rate. Estuarine Coast. Shelf Sci. 277, 108065. doi: 10.1016/j.ecss.2022.108065
Zhao B. X., Liu Y. X., Wang L., Liu Y. C., Sun C., Fagherazzi S., et al. (2022). Stability evaluation of tidal flats based on time-series satellite images: A case study of the Jiangsu central coast, China. Estuarine Coast. Shelf Sci. 264, 107697.
Zhu W., Li J., Li W. (2022). Observations of fine sediment flocculation in the turbidity maximum of the changjiang estuary. J. Sea Res. 179, 102150. doi: 10.1016/j.seares.2021.102150
Zhu Q., van Prooijen B. C., Maan D. C., Wang Z. B., Yao P., Daggers T., et al. (2019). The heterogeneity of mudflat erodibility. Geomorphology 345, 106834. doi: 10.1016/j.geomorph.2019.106834
Zhu Q., Van Prooijen B. C., Wang Z. B., Ma Y. X., Yang S. L. (2016). Bed shear stress estimation on an open intertidal flat using in situ measurements. Estuar. Coast. Shelf Sci. 182 (Pt.A), 190–201. doi: 10.1016/j.ecss.2016.08.028
Keywords: sedimentation, cohesive sediments, wave and swell, high turbidity estuary, subtidal flat
Citation: Shen Q, Zhu Q, Liu S, Lou S, Wu H, Zhu Z, Xu B and Yuan R (2023) Sedimentation of cohesive sediments at the subtidal flat affected by wind wave in high turbidity estuary. Front. Mar. Sci. 9:1045335. doi: 10.3389/fmars.2022.1045335
Received: 15 September 2022; Accepted: 05 December 2022;
Published: 12 January 2023.
Edited by:
Zeng Zhou, Hohai University, ChinaReviewed by:
Shaotong Zhang, Ocean University of China, ChinaYang Yang, Nanjing Normal University, China
Copyright © 2023 Shen, Zhu, Liu, Lou, Wu, Zhu, Xu and Yuan. This is an open-access article distributed under the terms of the Creative Commons Attribution License (CC BY). The use, distribution or reproduction in other forums is permitted, provided the original author(s) and the copyright owner(s) are credited and that the original publication in this journal is cited, in accordance with accepted academic practice. No use, distribution or reproduction is permitted which does not comply with these terms.
*Correspondence: Shuguang Liu, bGl1c2dsaXVAdG9uZ2ppLmVkdS5jbg==