
94% of researchers rate our articles as excellent or good
Learn more about the work of our research integrity team to safeguard the quality of each article we publish.
Find out more
ORIGINAL RESEARCH article
Front. Mar. Sci., 09 January 2023
Sec. Marine Biogeochemistry
Volume 9 - 2022 | https://doi.org/10.3389/fmars.2022.1043194
 Ruoshi Zhao1
 Zhongqiao Li2*
 Aung Aung Aye3
 Hao Zheng1Weifang Jin4
 Jingjing Zhang2
 Feng Zhou4
 Hongliang Li2Nang Mya Han3†Myat Lwin5
 Jianfang Chen2,4*
The dissolved organic matter (DOM) in the ocean is a large carbon pool that plays an important role in the global carbon cycle. Investigation of the characteristics and behaviors of DOM in some areas facilitates a better understanding of biochemical processes in the water column. In February 2020, water samples were collected to characterize the distribution and optical properties of DOM from the Northern Andaman Sea and the Northeastern Bay of Bengal. A high dissolved organic carbon (DOC) concentration appeared in the Northern Andaman Sea, which is strongly affected by the DOM contents of the Irrawaddy and Salween Rivers. A barrier layer that resulted from the freshwater input was observed above the thermocline. This layer was believed to have had a consistent effect on the concentration of DOM in the surface water and contributed to the differences in DOC concentration on each side of the Preparis Channel. Based on the fluorescence excitation emission matrix and parallel factor analysis, four fluorescent components were identified, including three humic-like components (C1, C2, and C4 with their maximal Ex/Em at ≤240/418 nm, 315/384 nm, and 270 (360)/442 nm and represented as peaks A, M, and A+C, respectively) and one protein-like component (C3 with maximal Ex/Em at 275/334 nm and represented as peak T). The humic-like components were mainly derived from terrestrial inputs. Low levels of humic-like components were confined in the upper water, with strong photodegradation in the euphotic zone. C3 was a typical tryptophan-like component that represented freshly produced autochthonous DOM. The correlation between C3 and biological index and apparent oxygen utilization suggested that it was highly bioavailable and not easy to be preserved in the deep sea. Overall, our results showed the distributions of DOM in the Northern Andaman Sea and the Northeastern Bay of Bengal and revealed the behaviors and controlling factors for DOM in the upper water.
Dissolved organic matter (DOM) is one of the largest and most dynamic pools of organic carbon in natural waters (Hedges, 2002). Estimated to be 662 Pg C, marine DOM contained as much carbon as the atmosphere (Hansell et al., 2009) and plays an important role in the global biogeochemical cycle by regulating nutrient availability and participating in food webs (Fellman et al., 2008; Jørgensen et al., 2011; Zhao et al., 2021). Chromophoric dissolved organic matter (CDOM) is the main light-absorbing constituent in aquatic systems and is estimated to account for 20%–70% of dissolved organic carbon (DOC) in the ocean (Laane and Koole, 1982). There are particularly high values of CDOM in coastal zones, where terrestrial input is the primary source of DOM (Ludwig et al., 1996; Coble, 2007). With the absorption properties of ultraviolet (UV) and visible wavelengths, high concentrations of CDOM can alter primary productivity by affecting the penetration of photosynthetically active radiation and blocking the light-sensitive organisms from UV radiation in coastal ecosystems (Blough and Del Vecchio, 2002; Foden et al., 2008). CDOM is highly photoreactive, and when exposed to sunlight, it can generate smaller organic carbon compounds, dissolved inorganic carbon (Osburn et al., 2001), and a series of reactive oxygen species, such as hydroxyl radicals, hydrogen peroxide, and superoxide radical ions (Page et al., 2014; Sun et al., 2021), offering labile substrates for microbial utilization (Benner and Biddand, 1998; Søndergaard et al., 2003).
The optical properties of natural water provided information on CDOM in chemical composition, sources, and transformation (Stedmon and Markager, 2001; Stedmon and Markager, 2005b). For decades, excitation emission matrix (EEM) fluorescence spectroscopy has been shown to be an effective technology with high sensitivity and selectivity (Coble, 2007). In EEMs, the common fluorescent components have been identified in aquatic environments, including humic-like compounds, acid-like compounds, and pigment-like compounds (Coble, 1996; Coble et al., 1998; Coble, 2007). In 2003, parallel factor (PARAFAC) analysis, a trilinear decomposition-based multivariate data analysis method, was successfully applied to decompose large amounts of complex matrices into individual fluorescent components (Stedmon et al., 2003). This method can identify the position of fluorescence peak and calculate the relative concentrations of each component more accurately. EEMs coupled with PARAFAC analysis have been proven to be an efficient and convenient tool to characterize CDOM and have significantly improved the ability to trace different fractions of fluorescent DOM in natural waters (Stedmon and Markager, 2005a; Kowalczuk et al., 2009; Walker et al., 2009; Lin and Guo, 2020). In marginal seas like the Andaman Sea (AS), which is a complex aquatic system containing both terrestrial and autochthonous CDOM, EEM-PARAFAC analysis is suited to describe the origins and behaviors of fluorescent DOM.
The AS is a semi-closed marginal sea in the northeast Indian Ocean, adjacent to Myanmar to the north and Thailand and Malaysia to the east. To the west, the AS is separated from the Bay of Bengal (BOB) by the Andaman and Nicobar Islands (ANI). The topography near archipelagos changes rapidly, and channels of varying sizes are formed to control the exchange of waters between the AS and the BOB. Among these, the major transport occurs in three important channels: the Preparis Channel, the Ten Degree Channel (TDC), and the Great Channel (GC). From April to November, the transport is inward from the BOB to the AS and becomes outward from December to March (Kiran, 2017; Liao et al., 2020). The exchange in the upper layer results in similar properties and vertical structure for the water column. Located in the South Asian monsoon regions, where the southwest wind prevails in summer (May–October) in contrast to the relatively weak northeast wind in winter (November–February), the AS and northern coastal zone accept large amounts of precipitation (Potemra et al., 1991; Kiran, 2017). Moreover, the Irrawaddy and Salween Rivers, the main surface runoffs on the north coast, bring an influx of fresh water to the AS. It was estimated that the input of freshwater (runoff + precipitation) was about 1,725 mm·a-1, higher than the evaporation flux, which was about 1,252 mm·a-1 (Varkey et al., 1996). Under the influence of a large runoff and plenty of rainfall, surface salinity is significantly low and forms a stable vertical stratification, resulting in a barrier layer that prevents the exchange of heat and materials in the upper water column (Sprintall and Tomczak, 1992). As it is well known, the BOB is one of the most typical oxygen minimum zones in the tropics (Paulmier and Ruiz-Pino, 2009). The degradation of dead organisms and DOM consumes the oxygen, and the existence of a barrier layer intensifies the hypoxia in the subsurface water.
As we mentioned, the AS is an atypical marginal sea with a complex oceanographic condition. However, there are several research projects exploring the dynamics of CDOM in the coastal waters of BOB (Chari et al., 2012; Chari et al., 2016; Das et al., 2017), with few focusing on the AS. In this study, investigations were carried out in the northern AS and the area near the Preparis Channel. We aimed to investigate the distribution and controlling factors for DOM in the AS. By using EEM-PARAFAC analysis, the fluorescent properties of CDOM were characterized to better understand the biogeochemical processes in the AS.
The sampling stations were in the northern AS and the area near the Preparis Channel (12–16°N, 90–99°E; Figure 1). In the northern AS, there is a wide continental shelf with steep topography, declining sharply from east to west, to a depth of 2,000 m. The width of the Preparis Channel is 322 km, while the depth only reaches 250 m (Kiran, 2017). The depth of the water to the west of the Preparis Channel can reach more than 2,000 m, and to the east, the water is approximately hundreds of meters deep. The Irrawaddy and Salween Rivers are the main runoffs to the north of the AS, with annual discharges of 410 km3·a-1 and 171 km3·a-1, respectively. However, there is a significant seasonal difference between runoff fluxes. During the winter monsoon (including December, January, and February only), the runoff was estimated to be 20 km3 and 8 km3, respectively, while in the summer monsoon (June, July, and August), the high flux was up to half of the annual discharge (Varkey et al., 1996).

Figure 1 Study area and sampling sites.
The sampling was carried out from the 20th to the 24th of February 2020, at the end of the northeast monsoon. A total of 171 samples in 16 stations were collected from the study area using 12 L Niskin samplers mounted on conductivity-temperature-depth (CTD) sensors (SeaBird Electronics, SBE 911 plus) on the China-Myanmar investigation “Joint Advanced Marine and Ecological Studies (JAMES).” The water samples were filtered immediately after collection using syringe filters (0.22 μm). The filtrate was poured into a brown glass bottle (CNW, 40 ml, immersed in HCl for 24 h and cleaned with Milli-Q water, then pre-combusted at 450°C for 5 h) and stored at −18°C for analyses of DOC and EEMs. The dissolved oxygen (DO) was obtained from the detectors (Seabird, SBE 43, and WET Labs, ECO-AFL/FL) on the CTD apparatus.
The DOC concentration was measured using a Shimadzu TOC-L analyzer in the non-purgeable organic carbon (NPOC) model, in which inorganic carbon was removed by acidification with HCl and oxygen purging, and then the DOC concentration was measured by a high-temperature catalytic oxidation method (Yang et al., 2012). Standard solutions were prepared using potassium hydrogen phthalate (KHP), and a standard curve was determined before measurement. Each sample was measured at least twice until the variation coefficient was <5%. The accuracy of the DOC concentration was checked using a 1-mg·L-1 standard solution (diluted from 1,000 mg·L-1 DOC standard) inserted in the samples.
Fluorescence EEMs were measured using a fluorescence spectrophotometer (Hitachi, F-7100) with a 1-cm cuvette. The emission spectra were scanned every 1 nm at wavelengths from 280 to 600 nm, with excitation wavelengths of 240–450 nm at 5-nm intervals. Additionally, the scanning rate was at 12,000 nm·min-1. The EEMs of samples were subtracted from the blank response (Milli-Q water). The fluorescence intensity of EEMs was calibrated using the Raman scatter peak of water and reported in Raman units (RU) by the following equations:
where Arp is the integral of the Roman peak, with an excitation wavelength of 350 nm and an emission wavelength of 371–428 nm;Iλem is the measured intensity of the Raman peak at emission wavelength λ; F is the fluorescence intensity in RU after calibration. After calibration, the fluorescence intensity is independent of instrument specificities (Lawaetz and Stedmon, 2009). The humification index (HIX) and biological index (BIX) represent the degree of humification and autotrophic productivity, respectively (Zsolnay et al., 1999; Huguet et al., 2009).
The EEM spectra were analyzed by PARAFAC analysis in MATLAB R2020b with the DOMFluor toolbox 1.7 (MathWorks, Natick, MA, USA; Stedmon and Bro, 2008). In the modeling process, an alternating least squares algorithm is used to minimize the sum of squared residuals and determine the number of components. The region of the spectra influenced by scatter peaks, where Rayleigh and Raman peaks dominate the signal, was cut and replaced with missing values. The data for outlier samples were identified by a leverage plot. Loading plots and residuals of different models were compared to determine the number of components that fit best. Finally, a four-component model was chosen to fit and validate by split-half analysis and random initialization. Split-half analysis and validation were conducted in MATLAB to mathematically compare the excitation and emission loadings of the models run on separate splits of the data using Tucker Congruence Coefficients (Figure S1). Then, 10 different 4-component models were run using random initialization, and the emission and excitation loadings were checked to be the same as those found during the split-half validation. Finally, the result of the PARAFAC model was uploaded to OpenFluor, an online spectral library of autofluorescence by organic compounds in the environment, to quantitatively match with previous studies (Murphy et al., 2014).
Pearson’s bivariate correlation (r) was used to calculate significant relationships between hydrologic parameters and variables we measured, and p< 0.05 was regarded as statistically significant. The principal component analysis (PCA) was used to reduce the dimensionality of the data set and show the difference in DOM between AS and BOB visually. The statistical analysis and plotting were carried out in Origin Pro 2021 (OriginLab Corporation, Northampton, MA, USA).
In the eastern equatorial Indian Ocean, there exists a common phenomenon in which the pycnocline does not coincide with the thermocline, implying that a strong halocline with uniform temperature exists above the thermocline. The distance between the bottom of the mixed layer and the top of the thermocline was referred to as the “barrier layer” (Sprintall and Tomczak, 1992). Here, the isothermal layer depth (ILD) is calculated as the depth where the temperature is 0.5°C lower than the sea surface temperature. The mixed layer depth (MLD) is calculated as the depth where the potential density is the sea surface density plus a variation in density when surface temperature decreases by 0.5°C, but salinity remains constant. The barrier layer thickness (BLT) is equal to the ILD minus the MLD. If the value is negative, there exists a compensated layer in the upper water. The calculation equations are as follows:
where t0 and σ0 are the temperature and density of the surface water, respectively, and Δσ represents the variation attributed to the change in temperature.
Salinity varied from 31.04 to 32.76 in surface waters, with relatively low values near the Irrawaddy and Salween Rivers, showing the influence of freshwater and the mixing between freshwater and sea water. Influenced by latitude and monsoon, sea surface temperature ranged from 25.91°C to 28.79°C, higher in the south and lower in the north. The impact of human activities was observed in the eastern coastal area, where the temperature and DO are relatively high in surface waters. Although the Preparis Channel is the main passage of water mass transport from the BOB to the AS (Liao et al., 2020), the horizontal transport in the upper water is limited due to the northeast monsoon.
A section was defined across the Preparis Channel to explore the difference in water masses between the BOB and AS. The northeast BOB is deeper than 2,000 m, whereas the geography in the northern AS is extremely complicated and shallow. The cross-sectional distributions of potential temperature and salinity are similar and affected by the vertical mixing of water masses. However, the ILD of the BOB was deeper than the AS, which was also reflected in the distributions of DO (Figure 2B). As one of the most typical characteristics, hypoxia (DO<2 mg·L-1) in the subsurface water was observed in both the BOB (depth of about 90–1,400 m) and the northern AS (deeper than 50 m). In some regions of the BOB, the values of DO are even close to the minimum detection limit.
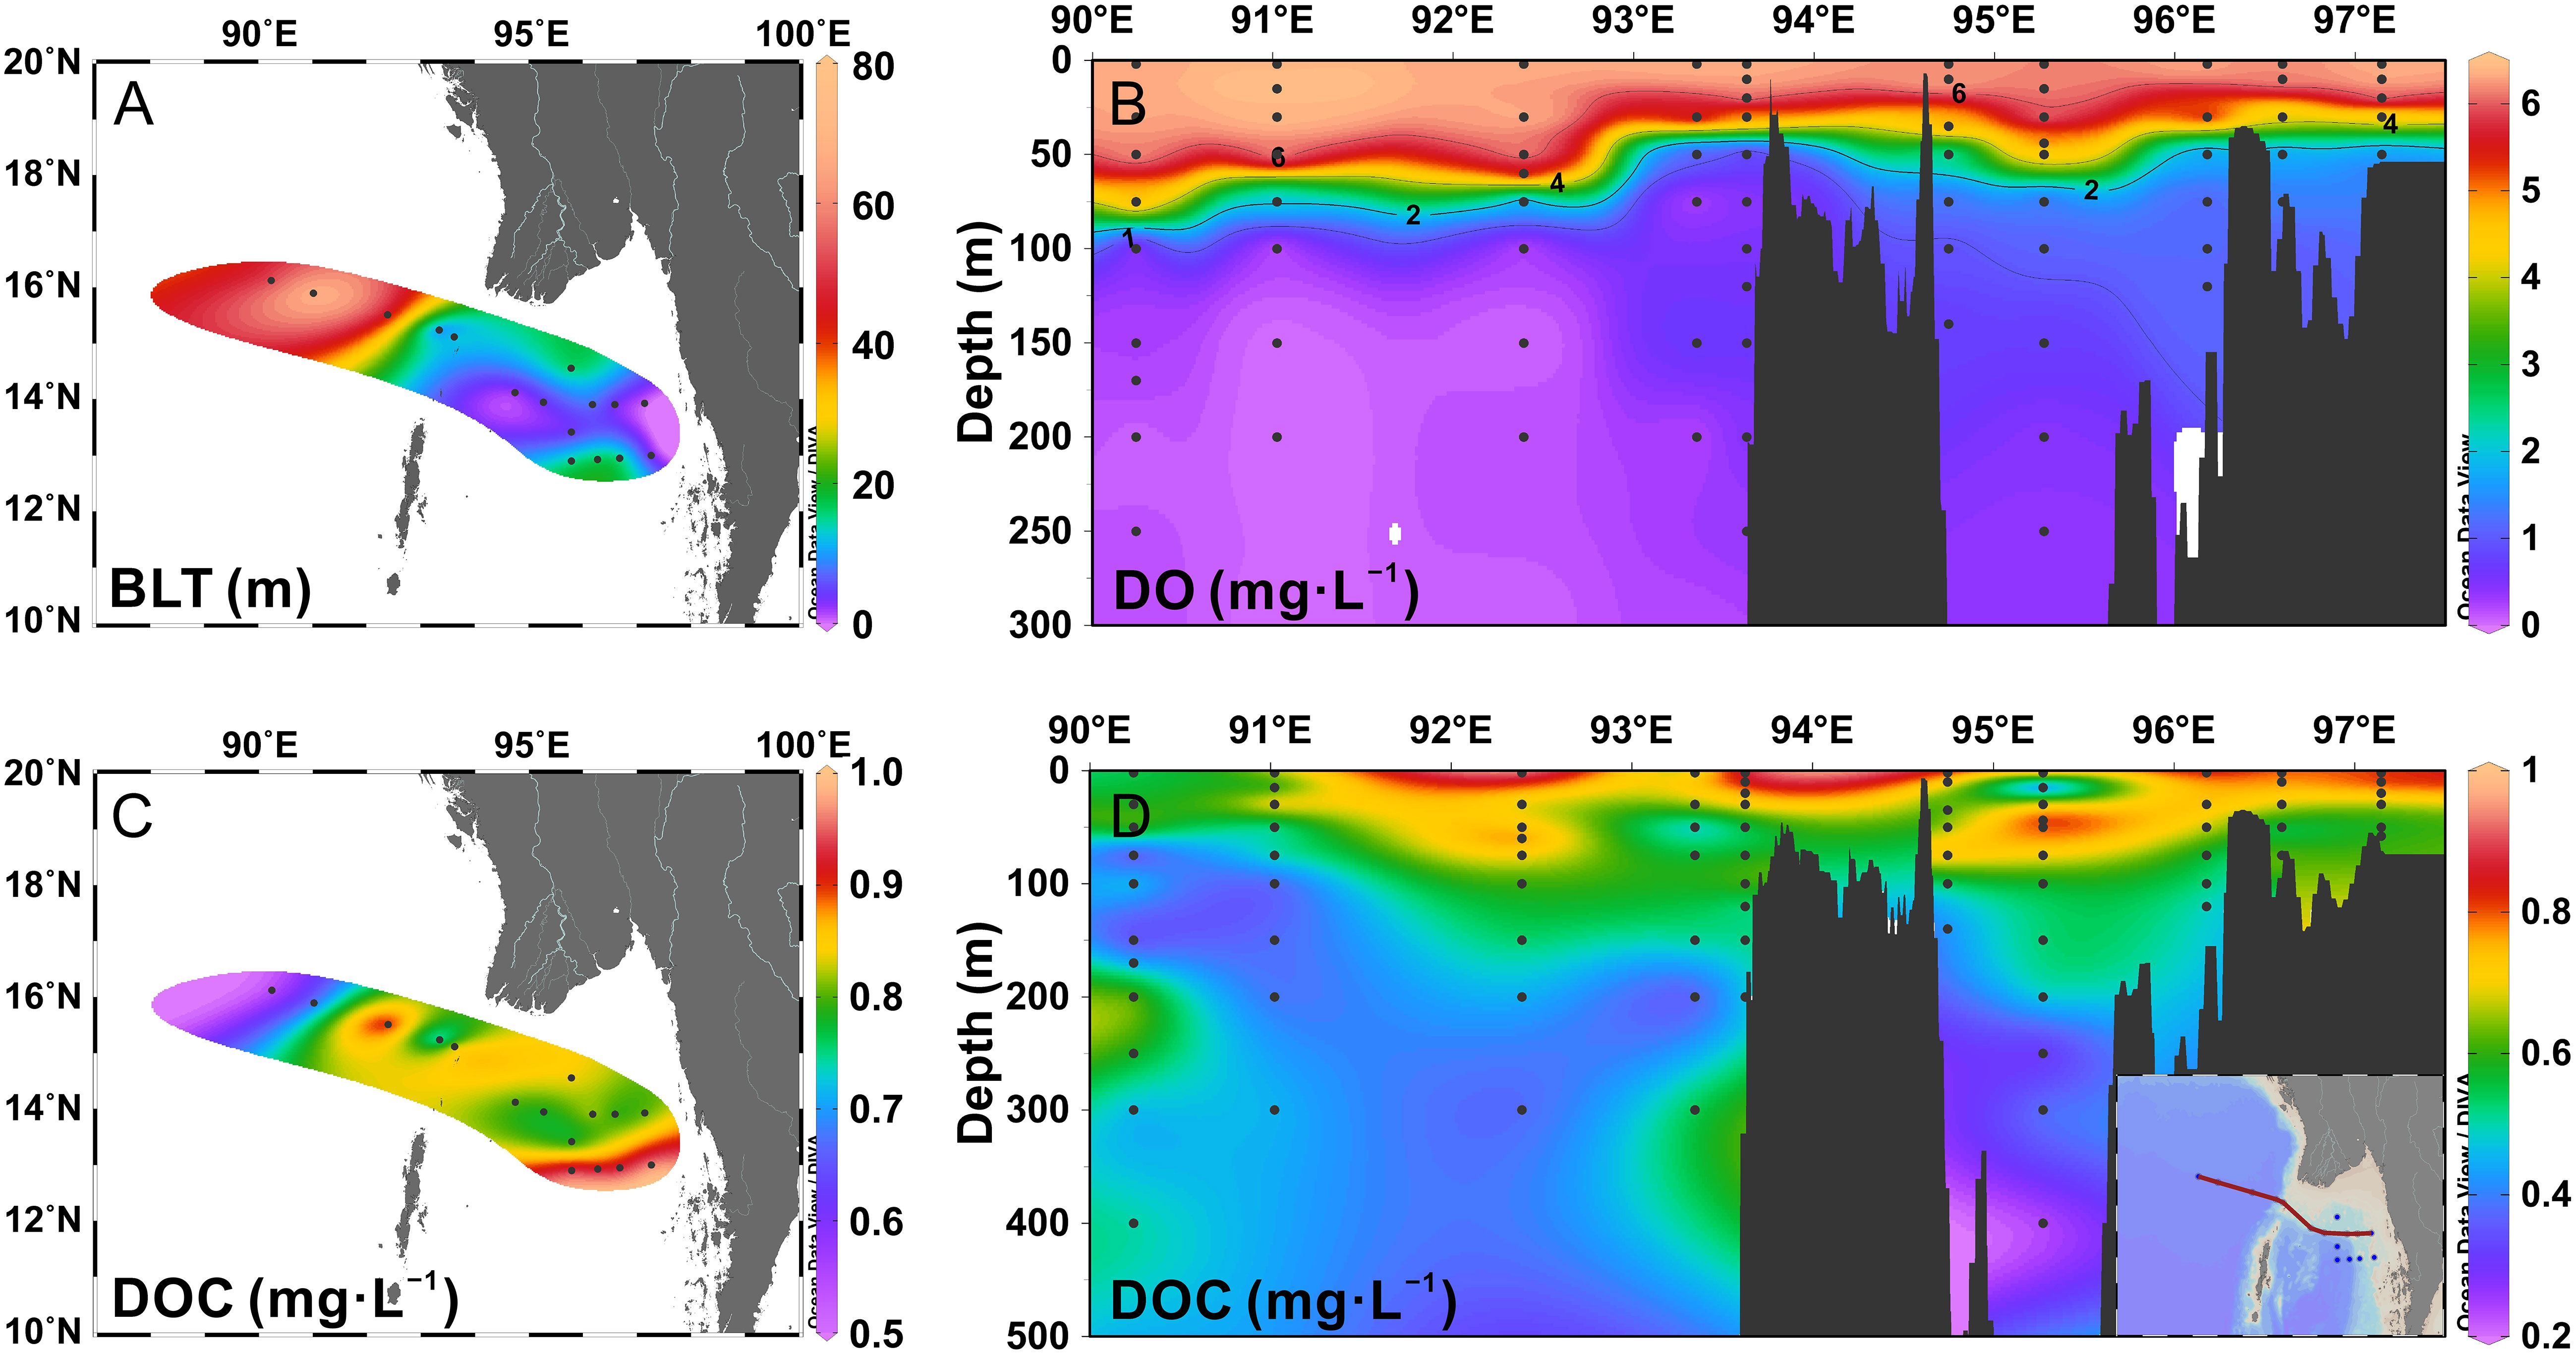
Figure 2 (A) The barrier layer thickness (BLT, m) in the study area. (B) Cross-sectional distribution of dissolved oxygen (DO, mg·L-1) across the Preparis Channel. (C) The distribution of dissolved organic carbon (DOC, mg·L-1) in the surface water. (D) Cross-sectional distribution of DOC (mg•L-1) across the Preparis Channel.
A stable stratification in the upper water column was observed in the study area. For all stations, the depth of the isohaline layer was shallower than that of the isothermal layer. Here, we calculated the thickness of the barrier layer and found it to be much thicker in the BOB (almost more than 50 m). In the northern AS, the BLT was less than 20 m, with relatively high values in the north near the rivers and the southern stations. A considerable freshwater flux resulted in the barrier layer in the eastern BOB. Especially during the southwest monsoon, abundant precipitation and river runoff caused a change in salinity in the surface water and brought a strong halocline above the thermocline into being. Freshwater discharge sustained the thick barrier layer until the northeast monsoon, when river runoff and precipitation gradually decreased. During February, the subtropical anticyclonic gyre (SAG) is well established in the BOB, and the barrier layer achieves a mature phase in which it is thick and widespread. As the vertical mixing became stronger in the surface water, the barrier layer would be eroded and even disappear (Sprintall and Tomczak, 1992; Thadathil et al., 2007; Kumari et al., 2018).
DOC concentrations ranged from 0.22 to 0.97 mg·L-1, with an average of 0.58 ± 0.17 mg·L-1 and a negative correlation with salinity (r = −0.711, p< 0.01, n = 171). The vertical distributions of DOC concentrations showed a decreasing trend from the surface to the deep layer, with constantly low values below 100 m (Figure 2D). On the surface (Figure 2C), DOC concentrations were relatively lower in the eastern BOB, where there was little source of DOM. In the northern AS, terrestrial allochthonous DOC was discharged from the Irrawaddy and Salween Rivers. However, the average concentrations from all stations were lower than 1 mg·L-1 due to the long offshore distances and low flux of rivers during February. The DOC concentrations should be higher in the coastal area in the north. In addition, high values of DOC were observed at the southern stations (MD-26, MD-27, MD-28, MD-29), indicating that there was a water mass abundant in dissolved organic exceeding that of the northern. The salinity of this water mass is relatively low, and the source of DOC was not explained because of the limited data. The distributions of DOM in the surface water resulted from the mixing of water masses with different characteristics that were affected by the northeast monsoon.
Vertical stratification in the upper water column facilitates the accumulation of DOC (Hansell et al., 2009). Considering the coupling relation between the thickness of the barrier layer and DOC concentrations (Figures 2A, C), we proposed that the barrier layer was another factor controlling the distribution of DOM. In the BOB, which was lacking in organic matters, the strong barrier layer was conducive to maintaining the low concentrations. Conversely, in the southern stations in the AS with high levels of DOC, for example, the barrier layer favored the accumulation of materials on the surface by reducing the vertical delivery to the underlayer. Under the barrier layer, the DO was inadequate without an effective supplement, leading to a retarded rate of decomposition, which was reflected in the low levels of DOC concentrations in the anoxic zone.
Four fluorescent components, namely, three humic-like components (C1, C2, and C4) and one protein-like component (C3), were identified by EEM-PARAFAC analysis in the study area (Figure 3) and compared with previous studies in OpenFluor (Murphy et al., 2013; Murphy et al., 2014). Table 1 provides the spectral characteristics of the four components, including the maximum of excitation and emission, the range of maximum fluorescence in RU (Figure 4A), probable sources, and some examples of matching components identified by other researchers in various aquatic environments. Contour plots and loadings of excitation and emission of individual PARAFAC components are given in Figure 3. All fluorescent components identified here were reported in previous studies for midwestern and coastal waters of the BOB (Chari et al., 2012; Chari et al., 2016).
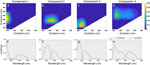
Figure 3 Contour plots (A–D) and loadings (E–H) of excitation and emission of individual parallel factor components (C1-C4).
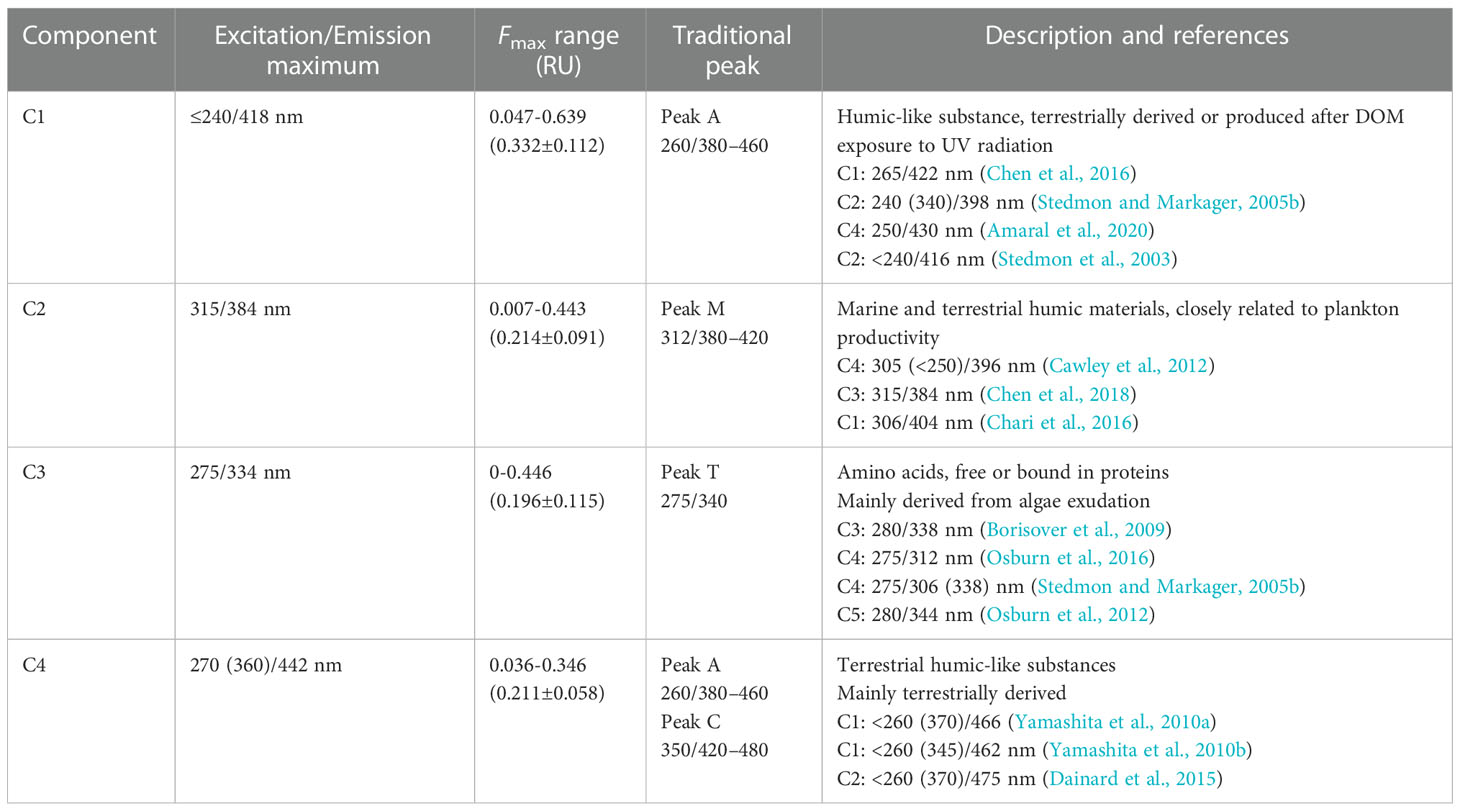
Table 1 The characteristics of the four components (C1-C4) identified by the PARAFAC (parallel factor) model [including peak positions (Excitation/Emission maximum) with secondary excitation bands in brackets, fluorescence maximum (Fmax) range, classification by traditional peak (Coble, 1996), and brief description].
The excitation maximum for C1 occurred at ≤240 nm and the emission maximum at 418 nm, typically categorized as a humic-like peak A as defined by Coble (1996). It was described as a common terrestrially derived component or one produced after DOM exposure to UV radiation (Stedmon and Markager, 2005b), observed in both terrestrially and marine-derived DOM. Component C2 showed an excitation maximum at 315 nm and an emission maximum at 384 nm, classified as a secondary humic-like component peak M existing in various aquatic environments and closely related to plankton productivity. The absence of peak M in the surface water indicated that it was labile and hard to preserve over long periods (Coble et al., 1998). The correlation between C1 and C2 (r = 0.861, p< 0.01, n = 170) implies a similarity of origins and consistency of behaviors in the study area. C1 and C2 were ubiquitous in aquatic environments and contained both autochthonous and allochthonous DOM. The Fmax of C1 was higher than that of others, while C2, C3, and C4 showed no difference in quantitative terms. C1 and C2 were predominant in FDOM, with a total proportion of 56%, and strongly correlated to FDOM in Fmax (r = 0.952, p< 0.01, n = 170; r = 0.888, p< 0.01, n = 170, respectively).
Component C3 had a peak at 275 nm excitation and 334 nm emission, which was confirmed as a fluorescent protein-like (tryptophan-like) substance, peak T. The tryptophan-like substance is sensitive to the polarity of the solvent. The position of the tryptophan-like substance in fluorescence spectra usually moves to a shorter wavelength when bounding to proteins because of the shielding effect of water (Lakowicz, 2006). C3 was mainly derived from algae exudation, representing autochthonous DOM freshly produced (Stedmon and Markager, 2005b), which was also reflected in the correlation to the BIX (r = 0.703, p< 0.01, n = 170). Furthermore, the proportion of C3 in FDOM (C3%) showed relevance to the apparent oxygen utilization (AOU, calculated by DO; r = −0.869, p< 0.01, n = 170), suggesting that C3 was biodegraded and recycled in the water column with high availability. The tryptophan-like substance was produced in upper water and expends rapidly as depth increases, so that smaller quantities were preserved in the deep sea. In the open sea, in situ biological production is the primary source of CDOM (Coble, 2007). The tryptophan-like (peak T) and tyrosine-like (peak B) substances are the main materials of fresh DOM in natural water. However, the tyrosine-like fluorophore (peak B) was not considered in the modeling because of its low abundance. It was enriched in the area with high nutrient and coastal upwelling, since the tyrosine-like fluorophore was attributed to bacterial decay of photosynthetically produced organic matter and considered a proxy of primary production. Different from tryptophan-like substances, tyrosine-like substances are not significantly affected by microbial and photodegradation and exert a positive priming effect on the overall DOM pool. In the study area, the fluorescent DOM was dominated by runoffs north of the AS. The barrier layer slowed down the vertical exchange in the upper water, so that few tyrosine-like substances were generated and preserved. Therefore, it was enriched in the continental shelf waters of the western BOB (Chari et al., 2016), but few observations were made in the AS.
Component C4 was composed of two peaks, with a primary excitation band centered at 270 nm and a secondary excitation peak at 360 nm, and one emission peak centered at 442 nm. C4 seemed to be a mixture of the traditional peak A in the ultraviolet region and peak C in the visible region defined by Coble (1996) and Coble et al. (1998), which were commonly observed in coastal environments. The Fmax of C4 was positively related to the HIX (r = 0.631, p< 0.01, n = 169), implying that it was terrestrially derived. The proportions of C3 and C4 in FDOM (C3% and C4%) were calculated and seemed to be exponentially correlated (r = 0.85, p< 0.01, n = 170; Figure 4B). C4% and C3% represented the degree of effect on FDOM by terrestrial input and biological activities in the site, respectively. The nonlinear relationship between them suggested the existence of other fluorescent components, namely, C1 and C2, with multiple sources.
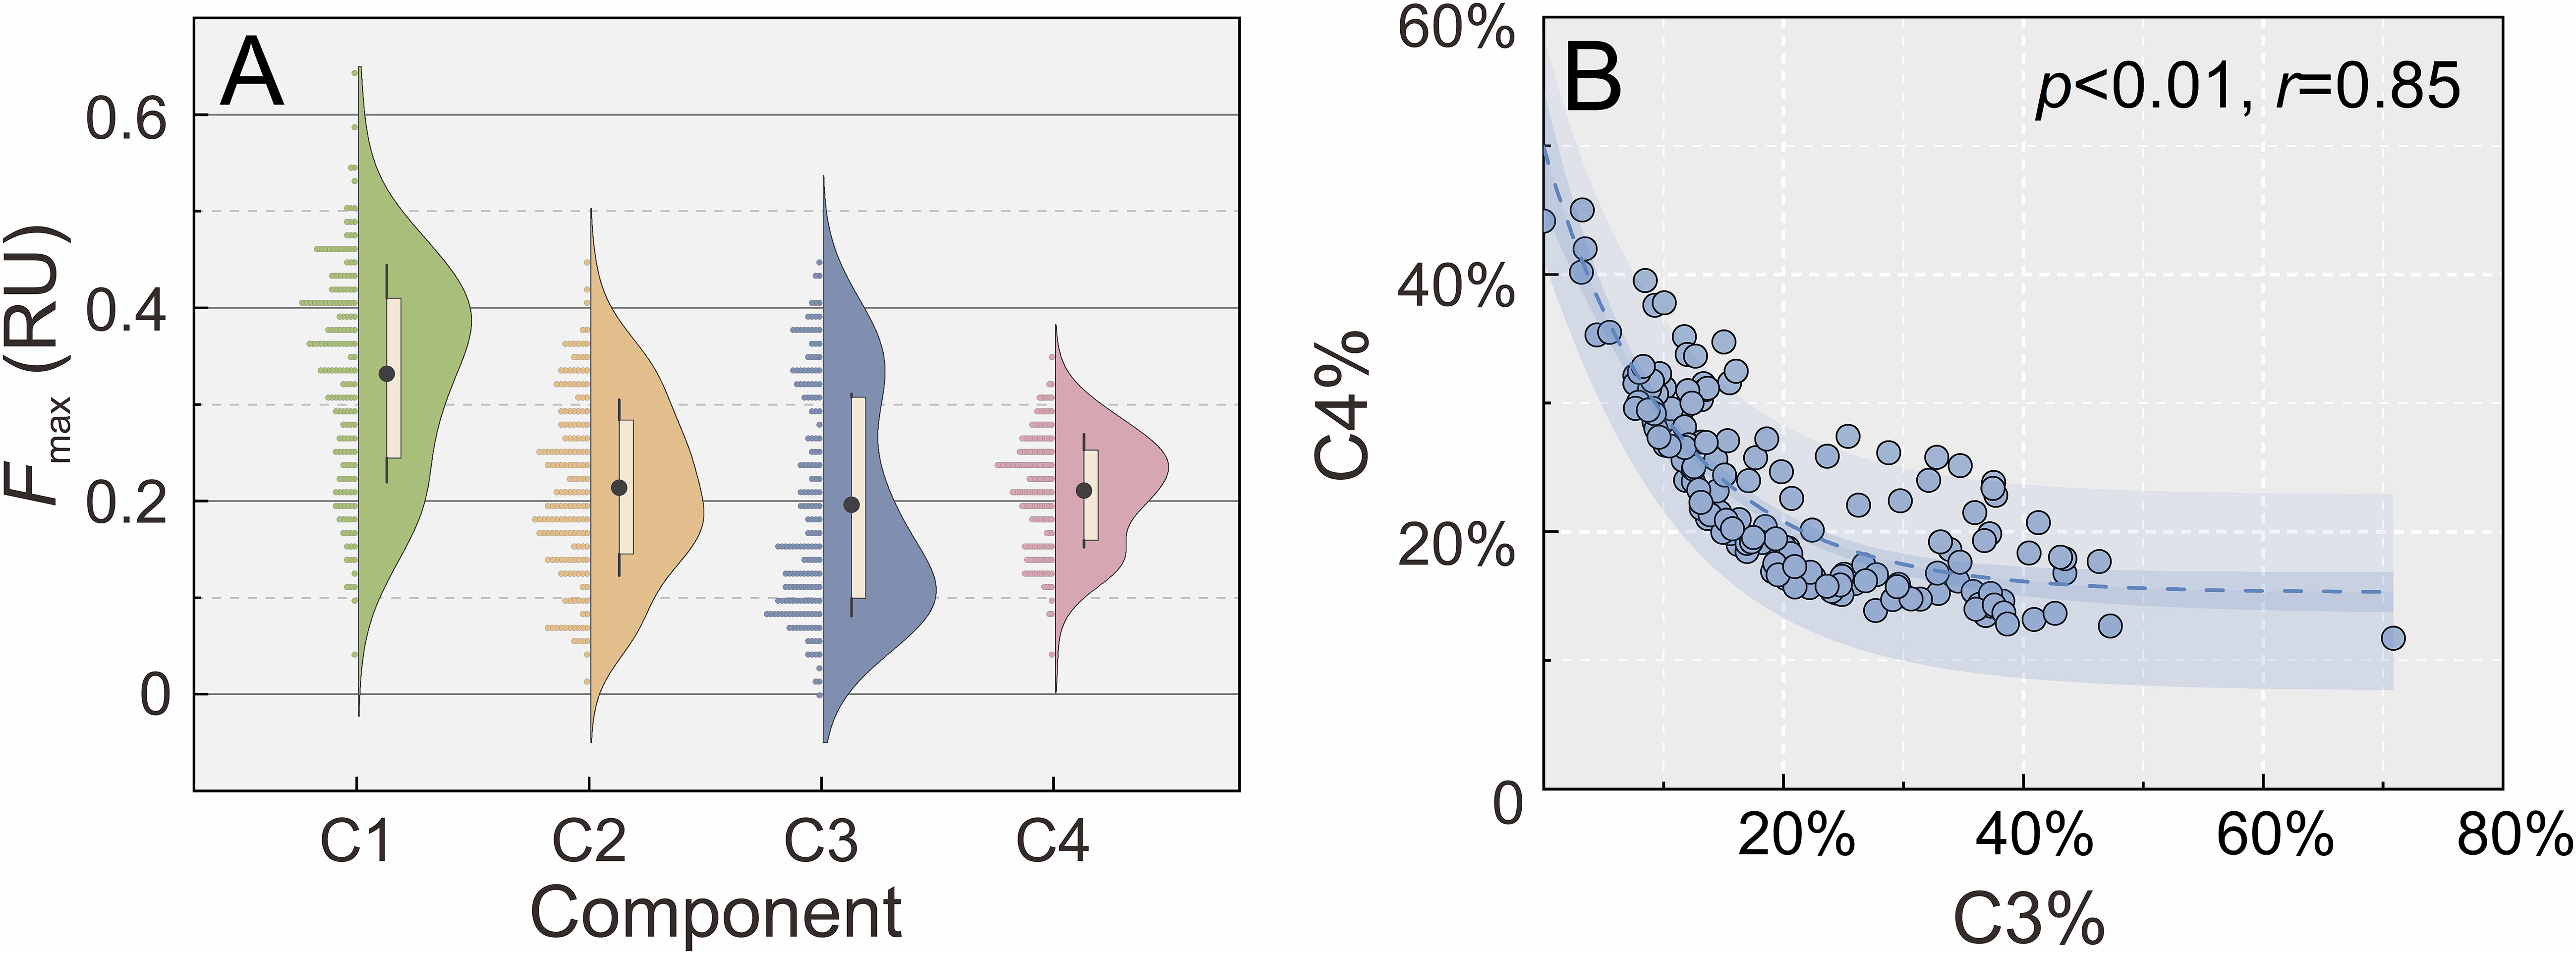
Figure 4 (A) Fluorescence maximum (Fmax) of fluorescent components identified by parallel factor (PARAFAC) analysis (data were represented by colored dots on the left side and the distribution density on the right side; the black dots represent the average value). (B) The exponential correlation between C3% and C4%.
The HIX values ranged from 0.70 in the subsurface layer (15 m) at station MD-20 with lowest C4% (11.7%) to 6.74 in the deep water station at MD-14, with a mean value of 2.07 ± 0.90. The higher values of the HIX were observed in the coastal area and resulted from terrigenous input from the rivers in the north (Figure 5B). In the vertical section, high values appeared in the upper–middle layer and bathypelagic layer because the terrestrial material was removed when exposed to sunlight in the surface and in the bottom; FDOM could originate from the resuspension of organic matter in pore waters (Guo et al., 2011). BIX values ranged between 0.86 and 1.90 (1.34 ± 0.22) and reflect a mixture of terrestrially derived DOM and marine-derived protein-like DOM. The high values of the BIX were observed in the surface and subsurface, closely related to biological activities (Lin et al., 2021). Both the HIX and BIX changed consistently with DOM sources, with high HIX values in nearshore waters, demonstrating that terrigenous materials with a high humification degree played a dominant role in the distribution of FDOM.
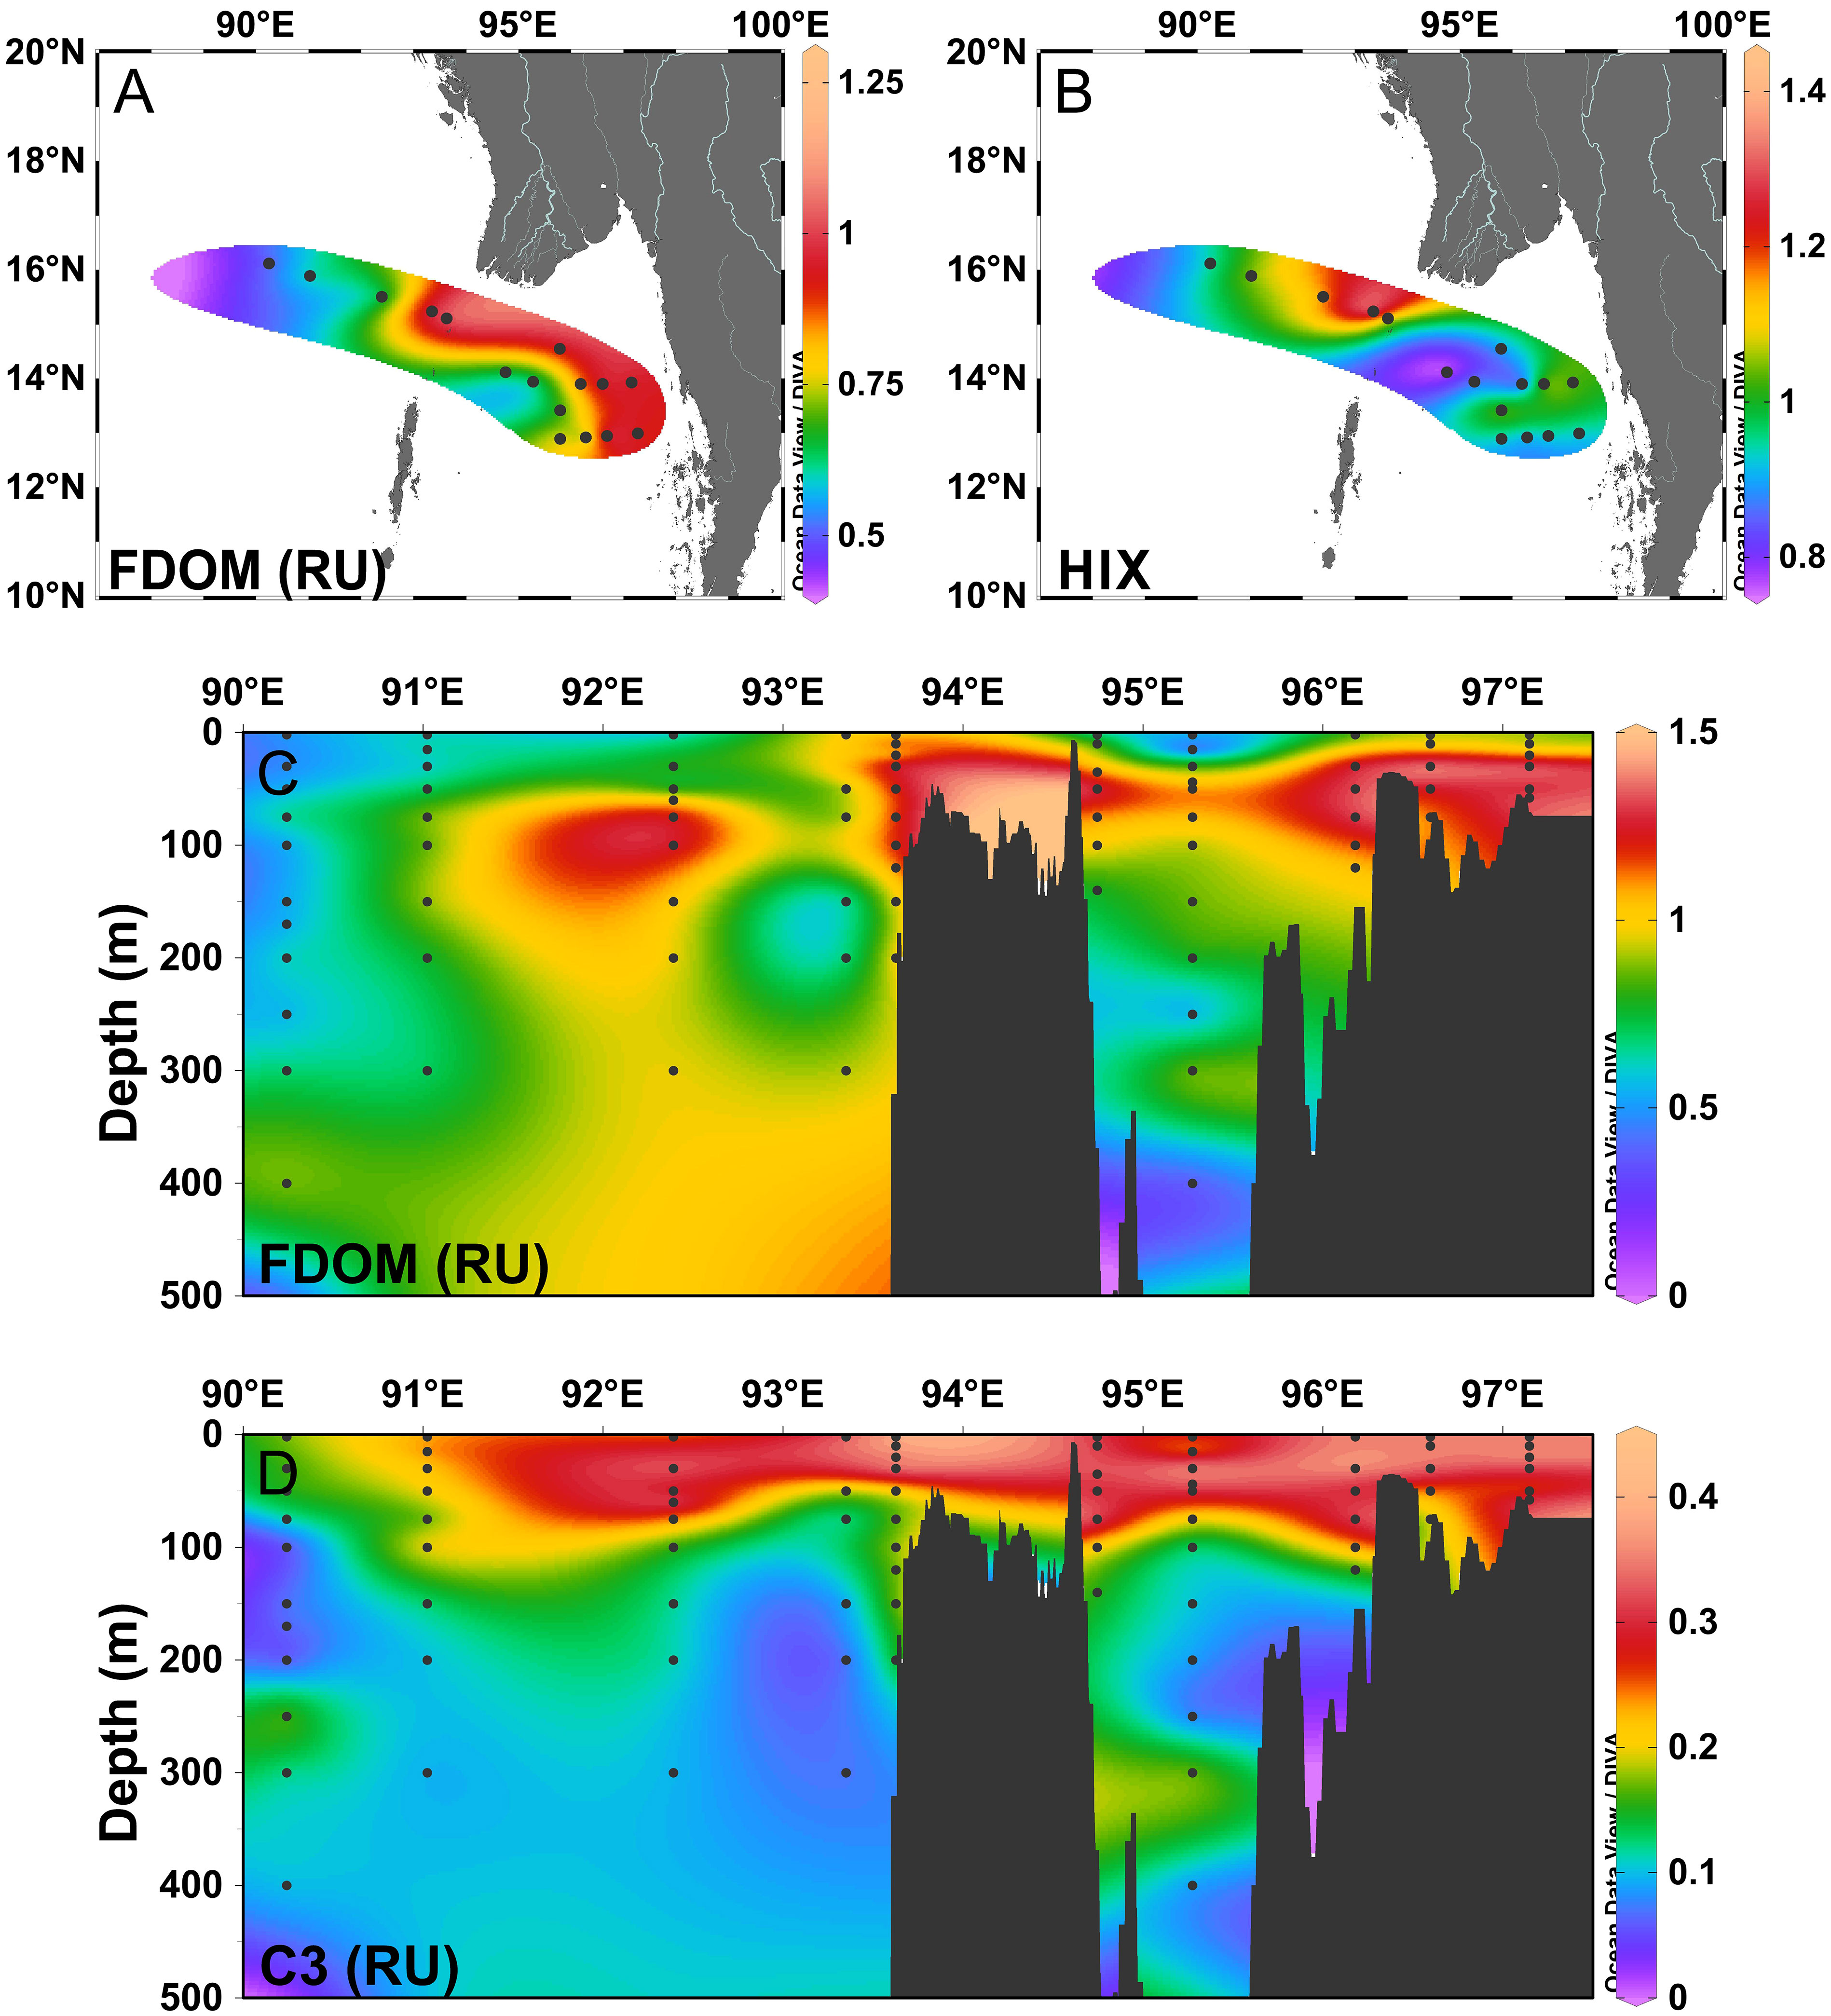
Figure 5 (A) The distribution of the fluorescence maximum of fluorescent dissolved organic matter (FDOM, RU) in the surface water. (B) The distribution of the humification index (HIX) in the surface water. (C) Cross-sectional distribution of the fluorescence maximum of fluorescent dissolved organic matter (FDOM, RU) across the Preparis Channel. (D) Cross-sectional distribution of the fluorescence maximum of C3 (RU) across the Preparis Channel.
In the surface water, the distribution of FDOM showed a decreasing trend from nearshore to offshore stations (Figure 5A), which was mainly controlled by terrestrial input from rivers and human activities. The distributions of individual components were similar to those of FDOM intensities. In the vertical section, FDOM was largely photodegraded at the surface, and as a consequence, the maximum FDOM concentrations were observed in the subsurface layer (Figure 5C). Photobleaching in the upper water was thought to be the major sink of humic-like components in the ocean (Chen and Bada, 1992). Differing from DOC, the concentration of FDOM had a poor correlation with salinity (r = −0.027, p = 0.728, n = 170), which was considered as evidence of the high degradability of FDOM. Identified as humic-like components, C1, C2, and C4 had high concentrations in subsurface layers due to the reduced photodegradation, which was a primary way to remove humic-like substances in the surface layer (Gonçalves-Araujo et al., 2015). In the AS, the humic-like components decreased with depth. However, the fluorescence intensities of the humic-like components are rapidly increasing in the mesopelagic layer and are at a constantly high level in the bathypelagic layer in the BOB. The humic-like fraction of DOM reached a net equilibrium between the supply from the terrestrial inputs, in situ production by the microbial activities, and photodegradation in surface waters (Jørgensen et al., 2011; Kowalczuk et al., 2013). For C4, strong fluorescence signals were observed in the bathypelagic layer in the BOB. Peak C was reported in previous studies to fluoresce from humic material that was refractory to degradation from the deep ocean (Coble et al., 1998). As a typical autochthonous component, C3 was produced freshly, which is indicative of recent biological activity. The tryptophan-like C3 from this study shows resistance to photodegradation. Without significant photodegradation and biodegradation (Stedmon and Markager, 2005b), C3 accumulated and was preserved for some time in the surface layer (Figure 5D). The distributions of C3 showed no difference between the AS and BOB, with a decreasing trend in the upper water, consistent with its sources from biological processes within the euphotic zone.
The PCA was carried out on the 11 parameters, namely, salinity, temperature (T), DO, DOC, HIX, BIX, FDOM, and the fluorescent components (C1–C4). Together, principal components 1 and 2 (PC1 and PC2, respectively) explained 83.47% of the total variance in the data set. As shown in Figure 6A, PC1 accounted for 51.34% of the variance, being positively related to DOC and temperature and negatively related to salinity. Loadings for variables we measured were clustered in three zones. C3 and the BIX with positive loadings of PC1 represented autochthonous FDOM, whereas C4 and the HIX with negative loadings represented allochthonous FDOM. As discussed before, FDOM, C1, and C2 contained materials from both marine and terrestrial systems, with low loadings in the middle. Therefore, we assumed that PC1 was dominated by sources of FDOM. PC2 explained 32.13% of the variance and may be strongly related to conservation of variables. For example, with the minimum of PC2, DO showed a strong correlation to salinity (p = 0.951, r< 0.01, n = 171). Compared with C1 and C2, protein-like C3 and DOC were less influenced by degradation (negatively related to salinity, r = −0.741, p< 0.01, n = 170; r = −0.711, p< 0.01, n = 171, respectively) and had lower loadings of PC2. Although humic-like C4 was also photodegraded at the surface, refractory humic materials served as a supplement to the degradability of C4. PC1 and PC2 were able to characterize the sources and behaviors of DOM, respectively.
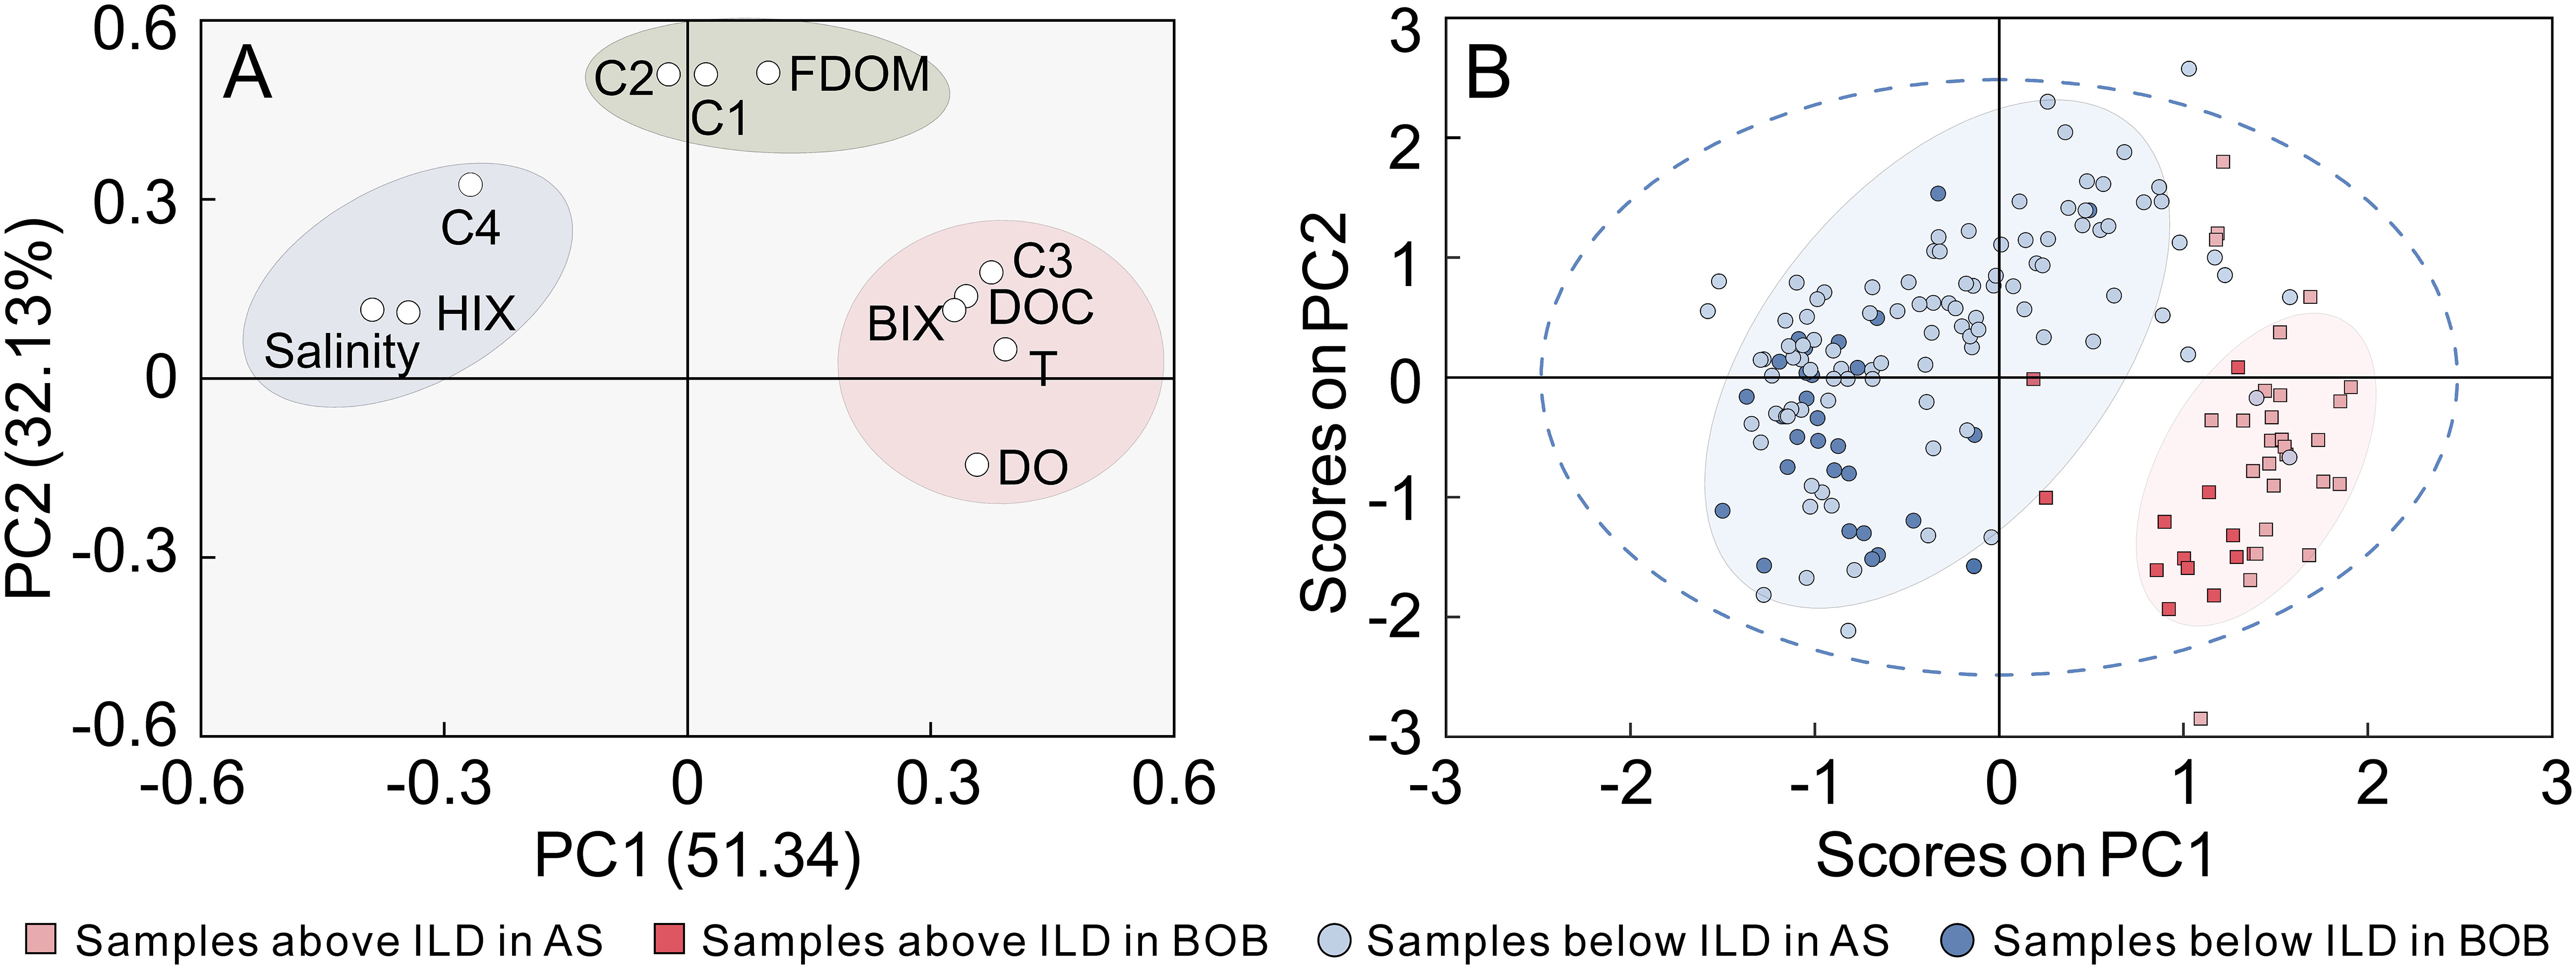
Figure 6 Principal component analysis (PCA). (A) Loading plot of the 11 parameters and (B) score plot of all samples (squares and dots represent samplesabove and below the isothermal layer depth (ILD), respectively; gradation of color was used to distinguish the sampling area).
Scores of samples are shown in Figure 6B, which clearly visualize how the samples relate to each other. Here, the samples were classified by location (BOB: Stations MD-14, MD-15, and MD-17; AS: Stations MD-18, MD-3B, MD-19, MD-13B, MD-20, and MD-22–MD-29) and depth (ILD). In the upper water column, there were more DOC and protein-like C3, which was mainly generated by plankton. The fraction of terrestrial FDOM was higher below the ILD. The scores of samples also showed the differences of DOM in the BOB and AS. Compared with those from AS, the samples from the BOB scored lower in both PC1 and PC2. It was shown that DOC and FDOM concentrations were lower in the BOB, which was caused by a low influx of DOM and the maintenance of a barrier layer. However, C4 was abundant in the BOB, especially in deep water, which implies that it may be the primary fluorescent DOM in the whole BOB. In the study area, the productivity in AS was higher, and there were more autochthonous FDOM produced by biological activities. Some samples of deep water in the AS had similar characteristics to the BOB and cannot be distinguished in the plot.
Horizontal and vertical distributions and controlling factors for DOM were investigated in the AS and adjacent area of the Preparis Channel. Using EEM-PARAFAC analysis, CDOM was characterized to independently assess the behaviors of the fluorescent components in the overall DOM pool. The results of DOC showed that the Irrawaddy and Salween Rivers are the primary terrestrial input, controlling the chemical properties of DOM on either side of the Preparis Channel. With a considerable quantity of freshwater input, barrier layers formed above the thermocline and had a persistent effect on DOC at the surface. Four fluorescent components were identified from 171 EEM samples measured, namely, three humic-like (C1, C2, and C4) components and one protein-like (C3) component. The humic-like components were dominated by terrestrial inputs and photodegradation at the surface, while C3 was a typical tryptophan-like component with high bioavailability and was not significantly affected by photochemical processes. The PCA results showed that with a thicker barrier layer on the surface, DOC and FDOM concentrations were lower in the northeast BOB. In the AS, there were more autochthonous FDOM produced by biological activities. However, the differences in the samples from the deep sea were not observed.
The raw data supporting the conclusions of this article will be made available by the authors, without undue reservation.
RZ, ZL and JC designed the study and wrote the manuscript with contribution of AA, HZ, WJ, JZ, FZ, HL, NH, ML. All authors contributed to the final version of the manuscript.
This work was funded in part by the Global Change and Air-Sea Interaction II Program (Grant Nos. GASI-04-HYST-06, GASI-04-HYST-01), the National Natural Science Foundation of China (42076242, 41906200, 41941013), and the Open Research Fund of State Key Laboratory of Estuarine and Coastal Research (SKLEC-KF202109).
The authors would like to thank the crew of R/V Xiangyanghong-06 for their assistance in sampling.
The authors declare that the research was conducted in the absence of any commercial or financial relationships that could be construed as a potential conflict of interest.
All claims expressed in this article are solely those of the authors and do not necessarily represent those of their affiliated organizations, or those of the publisher, the editors and the reviewers. Any product that may be evaluated in this article, or claim that may be made by its manufacturer, is not guaranteed or endorsed by the publisher.
The Supplementary Material for this article can be found online at: https://www.frontiersin.org/articles/10.3389/fmars.2022.1043194/full#supplementary-material
Amaral V., Romera-Castillo C., Forja J. (2020). Dissolved organic matter in the gulf of cádiz: Distribution and drivers of chromophoric and fluorescent properties. Front. Mar. Sci. 7 (126). doi: 10.3389/fmars.2020.00126
Benner R., Biddand B. (1998). Photochemical transformations of surface and deep marine dissolved organic matter: Effects on bacterial growth. Limnology Oceanography 43 (6), 1373–1378. doi: 10.2307/2838986
Blough N. V., Del Vecchio R. (2002). “"Chapter 10 - chromophoric DOM in the coastal environment,",” in Biogeochemistry of marine dissolved organic matter. Eds. Hansell D. A., Carlson C. A. (San Diego: Academic Press), 509–546.
Borisover M., Laor Y., Parparov A., Bukhanovsky N., Lado M. (2009). Spatial and seasonal patterns of fluorescent organic matter in lake kinneret (Sea of Galilee) and its catchment basin. Water Res. 43 (12), 3104–3116. doi: 10.1016/j.watres.2009.04.039
Cawley K. M., Butler K. D., Aiken G. R., Larsen L. G., Huntington T. G., McKnight D. M. (2012). Identifying fluorescent pulp mill effluent in the gulf of Maine and its watershed. Mar. pollut. Bull. 64 (8), 1678–1687. doi: 10.1016/j.marpolbul.2012.05.040
Chari H., Sarma N., Pandi S. R., Chiranjeevulu G., Kiran R., Murty K., et al. (2016). Fluorescent dissolved organic matter dynamics in the coastal waters off the central East Indian coast (Bay of bengal). BMC Ecology 4 (1), 13–20. doi: 10.13189/eer.2016.040103
Chari N. V. H. K., Sarma N. S., Pandi S. R., Murthy K. N. (2012). Seasonal and spatial constraints of fluorophores in the midwestern bay of Bengal by PARAFAC analysis of excitation emission matrix spectra. Estuarine Coast. Shelf Sci. 100, 162–171. doi: 10.1016/j.ecss.2012.01.012
Chen R. F., Bada J. L. (1992). The fluorescence of dissolved organic matter in seawater. Mar. Chem. 37 (3), 191–221. doi: 10.1016/0304-4203(92)90078-O
Chen M., Kim J.-H., Nam S.-I., Niessen F., Hong W.-L., Kang M.-H., et al. (2016). Production of fluorescent dissolved organic matter in Arctic ocean sediments. Sci. Rep. 6 (1), 39213. doi: 10.1038/srep39213
Chen B., Wei H., Shuzhan M., Feng M., Liu C., Gu X., et al. (2018). Characterization of chromophoric dissolved organic matter in the littoral zones of eutrophic lakes taihu and hongze during the algal bloom season. Water 10, 861. doi: 10.3390/w10070861
Coble P. G. (1996). Characterization of marine and terrestrial DOM in seawater using excitation-emission matrix spectroscopy. Mar. Chem. 51 (4), 325–346. doi: 10.1016/0304-4203(95)00062-3
Coble P. G. (2007). Marine optical biogeochemistry: The chemistry of ocean color. Chem. Rev. 107, 402–418. doi: 10.1002/chin.200720265
Coble P. G., Del Castillo C., Avril B. (1998). Distribution and optical properties of CDOM in the Arabian Sea during the 1995 southwest. Monsoon. 45 (10-11), 2195–2223. doi: 10.1016/S0967-0645(98)00068-X
Dainard P. G., Guéguen C., McDonald N., Williams W. J. (2015). Photobleaching of fluorescent dissolved organic matter in Beaufort Sea and north Atlantic subtropical gyre. Mar. Chem. 177, 630–637. doi: 10.1016/j.marchem.2015.10.004
Das S., Das I., Giri S., Chanda A., Maity S., Lotliker A. A., et al. (2017). Chromophoric dissolved organic matter (CDOM) variability over the continental shelf of the northern bay of Bengal. Oceanologia 59 (3), 271–282. doi: 10.1016/j.oceano.2017.03.002
Fellman J. B., D'Amore D. V., Hood E., Boone R. D. (2008). Fluorescence characteristics and biodegradability of dissolved organic matter in forest and wetland soils from coastal temperate watersheds in southeast Alaska. Biogeochemistry 88 (2), 169–184. doi: 10.1007/s10533-008-9203-x
Foden J., Sivyer D. B., Mills D. K., Devlin M. J. (2008). Spatial and temporal distribution of chromophoric dissolved organic matter (CDOM) fluorescence and its contribution to light attenuation in UK waterbodies. Estuarine Coast. Shelf Sci. 79 (4), 707–717. doi: 10.1016/j.ecss.2008.06.015
Gonçalves-Araujo R., Stedmon C. A., Heim B., Dubinenkov I., Kraberg A., Moiseev D., et al. (2015). From fresh to marine waters: Characterization and fate of dissolved organic matter in the Lena river delta region, Siberia. Front. Mar. Sci. 2. doi: 10.3389/fmars.2015.00108
Guo W., Yang L., Hong H., Stedmon C. A., Wang F., Xu J., et al. (2011). Assessing the dynamics of chromophoric dissolved organic matter in a subtropical estuary using parallel factor analysis. Mar. Chem. 124 (1), 125–133. doi: 10.1016/j.marchem.2011.01.003
Hansell D., Carlson C., Repeta D., Schlitzer R. (2009). Dissolved organic matter in the ocean: A controversy stimulates new insights. Oceanography 22 (4), 202–211. doi: 10.5670/oceanog.2009.109
Hedges J. I. (2002). “"Chapter 1 - why dissolved organics matter,",” in Biogeochemistry of marine dissolved organic matter. Eds. Hansell D. A., Carlson C. A. (San Diego: Academic Press), 1–33.
Huguet A., Vacher L., Relexans S., Saubusse S., Froidefond J.-M., Parlanti E. (2009). Properties of fluorescent dissolved organic matter in the gironde estuary. Organic Geochemistry 40 (6), 706–719. doi: 10.1016/j.orggeochem.2009.03.002
Jørgensen L., Stedmon C. A., Kragh T., Markager S., Middelboe M., Søndergaard M. (2011). Global trends in the fluorescence characteristics and distribution of marine dissolved organic matter. Mar. Chem. 126 (1), 139–148. doi: 10.1016/j.marchem.2011.05.002
Kiran S. R. (2017). General circulation and principal wave modes in Andaman Sea from observations. Indian J. Sci. Technol. 10, 1–11. doi: 10.17485/ijst/2017/v10i24/115764
Kowalczuk P., Durako M. J., Young H., Kahn A. E., Cooper W. J., Gonsior M. (2009). Characterization of dissolved organic matter fluorescence in the south Atlantic bight with use of PARAFAC model: Interannual variability. Mar. Chem. 113 (3-4), 182–196. doi: 10.1016/j.marchem.2009.01.015
Kowalczuk P., Tilstone G., zabłocka ,. M., Röttgers ,. R., Thomas ,. R. (2013). Composition of dissolved organic matter along an Atlantic meridional transect from fluorescence spectroscopy and parallel factor analysis. Mar. Chem. 157, 170–184. doi: 10.1016/j.marchem.2013.10.004
Kumari A., Kumar S. P., Chakraborty A. (2018). Seasonal and interannual variability in the barrier layer of the bay of Bengal. J. Geophysical Research: Oceans 123 (2), 1001–1015. doi: 10.1002/2017JC013213
Laane R. W. P. M., Koole L. (1982). The relation between fluorescence and dissolved organic carbon in the ems-dollart estuary and the Western wadden Sea. Netherlands J. Sea Res. 15 (2), 217–227. doi: 10.1016/0077-7579(82)90005-9
Lawaetz A. J., Stedmon C. A. (2009). Fluorescence intensity calibration using the raman scatter peak of water. Appl. Spectrosc 63 (8), 936–940. doi: 10.1366/000370209788964548
Liao J., Peng S., Wen X. (2020). On the heat budget and water mass exchange in the Andaman Sea. Acta Oceanologica Sin. 39 (7), 32–41. doi: 10.1007/s13131-019-1627-8
Lin H., Guo L. (2020). Variations in colloidal DOM composition with molecular weight within individual water samples as characterized by flow field-flow fractionation and EEM-PARAFAC analysis. Environ. Sci. Technol. 54 (3), 1657–1667. doi: 10.1021/acs.est.9b07123
Lin H., Xu H., Cai Y., Belzile C., Macdonald R. W., Guo L. (2021). Dynamic changes in size-fractionated dissolved organic matter composition in a seasonally ice-covered Arctic river. Limnology Oceanography 66 (8), 3085–3099. doi: 10.1002/lno.11862
Ludwig W., Suchet P., Probst J.-L. (1996). River discharges of carbon to the world's oceans: Determining local inputs of alkalinity and of dissolved and particulate organic carbon. Comptes Rendus l'Academie Sci. - Serie IIa: Sci. la Terre Des. Planetes 323, 1007–1014.
Murphy K., Stedmon C., Graeber D., Bro R. (2013). Fluorescence spectroscopy and multi-way techniques. PARAFAC. Analytical Methods 5 (23), 6541–6882. doi: 10.1039/c3ay41160e
Murphy K. R., Stedmon C. A., Wenig P., Bro R. (2014). OpenFluor- an online spectral library of auto-fluorescence by organic compounds in the environment. Analytical Methods 6 (3), 658–661. doi: 10.1039/C3AY41935E
Osburn C. L., Boyd T. J., Montgomery M. T., Bianchi T. S., Coffin R. B., Paerl H. W. (2016). Optical proxies for terrestrial dissolved organic matter in estuaries and coastal waters. Front. Mar. Sci. 2, 127. doi: 10.3389/fmars.2015.00127
Osburn C. L., Handsel L. T., Mikan M. P., Paerl H. W., Montgomery M. T. (2012). Fluorescence tracking of dissolved and particulate organic matter quality in a river-dominated estuary. Environ. Sci. Technol. 46 (16), 8628–8636. doi: 10.1021/es3007723
Osburn C. L., Morris D. P., Thorn K. A., Moeller R. E. J. B. (2001). Chemical and optical changes in freshwater dissolved organic matter exposed to solar radiation. Biogeochemistry 54 (3), 251–278. doi: 16:0310.1023/A:1010657428418
Page S., Logan J., Cory R., McNeill K. (2014). Evidence for dissolved organic matter as the primary source and sink of photochemically produced hydroxyl radical in arctic surface waters. Environ. science. Processes impacts 16, 807–822. doi: 10.1039/c3em00596h
Paulmier A., Ruiz-Pino D. (2009). Oxygen minimum zones (OMZs) in the modern ocean. Prog. Oceanography 80 (3), 113–128. doi: 10.1016/j.pocean.2008.08.001
Potemra J. T., Luther M. E., O'Brien J. J. (1991). The seasonal circulation of the upper ocean in the bay of Bengal. J. Geophysical Research: Oceans 96 (C7), 12667–12683. doi: 10.1029/91JC01045
Søndergaard M., Stedmon C., Borch N. (2003). Fate of terrigenous dissolved organic matter (DOM) in estuaries: Aggregation and bioavailability. Ophelia 57, 161–176. doi: 10.1080/00785236.2003.10409512
Sprintall J., Tomczak M. (1992). Evidence of the barrier layer in the surface layer of the tropics. J. Geophysical Research: Oceans 97 (C5), 7305–7316. doi: 10.1029/92JC00407
Stedmon C., Bro R. (2008). Characterizing dissolved organic matter fluorescence with parallel factor analysis: A tutorial. Limnology Oceanography 6, 572–579. doi: 10.4319/lom.2008.6.572
Stedmon C. A., Markager S. (2001). The optics of chromophoric dissolved organic matter (CDOM) in the Greenland Sea: An algorithm for differentiation between marine and terrestrially derived organic matter. Limnology Oceanography 46 (8), 2087–2093. doi: 10.4319/lo.2001.46.8.2087
Stedmon C., Markager S. (2005a). Resolving the variability in dissolved organic matter fluorescence in a temperate estuary and its catchment using PARAFAC analysis. Limnology Oceanography - LIMNOL OCEANOGR 50, 686–697. doi: 10.4319/lo.2005.50.2.0686
Stedmon C., Markager S. (2005b). Tracing the production and degradation of autochthonous fractions of dissolved organic matter by fluorescence analysis. Limnology Oceanography 50 (5), 1415–1426. doi: 10.2307/3597686
Stedmon C. A., Markager S., Bro R. (2003). Tracing dissolved organic matter in aquatic environments using a new approach to fluorescence spectroscopy. Mar. Chem. 82 (3), 239–254. doi: 10.1016/S0304-4203(03)00072-0
Sun J., Ma J., Lian L., Yan S., Song W. (2021). Photochemical formation of methylhydroperoxide in dissolved organic matter solutions. Environ. Sci. Technol. 55 (2), 1076–1087. doi: 10.1021/acs.est.0c07717
Thadathil P., Muraleedharan P. M., Rao R. R., Somayajulu Y. K., Reddy G. V., Revichandran C. (2007). Observed seasonal variability of barrier layer in the bay of Bengal. J. Geophysical Research: Oceans 112 (C2). doi: 10.1029/2006JC003651
Varkey M. J., Murty ,.V., Suryanarayana ,. A. (1996). Physical oceanography of the bay of Bengal. Oceanogr. Mar. Biol. Annu. Rev. 34, 1–70.
Walker S. A., Amon R. M. W., Stedmon C., Duan S., Louchouarn P. (2009). The use of PARAFAC modeling to trace terrestrial dissolved organic matter and fingerprint water masses in coastal Canadian Arctic surface waters. J. Geophys. Res., 114, G00F06. doi: 10.1029/2009JG000990
Yamashita Y., Cory R. M., Nishioka J., Kuma K., Tanoue E., Jaffé R. (2010a). Fluorescence characteristics of dissolved organic matter in the deep waters of the Okhotsk Sea and the northwestern north pacific ocean. Deep Sea Res. Part II: Topical Stud. Oceanography 57 (16), 1478–1485
Yamashita Y., Scinto L. J., Maie N., Jaffé R. (2010b). Dissolved organic matter characteristics across a subtropical wetland’s landscape: Application of optical properties in the assessment of environmental dynamics. Ecosystems 13 (7), 1006–1019. doi: 10.1007/s10021-010-9370-1
Yang L., Hong H., Guo W., Chen C.-T. A., Pan P.-I., Feng C.-C. (2012). Absorption and fluorescence of dissolved organic matter in submarine hydrothermal vents off NE Taiwan. Mar. Chem. 128-129, 64–71.
Zhao L., Gao L., Guo L. (2021). Seasonal variations in molecular size of chromophoric dissolved organic matter from the lower changjiang (Yangtze) river. J. Geophysical Research: Biogeosciences 126 (8), e2020JG006160. doi: 10.1029/2020JG006160
Keywords: dissolved organic matter, fluorescent properties, parallel factor analysis, Andaman Sea, fluorescence excitation emission matrix
Citation: Zhao R, Li Z, Aye AA, Zheng H, Jin W, Zhang J, Zhou F, Li H, Han NM, Lwin M and Chen J (2023) Characteristics of chromophoric dissolved organic matter in the Northern Andaman Sea. Front. Mar. Sci. 9:1043194. doi: 10.3389/fmars.2022.1043194
Received: 13 September 2022; Accepted: 13 December 2022;
Published: 09 January 2023.
Edited by:
Jun Sun, China University of Geosciences Wuhan, ChinaReviewed by:
Yang Liu, Shandong University, Qingdao, ChinaCopyright © 2023 Zhao, Li, Aye, Zheng, Jin, Zhang, Zhou, Li, Han, Lwin and Chen. This is an open-access article distributed under the terms of the Creative Commons Attribution License (CC BY). The use, distribution or reproduction in other forums is permitted, provided the original author(s) and the copyright owner(s) are credited and that the original publication in this journal is cited, in accordance with accepted academic practice. No use, distribution or reproduction is permitted which does not comply with these terms.
*Correspondence: Zhongqiao Li, bGl6cUBzaW8ub3JnLmNu; Jianfang Chen, amZjaGVuQHNpby5vcmcuY24=
†Retired
Disclaimer: All claims expressed in this article are solely those of the authors and do not necessarily represent those of their affiliated organizations, or those of the publisher, the editors and the reviewers. Any product that may be evaluated in this article or claim that may be made by its manufacturer is not guaranteed or endorsed by the publisher.
Research integrity at Frontiers
Learn more about the work of our research integrity team to safeguard the quality of each article we publish.