 Brian M. Shamblin1*
 Kristen M. Hart2
 Margaret M. Lamont3
 Donna J. Shaver4
 Peter H. Dutton5
 Erin L. LaCasella5
 Campbell J. Nairn1
- 1Daniel B. Warnell School of Forestry and Natural Resources, University of Georgia, Athens, GA, United States
- 2United States Geological Survey, Wetland and Aquatic Research Center, Davie, FL, United States
- 3United States Geological Survey, Wetland and Aquatic Research Center, Gainesville, FL, United States
- 4Division of Sea Turtle Science and Recovery, Padre Island National Seashore, National Park Service, Corpus Christi, TX, United States
- 5National Oceanic and Atmospheric Administration-National Marine Fisheries Service, Southwest Fisheries Science Center, La Jolla, CA, United States
Resolving natal populations for juvenile green turtles is challenging given their potential for extensive dispersal during the oceanic stage and ontogenetic shifts among nursery habitats. Mitochondrial DNA markers have elucidated patterns of connectivity between green turtle nesting populations (rookeries) and juvenile foraging aggregations. However, missing rookery baseline data and haplotype sharing among populations have often impeded inferences, including estimating origins of Gulf of Mexico juveniles. Here, we assessed genetic structure among seven foraging aggregations spanning southern Texas (TX) to southwestern Florida (SWFL), including Port Fourchon, Louisiana (LA); a surface-pelagic aggregation (SP) offshore of Louisiana and Florida; Santa Rosa Island, Florida (SRI); St. Joseph Bay, Florida (SJB); and the Big Bend region, Florida (BB). We estimated source contributions to aggregations with novel genetic data (excluding SP and BB) using a Bayesian many-to-one mixed stock analysis (MSA) approach. Haplotype frequencies for western (TX, LA, SP, SRI) and eastern (SJB, BB, SWFL) aggregations were significantly differentiated. The largest shift in haplotype frequencies between proximal nursery sites occurred between SRI and SJB, separated by only 150 km, highlighting the lack of a geographic yardstick for predicting genetic structure. In contrast to previous MSA results, there was no signal of Florida juveniles at any foraging site. Mexican contributions dominated in all aggregations, with strong connectivity between western Bay of Campeche (Tamaulipas/Veracruz) rookeries and western foraging aggregations. MSA indicated more diverse Mexican origins for eastern aggregations, with larger inputs from the eastern Bay of Campeche (Campeche/Yucatán), Campeche Bank, and Quintana Roo rookeries. These results demonstrate the significance of the Gulf of Mexico coast and offshore waters of the United States as important nursery habitat for green turtles of Mexican origin and highlight the need for international coordination for management of these populations.
1. Introduction
The green turtle (Chelonia mydas) is a globally distributed threatened species with complex life history. Genetic structure of breeding populations is shaped by female natal philopatry to nesting sites (Jensen et al., 2013), despite individual dispersal that span ocean basins (Monzón-Argüello et al., 2010). Resolving population origins for individuals away from their natal beaches is challenging given extensive dispersal, ontogenetic shifts, and seasonal migrations. Females in some populations reside year round near their nesting areas (Hart et al., 2013; Hart et al., 2017), whereas others migrate hundreds or thousands of km between foraging home ranges and nesting sites (Mortimer and Carr, 1987). Oceanic juveniles spend their first few years in the epipelagic zone (Witherington et al., 2012), where they may potentially disperse large distances from their natal beaches. Juveniles in the Northwest Atlantic recruit to neritic nursery habitats as they reach 20-30 cm straight carapace length (SCL) (Kubis et al., 2009; Howell et al., 2016). Juveniles foraging in temperate areas, such as Bermuda and the central Atlantic coast of Florida, typically depart these nursery sites as they reach puberty at 60-70 cm straight carapace length (SCL) (Witherington et al., 2006; Meylan et al., 2011). Finally, subadults settle into foraging home ranges where they appear to maintain strong site fidelity as adults (Shimada et al., 2016; Shimada et al., 2019).
Elucidating dispersal and migratory connectivity of migratory marine species at breeding and foraging sites is critical for assessing population dynamics and shaping global ocean policy (Rees et al., 2016; Dunn et al., 2019). However, resolving the spatial scale of dispersal in juvenile green turtles has proven challenging. Research using satellite telemetry has established links between nesting areas and foraging sites for adult females (Godley et al., 2010; Hart et al., 2013; Stokes et al., 2015). However, device size constraints have traditionally limited post-hatchling and oceanic juvenile telemetry applications. Linking neritic juveniles to their natal regions is typically achieved via ocean circulation modeling and/or genetic mixed stock analyses (MSA). A recent exercise combined hatchling production estimates with ocean circulation modeling assuming passive drift to estimate connectivity, including the entire United States Gulf coast (Putman et al., 2020). The northern Gulf of Mexico was subdivided into three regions: 1) Texas, 2) central (Louisiana through Alabama), and 3) the West Florida Shelf to assess population contributions during 1996-2017. These analyses predicted substantial contributions (~100,000 individuals) from Costa Rica to Texas and the West Florida Shelf with slightly smaller contributions (10,000s of individuals) to the central Gulf of Mexico coastal region. Contributions of similar magnitude (10,000s) were predicted from Mexican nesting populations in Campeche, Yucatán, and Quintana Roo to all three northern Gulf of Mexico regions (Putman et al., 2020).
Connectivity estimates from ocean circulation modeling and MSA often yield congruent results (Naro-Maciel et al., 2017; Jensen et al., 2020). However, marked discrepancies have also arisen and may be informative for refining dispersal and recruitment hypotheses. One such discordance was an MSA-estimated Atlantic Florida contribution to a southwestern Florida foraging aggregation (SWFL) that was not supported by ocean circulation modeling. Active swimming by Florida hatchlings to attain coastal countercurrents that enter the Gulf of Mexico from the Atlantic was invoked as a possible explanation (Naro-Maciel et al., 2017). Likewise, ocean transport modeling suggested substantial Quintana Roo, Mexican green turtle oceanic juvenile contributions within the Deepwater Horizon oil spill footprint off the Louisiana coast (51-65%, Putman et al., 2015), whereas MSA of an aggregate of surface-pelagic juveniles sampled on the northern half of this footprint indicated minor inputs (≤ 5%) from Quintana Roo and primary contributions (53-58%) from Tamaulipas/Veracruz (Shamblin et al., 2018). This discrepancy was attributed to active swimming by Caribbean Sea oceanic juveniles such that most remained entrained within the Loop Current and were transported out of the Gulf of Mexico and into the North Atlantic (Shamblin et al., 2018). Advancements in tag miniaturization have recently enabled collection of short-term data from oceanic juvenile green turtles, verifying the importance of directed swimming behavior in affecting their distribution relative to inferences of ocean transport based on the assumption of passive drift (Putman and Mansfield, 2015; Mansfield et al., 2021).
Given this potential for active swimming, it’s unclear to what extent juvenile green turtles originating from Florida’s Atlantic coast rookeries might recruit to foraging sites in the Gulf of Mexico, either at the initial recruitment to the benthic life stage or during subsequent ontogenetic shifts. MSA based on the best available baseline data at the time suggested the possibility of large Florida contributions to the foraging aggregations in Texas (81%, Anderson et al., 2013), St. Joseph Bay, Florida (SJB, 49%, Foley et al., 2007); and SWFL (25%, Naro-Maciel et al., 2017). However, Foley et al. (2007) and Anderson et al. (2013) cautioned that the results should be interpreted carefully given the presence of nesting populations along Mexico’s Gulf of Mexico coast with no available genetic data. A subsequent analysis demonstrated that control haplotype frequencies at the Rancho Nuevo, Tamaulipas, Mexico rookery were similar to those of the central eastern Florida population, resulting in poor resolution of these potential source populations in MSA (Shamblin et al., 2017). Mitogenomic sequencing identified a single nucleotide position that proved diagnostic of each lineage, indicating primary Mexican contributions to the proximal Texas foraging aggregation (Shamblin et al., 2017). Haplotype data that subsequently became publicly available suggested the presence of at least five distinct nesting populations along Mexico’s Atlantic coast, with many harboring haplotypes that were previously of unknown origin (Pérez-Ríos, 2008; Millán-Aguilar, 2009). Reassessment of Mexican and Florida contributions to Gulf of Mexico foraging aggregations with these updated baseline data is vital, particularly in the vicinity of the Florida Keys, where adult females from the Atlantic Florida nesting populations are known to forage (Herren et al., 2018).
We characterized genetic structure among six neritic juvenile foraging aggregations spanning approximately 2,300 km of coastal habitats in the Gulf of Mexico. We sequenced new samples from two previously uncharacterized neritic juvenile foraging sites and re-sequenced samples from three additional aggregations. These data, along with published haplotype frequencies from a surface-pelagic aggregation offshore of Louisiana through the Florida panhandle and a neritic aggregation in the Big Bend region of Florida, provided a basis for assessing genetic structure across the region. We used Bayesian many-to-one MSA to estimate rookery contributions to five aggregations incorporating novel genetic data and updated population baselines to: 1) qualitatively compare contribution estimates from MSA to published connectivity patterns based on passive oceanic transport, and 2) compare the published surface-pelagic sample with novel and updated data from proximal neritic aggregations, and 3) test for the presence of juveniles of Atlantic Florida origin in the Gulf of Mexico.
2. Methods
2.1. Sample collection and laboratory analyses
We analyzed genetic data from one surface-pelagic and six neritic juvenile green turtle foraging aggregations in the Gulf of Mexico; the final dataset was a combination of published genetic data, new genetic markers from previously analyzed aggregations, and novel sequences from two previously uncharacterized foraging aggregations (Table 1). Capture details and characterization of previously described foraging aggregations are included in the cited references. We collected blood samples from neritic juvenile green turtles around Port Fourchon, Louisiana (LA) from 2014 through 2019. Turtles were captured via dipnet and individually identified through insertion of passive integrated transponders into the front flipper or shoulder. Blood samples were collected from the dorsal cervical sinus and preserved on Whatman® paper prior to DNA extraction using a Qiagen DNEasy blood and tissue extraction kit. We collected tissue samples from neritic juveniles foraging in the Gulf of Mexico offshore of Santa Rosa Island, Florida (SRI) from 2014 through 2019. Turtles were captured via a modified net set technique. Additional SRI study site and capture methodology details are available in Lamont and Johnson (2021).
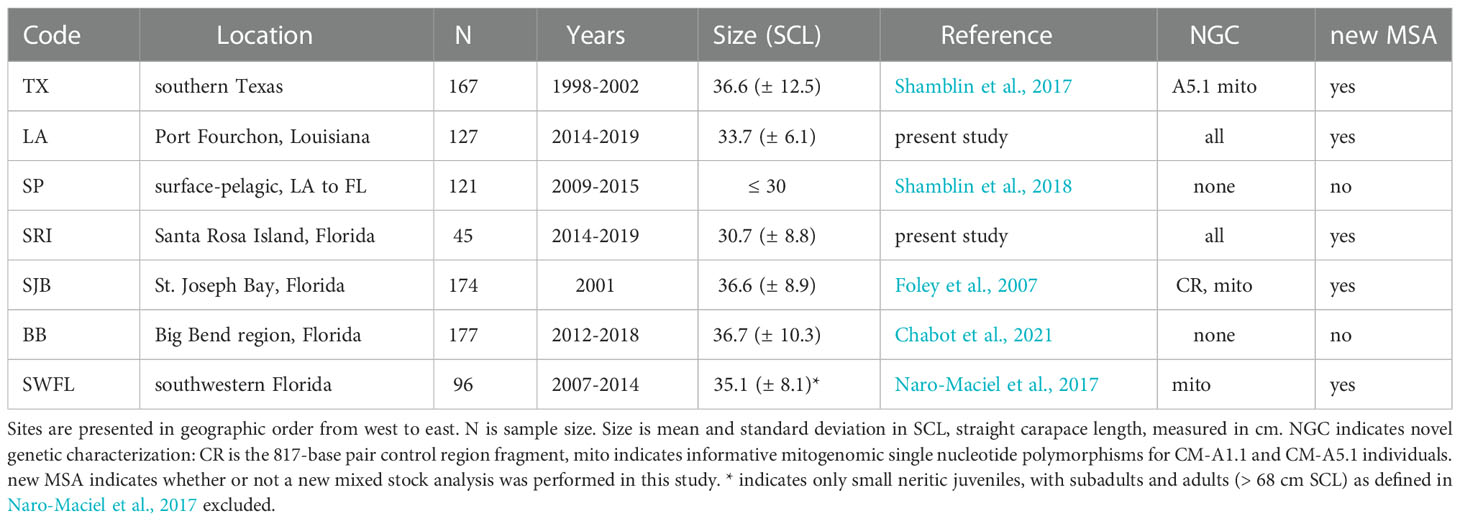
Table 1 Sampling locations and metadata for analyses of juvenile green turtle foraging aggregations in the Gulf of Mexico.
We amplified an 817-base pair (bp) fragment of the mitochondrial control region (CR) using primers LCM15382 and h950g (Abreu-Grobois et al., 2006) and sequenced the amplicon using LCM15382 and an internal sequencing primer Cm1820 (Shamblin et al., 2015a). We sequenced novel LA and SRI samples as well as CM-A1, CM-A5, and CM-A18 individuals from SJB (Foley et al., 2007) for this expanded control region fragment to identify informative variation outside the original 490-bp fragment. These are the only control region haplotypes in which variation has been detected and is available from potential populations of origin.
Following control region characterization, we sequenced all CM-A1.1 individuals for mitochondrial single nucleotide polymorphism (mtSNP) 12,958 in the ND5 gene using PCR primers CM12751F-CM13064R and sequencing primer CM12781 to distinguish between Tamaulipas and Florida lineages (Shamblin et al., 2017). We sequenced all CM-A5.1 individuals (including individuals from TX, Shamblin et al., 2017), at two additional mtSNPs that are regionally informative: mtSNP 10,745 that distinguishes TORT lineage CM-A5.1.2 and mtSNP 14,726 that distinguishes insular Caribbean lineage CM-A5.1.3 using primers and reaction conditions as previously described (Shamblin et al., 2012). We also sequenced CM-A1.1 and CM-A5.1 individuals from the previously characterized juvenile turtles (≤ 67.5 cm SCL, sex unknown) from Everglades National Park and Dry Tortugas National Park (SWFL; Naro-Maciel et al., 2017) as well as those from SJB (Foley et al., 2007) at these SNPs. Adults and subadults from SWFL were excluded to produce comparable data to other developmental habitats where these size classes are rare or absent except during mating and nesting season.
2.2. Genetic analyses
Sequences were aligned, edited, and compared to previously described haplotypes using the program Sequencher 5.0 (Gene Codes Corporation). Sequences were assigned haplotype designations after nomenclature published on the Archie Carr Center for Sea Turtle Research (ACCSTR) website (http://accstr.ufl.edu/resources/mtdna-sequences/ ) (Supplementary Table 1). We assessed genetic structure among seven juvenile foraging aggregations (Supplementary Table 2) using haplotype frequency-based pairwise FST comparisons and analysis of molecular variance (AMOVA) as implemented in Arlequin version 3.5 (Excoffier and Lischer, 2010). These comparisons incorporated published data from the Big Bend region of Florida (BB; Chabot et al., 2021) and a surface-pelagic sample set collected from shelf and slope waters from Louisiana to northwestern Florida (SP; Shamblin et al., 2018) (Figure 1). Comparisons were tested using 817-bp CR haplotypes (for rookery-informative haplotypes CM-A1, CM-A5, and CM-A18) as well as incorporating mtSNP data where available. Previous tests of juvenile natal homing based on CR haplotypes comparing DTFL nesting females and juveniles foraging in adjacent waters (SWFL) did not detect any differences between these groups (Naro-Maciel et al., 2017). We revisited this comparison based on CR, mitochondrial short tandem repeat array (mtSTR), and mitogenomic SNPs based on an expanded DTFL nesting female sample (Shamblin et al., 2020). Mitogenomic SNPs for CM-A1.1 and CMA5.1 turtles were generated in the present study and combined with previously published CR and mtSTR (Naro-Maciel et al., 2017). Significance values for AMOVA were obtained from 10,000 permutations.
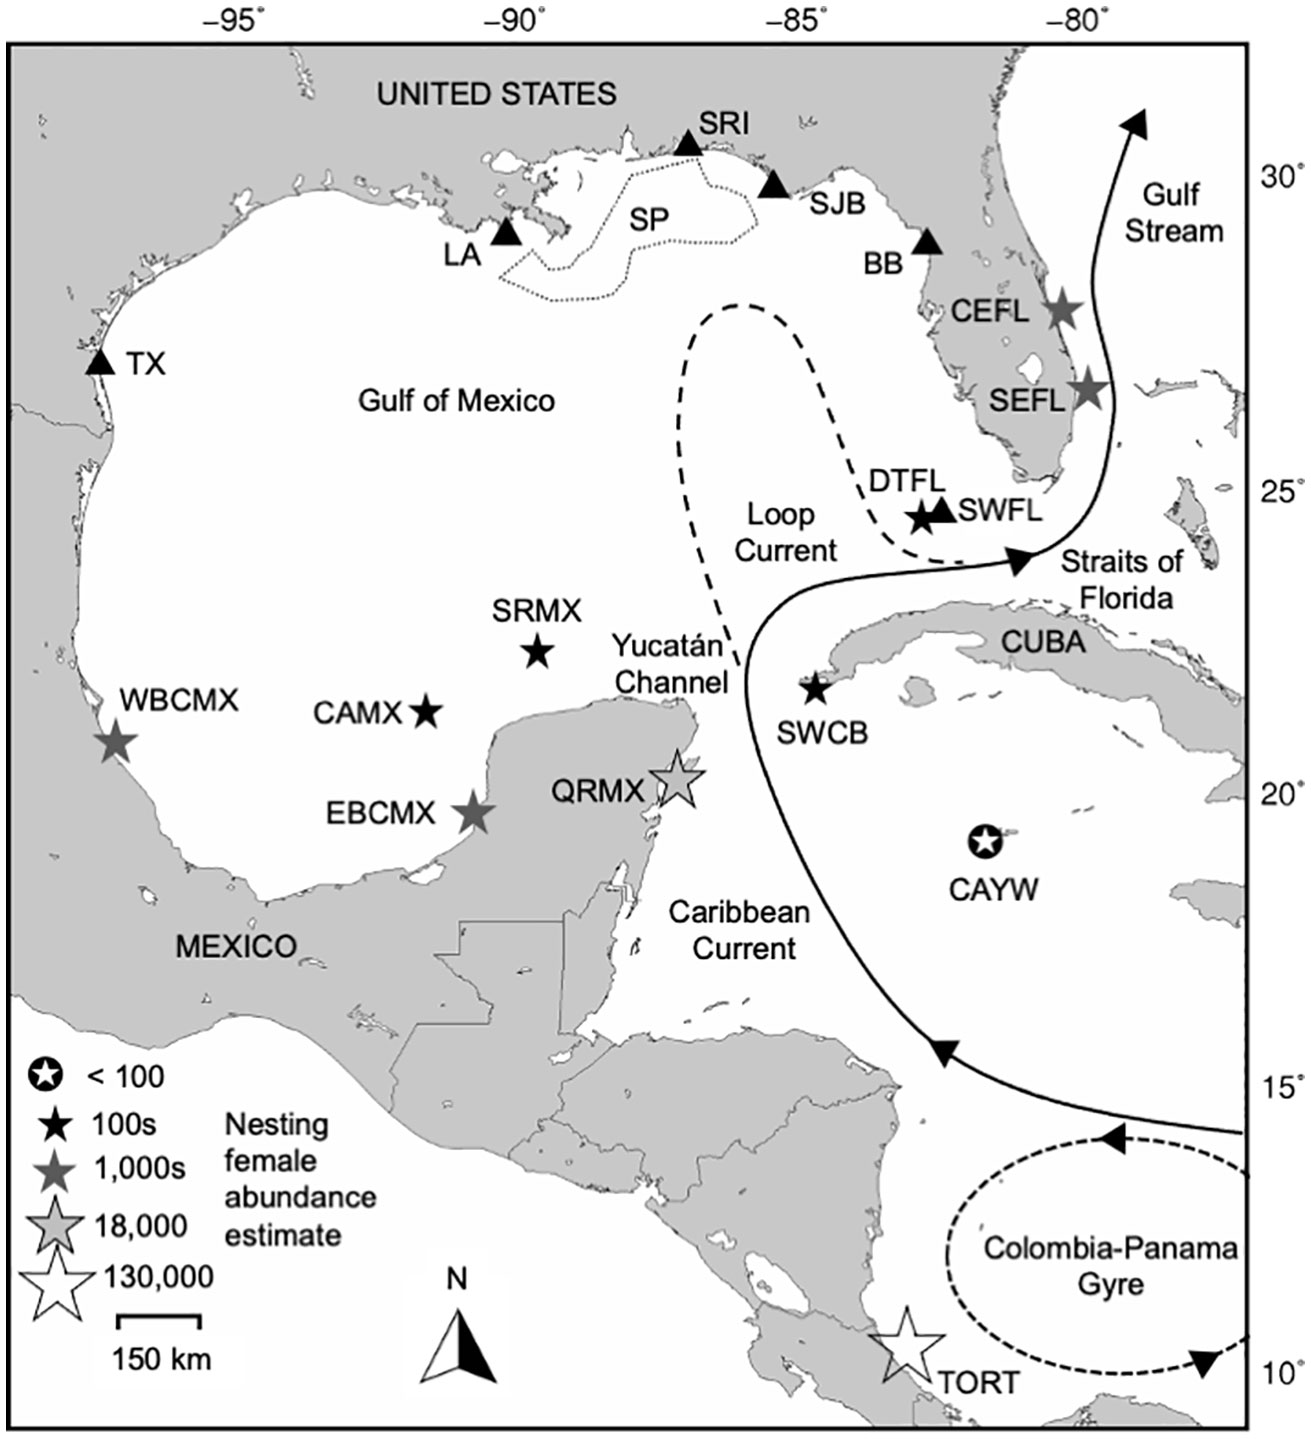
Figure 1 Gulf of Mexico neritic juvenile green turtle foraging aggregations (black triangles) and their potential source populations considered in mixed stock analyses (stars). Foraging aggregation abbreviations are: TX, Texas; LA, Louisiana; SRI, Santa Rosa Island, Florida; SP, surface-pelagic, spanning Louisiana to Florida waters indicated by the dotted line; SJB, St. Joseph Bay, Florida; BB, Big Bend region, Florida; SWFL: southwestern Florida (Dry Tortugas and Everglades). Source population abbreviations are: TORT, Tortuguero, Costa Rica; CAYW, Cayman Islands; SWCB, southwestern Cuba; QRMX, Quintana Roo, Mexico; WBCMX, Tamaulipas and Veracruz, Mexico; EBCMX, mainland Campeche and Yucatán, Mexico; CAMX, Cayo Arcas, Mexico; SRMX, Scorpion Reef, Mexico; DTFL, Dry Tortugas, Florida; SEFL, southeastern Florida; CEFL, central eastern Florida. The flow of major surface currents in the region is included for context.
In order to assess the effect of geographical distance on observed patterns of differentiation, we performed Mantel tests as implemented in Arlequin (Rousset, 1997). Genetic distance was represented by pairwise FST values, and geographic distance was untransformed shortest sea distances between approximate centers of each sampled neritic aggregation (Supplementary Table 3). We performed Mantel tests across the entire neritic Gulf of Mexico dataset as well as clusters defined by AMOVA to account for hierarchical genetic structure (Meirmans, 2012).
We individually estimated stock contributions to the five neritic assemblages that incorporated new genetic data (TX, LA, SRI, SJB, and SWFL) through Bayesian many-to-one MSA as implemented in the program BAYES (Pella and Masuda, 2001). Eleven western and northern Greater Caribbean nesting populations were considered as potential source populations: Tortuguero, Costa Rica (TORT); the Cayman Islands (CAYW); southwestern Cuba (SWCB); Quintana Roo, Mexico (QRMX); Western Bay of Campeche [Tamaulipas/Veracruz], Mexico (WBCMX); Eastern Bay of Campeche [Campeche/Yucatán mainland], Mexico (EBCMX); Cayo Arcas, Mexico (CAMX); Scorpion Reef, Mexico (SRMX); Dry Tortugas, Florida, USA (DTFL); southeastern Florida (SEFL); and central eastern Florida (CEFL) (Figure 1, Supplementary Table 2). Aves Island, Venezuela and Suriname were not included in the final MSAs because initial runs suggested only minor potential contributions with small credible intervals (< 0.01, data not shown), and only a single individual of eastern Caribbean origin was confirmed across the entire dataset. We did not perform new MSA for SP or BB because these recently published analyses were conducted using similar baseline data as the present study (Shamblin et al., 2018; Chabot et al., 2021). However, we did qualitatively compare estimated stock contributions from the novel and reanalyzed aggregations with estimates from these studies for geographic and temporal context.
MSAs were based primarily on 490-bp sequences. Informative variation outside the 490-bp haplotypes but present in the 817-bp CR sequences was included where available from potential source populations (eg. CM-A1.1 versus CM-A1.2, CM-A18.1 versus CM-A18.2). Mitogenomic variation for CM-A1.1 and CM-A5.1 was also incorporated where possible. Inclusion of these data necessitated some frequency assumptions for some Mexican and Cuban rookeries where these data were not available (Supplementary Table 2). Given that CM-A1 comprises a small proportion of QRMX and SWCB haplotypes, these assumptions were not expected to strongly impact estimates. MSA tests considering the possible extremes for haplotype frequencies produced qualitatively similar results (data not shown), so intermediate haplotype frequencies were used in MSA to minimize bias. A total of 300,000 Markov Chain Monte Carlo steps were run for eleven chains, with the first 50% of each run discarded as de-memorization (burn-in) steps, to ensure convergence as indicated by Gelman-Rubin shrink factors of less than 1.2 (Pella and Masuda, 2001). Stock contributions were estimated using uniform priors and relative population size-weighting priors (Supplementary Table 4). Estimated nesting female abundance was used to scale relative rookery sizes (Seminoff et al., 2015).
3. Results
3.1. Haplotypes and genetic structure
Novel LA and SRI samples yielded 16 CR haplotypes, all of which have been described from Gulf of Mexico and Caribbean nesting populations (Supplementary Tables 1 and 2, Hart et al., 2022). Several SJB haplotypes that were of unknown origin at the time of the original analysis have since been documented in Mexican nesting populations: QRMX (CM-A22, CM-A26, CM-A28), SRMX (CM-A27), and CAMX (CM-A47) (Pérez-Ríos, 2008; Millán-Aguilar, 2009) as well as Cuban nesting populations (CM-A27, CMA28) (Ruiz-Urquiola et al., 2010).
Sequencing outside the traditional 490-bp CR fragment provided informative variation for CM-A18, CM-A5, and CM-A1 (Supplementary Table 2). CM-A18.1, the conserved variant known only from Gulf of Mexico nesting beaches (Millán-Aguilar, 2009) was present in all juvenile aggregations. CM-A18.2, the common QRMX variant (Pérez-Ríos, 2008; Millán-Aguilar, 2009) was present in only one juvenile west of SJB but was more common among the remaining Florida Gulf coast aggregations. Individuals carrying CM-A5.1 were rare overall; nearly all represented the geographically widespread, conserved variant (CM-A5.1.1), with the TORT variant (CM-A5.1.2) absent and the insular Caribbean variant (CM-A5.1.3) present in a single SJB individual. The vast majority of CM-A1.1 individuals from all Gulf of Mexico foraging aggregations (96%) carried CM-A1.1.1, the conserved mitogenomic haplotype described from the rookery in Rancho Nuevo, Tamaulipas, Mexico and absent in Atlantic Florida nesting populations (Shamblin et al., 2017).
Genetic structuring was evident among the Gulf of Mexico foraging aggregations (FST = 0.054, p < 0.0001). All pairwise FST comparisons involving western (TX, LA, SP, SRI) versus eastern (SJB, BB, SWFL) aggregations were significantly different (Table 2). These groups represented the strongest genetic structure across the region (FCT = 0.081, p = 0.033). However, SRI haplotype frequencies were intermediate and not significantly different from any others with respect to exact tests (Table 2). Haplotype frequencies from the SP aggregation were weakly differentiated from TX and LA but strongly differentiated from Florida aggregations except SRI (Table 2). A shift in the relative frequencies of the two most common haplotypes (CM-A1.1.1 and CM-A3.1) between the western and eastern aggregations was the primary driver of differentiation (Figure 2). The SRI versus SJB comparison represented the strongest shift in haplotype frequencies between adjacent sample sites, despite being the shortest sea distance of any comparison (Figure 2). Combined haplotype frequencies (CR, mitogenomic SNPs, and mtSTR) for SWFL juveniles were strongly differentiated from those of the adjacent DTFL nesting population (FST = 0.191, p < 0.0001, exact test p <0.0001). An initial Mantel test suggested significant isolation by distance (r2 = 0.177, p = 0.01). However, hierarchical Mantel tests that separately considered sites in western (TX, LA, SP, SRI) and eastern (SJB, BB, SWFL) genetic clusters failed to detect any signal of isolation by distance (r2 = -0.017, p = 0.582; r2 = 0.07, p = 0.498; respectively).
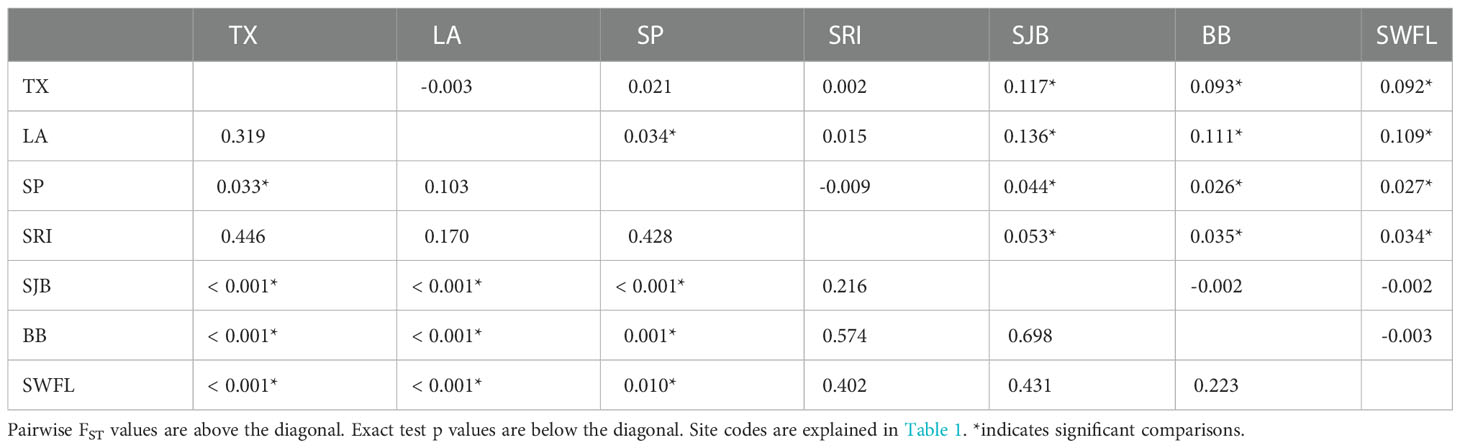
Table 2 Genetic structure among juvenile green turtle foraging aggregations in the Gulf of Mexico.
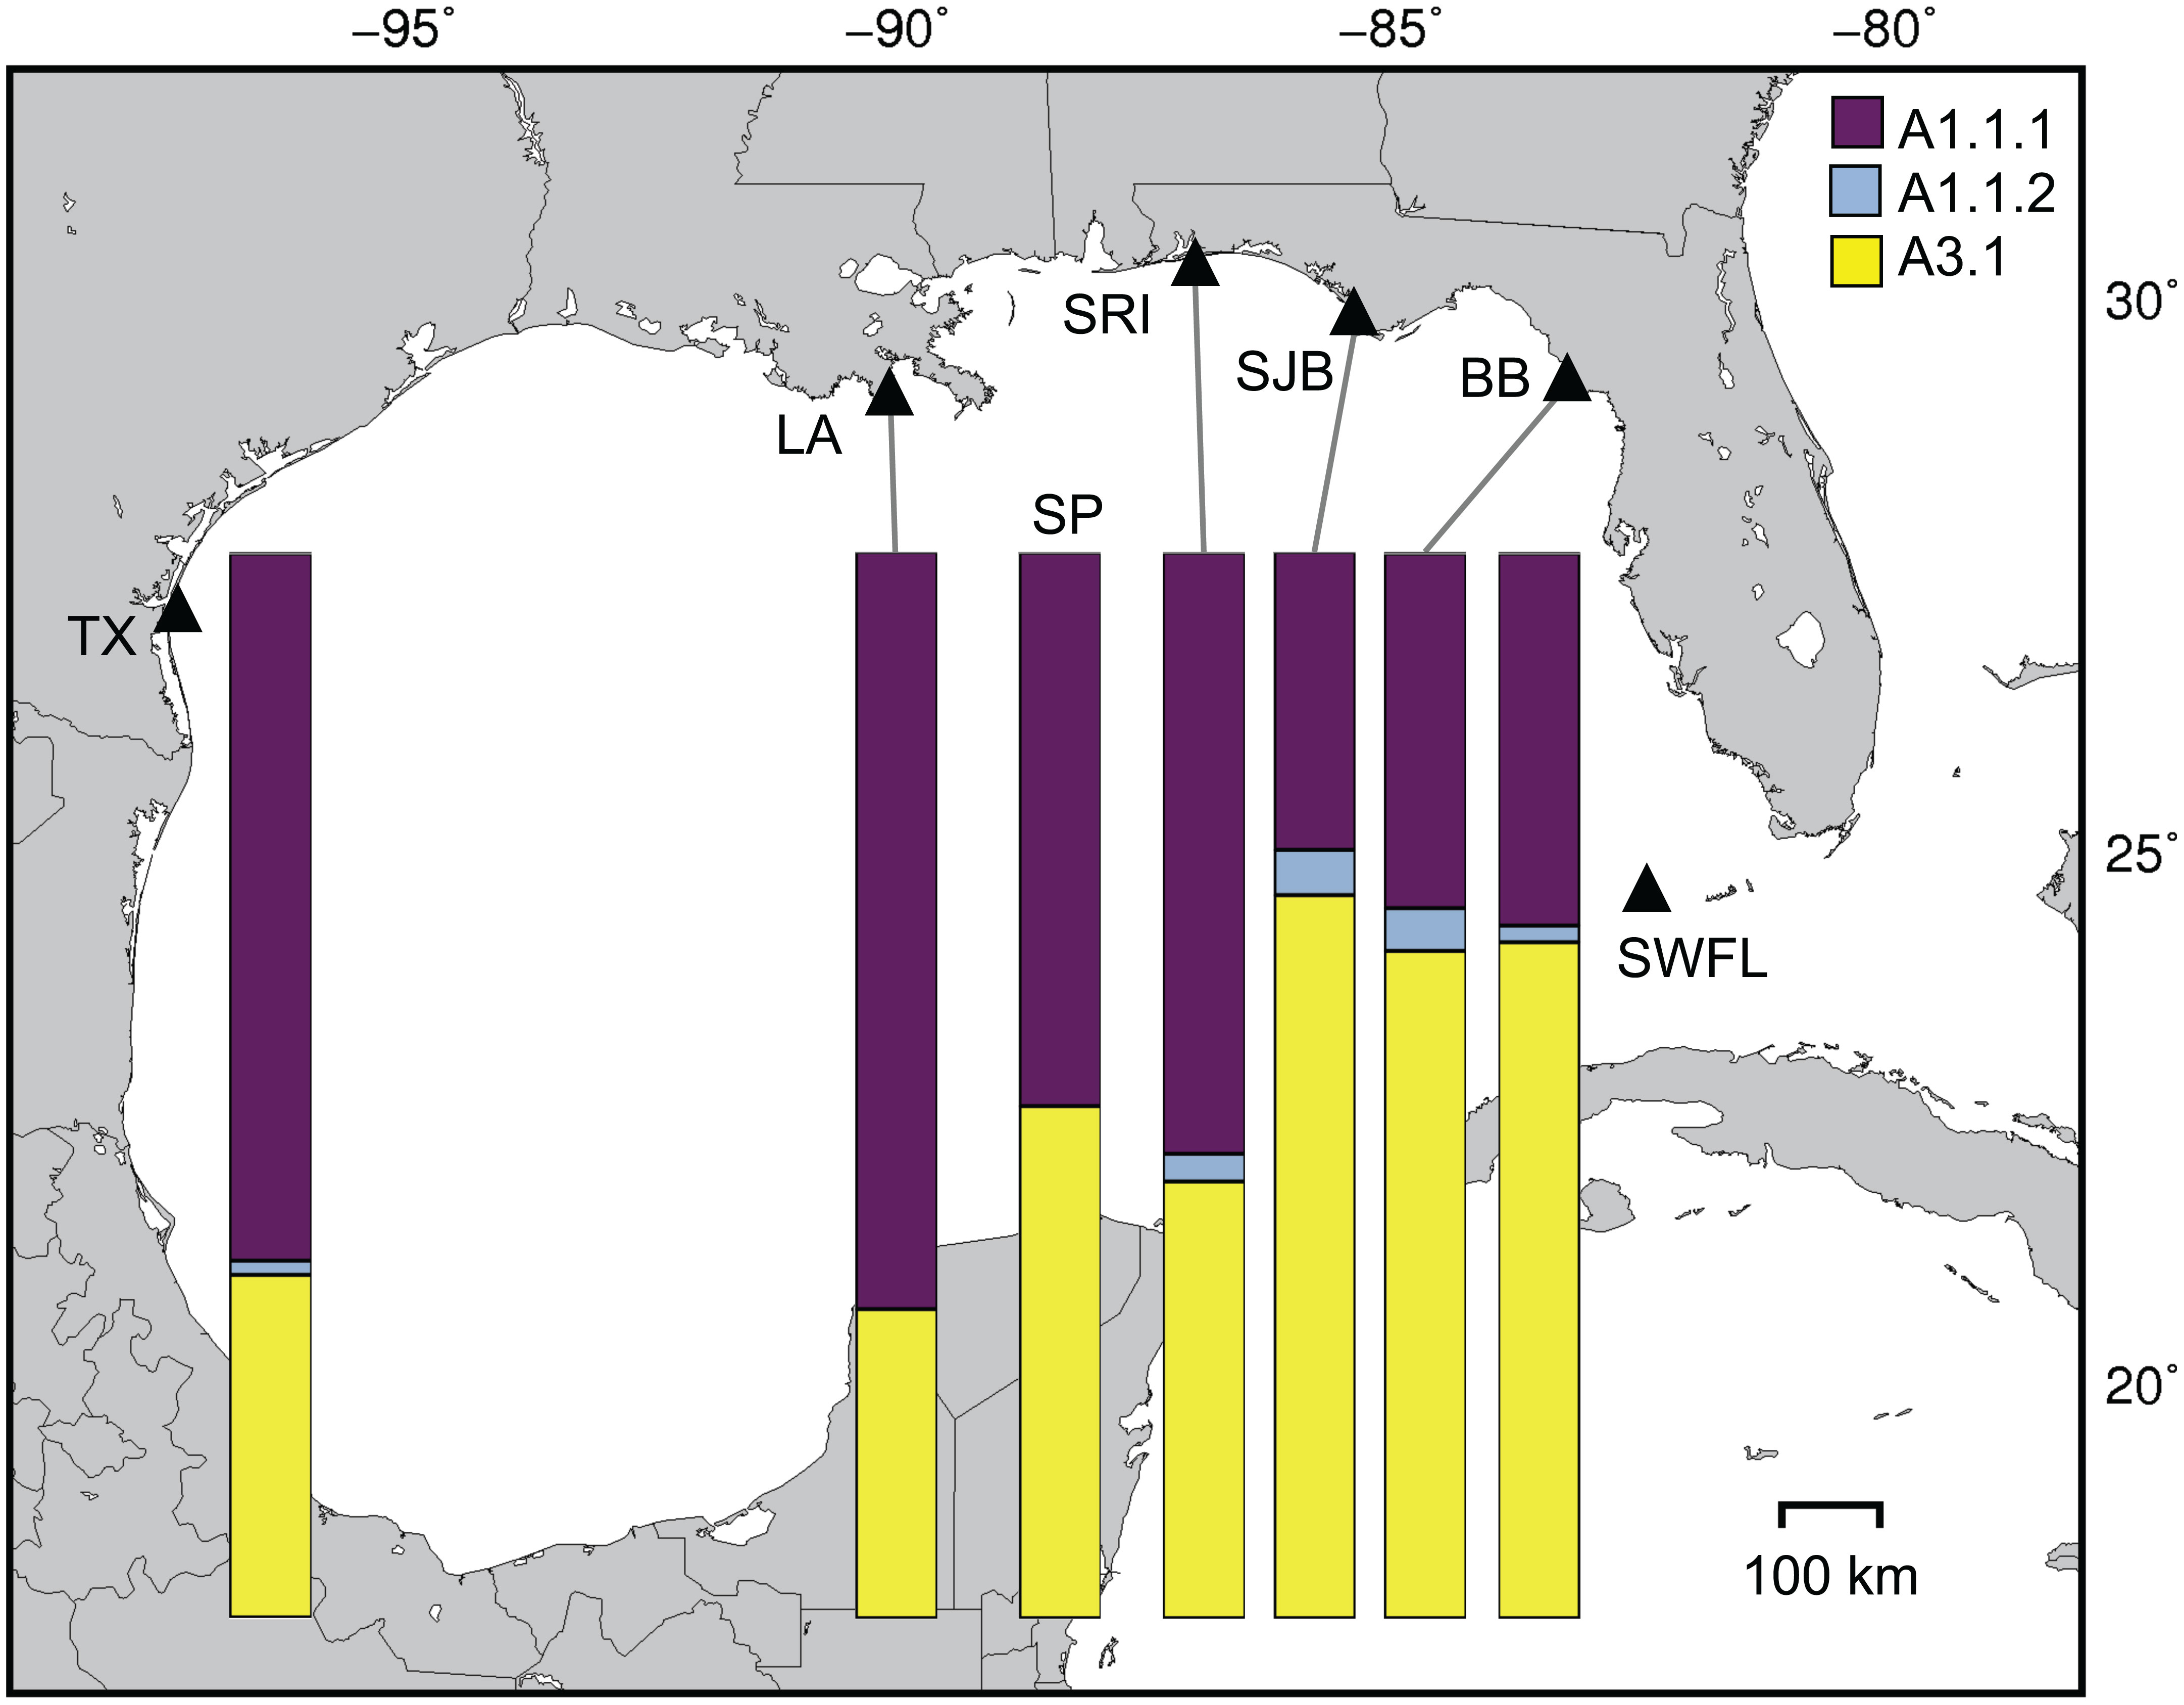
Figure 2 Relative frequencies of the two most common mitochondrial haplotypes, CM-A1.1 and CM-A3.1, in juvenile green turtle foraging aggregations in the northern Gulf of Mexico. CM-A1.1 is subdivided into conserved (Tamaulipas) CM-A1.1.1 and derived (Florida) CM-A1.1.2. Site codes are explained in Figure 1.
3.2. Mixed stock analyses
MSA assuming uniform priors indicated that juvenile green turtles in the Gulf of Mexico were primarily of Mexican origin, but contribution estimates from each Mexican genetic stock were strongly divergent among foraging aggregations (Figure 3, Supplementary Table 5). TX contributions were largely congruent with published estimates indicating large WBCMX inputs (Shamblin et al., 2017), but incorporation of updated Mexican rookery data suggested smaller QRMX contributions (0.20 to 0.08) and measurable inputs (0.07) from SRMX (Table 3). Likewise, the bulk of LA and SRI juveniles were also of WBCMX origin. By contrast, the Florida aggregations further east were more admixed, with smaller contributions from WBCMX and larger contributions from other Mexican stocks. MSA of the SJB aggregation indicated primary contributions from QRMX and moderate inputs from WBCMX, EBCMX, and SRMX (Table 3). MSA results for the SWFL juvenile aggregation suggested primary SRMX contributions, moderate contributions from QRMX and WBCMX, and smaller contributions from SWCB and TORT (Table 3).
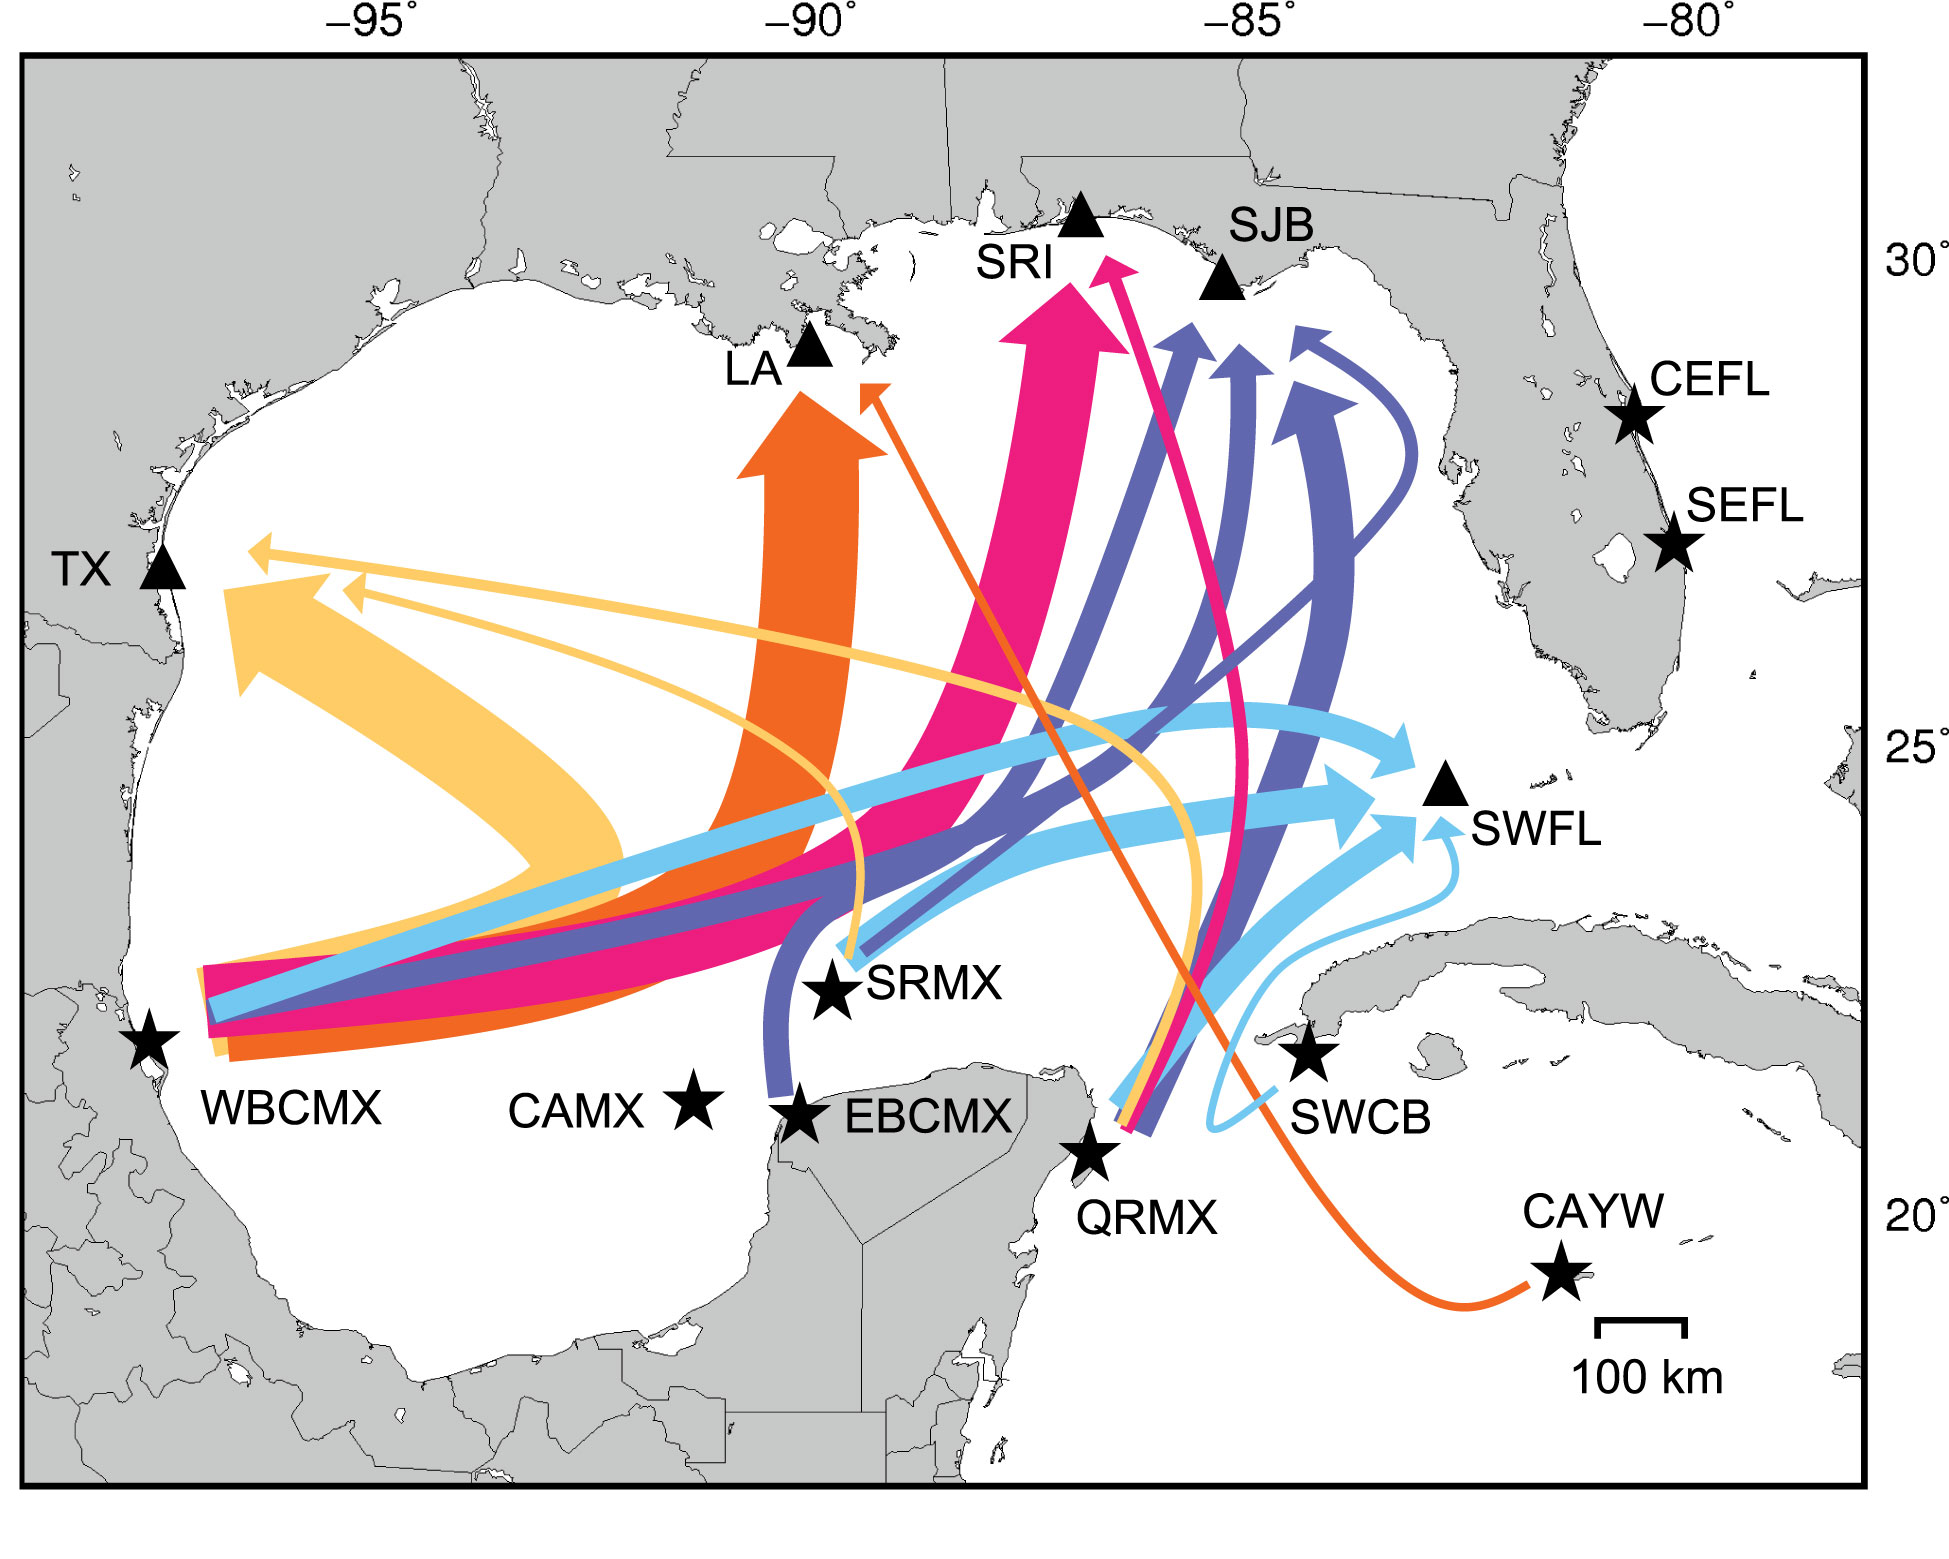
Figure 3 Median estimated rookery contributions to five Gulf of Mexico neritic juvenile foraging aggregations based on Bayesian many-to-one (foraging-centric) mixed stock analyses assuming uniform priors. Line thickness indicates the relative magnitude of inferred connectivity between nesting populations and juvenile nursery habitats. Estimated contributions < 0.05 were excluded for legibility. DTFL was included in mixed stock analyses but excluded for legibility. Site codes are explained in Figure 1.
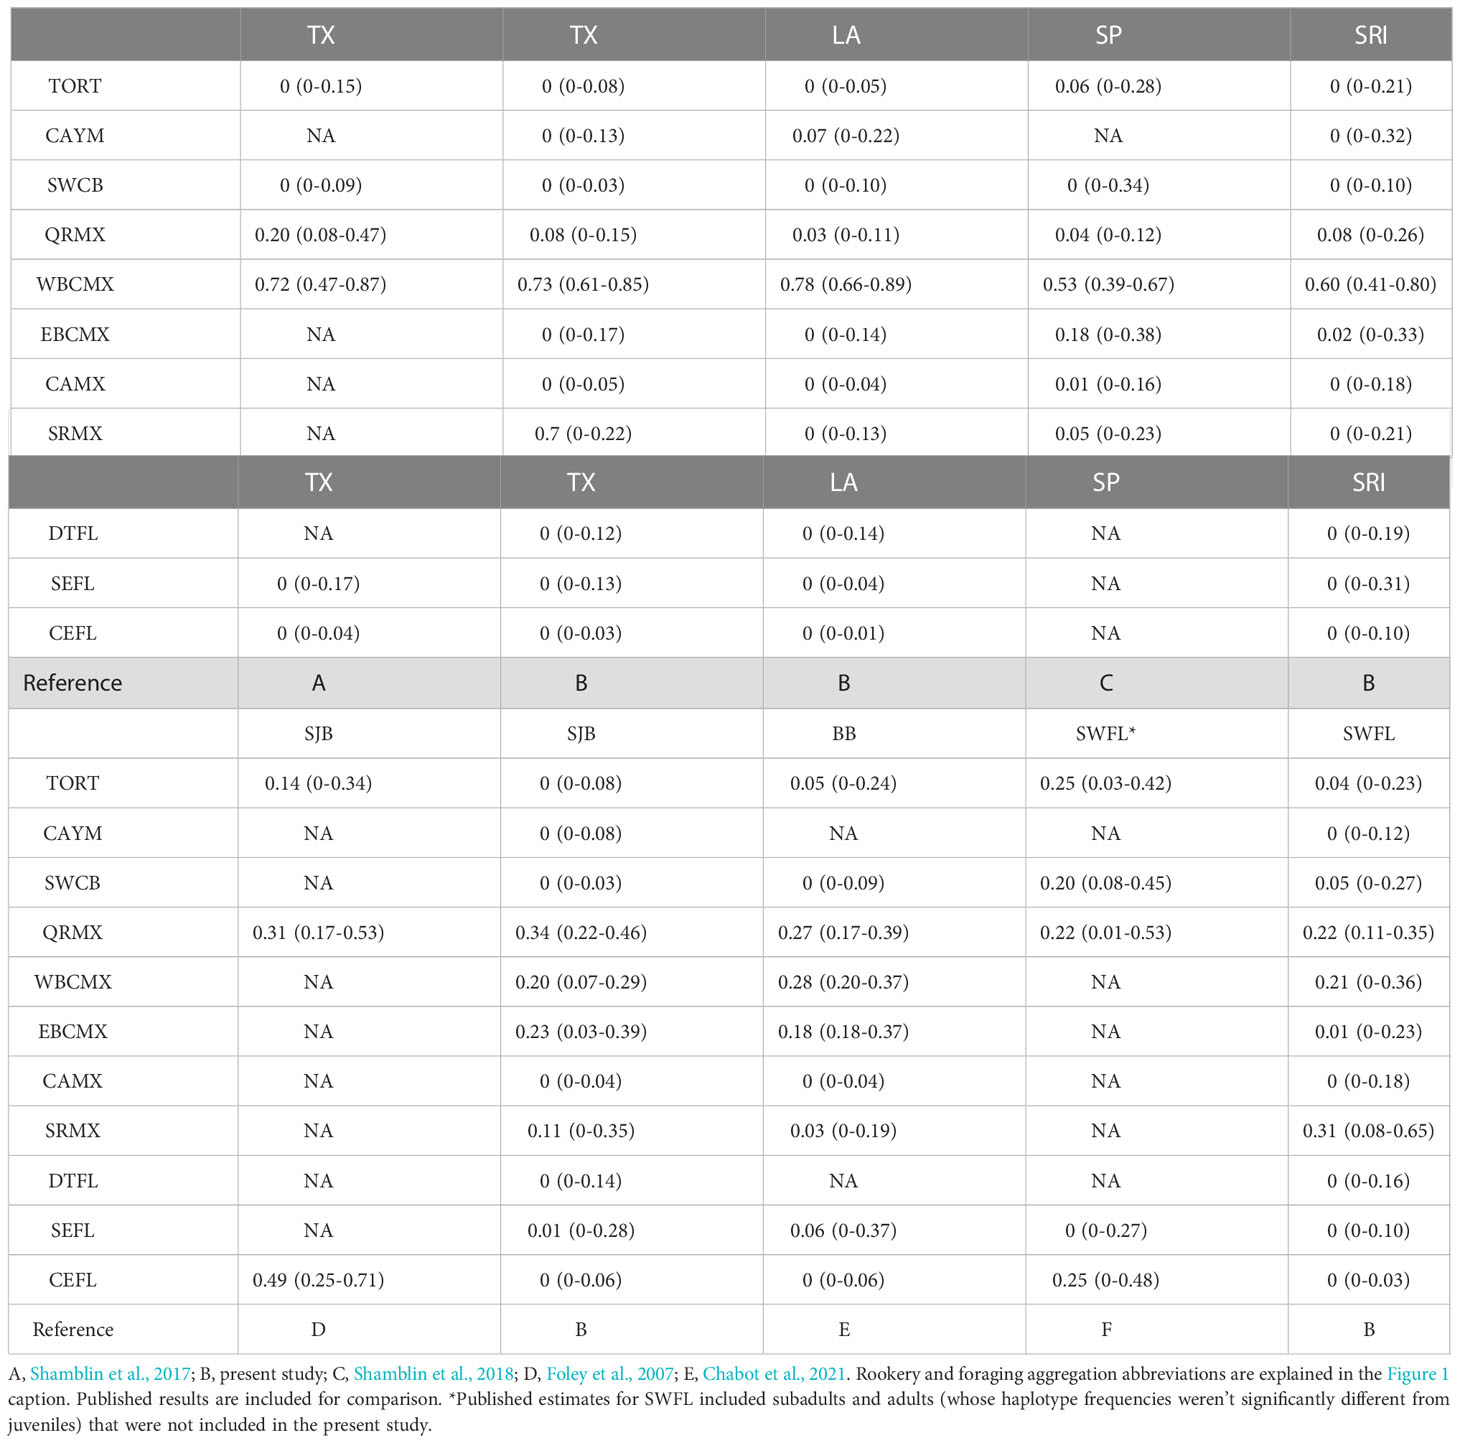
Table 3 Median contribution estimates to Gulf of Mexico green turtle foraging aggregations from Bayesian many-to-one mixed stock analysis assuming uniform priors.
Contribution point estimates from CEFL, SEFL, and DTFL were ≤ 0.01 across all foraging aggregations in the present study. This pattern held true even for the juveniles foraging in the vicinity of the DTFL nesting beaches, consistent with the significant haplotype frequency differentiation between DTFL nesting females and the SWFL foraging juveniles.
Despite variation in population sizes spanning several orders of magnitude, MSA results from uniform priors and weighted prior runs were largely concordant (Supplementary Table 5). The most notable difference with weighted priors was larger contribution estimates from TORT, the largest green turtle rookery in the Atlantic basin. This was particularly apparent for SRI, where TORT point estimates were nil in uniform prior runs but approximately 0.20 with weighted priors. The modest CAYW contribution to LA inferred with uniform priors (0.07) was not supported in the weighted prior run (Supplementary Table 5). This estimate likely was attributable to the presence of CM-A34.1 in the LA aggregation, which has only been documented in the CAYW nesting population to date (Barbanti et al., 2019).
4. Discussion
4.1. Contribution estimates from mixed stock analyses
Western and eastern Gulf of Mexico foraging aggregations were strongly structured, with an apparent transition occurring between SRI and SJB in northwestern Florida. MSA results indicated that this differentiation was driven by more admixture in the eastern foraging aggregations, with larger inputs from Campeche Bank and Caribbean Sea rookeries. Despite approximately 750 km and a temporal gap of more than a decade separating TX and LA samples, contribution estimates to LA were congruent with those from TX in indicating primary WBCMX contributions and minor inputs from elsewhere. Reanalysis of the SJB aggregation with updated baseline data yielded markedly different results from the original analysis. The estimated Atlantic Florida (CEFL) contribution in the original analysis (Foley et al., 2007) was replaced by three Bay of Campeche and Campeche Bank nesting populations (WBCMX, EBCMX, SRMX) in this study. Relative contributions of the major Mexican nesting populations to SJB were congruent with published MSA contributions to BB (Chabot et al., 2021), ~300 km distant, despite more than a decade between sampling periods at these sites. This region of northwestern Florida harbored the largest proportion of EBCMX juveniles (0.23 and 0.18, respectively, in uniform priors MSA) estimated for any Gulf of Mexico aggregation.
Despite the lack of haplotype frequency differentiation between SJB and SWFL, the MSA results suggested divergent Mexican origins, with minor EBCMX inputs and larger SRMX inputs in the latter aggregation. These MSA estimates highlight the importance of not assuming panmixia in the absence of significant frequency differentiation of proximal foraging aggregations. Many haplotypes are shared at high frequencies across Greater Caribbean nesting populations, including those along Mexico’s Gulf of Mexico coast. The haplotype profile for SRMX contains the common haplotypes CM-A1.1, CM-A3.1, and CM-A5.1, which are shared with other nesting populations in the region. It’s the presence of CM-A27 that sets this nesting population apart from others in the Gulf of Mexico (Millán-Aguilar, 2009), such that even small changes in frequency of CM-A27 in a foraging aggregation can equate to large differences in estimated contributions from this nesting population. The large SRMX contribution to the SWFL aggregation suggested by MSA was surprising given the relatively small size of this nesting population. Nonetheless, connectivity between these sites has been recorded for two nesting females. Méndez et al. (2013) tracked a female from the SRMX nesting beach to a foraging home range in the Florida Keys between the Dry Tortugas and the Marquesas Keys. Conversely, a female fitted with a satellite transmitter during a non-nesting emergence (“false crawl”) on Loggerhead Key, Dry Tortugas departed the area and subsequently nested at SRMX (KMH, unpublished data.)
Initial MSAs based on the best available baseline data suggested large Atlantic Florida (CEFL and SEFL) contributions to Florida Gulf of Mexico foraging aggregations (SJB: 0.49, Foley et al., 2007; SWFL: 0.25, Naro-Maciel et al., 2017). However, incorporation of updated baseline rookery data from Mexico and application of an informative mtSNP has indicated that juveniles of Florida origin are likely rare or absent among the Gulf of Mexico foraging aggregations. The small number of CM-A1.1.2 juveniles identified may represent contributions from QRMX, SWCB, and/or CAYW populations where CM-A1 occurs at low frequencies, and where mitogenomic data on these lineages are unavailable. Likewise, large SWCB contributions to SWFL estimated by the initial MSA (0.20) were not corroborated in the present study (0.05) given SRMX as an alternate source of CM-A27 individuals. Previous ocean transport modeling did not support the presence of Florida juveniles in the SWFL foraging aggregation. The discordance between genetic and ocean transport connectivity estimates was attributed to behavioral factors, invoking active swimming by juveniles to attain coastal counter currents to reach SWFL (Naro-Maciel et al., 2017). Given results from the current study, the more parsimonious explanation is that the genetic estimates from the initial MSA were in error due to missing baseline data and poor marker resolution.
4.2. Patterns of structure and connectivity
Previous genetic analyses of western Atlantic juvenile foraging aggregations have rejected simplistic explanations for observed patterns such as: equal contributions from potential source populations, random contributions proportional to rookery size, and contributions based on proximity to potential source populations (Luke et al., 2004; Naro-Maciel et al., 2007). Our study is congruent in indicating that relative rookery sizes appear to have a minor impact on estimated contributions. TORT had negligible estimated contributions across the Gulf of Mexico in the uniform priors MSAs (≤ 0.05) despite the fact that this population is an order of magnitude larger than QRMX, and two orders of magnitude larger than any Gulf of Mexico nesting population (Seminoff et al., 2015). Conversely, measurable SRMX contribution point estimates were obtained for five Gulf of Mexico foraging aggregations (Shamblin et al., 2018; Chabot et al., 2021; present study) despite the fact that this nesting population is an order of magnitude smaller than WBCMX and EBCMX and two orders of magnitude smaller than QRMX (Supplementary Table 4).
Sparse sampling of neritic juvenile foraging aggregations in many regions has limited inferences about drivers of genetic structuring among them. The strongest shift in haplotype frequencies in this study occurred between the two closest juvenile aggregations sampled, SRI and SJB, separated by only 150 km. Yet, MSA results indicated that TX and LA aggregations separated by approximately 750 km were comprised of similar contributions. The patterns of structure detected in the present study are concordant with juvenile green turtle genetic analyses in other locations. Along the Pacific coast of Australia, juvenile foraging aggregations in the northern and southern Great Barrier Reef were each dominated by their respective local nesting populations (Jensen et al., 2016). Differentiation within regions was weak or absent across as much as 1,000 km of coastline, but stock contributions to the two regions, separated by as little as 600 km, were strongly divergent. Jensen et al. (2016) hypothesized that current dynamics drive this pattern, as the North Caledonia Jet splits into the northward flowing North Queensland Current and southward flowing East Australian Current as it approaches the Great Barrier Reef shelf. Similarly, foraging aggregations in the Southwest Indian Ocean (SWIO) were primarily composed of two genetic stocks in the region (Jensen et al., 2020). The local population dominated contributions to foraging aggregations surrounding islands in the southern Mozambique Channel. Aggregations elsewhere were primarily comprised of the central genetic stock, despite up to 2,600 km of separation between foraging sites. Genetic estimates were strongly correlated with estimates from passive drift simulations, implicating the importance of regional current dynamics in driving self-recruitment in the central and southern SWIO (Jensen et al., 2020). Our study is consistent with these Pacific and Indian Ocean analyses in demonstrating that differentiation is often not simply a function of geographic distance.
4.3. Oceanic transport and connectivity estimates
Surface currents in the Gulf of Mexico are dominated by the dynamics of the Loop Current. The LC represents the western boundary current in the Gulf of Mexico, flowing from the Yucatán Channel to the Straits of Florida (Figure 1). The position of the Loop Current is variable, spanning 24°N to 28°N in the eastern Gulf of Mexico. In its extended state, the Loop Current typically sheds large eddies (200 – 400 km in diameter) that may progress through multiple detachments and reattachments before ultimately separating and propagating to the west (Hamilton et al., 2011). These dynamics could provide an avenue for dispersal into the western Gulf of Mexico for oceanic juveniles representing the large TORT and QRMX populations in the Caribbean Sea. Indeed, hatchling production estimates and ocean circulation modeling assuming passive drift supported such a scenario, predicting substantial TORT contributions to Texas and the West Florida Shelf an order of magnitude larger than those from specific Mexican nesting populations (Putman et al., 2020). Such large TORT contributions to neritic foraging aggregations in coastal Texas and along the West Florida Shelf were not corroborated by MSA. Even when accounting for relative rookery sizes, estimated TORT contributions to the TX sample were only 0.07 (0-0.20). Likewise, weighted prior TORT point estimates to West Florida Shelf foraging aggregations were modest given its size, ranging from 0.06 to 0.19. In all cases, these estimates were either equivalent to, or smaller than, contributions from individual Mexican genetic stocks that are at least an order of magnitude smaller than TORT (Chabot et al., 2021, present study).
Ocean transport models predicted contributions of similar magnitude from Mexican nesting populations in Campeche, Yucatán, and Quintana Roo to each of the three coastal regions spanning the northern Gulf of Mexico coast of the United States (Putman et al., 2020). MSA estimates were not consistent with this pattern, but rather implicated stronger connectivity between Caribbean Sea/Campeche Bank nesting populations and West Florida shelf developmental sites and weaker connectivity between these rookeries and developmental habitats in Texas and the central northern Gulf of Mexico. Green turtle rookeries from Tamaulipas and Veracruz (WBCMX) were not included in the hatchling production and transport models, but ocean transport predictions for the Tamaulipas Kemp’s ridley turtle (Lepidochelys kempii) nesting population provided some insights, albeit from a rookery-centric perspective. Analyses suggested substantial inputs to Texas and reduced but similar contributions to the north central Gulf of Mexico and the West Florida Shelf (Putman et al., 2020). MSA estimates from the present study, representing the foraging-centric perspective, were consistent with larger WBCMX inputs to TX and smaller inputs to the West Florida Shelf sites, but did not indicate any reduced connectivity to the north central Gulf of Mexico coast.
Oriented swimming behavior has previously been invoked as a potential explanation for these discrepancies between connectivity estimates generated from ocean transport modeling and MSA (Naro-Maciel et al., 2017). MSA results from the present study suggest that a large proportion of TORT oceanic juveniles may remain within the Caribbean Sea throughout their oceanic stage, potentially within the Colombia-Panama Gyre (Figure 1). Alternatively, the lack of large TORT contributions to Gulf of Mexico juvenile aggregations may reflect oriented swimming behavior that would allow these oceanic juveniles to remain entrained within the Loop Current such that they pass through the Straits of Florida into the North Atlantic. Likewise, QRMX contribution estimates from MSA were smaller than expected based on relative rookery sizes, raising the question of transport into the North Atlantic for a large proportion of QRMX oceanic juveniles. Satellite telemetry data have indicated that directed swimming behavior was sufficient to impact the trajectory of small oceanic juveniles relative to drifter tracks and ocean transport model predictions (Putman and Mansfield, 2015). However, these data also demonstrate individual variation and the potential for location-dependent oriented swimming behavior (Putman and Mansfield, 2015; Mansfield et al., 2021), making it challenging to incorporate behavior into dispersal models.
4.4. Caveats in MSA interpretation
Incorporation of updated rookery baselines and novel genetic markers has ruled out major Atlantic Florida contributions, while simultaneously indicating substantial Mexican contributions, to juvenile foraging aggregations across the northern Gulf of Mexico. Nonetheless, the MSA contribution estimates from specific populations should be interpreted with caution. Several potential source populations in the Gulf of Mexico and Greater Caribbean region remain genetically uncharacterized or under-represented. MSA are sensitive to the frequencies of rare haplotypes (Bolker et al., 2003), which could lead to overestimation of contributions from small nesting populations where they are present (eg. CAYM contributions to LA, and potentially SRMX contributions to SWFL).
Poor marker resolution remains a substantial impediment, particularly given the ubiquity of haplotype CM-A3 in the Greater Caribbean region. Baseline data for informative mtSNPs and the mtSTR array from Mexican and Cuban nesting populations are critical for refining population boundaries and improving resolution of MSA for Gulf of Mexico foraging aggregations. Although extensive sharing of CM-A3 mtSTR haplotypes among Atlantic Florida and Cayman Islands nesting populations suggests that additional sharing among Greater Caribbean populations is likely (Barbanti et al., 2019; Shamblin et al., 2020), significant frequency differentiation among these also offers hope of improved resolution in future MSA. Previous mitogenomic sequencing of common control region haplotypes CM-A1 and CM-A5 detected sparse but strongly informative polymorphism outside the control region (Shamblin et al., 2012; Shamblin et al., 2017). Continued mitogenomic screening of individuals carrying haplotypes shared across nesting populations, particularly CM-A3, is justified.
Finally, this study did not address the possibility of temporal variation in recruitment patterns from different populations within sites. Temporal variation could be driven by seasonal and annual variation in Loop Current dynamics (Hamilton et al., 2011) or differential recovery rates across genetic stocks. The latter was invoked to explain temporal variation in stock composition estimates in the southern Caribbean Sea (van der Zee et al., 2019). In the present study, sample size constraints limited the power to detect temporal variation, so all sites were represented by samples pooled across consecutive sampling years. Furthermore, temporal sampling spanning nearly two decades across all sites potentially confounded geographic and temporal variation present. Nonetheless, lack of haplotype frequency differentiation and similar MSA contribution estimates for TX-LA and SJB-BB samples collected more than a decade apart, respectively, suggest that the observed west versus east pattern of genetic structuring across the northern Gulf of Mexico is driven by geographic, rather than temporal, factors. Testing for temporal genetic structure and changes in relative contributions at sites represented by time series data where historical samples are available (eg. TX and SJB) are warranted in future studies. Continued and intensified sampling, particularly around the apparent transition zone in northwestern Florida, may provide additional insight into drivers of the observed genetic differentiation.
4.5. Management implications
The apparent lack of significant contributions from the Atlantic Florida nesting populations to Gulf of Mexico juvenile green turtle foraging aggregations highlights the need for additional research to identify important nursery habitats for juveniles of Atlantic Florida origin. Previous studies suggested that the Atlantic coast of the United States from Florida to North Carolina may serve as important developmental habitat for these Atlantic Florida juveniles (Bass and Witzell, 2000; Bass et al., 2006). However, these studies were conducted prior to availability of Mexican Gulf of Mexico baseline data and with 490-base pair control region sequences that have poor resolving power. MSA of United States Atlantic coast, Bermuda, and northeastern Caribbean Sea foraging aggregations incorporating the updated Mexican baselines and novel genetic data are vital for assessing possible Atlantic Florida contributions.
MSA results from across the northern Gulf of Mexico indicated small Caribbean Sea contributions given the size of the large TORT and QRMX nesting populations relative to those in the Mexican Gulf of Mexico. This implies there may be substantial retention of juveniles from these smaller rookeries within the Gulf of Mexico throughout their life cycle, which potentially could make them more vulnerable to threats like oil spills (McDonald et al., 2017). Genetic characterization of foraging aggregations elsewhere throughout the northern Greater Caribbean region is needed to determine the full extent of dispersal of juveniles originating from nesting populations within the Gulf of Mexico. Nonetheless, this study demonstrates the importance of the northern Gulf of Mexico coast as developmental habitat for juveniles representing the Mexican Gulf of Mexico rookeries. The strong connectivity within the Gulf of Mexico highlights the need for international cooperation and coordination for monitoring and management for continued recovery of and improved inferences of population dynamics for this species in the region.
Data availability statement
Summary haplotype data for all individuals are included in the Supplementary Table 2. Metadata for the SRI and SWFL haplotype dataset for this study can be found in the U.S. Geological Survey Data Release (Hart et al., 2022; https://doi.org/10.5066/P9H65DWH).
Ethics statement
The animal study was reviewed and approved by USGS Institutional Animal Care Protocol USGS-SESC-IACUC-2011-05.
Author contributions
KH, ML, and DS conducted field work and provided samples. PD and EL curated and provided DNA aliquots for archived samples. BS produced sequence data and conducted genetic analyses. All authors contributed to study design and manuscript writing.
Funding
Re-analysis of SJB samples was funded, in part, by grant 12-009R awarded from the Sea Turtle Grants Program grant 12-009R to CJN. The Sea Turtle Grants Program is funded from proceeds from the sale of the Florida Sea Turtle License Plate. Learn more at http://www.helpingseaturtles.org. Analysis was partially funded by the U.S. Geological Survey Priority Ecosystem Science Program, Bureau of Ocean Energy Management Gulf of Mexico Marine Assessment Program for Protected Species, and the U.S. Fish and Wildlife Service to KH and ML.
Acknowledgments
We thank the many technicians, students, and volunteers representing the authors’ institutions that contributed to field work, DNA extractions, and DNA laboratory analyses. We thank the Sea Turtle Salvage and Stranding Network for providing Texas samples. We gratefully acknowledge the Florida Fish and Wildlife Conservation Commission as well as staff and volunteers representing several federal agencies and conservation groups for collection of the Saint Joseph Bay samples. Any use of trade, product, or firm names is for descriptive purposes only and does not imply endorsement by the U.S. Government. We thank Ronel Nel and Nicole Esteban for reviews that enhanced the quality of this manuscript.
Conflict of interest
The authors declare that the research was conducted in the absence of any commercial or financial relationships that could be construed as a potential conflict of interest.
Publisher’s note
All claims expressed in this article are solely those of the authors and do not necessarily represent those of their affiliated organizations, or those of the publisher, the editors and the reviewers. Any product that may be evaluated in this article, or claim that may be made by its manufacturer, is not guaranteed or endorsed by the publisher.
Supplementary material
The Supplementary Material for this article can be found online at: https://www.frontiersin.org/articles/10.3389/fmars.2022.1035834/full#supplementary-material
References
Abreu-Grobois F. A., Horrocks J. A., Formia A., Dutton P. H., LeRoux R. A., Velez-Zuazo X., et al. (2006). “New mtDNA d-loop primers which work for a variety of marine turtle species may increase the resolution of mixed stock analysis,” in Poster presented at the 26th annual symposium on Sea turtle biology(Crete, Greece). Available at: http://www.iucn-mtsg.org/genetics/meth/primers/abreau_grobois_etal_new_dloop_primers.pdf.
Anderson J. D., Shaver D. J., Karel W. J. (2013). Genetic diversity and natal origins of green turtles (Chelonia mydas) in the western gulf of Mexico. J. Herpetol. 47, 251–257. doi: 10.1670/12-031
Barbanti A., Martin C., Blumenthal J. M., Boyle J., Broderick A. C., Collyer L., et al. (2019). How many came home? evaluating ex situ conservation of green turtles in the Cayman islands. Mol. Ecol. 28, 1637–1651. doi: 10.1111/mec.15017
Bass A. L., Epperly S. P., Braun McNeill J. (2006). Green turtle (Chelonia mydas) foraging and nesting aggregations in the Caribbean and Atlantic: Impacts of currents and behavior on dispersal. J. Hered. 97, 346–354. doi: 10.1093/jhered/esl004
Bass A. L., Witzell W. N. (2000). Demographic composition of immature green turtles (Chelonia mydas) from the East central Florida coast: Evidence from mtDNA markers. Herpetologica 56, 357–367.
Bolker B., Okayama T., Bjorndal K. A., Bolten A. B. (2003). Sea Turtle stock estimation using genetic markers: Accounting for sampling error of rare genotypes. Ecol. Appl. 13, 763–775. doi: 10.1890/1051-0761(2003)013[0763:STSEUG]2.0.CO;2
Chabot R., Welsh R., Mott C., Guertin J., Shamblin B., Witherington B. (2021). A sea turtle population assessment for florida’s big bend, northeastern gulf of Mexico. Gulf Caribb. Res. 32, 19–33. doi: 10.18785/gcr.3201.05
Dunn D. C., Harrison A.-L., Curtice C., Appeltans W., Bailey H., Ballance L., et al. (2019). The importance of migratory connectivity to global ocean policy. Proc. R. Soc B 286. doi: 10.1098/rspb.2019.1472
Excoffier L., Lischer H. E. L. (2010). Arlequin suite ver 3.5: A new series of programs to perform population genetics analyses under Linux and windows. Mol. Ecol. Resour. 10, 564–567. doi: 10.1111/j.1755-0998.2010.02847.x
Foley A. M., Singel K., Dutton P. H., Summers T. M., Redlow A. E., Lessman J. (2007). Characteristics of a green turtle (Chelonia mydas) assemblage in northwestern Florida determined during a hypothermic stunning event. Gulf Mex. Sci. 2007, 131–143. doi: 10.18785/goms.2502.04
Godley B. J., Barbosa C., Bruford M. W. W., Broderick A. C., Catry P., Coyne M. S., et al. (2010). Unravelling migratory connectivity in marine turtles using multiple methods. J. Appl. Ecol. 47, 769–778. doi: 10.1111/j.1365-2664.2010.01817.x/full
Hamilton P., Donohue K. A., Leben R. R., Lugo-Fernández A., Green R. E. (2011). ““Loop current observations during spring and summer of 2010: Description and historical perspective,”,” in In monitoring and modeling the deepwater horizon oil spill: A record-breaking enterprise Geophysical Monograph Series 195. American Geophysical Union. Washington, D.C. , 117–130. doi: 10.1029/2011GM001116
Hart K. M., Iverson A. R., Benscoter A. M., Fujisaki I., Cherkiss M. S., Pollock C., et al. (2017). Resident areas and migrations of female green turtles nesting at buck island reef national monument, st. Croix, US virgin islands. Endang. Speces Res. 32, 89–101. doi: 10.3354/esr00793
Hart K. M., Lamont M. M., Shamblin B. M. (2022). Green turtle genetics in the Gulf of Mexico 2016-2019. U. S. Geological Survey Data release. doi: 10.5066/P9H65DWH
Hart K. M., Zawada D. G., Fujisaki I., Lidz B. H. (2013). Habitat use of breeding green turtles Chelonia mydas tagged in dry tortugas national park: Making use of local and regional MPAs. Biol. Conserv. 161, 142–154. doi: 10.1016/j.biocon.2013.03.019
Herren R. M., Bagley D. A., Bresette M. J., Holloway-Adkins K. G., Clark D., Witherington B. E. (2018). Sea Turtle abundance and demographic measurements in a marine protected area in the Florida keys, USA. Herpetol. Conserv. Biol. 13, 224–239.
Howell L. N., Reich K. J., Shaver D. J., Landry A. M., Gorga C. C. (2016). Ontogenetic shifts in diet and habitat of juvenile green sea turtles in the northwestern gulf of Mexico. Mar. Ecol. Prog. Ser. 559, 217–229. doi: 10.3354/meps11897
Jensen M. P., Bell I. P., Limpus C. J., Hamann M., Ambar S., Whap T., et al. (2016). Spatial and temporal genetic variation among size classes of green turtles (Chelonia mydas) provides information on oceanic dispersal and population dynamics. Mar. Ecol. Prog. Ser. 543, 241–256. doi: 10.3354/meps11521
Jensen M. P., Dalleau M., Gaspar P., Lalire M., Jean C., Ciccione S., et al. (2020). Seascape genetics and the spatial ecology of juvenile green turtles. Genes 11, 1–24. doi: 10.3390/genes11030278
Jensen M. P., FitzSimmons N. N., Dutton P. H., Michael P. (2013). “Molecular genetics of sea turtles,” in The biology of Sea turtles, vol. 3 . Eds. Wyneken J., Lohmann K. J., Musick J. A. (Boca Raton, FL: CRC Press), 135–154.
Kubis S. A., Chaloupka M. Y., Ehrhart L. M., Bresette M. J. (2009). Growth rates of juvenile green turtles Chelonia mydas from three ecologically distinct foraging habitats along the east central coast of Florida, USA. Mar. Ecol. Prog. Ser. 389, 257–269. doi: 10.3354/meps08206
Lamont M. M., Johnson D. (2021). Variation in species composition, size and fitness of two multi-species sea turtle assemblages using different neritic habitats. Front. Mar. Sci. 7. doi: 10.3389/fmars.2020.608740
Luke K. E., Horrocks J. A., LeRoux R. A., Dutton P. H. (2004). Origins of green turtle (Chelonia mydas) feeding aggregations around Barbados, West indies. Mar. Biol. 144, 799–805. doi: 10.1007/s00227-003-1241-2
Mansfield K. L., Wyneken J., Luo J. (2021). First Atlantic satellite tracks of ‘lost years’ green turtles support the importance of the Sargasso Sea as a sea turtle nursery. Proc. R. Soc B 288, 20210057. doi: 10.1098/rspb.2021.0057
McDonald T. L., Schroeder B. A., Stacy B. A., Wallace B. P., Starcevich L. A., Gorham J., et al. (2017). Density and exposure of surface-pelagic juvenile sea turtles to deepwater horizon oil. Endanger. Species Res. 33, 69–82. doi: 10.3354/esr00771
Meirmans P. G. (2012). The trouble with isolation by distance. Mol. Ecol. 21, 2839–2846. doi: 10.1111/j.1365-294X.2012.05578.x
Méndez D., Navarro J., Cuevas E., González-Garza B. I., Guzmán-Hernández V. (2013). Satellite tracking of green turtle females Chelonia mydas and the evaluation of their home ranges in the north coast of the Yucatán peninsula, Mexico. Rev. Biol. Mar. Oceanogr. 48, 497–509. doi: 10.4067/S0718-19572013000300008
Meylan P. A., Meylan A. B., Gray J. A. (2011). The ecology and migrations of Sea turtles 8. tests of the developmental habitat hypothesis. Bull. Am. Museum Nat. Hist. 357, 77. doi: 10.1206/357.1
Millán-Aguilar O. (2009). Estructura genética poblacional de la tortuga verde, chelonia mydas, en el golfo de méxico determinada por análisis de sequencias del ADN mitocondrial Master's thesis. Universidad Nacional Autónoma de México, Mazatlán, Mexico.
Monzón-Argüello C., Lopez-Jurado L. F., Rico C., Marco A., Lopez P., Hays G. C., et al. (2010). Evidence from genetic and Lagrangian drifter data for transatlantic transport of small juvenile green turtles. J. Biogeogr. 37, 1752–1766. doi: 10.1111/j.1365-2699.2010.02326.x
Mortimer J. A., Carr A. F. (1987). Reproduction and migrations of the ascension island green turtle (Chelonia mydas). Copeia 1987,103–113. doi: 10.2307/1446043
Naro-Maciel E., Becker J. H., Lima E. H. S. M., Marcovaldi M. A., DeSalle R. (2007). Testing dispersal hypotheses in foraging green sea turtles (Chelonia mydas) of Brazil. J. Hered 98, 29–39. doi: 10.1093/jhered/esl050
Naro-Maciel E., Hart K. M., Cruciata R., Putman N. F. (2017). DNA And dispersal models highlight constrained connectivity in a migratory marine megavertebrate. Ecography (Cop.). 40, 586–597. doi: 10.1111/oik.03181
Pella J., Masuda M. (2001). Bayesian Methods for analysis of stock mixtures from genetic characters. Fish. Bull. 99, 151–167.
Pérez-Ríos N. (2008). Estructura genética poblacional de la tortuga verde, chelonia mydas, en el caribe mexicano dterminado por análisis de sequencias del AND mitocondrial Master's thesis. Universidad Nacional Autónoma de México, Mazatlán, Mexico.
Putman N. F., Abreu-Grobois F. A., Putman E. M., Richards P. M., Verley P. (2015). Deepwater horizon oil spill impacts on sea turtles could span the Atlantic. Biol. Lett. 11, 20150596. doi: 10.1098/rsbl.2015.0596
Putman N. F., Mansfield K. L. (2015). Direct evidence of swimming demonstrates active dispersal in the sea turtle “lost years”. Curr. Biol. 25, 1221–1227. doi: 10.1016/j.cub.2015.03.014
Putman N. F., Seney E. E., Verley P., Shaver D. J., López-Castro M. C., Cook M., et al. (2020). Predicted distributions and abundances of the sea turtle ‘lost years’ in the western north Atlantic ocean. Ecography (Cop.). 43, 506–517. doi: 10.1111/ecog.04929
Rees A. F., Alfaro-Shigueto J., Barata P. C. R. C. R., Bjorndal K. A., Bolten A. B. B., Bourjea J., et al. (2016). Are we working towards global research priorities for management and conservation of sea turtles? Endanger. Species Res. 31, 337–382. doi: 10.3354/esr00801
Rousset F. (1997). Genetic differentiation. Genetics 145, 1219–1228. doi: 10.1093/genetics/145.4.1219
Ruiz-Urquiola A., Riverón-Giró F. B. F., Pérez-Bermúdez E., Abreu-Grobois F. A., González-Pumariega M., James-Petric B., et al. (2010). Population genetic structure of greater Caribbean green turtles (Chelonia mydas) based on mitochondrial DNA sequences, with an emphasis on rookeries from southwestern Cuba. Rev. Investig. Mar. 31, 33–52.
Seminoff J. A., Allen C. D., Balazs G. H., Dutton P. H., Eguchi T., Haas H., et al. (2015). “Status review of the green turtle (Chelonia mydas) under the U.S,” in Endangered species act. NOAA technical memorandum, NOAA-NMFS-SWFSC-539 National Marine Fisheries Service, La Jolla, California, 571.
Shamblin B. M., Bagley D. A., Ehrhart L. M., Desjardin N. A., Martin R. E., Hart K. M., et al. (2015). Genetic structure of Florida green turtle rookeries as indicated by mitochondrial DNA control region sequences. Conserv. Genet. 16, 673–685. doi: 10.1007/s10592-014-0692-y
Shamblin B. M., Bjorndal K. A., Bolten A. B., Hillis-Starr Z. M., Lundgren I., Naro-maciel E., et al. (2012). Mitogenomic sequences better resolve stock structure of southern greater Caribbean green turtle rookeries. Mol. Ecol. 21, 2330–2340. doi: 10.1111/j.1365-294X.2012.05530.x
Shamblin B. M., Dutton P. H., Shaver D. J., Bagley D. A., Putman N. F., Mansfield K. L., et al. (2017). Mexican Origins for the Texas green turtle foraging aggregation: A cautionary tale of incomplete baselines and poor marker resolution. J. Exp. Mar. Bio. Ecol. 488, 111–120. doi: 10.1016/j.jembe.2016.11.009
Shamblin B. M., Hart K. M., Martin K., Ceriani S. A., Bagley D., Mansfield K. L., et al. (2020). Green turtle mitochondrial microsatellites indicate finer-scale natal homing to isolated islands than to continental nesting sites. Mar. Ecol. Prog. Ser. 643, 159–171. doi: 10.3354/meps13348
Shamblin B. M., Witherington B. E., Hirama S., Hardy R. F., Nairn C. J. (2018). Mixed stock analyses indicate population-scale connectivity effects of active dispersal by surface-pelagic green turtles. Mar. Ecol. Prog. Ser. 601, 215–226. doi: 10.3354/meps12693
Shimada T., Jones R., Limpus C., Groom R., Hamann M. (2016). Long-term and seasonal patterns of sea turtle home ranges in warm coastal foraging habitats: Implications for conservation. Mar. Ecol. Prog. Ser. 562, 163–179. doi: 10.3354/meps11972
Shimada T., Limpus C. J., Hamann M., Bell I. P., Esteban N., Groom R., et al. (2019). Fidelity to foraging sites after long migrations. J. Anim. Ecol. 89,1008–1016. doi: 10.1111/1365-2656.13157
Stokes K. L., Broderick A. C., Canbolat A. F., Candan O., Fuller W. J., Glen F., et al. (2015). Migratory corridors and foraging hotspots: Critical habitats identified for Mediterranean green turtles. Divers. Distrib. 21, 665–674. doi: 10.1111/ddi.12317
van der Zee J. P., Christianen M. J. A., Nava M., Velez-Zuazo X., Hao W., Bérubé M., et al. (2019). Population recovery changes population composition at a major southern Caribbean juvenile developmental habitat for the green turtle, Chelonia mydas. Sci. Rep. 7, 14392. doi: 10.1038/s41598-019-50753-5
Witherington B. E., Bresette M. J., Herren R. (2006). “Chelonia mydas – green turtle,” in Biology and conservation of Florida turtles. chelonian research monographs Chelonian Research Foundation, Arlington, Vermont, vol. 3 . Ed. Meylan P. A., 90–104.
Keywords: dispersal, migratory connectivity, Chelonia mydas, haplotype, mitochondrial DNA, genetic structure
Citation: Shamblin BM, Hart KM, Lamont MM, Shaver DJ, Dutton PH, LaCasella EL and Nairn CJ (2023) United States Gulf of Mexico Waters provide important nursery habitat for Mexico’s Green turtle nesting populations. Front. Mar. Sci. 9:1035834. doi: 10.3389/fmars.2022.1035834
Received: 03 September 2022; Accepted: 23 December 2022;
Published: 19 January 2023.
Edited by:
Jeremy Kiszka, Florida International University, United StatesReviewed by:
Ronel Nel, Nelson Mandela University, South AfricaNicole Esteban, Swansea University, United Kingdom
Copyright © 2023 Shamblin, Hart, Lamont, Shaver, Dutton, LaCasella and Nairn. This is an open-access article distributed under the terms of the Creative Commons Attribution License (CC BY). The use, distribution or reproduction in other forums is permitted, provided the original author(s) and the copyright owner(s) are credited and that the original publication in this journal is cited, in accordance with accepted academic practice. No use, distribution or reproduction is permitted which does not comply with these terms.
*Correspondence: Brian M. Shamblin, YnJpYW5zaG1AdWdhLmVkdQ==