 Luis Soto-Mardones
 Alejando Parés-Sierra
 K. Elsy Ticse de la Torre2
 Ana Laura Flores-Morales
- 1Facultad de Ciencias, Departamento de Física, Universidad del Bío-Bío, Concepción, Chile
- 2Departamento de Oceanografía Física, Centro de Investigación Científica y de Educación Superior de Ensenada, Ensenada, Mexico
- 3Universidad Autónoma de Baja California, Facultad de Ciencias Marinas, Ensenada, Mexico
Turbidity is a good indicator to determine the quality of the water; it is a measure of the number of particles in suspension in the water. Using ocean color data, we analyzed the seasonal variability of turbidity in front of the Campeche Bank and part of the confluence zone of the coastal currents coming from the Tamaulipas-Veracruz and Campeche platforms [94°W-87.6°W and 18°N-24°N]. The extended platform has several river discharges that are strongly influenced by winds and the loop current coming from the Strait of Yucatan. 2003-2020 was analyzed using satellite images (reflectance, Chlorophyll, sea surface temperature, and altimetry), reanalyzed winds and discharges from the grijalva-usumacinta river system. We used seasonal climatologies, Hovmoller diagrams, and Orthogonal and Complex Empirical Functions to describe the data. In addition, through the “Coastal and Regional Ocean Community model-CROCO) the surface fields of Salinity and velocity were incorporated into the analysis. The results indicated that the seasonal turbidity and its intensification in autumn and winter on the western side of the Campeche platform are due mainly to the contribution of intense flows from the Grijalva-Usumacinta which is further dynamically mix in autumn by the southwest winds, the cyclonic gyres, and the return currents. In spring-summer, the same forcing persists; however, the turbidity decreases due to the ineffectiveness of the intense zonal winds to produce Ekman transport.
Introduction
The fluvial discharge of the Grijalva-Usumacinta river system (GURS) on the Yucatan continental shelf located in the southeastern part of the Gulf of Mexico is the second largest fluvial contribution to the gulf (Toledo, 2003; Hudson et al., 2005; Yáñez-Arancibia et al., 2009; Sánchez et al., 2015). The rainy season, from June to September, brings a supply of fresh water to the bay through the GURS, reducing salinity and modifying the seawater temperature creating a coastal front (Monreal-Gómez et al., 1992; Saldías and Lara, 2020). In addition, GURS is the main source of sediment in the coastal zone (Carranza-Edwards et al., 1993).
The discharge of brackish water to the coastal ocean has important implications, not only physical due to the high difference in salinity/density with the coastal ocean, but also due to biogeochemical repercussions due to the high content of sedimentary material, concentration of nutrients of terrestrial origin, and contaminants brought by river discharges (Michael et al., 2006; Goñi et al., 2013; Vargas et al., 2013).
Turbidity generated by sediment runoff is a key indicator of water quality and has biotic effects due to low light penetration into water such as reduced photosynthesis (Schofield et al., 2004; Klemas, 2012; Fabricius et al., 2016; Romero-Rodríguez et al., 2020). The remote sensing reflectance (R_rs) is a tool widely used in recent years to measure and analyze the optical properties of environments that are highly influenced by sediment runoff. (Schofield et al., 2004; Nezlin and DiGiacomo, 2005; Zhang et al., 2014; Ali et al., 2016; Gangloff et al., 2017; Wattelez et al., 2017; Saldías et al., 2018; Romero-Rodríguez et al., 2020).
Globally, rivers are the most significant contributors of suspended particles in the ocean (Syvitski et al., 2005). The rivers that produce the highest flow discharges on average for the Gulf of Mexico are the Mississippi and GURS (Toledo, 2003; Yáñez-Arancibia et al., 2009; Sánchez et al., 2015). Suspended particles are initially propelled by inertia into the open ocean and subsequently change direction to be incorporated into coastal currents parallel to the shoreline due to the rotation of the Earth (Horner-Devine et al., 2006; McCabe et al., 2009). A key concern in understanding water turbidity is to describe the factors that modulate it. Important factors are, for example, high summer and fall rainfall (Douglas et al., 1993) and strong winds in spring that induce upwelling and stimulate phytoplankton growth, which in turn also changes the turbidity of the water (Mendes et al., 2017).
The circulation on the shelf is produced by the wind that blows most commonly towards the west throughout the year, forcing the ocean to produce a persistent circulation towards the west (Martínez-López and Pares-Sierra, 1998; Zavala-Hidalgo et al., 2003). Zavala-Hidalgo and Fernández-Eguiarte (2007) show that the currents on the continental shelf are seasonally dominated by the winds’ circulation and run parallel to the coast. In the autumn-winter season, the winds blow towards the west, generating currents with an average southward direction toward the Yucatan and Campeche; both currents converge in the southern zone of the Bay of Campeche, generating a return current perpendicular to the coast in front of Campeche. The opposite occurs in summer when the dominant currents are towards the north in the Tamaulipas and Veracruz region. Upwelling events have been widely studied in the literature (Belousov et al., 1966; Cochrane, 1966; Bogodanov et al., 1968; Cochrane, 1968; Cochrane, 1969; Bessonov et al., 1971; Bulanienkov and Garcia, 1973; Ruiz-Renteria, 1979; Furnas and Smayda, 1987; Merino, 1997; Reyes-Mendoza et al., 2016; Ruíz-Castillo et al., 2016; Jouanno et al., 2018). Kurczyn et al. (2021) state that the prevailing winds at the coast are not strong enough to drive the upwelling. The most convincing hypothesis suggests that the Yucatán upwelling is driven by the interaction of the Yucatán Current and the Yucatán Shelf (Furnas and Smayda, 1987; Merino, 1997; Jouanno et al., 2018). Likewise, Kurczyn et al. (2021), studying the impact of the upwelling on the western platform on the Campeche side, found the presence of Caribbean Subtropical Underwater. They found that this later water is brought by advection from the northeast platform, more than 500 km away from the study area.
The coastal environment of the southeastern part of the Yucatan continental shelf is exciting to study because it is subject to complex ocean-atmosphere dynamics and interacts with the strong seasonal GURS discharges. Analyzing turbidity at the coastline requires non-traditional approaches. Therefore, this study aimed to identify the spatial and temporal variability of the turbidity of coastal waters, determining the main factors that modulate it. Due to the optical complexity of some bodies of water, several different strategies have been used to analyze turbidity. Romero-Rodríguez et al. (2020) use the reflectance band to explain the turbidity adjacent to the Nayarit shelf; however, Kulshreshtha and Shanmugam (2016) propose a simple algorithm based on the use of two bands (and) to estimate the turbidity of coastal water from the Bay of Bengal. In this work, spatial and temporal variability analyzes were performed using fully normalized remote sensing reflectance centered at 555 nm (Rrs 555) and integrating continental and oceanic information to explain turbidity dynamics on the zonal side of the Yucatan Shelf and the western side of the Campeche Shelf.
Materials and methods
Study area
The study area (Figure 1A) comprises between 94°W-87.6°W and 18°N-24°N. It includes the mouth of the Grijalva-Usumacinta river system (GURS, Figure 1G) and part of the Campeche continental shelf. One of the most outstanding morphological characteristics of the Gulf of Mexico is an extensive continental shelf less than 200 meters deep that borders its margins and goes from Florida, United States, to the Yucatan Peninsula, Mexico (Banco de Campeche). The widest continental shelf in the southern Gulf of Mexico starts from the Tuxtlas region to the Yucatan Peninsula, ranging from 130 km off Isla del Carmen, 150 km in the Sonda de Campeche (southwestern region of the Bank of Campeche), and in the northern part of the Yucatan Peninsula with 260 km. In this study, the zonal side of the Yucatan shelf and the western side of the Campeche shelf are analyzed separately, following the regionalization based on knowledge of physical processes Zavala-Hidalgo and Fernández-Eguiarte (2007). The figure shows the regionalization proposed by Zavala-Hidalgo and Fernández-Eguiarte (2007), Figure 1B. It shows the domains of the loop current (8) and the coastal currents of Tamaulipas-Veracruz and Campeche, which are framed with blue (2), and red (3) contours, respectively. The dominant winds in the study region are shown through the 18-year seasonal climatology of ERA5-Wind (Figures 1C–F).
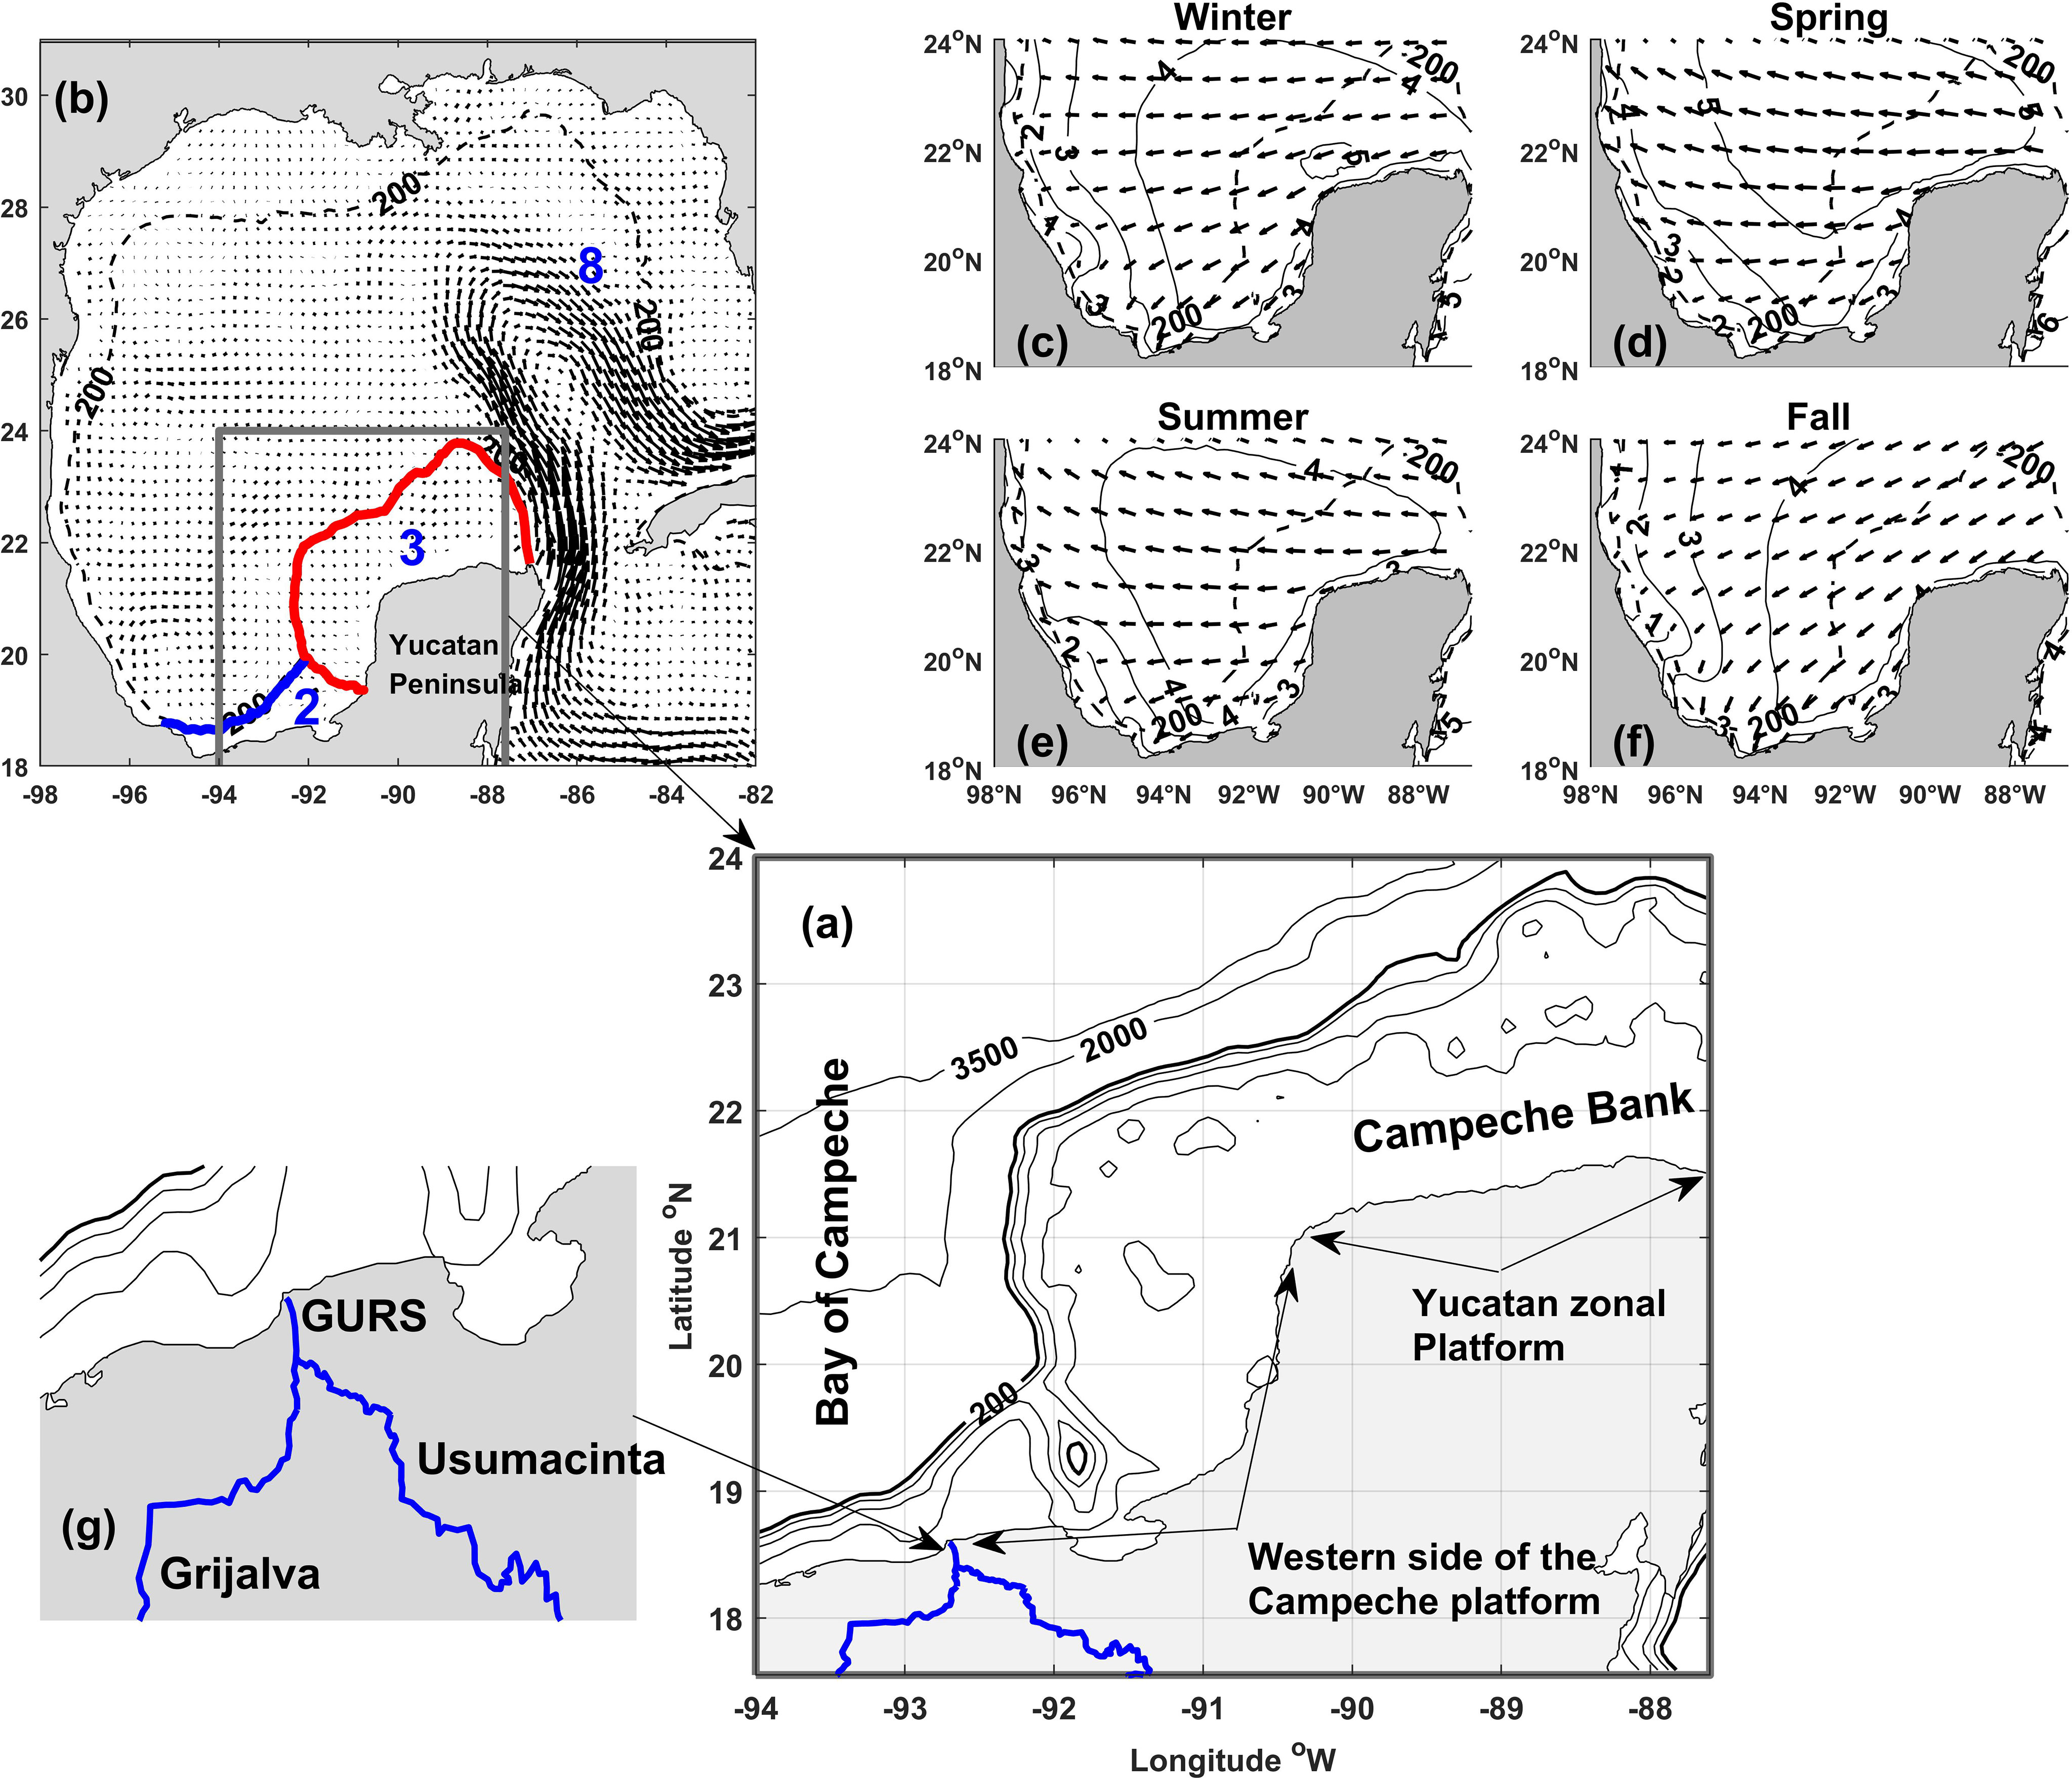
Figure 1 (A) The study area comprises between 94°W-87.6°W and 18°N-24°N. It includes the mouth of the Grijalva-Usumacinta river system (blue line) and the continental shelf up to the 200m isobath. (B) Confluence zone of the coastal currents coming from the Tamaulipas-Veracruz (2) and the Campeche (3) platforms, and the loop current (8). Seasonal winds composed of 18 years of ERA5- Wind for (C) Spring, (D) Spring, (E) Summer, (F) Fall, and (G) Grijalva-Usumacinta river system.
On the other hand, the Usumacinta river basin has an extension of 73,945 km2; it constitutes a basin shared between Guatemala (58% of its surface) and Mexico (42%). It starts in Guatemala at the Sierra de los Cuchumatanes and in Mexico in the mountains of Los Altos in Chiapas, it runs uninterruptedly for about 1,000 km, to finally join the Grijalva River and flow into the Gulf of Mexico, with an average discharge of 4,402 m3s-1 (Toledo, 2003; Yáñez-Arancibia et al., 2009; Sánchez et al., 2015) on average. The Grijalva and Usumacinta River System (SGU) has a humid tropical climate, with an annual rainfall of 1,200 to 4,300 mm (Saavedra-Guerrero et al., 2015). There is strong seasonality with a rainy season in summer (June-December) and another relatively dry winter (January-May). It ranks second in discharge to the Gulf of Mexico after the Mississippi River (Hudson et al., 2005).
Satellite-derived turbidity and Chlo
Measurements of Rrs(555) are used as an indicator of the turbidity since its magnitude is related to the optical properties of water (Morel & Bélanger, 2006), and the normalized water levin Radiance (nLw) could be expressed through Rrs after applying corrections (Gordon & Voss, 2004). In addition, ocean color data in the nLw(555) band have been widely used to monitor coastal river plumes due to their high resolution (~1 km) and their ability to delineate river plume boundaries and shape (e.g., Nezlin and DiGiacomo, 2005; Thomas & Weatherbee, 2006; Saldías et al., 2012; Mendes et al., 2014; Fernández-Novoa et al., 2015; Saldías et al., 2016; Romero-Rodríguez et al., 2020).
Daily data for CHLO (mg m3) and Rsr(555) (mW cm-2µm-1sr-1) at L2 level with 1 km pixel resolution were downloaded from the Ocean Biology Processing Group website (https://oceancolor.gsfc.nasa.gov/). Measurements from MODIS-AQUA/TERRA sensors were used from January 1, 2003, to December 31, 2020. The L2 products are organized into partial daily scenes of the Earth’s surface to generate a complete daily matrix of the Gulf of Mexico., first, a mosaic had to be generated by combining the partial scenes corresponding to the sensor step for each day. The products for CHLO and Rrs(555) from the MODIS-AQUA and MODIS-TERRA sensors were spatially averaged to form a single matrix which was used for Generate monthly averages.
GHRSST
The SST database was built with the daily L4 level product generated by the Group for High-Resolution Sea Surface Temperature (GHRSST). These data are free of cloud gaps and have a spatial resolution of 1 km (Chao et al., 2009, JPL OurOcean Project. 2010). The L4 GHRSST product is made up of the following sensors: the Advanced Very High-Resolution Radiometer (AVHRR), the Advanced Along Track Scanning Radiometer (AATSR), the Spinning Enhanced Visible and Infrared Imager (SEVIRI), the Advanced Microwave Scanning Radiometer-EOS (AMSRE), the Tropical Rainfall Measuring Mission Microwave Imager (TMI), the Moderate Resolution Imaging Spectroradiometer (MODIS), the Geostationary Operational Environmental Satellite (GOES) Imager, the Multi-Functional Transport Satellite 1R (MTSAT-1R) radiometer, and in situ data from drifting and moored buoys. In addition, we clipped the global daily data to the coordinates of our study area and generated the monthly mean averages from January 2003 to December 2019.
Winds ERA-5
The ERA5 reanalysis (spanning 1979 onwards) of the European Center for Medium-Range Weather Forecast (ECMWF) embodies a detailed record of the global atmosphere, land surface, and ocean waves. The new reanalysis ERA5 replaces the ERA-Interim reanalysis. ERA5 has a significantly enhanced horizontal resolution of 31 km, compared to 80 km for ERA-Interim. In addition, ERA5 has hourly outputs (Hersbach et al., 2020). The dataset is publicly available (Copernicus Climate Change Service [C3S], 2017, https://cds.climate.copernicus.eu/).
Wind stress
To obtain zonal and meridional wind stresses, the criteria used in Domínguez-Hernández et al. (2020) and Romero-Rodríguez et al. (2020), applied in the ERA-5 products.
Ekman velocities
Displacement in the surface layer begins with the action of the wind near the ocean surface. Then, each layer of the water column is affected by the movement of the upper or lower layer in the case of lower boundary layer friction. Ekman dynamics establish a balance between the earth’s rotation (Coriolis effect) and the friction force between the vertical direction:
This equation is solved using the boundary conditions at the surface (z=0) where the variation of speed with depth is given by the wind stress and at he bottom where the effect of the wind stress is null .
Therefore the Ekman velocities
With y
AV: turbulent viscosity
Wind Stress (ERA-5)
ρ: Density of seawater.
We used a constant turbulent viscosity within the range suggested by Pond and Pickard (1978) for the calculations of this work. Ocean density was obtained from the CSIRO Climatological Atlas of Regional Seas (CARS) (Ridgway et al., 2001; Dunn and Ridgway, 2002). The density fields were gridded according to the resolution of the ERA-5 winds.
Altimetry
We used data from altimetry sensors distributed by The Copernicus Climate Change Service (https://cds.climate.copernicus.eu/) to analyze the behavior of the surface circulation system. Level L4 products from the measurements of multiple altimetry sensors were used to generate daily global maps with a 25x25 km pixel grid. These data include sea surface height (SSH), Absolutely Dynamic Topography (ADT), and geostrophic velocity of the zonal (U) and meridional (V) components.
Monthly river discharge data
The SGU flow data was extracted from GEO Global Water Sustainability (GEOGloWS, 2017). The GEOGloWS ECMWF Streamflow Service is a worldwide application of global runoff forecasts from the European Center for Medium-Range Weather Forecasts (ECMWF) that transforms runoff into river discharge forecasts for all the world’s rivers. The hydrological data service consists of the same 40-year historical simulations from ECMWF’s ERA5-Land reanalysis and 15-day ensemble forecasts produced daily for the Copernicus Emergency Management Service’s Global Flood Awareness System (GloFAS). https://tethys-staging.byu.edu/apps/geoglows-hydroviewer/).
CROCO hydrodynamic model
The area between 14°N-31.5°N and 77.5°W-98.5°W was simulated for the year 2003 using the “Coastal and Regional Ocean Community model (CROCO; http://www.croco-ocean.org)”. CROCO is a new model built from ROMS-Agrif (Debreu et al., 2012; Penven et al., 2006). CROCO can solve the primitive equations based on the Hydrostatic and Boussinesq approximations coupled with advection-diffusion schemes for potential temperature and salinity, as well as a non-linear equation of state for density. Said advection scheme is of the third order, which allows an increase in the time step, thus improving its resolution (Shchepetkin and McWilliams, 1998). For boundary forcing, we used data from GLORYS12V1 product wish, which includes 1/12° horizontal resolution and 50 vertical levels. In time the reanalysis coves 1993 onward (https://doi.org/10.48670/moi-00021). Data from a global atmospheric reanalysis “ERA-Interim” were used as atmospheric forcing; this system has a spatial resolution of approximately 80 km (T255 spectral) on 60 levels in the vertical from the surface up to 0.1 hPa (For detailed documentation of the ERA-Interim Archive see Berrisford et al., 2011). We used Bathymetry data from the ETOPO2 database (Smith and Sandwell, 1997). Additionally, the simulation considered the presence of a variable monthly flow of fresh water from the Grijalva-Usumacinta river. The model was stabilized for three years using the fourth year for the analyses; the time step used was ~7.3min with files in daily averages for these analyses. The spatial resolution of the model was 7.5 km with 40 vertical sigma levels. The flow of freshwater is from climatology (Figure 2B). The salinity and temperatures assigned to said flow are constant throughout the year, with 0 (psu) in salinity and 25°C in temperature.
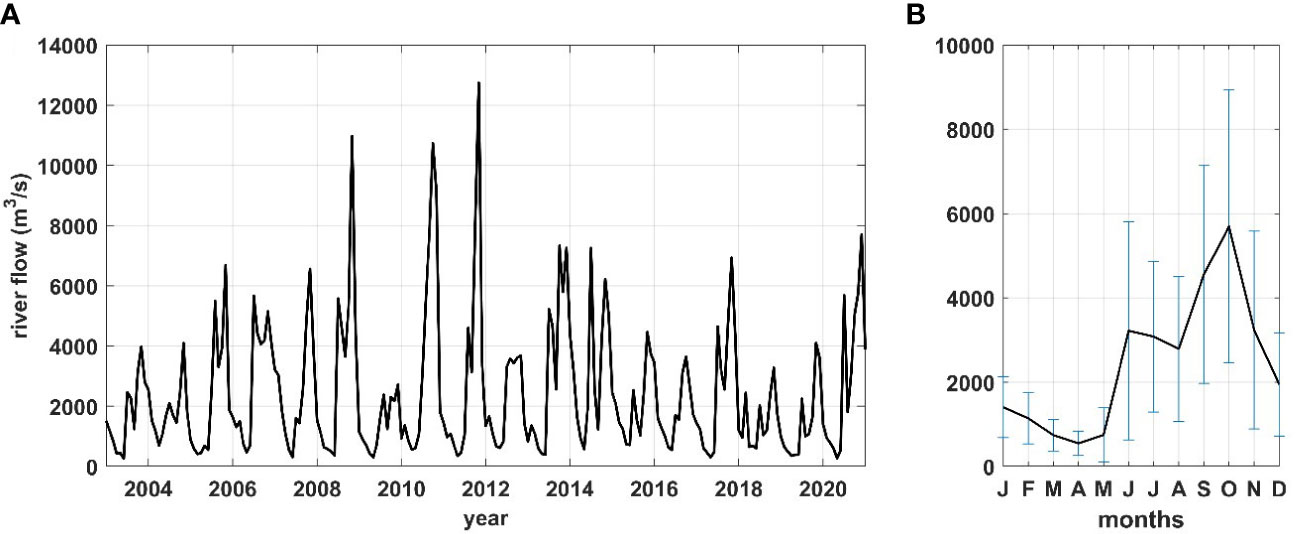
Figure 2 Flow of the Grijalva-Usumacinta River System (m3s -1 ). (A) 2003-2020 time series and (B) Monthly climatology and its standard deviation (blue line).
Analysis of oceanographic and atmospheric time series
Based on the monthly oceanographic (Rrs555, SST and Altimetry) and atmospheric (Wind Effort) images, the annual signal will be characterized through climatologies and space-time Hovmuller diagrams. The Hovmuller Diagrams were obtained by averaging the area coverage from the coast to the 200 m isobath. Cross-correlation analysis was used to determine the peak time lag between Rrs555, and the variables of Chlorophyll, wind stress, Ekma transport, geostrophic velocity and sea surface temperature. In addition, we used orthogonal empirical functions (OEFs) to extract the spatial structure and the temporal variability in all the variables (Barnett and Patzert, 1980; Kelly, 1985). The FEOs allow quantifying the total variance of the oceanographic and atmospheric time series in orthogonal or independent modes. In this way, we obtain modes or structures with the highest percentage of the variance, which probably represents the dominant signals in the study region, leaving the contributions associated with other types of processes or scales in the lower modes. We used regular FEOSs for analyzing the scalar variables (Rrs555 and SST) and complex FEOs for variables composed of a zonal and a meridional component (geostrophic speed, Ekman speed, and wind effort) (Romero-Rodríguez et al., 2020).
Results
Seasonal climatology The time series of GURS flows (Figure 2A) shows a seasonal behavior with the maximum amplitudes in the autumn period and the minimum in early spring. For example, the climatological flow (Figure 2B) shows that the maximum flow is reached in August (~5,500 m3s-1) with maximum variability (m3s-1), although a high flow persists around the summer-autumn seasons. On the other hand, the minimum flows occur in spring, specifically in April (~750 m3s-1) with the least variability ( ± 150 m3s-1).
Turbidity patterns adjacent to the Yucatan platform
Seasonal climatology (Figures 3A–D) and standard deviation (Figures 3E–H) showed spatial patterns of Rrs555 turbidity adjacent to the Yucatan shelf. Around the mouth of the GURS and on the western side of the Campeche shelf (~93°W – 90.5°W), an intense band of Rrs555 is observed in winter and autumn (Figures 3A, D), which fluctuates in a range of 5-20·10-3 rs-1, on the other hand, in spring (Figure 3B) this band begins to weaken, reaching its minimum (~5 at 10·10-3 rs-1) in summer (Figure 3C). Likewise, on the zonal side of the Yucatan platform (~90.5°W and 87.1°W), the Rrs555 band reaches its maximum (~5 to 10·10-3 rs-1) in winter-autumn (Figures 3A, D), decreasing (~5·10-3 rs-1) and narrowing significantly in spring (Figure 3B) until almost disappearing in summer (Figure 3C). On the other hand, the standard deviation shows that the most significant variability (0.2 to 0.610-3 rs-1) occurs in autumn (Figure 3H) and decreases significantly (0.2 to 0.6·10-3 rs-1) in winter (Figure 3E) until reaching its minimum (~0.2·10-3 rs-1) in summer (Figure 3G).
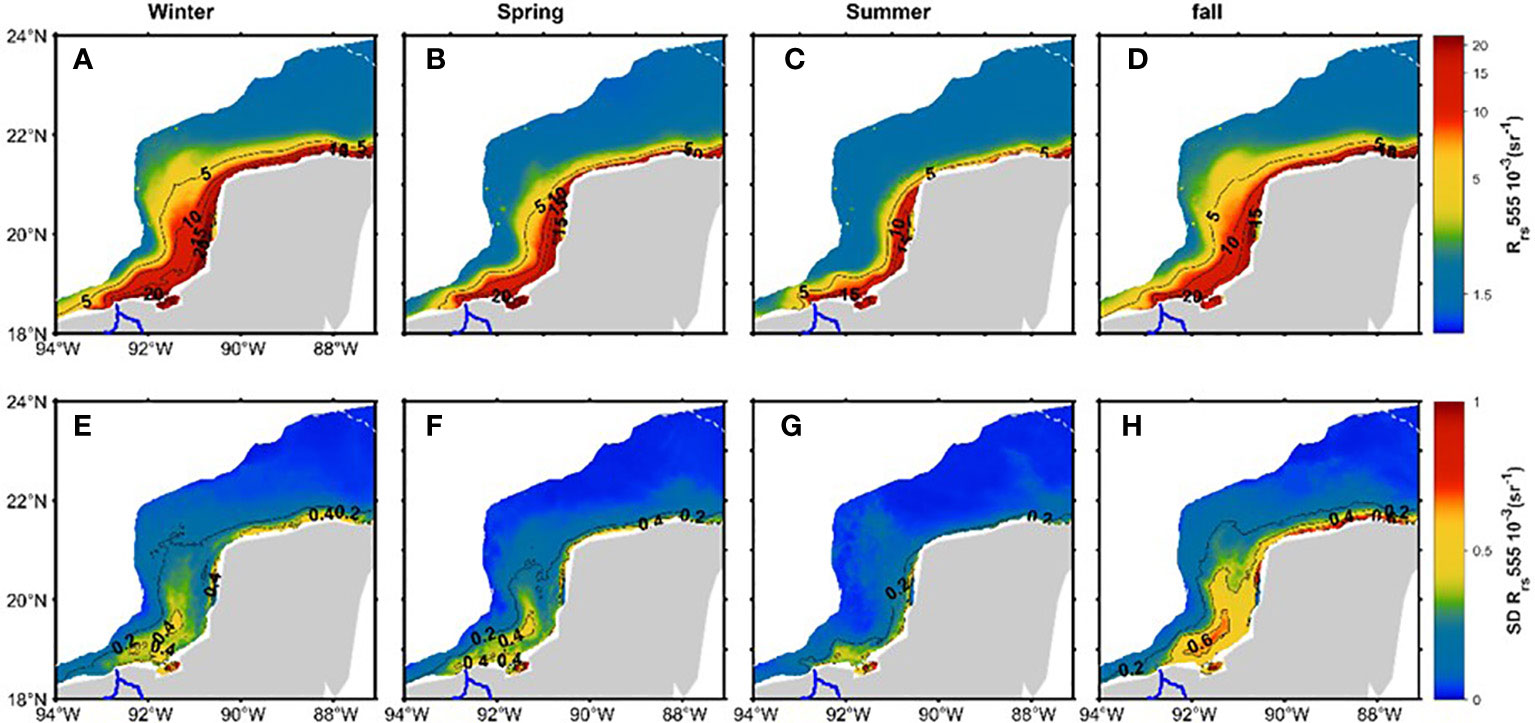
Figure 3 Seasonal climatology of reflectivity [Rrs · 10−3 sr−1 ] on the western side of the Campeche shelf and zonal edge of the Yucatan shelf and their respective standard deviation. (A, E) winter, (B, F) spring, (C, G) summer, and (D, H) autumn. The blue outline corresponds to GURS.
Seasonal patterns of wind stress
The seasonal analysis of the wind stress (WS) shows the predominance of very intense winds (> 20·10-3 Nm-2) coming from the East (Figures 4A–D), and they decay significantly towards the western side of the Campeche platform. The WS shows very defined patterns in both regions, in winter-autumn (Figures 4A, D), the wind blows towards the southwest; on the other hand, in spring-summer (Figures 4B, C), it blows zonally. The intensity of the WS in autumn-winter is approximately similar; however, the other seasons differ in magnitude, maximum spring (> 30·10-3 Nm-2) and minimum in summer. On the zonal side of the Yucatan platform, the greatest variability (> 6·10-3 Nm-2) associated with the standard deviation (Figure 4E–H) is found in the vicinity of the 200 m isobath and decays towards the region coastal. Similar behavior is observed on the western side of the Campeche platform (Figures 4E, F, H), except for the summer season (Figure 4G).
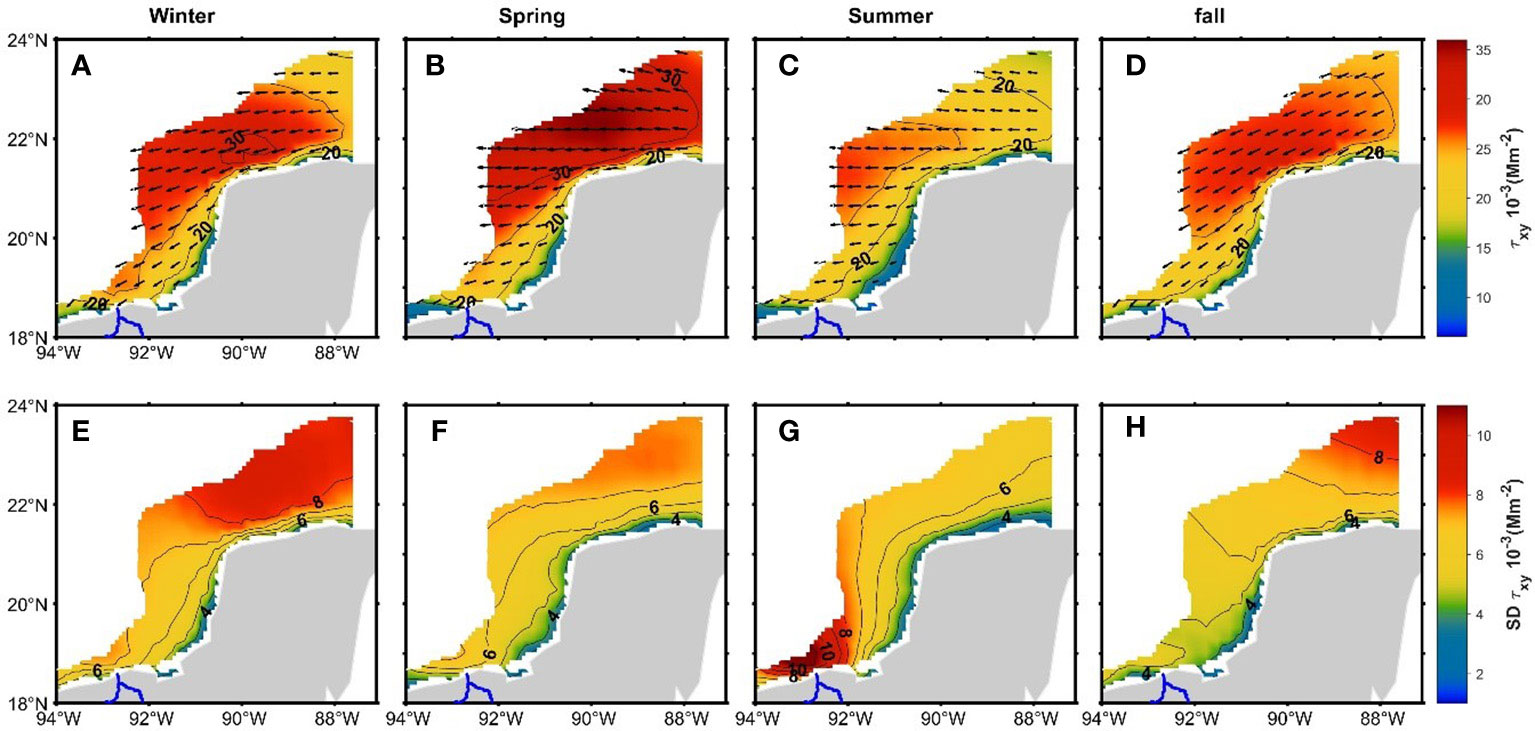
Figure 4 Seasonal climatology of wind stress [τxy · 10−3 Nm−2 ] on the western side of the Campeche shelf and the zonal side of the Yucatán shelf and their respective standard deviation. (A, E) winter, (B, F) spring, (C, G) summer, and (D, H) autumn. The blue outline corresponds to GURS.
The geostrophic velocity climatology shows very marked seasonal differences (Figure 5). On the zonal side of the Yucatan shelf, a robust westward flow (> 8·10-2ms-1, Figure 5B) is observed during spring and intensifies in summer (> 10·10-2ms-1, Figure 5C). Subsequently, the flow forks towards the western side of the Campeche platform, slowing down but maintaining its direction towards the southwest. During winter and autumn (Figures 5A, D), the geostrophic velocity decreases significantly (< 8·10-2ms-1), circulating in the form of meanders and cyclonic gyres off Yucatan; likewise, on the coast of Campeche, the flow rotates in a cyclonic manner, generating a countercurrent in the area of the curvature. A decrease in magnitude stands out in the region of the curvature of Campeche, generating cyclonic circulation. This trend is observed in all four seasons, although it is more defined in autumn and winter. On the other hand, the variability of the geostrophic circulation (Figures 5E–H) during the year remains approximately 4·10-2ms-1 and 8·10-2ms-1, respectively.
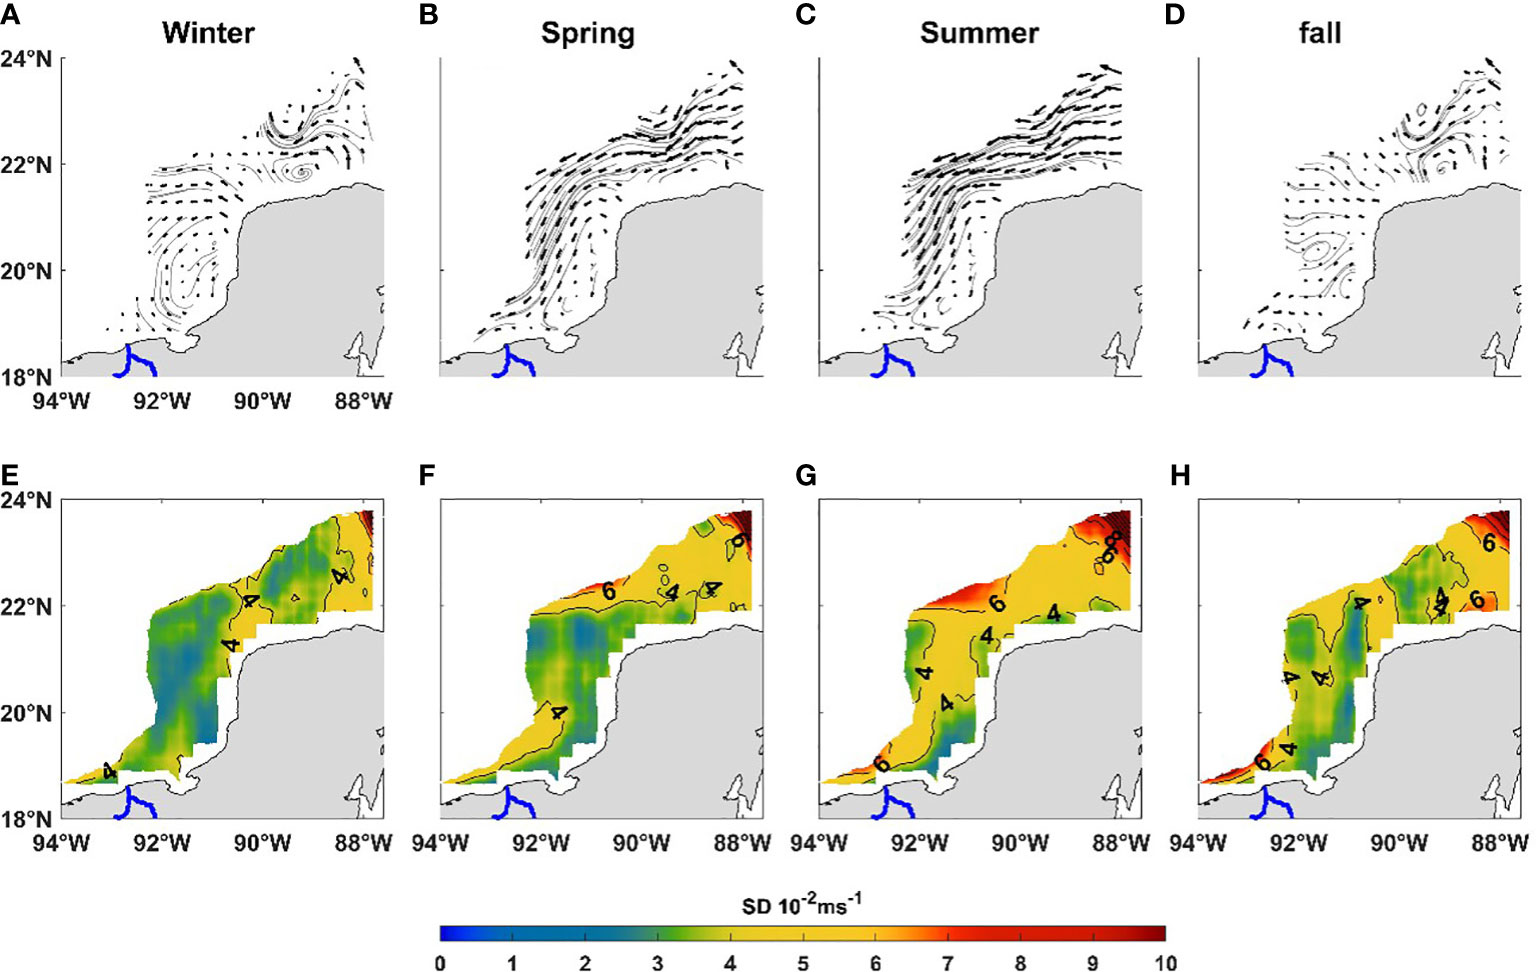
Figure 5 Seasonal climatology of the geostrophic velocity [νg · 10−2 ms−1 ] off the coast of Campeche and the zonal border of Yucatán and its respective standard deviation. (A, E) winter, (B, F) spring, (C, G) summer, and (D, H) autumn. The blue outline corresponds to the GrijalvaUsumacinta river system.
Temporary variability
Figure 6 shows the seasonal Hovmöller diagrams of the oceanographic and atmospheric variables along the coast. The spatial distribution of seasonal turbidity shows a band in front of the mouth of the GURS (Figure 1) that extends to the east along the western side of the Campeche shelf, while to the west, the turbidity is not present. Likewise, turbidity to the east is present throughout the year up to the curvature off Mérida (~90°W), although it weakens in summer. On the zonal side of the Yucatan shelf (90°W-87.6°W), turbidity only intensifies in the winter-autumn period and tends to decrease (<5·10-3rs-1) in spring-summer. On the other hand, the Hovmoller diagram of chlorophyll concentrations (Figure 6B) shows in summer, an intense band (>0.5mgm-3) that covers the entire coast and declines in winter-spring. However, chlorophyll concentrations decline more markedly on the zonal border of Yucatan.
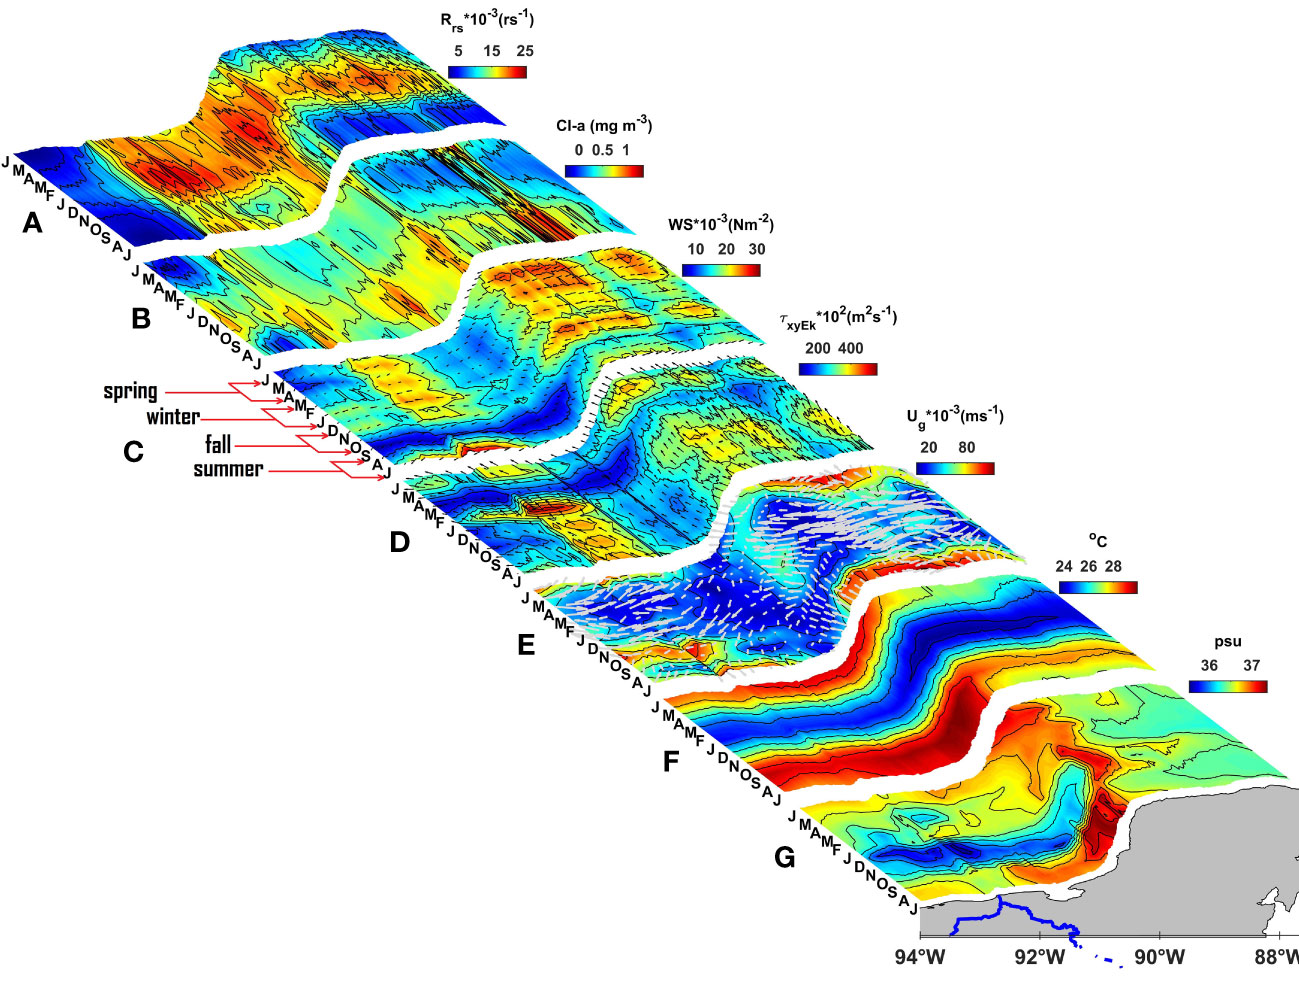
Figure 6 Hovmöller diagram of (A) Turbidity, (B) Chlorophyll, (C) Wind Effort, (D) Meridional Ekman Transport, (E) Geostrophic Velocity, (F) Sea Surface Temperature and (G) Modeled Salinity.
Figure 6C shows that the circulation of the winds is mainly towards the west and its magnitude is subject to seasonal and topographical variations. Intense winds (>25·10-3NM-2) predominate only on the zonal side of the Yucatan platform; on the other hand, on the western side of the Campeche platform, the magnitudes of the wind force decrease (<20·10-3NM-2). It stands out that in the summer period, the magnitudes of WS decrease drastically off the coast of Campeche with a slight increase of the mouth of the GURS. From September to June, atmospheric cold fronts from North America (Kurczyn et al., 2020) drastically change the regional wind flow and interrupt upwelling processes from the northeast (Merino, 1997).
On the other hand, the Ekman transport (Figure 6D) is preferentially northward. The transport in front of the zonal border of Yucatán intensifies during the winter, spring, and autumn seasons (>400 102m2s-1), weakening slightly during the summer. On the western side of the Campeche shelf, except in the summer, it intensifies significantly in front of the mouth of the GURS; it stands out that transport decreases significantly in the area of the curved coast of Campeche (<300·102m2s-1).
The superficial geostrophic velocity (Figure 6E) shows a preferential direction towards the west with the maximum magnitudes in front of the zonal side of Yucatán in spring-summer (>70·102m2s-1), on the other hand, in autumn-winter, the magnitudes decrease drastically (<50·102m2s-1). The circulation off the western side of Campeche varies seasonally, with a cyclonic flow in winter, westward in spring-summer, and eastward in autumn. In the zone of the curvature of Campeche, the circulation is oscillating.
On the other hand, the SST (Figure 6F) shows a marked difference between the Yucatan zonal platform and the western side of Campeche. The low temperatures on the zonal side of Yucatán seem to be modulated by the intense winter, spring, and autumn winds (Figures 4A, B, D), except for the summer season when the WS decreases (Figure 4C). Likewise, on the western side of the Campeche platform, the increase in SST stands out from May to October due to the lower ventilation of WS and possible local effects, such as the contribution of warm waters from GURS.
The maximum inflows from the GURS are in October (Figure 2B), which significantly modify the modeled salinity (Figure 6G) on the western side of Campeche (< 36.2 psu) during autumn, winter, and part of spring. As a result, a core of high salinity stands out (>36.6 psu) in front of the Mérida curvature in autumn and extends to the west in spring-summer. On the other hand, in the zonal border of the Yucatán platform, the salinity fields tend to remain approximately constant, around ~36.4 psu.
Cross-correlation analysis
The cross correlation between Chlorophyll and Rrs555 along the coast (Figure 7A) showed that both series are not correlated (correlation coefficient<0.3), except in a small region of the zonal edge of the coast. Yucatan Peninsula around ~89°W.
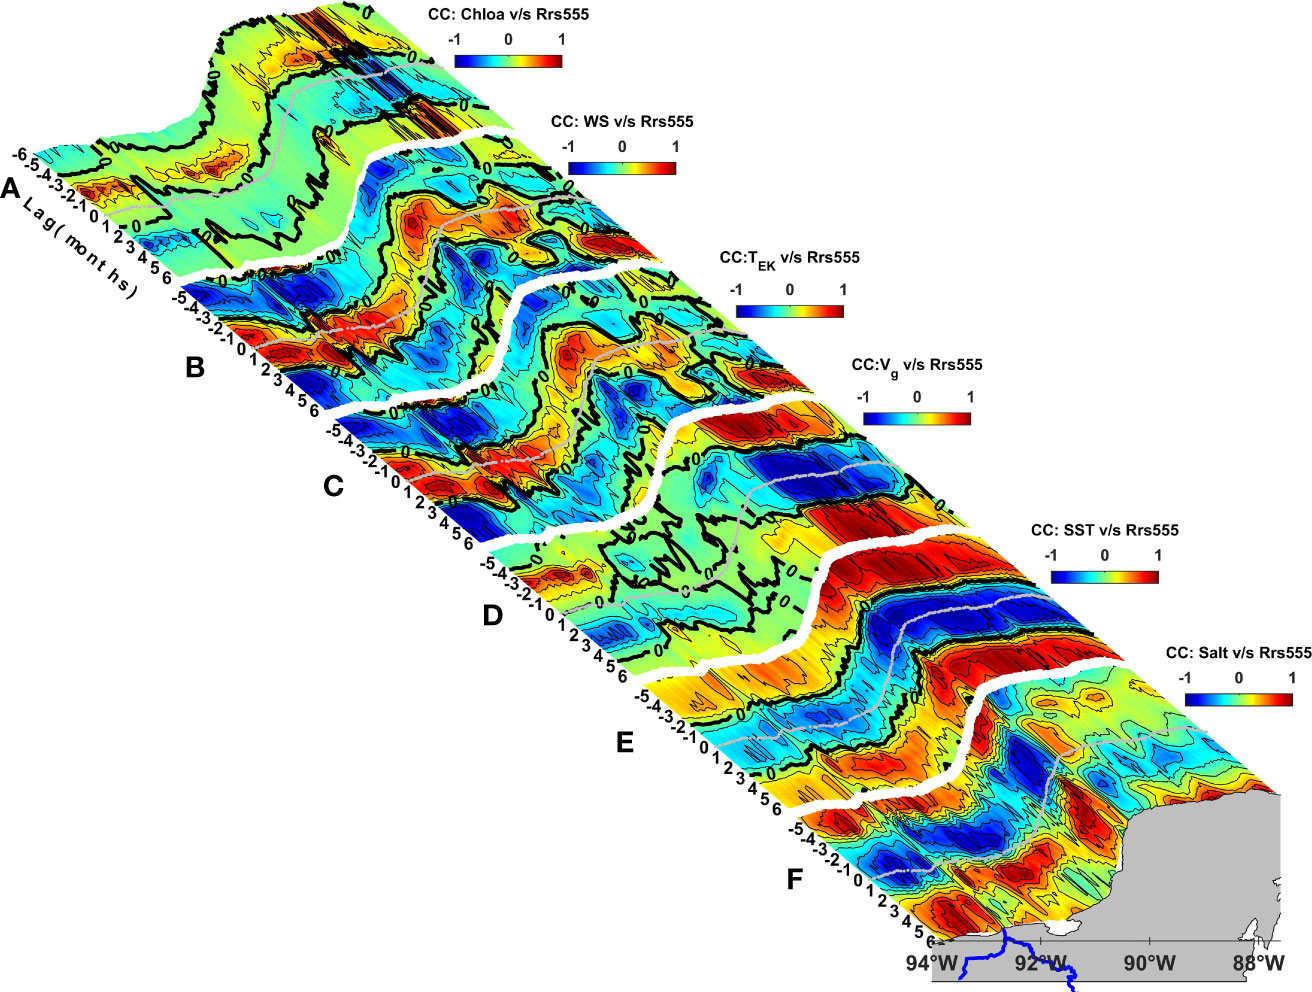
Figure 7 Hovmöller Diagram of the Cross-Correlation Coefficient (CC) between: (A) Chlorophyll and Turbidity (Rrs555), (B) Wind Effort and Turbidity (Rrs555), (C) Southern Ekman Transport and Turbidity (Rrs555 ), (D) Geostrophic Velocity and Turbidity (Rrs555), (E) Sea Surface Temperature and Turbidity (Rrs555) and (F) Modeled Salinity and Turbidity (Rrs555).
On the other hand, the cross-correlation between the WS and Rrs555 (Figure 7B) shows, compared to the mouth of the GURS, a core correlation coefficient >0.6 in-phase (lag 0) and significant at the confidence interval (p< 0.005), however, on the curved side of Campeche, no significant correlation (<0.2) between both variables is observed. On the contrary, on the zonal side of the Yucatan platform, the cross-correlation is significant (confidence interval (p< 0.005) and with both series in phase (Lag 0) and a lag of 2 to 4 months with the nuclei of maximum correlation (>0.8).
The cross-correlation between WS transport and Rrs555 (Figure 7C) showed the zonal side of the Yucatan shelf that the highest positive correlation (>0.8) was identified with a lag of 1 to 5 months. This indicates that transport increased months after the maximum recorded turbidity (typical case of upwelling). In front of the GURS plume, a nucleus in phase (Lag 0) was found, however, in front of the curvature of the Campeche platform side, no significant correlation coefficient was observed (<0.2), indicating that the transport does not explain the turbidity in that region.
The coefficients of maximum negative correlation (~-0.8) and in phase (Lag 0) between the magnitude of the geostrophic velocity and Rrs555 (Figure 7D) in front of the zonal edge of the Yucatan Peninsula indicate that given the increase in the geostrophic velocity drastically decreases the turbidity. On the contrary, on the western side of the Campeche platform, there is no correlation between both series (<0.3).
The cross-correlation between SST and Rrs555 along the coast (Figure 7E) is in the opposite phase (Lag 0). Compared to the zonal side of Yucatán and western Campeche, the correlation coefficients are >0.8 and<0.3, respectively. According to this result, according to the confidence interval (p< 0.005), only the correlation coefficient for the Yucatan Peninsula is significant, indicating that turbidity increases at lower temperatures or vice versa.
Finally, the cross-correlation between modeled salinity and Rrs555 (Figure 7F) shows a high negative correlation on the western side of Campeche. The cross-correlation showed significant correlation coefficients with respect to the confidence interval (p< 0.005) and with both series in phase (Lag 0) and a lag from 0 to 2 with the maximum correlation nuclei (>-0.6). On the other hand, on the zonal side of Yucatán, it was shown that both series are not correlated due to the low correlation coefficient (<0.3). This result shows that the low salinity values represent a good tracer of the boundaries of the GURS plume on the western side of Campeche.
Empirical orthogonal functions
The spatial structure of the first EOF of Rrs555 (Figure 8A) explained 83.7% of the total variance (Table 1) and showed an extensive band of maximum amplitudes starting from the GURS and bordering the western coast of Campeche, instead Towards the zonal edge of Yucatan this band narrows drastically. Furthermore, the first EOF showed a dominant signal corresponding to a seasonal variation (Figure 8G, black line) and reaching its maximum in autumn-winter and minimum in summer (Figure 8M, black line).
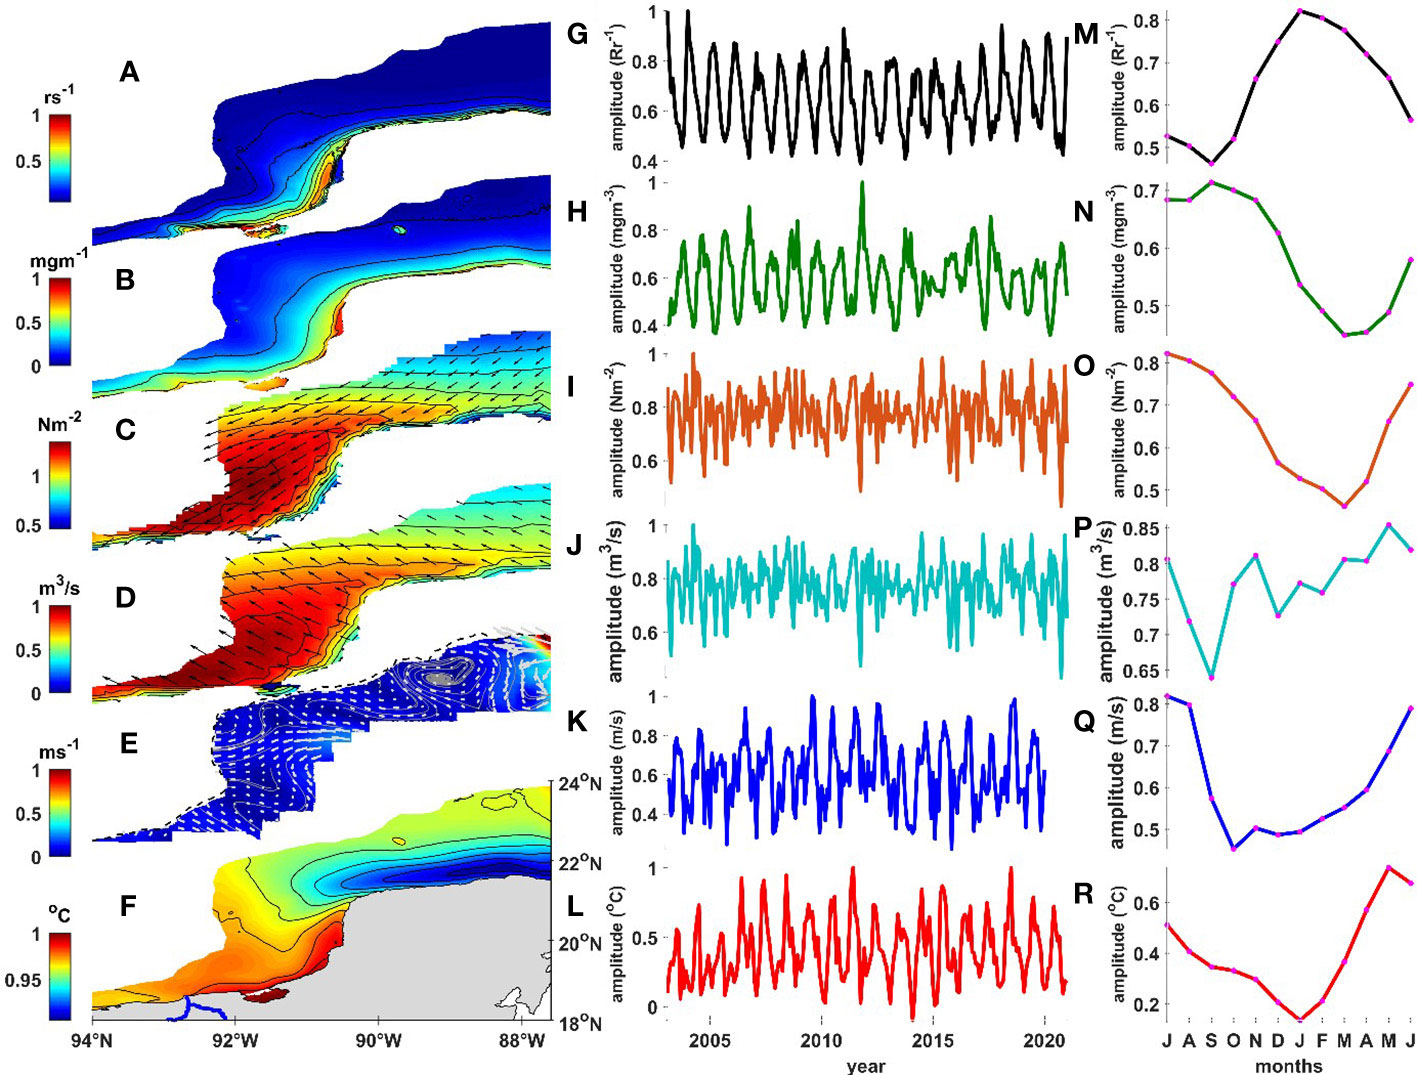
Figure 8 Spatial structure of the first mode of the Empirical Orthogonal and Complex Functions of (A) Turbidity (Rrs555), (B) Chlorophyll, (C) Wind Effort, (D) Meridional Ekman Transport, (E) Velocity Geostrophic and (F) SST. Temporal structures and climatology of (G, M) Turbidity (Rrs555) in black line, (H, N) Chlorophyll in green line, (I, O) Wind effort in brown line, (J, P) Meridional Ekman transport in light blue line, (K, Q) Velocity Geostrophic on blue line, (L, R) SST on the red line. Climatology of temporary structures.
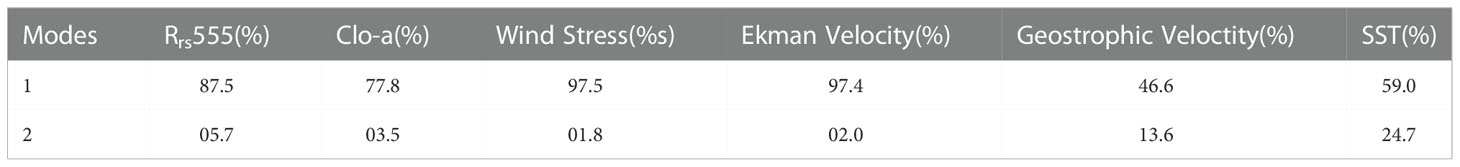
Table 1 Distribution of the total variation contained in the monthly data series.
Chlorophyll shows the presence of a dominant signal (Figure 8B), represented by the first mode, which corresponds to seasonal variation (Figures 8H, N, green line) and contains most of the variance, explaining 77.8% of its variability (Table 1). The spatial structure of the first mode (Figure 8B), shows a band of maximum amplitudes similar to that observed in Turbidity (Figure 8A), although it starts from 74°W and its variability (Figure 8N, green line) is in phase opposite to seasonal climatology of Rrs555 (Figure 8M, black line). This result shows that turbidity is not associated with chlorophyll.
The first CEOF of the WS explained 97.2% of the variability (Figure 8C). The spatial pattern showed the most significant amplitude in front of Campeche and decreased towards the zonal side of Yucatán. In addition, in WS it was predominant towards the southwest, which was favorable to upwelling. The temporal pattern of the WS (Figures 8I, O, red line) was modulated by seasonal variability and is in phase with the temporal chlorophyll climatology (Figure 8N, green line) and in opposite phase with turbidity (Figure 8M, black line). Likewise, the CEOF of the first mode of Ekman transport robustly explains 97.4% of the variance (Table 1), and the spatial structure (Figure 8D) reaches the maximum amplitudes in spring (Figure 8J, P, light blue line).
The spatial structure of the first CEOF mode (Figure 8E) shows, on the zonal side of the Yucatan shelf, a flow preferentially westward, composed of gyres and meanders that branch off towards the curved coast of Campeche. This mode shows the presence of a dominant signal, which corresponds to seasonal variation (Figure 8K, blue line) and contains most of the variance, explaining 46.6% of its variability (Table 1) and reaches its maximum in spring-summer and its minimum in autumn (Figure 8Q, blue line).
Finally, the EOF of the SST explains 59% (Table 1) of the variance and the spatial structure (Figure 8F) dominated by the seasonal signal (Figure 8l, red line) shows minimum amplitudes compared to the zonal boundary of the Yucatan shelf possibly related to upwelling, however, the maximum SST amplitudes off the western side of Campeche is due to the influence of the GURS flow. Both processes are important in the spring period (Figure 8L, R, red).
Hydrodynamic model
The seasonal surface salinity fields (Figures 9A–D) inside the platform showed in autumn (Figure 9D) a salt wedge in front of the zonal side of the Yucatan platform that spreads towards the west and is caught off the curved coast of the western side of Campeche during the winter, spring, and summer seasons. In the autumn season, a wedge of low salinity stands out that appears in front of the Campeche side, coinciding with the maximum discharges of seasonal flows of the GURS (see, Figure 2).
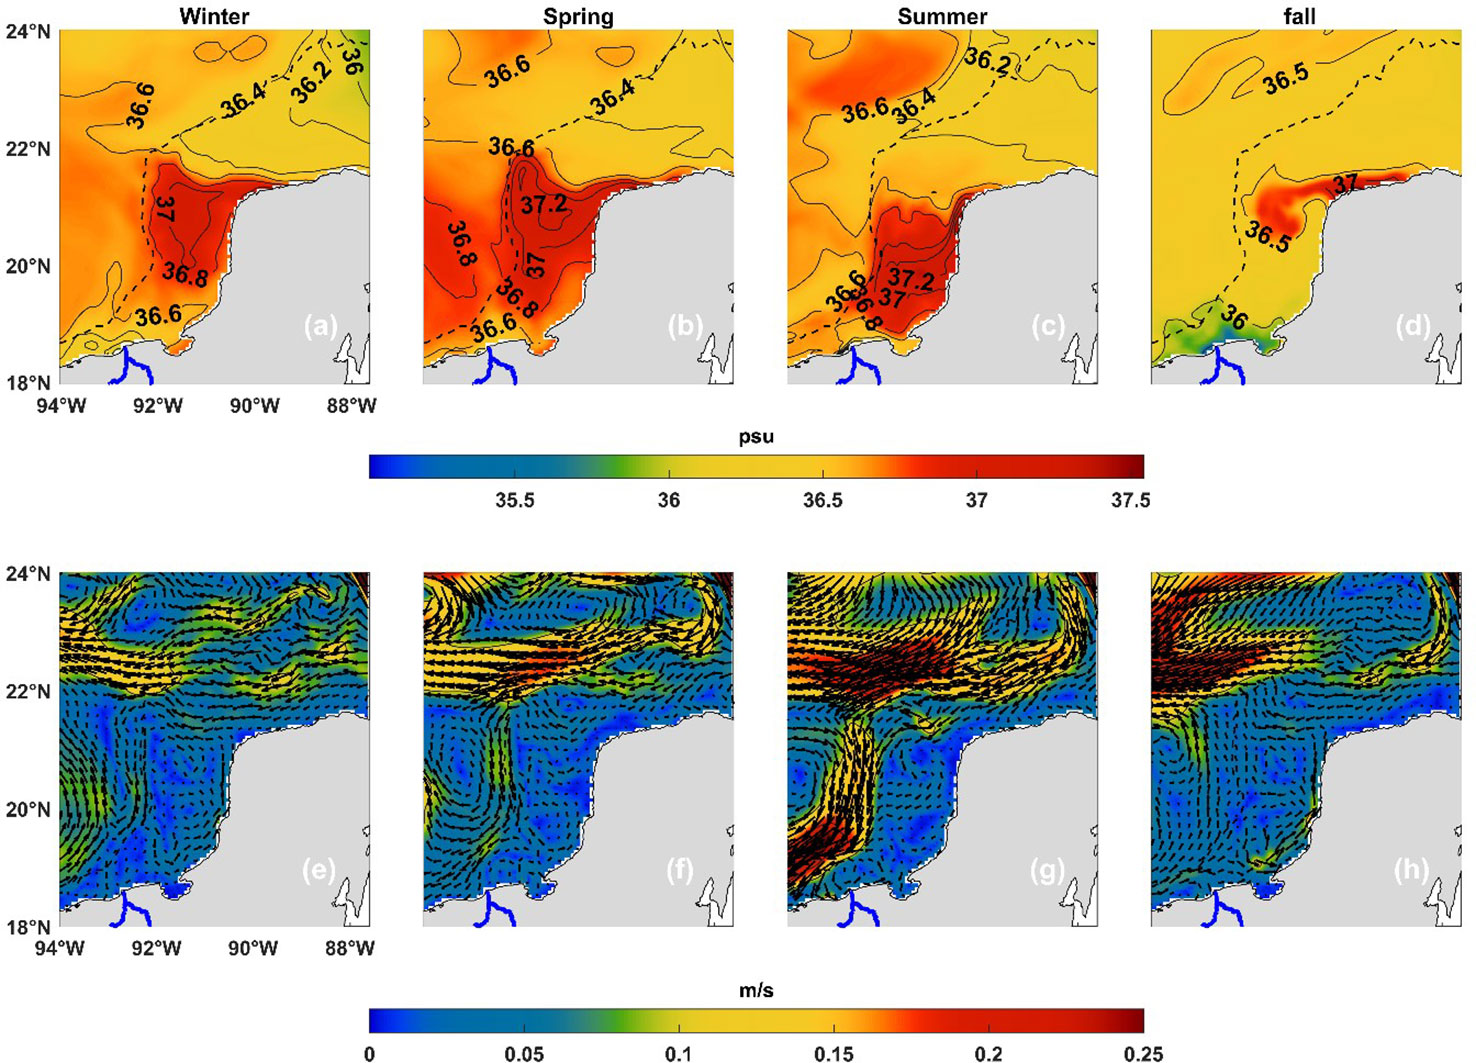
Figure 9 Seasonal surface maps of Salinity (A–D) and Circulation (E–H) in the eastern platform of Yucatan from the CROCO hydrodynamic model.
On the other hand, the modeled seasonal current (Figures 9E–H) shows, in the eastern platform, a flow in the form of meanders towards the west that, upon entering the western coast of Campeche bifurcates forming counter-clock gyres that favor the formation of a countercurrent that runs along the curved coast to the northeast in winter (Figure 9E) and that intensifies in autumn (Figure 9H). The circulation on the western side of the Campeche shelf is made up of cyclonic gyres that favor the entry of subsurface water throughout the year, coupled with the countercurrent that couples with the GURS plume.
Discussion
Annual cycle of turbidity in the continental shelf of the Yucatan Peninsula
Recent literature has established various turbidity thresholds used to define the contour of river plumes, explicitly considering the turbidity of their waters. Some of them (Shi and Wang, 2007; Saldías et al., 2012; Romero-Rodríguez et al., 2020) have used the normalized radiance threshold value nLw (555 and 645 nm) in terms of reflectance is 0.008sr-1. Likewise, the article by Petus et al. (2014) used a threshold of 0.009sr-1. For its part, what is reported in the work of Fernández-Novoa et al. (2017) establishes a threshold of 0.001 sr-1. These authors indicate that, in any case, although some turbidity can be detected below this value, the material and fresh water are diluted enough to follow a similar dynamic to ocean water; in the context of this work, it was delimited the GURS plume in the range of 0.005-0.02 sr-1. In general, turbidity is present throughout the year, but it is more intense in autumn and winter (Figures 3A, D) and falls in spring-summer (Figures 3B, C).
The GURS plume turns eastward due to the effect of the Earth’s rotation (Horner-Devine et al., 2006; McCabe et al., 2009), forming a current parallel to the western coast of Campeche. River discharges bring a large sediment load to the ocean (Syvitski et al., 2005), which could later be reflected in turbidity. Therefore, the turbidity of the Campeche area is more sensitive to the discharge of the river, which would explain that the maximum turbidity occurs in autumn, coinciding with the maximum discharges of the GURS (Figure 2B). On the other hand, the maximum turbidity in winter was not expected because the flow is minimal. Furthermore, the sediments contributed in autumn are resuspended in winter due to the effect of hydrodynamic processes (Shi and Wand, 2010; Romero-Rodríguez et al., 2020).
Continental shelves play an essential role in oceanographic dynamics (Huyer, 1990; De Wright, 1995; Zamudio et al., 2007; Romero-Rodríguez et al., 2020), which cannot be fully understood in isolation from the processes that take place in oceanic waters. (Csanady, 1977). The western shelf of Campeche showed marked differences in its spatial and temporal distribution parameters in contrast to the zonal Yucatan (Figure 6). Off the western coast of Campeche, the oceanographic parameters seasonally intensified while the dynamics mostly decreased. However, on the zonal coast of Yucatan, the seasonal processes were reversed.Chlorophyll concentration has been used to indicate phytoplankton biomass (Cowles and Desiderio, 1993; Lambert et al., 1999), showing a low correlation coefficient with turbidity (Figure 7A). In addition, the Yucatan and Campeche zone has been described as an oligotrophic region devoid of nutrients in the surface layer (Müller-Karger et al., 1991; Signoret et al., 1998; Okolodkov, 2003). However, significant nuclei of chlorophyll (~1.1 mg m-3) are observed in summer-autumn (Figure 6B), a period that coincides with what has be en reported by various authors (Müller-Karger et al., 1991; Signoret et al., 1998; Aguilar-Maldonado et al, 2018). Also, the seasonal climatologies of the first EOFs mode of turbidity and chlorophyll (Figures 8M, N) confirm the null relationship between them and that both variables are linked to independent dynamic processes.
The turbidity in the study area is maximum in autumn-winter (Figures 3A, D), coinciding with the highest STGU discharge and with the WS in a southwesterly direction (Figures 3E, H), on the other hand, the turbidity is minimum (Figure 3B, C) in spring-summer with lower GURS discharges and intense winds in a completely zonal direction (Figures 4B, C). The effectiveness of WS in producing upwelling on the zonal side of the Yucatan shelf is widely discussed in the literature, indicating first that the most significant upwelling occurs in summer (Pica-Granados and Pineda-López, 1991; Merino, 1997; Perez et al., 1999; Zavala-Hidalgo et al., 2006), and minimum in summer as reflected by the minimum ventilation of the SST (Figure 6F).In this same context, the WS to the southwest is more effective in producing upwelling compared to the lower effectiveness of zonal winds. Multiple mechanisms have been proposed to drive upwelling (Cochrane, 1966; Ruiz-Renteria, 1979; Furnas and Smayda, 1987; Merino, 1997; Reyes-Mendoza et al., 2016; Ruíz-Castillo et al., 2016; Jouanno et al., 2018); however, the issue is still under investigation. Although the prevailing winds are parallel to the coast in spring-summer, their strength is not enough to drive the typical upwelling. The spatial structure of the first CEOF mode of the WS with 97.5% of the variance (Figure 8C) corroborates the southwest direction of the winds and their temporal variability (Figure 8O, green line) in the phase opposite to the turbidity (Figure 8M, black line). Likewise, the cross-correlation between the WS and the turbidity (Figure 7B) showed the region where the wind was more effective standing out the mouth of the GURS and the zonal coast of Yucatan. Likewise, the cross correlation between the WS and the turbidity (Figure 7B) showed the region where the wind was more effective, standing out the mouth of the GURS and the zonal coast of Yucatan. In contrast, in the Campeche curvature region, the WS correlation is minimal, indicating that the wind and the Ekman transport (Figure 8C) have no effect in that region and are associated with other hydrodynamic processes (Shi and Wand, 2010; Romero-Rodríguez et al., 2020).The seasonal circulation over the shelf (Zavala-Hidalgo and Fernández-Eguiarte, 2007) is produced by the wind blowing preferentially to the west throughout the year, forcing the ocean to produce a persistent circulation to the west (Martínez-López and Pares-Sierra, 1998; Zavala-Hidalgo et al., 2003). In spring and summer, the zonal WS (Figure 4B, C) in front of the Yucatan zonal platform coincides with the intensification of the geostrophic velocity (Figures 5B, C). Later, this flow forks towards the western side of the Campeche shelf generating a series of cyclonic gyres. In front of the Yucatán zonal shelf during autumn-winter, the attenuation of the WS blowing to the southwest (Figures 4A, D) generates a decrease in currents in the form of meanders and gyres. In addition, the fork of the current towards the western side of Campeche is transformed into a series of cyclonic gyres that generate a return current to the east (Figures 5A, D). The seasonal behavior of geostrophic velocities (Figure 5) is replicated by the spatial and temporal structure of the first CEOF mode (Figures 8E, Q).
Similarly, the modeled velocities (Figure 9) replicate with greater precision (due to the higher spatial resolution) the seasonal circulation of the geostrophic velocities (Figure 5), allowing us to see the role played by the continental shelves and their interaction with the oceanic zone (Csanady, 1977; Huyer, 1990; De Wright, 1995; Zamudio et al., 2007; Romero-Rodríguez et al., 2020). Likewise, the modeled circulation (Figures 9E–H) more clearly showed the coastal circulation off the western coast of Campeche, with the formation of cyclonic gyres and the return current to the east in winter and autumn (Figures 9E, H). On the other hand, in autumn, the modeled salinity wedge comes from the zonal coast of Yucatan (Figure 9D); it advects towards the western side of Campeche during the winter, spring, and summer seasons (Figures 9A–C). Kurczyn et al. (2021), using a combination of observations and models, showed evidence that the origin of upwelling water (Caribbean Subtropical Underwater) off Campeche was brought from the northeast shelf, more than 500 km away from the study area, by advection. Likewise, the low concentrations of modeled salt during autumn, winter, and part of spring (Figure 6G) in the western side of Campeche turned out to be the best tracer of the GURS plume.
Conclusions
The seasonality of the turbidity and its intensification in autumn and winter on the western side of the Campeche platform is due in part to the contribution of the intense flows of the Grijalva-Usumacinta River Systems in autumn (Figure 2) and which are mixed dynamically by the southwest WS, by cyclonic gyres that increase turbidity through Ekman pumping and return currents. In spring-summer, the same forcing persists; however, the turbidity decreases due to the intense zonal winds’ ineffectiveness in producing Ekman transport.
On the zonal side of the Yucatan platform, the influence of waters from the Grijalva-Usumacinta River System plume is ruled out, and the widening of the turbidity strip in autumn and winter would be mainly due to the effectiveness of the effort of the southwest wind in producing upwelling; likewise, the weakening of the turbidity fringe is explained by the ineffectiveness of the zonal WS in producing upwelling.
Data availability statement
The raw data supporting the conclusions of this article will be made available by the authors, without undue reservation.
Author contributions
The authors confirm contribution to the paper as follows: study conception and design: LS-M and AP-S data collection: LS-M and ALF-M. hydrodynamic model (CROCO): ET and AP-S Analysis and interpretation of results: LS-M and ALF-M; draft manuscript preparation: LS-M. All authors reviewed the results and approved the final version of the manuscript.
Funding
The Government of Mexico funded it through the SENER-CONACYT #201441 project called “Implementation of oceanographic observation networks (physical, geochemical, ecological) in the face of possible contingencies related to the exploration and production of hydrocarbons in deep waters of the Gulf of Mexico, as well as through the Frontera Science project, CONACYT key: CF-MG-20191030200716411-1727972 called “Study of the hydrodynamic interaction between coastal lagoons with adjacent Mexican seas.
Acknowledgments
To the “Consorcio de Investigación del Golfo de México” (CIGoM) project and the Universidad del Bío-Bío that made my research stay at “Centro de Investigación Científica y de Educación Superior de Ensenada, Baja California” (CICESE) possible. This research has been funded by the Mexican National Council for Science and Technology CONACYT, project 201441. This is a contribution of the Gulf of Mexico Research Consortium (CIGoM). We acknowledge PEMEX specific request to the Hydrocarbon Fund to further the knowledge on the environmental effects of oil spills in the Gulf of Mexico.
Conflict of interest
The authors declare that the research was conducted in the absence of any commercial or financial relationships that could be construed as a potential conflict of interest.
The handling editor declared a shared affiliation, though no other collaboration, with one of the authors AF at the time of the review.
Publisher’s note
All claims expressed in this article are solely those of the authors and do not necessarily represent those of their affiliated organizations, or those of the publisher, the editors and the reviewers. Any product that may be evaluated in this article, or claim that may be made by its manufacturer, is not guaranteed or endorsed by the publisher.
References
Aguilar-Maldonado J., Santamaría-Del-Ángel E., González A., Cervantes O., Sebastia-Frasquet M.T (2018). Mapping Satellite Inherent Optical Properties Index. In Coastal Waters of the Yucatan Peninsula (Mexico) Sustainability 10, 1894. doi: 10.3390/su10061894
Ali K. A., Ortiz J., Bonini N., Shuman M., Sydow C. (2016). Application of aqua MODIS sensor data for estimating chlorophyll a in the turbid case 2 waters of lake Erie using bio-optical models. GISci. Remote Sens. 53 (4), 483–505. doi: 10.1080/15481603.2016.1177248
Barnett T. P., Patzert W. C. (1980). Scales of thermal variability in the tropical pacific. J. Geophys. Res. 10, 529–540. doi: 10.1175/1520-0485(1980)010<0529:SOTVIT>2.0.CO;2
Belousov I. M., Ivanov Y. A., Pasternak S. A., Rass T. S., Rossov V. V. (1966). Oceanographic research by the soviet-Cuban marine expedition. Oceanology 6, 312–320.
Berrisford P., K˚allberg P., Kobayashi S., Dee D. P., Uppala S. M., Simmons A. J., et al. (2011). ‘Atmospheric conservation properties in ERA-interim’. ERA Rep. Series,ECMWF:Reading,UK.Inpress 137, 1381–1399. doi: 10.1002/qj.864
Bessonov N., Gonzalez O., Elizarov A. (1971). “Resultados de las investigaciones cubano-sovieticas en el banco de campeche,” in Coloquio sobre investigaciones y recursos del mar caribe y regiones adyacentes (UNESCO), 317–323.
Bogodanov D. V., Solokov V. A., Kromov N. S. (1968). Regions of high biological and commercial productivity in the gulf of Mexico and Caribbean Sea. Oceanology 8, 371–381. Available at: http://hdl.handle.net/1969.3/21385.
Bulanienkov S. K., Garcia C. (1973). “Influencia de los procesos atmosfericos en el afloramiento del banco del campeche,” in Curata reunion de balance de trabajo, centro de investigaciones Pesqueras/Instituto nacional de la pesca, vol. 2. (Cuba: Informe de Investigacion), 28.
Carranza-Edwards A., Rosales-Hoz L., Monreal A. (1993). Suspended sediments in the southeastern gulf of Mexico. Mar. Geology 112, 257–269. doi: 10.1016/0025-3227(93)90172-R
Chao Y., Li Z., Farrara J., McWilliams J.C., Bellingham J., Capet X., et al (2009). TDevelopment, implementation nd evaluation of a data-assimilative ocean forecasting system off the central California coast. Deep-Sea Res 56, 100–126. doi: 10.1016/j.dsr2.2008.08.011
Cochrane J. D. (1966). The Yucatan Current, upwelling off Northeastern Yucatan, and currents and waters of Western Equatorial Atlantic. Oceanography of the Gulf of Mexico. Progress Rep 66–23T, 14–32.
Cochrane J. D. (1968). Currents and waters of the eastern gulf of Mexico and western Caribbean, of the western tropical Atlantic ocean, and of the eastern tropical pacific ocean. Dep. Oceanogr. Meteorol. Texas A&M Univ. Ref. 68-8T, 19–28.
Cochrane J. D. (1969). Water and circulation on campeche bank in may. bull. jpn. Soc. fish. Oceanogr. Spec, 123–128. .(Prof. Uda's Commemorative Papers).
Cowles T. J., Desiderio R. A. (1993). Resolution of biological microstructure through in situ fluorescence emission spectra. Oceanography 6, 105–111. doi: 10.5670/oceanog.1993.05
Csanady G. T. (1977). The coastal jet conceptual model in the dynamics of shallow seas. sea 6, 117–144.
Debreu L., Marchesiello P., Penven P., Cambon G. (2012). Two-way nesting in split-explicit ocean models: algorithms, implementation and validation. Ocean Model 49-50, 1–21. doi: 10.1016/j.ocemod.2012.03.003
De Wright L. D. (1995). Morphodynamics of inner continental shelves Vol. 4 (Boca Raton: CRC Press), 50.
Domínguez-Hernández G., Cepeda-Morales J., Soto-Mardones L., Rivera-Caicedo J. P., Romero-Rodríguez D. A., Inda-Díaz E., et al. (2020). Semi-annual variations of chlorophyll concentration on the Eastern tropical pacific coast of Mexico. Adv. Space Res. 65, 2595–2607. doi: 10.1016/j.asr.2020.02.019
Douglas M. W., Maddox C. E., Howard K. (1993). The Mexican monsoon. J. Clim. 6, 1665–1677. doi: 10.1175/1520-0442
Dunn J. R., Ridgway K. R. (2002). Mapping ocean properties in regions of complex topography. Deep Sea Res. Part I: Oceanographic Res. 49 (3), 591–604. doi: 10.1016/S0967-0637(01)00069-3
Fabricius K. E., Logan M., Weeks S. J., Lewis S. E., Brodie J. (2016). Changes in water clarity in response to river discharges on the great barrier reef continental shelf: 2002–2013. Estuar. Coast. Shelf Sci. 173, A1–A15. doi: 10.1016/j.ecss.2016.03.001
Fernández-Novoa D., Gómez-Gesteira M., Mendes R., deCastro M., Vaz N., Dias J. M., et al. (2017). Influence of main forcing affecting the tagus turbid plume under high river discharges using MODIS imagery. PloS One 12 (10), e0187036. doi: 10.1371/journal.pone.0187036
Fernández-Novoa D., Mendes R., Días J., Sánchez-Arcilla A., Gómez-Gesteira M. (2015). Analisys of the influence of river discharge ans wind on the ebro turbid plume using MODIS-aqua and MODIS-Terra data. J. Mar. Syst. 142, 40–46. doi: 10.1016/j.jmarsys.2014.09.009
Furnas M. J., Smayda T. J. (1987). Inputs of subthermocline waters and nitrate onto the campeche bank. Cont. Shelf Res. 7, 161–175. doi: 10.1016/0278-4343(87)90077-X
Gangloff A., Verney R., Doxaran D., Ody A., Estournel C. (2017). Investigating rhoˆne river plume gulf of lions, France dynamics using metrics analysis from the MERIS 300m ocean color archive 2002–2012. Cont. Shelf Res. 144, 98–111. doi: 10.1016/j.csr.2017.06.024
Goñi M. A., Hatten J. A., Wheatcroft R. A., Borgeld J. C. (2013). Particulate organic matter export by two contrasting small mountainous rivers from the pacific Northwest, U.S.A. J. Geophys. Res. Biogeosci. 118, 112–134. doi: 10.1002/jgrg.20024
Gordon H. R., Voss K. J. (2004). MODIS Normalized Water-leaving Radiance. MODIS Algorithm Theoretical Basis Document, 121.
GEOGLOWS. (2017). Global Streamflow Forecasting. https://geoglows.amerigeoss.org/.
Hersbach H., Bell B., Berrisford P., Hirahara S., Horányi A., Muñoz-Sabater J., et al. (2020). The ERA5 global reanalysis. Q. J. R. Meteorological Soc. 146 (730), 1999–2049. doi: 10.1002/qj.3803
Horner-Devine A. R., Fong D. A., Monismith S. G., Maxworthy T. (2006). Laboratory experiments simulating a coastal river inflow. J. FluidMech. 55 (5), 203–232. doi: 10.1017/S0022112006008937
Hudson P. F., Hendrickson. D. A., Benke. A. C., Varela-Romero. A., Rodiles-Hernández R., Minckley W. L. (2005). Rivers of Mexico. In Benke A. C., Cushing C. E. Eds. Rivers of North America. Book description The 2005 Award for Excellence in Professional and Scholarly Publishing by the Association of American Publishers (AAP), 1030–1084. doi: 10.1016/B978-012088253-3/50026-2
Jouanno J., Pallàs-Sanz E., Sheinbaum J. (2018). Variability and dynamics of the Yucatan upwelling: high-resolution simulations. J. Geophys. Res. Oceans 123, 1251–1262. doi: 10.1002/2017jc013535
Kelly K. A. (1985). The influence of winds and topography on the surface temperature patterns over the northern California slope. J. Geophys. Res. 90, 11,783–11,798. doi: 10.1029/JC090iC06p11783
Klemas V. (2012). Remote sensing of coastal plumes and ocean fronts: Overview and case study. J. Coast. Res. 278, 1–7. doi: 10.2112/JCOASTRES-D-11-00025.1
Kulshreshtha A., Shanmugam P. (2016). “Estimation of turbidity in coastal waters using satellite data,” in Proceedings of SPIE - The International Society for Optical Engineering, 987805. doi: 10.1117/12.2223544
Kurczyn J. A., Appendini C. M., Beier E., Sosa-López A., López-González J., Posada-Vanegas G. (2020). Oceanic and atmospheric impact of central American cold surges (Nortes) in the gulf of Mexico. Int. J. Climatol. 41, E1450–E1468. doi: 10.1002/joc.6779
Kurczyn J., Duran R., Beier E., Souza A. (2021). On the advection of upwelled water on the Western Yucatan shelf. Front. Mar. Sci., Sec. Coastal Ocean Processes 8, 23452. doi: 10.3389/fmars.2021.723452
Lambert C. D., Bianchi T. S., Santschi P. H. (1999). Cross-shelf changes in phytoplankton community composition in the gulf of Mexico (Texas shelf/slope): use of plant pigments as biomarkers. Continental Shelf Res. 19, 1–21. doi: 10.1016/S0278-4343(98)00075-2
Martínez-López B., Pares-Sierra A. (1998). Circulation in the gulf of méxico induced by tides wind and the yucatan current. Cienc. Mar. 24, 65–93. doi: 10.7773/cm.v24i1.740
McCabe R. M., MacCready P., Hickey B. M. (2009). Ebb-tide dynamics and spreading of a large river plume. J. Phys. Oceanogr. 39, 2839–2856. doi: 10.1175/2009JPO4061.1
Mendes R., Saldías G. S., de Castro M., Gómez-Gesteira M., Vaz N., Dias J. M. (2017). Seasonal and interannual variability of the douro turbid river plume, northwestern Iberian peninsula. Remote Sens. Environ., 401–411. doi: 10.1016/j.rse.2017.04.001
Mendes R., Vaz N., Fernández-Nóvoa D., da Silva J., Gómez-Gesteira M., Dias J. (2014). Observation of a turbid plume using MODIS imagery: The case of douro estuary (Portugal). Remote Sens. Environ. 154, 127–138. doi: 10.1016/j.rse.2014.08.003
Merino M. (1997). Upwelling on the Yucatan shelf: hydrographic evidence. J. Mar. Syst. 13, 101–121. doi: 10.1016/s0924-7963(96)00123-6
Michael S., Hales W. B., Chase Z., Wheeler P., Whitney M. (2006). Riverine input of macronutrients, iron, and organic matter to the coastal ocean off Oregon, U.S.A., during the winter. Limnology Oceanography 51 (5), 2221–2231. doi: 10.4319/lo.2006.51.5.2221
Monreal-Gómez A., Salas de León D., Padilla A. R., Alatorre M. A. (1992). Hydrography and estimation of density currents in the southern part of the bay of campeche, Mexico. Cienc. Marinas 18 (4), 115–133. doi: 10.7773/cm.v18i4.908
Morel A., Bélange S. (2006). Improved detection of turbid waters from ocean color sensors information. Remote Sens. Environ. 102, 237–249. doi: 10.1016/j.rse.2006.01.022
Müller-Karger F. E., Walsh J. J., Evans R. H., Meyers M. B. (1991). On the seasonal phytoplankton concentration and sea surface temperature cycles of the gulf of Mexico as determined by satellites. J. Geophys. Res. 96 (C7), 12645–12665. doi: 10.1029/91jc00787
Nezlin N. P., DiGiacomo P. M. (2005). Satellite ocean color observations of stormwater runoff plumes along the San Pedro shelf southern California during 1997–2003. Cont. Shelf Res. 25 (14), 1692–1711. doi: 10.1016/j.csr.2005.05.001
Okolodkov Y. B. (2003). A review of Russian plankton research in the gulf of Mexico and the Caribbean Sea in the 1960–1980s. Hidrobiológica 13, 207–221. Available at: https://hidrobiologica.izt.uam.mx/index.php/revHidro/article/view/1126.
Penven P., Debreu L., Marchesiello P., McWilliams J. C. (2006). Application of theROMS embedding procedure for the central California upwelling system. OceanModel. 12, 157–187. doi: 10.1016/j.ocemod.2005.05.002
Perez R., Muller-Karger F. E., Victoria I., Melo N. (1999). Cuban, Mexican, U. S. reserachers probingmysteries of Yucatan currents. Eos Trans. AGU 80 153, 158–159.
Petus C., Collier b C., Devlin M., Rasheed M., McKenna S. (2014). Using MODIS data for understanding changes in seagrass meadow health: A case study in the great barrier reef (Australia). Mar. Environ. Res. 98, 68–85. doi: 10.1016/j.marenvres.2014.03.006
Pica-Granados Y., Pineda-López R. (1991). “Golfo de méxico y mar caribe, oceanografía física,” in Oceanografía de mares mexicanos. Ed. En de la Lanza G.(México: AGT Editor), 31–79.
Reyes-Mendoza O., Mariño-Tapia I., Herrera-Silveira J., Ruiz-Martínez G., Enriquez C., Largier J. L. (2016). The effects of wind on upwelling off cabo catoche. J. Coast. Res. 32, 638–650. doi: 10.2112/JCOASTRES-D-15-00043.1
Ridgway K. R., Dunn J. R., Wilkin J. L. (2001). Ocean interpolation by 4- dimensional weighted least squares application to the waters around Australasia. J. Atmospheric Oceanic Technol. 19, 1357–1375. doi: 10.1175/1520-0426(2002)019<1357:OIBFDW>2.0.CO;2
Romero-Rodríguez D., Soto-Mardones L., Cepeda J., Rivera J., Inda. E. (2020). Satellite-derived turbidity in front of small rivers mouths in the Eastern tropical pacific coast of Mexico. Adv. Space Res. 66, 2349–2364. doi: 10.1016/j.asr.2020.08.007
Ruíz-Castillo E., Gomez-Valdés J., Sheinbaum J., Rioja-Nieto R. (2016). Wind-driven coastal upwelling and westward circulation in the Yucatan shelf. Continent. Shelf Res. 118, 63–76. doi: 10.1016/j.csr.2016.02.010
Ruiz-Renteria F. (1979). Upwelling north of the Yucatan peninsula (Master’s thesis) (Texas: Texas A&M University).
Saavedra-Guerrero A., López-López D. M., Castellanos Fajardo L. A. (2015). Descripción del medio físico de la cuenca media del río Usumacinta en México. in Carabias J., de la Maza J., Cadena R. Conservación y desarrollo sustentable en la Selva Lacandona México: 25 años de actividades y experiencias, 19–34.
Saldías G., Lara C. (2020). Satellite-derived sea surface temperatura fronts in a river-influenced coastal upwelling área off central-southern Chile. Regional Stud. Mar. Sci. 37, 101322. doi: 10.1016/j.rsma.2020.101322
Saldías G. S., Sobarzo M., Largier J., Moffat C., Letelier R. (2012). Seasonal variability of turbid river plumes off central Chile based on high-resolution MODIS imagery. Remote Sens. Environ. 123, 220–233. doi: 10.1016/j.rse.2012.03.010
Saldías G. S., Sobarzo M., Quiñones R. (2018). Freshwater structure and its seasonal variability off western Patagonia. Prog. Oceanogr. 17 (4), 143–153. doi: 10.1016/j.pocean.2018.10.014
Saldías G. S., Largier J. L., Mendes R., Pérez-Santos I., Vargas C. A., Sobarzo M. (2016). Satellite-measured interannual variability of turbid river plumes off central-southern Chile: Spatial patterns and the influence of climate variability. Prog. Oceanogr. 146, 212–222.
Sánchez A. J., Salcedo M. A., Florido R., Mendoza J. D., Ruíz-Carrera V., y Álvarez-Pliego N. (2015). Ciclos de inundación y servicios ambientales en grijalva-usumacinta. ContactoS 97, 5–14. Available at: http://www.izt.uam.mx/newpage/contactos/index.php/es/.
Schofield O., Arnone R. A., Bissett W. P., Dickey T. D., Davis C. O., Finkel Z., et al. (2004). Watercolors in the coastal zone: What can we see? Oceanography 17, 24–31. doi: 10.5670/oceanog.2004.44
Shchepetkin A., McWilliams J. C. (1998). Quasi-monotone advection schemes based on explicit locally adaptive dissipation. Monthly Weather Rev. 126, 1541–1580. doi: 10.1175/1520-0493(1998)126<1541:QMASBO>2.0.CO;2
Shi W., Wang M. (2007). Detection of turbid waters and absorbing aerosols for the MODIS ocean color data processing. Remote Sens. Environ. 110, 149–161. doi: 10.1016/j.rse.2007.02.013
Signoret M., Bulit C., Pérez R. (1998). Patrones de distribución de clorofila ay producción primaria en aguas del golfo de méxico y del mar caribe. Hidrobiológica 8, 81–88. Available at: https://hidrobiologica.izt.uam.mx/index.php/revHidro/article/view/712.
Smith W. H., Sandwell D. T. (1997). Global Sea floor topography from satellite altimetry and ship depth soundings. Science 277, 1956–1962. doi: 10.1126/science.277.5334.1956
Syvitski J. P., Vorosmarty C. J., Kettner A. J., Green P. (2005). Impact of humans on the flux of terrestrial sediment to the global coastal ocean. Science 3085720, 376–380. doi: 10.1126/science.1109454
Thomas A. C., Weatherbee R. A. (2006). Satellite-measured temporal variability of the Columbia river plume. Remote Sens. Environ. 100, 167–178. doi: 10.1016/j.rse.2005.10.018
Toledo A. (2003). “Hacia un análisis integrado de las regiones hidrológicas de méxico,” in Ríos, costas, mares (México D.F: Instituto Nacional de Ecología/ El Colegio de México, A.C./ El Colegio de Michoacán, A.C).
Vargas C. A., Arriagada N. L., Sobarzo M., Contreras P. Y., Saldías. G. (2013). Bacterial production across a river-to-ocean continuum in central Chile: implications for organic matter cycling. Aquat. Microbial Ecol. 68, 195–121. doi: 10.3354/ame01608
Wattelez G., Dupouy C., Lefevre J., Ouillon S., Fernandez J. M., Juillot F. (2017). Application of the support vector regression method for turbidity assessment with MODIS on a shallow coral reef (lagoon voh-Kone´-Pouembout, new Caledonia). Water 9 (10), 737. doi: 10.3390/w9100737
Yáñez-Arancibia A., Day J. W., y Currie-Alder B. (2009). Functioning of the grijalva-usumacinta river delta, Mexico: challenges for coastal management. Ocean Yearbook 3, 479–507. doi: 10.1109/JSTARS.2014.2380785
Zamudio L., Hurlburt H. E., Metzger E. J., Tilburg C. E. (2007). Tropical wave-induced oceanic eddies at cabo corrientes and the maria islands, Mexico. J. Geophysical Research: Oceans 112 (C5), C05048. doi: 10.1029/2006JC004018
Zavala-Hidalgo J., Fernández-Eguiarte A. (2007) 968-817, 807–801. (compiladores), SEMARNAT-INE, ISBN.
Zavala-Hidalgo J., Gallegos-Garcia A., Martinez-Lopez B., Morey S. L., O’Brien J. J. (2006). Seasonal upwelling on the western and southern shelves of the gulf of mexica. Ocean dynamics 56, 333–338. doi: 10.1007/s10236-006-0072-3
Zavala-Hidalgo J., Morey S. L., O’Brien J. J. (2003). Seasonal circulation on the western shelf of the gulf of Mexico using a high-resolution numerical model. J. Geophys. Res. 108, C12. doi: 10.1029/2003jc001879
Keywords: Grijalva-Usumacinta river system, remote sensing reflectance, suspended particles, turbidity, wind stress
Citation: Soto-Mardones L, Parés-Sierra A, Ticse de la Torre KE and Flores-Morales AL (2023) Effect of the Grijalva-Usumacinta system on the circulation adjacent to the eastern shelf of Yucatan. Front. Mar. Sci. 9:1034644. doi: 10.3389/fmars.2022.1034644
Received: 01 September 2022; Accepted: 30 November 2022;
Published: 05 January 2023.
Edited by:
Francisco Delgadillo-Hinojosa, Autonomous University of Baja California, MexicoReviewed by:
Cecile Dupouy, UMR7294 Institut Méditerranéen d’océanographie (MIO), FranceJesus Antonio Aguilar Maldonado, Universitat Politècnica de València, Spain
Copyright © 2023 Soto-Mardones, Parés-Sierra, Ticse de la Torre and Flores-Morales. This is an open-access article distributed under the terms of the Creative Commons Attribution License (CC BY). The use, distribution or reproduction in other forums is permitted, provided the original author(s) and the copyright owner(s) are credited and that the original publication in this journal is cited, in accordance with accepted academic practice. No use, distribution or reproduction is permitted which does not comply with these terms.
*Correspondence: Luis Soto-Mardones, bHNvdG9AdWJpb2Jpby5jbA==