 Matthew R. First1*
 Stephanie H. Robbins-Wamsley1Scott C. Riley2Jonathan F. Grant3
 Vanessa Molina2
 Timothy P. Wier2
- 1Chemistry Division, U.S. Naval Research Laboratory, Washington, DC, United States
- 2Excet Inc., Springfield, VA, United States
- 3Battenkill Technologies, Inc., Manchester Center, VT, United States
International limits on the concentrations of living organisms in ballast water are now in force for commercial ships. Microscopy-based, “direct count” assays estimate the concentrations of organisms. These assays are used in performance tests of Ballast Water Management Systems (BWMSs), which are shipboard technologies designed to reduce living organisms in ballast water to below the discharge limits. Here, we examine the factors that affect the method detection limit (MDL) of direct count assays. The MDL depends upon the volumes sampled, concentrated (or diluted), and analyzed, so the MDL will vary as these volumes vary from analysis-to-analysis. Decreasing the MDL to detect exceedingly rare individuals (e.g., ~1 individual per m3 or fewer) is possible, but problematic, given the challenges in analyzing dynamic communities of living organisms: increasing sample and analysis volumes to lower the MDL will likely accelerate the loss of individuals, as organisms are concentrated to several orders of magnitude above in situ concentrations and held for extended times. Results of direct count assays may be widely disseminated as an indicator of the performance of BWMSs, and when no organisms are detected, concentrations may be shown as “0 organisms per m3 or mL” rather than “<MDL”, as appropriate. When clearly derived and reported, a numerical MDL for the direct count assay—the lowermost value distinct from “zero”—provides context to results and transparency into the sensitivity of the assay.
Introduction
Direct count assays estimate concentrations of free-living, aquatic microorganisms by tallying individuals detected within a known sample volume. The individuals may be entrained in a flow stream and detected through optical scattering, image analysis, or other methods. The individual microorganisms may also be tallied during manual scan of a discrete volume, such as contained in a gridded, counting chamber, viewed under magnification. The latter approach—direct counts via microscopy—is well-suited to quantifying mixed assemblages of protists and microinvertebrates, and it has been adapted as a standard analytical approach to quantify organisms in evaluations of Ballast Water Management Systems (BWMSs), which are used aboard ships to treat large volumes of ballast water prior to discharge (Sayinli et al., 2022).
Water treated with an effective BWMS will likely have low concentrations of organisms (e.g., ~10 individuals per m3 of organisms ≥50 µm, or fewer). To quantify sparse populations in treated water, analysts concentrate organisms, e.g., with mesh netting such as the fabric used in a plankton net, sized to retain individuals larger than nominal openings of the mesh. The volume of the concentrated sample (C) may be orders of magnitude smaller than the sample volume (S). For example, standard test methods for evaluating BWMSs require that a sample of 3 m3 be concentrated to 1 L to quantify sparse populations of organisms ≥50 µm in minimum dimension (US EPA, 2010; Marine Environmental Protection Committee (MEPC), 2018). Typically, only a portion of the concentrated sample is analyzed, given a limited “shelf-life” of samples of living organisms and the time required for analysis. Microscopists repeatedly scan aliquots of the concentrated sample—continuing this example, in 1 to 5 mL increments, based upon the capacity of the counting chamber—and tally all organisms in the accumulated volume of sample analyzed (A).
Direct counts of organisms are discrete data, and methods for determining a Method Detection Limit (MDL) recommended for continuous data are not relevant (US EPA, 2016). Here, given the importance of MDLs for understanding the limitations of BWMS testing data, our goal is to consider the factors that affect the MDL for direct count assays. First, we demonstrate how the volumes defined above—C, S, and A—affect the MDL. Second, we incorporate confidence intervals around zero values, which effectively increase the MDLs and identify the minimum value that is significantly distinct (e.g., with >95% probability) from zero. Finally, we address measurement uncertainty and the factors that may influence systematic error. When presented along with the results of direct counts, the MDL, confidence intervals, and measurement uncertainty provide context to the results, especially in instances where the reported outcome is, e.g., “0 individuals per m3” or “none detected”.
This discussion applies to analyses of ballast water in the context of performance testing of BWMS, however, the general principles apply to shipboard sampling and analysis for compliance, as well as to basic research and experimentation. In general, these considerations apply broadly to other measurements based upon discrete data and produced through a sophisticated sampling and analytical procedure.
Direct count methods
Regulations on ballast discharge define two categories of organisms based upon the size of the individual: organisms ≥10 and <50 µm in minimum dimension are limited to fewer than 10 per mL; organisms ≥50 µm are limited to fewer than 10 per m3 (International Maritime Organization (IMO), 2004; United States Coast Guard (USCG), 2012). The analytical methods for these two size classes use direct-count approaches, designed to detect living organisms in the two categories (United States Environmental Protection Agency (US EPA), 2010; Marine Environmental Protection Committee (MEPC), 2018). In general, the direct count methods are performed by microscopists, who scan a volume of water and tally individuals within that volume determined to meet the size and vitality requirements. Specific details of the methods for ≥10 and <50 µm and ≥50 µm are described below:
For organisms ≥10 and <50 µm, analysts tally living organisms based on (1) motility, and (2)fluorescence of molecular probes that are engineered to fluoresce upon enzyme transformation and accumulate in the cytoplasm of living cells (e.g., Steinberg et al., 2011). Analyses typically occur in a Sedgwick Rafter counting chamber with ~1 mL capacity, gridded into 1000 squares, each representing ~1 µL of the sample volume (McAlice, 1971).
For organisms ≥50 µm, analysts tally moving organisms, and if organisms are not moving, the analysts may attempt to stimulate movement. Analyses typically occur in a Bogorov Counting Chamber, which is an acrylic block with one or more channels that hold 5 mL or more of sample water. The channels are sized such that the entire width should fit within a microscope’s field of view, given the typical magnification required to detect organisms ≥50 µm. The analysts scan the length of the chamber, following the channel along its bends and switchbacks. Chambers are uncovered, and analysts may interrogate the sample as they scan along the chamber, e.g., using a narrow probe to separate aggregates, reposition obstructions, or stimulate stationary individuals to movement. Note that non-motile organisms and resting stages add complexity to this analysis, but these complications are beyond the scope of this work.
Concentration estimates
For both methods, the concentration of the population (P) meeting the size and vitality characteristics is calculated based upon the tally of individuals (I, ind.) following the equation below (Eq.1):
The volumes C, S, and A are described above. An additional factor, D, is the dilution of the sample. Dilution is most relevant for untreated samples, where high concentrations of organisms—especially when moving—impede manual counting, so diluting the sample is necessary. For analysis of organisms ≥10 and<50 µm, D also represents the small volumes of fluorophores or suspensions of microbeads added to the samples (First et al., 2020). Dilution is calculated as the sum of diluent and sample volumes relative to the volume of sample, and values of D are ≥1 (where D = 1 indicates that the sample was not diluted). An example calculation is shown below (Box 1). This example (and other examples herein) uses values reflecting a direct count analysis of the ≥50 µm size class, however, these general examples apply to analyses of the ≥10 and <50 µm, as well.
Box 1
Example of a calculation for a direct count analysis of organisms ≥50 µm Example volumes used here are the same as those in the U.S. test protocol (US EPA, 2010) for organisms ≥50 µm: sample volume, S = 3 m3; concentration sample volume, C = 1000 mL; and analysis volume, A = 20 mL. In this example, the measurement assumes a Poisson distribution, and there is no dilution or addition of reagents, so D = 1.
Given these values, a single individual (I, ind.) encountered during the analysis volume of 20 mL represents a population concentration of 17 individuals per m3.
This value (rounded to the nearest integer) is the MDL for the sample volumes in the example above. Effectively, concentrations up to 16 individuals per m3 are below the MDL and would not be detected.
Examples of typical values for direct count analyses of organism ≥10 and <50 µm are shown elsewhere (First et al., 2020).
With the values shown in Box 1, the absence of organisms (I = 0) in the analysis volume (A) yields a population concentration of 0 living organisms per m3 in the ≥50 µm size class. However, given the MDL of the analysis, this estimate is most appropriately reported as <17 ind. per m3.
Method detection limits
Commonly, analytical techniques produce continuous data, such that a measurement value may fall between any numerical interval. For continuous data, test personnel determine MDL using one of several standard approaches like those proposed by the US Environmental Protection Agency (US EPA, 2016), which is also codified into the US Code of Federal Regulations (40 CFR Appendix B to Part 136). For example, MDL is the greater of two values produced from the following approaches:
•The standard deviation (SD) is measured from multiple readings (n) of a sample spiked with the analyte. The analyte is spiked to concentrations 2 to 10 times the presumed MDL. Then, the SD is multiplied by the Student’s t-value that represents n-1 degrees of freedom and α = 0.01. This product is considered the MDL.
•The mean and SD of n blank samples is determined. The sum of the mean plus the SD is then multiplied by the appropriate Student’s t-value to yield the MDL.
Direct counts of organisms, in contrast, produce discrete data, and the approaches described above are not applicable (see Chik et al., 2018). Concentrations of organisms are based upon the number of discrete individuals (I = 0, 1, 2, 3…). Method blanks will have zero organisms (I=0), so the MDL, therefore, occurs when I = 1. However, the MDL should also consider the general approach used for continuous data, where the MDL considered the probability distribution of “zero” values, such that the MDL is the lowest value that is statistically greater than zero. The following sections discuss these facets of the MDL: 1. the concentration represented by one individual, and 2. the confidence interval surrounding counts of zero individuals.
The “value” of one individual
Actual concentrations are based upon the number of individuals counted, and the water volumes sampled, concentrated, and analyzed. Therefore, a single individual will represent different concentrations based upon sampling and analysis volumes according to Eq.1 and demonstrated in Box 1. For this reason, MDLs may be reported as fractions of a whole number (including <1 organism), even though counts of individuals are integers. Throughout the following discussion, which includes ranges of MDLs and approaches to adjust MDLs, it is important to emphasize that these MDLs are based upon the detection of a single individual (i.e., I = 1 ind.).
When measuring treated ballast water, analysts must adjust volumes to achieve an MDL of ≤10 per m3 (as noted above, the following examples consider direct counts of the ≥50 µm size class but are generally applicable for analyses of organisms ≥10 and <50 µm). Increasing S, decreasing C, or increasing A will lower the MDL. Some considerations for each of these adjustments follow:
•Increasing S requires foreplanning, as the sampling ports and probes (sensu Wier et al., 2015), piping, pumps, and plankton nets must be upsized to conduct representative sampling and meet the capacity of higher sampling rates. Larger quantities of S will lower MDL. Figure 1 shows MDLs for 1, 3, 5, 10, 30, and 60 m3.
•Decreasing C would decrease the analytical burden: e.g., if the 1000 mL volume recovered from a plankton net is further concentrated to 500 mL, each mL analyzed represents twice the volume of the total sample. Decreasing C, however, introduces the risk of loss of organisms, which may occur during the secondary filtration process or through bottle-effects (e.g., Nogueira et al., 2014), especially as the respiration of microbe-laded aggregates will deplete oxygen. In Figure 1, C is set to 1000 mL.
•Increasing A will proportionally lower the MDL up until the end point where A is equal to C (the entire sample volume is analyzed). These minimum MDLs for each S are labeled in Figure 1. In practice, increases in A may be limited by the ‘shelf life’ of the sample. Generally, analyses of BW samples should be completed within 6 hours of collection, or sooner as required by prevailing circumstances (United States Environmental Protection Agency (US EPA), 2010). In this case, increases in A require faster per capita counting rates or additional analysts.
Changes to S, C, or A to lower MDLs introduce tradeoffs. In addition to those mentioned above, a larger volume of sample could also result in increased handling time, leaving less time for analysis. The suspended solids within the larger volume will also be concentrated; these already can increase the time required for microscopic analysis. Additionally, the filters used to concentrate the sample may more readily clog due to the increased load, potentially reducing the effective pore size and resulting in the concentrated sample containing additional debris and organisms smaller than the target size class. From Figure 1, reducing MDL tenfold—from the current best case of 0.3 to 0.03 m-3)—requires tenfold increase in sample volume (from 3 to 30 m3). This is a significant volume of water to both collect and concentrate to 1 L.
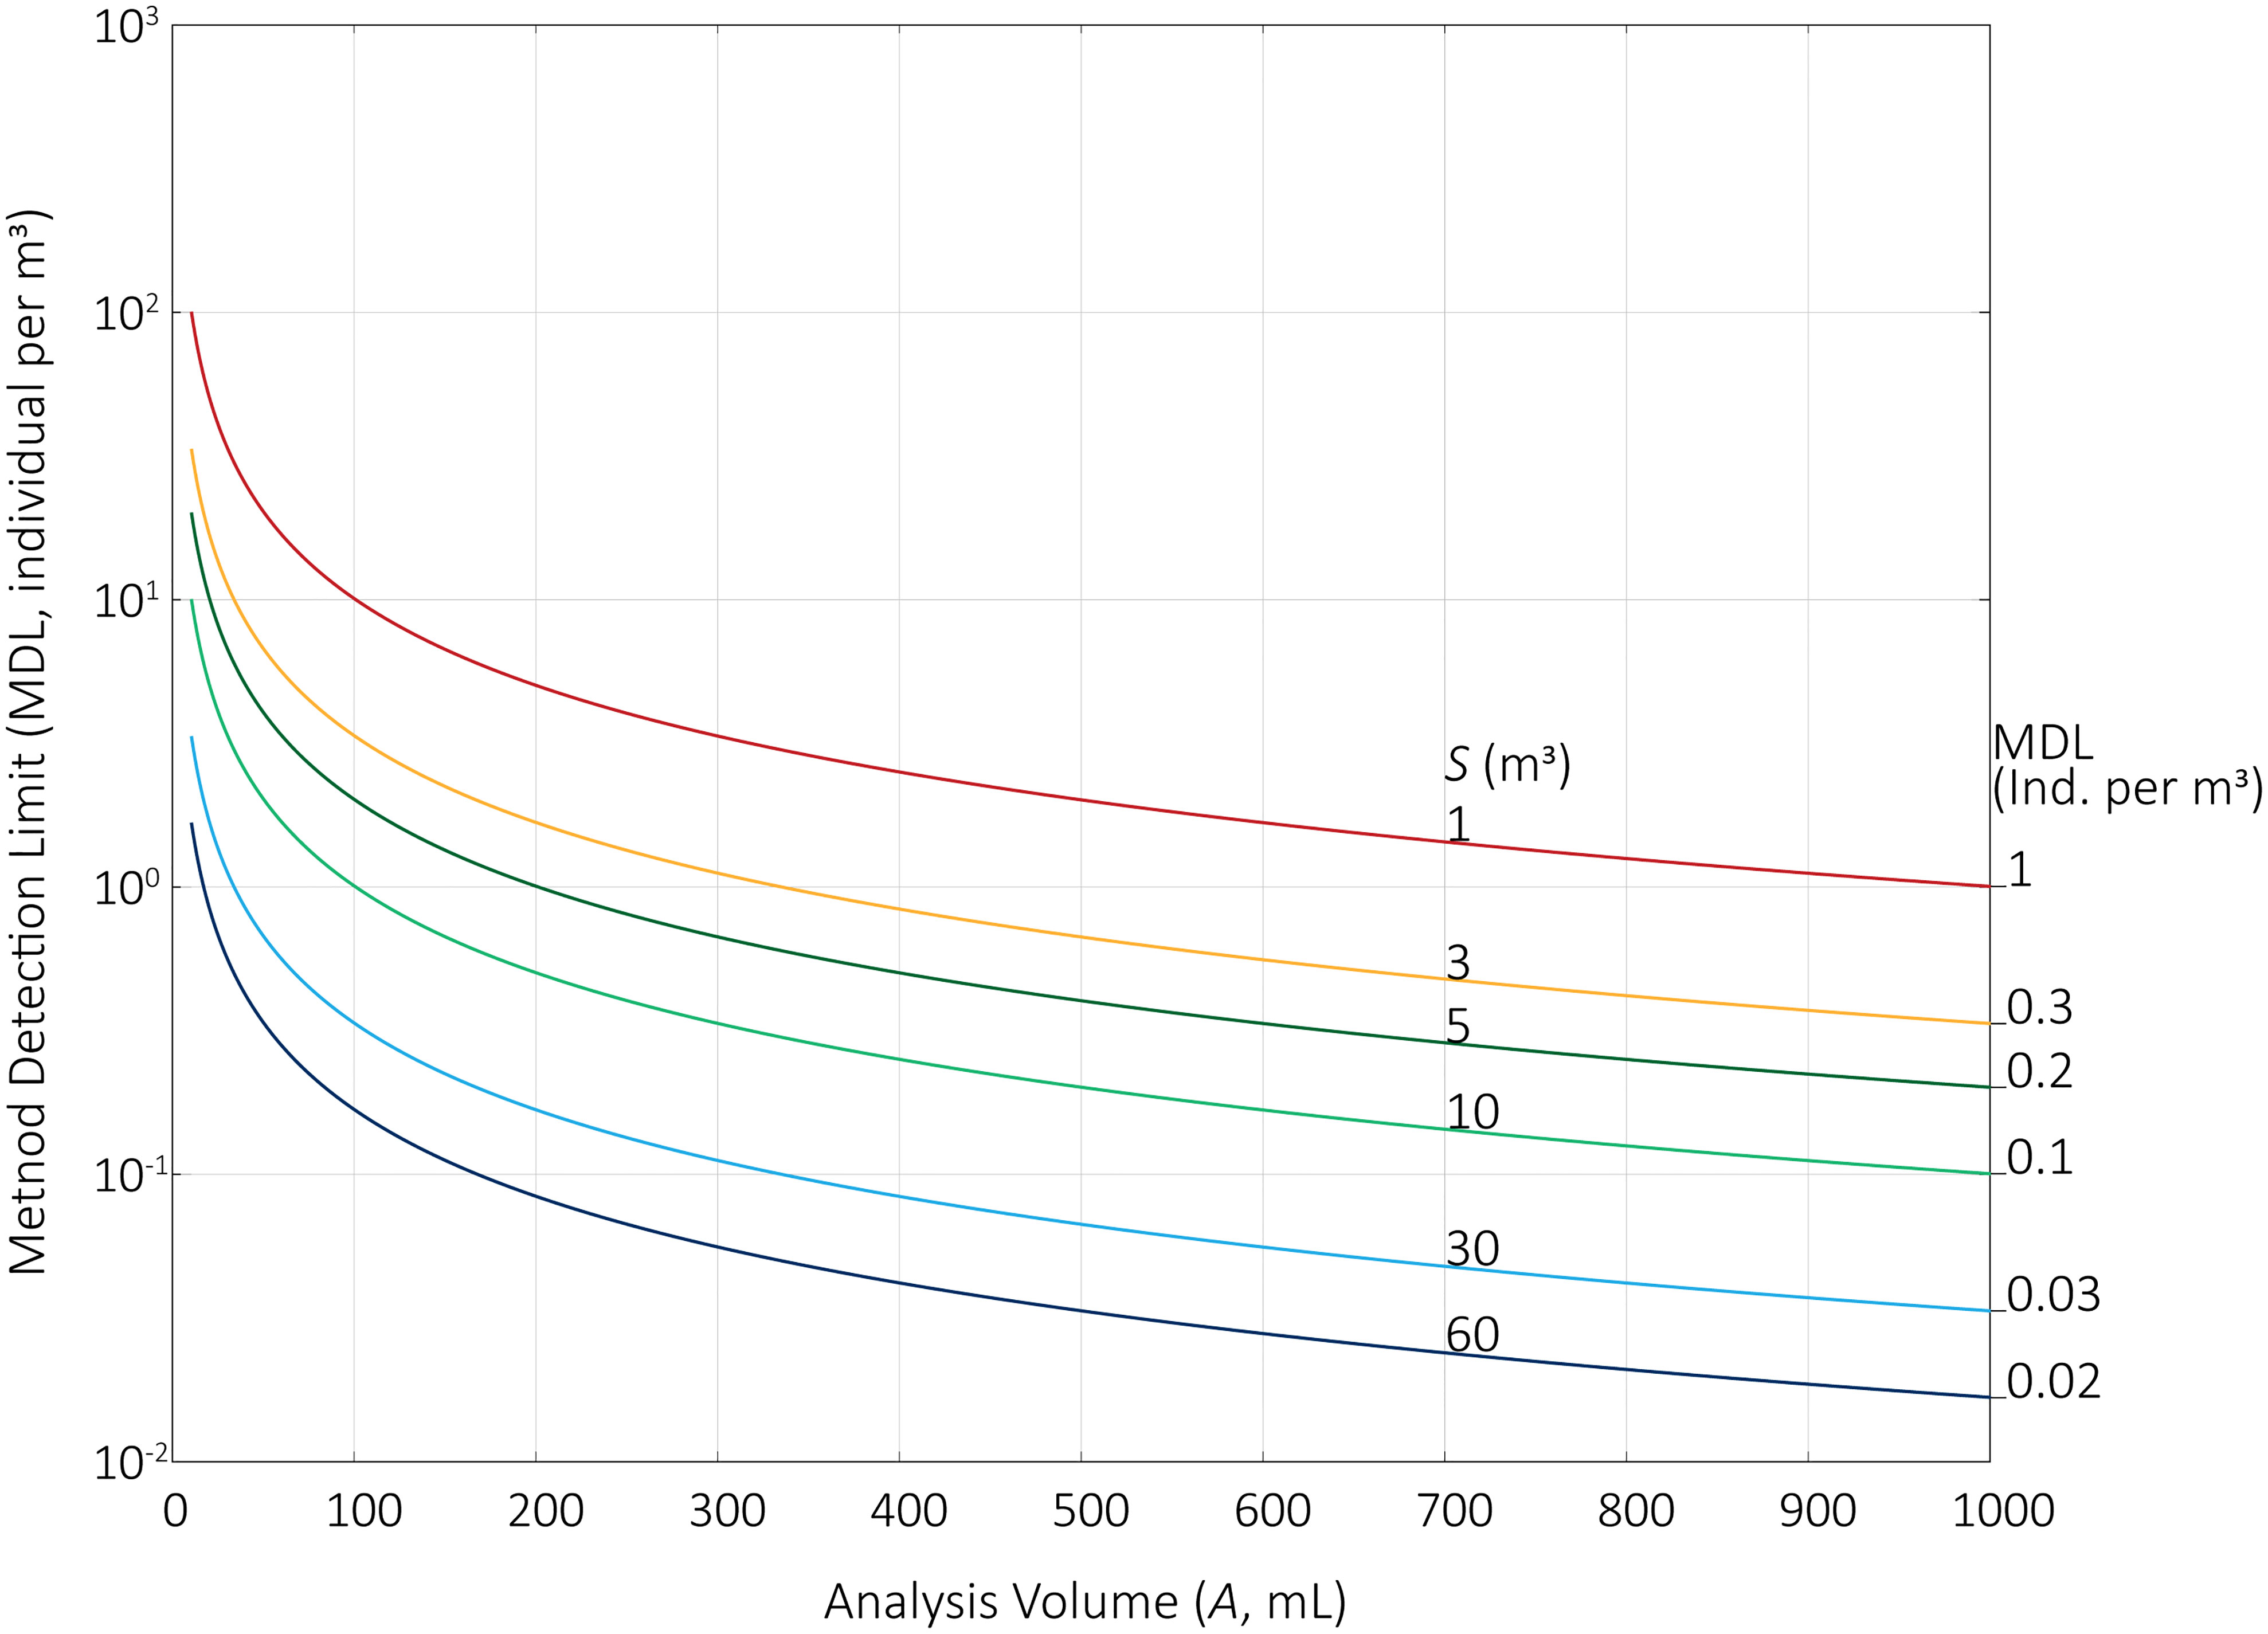
Figure 1 Method detection limits (MDL) for total sample volumes (S) of 1, 3, 5, 10, 30, and 60 m3. Analysis volumes (A) range from 10 to 1000 mL for a concentrated sample volume (C) of 1000 mL. Maximum MDLs (where A = C) are listed for each S. MDLs assume 100% recovery during sample collection and handling, and 100% detection of living organisms during counting.
Confidence intervals surrounding zero
The confidence intervals (CIs) for sparsely concentrated organisms are calculated by the formulas for Poisson CI (United States Environmental Protection Agency (US EPA), 2010). The upper CI formula uses the critical value from the Chi-Squared (χ2) distribution based upon the number of organisms (N) and a chosen significance level (e.g., α = 0.05). Values of N are integers ≥0. For the upper confidence interval, χ2 is determined at 2(N+1) and 1–α (0.95):
When N = 0 (i.e., no organisms are detected), 2(N+1) = 2, χ2 = 5.99, and = 2.99. Therefore, the 95% upper CI is effectively equal to the MDL multiplied by a factor of ~3 (Note: for a 99% upper CI, the multiplication factor is ~4.6).
The values shown in Figure 2 represent 95% upper confidence limits where no (zero) organisms were detected. When A reached its maximum (i.e., the entire concentrated sample is analyzed), the 95% UCIs ranged from 3 to 0.05 individuals per m3 (restated, 5 individuals per 100 m3 or simply 1 individual per 20 m3). MDLs incorporate measures of statistical dispersion and probability to determine whether a measurement is distinct from blanks (US EPA, 2016). This general principle should also apply for discrete data, too: the MDLs for the direct count data should adjust the MDL to the upper CIs for zero.
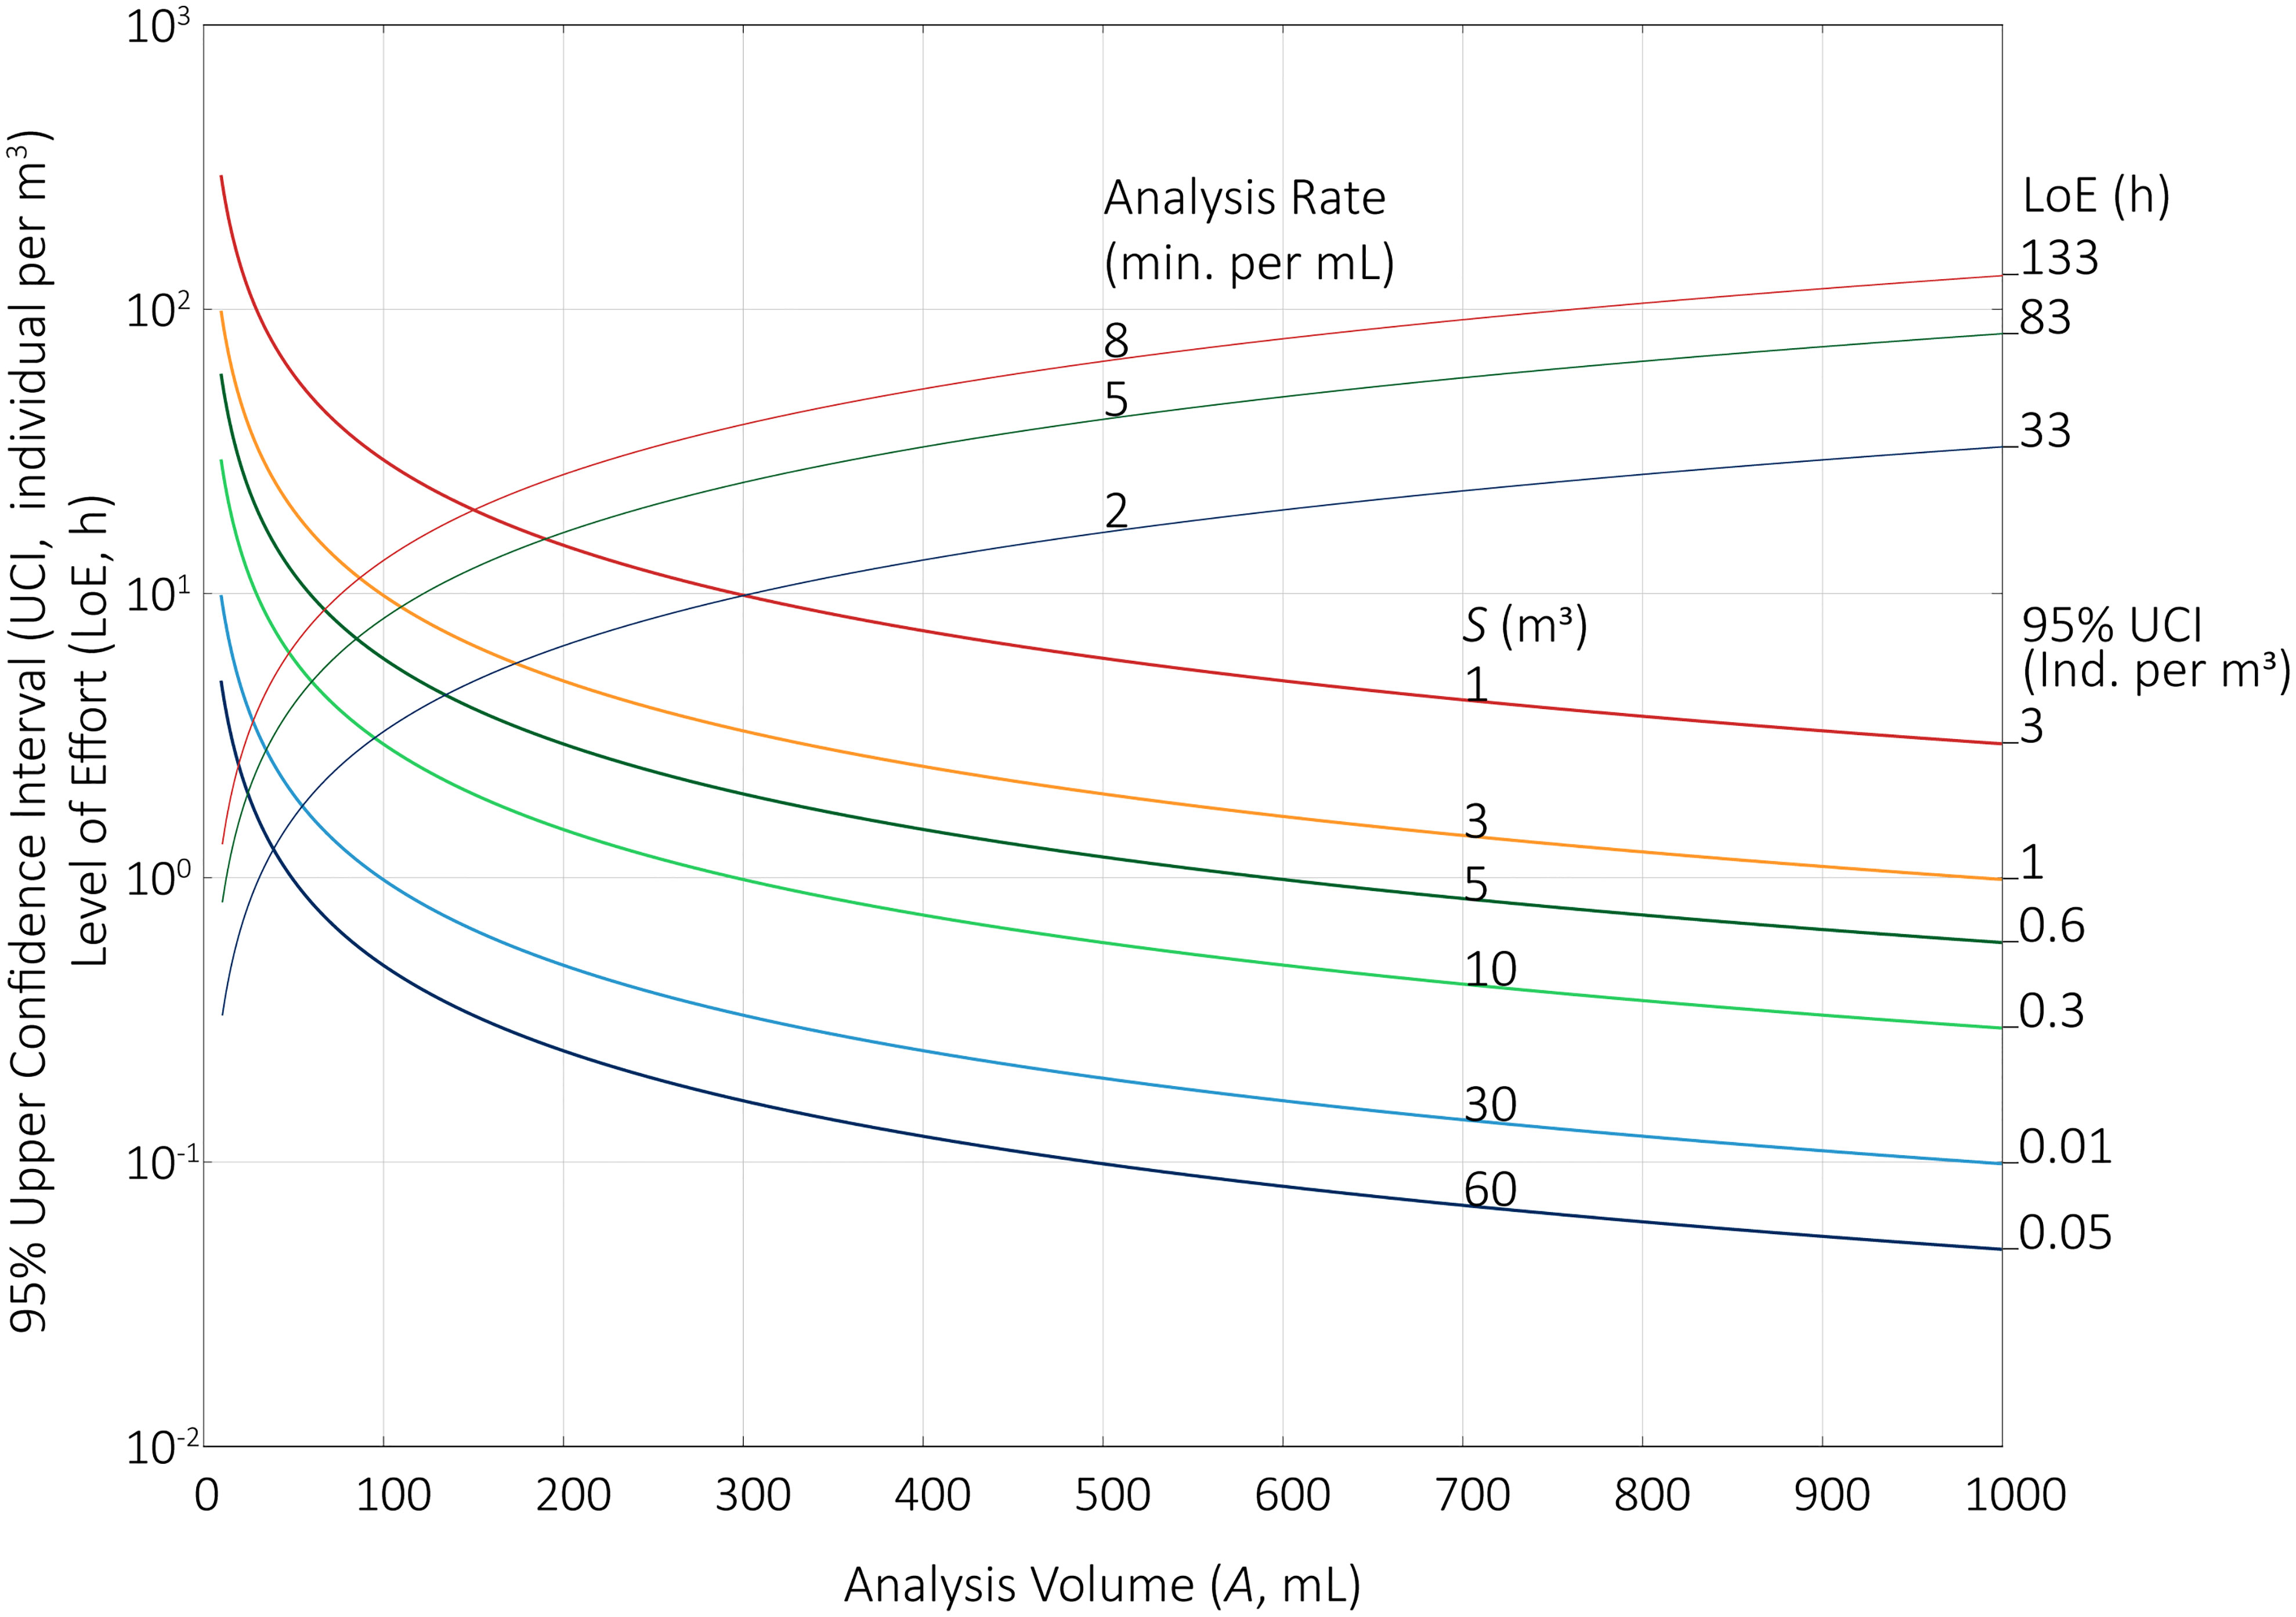
Figure 2 95% upper CI (MDL) for total sample volumes (S, m3) of 1, 3, 5, 10, 30, and 60 m3 when no living organisms are detected during analysis (i.e., I = 0). Analysis volumes (A, mL) range from 10 to 1000 mL for a concentrated sample volume (C) of 1000 mL. The Level of Effort (LoE) was calculated for the range of A, with counting rates of 2-, 5-, and 8-min. per mL per person. Maximum 95% upper CIs and maximum LoEs are listed where A = 1000 mL.
Analytical level of effort
The extremely low MDLs, taken alone, do not indicate the extensive analytical effort required to achieve these concentrations. To incorporate this Level of Effort (LoE), we used empirical measurements of analytical times for a set of samples (First and Drake, 2012). On average, microscopists required 5 minutes to scan each mL of A, the analysis volume. The rate varied based upon sample characteristics, so we considered the rate could range from 2 to 8 minutes per mL per person. When A is 1000 mL, LoE ranged from 33 to 133 person-hours (Figure 2). This does not include associated tasks, such as documenting results, loading samples, or cleaning sample chambers; neither does this budget include time spent on taxonomic identification. This analytical burden is only practical when shared among multiple analysts. Nevertheless, the LoE is extraordinary: between 5 and 22 microscopists working concurrently are required to complete analysis of one sample within 6 hours.
Measurement uncertainty
Measurement uncertainty includes random and systematic effects associated with all quantities and processes of an analytical protocol. Quantities are the variables in equation 1 (e.g., number of individuals tallied, I; sample volume, S; etc.). Processes include the methods for concentrating organisms, holding samples, and counting organisms via microscopy. Random uncertainty widens the range of potential values surrounding an estimate, whereas systematic uncertainty results in a directional difference between the “true” value and the estimate, such that the estimate is either greater than or less than the “true” value. In an analysis of the sources of measurement uncertainty, systematic effects—primarily the loss of organisms during sampling—had a large impact on the estimates of concentrations of organisms ≥50 µm (First et al., 2020).
Note that multiple factors affect measurement uncertainty (e.g., sampling devices, analytical equipment, protocols for processing water, water characteristics, etc.), so estimates are unique to each laboratory and test. A laboratory seeking to decrease the MDL must first quantify their measurement uncertainty, then seek to reduce it through amendment of sampling and analytical protocols. These amendments would probably only result in moderate changes to the sources of random uncertainty due to, e.g., using larger volumetric vessels and pipettors, as graduated cylinders, beakers, and pipettors were generally comparable in their variability of measurements across a range of volumes (First et al., 2020). However, protocol changes to decrease the MDL will likely increase systematic uncertainty by one or more of the following:
•Organism loss during sampling
Commonly, organisms ≥50 µm are concentrated in a plankton net, which should be sized proportional to the sample flow rate and volume. The larger nets offer more surface area to snag and retain organisms as water and captured organisms are drained into the “cod end” (the removable cylinder at the base of the plankton net). Small holes or other defects are difficult to detect but are readily formed when handling large plankton nets. If “undersized’ nets are used, relative to the flow rate, the resulting pressure differential across the net can push soft-bodied organisms through the net. If larger sample volumes result in increased “time in the net”, mortality may increase due to prolonged physical stresses. All these factors will result in organism loss rates that would vary based on S, the total sample volume.
Interferences from suspended solids
Organisms ≥50 µm are typically a small subset of all suspended solids ≥50 µm. The total mass includes aggregates formed by natural flocculation and microbial activities (Simon et al., 2002). Larger samples should have proportionally more aggregates: e.g., a 10-m3 sample should have 10-fold the quantity in a 1-m3 sample. However, the methods employed to reduce MDL may encourage the formation of these aggregates, as the encounter rate of suspended solids increases in the plankton net. Also, mesh saturation (clogging) will effectively retain solids <50 µm (Tranter and Smith, 1968). Aggregates hide organisms ≥50 µm and thus increase the likelihood (or magnitude) of an undercount.
•Bottle-effects and mortality
The aggregates mentioned above harbor assemblages of bacteria, which could affect the conditions within the sample, primarily through their respiration. Microbial respiration will shift the balance of dissolved gases—reducing oxygen and increasing carbon dioxide. Samples may be refrigerated or aerated to mitigate this impact; nevertheless, the high concentrations of suspended solids and high rates of microbial respiration in concentrated samples will stress organisms and may lead to mortality, especially when samples are held for many hours to complete the analysis.
These and other sources of systematic error introduce a gap between the sample and the sample’s source, so it is important to quantify the systematic error—especially when changes to sampling and analysis procedures increase stresses on living organisms.
Discussion
The numerical limits established by the USA and the IMO seek to reduce the risk of ballast-borne bioinvasions. High concentrations of living organisms in ballast—given these individuals may survive and reproduce—contribute to the risk of a bioinvasion (Simberloff, 2009). It follows: reducing organism concentrations reduces risk; further, zero organisms in ballast water eliminates any risk of a biological invasion through ballast water. Towards this goal, state or regional authorities have considered a zero-discharge standard (see Albert et al., 2013). A zero-discharge standard without an accompanying MDL, however, does not constrain—i.e., limit the range—of potential concentrations of organisms.
The USA and IMO discharge standards (DS), by specifying non-zero concentrations, set an effective MDL, such that reports of 0 organisms per mL or m3 imply that the MDL is at least ≤10 organisms per mL or m3, which effectively constrains the range of values represented by “zero”. Testing laboratories should have established sampling and analysis volumes designed to ensure that organism concentrations ≤10 per m3 or mL are detectable. Given the effort associated with reducing the MDL, it seems unlikely the analyses were designed to detect concentrations much less than the DS (e.g., ≤1 per mL or m3).
In the examples provided herein, sample volumes, S, ranged from 1 to 60 m3; analysis volumes, A, ranged from 10 mL to 1000 mL (the volume of C, the total concentrated sample volume). Under any of these conditions, when the count of individuals (I) is zero, the result of Eq. 1 is 0 organism per m3. MDLs, however, ranged nearly four orders of magnitude, from 0.02 to 100 individuals per m3. Reporting (or requiring) 0 individuals per m3 of ballast water—without the context of the MDL—effectively allows concentrations along (or even beyond) that spectrum.
Given these considerations, we recommend analysts and testing laboratories:
•Report the volumes of S, C, and A, as well as other factors that affect MDL for each concentration value reported, as these may vary from sample to sample;
•Report the MDL, but also incorporate upper CIs into the MDL, and report the statistical approaches and assumptions (e.g., whether the CI is based upon α = 0.05, 0.01, or other values); and
•Perform validation experiments to examine the processes that may cause systematic error and underestimates of concentrations; in particular, examine the mortality rates of target organisms, especially in highly concentrated samples.
Numerical limits on concentrations of organisms in ballast water address a broadly shared concern that ship-borne, invasive species can alter or disrupt the recipient ecosystems. Consequently, concentration estimates produced during evaluations of BWMS or determined directly from discharged ballast water must clearly indicate the limitations of the measurement, such that the significance of the estimate should be broadly understood and interpretable. For full transparency, the reported concentrations should be accompanied with all “raw data”, i.e., the organism counts, sample volumes, and adjustments (e.g., dilution factors) to calculate concentrations. This suggestion echoes a recommendation from an analogous situation—detection of pathogens in drinking water—where the information is relevant to a diverse community of stakeholders (Chik et al., 2018). Unaccompanied by an MDL, a concentration of “zero organisms per unit volume”—whether listed as an analysis result or as a regulatory benchmark—does not constrain the potential range of concentrations and does not communicate the level of risk associated with a particular water sample or treatment method.
Author contributions
MF, SR-W, SR, JG, VM, and TW all participated in the concept development, organization, writing, and proofing of the manuscript, which was developed over several years during team meetings with all authors. All authors contributed to the article and approved the submitted version.
Funding
This work was funded by the United States Coast Guard [Agreement: CG835-21-XMMS003], but it does not reflect the positions or policy of the USCG, the US Navy, or any of the authors’ institutional affiliations.
Acknowledgments
We are grateful to Richard Everett (Excet, Inc.) for his critical review of the manuscript. We are grateful to LT Max Walker (USCG) for guidance and support. We are grateful to two peer reviewers, whose careful reviews improved an earlier version of this document.
Conflict of interest
SR, VM, and TW were employed by Excet Inc. JG was employed by Battenkill Technologies Inc.
The remaining authors declare that the research was conducted in the absence of any commercial or financial relationships that could be construed as a potential conflict of interest.
Publisher’s note
All claims expressed in this article are solely those of the authors and do not necessarily represent those of their affiliated organizations, or those of the publisher, the editors and the reviewers. Any product that may be evaluated in this article, or claim that may be made by its manufacturer, is not guaranteed or endorsed by the publisher.
References
Albert R. J., Lishman J. M., Saxena J. R. (2013). Ballast water regulations and the move toward concentration-based numeric discharge limits. Ecol. Appl. 23, 289–300. doi: 10.1890/12-0669.1
Chik A. H. S., Schmidt P. J., Emelko M. B. (2018). Learning something from nothing: The critical importance of rethinking microbial non-detects. Front. Microbiol. 9. doi: 10.3389/fmicb.2018.02304
First M. R., Drake L. A. (2012). Performance of the human “counting machine”: Evaluation of manual microscopy for enumerating plankton. J. Plankton Res. 34, 1028–1041. doi: 10.1093/plankt/fbs068
First M. R., Riley S. C., Robbins-Wamsley S. H., Parson E. W. J., Grant J. F., Drake L. A. (2020). Measurement uncertainty in determining concentrations of living organisms. Manage. Biol. Invasions 11 (3), 493–511. doi: 10.3391/mbi.2020.11.3.10
International Maritime Organization (IMO) (2004). International convention for the control and management of ships’ ballast water and sediments 2004 (London, UK: Convention BWM/CONF/36).
Marine Environmental Protection Committee (MEPC) (2018). Code for approval of ballast water management systems (BWMS code). rRsolution MEPC Vol. 300 (London: International Maritime Organization).
McAlice B. J. (1971). Phytoplankton sampling with the Sedgwick-rafter cell. Limnol. Oceanogr. 16, 19–28. doi: 10.4319/lo.1971.16.1.0019
Nogueira P., Domingues R. B., Barbosa A. B. (2014). Are microcosm volume and sample pre-filtration relevant to evaluate phytoplankton growth? J. Exp. Mar. Biol. Ecol. 461, 323–330. doi: 10.1016/j.jembe.2014.09.006
Sayinli B., Dong Y. J., Park Y., Bhatnagar A., Sillanpaa M. (2022). Recent progress and challenges facing ballast water treatment-a review. Chemosphere 291, 132776. doi: 10.1016/j.chemosphere.2021.132776
Simberloff D. (2009). The role of propagule pressure in biological invasions. Annu. Rev. Ecol. Evol. Systemat. 40, 81–102. doi: 10.1146/annurev.ecolsys.110308.120304
Simon M., Grossart H. P., Schweitzer B., Ploug H. (2002). Microbial ecology of organic aggregates in aquatic ecosystems. Aquat. Microb. Ecol. 28, 175–211. doi: 10.3354/ame028175
Steinberg M. K., Lemieux E. J., Drake L. A. (2011). Determining the viability of marine protists using a combination of vital, fluorescent stains. Mar. Biol. 158, 1431–1437. doi: 10.1007/s00227-011-1640-8
Tranter D. J., Smith P. E. (1968). “Filtration performance,” in Zooplankton sampling: Review papers of the proceedings of the symposium on the hydrodynamics of zooplankton sampling. monographs on oceanographic methodology, vol. 2. (Paris: UNESCO Press), p 27–p 56ISBN 92-3-101194-4.
United States Coast Guard (USCG) (2012). Standards for living organisms in ships’ ballast water discharged in U.S. waters (Washington, DC, USA: Federal Register), p 68. Available at: https://www.federalregister.gov/d/2012-6579.
United States Environmental Protection Agency (US EPA) (2010) Generic protocol for the verification of ballast water treatment technology. Available at: https://nepis.epa.gov/Exe/ZyPURL.cgi?Dockey=P10097A4.txt.
US EPA (2016) Definition and procedure for the determination of the method detection limit, revision 2. Available at: https://www.epa.gov/cwa-methods.
Keywords: zooplankton, phytoplankton, detection limits, shipping, type approval, measurement uncertainty, confidence interval, testing
Citation: First MR, Robbins-Wamsley SH, Riley SC, Grant JF, Molina V and Wier TP (2022) None detected: What “zero” indicates in direct counts of aquatic microorganisms in treated ballast water. Front. Mar. Sci. 9:1034386. doi: 10.3389/fmars.2022.1034386
Received: 01 September 2022; Accepted: 25 October 2022;
Published: 21 November 2022.
Edited by:
Margarita Fernández Tejedor, Institute of Agrifood Research and Technology (IRTA), SpainReviewed by:
Aitor Laza-Martínez, University of the Basque Country, SpainPankaj Tiwari, University of Kalyani, India
Copyright © 2022 First, Robbins-Wamsley, Riley, Grant, Molina and Wier. This is an open-access article distributed under the terms of the Creative Commons Attribution License (CC BY). The use, distribution or reproduction in other forums is permitted, provided the original author(s) and the copyright owner(s) are credited and that the original publication in this journal is cited, in accordance with accepted academic practice. No use, distribution or reproduction is permitted which does not comply with these terms.
*Correspondence: Matthew R. First, bWF0dGhldy5maXJzdEBucmwubmF2eS5taWw=