 Octavio Quintanar-Retama
 Ana Rosa Vázquez-Bader1
 Adolfo Gracia
- 1Universidad Nacional Autónoma de México (UNAM), Instituto de Ciencias del Mar y Limnología, Unidad Académica Ecología y Biodiversidad Acuática, México, Mexico
- 2Posgrado en Ciencias Biológicas, Unidad de Posgrado, CDMX, Mexico
The diversity and distribution of macrofaunal communities in the deep-sea bottoms of Gulf of Mexico (GoM) Mexican waters are poorly known compared to the northern GoM. This study was designed to contribute to the knowledge of macrofauna communities through (i) evaluate the taxonomic composition of macrofauna communities at major taxa level, and (ii) analyze the spatial distribution patterns in the deep sea of the southwestern GoM. Benthic macrofauna composition was analyzed in a large geographical area (92.67°–96.70° W 18.74°–23.04° N) and bathymetric gradient (185-3740 m depth). Samples were collected on board the R/V Justo Sierra (Universidad Nacional Autónoma de México) with a Reineck-type box corer during the oceanographic cruises SOGOM-3 and SOGOM-4 carried out on April 21–May 15, 2017, and on August 29–September 20, 2018, respectively. Thirteen environmental parameters were measured (among them, depth, salinity, temperature, O2, sediment grain size, hydrocarbons, and organic matter). Twenty-five taxa were registered in SOGOM 3 (2315 individuals) all of which were observed in SOGOM 4 (1721 individuals) with exception of the mollusk Class Solenogastres. The average abundance (ind. m-2) registered was 517 (range: 150-1388 ind. m-2), and 347 (range: 38-1088 ind. m-2) for SOGOM 3, and SOGOM 4, respectively. In SOGOM 3 Polychaeta, Nematoda, Amphipoda, Tanaidacea, and Bivalvia contributed with 75% of the total abundance, which were also the most abundant in SOGOM 4 representing 82% of total macrofauna abundance. Highest abundance was registered to the south of the study area near the coast, and the lowest one was found in deeper areas. Macrofauna abundance decreased with depth in both cruises. High diversity values were registered at intermediate depths in the south and west zones of the study area. Both cruises separated in a nMDS analysis. During SOGOM 3 dissolved oxygen, aromatic hydrocarbons, and organic matter (%) were the environmental variables related to macrofauna whereas, in SOGOM 4, depth was the most important one. This study fills a gap in the knowledge of diversity and distribution of macrofaunal communities of the deep-sea bottoms of a large area covering the whole bathymetric range of southern Gulf of Mexico and provides a baseline useful to compare with polluted areas and for assessing the impact of chronic pollution and/or potential oil spill accidents.
1. Introduction
The deep sea greater than 200 m depth (Gage and Tyler, 1991; Fiege et al., 2010) represents 90% of the planet oceans. This ecosystem has unique characteristics like high hydrostatic pressure, low temperature conditions, and scarce and intermittent food availability (Gage and Tyler, 1991; Ramirez-Llodra et al., 2010; Danovaro et al., 2014). The substrate of this ecosystem is mostly composed of soft sediments (Gray, 2002). Consequently, the soft deep sea bottoms benthic macrofauna communities constitute one of the largest faunal assemblages on the planet in terms of area covered (Snelgrove, 1998). These communities are integrated of metazoans with a length of less than 1.5 cm which are retained on a mesh size sieve between 250 and 500 μm (Hessler and Jumars, 1974; Rex, 1981; Gage, 2001; Rex et al., 2006). Typically, a dozen phyla are the most frequent (Grasle, 1991). Polychaetes, peracarid crustaceans, and mollusks stand out for their importance in terms of abundance and diversity (Grassle and Maciolek, 1992; Brandt et al., 2018). They participate in the secondary production, bioturbation, and bio-irrigation sediment processes (Snelgrove, 1998; Zhang et al., 2010), contributing to the transport, burial, and pollutant absorption (Snelgrove, 1998; Banta and Andersen, 2003). Once the pollutants are ingested by organisms, they can be bioaccumulated and hence could affect entire food chains (Somero, 1992). Also, they take part in the organic matter (OM) sink process and oxygen transport to subsurface layers (Crawshaw et al., 2019) promoting bacterial activity (Parkes et al., 1994). Moreover, they affect sediment transport through the increase of system’s susceptibility to erosion (Grant et al., 1982), and can also modify fine sediment by feeding and transforming it into larger defecated pellets, thereby increasing the porosity of soft bottoms. Thus, the contribution of this communities in biogeochemical cycles through nutrients recycling, ecological interactions, and environment transformation is fundamental for sustaining the deep sea, and the global oceanic ecosystem.
According to Qu et al. (2016), the distribution of benthic communities in the deep sea of the Gulf of Mexico (GoM) are quite well known and it is possible to predict the abundance, species composition, and biodiversity depending on the locality, and depth. Several studies have been carried out in the northern gulf (Rowe et al., 1974; Pequegnat et al., 1990; Baguley et al., 2006a; Baguley et al., 2006b; Baguley et al., 2008; Wei et al., 2010a; Wei et al., 2010b; Sharma et al., 2011; Wei et al., 2012b; Wei et al., 2012a; Carvalho et al., 2013). The macrofauna abundance tends to decrease with increasing depth. This has been reported in other seas (Baldrighi et al., 2014), in the northern Gulf of Mexico (Wei et al., 2012a) and within the study area (Escobar-Briones et al., 1999). On the other hand, diversity frequently exhibits a bathymetric pattern with lowest values in the upper bathyal and abyssal regions and highest ones at intermediate depths (Rex, 1981; Ramirez-Llodra et al., 2010; Wei and Rowe, 2019). Despite of these general patterns, other trends have been reported, frequently in studies based on the analysis of transects (Pérez-Mendoza et al., 2003). These changes usually were associated with horizontal variations of some abiotic factors such as sedimentation rate or organic matter content. However, there are only a few studies on deep-sea macrofauna communities in the Exclusive Economic Zone of Mexico (but see, Escobar-Briones et al., 2008; Escobar-Briones et al., 1999; Salcedo et al., 2017, Hernández-Ávila et al., 2021). So, the diversity and distribution of macrofaunal communities in the deep-sea bottoms of GoM Mexican waters are poorly known compared to the northern GoM. Recently there is a renewed interest to study the GoM and have a comprehensive knowledge of the whole Large Ecosystem and its responses to different stressors. Among them, oil spills like the two mega oil spills occurred in the GoM (Ixtoc 1, 1979-1980 and DHW, 2010). Events of this magnitude could be repeated and are of great concern due to the impacts on deep-water ecosystem (Murawski et al., 2020; Pulster et al., 2020; Reuscher et al., 2020; Schwing et al., 2020). This study was designed to contribute to the knowledge of macrofauna communities through (i) evaluate the taxonomic composition of macrofauna communities at major taxa level, and (ii) analyze the spatial distribution patterns in the deep sea of the southwestern GoM. Data obtained of the large bathymetric and geographic range covered in the southern GoM will contribute substantially to the knowledge of macrofaunal communities in this poor studied area supplying unique information for understanding the GoM as a whole ecosystem. Besides it will provide a baseline data that could be useful to evaluate the impact of man driven activities such as accidental oil spills and/or long-term ecosystem changes.
2. Materials and methods
2.1. Study area
The Gulf of Mexico is one of the most productive and diverse Large Marine Ecosystems of the world (Kumpf et al., 1999) bordered by three nations (US, Cuba, and Mexico). It has an area of about 1,540,000 km2 (Ward and Tunnell, 2017) and a maximum depth near to 4000 m in the central area and the Sigsbee Canyon (Darnell, 2015). Most of the GoM (65%) are deep waters of which 42% corresponds to continental slope (200-3000 m) and 24% to abyssal plains (> 3000m) (Ward and Tunnell, 2017). More than a half of its surface area (55%) is Mexican Economic Exclusive Zone. Deep Gulf bottoms are mainly composed by mud from terrigenous and biogenic origin. The Loop Current coming from the Caribbean Sea determines the Gulf circulation pattern. This current enters through the Yucatán Channel, leaves trough the Florida Straits and produces several cyclonic-anticyclonic gyres of different scales depending on the wind and pressure effects (Monreal-Gómez and Salas-de-León, 1997). A general net current flows in a West-North-East direction around the Gulf from Campeche Bank to Florida (Monreal-Gómez et al., 2004). Although there is a large number of field and numerical studies carried out over decades in the Gulf of Mexico, the behavior of the Loop Current and the conditions that generate the detachment of the eddies traveling towards the east of the Gulf still lack studies to be predicted with accurate precision. Three important gaps have been pointed out: 1) the non-existence of measurements of the physical oceanographic characteristics (e.g. currents and temperature) in the entire area, in the long term and in the entire water column including atmospheric data of the air-sea interface, 2) the lack of comprehensive measurements of inflows, outflows, counterflow, and underflow and 3) the interaction of the loop current system with west shallow water when it enters to the east and begins to exit the Gulf (NAS, 2018). Freshwater is discharged by several rivers around the Gulf among which the Mississippi River in the North and the Grijalva-Usumacinta River System in the South contribute with the highest load.
2.2. Sampling and sample processing
Sediment samples were collected on board of the R/V Justo Sierra of the Universidad Nacional Autónoma de México (UNAM) in the southwestern GoM during the oceanographic cruises SOGOM-3 and SOGOM-4 carried out on April 21–May 15, 2017 and on August 29–September 20, 2018, respectively. The sampling sites were located within a geographical range of 92.67°–96.70° west longitude and 18.74°–23.04° north latitude, in a depth range from 185 to 3740 m (Figure 1). Sampling design considered 63 locations in each cruise; however, due to logistical reasons only 56 and 62 were successfully sampled in SOGOM 3 and SOGOM 4, respectively. Due to the large area sampled, bathymetric range covered, cast sampling time and ship time cost we limited operating the sampling to one core per site. Original site numbering was kept for cruise comparisons.
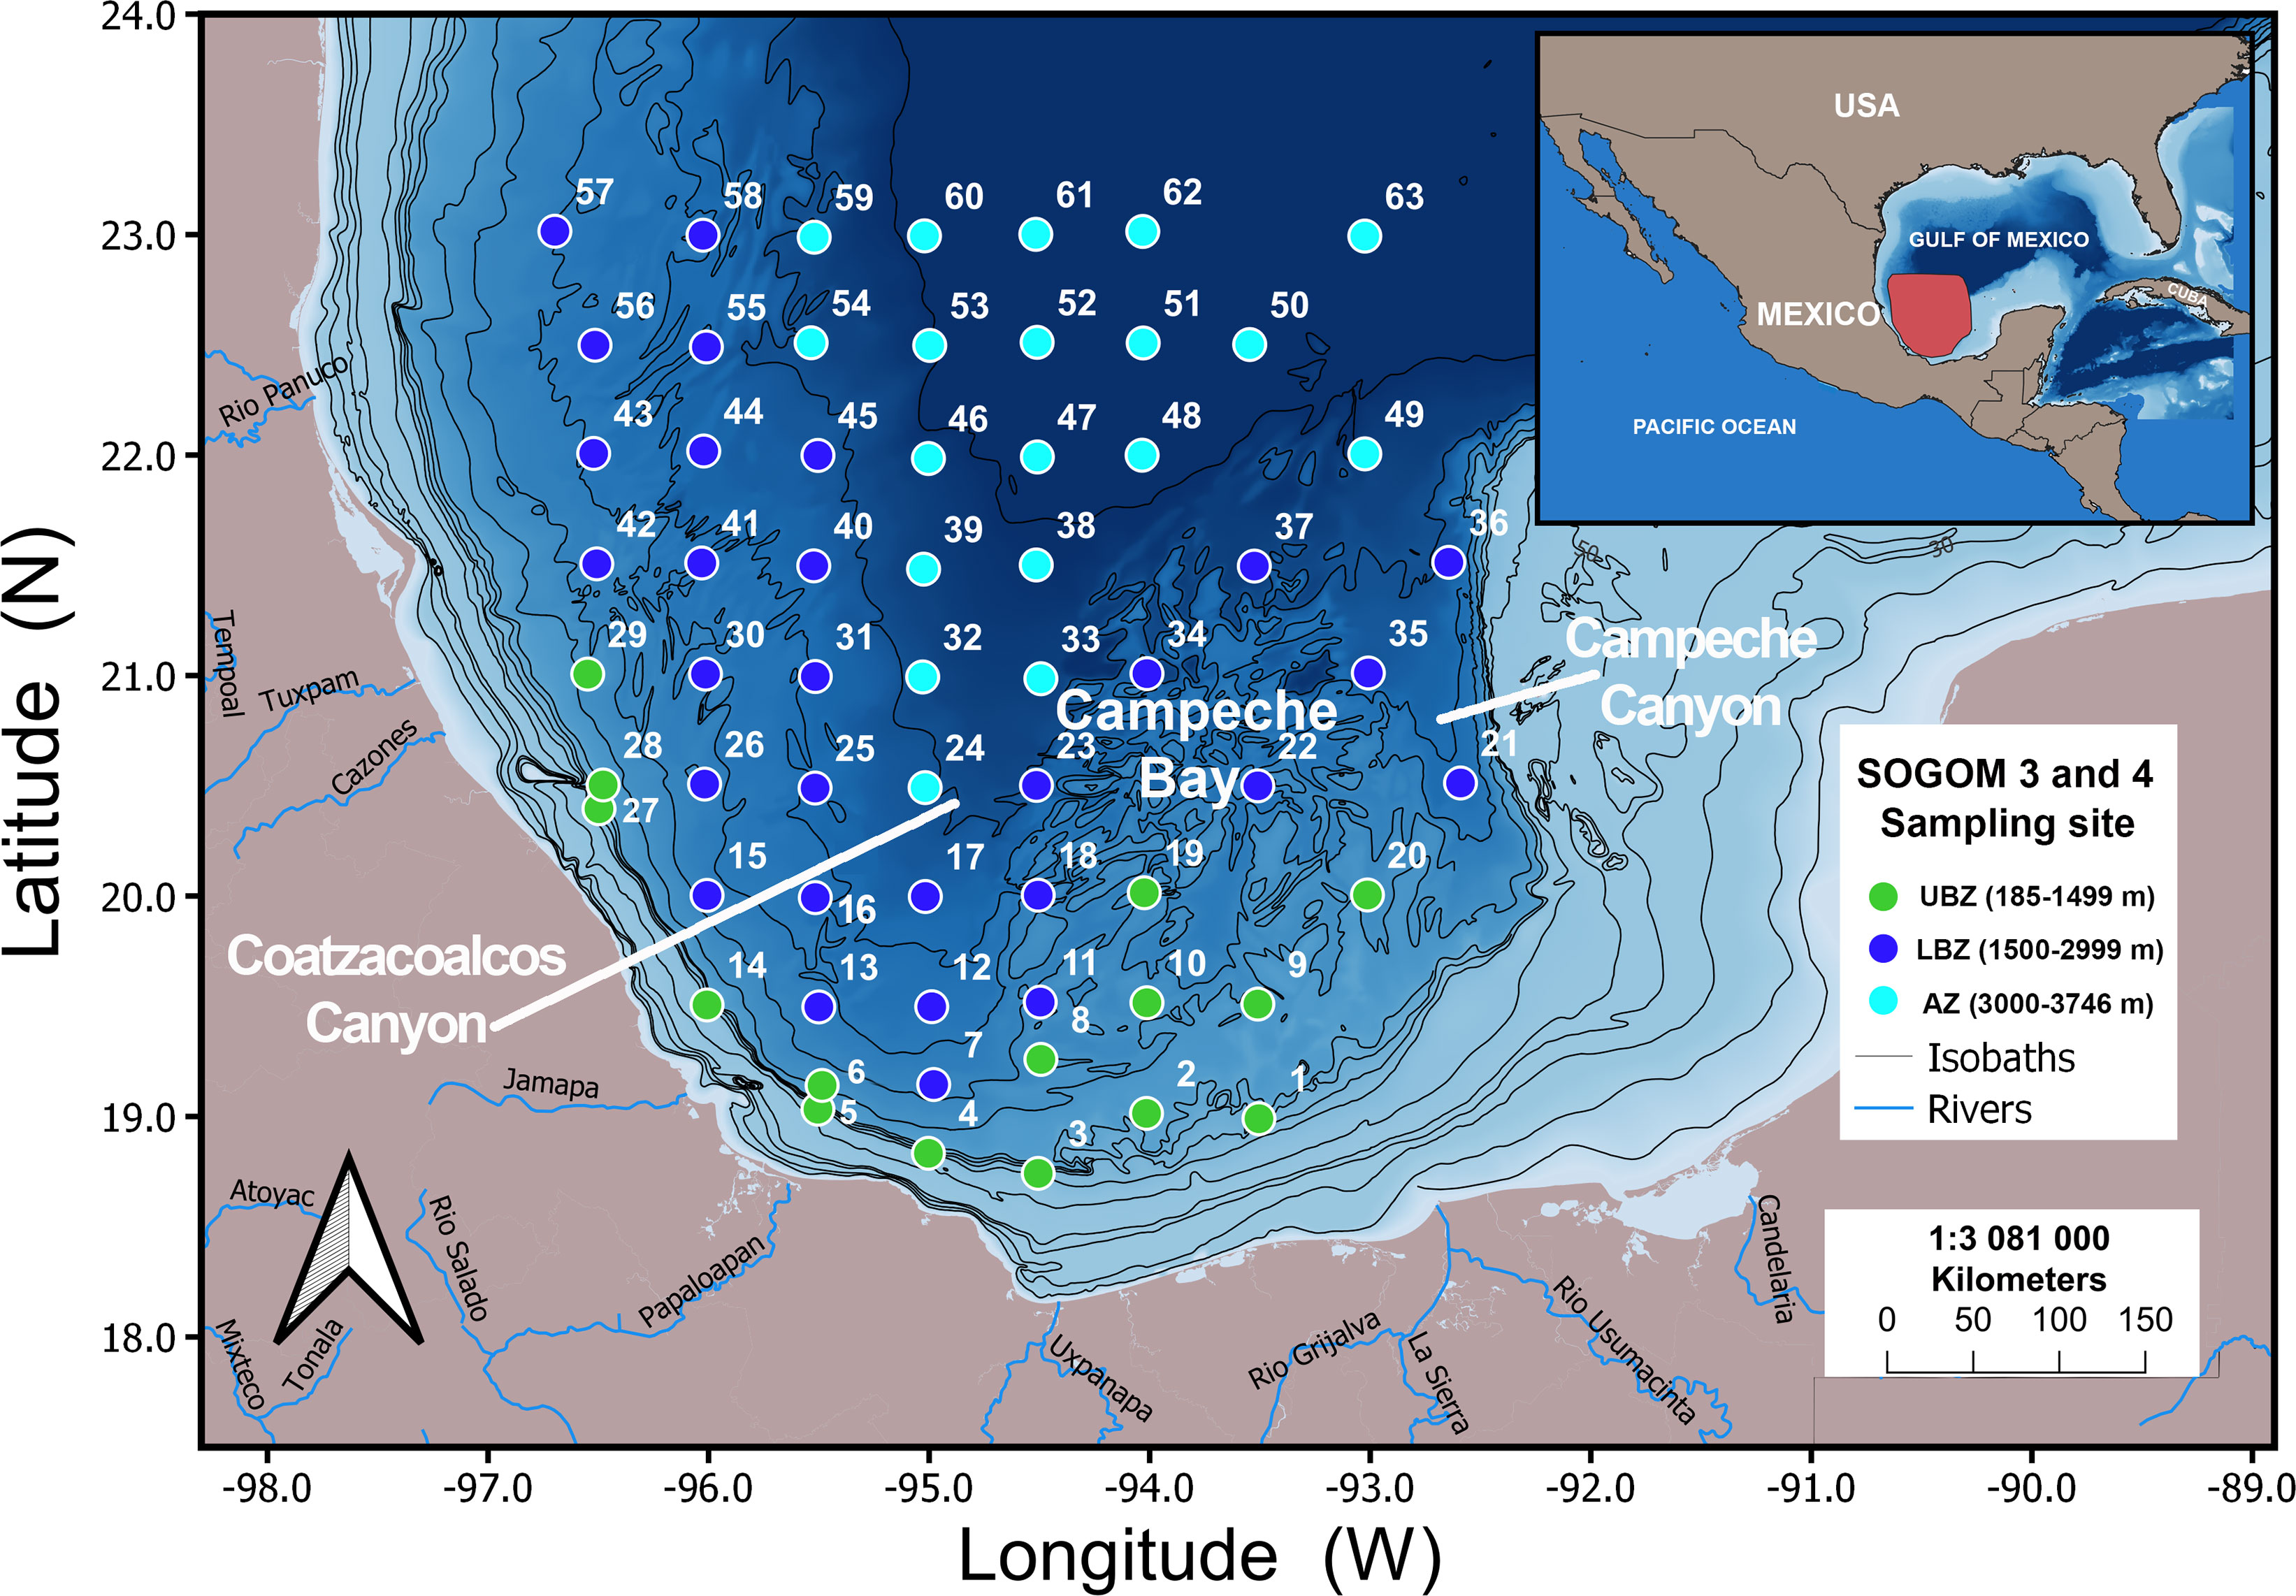
Figure 1 Location of the 63 sites sampled during the oceanographic cruises SOGOM 3 and SOGOM 4.
The sediment was collected with a Reineck-type box corer of 0.16 m2 effective area. A sediment sample of 0.08 m2 surface and 13 cm depth was collected for faunal analysis in each core. Approximately 1000 cm3 of sediment were collected for abiotic parameters measurement. Faunal samples were sieved on board with filtered seawater through a mesh size of 500 µm and subsequent fixation was made with a mix of seawater and 8% formaldehyde. The 500 µm mesh size retained most of the macrofauna adult organisms and are directly comparable to other studies (e.g. Hernández-Ávila et al., 2021) using this mesh size.
Thirteen environmental variables were measured. Four were registered in situ. Depth (m) was determined with the ship’s echo sounder. Salinity (PSU), temperature (°C), and dissolved oxygen (ml l-1) of bottom water were measured with a CTD underwater unit (Model Sea-Bird SBE 9 plus). For safety reasons the CTD was placed on average at 282 m (range: 5–780 m) and 159 m (range: 5–552 m) from the bottom, depending on the depth site in SOGOM 3 and SOGOM 4, respectively. At low depths the CTD was closer to the bottom (~5m), so parameters of water were adequately reflected. Registers at deep sites are also reliable of the water mass near the bottom as variations are relatively lower. The geographic location (latitude and longitude) was recorded at the time the corer reached the seabed.
The content of carbonate was estimated by back titration. Excess hydrochloric acid was used to drive off the carbon dioxide produced in the reaction by boiling and the remaining unreacted acid was titrated with a sodium hydroxide solution, in the presence of the phenolphthalein indicator. Organic matter was estimated through the reaction on one dry gram of sediment with 10 ml of potassium dichromate, 10 ml of sulfuric acid, 100 ml of distilled water and 10 ml of phosphoric acid. One ml of diphenylamine was added, and then organic matter and carbon were estimated based on a titration with a 0.5 N ferrous sulfate (Jackson, 1958). Sediment granulometry was measured using a Beckman Coulter model LS 230 laser diffraction analyzer (Small Volume Modulo Plus), and the particle size distribution was expressed as percentage of sand, silt, and clay.
After drying and grinding sediment samples, hydrocarbons were extracted using an ASE 350 accelerated solvent extractor with dichloromethane. The samples were purified and concentrated in a chromatographic column packed with sulfite, silica, alumina, and copper. Concentrated extracts were analyzed with a GC-MS system (Agilent 6809N/5973MS) with Hp-5MS column of 30 m to determine aliphatic, and aromatic hydrocarbon concentration (µg kg-1). Isotopic Carbon was extracted following the standard procedures of combustion. The CO2 was purified with liquid nitrogen –190°C and analyzed with a mass spectrometer to determine the isotopic carbon (13C/12C).
In the laboratory, the sediment was examined using an AVEN Mighty Vue Pro 5D ESD magnifying lamp (2.25X magnification). The specimens were picked up with fine point tweezers and preserved in vials with ethanol 70%. Macrofauna organisms were observed under a stereomicroscope Zeiss Stemi 508 (maximum magnification 50X) and Zeiss Primo Star microscope and identified at the major taxa level using the general taxonomic literature (e. g. Brusca and Brusca, 2003). Only the identified fauna was included in the analysis. Colonial organisms belonging to the phyla Cnidaria, Porifera and Bryozoa were counted as one specimen because we did not know for sure if there could be more than one colony. The taxon names of the organisms were cross-checked with the World Register of Marine Species (WoRMS, www.marinespecies.org).
2.3. Data analysis
The sites of each cruise were organized in three depth categories (DCs): upper bathyal zone (UBZ) (185–1500 m), lower bathyal zone (LBZ) (1501–3000 m), and abyssal zone (AZ) (3001–3740 m). The limit between bathyal and abyssal regions at 3000 m was based on the literature (e.g., Harris, 2020; Watling et al., 2013) and bathymetry of the GoM.
We constructed a grouped line chart for each abiotic factor to assess depth related and between cruises variations. Abundance was standardized to individuals per square meter for each site in both cruises. Based on these, we elaborated a box plot, and pie chart, to evaluate possible macrofauna abundance variations between cruises. Boxplots were notched to show significant differences between DCs or between cruises. The overlap of the notches indicates that the differences are not significant and the non-overlap indicates the opposite (Mcgill et al., 1978; Kampstra, 2008). Besides, we constructed basic, and percent stacked bar plot to analyze registered macrofauna abundance, and relative abundance (percentage contribution of each taxon to the total macrofauna abundance at each site) bathymetric changes within each cruise, and between them with STATISTICA 7 software. The correlation between each abiotic factor, general abundance and polychaete relative abundance values with depth for each cruise was evaluated using Spearman’s correlation including the hypothesis test (H0: rs = 0 (there is no relationship); H1: rs ≠ 0 (there is a relationship) to assess whether or not the correlation was significant. Values less than 0.4 were defined as weak correlation, between 0.41 and 0.69 intermediate correlation, and values greater than 0.69 as strong correlation. Kruskal-Wallis tests were carried out to determine the significance of the possible abundance and diversity metrics differences observed across cruises and/or depth zones.
For each cruise, the standardized abundance data matrix was square-root transformed to reduce the bias of outliers. Subsequently, we generated a matrix of pairwise similarity between sites based on the Bray-Curtis index (Clarke et al., 2014), and posteriorly a non-metric multidimensional scaling (nMDS). A hierarchical cluster analysis (group average) was performed based on the similarity matrix including the SIMPROF test (1000 permutations for average profile, 999 simulation permutations and 5% level of significance). The cluster analysis was plotted on the nMDS ordination. The nMDS of both oceanographic cruise sites was done from a matrix including both samplings, each one labeled with the respective cruise number (3 or 4) and DCs. Also, an ANOSIM analysis was carried out to test differences among cruises and DCs. Draftsman plot and correlation matrix for environmental parameters were calculated to analyze covariance between them. Values of the correlation coefficient greater than 0.7 were considered strong correlations. The Spearman rank correlations (SR) between matrices of biotic and abiotic similarities were calculated using the BEST routine (Clarke et al., 2008). The abiotic similarity matrix was generated with Euclidean distance from the normalized matrix of environmental variables. Multivariate analyses were carried out with PRIMER v6 (Clarke and Gorley, 2006). Abundance rank curves of each cruise were based on the standardized abundance matrix ordering taxa in each depth category (DC) according to their contribution to the recorded abundance.
Based on the abundance data matrix we calculated diversity estimates (Hill numbers) of order q = 0, 1, and 2 with the iNEXT package (Chao et al., 2014) in R. Hill numbers include the three most widely used diversity metrics: species richness (q = 0), Shannon diversity (q = 1) and Simpson diversity (q = 2). Diversity variations among DCs in each cruise were evaluated with rarefaction and extrapolation sampling curves for three Hill numbers. The criterion used for determining the significance between the estimated values of taxonomic richness (0.995 sample coverage) among DCs within each cruise and between cruises was the overlapping confidence interval (no overlapping = significant difference and partial/total overlapping = no significant differences) (Zar, 2010).The geographic distribution abundance map was elaborated with the standardized abundance, whereas the diversity geographic distribution map was done with the estimated taxonomic richness values (q = 0) at 0.8 sample coverage. The resolution of the isobaths for all maps were: 10 m in the 0 to 50 m depth range, 50 m in the 50 to 100 m, 100 m in the 100 to 500 m and 500 m in the 500 to 3500 m intervals. The geographic distribution maps of sample sites, abundance and taxonomic richness were made with the QGIS 3.12 software (QGIS.org, 2021). In the case of the abundance and taxonomic richness maps, the data class aggrupation was carried out with the natural rupture methodology (Jenks) (Smith et al., 2015). All images were edited with Adobe Photoshop CS6 (13.0) software.
3. Results
3.1. Abiotic factors
The abiotic factors measured in the bottom water showed no variation in depths greater than 1000 m. We registered a temperature range between 17.8-5.17°C at 185-1143 m, and 18.69-5.14°C at 189-1225 m in SOGOM 3, and SOGOM 4, respectively. Beyond these depths, temperature always was near to 4°C in both cruises. Temperature and depth correlation was negative and strong in SOGOM 3 and was not significant in SOGOM 4 (rs3 = -0.71, p < 0.001 and rs4 = -0.17, p = 0.19) (rs3 = Spearman’s correlation coefficient during SOGOM 3; rs4 = Spearman’s correlation coefficient during SOGOM 4). Salinity values were in a 36.54-35.24 PSU range between 185 to 672 m depth, and 36.45-35.1 PSU from 189 to 614 m in SOGOM 3, and SOGOM 4, respectively. Salinity values were always near to 35 PSU in higher depths for both cruises. Salinity and depth correlation was not significant in both cruises (rs3 = -0.19, p = 0.16 and rs4 = -0.02, p = 0.90). Dissolved oxygen concentrations registered in SOGOM 3 were found in a 2.48-3.56 ml l-1 range at depths of 185 to 1275 m. In deeper locations, dissolved oxygen values showed a 4.0-4.7 ml l-1 range, except in the sites 8, and 10 where they registered 3.6 and 5.4 ml l-1, respectively. The dissolved oxygen concentration in SOGOM 4 showed values between a 2.5 and 3.8 ml l-1 range in a 285-1225 m depth range. Beyond these depths, dissolved oxygen values varied in a 4.3 to 4.7 ml l-1 range. Correlation of DO with depth was positive and intermediate in both samplings (rs3 = 0.58, p < 0.001 and rs4 = 0.45, p < 0.001) (Figure 2).
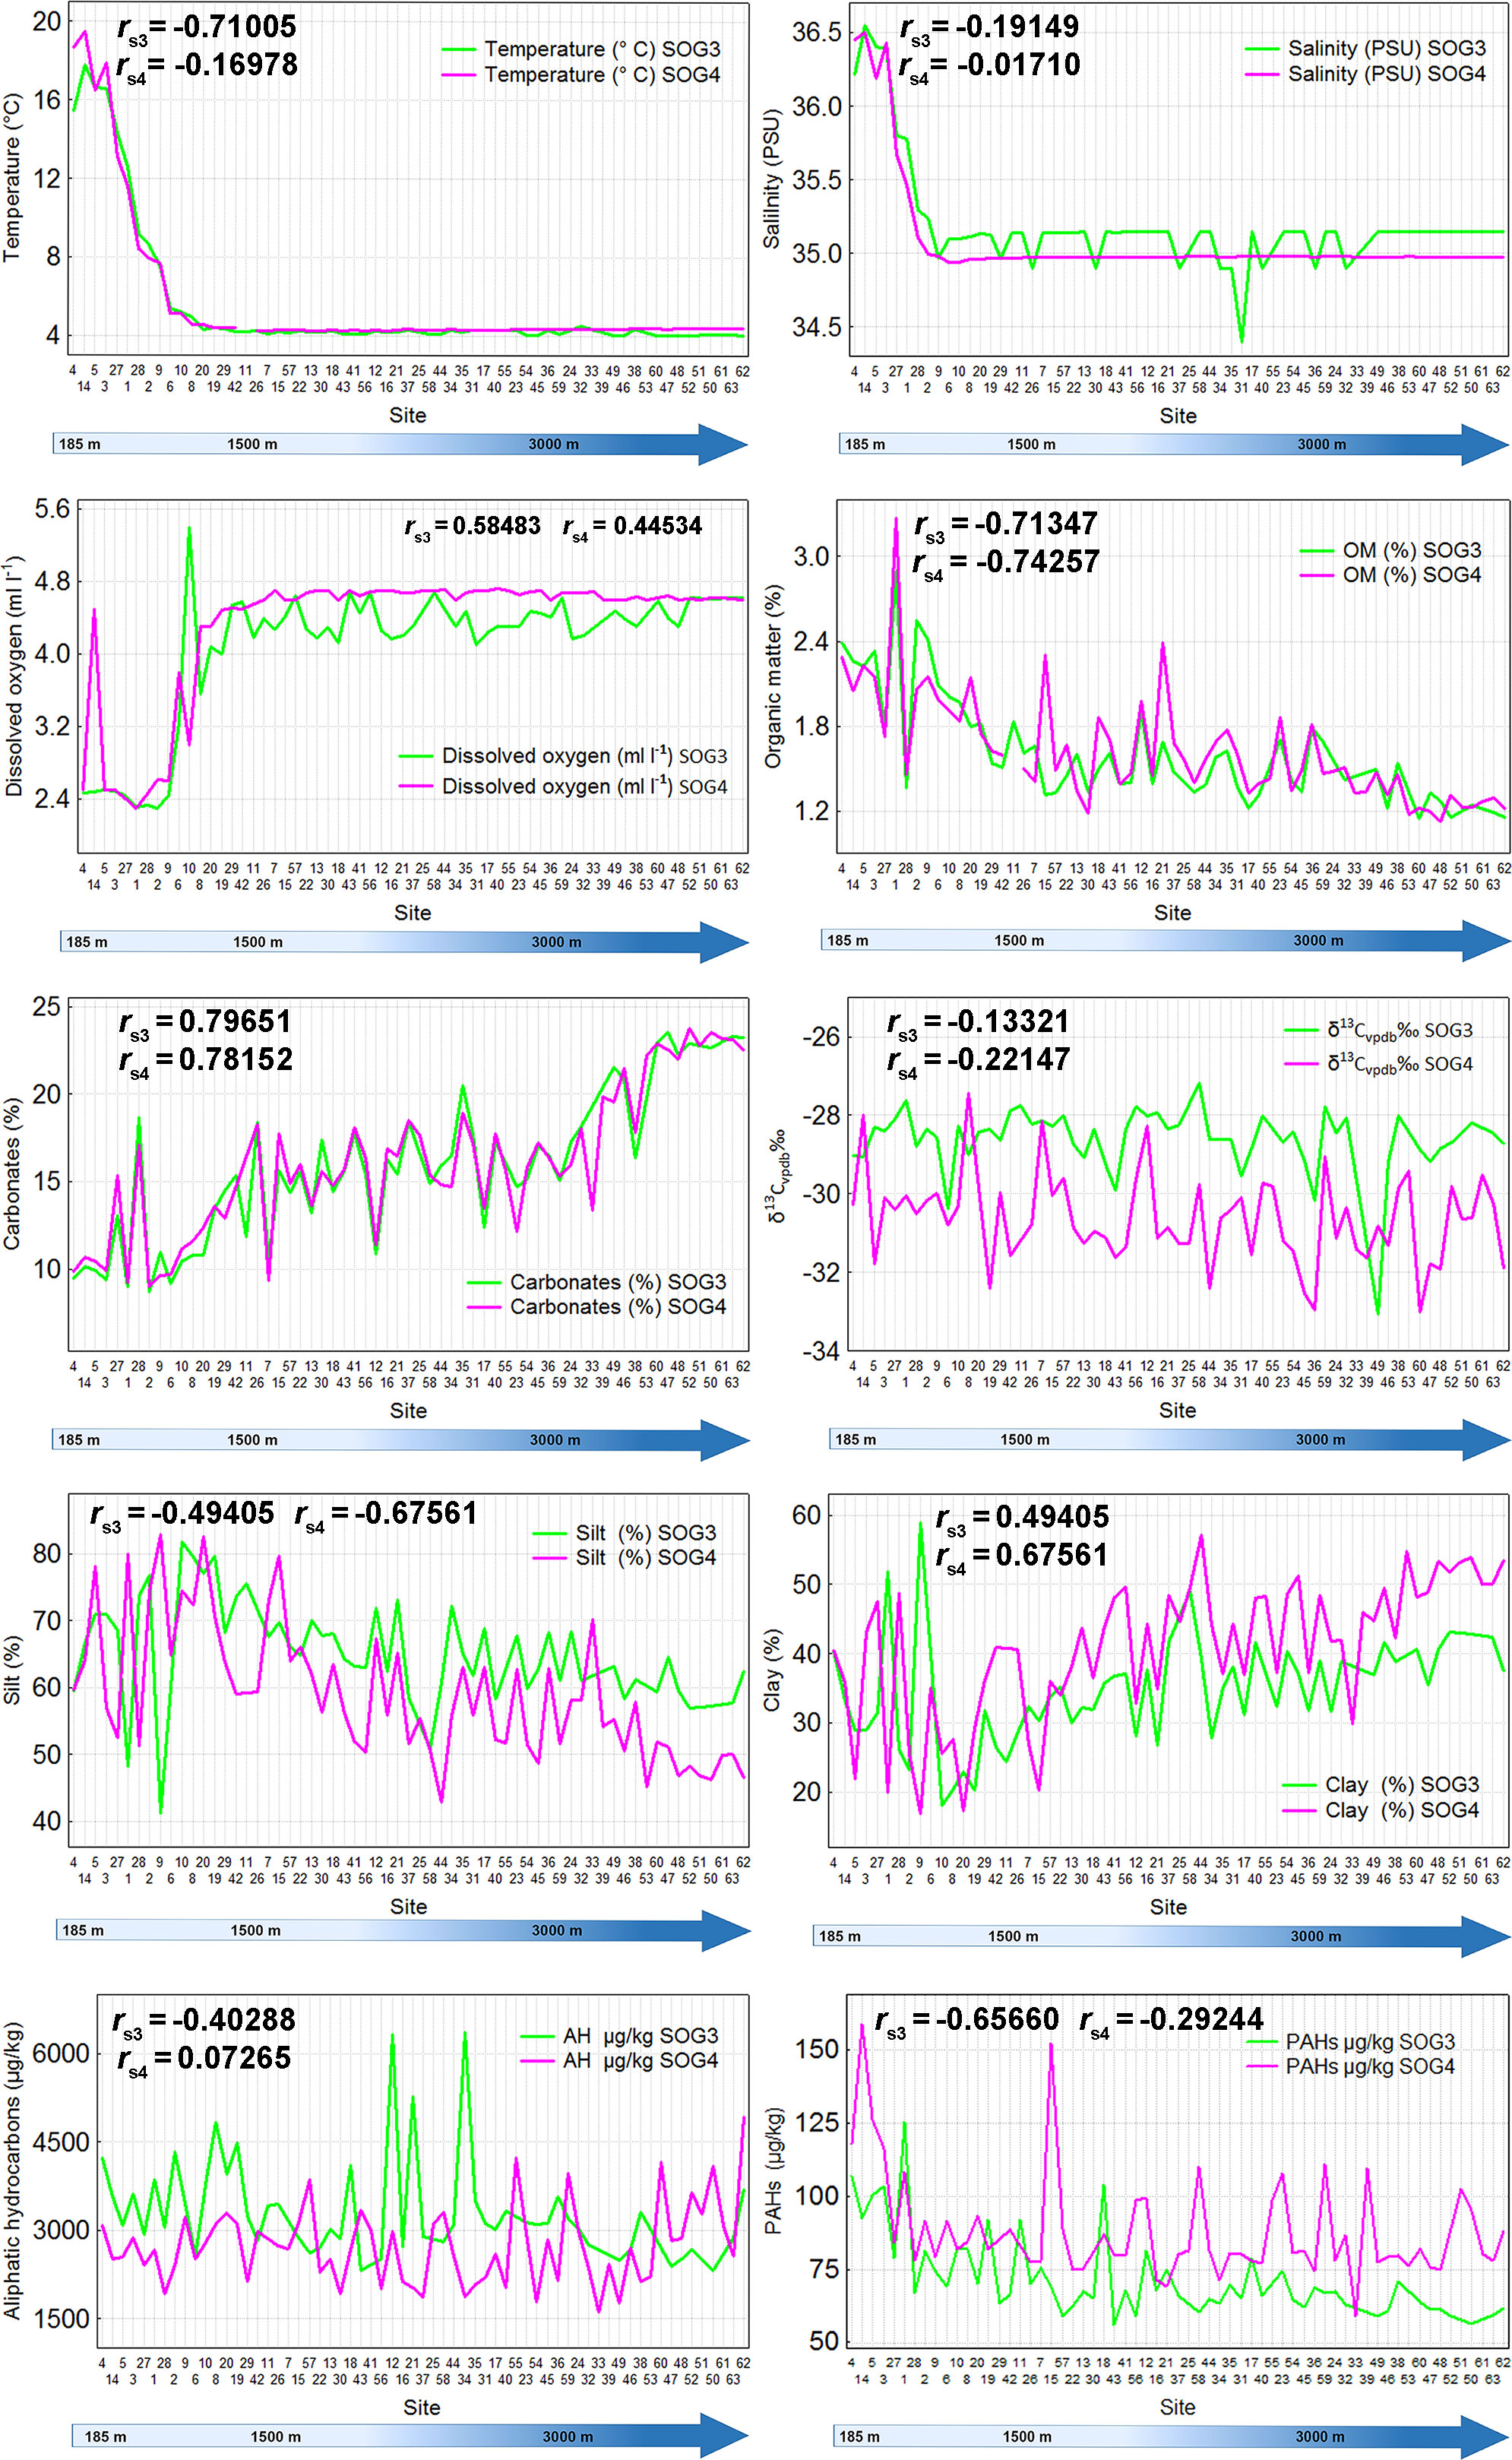
Figure 2 Depth related pattern of environmental factors (sites are ordered from low to highest depth, left to right). SOG3 = SOGOM 3, SOG4 = SOGOM 4, AH = Aliphatic hydrocarbons, PAHs = Polycyclic Aromatic Hydrocarbons, rs3 = Spearman’s correlation coefficient during SOGOM 3, rs4 = Spearman’s correlation coefficient during SOGOM 4.
Sand content was excluded from the sediment analysis because it was extremely low in both cruises (≤ 0.09% and 0.27% in SOGOM 3 and SOGOM 4, respectively). Content (%)organic matter and silt showed a decreasing pattern related to depth, whereas carbonate and clay values (%) presented an opposite trend, increasing with depth. The OM values presented a range of 1.15% to 2.89% in SOGOM 3, and 1.12% to 3.27% in SOGOM 4. OM and depth correlation was negative and strong in both samplings (rs3 = 0.71, p < 0.001 and rs4 = 0.74, p < 0.001). Silt value range in SOGOM 3 was 41.11%-81.82%, and clay was 18.12%-56.89%. Meanwhile, in SOGOM 4 the silt range was 42.90%-82.86% and clay 16.87% - 57.10%. Silt and depth correlation was negative and intermediate (rs3 = -0.49, p < 0.001 and rs4 = -0.68, p < 0.001) while, clay and depth correlation was positive and intermediate in both cruises (rs3 = 0.49, p < 0.001 and rs4 = 0.68, p < 0.001) Content (%) carbonate showed an interval from 8.7 to 23.5 in SOGOM 3, and 9.0 to 23.8 in SOGOM 4. Carbonate and depth correlation was positive and strong in both cruises (rs3 = 0.80, p < 0.001 and rs4 = 0.78, p < 0.001). In general, the aromatic and aliphatic hydrocarbons recorded values that decreased with depth increase, except in SOGOM 4 where a slight increase of aliphatic hydrocarbons was registered in sites deeper than 3000 m. Aromatic hydrocarbons ranges were 56-125 µg kg-1 and 59-158 µg kg-1 for SOGOM 3 and SOGOM 4, respectively. Correlation of aromatic hydrocarbons and depth was negative and intermediate in SOGOM 3 and weak in SOGOM 4 (rs3 = -0.66, p < 0.001 and rs4 = -0.29, p = 0.02). Aliphatic hydrocarbons were found in a 2316- 6364 µg kg-1 and 1601 to 4927 µg kg-1 ranges for SOGOM 3, and SOGOM 4, respectively. Aliphatic and depth correlation was negative and intermediate in SOGOM 3 and no significance was found in SOGOM 4 (rs3 = -0.40, p < 0.001and rs4 = 0.07, p = 0.57). We registered delta C 13 (d13C) values between -33 to -27 CVPDB‰, and -33 to -27 CVPDB‰ in SOGOM 3 and SOGOM 4, respectively. In SOGOM 3 delta C 13 showed a slight decrease related to depth increase, whereas this trend was not observed in SOGOM 4. Delta C 13 and depth correlation was not significant in both samplings (rs3 = -0.13, p = 0.33 and rs4 = -0.22, p = 0.08) (Figure 2).
3.2. Fauna description
We registered 25 taxa in SOGOM 3 cruise, all of which were also observed in SOGOM 4 cruise with exception of the mollusk class Solenogastres. During the SOGOM 3 cruise we collected 2186 specimens (range: 9 to 111 per site) in 56 sites, while in the SOGOM 4 cruise we obtained 1689 specimens in 62 sites sampled (range: 3 to 87 per site) (Table 1). Locations grouped by DC showed 866, 924 and 396 individuals, and 22, 25, and 14 taxa for UBZ, LBZ, and AZ, respectively in SOGOM 3, and 763, 692 and 234 individuals, and 21, 21, and 15 taxa for UBZ, LBZ, and AZ in SOGOM 4, respectively (Table 2).

Table 1 Number of sites, specimens, and taxa. Average abundance and depth for each cruise.
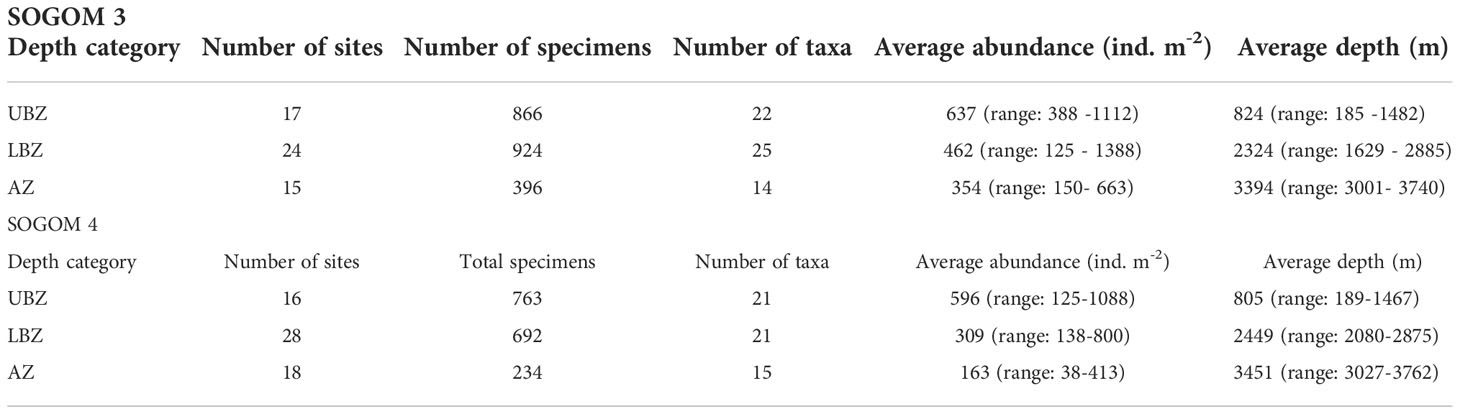
Table 2 Number of sites, specimens, and taxa. Average abundance, and depth for each depth category of each cruise.
The macrofauna standardized abundance average was higher in SOGOM 3 (488 ind. m-2, range: 113-1388) than in SOGOM 4 (341 ind. m-2, range: 38-1088) and significantly different (p = 0.002) (Figure 3). Abundance difference between cruises was consistent in the three DCs but it was only significant in the deeper ones (Figure 3). Within each sampling, only significant differences were observed between UBZ and AZ in SOGOM 3 while in SOGOM 4 all DCs showed significant differences in recorded abundance (notches in the box plots and p values) (Figure 3). The five most abundant macrofauna taxa were the same in both cruises. Polychaeta, Nematoda, Amphipoda, Tanaidacea, and Bivalvia represented 79% and 84% of the total abundance in SOGOM 3 and SOGOM 4, respectively. The composition of the following five most abundant taxa showed a difference between cruises. Isopoda and Nemertea were found in both cruises, while Bryozoa, Cnidaria and Harpacticoida were recorded in SOGOM 3 and Sipuncula, Porifera and Oligochaeta in SOGOM 4 (Figure 4). Macrofauna abundance presented a decreasing trend related to depth increase in both cruises (rs = -0.48 and -0.70 (p ≤0.001) in SOGOM3 and SOGOM 4, respectively). Polychaetes, and nematodes were the most abundant taxa in all sites, with exception of sites 26, 58, 59, and 46 in SOGOM 3. Although average abundance was higher in SOGOM3, only two sites (7 and 27) were superior to the highest abundance values registered in SOGOM 4. However, three locations of SOGOM 4 showed lower abundance values that the lower one of SOGOM 3 (Figure 5).
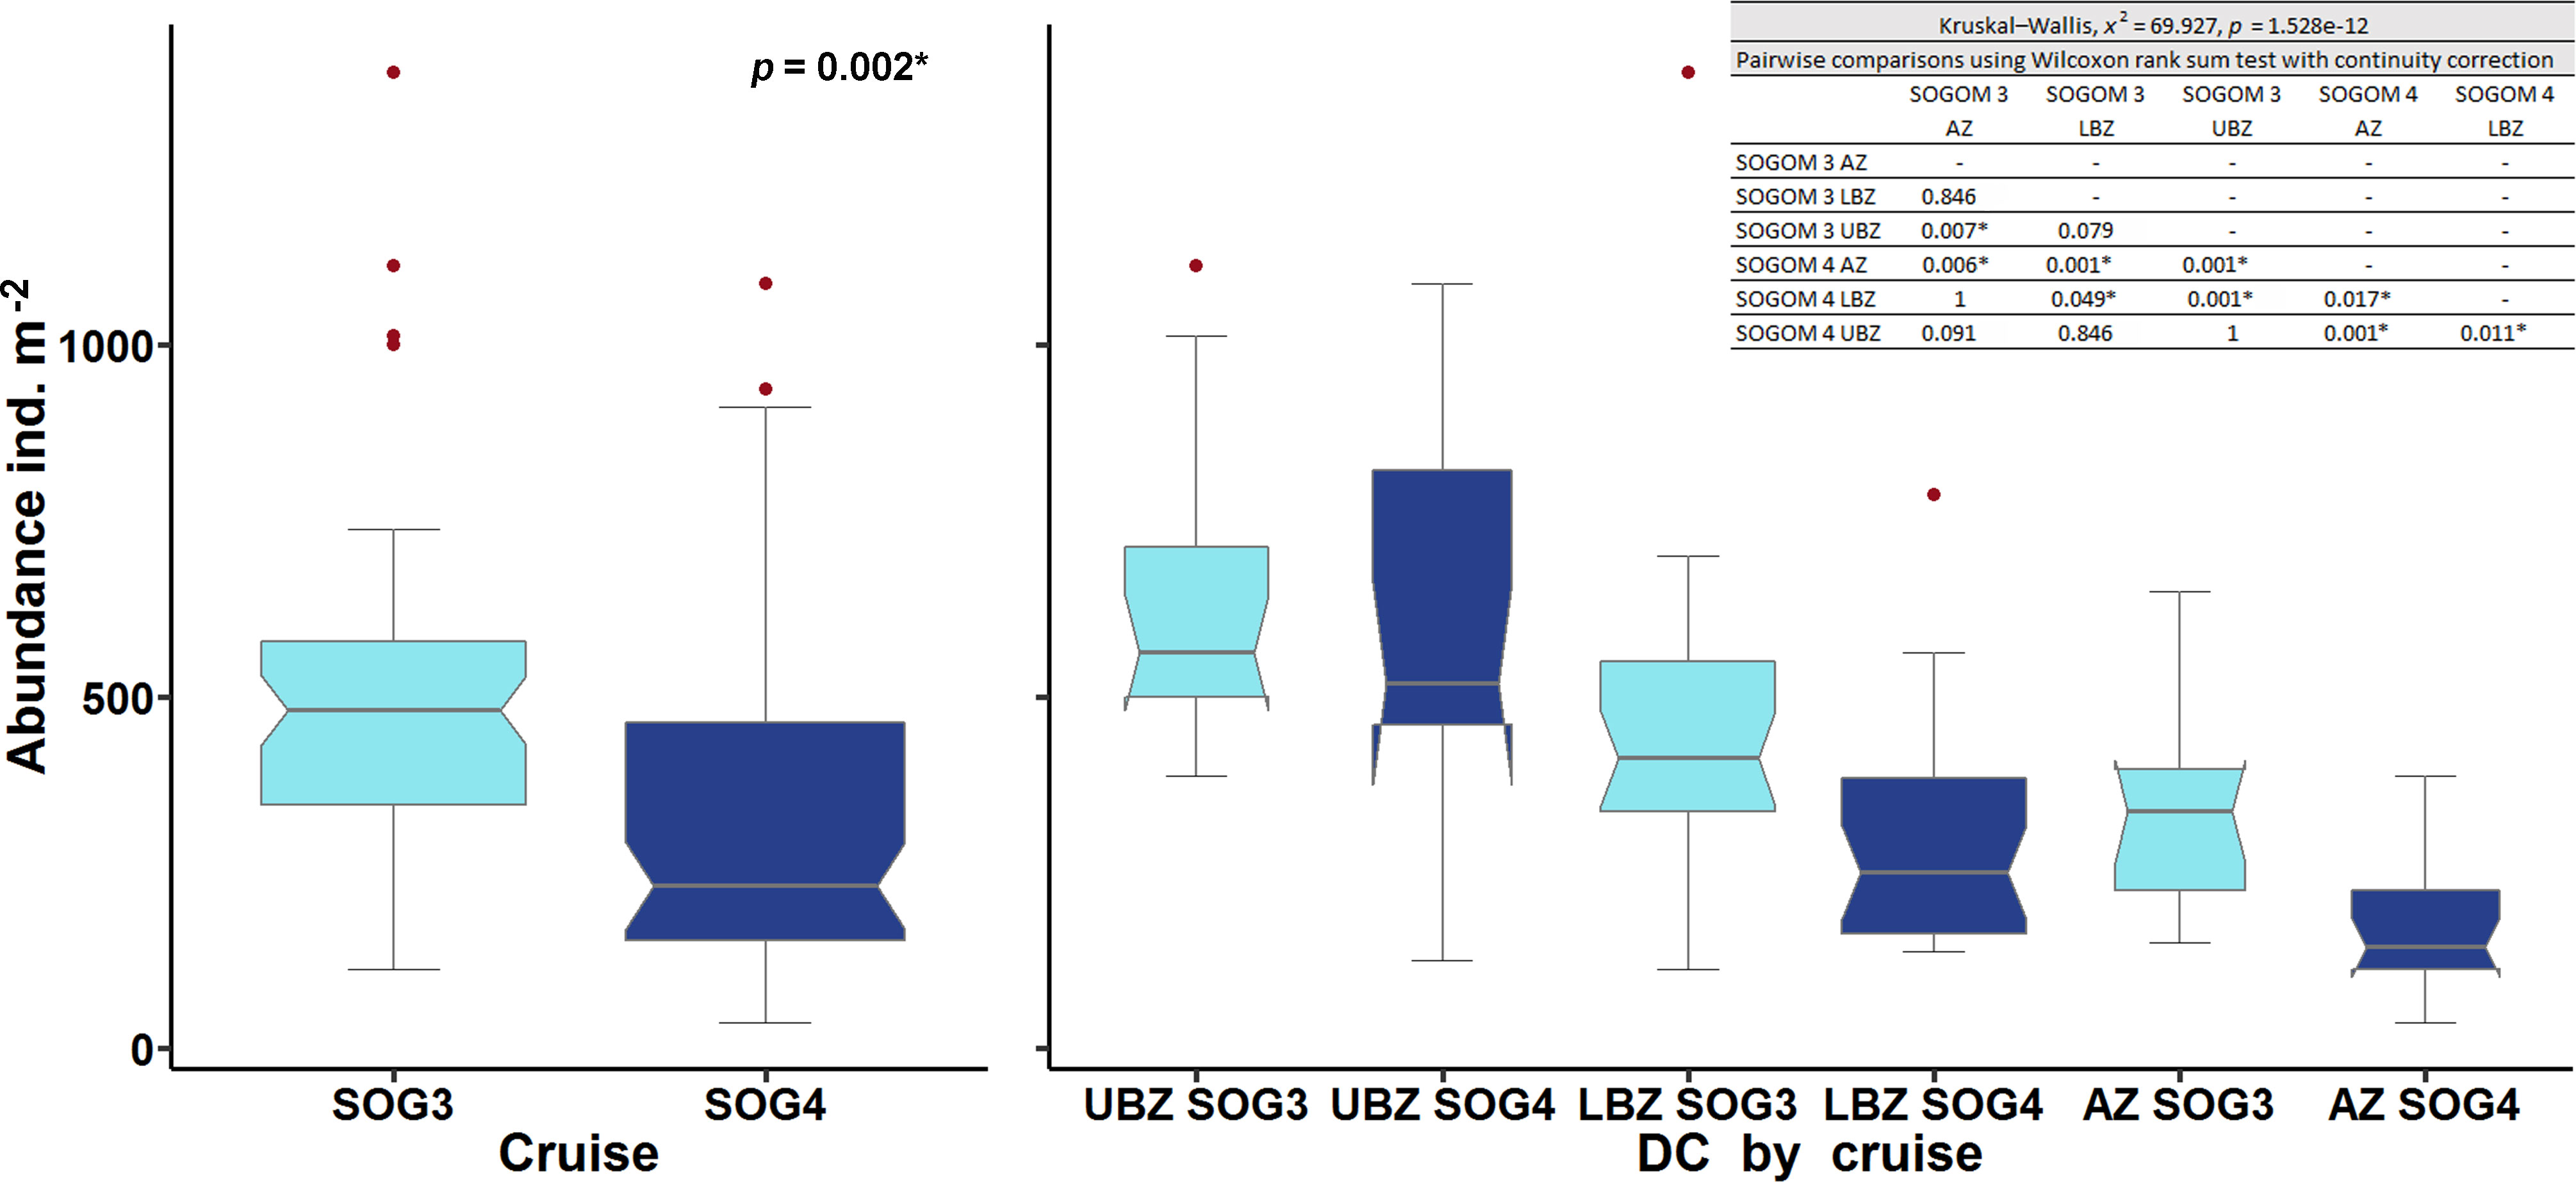
Figure 3 Box plots of macrofauna abundance (ind. m-2) registered in SOGOM 3 (light blue) and SOGOM 4 (navy blue), and in each depth category. Upper bathyal zone (UBZ), lower bathyal zone (LBZ) and abyssal zone (AZ).
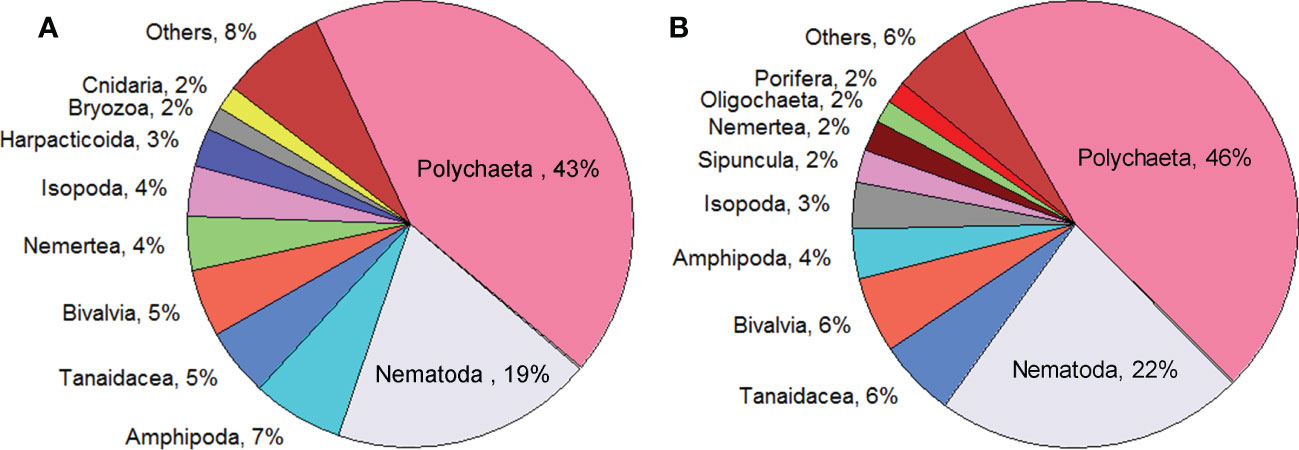
Figure 4 Relative abundance of the ten most abundant macrofauna taxa of SOGOM 3 (A), and SOGOM 4 (B).
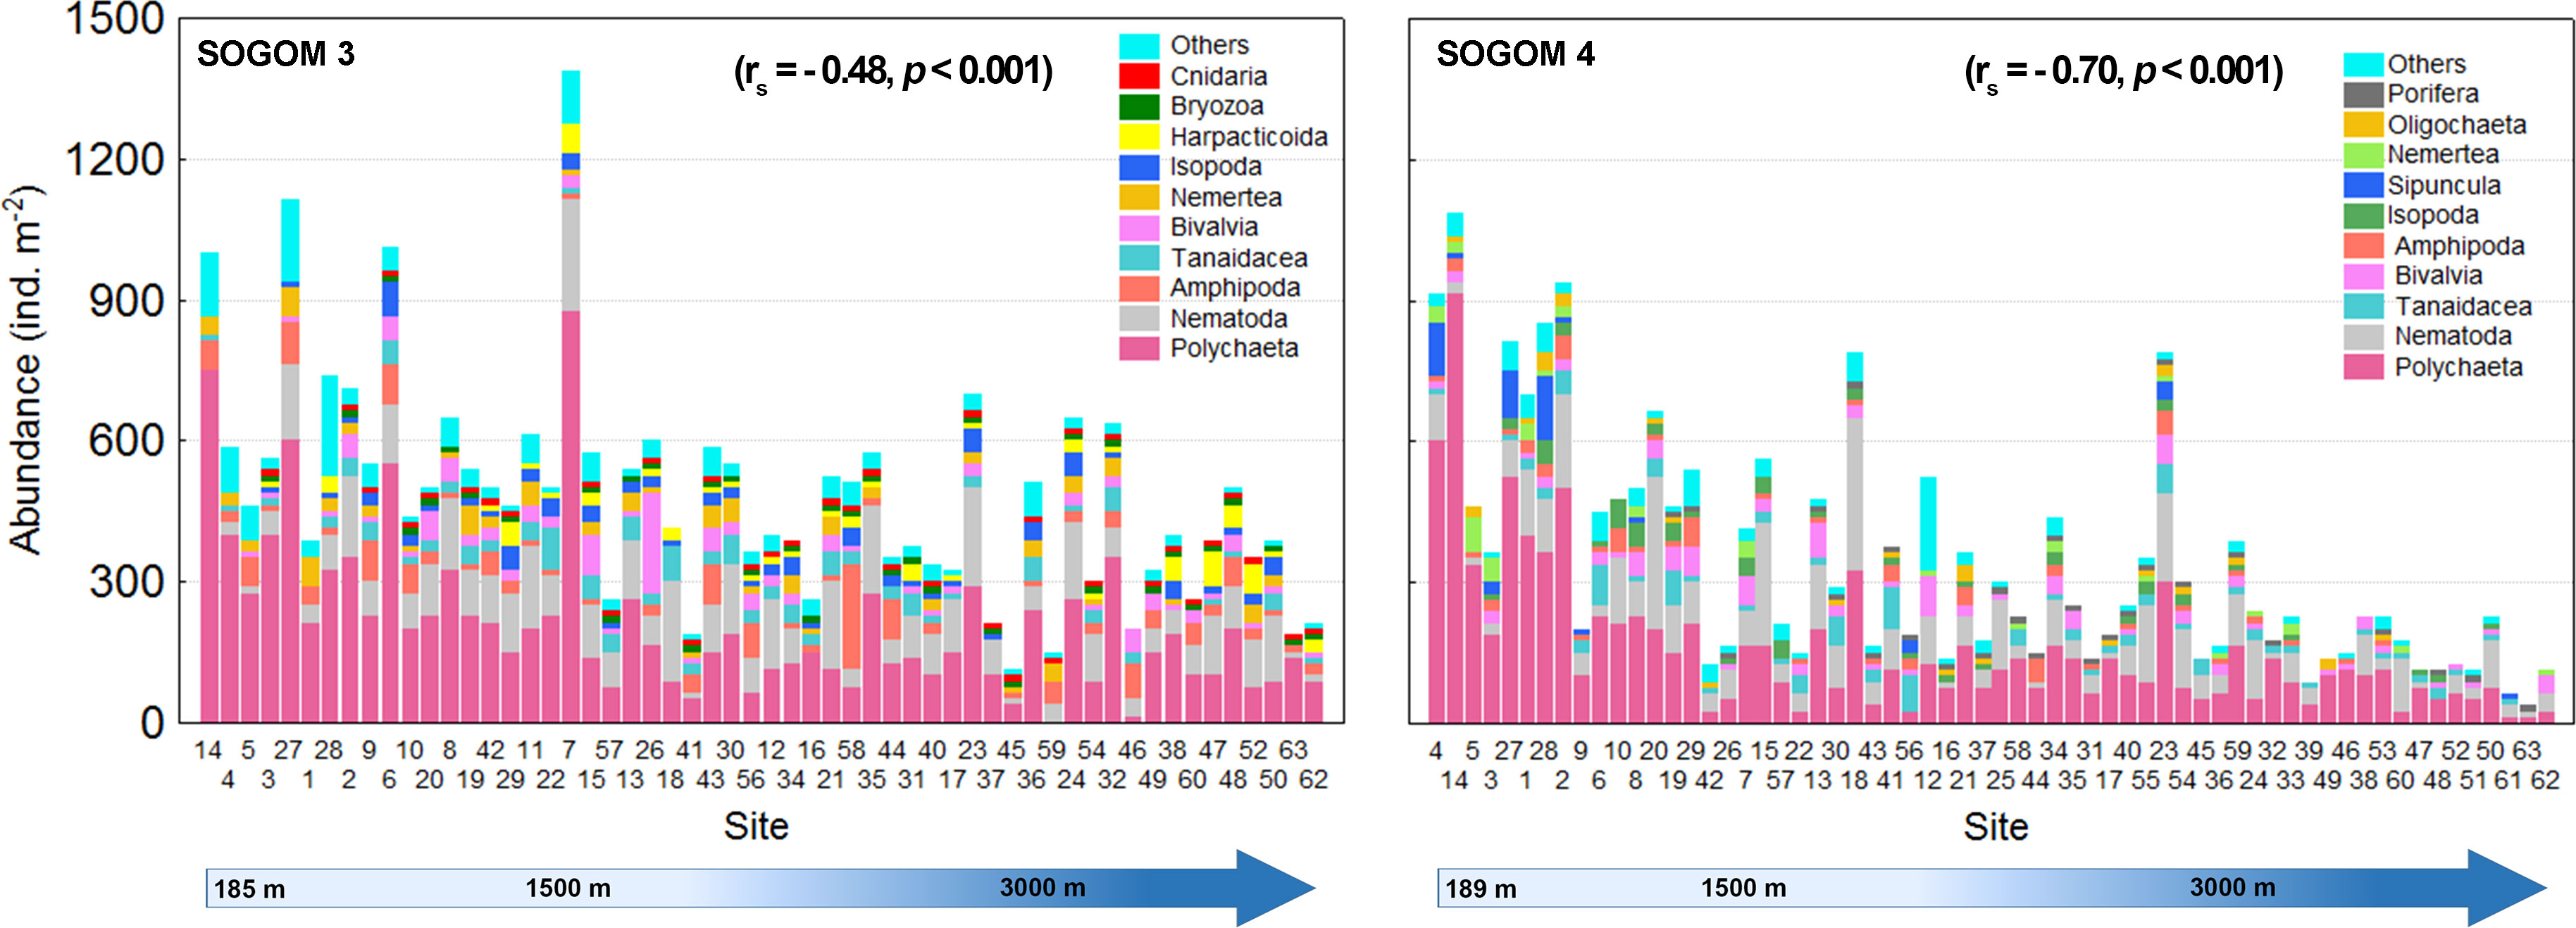
Figure 5 Abundance of the ten most abundant macrofauna taxa related to depth in SOGOM 3 and SOGOM 4, rs = Spearman’s correlation coefficient.
The polychaetes were found in all locations except in site 59 of SOGOM 3. The polychaetes relative abundance decreased with increasing depth in both cruises, but only during SOGOM 3 the correlation between depth and relative abundance was significant (rs = -0.417, p = 0.001 and rs = -0.185, p = 0.151 in SOGOM 3 and SOGOM 4 respectively). Nematodes were registered in 96%, and 94% of total sites in SOGOM 3 and SOGOM 4, respectively. This taxon showed a consistent abundance pattern in both cruises with lowest values in the seven shallowest sites, and a relatively higher and uniform abundance in the remaining sites. The Bivalvia mollusk class was registered in 79% of SOGOM 3 sites and in 68% of SOGOM 4 locations. Although absent in some sampling sites, this taxon was recorded in practically the entire bathymetric range with low relative abundance variation. Bivalvia relative abundance mainly varied in a 1%-17% range in both cruises, except sites 46 and 26 of SOGOM 3 and site 62 of SOGOM 4 that showed high relative values of 25%, 35% and 33%, respectively. Tanaidacea (Peracarida, Arthropoda) relative abundance showed a similar pattern in both cruises with slight higher values in SOGOM 4 (1% to 40%) compared to SOGOM 3 (1% to 18%). Amphipoda (Peracarida, Arthropoda) presented differences in the relative abundance between both cruises. In SOGOM 3 this taxon was present in 80% of the sites mainly in a relative abundance range of 1%-25%, except for sites 59, 46, and 58 which presented high values of 33%, 38%, and 44%, respectively. In SOGOM 4 this taxon was collected in 57% of the sites. Only the site 44 registered a high relative abundance of 33%, while the remaining sites showed a low relative abundance range of 1% to 13% (Figure 6).
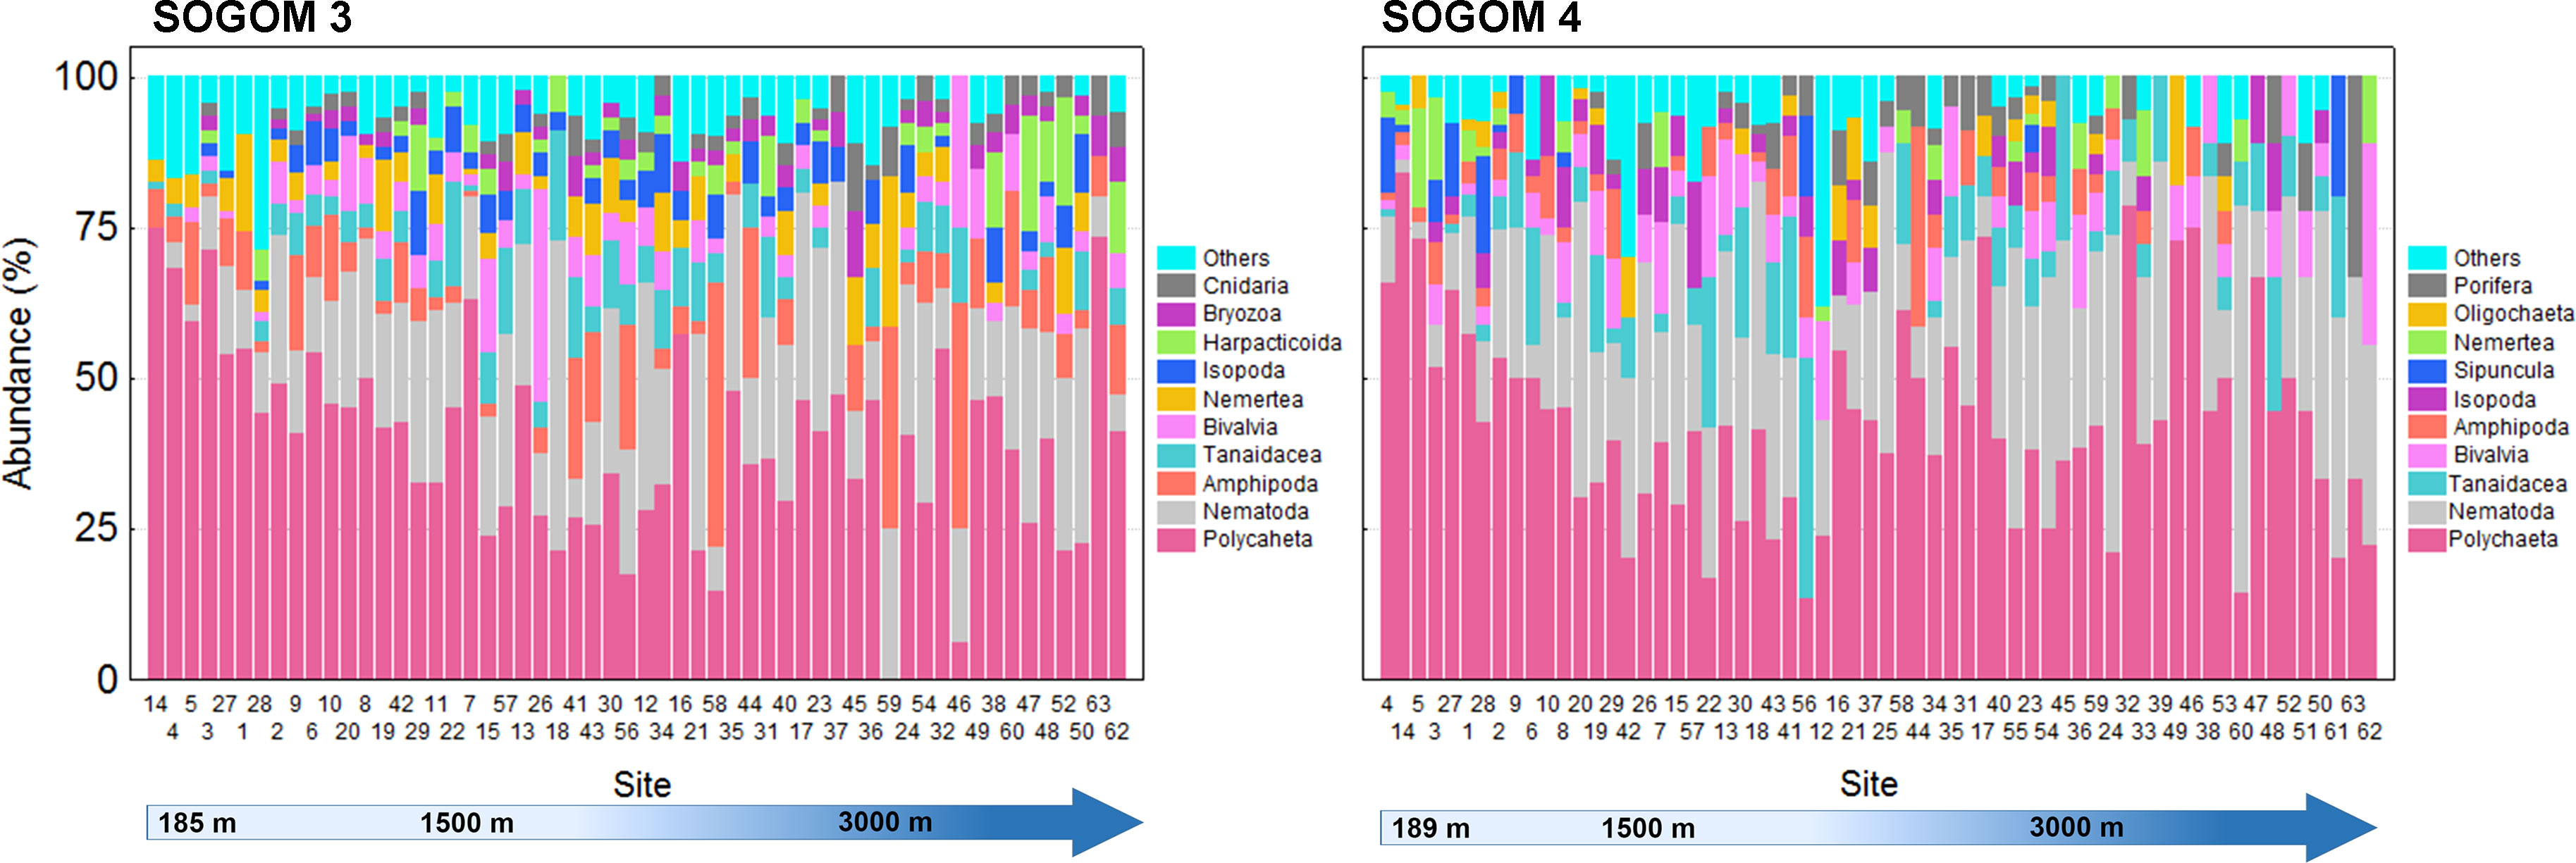
Figure 6 Relative abundance of the ten most abundant macrofauna taxa related to depth in SOGOM 3 and SOGOM 4.
In general, the geographic abundance pattern was similar in both cruises. The highest abundance values were recorded in the south of the study area and locations near to the coastline and the lowest ones were registered in the northern sites. During SOGOM 3 the highest abundance values were recorded at four sites near the coast in the southern region. Intermediate values were associated with locations near the coastline in the southern and northwestern regions, besides sites located in the saline domes zone in the Campeche Bay and the Campeche and Coatzacoalcos Canyon. Low abundance values were recorded in all regions of the study area, particularly in the northern region at the abyssal plain. In SOGOM 4, the highest and intermediate abundance values were again recorded at sites near the coast in the southern region, as well as in most of the localities of the Campeche Bay saline domes zone. Low abundance values were found in the northern zone, except of four sites with intermediate values in the northwestern region (Figures 7, 8).
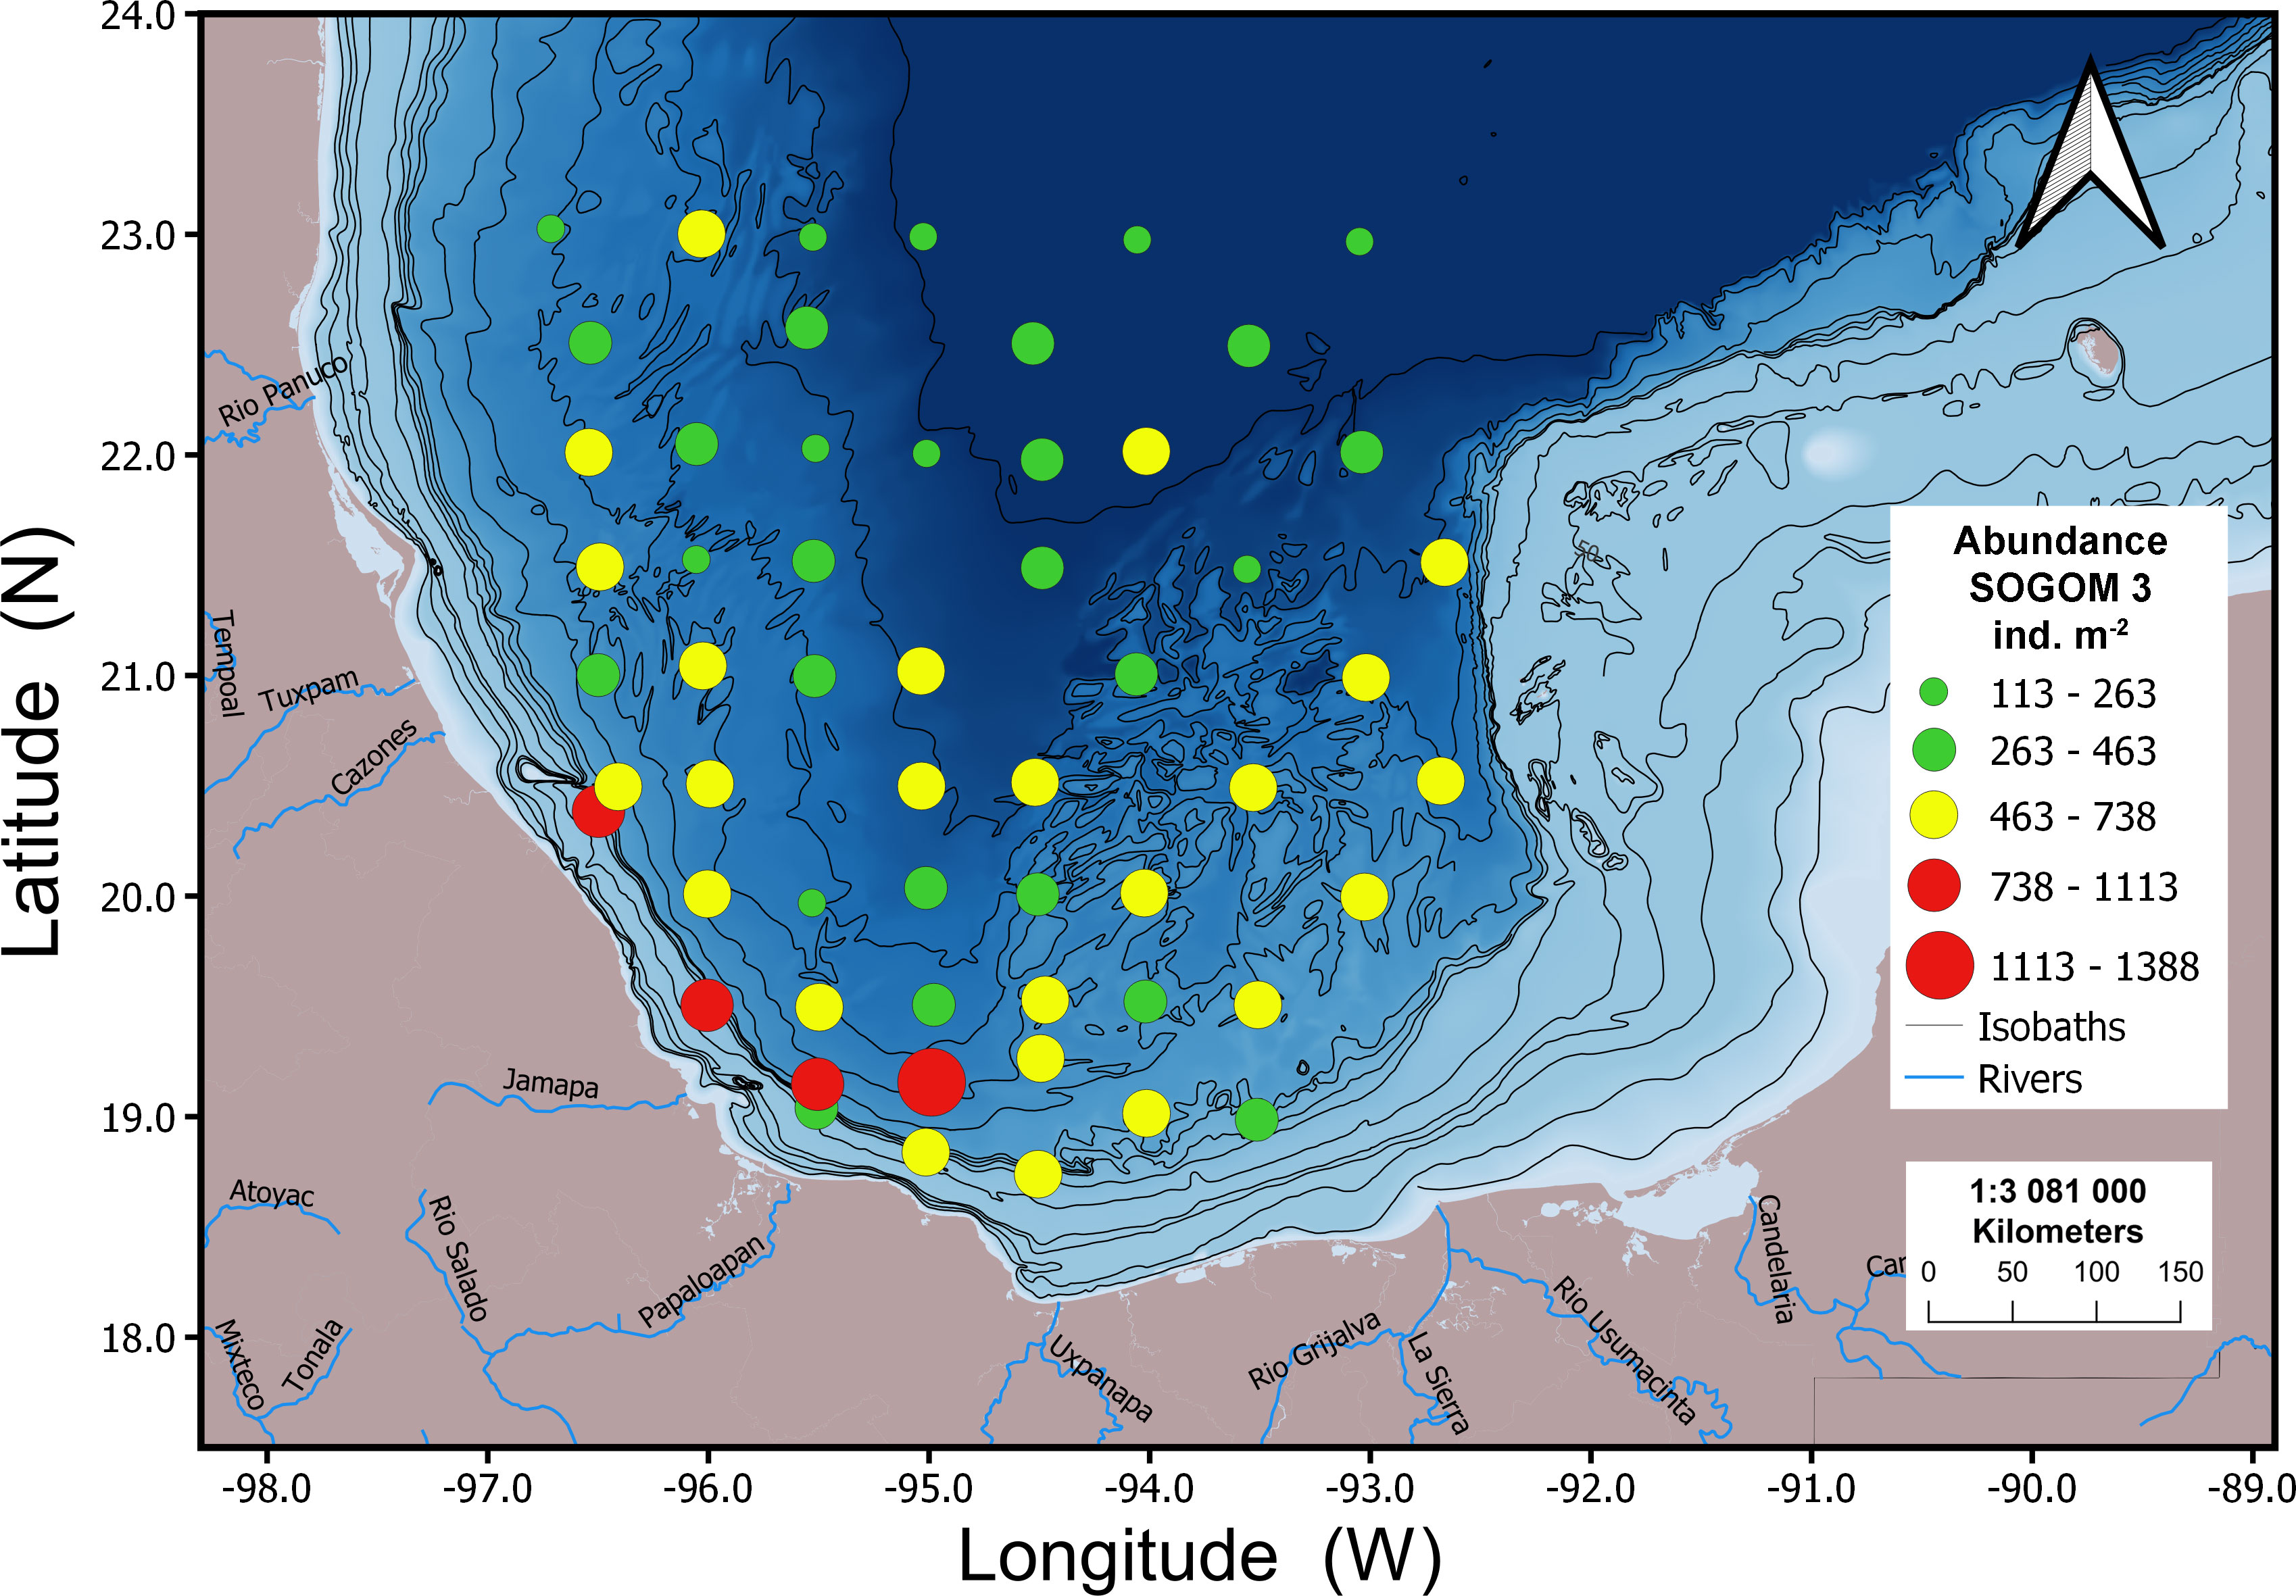
Figure 7 Geographic distribution of macrofauna abundance values for SOGOM 3.
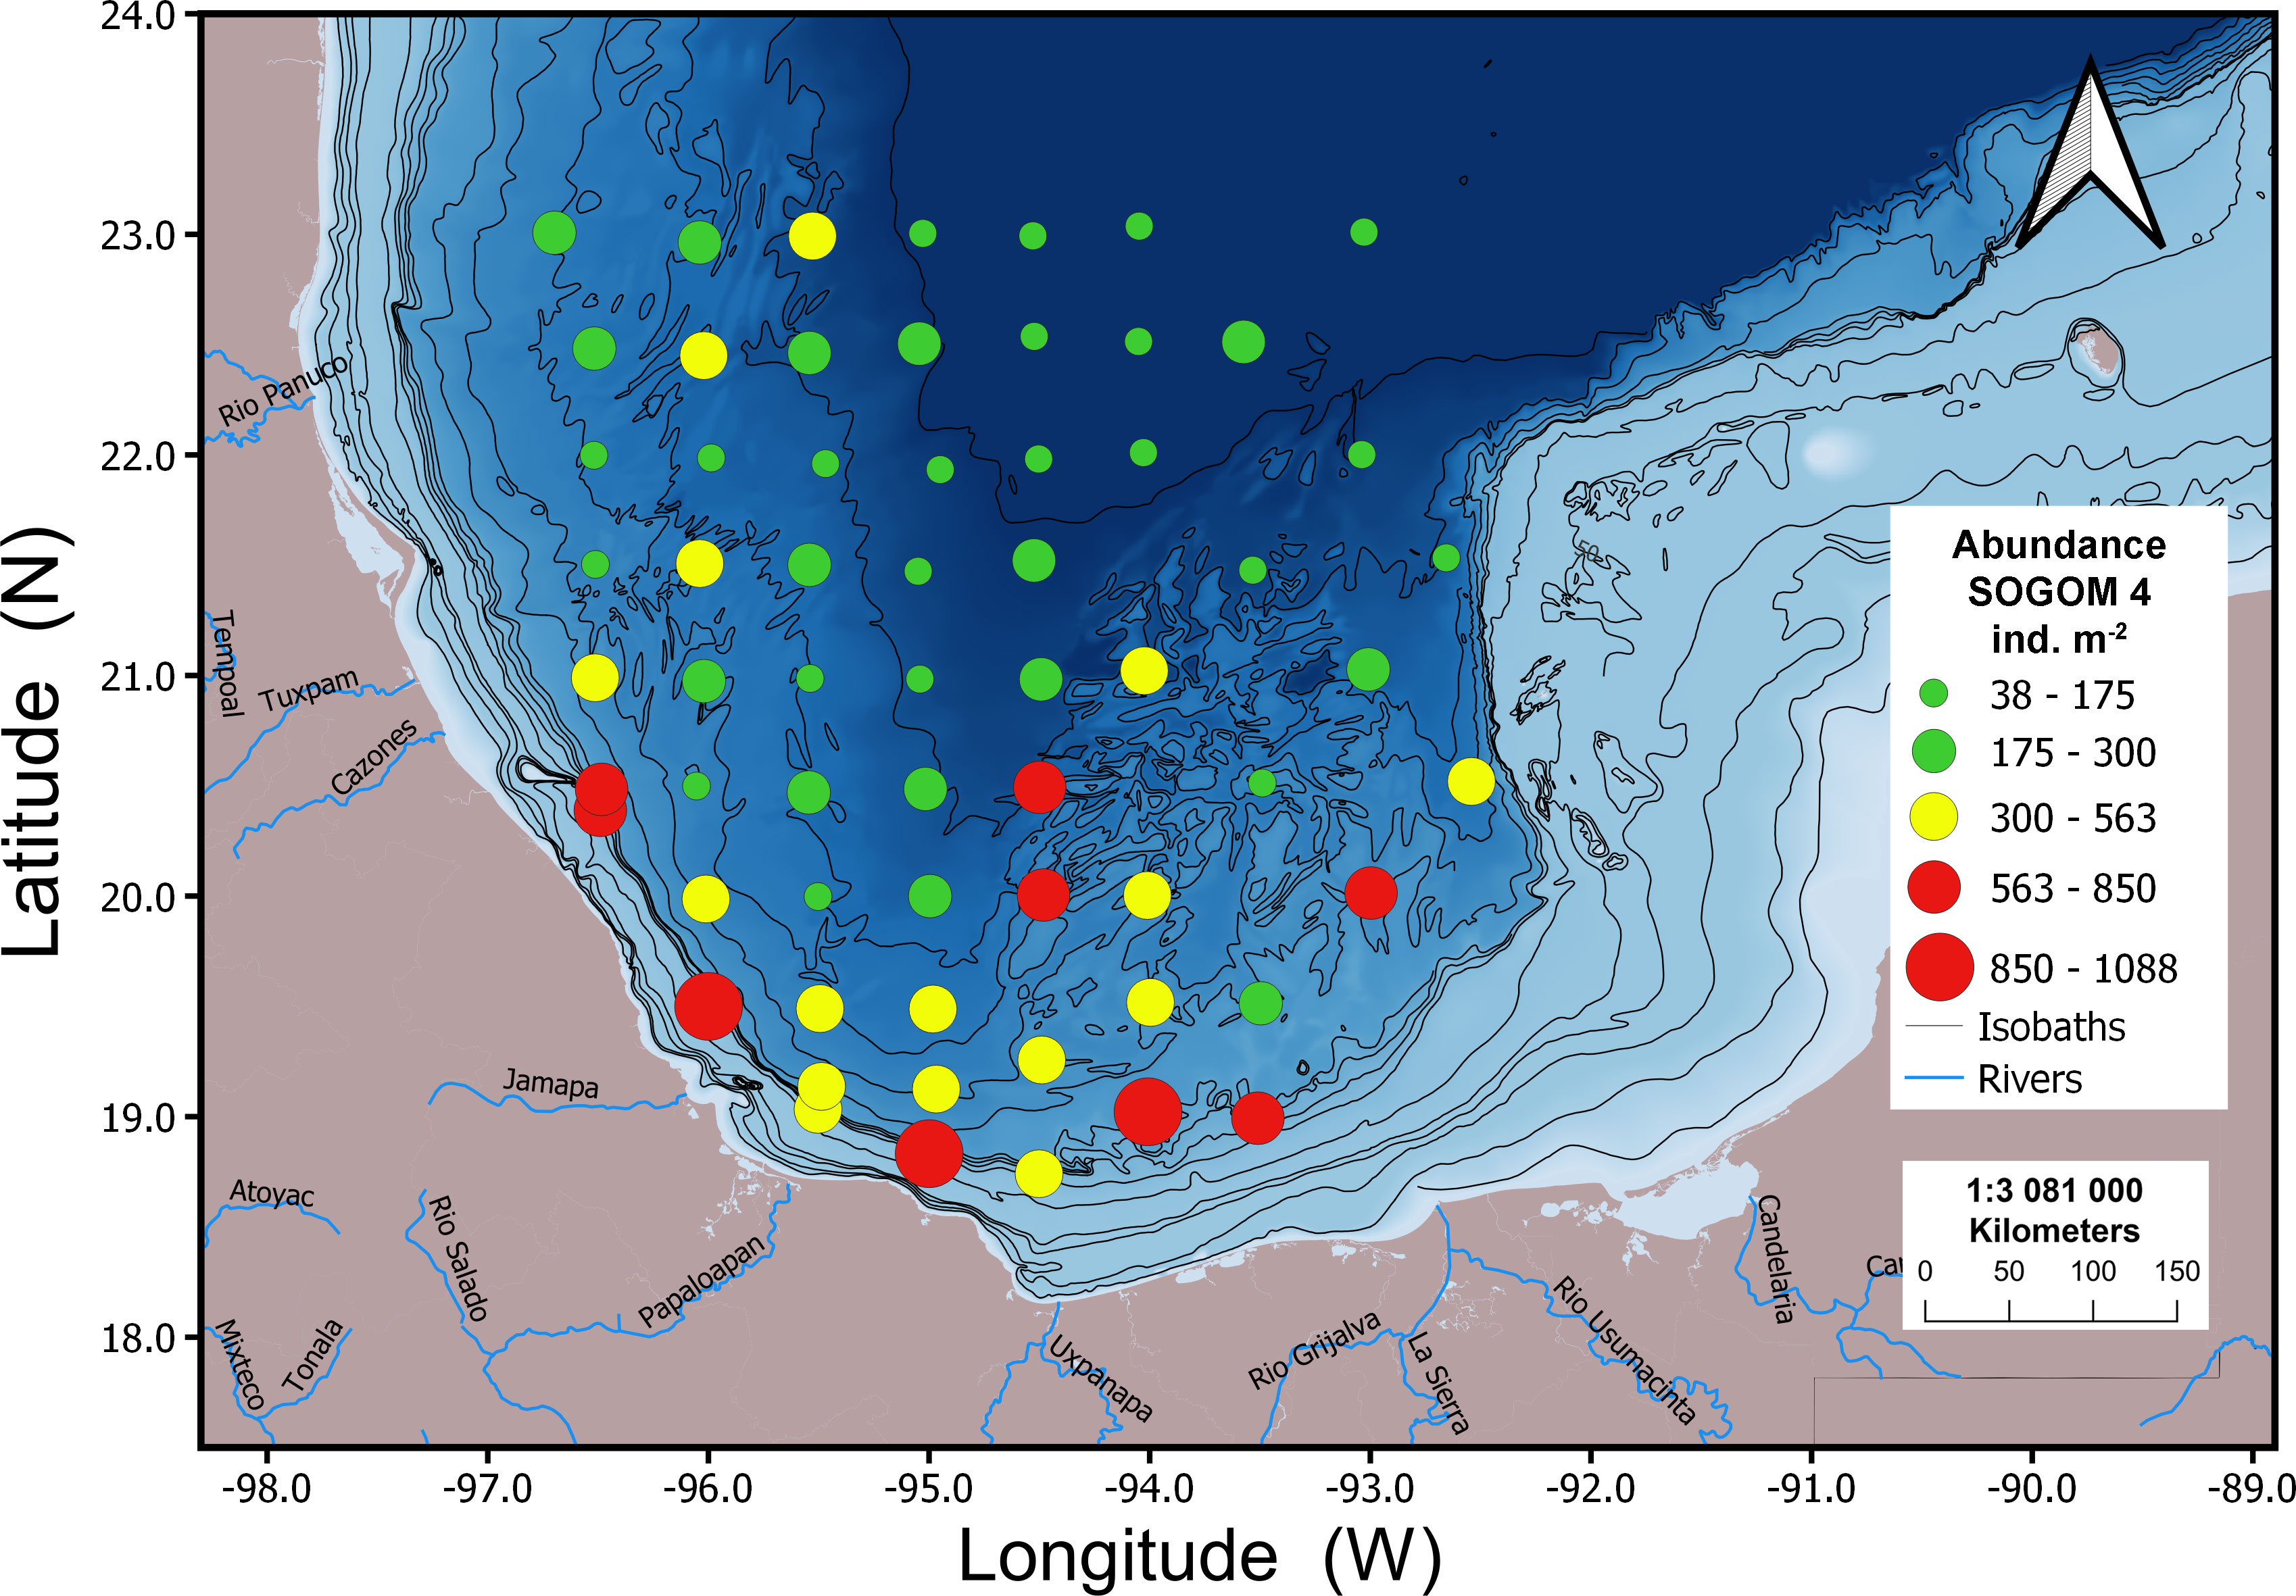
Figure 8 Geographic distribution of macrofauna abundance values for SOGOM 4.
3.3. Multivariate analysis
The SOGOM 3 nMDS analysis showed an overlapping of sampling sites corresponding to the three DCs. The SIMPROF groups plotted on the nMDS allowed to distinguish four groups. Groups I and II were mainly composed of sites near the coast of the southern region and of the UBZ DC. Remarkably, group I sites were characterized by high abundance values. Group III was dominated by AZ sites and some LBZ locations. Group IV included most of sampling sites of the three DCs (Figure 9A). The nMDS analysis of SOGOM 4 showed a general clearer pattern ordered in a bathymetric gradient (from the upper bathyal zone to the abyssal region) from left to right of the graph. The SIMPROF test of the cluster analysis allowed us to distinguish three main groups: group I composed by sites of the UBZ region and two sites of the LBZ. Group II was dominated by sites of the LBZ region, one site (59) of the abyssal region and five (6, 10, 19, 20 and 29) of the UBZ. Group III showed two sites (9 and 42) of the UBZ and sites of the LBZ and AZ, each one with 13 sampling sites (Figure 9B). The nMDS analysis of both cruises did not show a clear separation between them, although sampling sites of each cruise were ordered at opposite ends (Figure 10). The ANOSIM showed a slight, but significant difference (R = 0.206 p = 0.001) in the composition and structure of the macrofauna communities between cruises. These variations occur fundamentally in the deepest DCs. When comparing UBZ between cruises, no significant differences were found (R = 0.002 p = 0.393), however they were observed comparing LBZ (R = 0.24 p = 0.001) and AZ (R = 0.43 p = 0.001) between SOGOM 3 and 4. When we compared within each cruise, the ANOSIM showed the macrofauna communities changes across the bathymetric gradient. The greatest differences were registered when comparing UBZ with AZ (R: 0.231 p = 0.002; R: 0.458 p = 0.001 in SOGOM 3 and 4 respectively), while the smallest ones were recorded between adjoining DCs, particularly between LBZ and AZ (R: 0.046 p = 0.222; R: 0.125 p = 0.012 in SOGOM and 4, respectively).
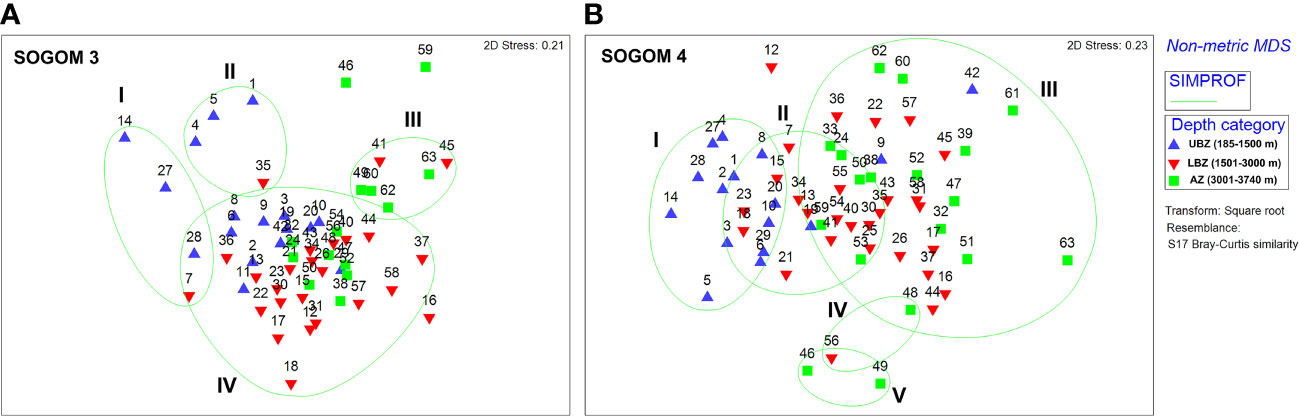
Figure 9 Non-metric multidimensional scaling of macrofauna communities of SOGOM 3 (A) and SOGOM 4 (B) with a classification analysis plotted (green line) based on Bray Curtis similarities. Upper bathyal zone (UBZ-blue triangles), lower bathyal zone (LBZ-red inverted triangles), and abyssal zone (AZ-green square).
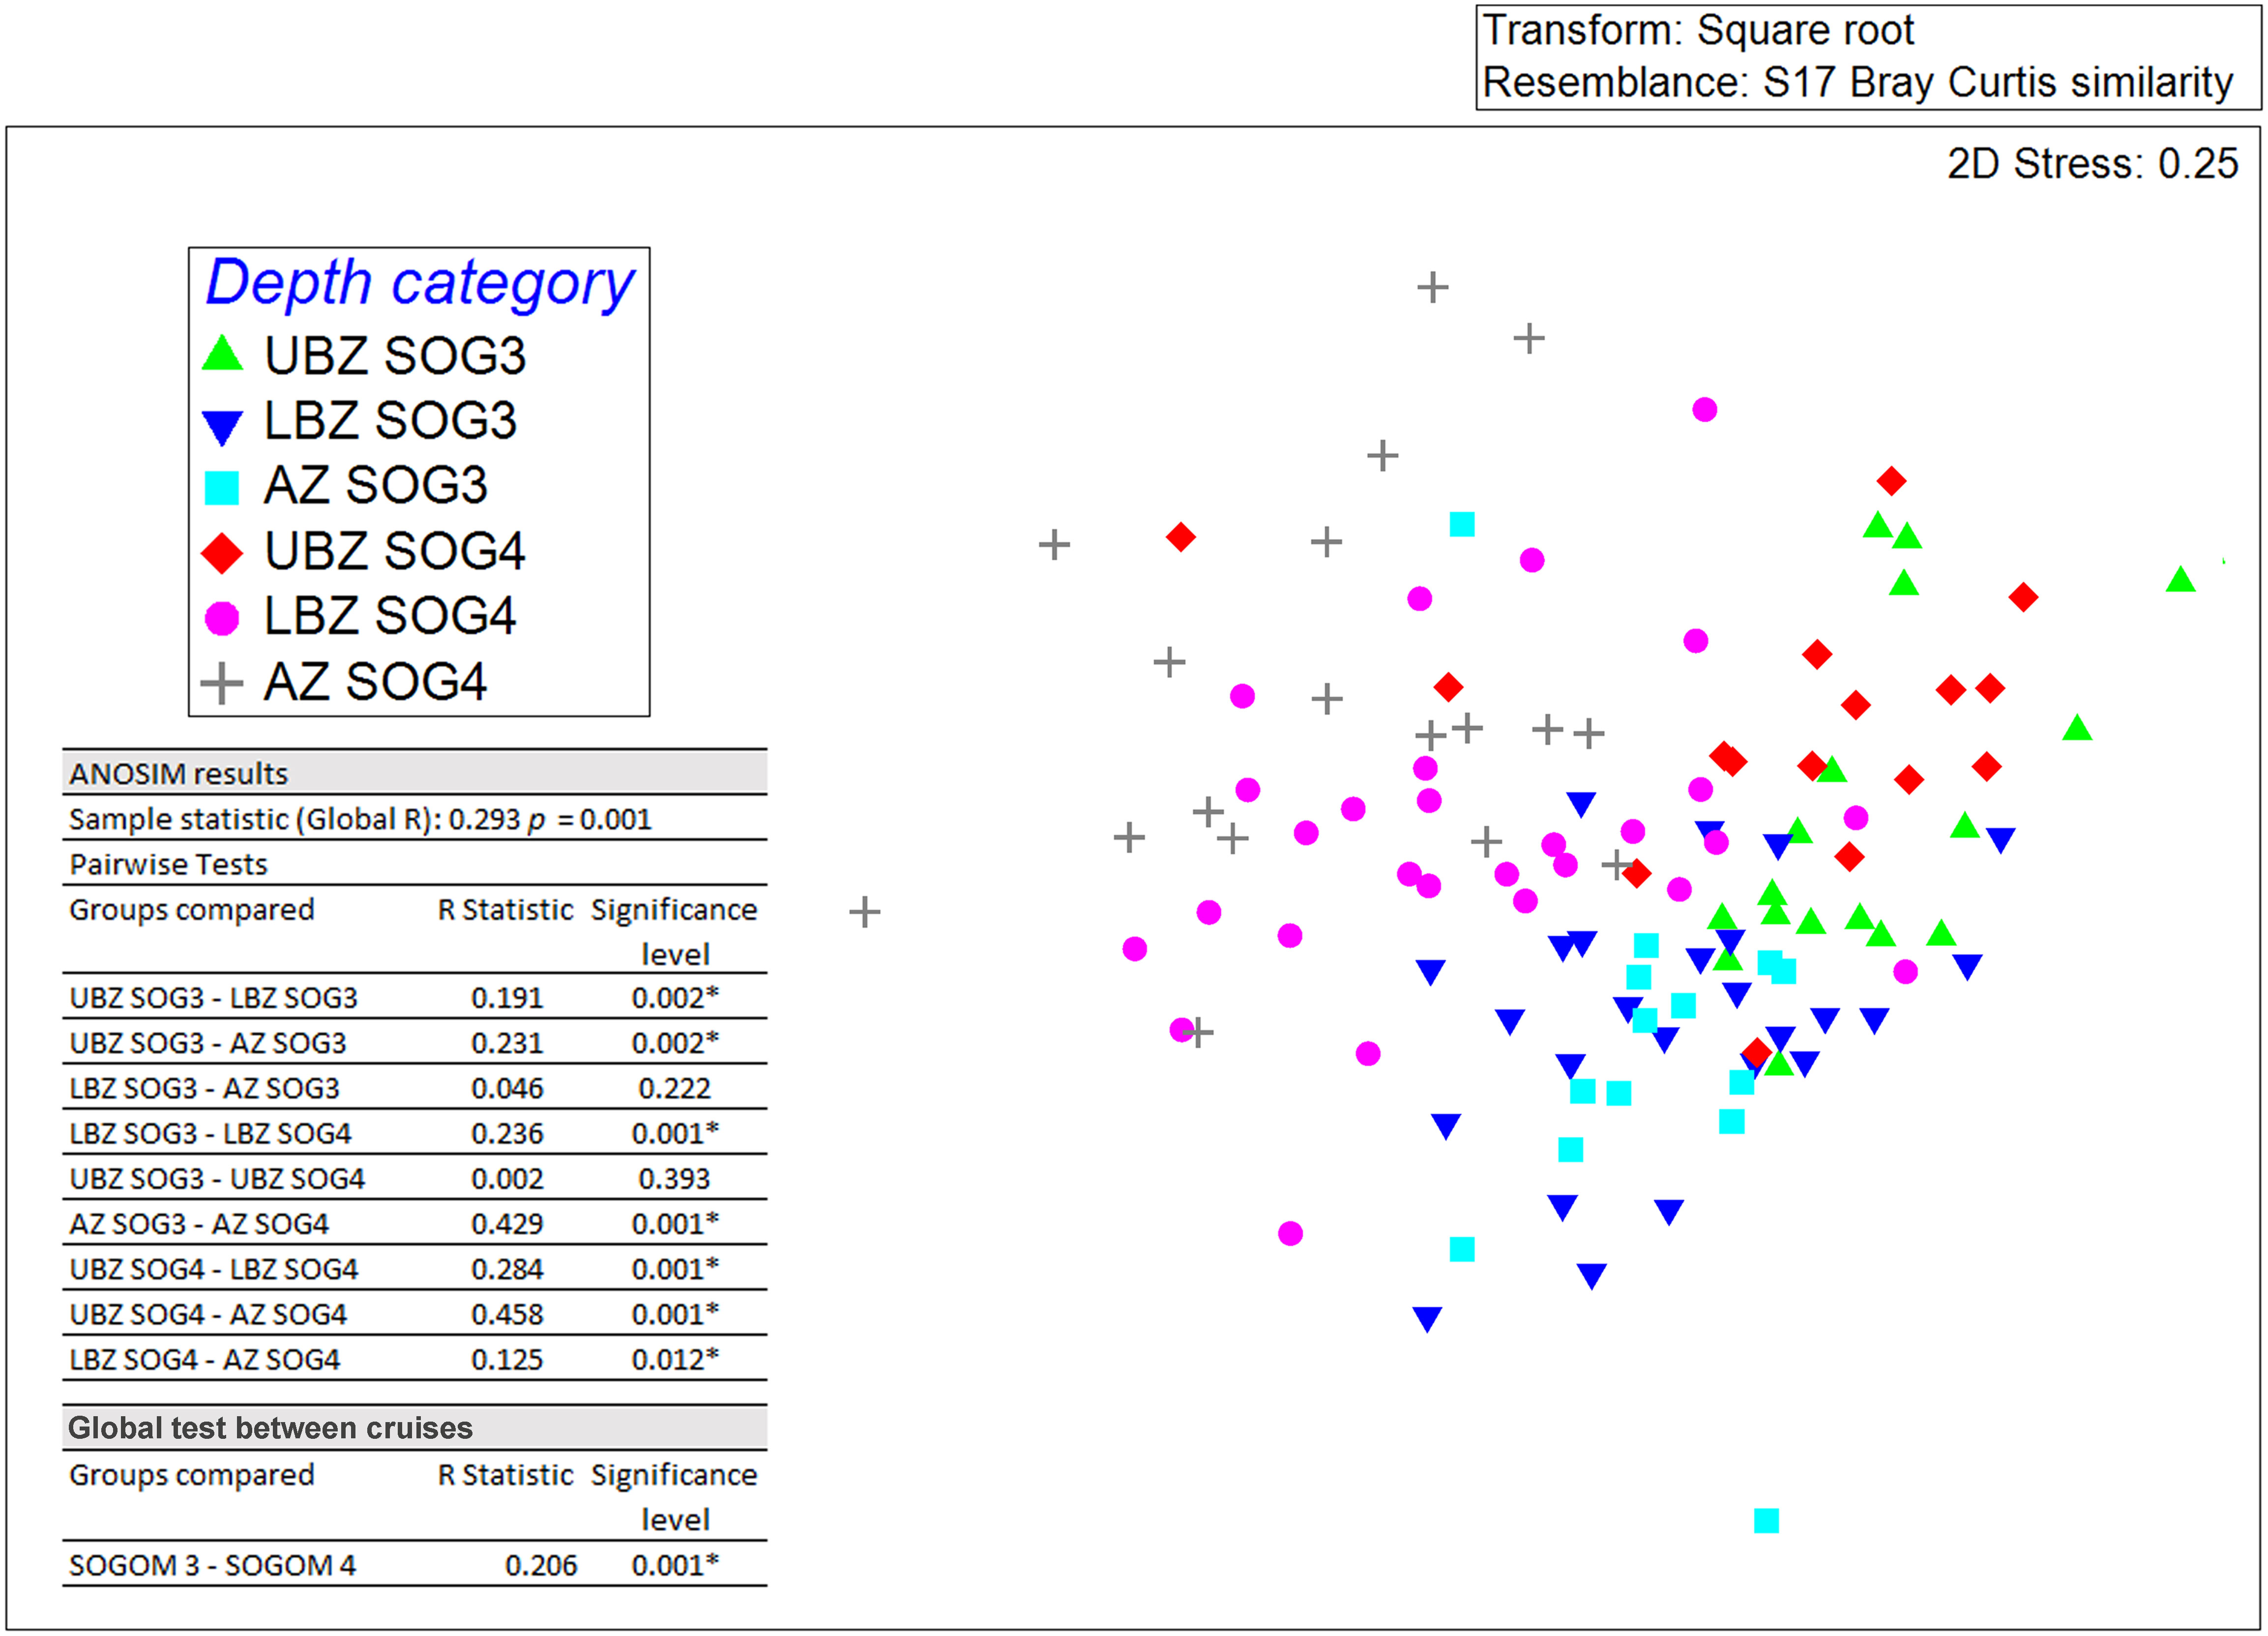
Figure 10 Non-metric multidimensional scaling of SOGOM 3 and SOGOM 4 macrofauna communities based on Bray Curtis similarities. Upper bathyal zone (UBZ), lower bathyal zone (LBZ), abyssal zone (AZ). UBZ in SOGOM 3 (green triangle), LBZ in SOGOM 3 (blue inverted triangle), AZ in SOGOM 3 (light blue square), UBZ in SOGOM 4 (red diamond), LBZ in SOGOM 4 (pink circle), AZ in SOGOM 4 (gray cross).
Abundance rank curves showed bathymetric variations in the composition and structure of the macrofaunal community. In SOGOM 3, the taxa that mainly contributed to abundance were essentially the same (Polychaeta, Nematoda and Amphipoda) in the three DCs. Bivalvia was the fifth taxon in ranking abundance in the three DCs. Sipuncula abundance decreased with increasing depth while Harpacticoida showed the reverse pattern. Porifera and Tanaidacea showed a parabolic shape pattern with the highest contribution to abundance in LBZ and the lowest in UBZ and AZ. In general, during SOGOM 4 Polychaeta, Nematoda and Tanaidacea were the taxa that most contributed to abundance in the three DCs. Amphipoda was ranked fifth in the UBZ and LBZ and sixth in AZ. Bivalvia was sixth in ranking abundance in UBZ and fourth in LBZ and AZ. Sipuncula showed the same pattern as in SOGOM 3 decreasing its contribution to total abundance with increasing depth. Porifera and Harpacticoida again showed an inverse pattern to that of Sipuncula, their contribution to abundance being more important with increasing depth (supplementary data).
The BIOENV analysis included nine abiotic factors (longitude W, depth (m), temperature (°C), dissolved oxygen (ml l-1), polycyclic aromatic hydrocarbons (µg kg-1), aliphatic hydrocarbons (µg kg-1), d13CVPDB‰, organic matter (%) and clay (%)). Four environmental variables were then excluded due to their strong correlation with other abiotic factors. In SOGOM 3, salinity was highly correlated with bottom water dissolved oxygen concentration, and carbonate content with sediment organic matter content. While, in SOGOM 4 the highest correlation was between salinity and temperature, and carbonate with depth. In addition, latitude and sediment silt content were also excluded from the analysis, as they were strong correlated with depth and sediment clay content in both oceanographic cruises, respectively. The environmental parameter combination (up to 4 factors) that showed the best match with biotic similarity matrices using the Spearman rank correlation were temperature, dissolved oxygen, aromatic hydrocarbons, and organic matter in SOGOM 3 with a 0.358 correlation (p = 0.001) with none permuted statistic greater than Rho. Meanwhile, in SOGOM 4 depth was the environmental parameter that showed better correlation (0.337) with biotic similarity matrices (p = 0.001).
3.4. Biodiversity estimates
In the analysis of diversity we registered a sample coverage higher than 0.996 for all DCs in both cruises, except AZ in SOGOM 4 that registered 0.988 SC. The sampling curves analysis showed that LBZ registered the highest diversity values in both cruises based on the three Hill numbers analyzed (q = 0, 1, 2), also sharing higher values with AZ during SOGOM 3 with q = 2. However, a close comparison (0.995 sample coverage) showed that there were no significant differences of taxonomic richness among DCs during SOGOM 4 and during SOGOM 3 LBZ was more diverse than AZ and did not present significant differences with UBZ. In the case of the Shannon and Simpson diversity, in both cruises, LBZ was more diverse than UBZ and did not present significant differences with AZ. (Figures 11, 12 and Supplementary data).
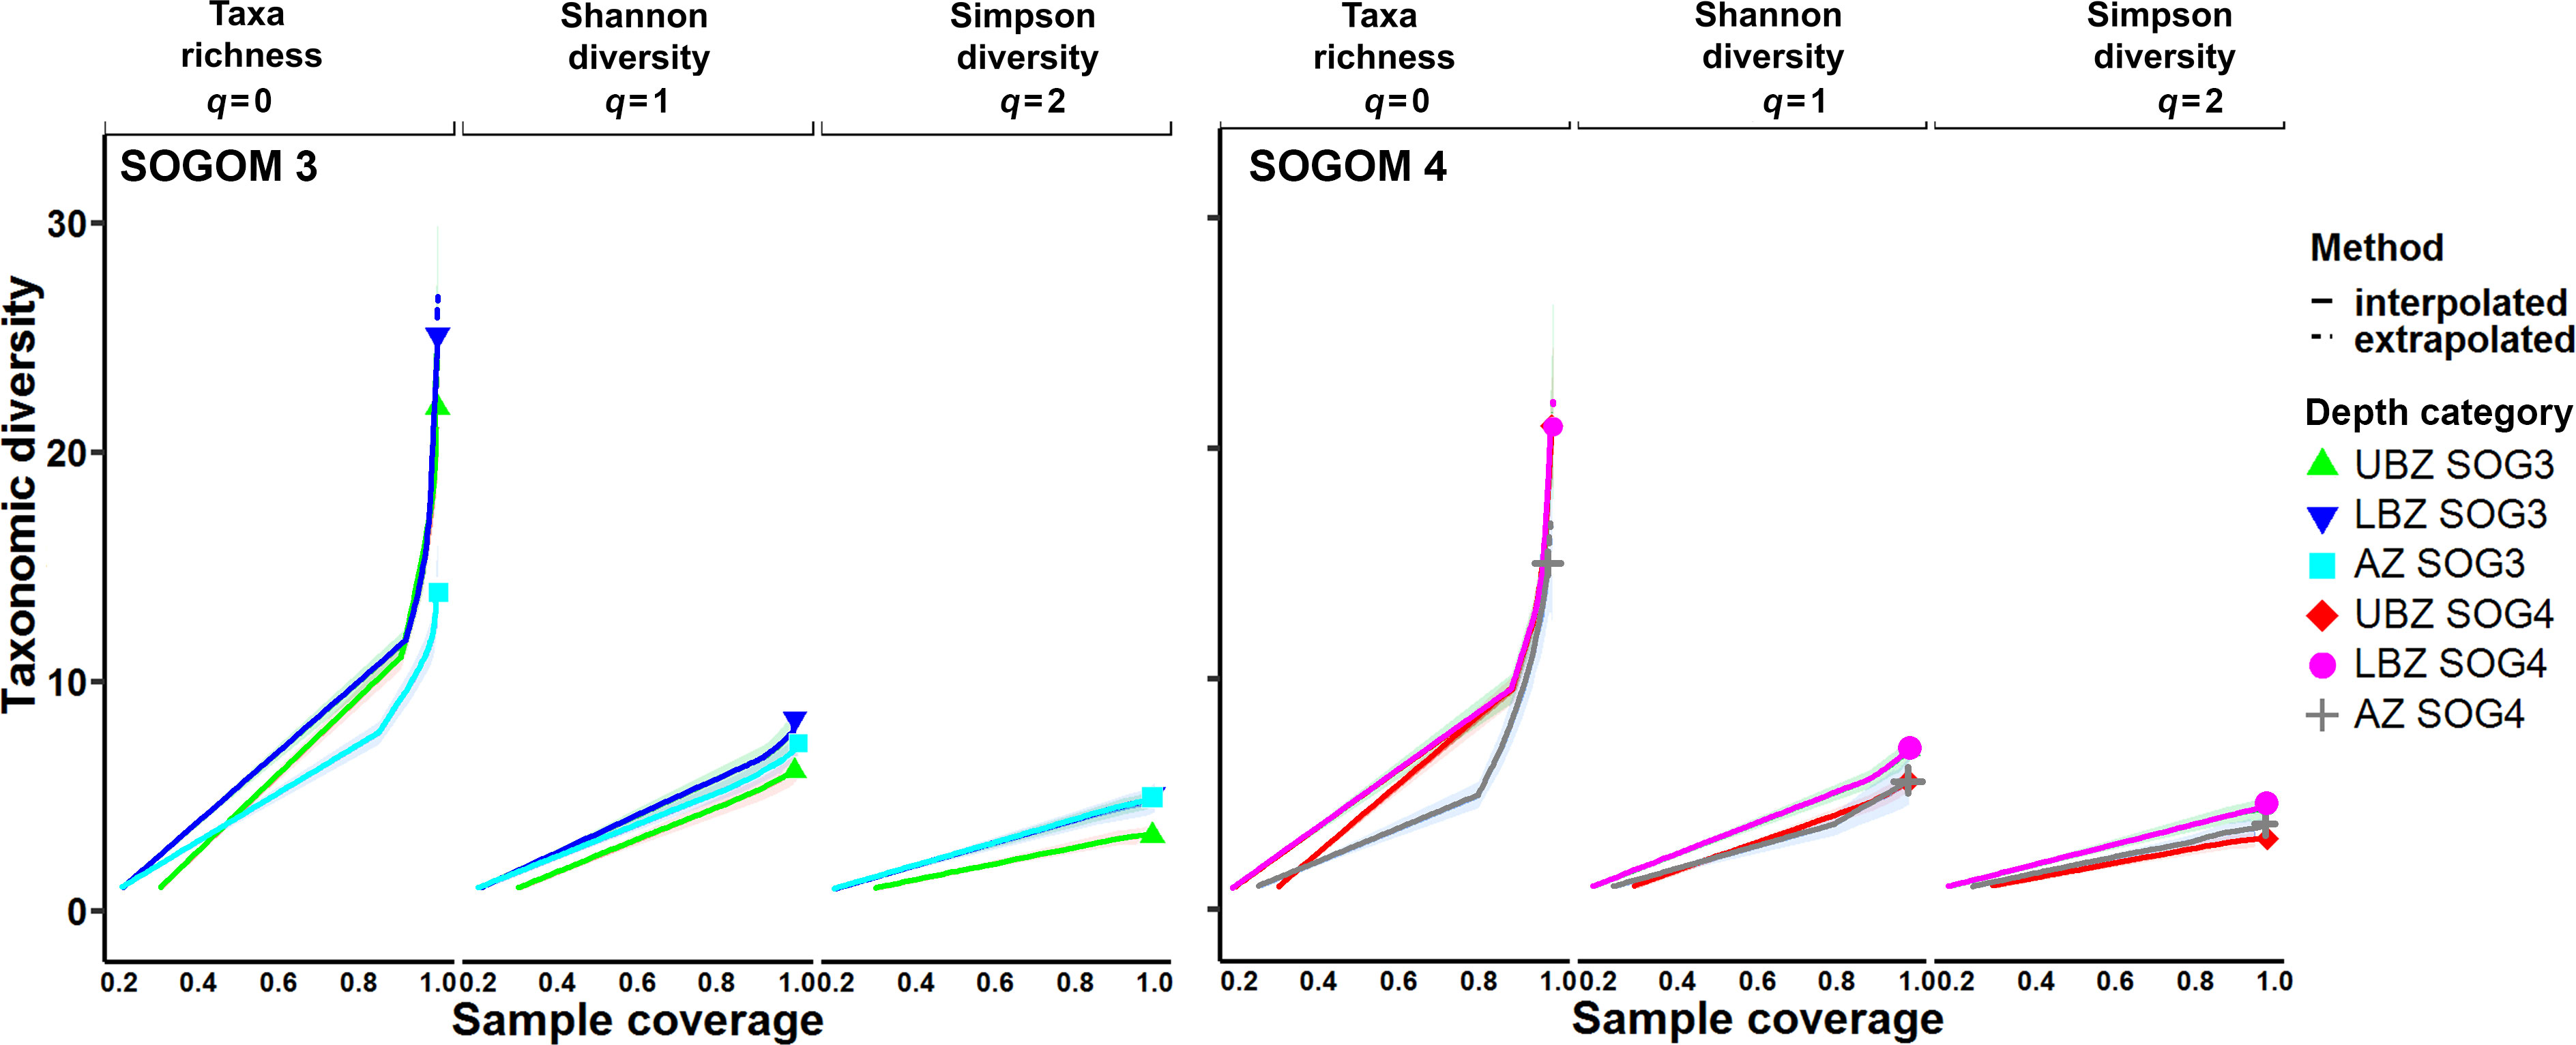
Figure 11 SOGOM 3, and SOGOM 4 coverage-based R/E (rarefaction and extrapolation) sampling curves for three Hill numbers (q = 0, 1, and 2). Upper bathyal zone (UBZ); lower bathyal zone (LBZ) and abyssal zone (AZ).
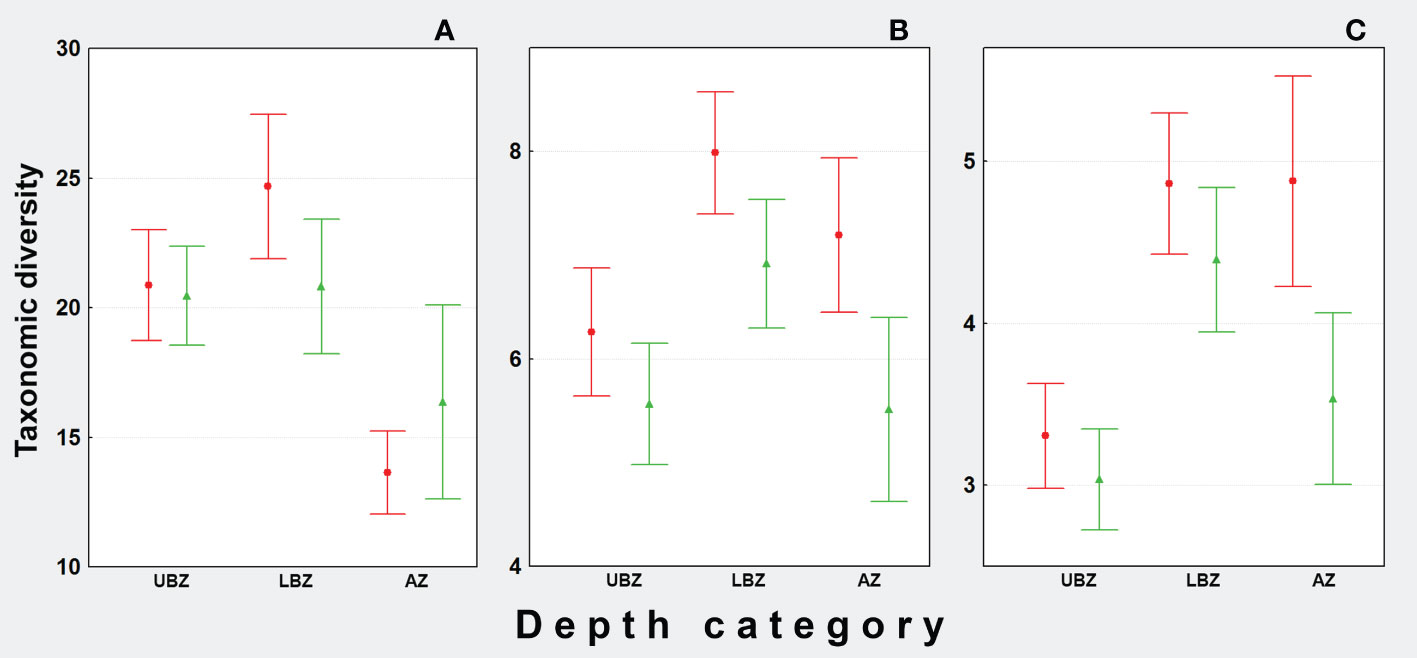
Figure 12 Punctual comparison (0.995 sample coverage) of taxonomic richness (q = 0) (A), Shannon diversity (q = 1) (B) and Simpson diversity (q = 2) (C) during SOGOM 3 (red) and SOGOM 4 (green). Upper bathyal zone (UBZ), lower bathyal zone (LBZ), abyssal zone (AZ).
The diversity profiles of SOGOM 3 based on Hill numbers 0 to 2 showed a range from 20.3 to 4.2 in average Alpha diversity, from 1.2 to 1.0 in Beta diversity, and from 25 to 4.4 in Gamma diversity. The Alpha diversity profile revealed that AZ had more evenness than LBZ, and UBZ (Supplementary data). In SOGOM 4 we registered values between 19.0 and 3.6 in average Alpha diversity, between 1.3 and 1.0 in Beta diversity, and between 24 and 3.7 in Gamma diversity using Hill numbers 0 to 2. The Alpha diversity profile showed that LBZ, and AZ had relative more evenness than UBZ (Supplementary data).
Diversity values (taxonomic richness q = 0) according to geographic distribution in SOGOM 3 showed that low diversity occurred in all regions of the study area. The intermediate values were found in the central region including the Coatzacoalcos Canyon, part of the Campeche Bay saline domes zone, two sites in the Campeche Canyon and five more in the northwestern region. The highest diversity values were associated with localities in the bathyal region in the south and northwest of the study area, besides, one site in the abyssal plain (Figure 13). In SOGOM 4 locations with low diversity records were also spread out along the study area. The highest values were again recorded in the bathyal zone of the northwestern region, two sites in the southwestern region and two more in the abyssal zone. Whereas, in the northern region of the study area, and in the Campeche Bay salt domes zone and in the Campeche Canyon, we registered intermediate diversity values (Figure 14).
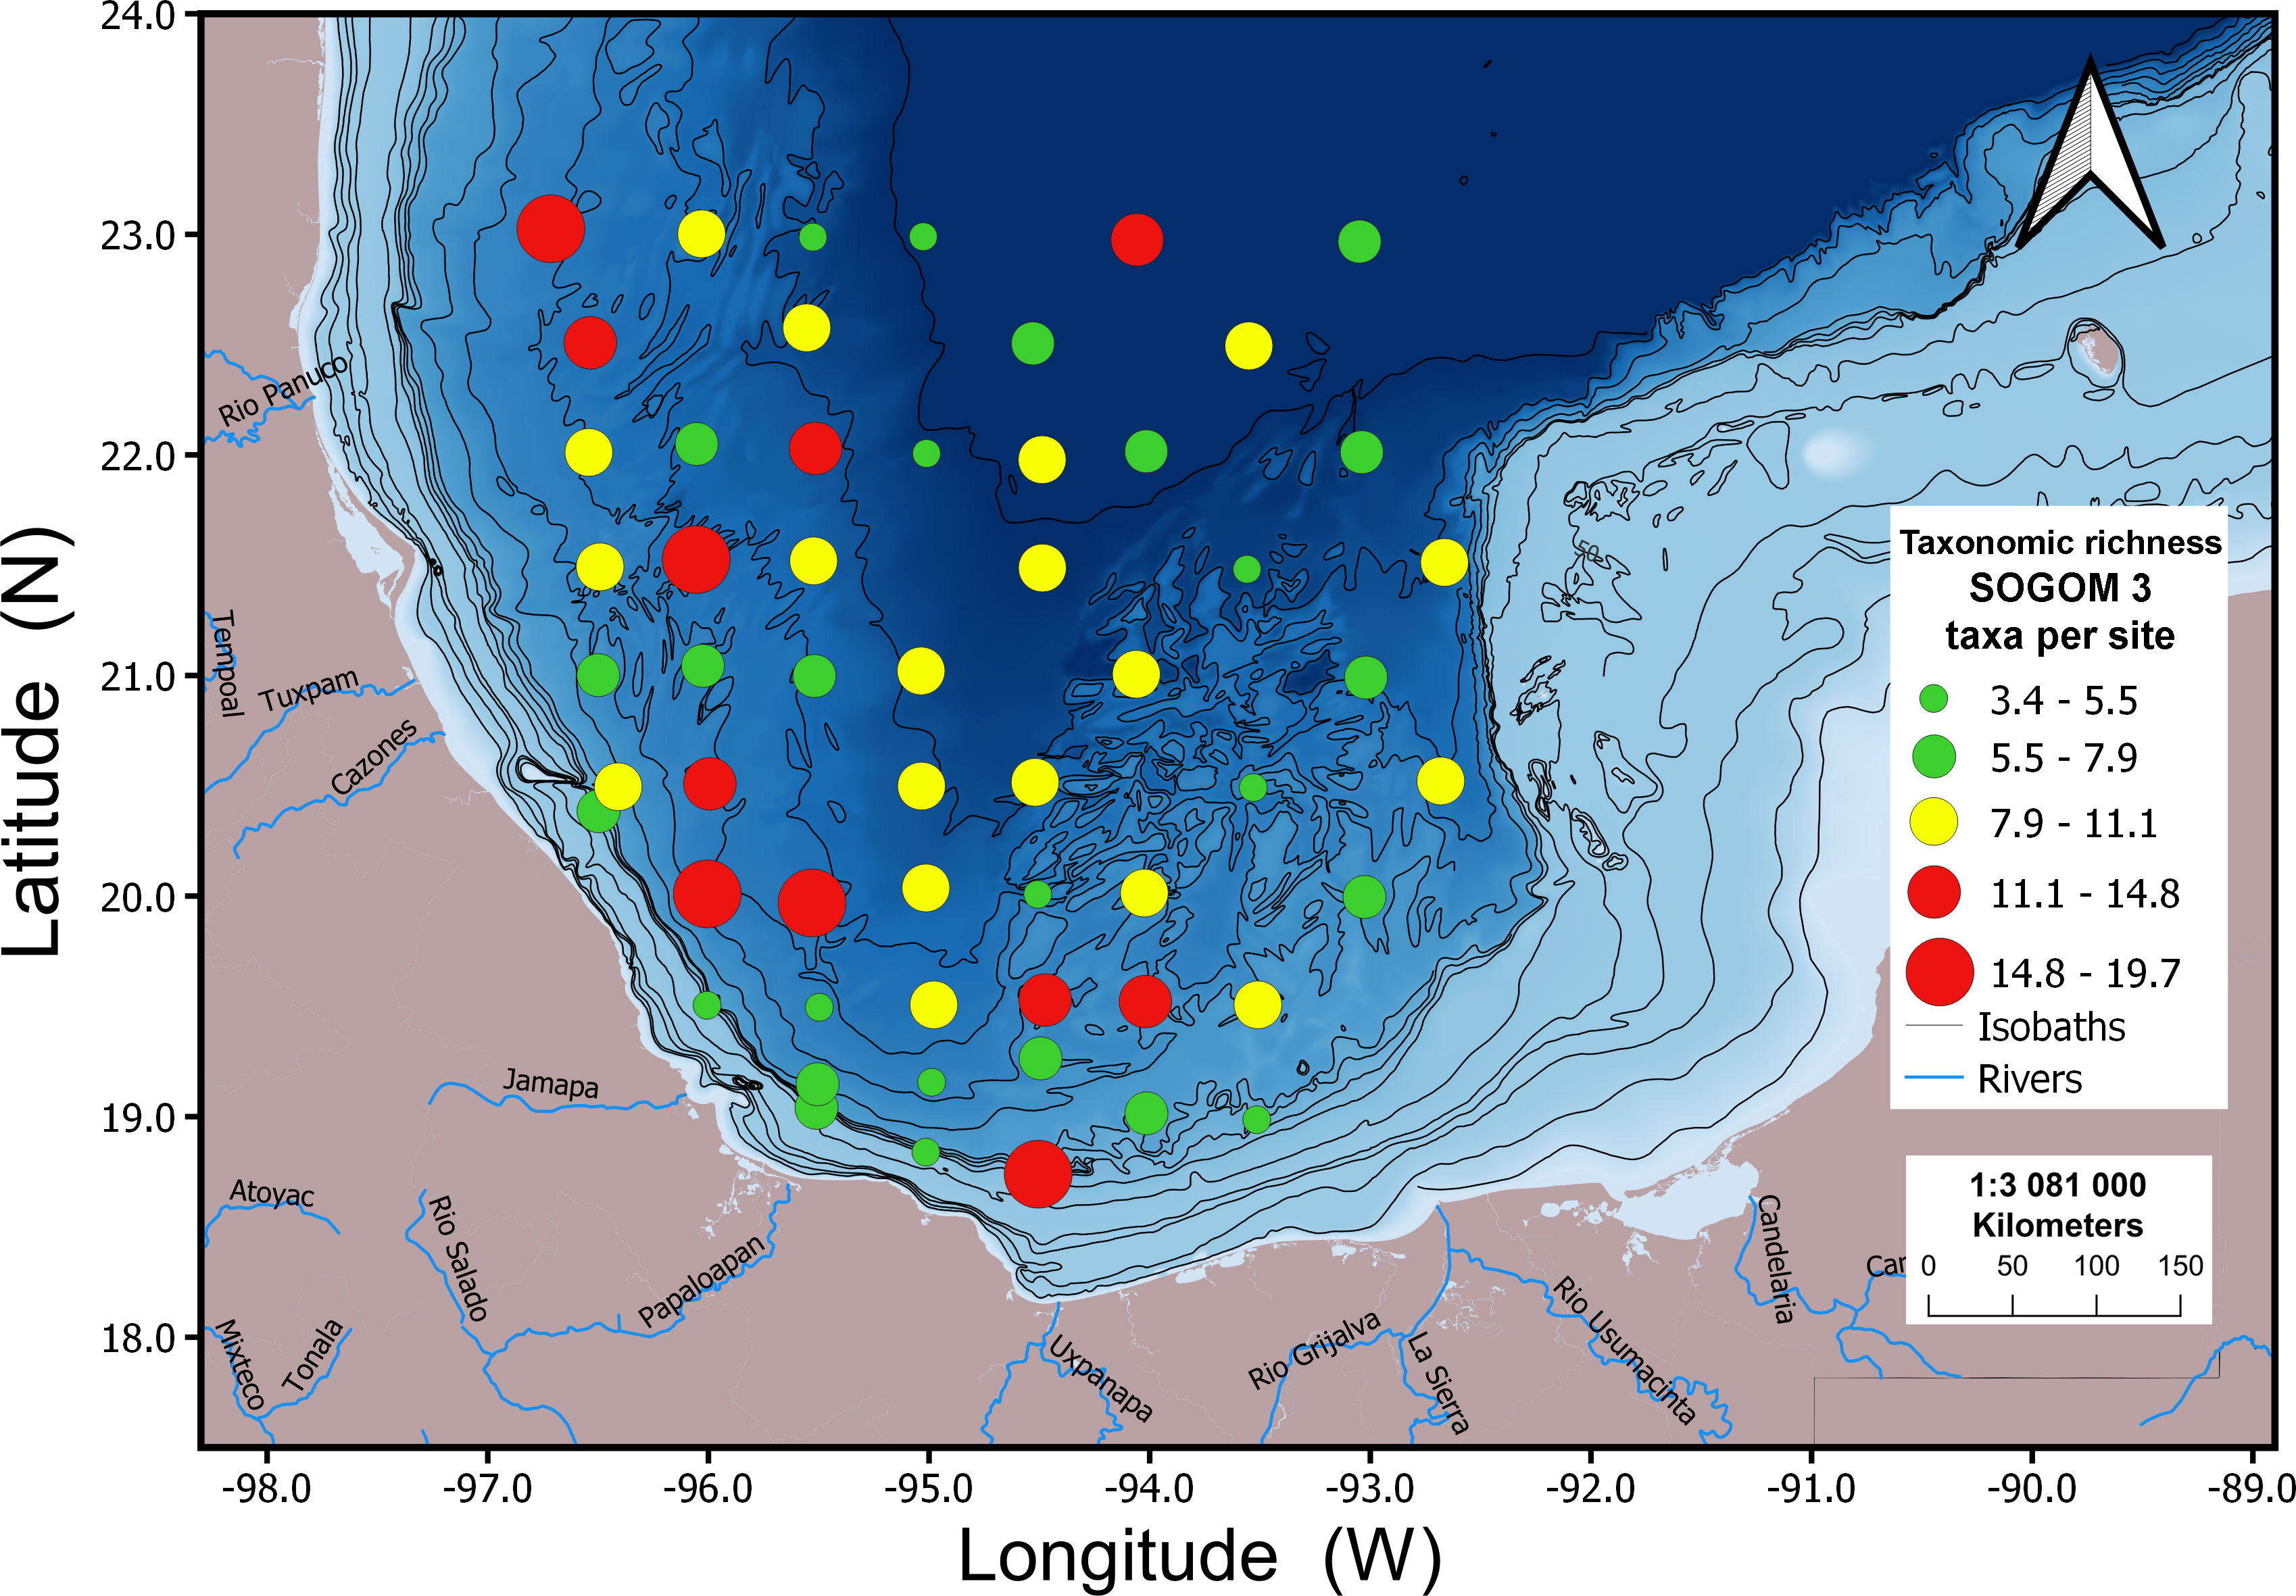
Figure 13 Geographic distribution of macrofauna diversity values for SOGOM 3.

Figure 14 Geographic distribution of macrofauna diversity values for SOGOM 4.
4. Discussion
4.1. Abiotic factors
The bottom water environmental variables showed a same pattern in both cruises. Dissolved oxygen, and temperature values registered relative high variation ranges in the 185-1200 m depth interval (range: 2 to 3.5 ml l-1, and 19 to 5° C, respectively) compared to higher depths where variation was minimal (4.0-4.7 ml l-1 and temperature close to 4° C, respectively). Also, salinity values stabilized at 35 PSU near 650 m depth in both cruises. These values agree with the North Atlantic Deep Water (NADW) characteristics registered under 1000 m depth with temperature close to 4° C, 35 PSU salinity and dissolved oxygen concentration higher than the overlying layer (Rivas et al., 2005).
Sediment composition varied with depth in both cruises; such pattern consisted in a clay increase, and a silt concentration decrease with increasing depth and with sand values below 0.3%. This pattern was previously documented in the southwestern GoM (Díaz-Asencio et al., 2019) where terrigenous sediments predominate (Balsam and Beeson, 2003; Díaz-Asencio et al., 2019) with an important component of carbonated biogenic sediments that increase their concentration with depth and distance from the coastline (Balsam and Beeson, 2003). Although we did not record clear variations in sand concentration between cruises, we consistently recorded high silt and low clay concentrations in SOGOM 3 compared to SOGOM 4 in the two deepest DCs. The sediment carbonate concentration also presented a depth-related pattern with the highest values found in the deepest zone of the study area. This pattern agrees to that reported by Balsam and Beeson (2003) who recorded values of up to 50% in the abyssal zone and 75% near the Yucatan shelf.
OM content (%) varied with depth in both cruises; such pattern consisted in highest values in shallower sites close to the coast and lower ones in deeper sites. The δ13C analysis did not give clear results about marine and terrigenous sediment ratios. The values were consistently higher in SOGOM 3. We registered a range of -27.19‰ to -33.06‰ with a -28.63‰ ± 0.8‰ average in SOGOM 3 and a -27.45‰ to -33.01‰ range, and an average -30.63‰ ± 1.1‰ in SOGOM 4. These values could be due to the presence of carbon fixed by chemosynthetic communities (Paull et al., 1985; Brooks et al., 1987; Demopoulos et al., 2010) typical of hydrocarbon infiltration zones which have been recorded in the study area (Sahling et al., 2016). Our results contrast with some records reported by González-Ocampo et al. (2007) (–25.39‰ to –20.95‰, average of –22.9‰ ± 0.9‰) in the region. However, they fit well with data registered by Gracia (2010) in a large area and wide bathymetric range in the southern GoM along ten years whose average varied between-26.62‰ a -31.17‰ in a general range of -24.82‰ a -36.09‰.
Sediment hydrocarbon concentrations varied between cruises. Average aliphatic hydrocarbon value in SOGOM 3 was higher than SOGOM 4 (3347 µg kg-1 ± 867 µg kg-1 vs. 2739 µg kg-1 ± 673 µg kg-1), whereas average aromatic hydrocarbon value was relatively lower in SOGOM 3 compared to SOGOM 4 (72 µg kg-1 ± 14 µg kg-1 vs. 88 µg kg-1 ± 18 µg kg-1). However, a general pattern of higher sediment hydrocarbon concentration in sites located in the southern region near the coast was apparent. This pattern was more consistent in PAHs sediment concentration for both cruises, as high aliphatic hydrocarbons values were recorded in the abyssal zone during SOGOM 4. The high PAH concentrations in the UBZ of the southern area can be explained by the presence of numerous oil seeps found in this area, oil platform activities and the influence of several rivers that introduce pollutants to the marine environment (Gracia et al., 2014). The PAH concentration range (56-125 µg kg-1, and 59-158 µg kg-1 for SOGOM 3 and SOGOM 4, respectively) is within the range reported for the Southern Gulf of México and, (albeit within the lowest values) within the interval recorded in the adjacent oil platform area (16–953 µg kg-1) located in the continental shelf (Gracia et al., 2016a; Gracia et al., 2016b), and similar to values (84 µg kg-1- 158 µg kg-1) registered in sediments of the deep zone of the north of the GoM (Adhikari et al., 2016). Although PAHs represented a minimal fraction of the total hydrocarbons recorded (3% in SOGOM 3 and 4% in SOGOM 4), they are a fraction of biological importance due to their high toxicity by their mutagenic effects. (Hatami et al., 2021; Billah et al., 2022). In addition, they were among the set of environmental factors most related to the fauna distribution during SOGOM 3. The presence of these pollutants could be influencing the composition of the communities, favoring the presence of taxa capable of resisting their effects to some extent. In the study area, Capitellidae, a taxon documented as tolerant to the presence of some PAHs (Bach et al., 2005), has been recorded as one of the dominant families within the polychaetes (Quintanar-Retama et al., 2022)(also the dominant taxon in this study). In the region, the dominance of deposit feeders has also been documented (Quintanar-Retama et al., 2022), which, due to their bioturbating activity, promote the burial of pollutants, reduce their bioavailability (Timmermann et al., 2008; Konovalov et al., 2010), and favor the establishment of macrofaunal communities.
The UBZ can be characterized as a region that presents important DO concentrations, salinity and temperature variations, high OM and silt concentrations, low carbonate and clay in sediments and high aromatic hydrocarbons values. Whereas the LBZ and AZ regions were described by a high DO, salinity and temperature stability, low OM and silt values, high carbonate and clay values and relatively lower aromatic hydrocarbons in sediments. All these environmental factors have been related to the deep sea benthic communities distribution. Temperature and hydrostatic pressure have been documented as promoters of faunal zonation because they establish a physiological bottleneck that prevents the broad bathymetric distribution of species from shallow areas (Allen, 2008; Brown and Thatje, 2014). Adaptations such as increased mitochondrial concentration and adoption of enzymes more efficiently at low temperatures have been documented (Clarke, 1998). The importance of temperature as a structurer of benthic communities in the deep sea can be seen in the distribution pattern observed in regions such as Antarctica where the bathymetric gradient does not imply a significant temperature gradient and it is very common to record eurybathic species (Brey et al., 1996; Brandt et al., 2007) in such a way that the typical zonation of temperate or tropical regions is not usually recorded. Also, oxygen (Levin and Sibuet, 2012) and the organic matter availability (Cosson et al., 1997; Mamouridis et al., 2011; Bernardino et al., 2016; Brandt et al., 2018; Guggolz et al., 2018) has also been shown to be important factors for the distribution of deep-sea benthic communities.
4.2. Fauna description
The most abundant taxa (Polychaeta, Nematoda, Amphipoda, Tanaidacea and Bivalvia) with polychaete dominance in the macrofauna communities that we registered (43% in SOGOM 3 and 46% in SOGOM4) agrees with those reported in other studies of deep sea macrofauna. (Hessler and Sanders, 1967; Hessler and Jumars, 1974; Alongi, 1992; Brandt and Schnack, 1999; Paterson et al., 2009; Bernardino et al., 2016; Brandt et al., 2018; Brandt et al., 2019, Hernández-Ávila et al., 2021). It is interesting to note that Isopoda was not recorded within the five most abundant taxa even that it usually is a dominant taxon in the macrofauna (e.g. Brandt et al., 2019). Specially the very diverse and widely deep sea distributed Asellota suborder (Wilson, 2008) which can represent up to 97% of the isopods collected in this environment (Brandt et al., 2007). We recorded a relative isopods abundance lower than tanaidaceans and amphipods (4% in SOGOM 3 and 3% in SOGOM 4). Nonetheless, the isopods were among the six taxa with the highest number of records in both cruises.
The bathymetric pattern of the relative abundance of macrofauna taxa was similar in both cruises. In general, Polychaeta abundance decreased with increasing depth. This trend within the benthic macrofauna communities has already been documented in other seas (Brandt et al., 2018) and in the study area (Quintanar-Retama et al., 2022) and is partly due to the dominance of other groups like crustaceans in the low bathyal, and abyssal regions (Brandt et al., 2018). The polychaetes relative abundance decreasing pattern was more evident up to 2300 m depth. In deeper sites, the polychaete abundance did not show a clear pattern in both cruises, although average values recorded were important (35% in SOGOM 3 and 44% in SOGOM 4). Nematodes showed a same bathymetric pattern in both cruises, characterized by low abundance up to 600 m and by relative high values, in deeper sites. This group is an important component of deep-sea infauna communities (Sharma et al., 2011; Baldrighi et al., 2014) but often it is not considered in macrofauna studies because it is a typical taxon of meiofauna communities (Higgins and Thiel, 1988; Giere, 2008). Even though the genera present in the macrofauna retained in sieves larger than 300 microns are usually different from those retained between 45 and 300 microns, besides, they present lower densities than those reported for typical meiofauna genera (Baldrighi et al., 2014), and carry out important ecological functions within benthic macrofauna communities (Sharma et al., 2011). Tanaidacea is a well-represented taxon in the deep sea (Larsen, 2005) and considered a eurytopic taxon (Blazewicz-Paszkowycz et al., 2012) due to its wide distribution in the marine environment and its presence in freshwater habitats (Bamber, 2008). This taxon presented low relative abundance values up to 800 m, but its contribution to the general abundance increased in deeper sites. Amphipods and harpacticoid copepods, that are well represented in the deep sea (Baguley et al., 2006a; Blankenship et al., 2006) also recorded high values of relative abundance in LBZ and AZ, respectively. According to Brandt et al. (2018), the macrofaunal composition of abyssal regions is frequently dominated by crustaceans. We observed a similar pattern with an increase of the relative abundance of Amphipoda, Tanaidacea and Harpacticoida related to increasing depth, but polychaetes were dominant in the three DCs.
Sponges and sipunculids were among the taxa that showed notable changes in abundance across depth categories. Sponges of the class Hexactinellida are a well-represented and wide distributed taxon in the deep sea (Dohrmann et al., 2008). In this study, Porifera registered a low representation in UBZ, high in LBZ and an intermediate in AZ in both cruises (ratio between records and number of sites were 0.06, 0.67, 0.47 in UBZ, LBZ and AZ during SOGOM 3, and 0.13, 0.71, 0.33 during SOGOM 4, respectively). The sipunculid bathymetric distribution registered a decreasing pattern with high abundance in relative shallow waters, mainly in SOGOM 4, which agrees with the abundance pattern reported in the literature (Baldrighi et al., 2014).
In general, our standardized abundance values were lower compared to available data in other deepwater regions like the South Atlantic (Bernardino et al., 2016), in a wide latitude range of the Atlantic (Sibuet et al., 1989), the Mediterranean Sea (Baldrighi et al., 2014). In the north of the GoM reported abundance values were also higher in the UBZ (Demopoulos et al., 2014), UBZ-AZ (Wei et al., 2012a) and LBZ-UBZ (Washburn et al., 2017) regions compared to our data. In the southern Gulf of Mexico some data reported for the UBZ-AZ area (794-2713 ind. m-2, Escobar-Briones et al., 1999), are within our abundance range but other recorded in the Campeche Canyon (1,550 to 6,925 ind. m-2, Escobar-Briones et al., 2008) and in the northwest region (400-128,000 ind. m-2, Salcedo et al., 2017) are higher. However, these results are not directly comparable because these authors used a mesh sieve of 250 or 300 microns while we used a sieve of 500 microns which could explain the relatively low abundance values we recorded in both cruises. Besides, some of these studies included typical taxa of meiofauna (nematods, copepods and ostracods) or considered all the organisms recovered of the sieved sample such as foraminiferans (Escobar-Briones et al., 2008). A sound comparison should require considering sampling device type, the mesh size used for sieving, the sampling depth and the groups included in the analysis.
The nMDS and ANOSIM analyses showed slight, but significant differences between cruises (R: 0.211) (p = 0.001). Since the communities composition and structure were similar in both cruises, the differences shown by the multivariate analysis could be largely due to the difference in general abundance. The high abundance recorded during SOGOM 3 could reflect a seasonal effect, which is a wide documented phenomenon in the deep sea (Galéron et al., 2009; Billett et al., 2010; Cordes et al., 2010; Glover et al., 2010). The environmental factor analysis revealed high silt and low clay average values in the SOGOM 3 deepest DCs, where the macrofauna abundance variation was more evident between cruises (Figure 5). The granulometric sediment composition was proposed a as driver of macrofauna abundance variations (Baldrighi et al., 2014). Sedimentological composition variations in this study could be related to seasonal changes of continental sediment supply associated to seasonal river discharge.
In both cruises we observed that the macrofauna abundance decreased with increasing depth and decreasing OM. This pattern was widely documented in the deep sea (Hessler and Sanders, 1967; Gage and Tyler, 1991; Wei et al., 2010a; Wei et al., 2012a; Baldrighi et al., 2014; Bernardino et al., 2016) and also related to OM availability with depth (Morse and Beazley, 2008) and distance from the coast (Escobar-Briones and García-Villalobos, 2009) Some authors (Pérez-Mendoza et al., 2003; Hughes and Gage, 2004) have reported inconsistencies to this widespread bathymetric pattern related with local environmental variables that promoted infaunal abundance. We recorded sites that deviated from the abundance general depth-related pattern located in areas with high sedimentation rates (continental rise, Coatzacoalcos Canyon) that promotes the OM accumulation, favouring high abundance (Vetter and Dayton, 1998; Escobar-Briones et al., 2008).
The pattern of abundance geographic distribution was similar in both cruises with the highest values recorded close to the coastline in the southern region, and the lowest ones in the abyssal plain located in the northeastern region of the study area. The Campeche Bay salt domes zone registered intermediate abundance values in SOGOM 3 and intermediate and high in SOGOM 4. In this area the presence of a quasi-permanent cyclonic gyre (Díaz-Flores et al., 2017) promotes nutrient upwellings that enhance primary productivity and a posterior OM exportation to deep sea floor. Also, this area is under the influence of continental OM contribution of the Grijalva Usumacinta river system, the second most important one contributing with water and sediments to the GoM after the Mississippi River. The presence of numerous oil seeps in this area is another factor that may help to understand the abundance pattern. Oil natural flows may allow the establishment of communities based on chemoautotrophic endosymbiotic bacteria, that do not depend on the export of organic matter produced in surface waters or of the continental region (Levin and Michener, 2002; Levin, 2005; Bourque et al., 2017). According to MacDonald et al. (1989) important infaunal abundance values are usually recorded in sites close to this type of environment. In the northwestern region of the study area intermediate abundance values of both cruises could be mainly related to the OM contribution of river discharge on the Veracruz and Tamaulipas coasts (e.g., the Soto la Marina, Pánuco, Tuxpan and Cazones rivers).
4.3. Multivariate analysis
The multivariate analysis showed depth-related differences in the macrofauna community composition and structure in both cruises. These kind of differences were extensively recognized in other deep sea regions (e. g. Levin et al., 2001; Bernardino et al., 2016; Woolley et al., 2016) and in the Gulf of Mexico (e.g. Hernández-Ávila et al., 2021). The separation along the depth gradient was more evident in SOGOM 4. The groups generated by the classification analysis with the SIMPROF test plotted on the ordering obtained for each of the samplings, confirmed this depth pattern. It must be noted that, even though the specimens were identified at a high taxon level, this pattern was detected. According to Brandt et al. (2019) this taxonomic resolution degree may not be useful to show the differences between basins, but it is usually enough to show the differences between different depth zones. Differences were similar between cruises. Polychaeta, Nematoda, Amphipoda, Isopoda and Bivalvia were classified at practically the same contribution level in the three DCs. Thus, the main community structure differences related to depth were due to the higher contribution of Sipuncula, and Ostracoda in the UBZ compared to LBZ and AZ. Whereas, Harpacticoida showed a high contribution at the low bathyal, and abyssal stations and, the low one in UBZ. On the other hand, Tanaidacea, Porifera and Nemertea recorded a parabolic pattern. In LBZ the first two taxa recorded the highest contribution, while the latter registered the lowest one. Gastropoda, Cumacea, Scaphopoda and Pycnogonida were collected only in UBZ and LBZ sites while Brachiopoda only in AZ. Differences of these communities in a depth interval have been attributed to several factors. Among them, sediment grain size variations, oxygen availability (Etter and Grassle, 1992; Levin et al., 2001), organic carbon flux (Hernández-Ávila et al., 2021), and proximity to slope habitats (Woolley et al., 2016). In our analysis, the environmental factors related to faunal distribution were temperature, dissolved oxygen, PAHs, organic matter in SOGOM 3 and depth in SOGOM 4. All of them have been recorded as benthic community drivers in the deep sea (Cosson et al., 1997; Allen, 2008; Levin and Sibuet, 2012; Brown and Thatje, 2014; Bernardino et al., 2016; Brandt et al., 2018). The macrofauna communities difference between cruises observed in the multivariate analysis was mainly due to abundance variations as composition and structure were similar in both samplings.
4.4. Biodiversity estimates
The general alpha diversity depth-related pattern registered was similar in both cruises and according to the common pattern observed in the deep sea. Usually, the highest diversity values are registered in medium depths (2000-3000 m) and the lowest ones in the upper bathyal and abyssal regions (Rex, 1981; Ramirez-Llodra et al., 2010; Bernardino et al., 2016; Wei and Rowe, 2019). Some authors mention that high diversity in the LBZ may be due to UBZ and LBZ overlapping fauna (Levin et al., 2001; Snelgrove and Smith, 2002). The same trend has been recorded in the deep sea of the northern GoM region (Wei and Rowe, 2019). This could indicate that the processes that controling diversity in the benthic macrofauna could be similar throughout the Gulf. In our study, this pattern was consistent on the three estimated Hill numbers. Even though if a low taxonomic resolution was used, this bathymetric diversity macrofauna pattern of diversity was observed.
The diversity geographic pattern analysis showed that highest taxonomic diversity values of both cruises were located at medium depths in the southern and northwest regions of the study area. We also registered some sites with medium and high diversity values in the abyssal plain in both cruises. This region was usually characterized with low abundance but high diversity macrofauna. Dominance is not frequent, and it is very common to register a single specimen of each species (Sanders, 1968; Rex, 1981; Ramirez-Llodra et al., 2010). Organic matter accumulation is usually mentioned as one of the factors that could support high diversity and may be one of the reasons to explain high diversity values recorded in the Campeche and Coatzacoalcos Canyons. Finally, although the relationship between diversity and latitude is a phenomenon frequently recorded (Poore and Wilson, 1993; Rex et al., 1993; Gage, 2004; Rex et al., 2005), we did not observe a trend of geographic distribution diversity related to latitude in the southwestern Gulf of Mexico.
5. Conclusions
This study contributes with unique knowledge of macrofaunal communities in a large area and bathymetric range of the scarce studied area of southern GoM. UBZ presented different environmental conditions compared with LBZ and AZ. The UBZ was characterized by important DO concentrations, salinity, temperature variations, and high OM, silt, hydrocarbon values as well as low carbonate and clay sediment concentrations. On the other hand, LBZ and AZ presented high DO, salinity and temperature stability, low OM, hydrocarbons and silt values, high carbonate, and clay values in sediment. The high taxa registered are typical of deep sea macrofauna communities. The macrofauna abundance showed a depth related pattern. Highest abundance was registered in the south area at relatively low deep locations near the coast, whereas the lowest ones were found in the abyssal zone. The highest diversity was found in the south and northwest of the study area at medium depths. Even though the low taxonomic resolution level used, a community structure and diversity depth related pattern were recognized. Furthermore, there were differences between cruises in community abundance that can be related to seasonal abundance effect. Depth, water temperature, dissolved oxygen, OM and PAH in sediments were identified as the main drivers of macrofauna community structure. Data provided would be very important for understanding the GoM as whole and for assessing the impact of man driven activities such as accidental oil spills and/or long-term ecosystem changes.
Data availability statement
The raw data supporting the conclusions of this article will be made available by the authors, without undue reservation.
Author contributions
OQ-R: conceptualization, methodology, formal analysis, investigation, data curation, manuscript writing and visualization. ARV-B: conceptualization, methodology, manuscript writing, review and editing. AG conceptualization, methodology, investigation, resources, manuscript writing, review and editing, supervision, project administration, and funding acquisition. All authors contributed to the article and approved the submitted version.
Funding
This study was funded by the Mexican National Council for Science and Technology - Mexican Ministry of Energy - Hydrocarbon Fund, project 201441.
Acknowledgments
Officers and crew of the R/V Justo Sierra are greatly appreciated for their support during research cruises. We thank graduate and undergraduate students that participated along the research cruises. We are also grateful to the invaluable technical support in the laboratory of Héctor M. Alexander Valdés, Luz Patricia Ortega Tenorio, and Balbina Suárez Achaval in the analysis of sediment variables and Araceli Jaqueline Mercado Santiago and Francisco Fabián Velasco López in processing biological samples. We thank CONACYT for the graduate scholarship granted to OQR (CVU: 517836) during the development of this study. We are also grateful to the Posgrado en Ciencias Biológicas, UNAM for all the support received. This study was funded by the Mexican National Council for Science and Technology - Mexican Ministry of Energy - Hydrocarbon Fund, project 201441 as part of the Gulf of Mexico Research Consortium (CIGoM) due to PEMEX’s specific request to the Hydrocarbon Fund to address the environmental effects of oil spills in the Gulf of Mexico.
Conflict of interest
The authors declare that the research was conducted in the absence of any commercial or financial relationships that could be construed as a potential conflict of interest.
The handling Editor SH declared a shared consortium CIGOM with the author AG at the time of review.
Publisher’s note
All claims expressed in this article are solely those of the authors and do not necessarily represent those of their affiliated organizations, or those of the publisher, the editors and the reviewers. Any product that may be evaluated in this article, or claim that may be made by its manufacturer, is not guaranteed or endorsed by the publisher.
Supplementary material
The Supplementary Material for this article can be found online at: https://www.frontiersin.org/articles/10.3389/fmars.2022.1033596/full#supplementary-material
References
Adhikari P. L., Maiti K., Overton E. B., Rosenheim B. E., Marx B. D. (2016). Distributions and accumulation rates of polycyclic aromatic hydrocarbons in the northern gulf of Mexico sediments. Environ. pollut. 212, 413–423. doi: 10.1016/J.ENVPOL.2016.01.064
Allen J. A. (2008). Bivalvia of the deep Atlantic. Malacologia 50, 57–173. doi: 10.4002/0076-2997-50.1.57
Alongi D. M. (1992). Bathymetric patterns of deep-sea benthic communities from bathyal to abyssal depths in the western south pacific (Solomon and coral seas). Deep Sea Res. Part A Oceanogr. Res. Pap. 39, 549–565. doi: 10.1016/0198-0149(92)90088-B
Bach L., Palmqvist A., Rasmussen L. J., Forbes V. E. (2005). Differences in PAH tolerance between capitella species: Underlying biochemical mechanisms. Aquat. Toxicol. 74, 307–319. doi: 10.1016/J.AQUATOX.2005.06.002
Baguley J. G., Montagna P. A., Hyde L. J., Kalke R. D., Rowe G. T. (2006a). Metazoan meiofauna abundance in relation to environmental variables in the northern gulf of Mexico deep sea. Deep. Res. Part I Oceanogr. Res. Pap. 53, 1344–1362. doi: 10.1016/j.dsr.2006.05.012
Baguley J. G., Montagna P. A., Hyde L. J., Rowe G. T. (2008). Metazoan meiofauna biomass, grazing, and weight-dependent respiration in the northern gulf of Mexico deep sea. Deep. Res. Part II Top. Stud. Oceanogr. 55, 2607–2616. doi: 10.1016/j.dsr2.2008.07.010
Baguley J. G., Montagna P. A., Lee W., Hyde L. J., Rowe G. T. (2006b). Spatial and bathymetric trends in harpacticoida (Copepoda) community structure in the northern gulf of Mexico deep-sea. J. Exp. Mar. Bio. Ecol. 330, 327–341. doi: 10.1016/j.jembe.2005.12.037
Baldrighi E., Lavaleye M., Aliani S., Conversi A., Manini E. (2014). Large Spatial scale variability in bathyal macrobenthos abundance, biomass, α- and β-diversity along the mediterranean continental margin. PloS One 9, 32–34. doi: 10.1371/journal.pone.0107261
Balsam W. L., Beeson J. P. (2003). Sea-Floor sediment distribution in the gulf of Mexico. Deep. Res. Part I Oceanogr. Res. Pap. 50, 1421–1444. doi: 10.1016/j.dsr.2003.06.001
Bamber R. N. (2008). A new species of the freshwater tanaidacean genus Pseudohalmyrapseudes (Crustacea: Tanaidacea: Parapseudidae) from sulawesi. Rec. West. Aust. Museum 24, 421. doi: 10.18195/issn.0312-3162.24(4).2008.421-428
Banta G. T., Andersen O. (2003). Bioturbation and the fate of sediment pollutants- experimental case studies of selected infauna species. Vie Milieu 53, 233–248. Available at: https://hal.sorbonne-universite.fr/hal-03205288/document.
Bernardino A. F., Berenguer V., Ribeiro-Ferreira V. P. (2016). Bathymetric and regional changes in benthic macrofaunal assemblages on the deep Eastern Brazilian margin, SW Atlantic. Deep. Res. Part I Oceanogr. Res. Pap. 111, 110–120. doi: 10.1016/j.dsr.2016.02.016
Billah M., Alam K., Uddin I., Amran A., Cabral A. C., García M. R.. (2022). Polycyclic aromatic hydrocarbons (PAHs) pollution in mangrove ecosystems: global synthesis and future research directions. Rev. Environ. Sci. Bio/Technology 213 (21), 747–770. doi: 10.1007/S11157-022-09625-0
Billett D. S. M., Bett B. J., Reid W. D. K., Boorman B., Priede I. G. (2010). Long-term change in the abyssal NE Atlantic: The “Amperima event” revisited. Deep. Res. Part II Top. Stud. Oceanogr. 57, 1406–1417. doi: 10.1016/j.dsr2.2009.02.001
Blankenship L. E., Yayanos A. A., Cadien D. B., Levin L. A. (2006). Vertical zonation patterns of scavenging amphipods from the hadal zone of the Tonga and kermadec trenches. Deep. Res. Part I Oceanogr. Res. Pap. 53, 48–61. doi: 10.1016/j.dsr.2005.09.006
Blazewicz-Paszkowycz M., Bamber R., Anderson G. (2012). Diversity of tanaidacea (crustacea: Peracarida) in the world’s oceans - how far have we come? PloS One 7, 33068. doi: 10.1371/journal.pone.0033068
Bourque J. R., Robertson C. M., Brooke S., Demopoulos A. W. J. (2017). Macrofaunal communities associated with chemosynthetic habitats from the U.S. Atlantic margin: A comparison among depth and habitat types. Deep. Res. Part II Top. Stud. Oceanogr. 137, 42–55. doi: 10.1016/j.dsr2.2016.04.012
Brandt A., Alalykina I., Brix S., Brenke N., Błażewicz M., Golovan O. A., et al. (2019). Depth zonation of Northwest pacific deep-sea macrofauna. Prog. Oceanogr. 176, 102131. doi: 10.1016/j.pocean.2019.102131
Brandt A., De Broyer C., De Mesel I., Ellingsen K. E., Gooday A. J., Hilbig B., et al. (2007). The biodiversity of the deep southern ocean benthos. Philos. Trans. R. Soc B Biol. Sci. 362, 39–66. doi: 10.1098/rstb.2006.1952
Brandt A., Frutos I., Bober S., Brix S., Brenke N., Guggolz T., et al. (2018). Composition of abyssal macrofauna along the vema fracture zone and the hadal Puerto Rico trench, northern tropical Atlantic. Deep. Res. Part II Top. Stud. Oceanogr. 148, 35–44. doi: 10.1016/j.dsr2.2017.07.014
Brandt A., Schnack K. (1999). Macrofaunal abundance at 79°N off east greenland: Opposing data from epibenthic-sledge and box-corer samples. Polar Biol. 22, 75–81. doi: 10.1007/S003000050392
Brey T., Dahm C., Gorny M., Klages M., Stiller M., Arntz W. E. (1996). Do Antarctic benthic invertebrates show an extended level of eurybathy? Antarct. Sci. 8, 3–6. doi: 10.1017/s0954102096000028
Brooks J. M., Kennicutt M. C., Fisher C. R., Macko S. A., Cole K., Bidigare R. R., et al. (1987). Deep-Sea hydrocarbon seep Communities : Evidence for energy and nutritional carbon sources published by : American association for the advancement of science stable URL : http://www.jstor.org/stable/1700859 REFERENCES linked references are available on JS. Sci. (80-. ) . 238, 1138–1142. doi: 10.1126/SCIENCE.238.4830.1138
Brown A., Thatje S. (2014). Explaining bathymetric diversity patterns in marine benthic invertebrates and demersal fishes: Physiological contributions to adaptation of life at depth. Biol. Rev. 89, 406–426. doi: 10.1111/brv.12061
Carvalho R., Wei C. L., Rowe G., Schulze A. (2013). Complex depth-related patterns in taxonomic and functional diversity of polychaetes in the gulf of Mexico. Deep. Res. Part I Oceanogr. Res. Pap. 80, 66–77. doi: 10.1016/j.dsr.2013.07.002
Chao A., Gotelli N. J., Hsieh T. C., Sander E. L., Ma K. H., Colwell R. K., et al. (2014). Rarefaction and extrapolation with hill numbers: A framework for sampling and estimation in species diversity studies. Ecol. Monogr. 84, 45–67. doi: 10.1890/13-0133.1
Clarke A. (1998). “Temperature and energetics: an introduction to cold ocean physiology,” in Cold ocean physiology society for experimental biology seminar series. Eds. Pörtner H.-O., Playle R. C. (Cambridge: Cambridge University Press), 3–30. doi: 10.1017/CBO9780511661723.002
Clarke K. R., Somerfield P. J., Gorley R. N. (2008). Testing of null hypotheses in exploratory community analyses: similarity profiles and biota-environment linkage. J. Exp. Mar. Bio. Ecol. 366, 56–69. doi: 10.1016/j.jembe.2008.07.009
Clarke K. R., Somerfield P., Warwick R. M. (2014). Change in marine communities: an approach to statistical analysis and interpretation (Plymouth: Primer-E Ltd).
Cordes E. E., Cunha M. R., Galéron J., Mora C., Olu-Le Roy K., Sibuet M., et al. (2010). The influence of geological, geochemical, and biogenic habitat heterogeneity on seep biodiversity. Mar. Ecol. 31, 51–65. doi: 10.1111/j.1439-0485.2009.00334.x
Cosson N., Sibuet M., Galeron J. (1997). Community structure and spatial heterogeneity of the deep-sea macrofauna at three contrasting stations in the tropical northeast Atlantic. Deep. Res. Part I Oceanogr. Res. Pap. 44, 247–269. doi: 10.1016/S0967-0637(96)00110-0
Crawshaw J. A., Schallenberg M., Savage C. (2019). Physical and biological drivers of sediment oxygenation and denitrification in a new Zealand intermittently closed and open lake lagoon. New Zeal. J. Mar. Freshw. Res. 53, 33–59. doi: 10.1080/00288330.2018.1476388
Danovaro R., Snelgrove P. V. R., Tyler P. (2014). Challenging the paradigms of deep-sea ecology. Trends Ecol. Evol. 29, 465–475. doi: 10.1016/j.tree.2014.06.002
Darnell R. M. (2015). The American sea: A natural history of the gulf of Mexico (Texas: Texas A&M University Press).
Demopoulos A. W. J., Bourque J. R., Frometa J. (2014). Biodiversity and community composition of sediment macrofauna associated with deep-sea Lophelia pertusa habitats in the gulf of Mexico. Deep. Res. Part I Oceanogr. Res. Pap. 93, 91–103. doi: 10.1016/j.dsr.2014.07.014
Demopoulos A. W. J., Gualtieri D., Kovacs K. (2010). Food-web structure of seep sediment macrobenthos from the gulf of Mexico. Deep. Res. Part II Top. Stud. Oceanogr. 57, 1972–1981. doi: 10.1016/j.dsr2.2010.05.011
Díaz-Asencio M., Bartrina V. F., Herguera J. C. (2019). Sediment accumulation patterns on the slopes and abyssal plain of the southern gulf of Mexico. Deep. Res. Part I Oceanogr. Res. Pap. 146, 11–23. doi: 10.1016/j.dsr.2019.01.003
Díaz-Flores M. Á., Salas-de-León D. A., Monreal-Gómez M. A. (2017). Origin and evolution of cyclonic eddy of the bay of campeche, gulf of Mexico. Rev. Biol. Mar. Oceanogr. 52, 441–450. doi: 10.4067/s0718-19572017000300003
Dohrmann M., Janussen D., Reitner J., Collins A. G., Wörheide G. (2008). Phylogeny and evolution of glass sponges (Porifera, hexactinellida). Syst. Biol. 57, 388–405. doi: 10.1080/10635150802161088
Escobar-Briones E., Estrada Santillán E. L., Legendre P. (2008). Macrofaunal density and biomass in the campeche canyon, southwestern gulf of Mexico. Deep. Res. Part II Top. Stud. Oceanogr. 55, 2679–2685. doi: 10.1016/j.dsr2.2008.07.017
Escobar-Briones E., García-Villalobos F. J. (2009). Distribution of total organic carbon and total nitrogen in deep-sea sediments from the southwestern gulf of Mexico. Bol. la Soc Geol. Mex. 61, 73–86. doi: 10.18268/BSGM2009v61n1a7
Escobar-Briones E., Signoret M., Hernández D. (1999). Variation of the macrobenthic infaunal density in a bathymetric gradient: Western gulf of Mexico. Cienc. Mar. 25, 193–212. doi: 10.7773/cm.v25i2.667
Etter R. J., Grassle J. F. (1992). Patterns of species diversity in sediment particle size diversity. Nature 360, 1990–1992. doi: 10.1038/360576a0
Fiege D., Ramey P. A., Ebbe B. (2010). Diversity and distributional patterns of polychaeta in the deep south Atlantic. Deep. Res. Part I Oceanogr. Res. Pap. 57, 1329–1344. doi: 10.1016/j.dsr.2010.06.012
Gage J. D. (2001). Deep-sea benthic community and environmental impact assessment at the Atlantic frontier. Cont. Shelf Res. 21, 957–986. doi: 10.1016/S0278-4343(00)00120-5
Gage J. D. (2004). Diversity in deep-sea benthic macrofauna: The importance of local ecology, the larger scale, history and the Antarctic. Deep. Res. Part II Top. Stud. Oceanogr. 51, 1689–1708. doi: 10.1016/j.dsr2.2004.07.013
Gage J. D., Tyler P. A. (1991). Deep-Sea biology: A natural history of organisms at the deep-Sea floor (Campbridge: Cambridge University Press). doi: 10.1017/CBO9781139163637
Galéron J., Menot L., Renaud N., Crassous P., Khripounoff A., Treignier C., et al. (2009). Spatial and temporal patterns of benthic macrofaunal communities on the deep continental margin in the gulf of Guinea. Deep. Res. Part II Top. Stud. Oceanogr. 56, 2299–2312. doi: 10.1016/j.dsr2.2009.04.011
Giere O. (2008). Meiobenthology: the microscopic motile fauna of aquatic sediments (Berlin: Springer Science & Business).
Glover A. G., Gooday A. J., Bailey D. M., Billett D. S. M., Chevaldonné P., Colaço A., et al. (2010). Temporal change in deep-Sea benthic ecosystems: A review of the evidence from recent time-series studies. Adv. Mar. Biol. 58, 1–95. doi: 10.1016/B978-0-12-381015-1.00001-0
González-Ocampo M., Escobar-Briones E., Morales-Puente P. (2007). “Composición y caracterización isotópica δ13C de carbono orgánico particulado en aguas oceánicas del suroeste del golfo de méxico,” in Carbono en ecosistemas acuáticos de méxico. Eds. Torre B.H. de la, Gaxiola G. (México, INE: SEMARNAT, CICESE), 75–100.
Gracia A. (2010). “Campaña oceanográfica (SGM-2010),” in Informe final. gerencia de seguridad industrial, protección ambiental y calidad región Marina noreste, PEMEX - EXPLORACIÓN – PRODUCCIÓN (UNAM, México: Instituto de Ciencias del Mar y Limnología).
Gracia A., Alexander-Valdés H. M., Ortega-Tenorio P. L., Frausto Castillo J. A. (2016a). “Source and distribution of polycyclic aromatic hydrocarbon in the IXTOC I spill area,” in. 2016 Gulf of Mexico Oil spill & Ecosystem Science Conference, Tampa, Florida, January, 2016.
Gracia A., Alexander-Valdés H. M., Ortega-Tenorio P. L., Frausto-Castillo J. A. (2016b). Distribución de hidrocarburos en columna de agua y sedimentos del sur del golfo de méxico (Jalisco, México: Reunión Anual 2016 de la Unión Geofísica Mexicana Oral Presentation. November).
Gracia A., Vázquez F., Sánchez G., Valdés H. (2014). “Composición y volumen de contaminantes de las descargas costeras al golfo de méxico,” in golfo de méxico contaminación e impacto ambiental: Diagnóstico y tendencias 2da. edición., ed (Univ. Nal. Autón. de México, Instituto Nacional de Ecología), 789–816: B. A. V. J. R. von Osten G. Gold-Bouchot y C. Agraz-Hernández (Univ. Autón. de Campeche).
Grant W. D., Boyer L. F., Sanford L. P. (1982). The effects of bioturbation on the initiation of motion of intertidal sands. J. Mar. Res. 40, 659–677. doi: 10.1016/0077-7579(94)90028-0
Grassle J. F., Maciolek N. J. (1992). Deep-sea species richness: regional and local diversity estimates from quantitative bottom samples. Am. Nat. 139, 313–341. doi: 10.1086/285329
Gray J. S. (2002). Species richness of marine soft sediments. Mar. Ecol. Prog. Ser. 244, 285–297. doi: 10.3354/meps244285
Guggolz T., Lins L., Meißner K., Brandt A. (2018). Biodiversity and distribution of polynoid and spionid polychaetes (Annelida) in the vema fracture zone, tropical north Atlantic. Deep. Res. Part II Top. Stud. Oceanogr. 148, 54–63. doi: 10.1016/j.dsr2.2017.07.013
Hatami M., Arash M., Mohsen H., Hossein M., Marofi A. S., Haghshenas A., et al. (20212021). Seasonal variations of polycyclic aromatic hydrocarbons in coastal sediments of a marine resource hot spot: the case of pars special economic energy zone, iran. environ. Geochemistry Heal 4310(43), 3897–3919. doi: 10.1007/S10653-021-00863-9
Harris P. T. (2020). “Seafloor Geomorphology—Coast, Shelf, and Abyss,” in Seafloor Geomorphology as Benthic Habitat (Elsevier Inc.), 115–160. doi: 10.1016/b978-0-12-814960-7.00006-3
Hernández-Ávila I., Pech D., Ocaña F. A., Árcega-Cabrera F., Enriquez C. (2021). Shelf and deep-water benthic macrofauna assemblages from the western Gulf of Mexico: Temporal dynamics and environmental drivers. Mar. Environ. Res. 165, 105241. doi: 10.1016/j.marenvres.2020.105241
Hessler R. R., Jumars P. A. (1974). Abyssal community analysis from replicate box cores in the central north pacific. Deep. Res. Oceanogr. Abstr. 21, 246. doi: 10.1016/0011-7471(74)90058-8
Hessler R., Sanders H. (1967). Faunal diversity in the deep-sea. Deep. Res. Oceanogr. Abstr. 14, 65–78. doi: 10.1016/0011-7471(67)90029-0
Higgins R., Thiel H. (1988). Introduction to the study of meiofauna (Washington, D.C.: Smithsonian Institution Press).
Hughes D. J., Gage J. D. (2004). Benthic metazoan biomass, community structure and bioturbation at three contrasting deep-water sites on the northwest European continental margin. Prog. Oceanogr. 63, 29–55. doi: 10.1016/J.POCEAN.2004.09.002
Kampstra P. (2008). Beanplot: A boxplot alternative for visual comparison of distributions. J. Stat. Software 28, 1–9. doi: 10.18637/jss.v028.c01
Konovalov D., Renaud P. E., Berge J., Voronkov A. Y., Cochrane S. K. J. (2010). Arctic Sediments. Chem. Ecol. 26, 197–208. doi: 10.1080/02757541003789058
Kumpf H., Steidinger K., Sherman K. (1999). Gulf of Mexico large marine ecosystem. (Hoboken: Blackwell Science).
Levin L. A. (2005). Ecology of cold seep sediments: Interactions of fauna with flow, chemistry and microbes. Oceanogr. Mar. Biol. 43, 1–46. doi: 10.1201/9781420037449-3
Levin L. A., Etter R. J., Rex M. A., Gooday A. J., Smith C. R., Pineda J., et al. (2001). Environmental influences on regional deep-sea species diversity. Annu. Rev. Ecol. Syst. 32, 51–93. doi: 10.1146/annurev.ecolsys.32.081501.114002
Levin L. A., Michener R. H. (2002). Isotopic evidence for chemosynthesis-based nutrition of macrobenthos: The lightness of being at pacific methane seeps. Limnol. Oceanogr. 47, 1336–1345. doi: 10.4319/LO.2002.47.5.1336
Levin L. A., Sibuet M. (2012). Understanding continental margin biodiversity: A new imperative. Ann. Rev. Mar. Sci. 4, 79–112. doi: 10.1146/annurev-marine-120709-142714
MacDonald I. R., Boland G. S., Baker J. S., Brooks J. M., Kennicut M. C., Bidigare R. R. (1989). Marine biology gulf of Mexico hydrocarbon seep communities. Environ. Res. 247, 235–247. doi: 10.1007/BF00391463
Mamouridis V., Cartes J. E., Parra S., Fanelli E., Saiz Salinas J. I. (2011). A temporal analysis on the dynamics of deep-sea macrofauna: Influence of environmental variability off Catalonia coasts (western Mediterranean). Deep. Res. Part I Oceanogr. Res. Pap. 58, 323–337. doi: 10.1016/j.dsr.2011.01.005
Mcgill R., Tukey J. W., Larsen W. A. (1978). Variations of box plots. Am. Stat. 32, 12–16. doi: 10.2307/2683468
Monreal-Gómez M. A., Salas-de-León D. A. (1997). “Circulación y estructura termohalina del golfo de méxico. oceanografía física en méxico,” in Contribuciones a la oceanografía física en méxico. monografía no. 3. Ed. Lavín M. F. (México: Unión Geofísica Mexicana), 183–199.
Monreal-Gómez M. A., Salas-de-León D. A., Velasco-Mendoza H. (2004). “La hidrodinámica del golfo de méxico,” in Diagnóstico ambental del golfo de méxico. Eds. Caso M., Pisanty I., Ezcurra E. (Ciudad de México: SEMARNAT), 47–68.
Morse J. W., Beazley M. J. (2008). Organic matter in deepwater sediments of the Northern Gulf of Mexico and its relationship to the distribution of benthic organisms. Deep. Res. Part II Top. Stud. Oceanogr. 55, 2563–2571. doi: 10.1016/j.dsr2.2008.07.004
Murawski S. A., Hollander D. J., Gilbert S., Gracia A. (2020). “Deepwater oil and gas production in the gulf of Mexico and related global trends,” in Scenarios and responses to future deep oil spills (Cham: Springer), 16–32. doi: 10.1007/978-3-030-12963-7_2
National Academies of Sciences, Engineering and Medicine (2018). Understanding and predicting the gulf of Mexico loop current: critical gaps and recommendations (Washington: National Academies Press).
Parkes R. J., Cragg B. A., Bale S. J., Getlifff J. M., Goodman K., Rochelle P. A., et al. (1994). Deep bacterial biosphere in pacific ocean sediments. Nature 371, 410–413. doi: 10.1038/371410a0
Paterson G. L. J., Glover A. G., Barrio Froján C. R. S., Whitaker A., Budaeva N., Chimonides J., et al. (2009). A census of abyssal polychaetes. Deep Sea Res. Part II Top. Stud. Oceanogr. 56, 1739–1746. doi: 10.1016/J.DSR2.2009.05.018
Paull C. K., Jull A. J. T., Toolin L. J., Linick T. (1985). Stable isotope evidence for chemosynthesis in an abyssal seep community. Nature 317, 709–711. doi: 10.1038/317709a0
Pequegnat W. E., Gallaway B. J., Pequegnat L. H. (1990). Aspects of the ecology of the deep-water fauna of the gulf of Mexico. Integr. Comp. Biol. 30, 45–64. doi: 10.1093/icb/30.1.45
Pérez-Mendoza A. Y., Hernández-Alcántara P., Solís-Weiss V. (2003). Bathymetric distribution and diversity of deep water polychaetous annelids in the sigsbee basin, northwestern gulf of Mexico. Hydrobiologia 496, 361–370. doi: 10.1023/A:1026133907343
Poore G. C., Wilson G. D. F. (1993). Marine species richness. Nature 361, 597–598. doi: 10.1111/j.1748-7692.1990.tb00253.x
Pulster E. L., Gracia A., Armenteros M., Toro-Farmer G., Snyder S. M., Carr B. E., et al. (2020). A first comprehensive baseline of hydrocarbon pollution in gulf of Mexico fishes. Sci. Rep. 10, 1–14. doi: 10.1038/s41598-020-62944-6
QGIS.org (2021). QGIS geographic information system (Gossau, Zürich: QGIS Association). Available at: http://www.qgis.org.
Quintanar-Retama O., Armenteros M., Gracia A. (2022). Diversity and distribution patterns of macrofauna polychaetes (Annelida) in deep waters of the southwestern gulf of Mexico. Deep Sea Res. Part I Oceanogr. Res. Pap. 181, 103699. doi: 10.1016/j.dsr.2022.103699
Qu F., Nunnally C. C., Lemanski J. R., Wade T. L., Amon R. M. W., Rowe G. T. (2016). Polychaete annelid (segmented worms) abundance and species composition in the proximity (6-9 km) of the deep water horizon (DWH) oil spill in the deep gulf of Mexico. Deep. Res. Part II Top. Stud. Oceanogr. 129, 130–136. doi: 10.1016/j.dsr2.2015.04.020
Ramirez-Llodra E., Brandt A., Danovaro R., De Mol B., Escobar E., German C. R., et al. (2010). Deep, diverse and definitely different: unique attributes of the world’s largest ecosystem. Biogeosciences 7, 2851–2899. doi: 10.5194/bg-7-2851-2010
Reuscher M. G., Baguley J. G., Montagna P. A. (2020). The expanded footprint of the deepwater horizon oil spill in the gulf of Mexico deep-sea benthos. PloS One 15, 1–16. doi: 10.1371/journal.pone.0235167
Rex M. A. (1981). Community structure in the deep-Sea benthos. Annu. Rev. Ecol. Syst. 12, 331–353. doi: 10.1146/annurev.es.12.110181.001555
Rex M. A., Crame J. A., Stuart C. T., Clarke A. (2005). Large-Scale biogeographic patterns in marine mollusks: A confluence of history and productivity? Ecology 86, 2288–2297. doi: 10.1890/04-1056
Rex M. A., Etter R. J., Morris J. S., Crouse J., McClain C. R., Johnson N. A., et al. (2006). Global bathymetric patterns of standing stock and body size in the deep-sea benthos. Mar. Ecol. Prog. Ser. 317, 1–8. doi: 10.3354/meps317001
Rex M. A., Stuart C. T., Hessler R. R., Allen J. A., Sanders H. L., Wilson G. D. F. (1993). Global-scale latitudinal patterns of species diversity in the deep-sea benthos. Nature 365, 636–639. doi: 10.1038/365636a0
Rivas D., Badan A., Ochoa J. (2005). The ventilation of the deep gulf of Mexico. J. Phys. Oceanogr. 35, 1763–1781. doi: 10.1175/JPO2786.1
Rowe G. T., Polloni P. T., Horner S. G. (1974). Benthic biomass estimates from the northwestern atlantic ocean and the northern gulf of Mexico. Deep. Res. Oceanogr. Abstr. 21, 641–650. doi: 10.1016/0011-7471(74)90048-5
Sahling H., Borowski C., Escobar-Briones E., Gaytán-Caballero A., Hsu C. W., Loher M., et al. (2016). Massive asphalt deposits, oil seepage, and gas venting support abundant chemosynthetic communities at the campeche knolls, southern gulf of Mexico. Biogeosciences 13, 4491–4512. doi: 10.5194/bg-13-4491-2016
Salcedo D. L., Soto L. A., Estradas-Romero A., Botello A. V. (2017). Interannual variability of soft-bottom macrobenthic communities of the NW gulf of Mexico in relationship to the deepwater horizon oil spill. Mar. pollut. Bull. 114, 987–994. doi: 10.1016/j.marpolbul.2016.11.031
Sanders H. L. (1968). Marine benthic diversity: a comparative study. Am. Nat. 102, 243–282. doi: 10.1086/282541
Schwing P. T., Montagna P. A., Joye S. B., Paris C. B., Cordes E. E., McClain C. R., et al. (2020). A synthesis of deep benthic faunal impacts and resilience following the deepwater horizon oil spill. Front. Mar. Sci. 7. doi: 10.3389/fmars.2020.560012
Sharma J., Baguley J., Bluhm B. A., Rowe G. (2011). Do meio-and macrobenthic nematodes differ in community composition and body weight trends with depth? PloS One 6, 14491. doi: 10.1371/journal.pone.0014491
Sibuet M., Lambert C. E., Chesselet R., Laubier L. (1989). Density of the major size groups of benthic fauna and trophic input in deep basins of the Atlantic ocean. J. Mar. Res. 47, 851–867. doi: 10.1357/002224089785076064
Smith M., Goodchild M., Longley P. (2015). Univariate classification schemes en geospatial analysis. Available at: http://www.spatialanalysisonline.com/HTML/index.html?classification_and_clustering.htm [Accessed February 4, 2022].
Snelgrove P. V. R. (1998). The biodiversity of macrofaunal organisms in marine sediments. Biodivers. Conserv. 7, 1123–1132. doi: 10.1023/A:1008867313340
Snelgrove P., Smith C. (2002). A riot of species in an environmental calm: the paradox of the species-rich deep-sea floor. Oceanogr. Mar. Biol. 40, 319–320. doi: 10.1201/9780203180594-22
Somero G. N. (1992). Biochemical ecology of deep-sea animals. Experientia 48, 537–543. doi: 10.1007/BF01920236
Timmermann K., Banta G. T., Johnsen A. R., Andersen O. (2008). Effects of the polychaetes Arenicola marina and Nereis diversicolor on microbial pyrene mineralization. Aquat. Microb. Ecol. 50, 197–207. doi: 10.3354/ame01162
Vetter E. W., Dayton P. K. (1998). Macrofaunal communities within and adjacent to a detritus-rich submarine canyon system. Deep Sea Res. Part II Top. Stud. Oceanogr. 45, 25–54. doi: 10.1016/S0967-0645(97)00048-9
Ward C. H., Tunnell J. W. (2017). “Habitats and biota of the gulf of Mexico: An overview,” in Habitats and biota of the gulf of Mexico: Before the deepwater horizon oil spill (New York: Springer), 1–54. doi: 10.1007/978-1-4939-3447-8_1
Washburn T. W., Reuscher M. G., Montagna P. A., Cooksey C., Hyland J. L. (2017). Macrobenthic community structure in the deep gulf of Mexico one year after the deepwater horizon blowout. Deep. Res. Part I Oceanogr. Res. Pap. 127, 21–31. doi: 10.1016/j.dsr.2017.06.001
Watling L., Guinotte J., Clark M. R., Smith C. R. (2013). A proposed biogeography of the deep ocean floor. Prog. Oceanogr. 111, 91–112. doi: 10.1016/j.pocean.2012.11.003
Wei C. L., Rowe G. T. (2019). Productivity controls macrofauna diversity in the deep northern gulf of Mexico. Deep. Res. Part I Oceanogr. Res. Pap. 143, 17–27. doi: 10.1016/j.dsr.2018.12.005
Wei C. L., Rowe G. T., Briones E. E., Boetius A., Soltwedel T., Caley M. J., et al. (2010a). Global patterns and predictions of seafloor biomass using random forests. PloS One 5, e15323. doi: 10.1371/journal.pone.0015323
Wei C. L., Rowe G. T., Escobar-Briones E., Nunnally C., Soliman Y., Ellis N. (2012a). Standing stocks and body size of deep-sea macrofauna: Predicting the baseline of 2010 deepwater horizon oil spill in the northern gulf of Mexico. Deep. Res. Part I Oceanogr. Res. Pap. 69, 82–99. doi: 10.1016/j.dsr.2012.07.008
Wei C. L., Rowe G. T., Fain Hubbard G., Scheltema A. H., Wilson G. D. F., Petrescu I., et al. (2010b). Bathymetric zonation of deep-sea macrofauna in relation to export of surface phytoplankton production. Mar. Ecol. Prog. Ser. 399, 1–14. doi: 10.3354/meps08388
Wei C. L., Rowe G. T., Haedrich R. L., Boland G. S. (2012b). Long-term observations of epibenthic fish zonation in the deep northern gulf of Mexico. PloS One 7 (10), e46707. doi: 10.1016/j.dsr2.2008.07.014
Wilson G. D. F. (2008). Local and regional species diversity of benthic Isopoda (Crustacea) in the deep Gulf of Mexico. Deep Sea Res. Part II Top. Stud. Oceanogr. 55, 2634–2649. doi: 10.1016/J.DSR2.2008.07.014
Woolley S. N. C., Tittensor D. P., Dunstan P. K., Guillera-Arroita G., Lahoz-Monfort J. J., Wintle B. A., et al. (2016). Deep-sea diversity patterns are shaped by energy availability. Nature 533, 393–396. doi: 10.1038/nature17937
Keywords: deep sea, macrofauna, diversity, abundance pattern, Gulf of Mexico
Citation: Quintanar-Retama O, Vázquez-Bader AR and Gracia A (2023) Macrofauna abundance and diversity patterns of deep sea southwestern Gulf of Mexico. Front. Mar. Sci. 9:1033596. doi: 10.3389/fmars.2022.1033596
Received: 31 August 2022; Accepted: 05 December 2022;
Published: 04 January 2023.
Edited by:
Sharon Z. Herzka, Center for Scientific Research and Higher Education in Ensenada (CICESE), MexicoReviewed by:
Jill R. Bourque, U.S. Geological Survey, United StatesJuan Moreira Da Rocha, Autonomous University of Madrid, Spain
Copyright © 2023 Quintanar-Retama, Vázquez-Bader and Gracia. This is an open-access article distributed under the terms of the Creative Commons Attribution License (CC BY). The use, distribution or reproduction in other forums is permitted, provided the original author(s) and the copyright owner(s) are credited and that the original publication in this journal is cited, in accordance with accepted academic practice. No use, distribution or reproduction is permitted which does not comply with these terms.
*Correspondence: Octavio Quintanar-Retama, b3F1aW50YW5hckBjaWVuY2lhcy51bmFtLm14; Adolfo Gracia, Z3JhY2lhQHVuYW0ubXg=