 María-Eugenia López1†
 Mikaela Bergenius Nord2†Olavi Kaljuste3Lovisa Wennerström3
 Zeynep Hekim3,4
 Joni Tiainen5Anti Vasemägi1,6*
- 1Department of Aquatic Resources, Institute of Freshwater Research, Swedish University of Agricultural Sciences, Drottningholm, Sweden
- 2Department of Aquatic Resources, Institute of Marine Research, Swedish University of Agricultural Sciences, Lysekil, Sweden
- 3Department of Aquatic Resources, Institute of Coastal Research, Swedish University of Agricultural Sciences, Öregrund, Sweden
- 4Joint Research Centre (JRC), European Commission, Ispra, Italy
- 5Natural Resources Institute Finland, Natural Resources Unit, Helsinki, Finland
- 6Chair of Aquaculture, Institute of Veterinary Medicine and Animal Sciences, Estonian University of Life Sciences, Tartu, Estonia
Overexploitation of fisheries is recognized as a major environmental and socioeconomic problem that threats biodiversity and ecosystem functioning. Inappropriate management policies of fish stocks have been applied as a consequence of inadequate characterization of subtle genetic structure in many fish species. In this study, we aim to assess the extent of genetic differentiation and structure of vendace (Coregonus albula) collected from eight locations in the Bothnian Bay, the northernmost part of the Baltic Sea. Specifically, we test if this species forms a single panmictic population or is divided into several genetically distinct units. We used restriction site-associated DNA sequencing (RAD-seq) to identify 21,792 SNPs based on 266 individuals. We identified a clear pattern of genetic differentiation between River Kalix and the other sampling locations, and a weak structuring between samples from Swedish and Finnish coast. Outlier analysis detected 41 SNPs putatively under divergent selection, mainly reflecting the divergence between River Kalix and the other samples. The outlier SNPs were located within or near 25 genes, including voltage-dependent calcium channel subunit alpha-2 (CACNA2D2), cadherin 26 (CDH26) and carbonic anhydrase 4-like (CA4) that have earlier been associated with salt-tolerance and salinity stress. Our study provides the first genome-wide perspective on genetic structuring of Baltic Sea vendace and rejects the hypothesis of panmixia in the Bothnian Bay. As such, our work demonstrates the power of RAD-sequencing to detect low but significant genetic structuring relevant for fisheries management.
Introduction
Overexploitation of fisheries has long been recognized as a major environmental and socioeconomic problem, threatening biodiversity and ecosystem functioning (Lotze et al., 2006; Worm et al., 2006; Worm et al., 2009). As a result, a third of commercial fish stocks are being harvested at biologically unsustainable levels and 90% are fully exploited (FAO, 2020), which strongly indicates that current approaches to fisheries management are not sufficiently successful in preventing the depletion of populations (Reiss et al., 2009). Successful management measures require that reproductively isolated populations are governed as independent stocks (Reiss et al., 2009). However, it is frequently assumed, without well-grounded scientific evidence, that the exploited species form single panmictic populations (Euclide et al., 2021). Management measures have consequently been inappropriate and in many cases led to unintentional overexploitation of local populations (Hutchinson, 2008; Li et al., 2015).
Testing for allele frequency differences between groups of individuals to characterize population genetic structuring should be the first step in fisheries management (Waples et al., 2008). However, the scarcity of obvious dispersal barriers, high levels of dispersal and gene flow, large population sizes generating low levels of random genetic drift in many marine species, make it challenging to identify low levels of genetic divergence (Waples, 1998; Allendorf et al., 2010; Waples et al., 2022). In the past, this has led to failed attempts to detect subtle genetic substructure using a limited number of neutral markers despite the ecological evidence for reproductive isolation (Waples, 1998; Allendorf et al., 2010). However, more recent studies have shown that by screening thousands or even millions of polymorphisms spread along the genome and identify specific variants affected by divergent natural selection, it is possible to identify genetic substructure, even when the overall level of genetic divergence across the majority of the genome is extremely low or non-existing (Lamichhaney et al., 2012; Guo et al., 2015; Barrio et al., 2016; Guo et al., 2016; Momigliano et al., 2017). For example, in Baltic herring, genome-wide screening of single nucleotide polymorphisms (SNPs) allowed identification of previously unknown highly divergent regions of the genome. These regions are most likely shaped by local adaptation linked to environmental factors, such as salinity and temperature, despite lack of genetic divergence at other parts of the genome (Guo et al., 2016; Han et al., 2020). Thus, the most promising feature of surveying genome-wide variation is that it provides insights into putative adaptive divergence and enables more precise and effective population delineation often unattainable with other methods (Bradbury et al., 2013).
Vendace (Coregonus albula) is a small salmonid fish that belongs to Eurasian cisco complex (Coregoninae) (Mehner et al., 2021; Sendek, 2021). This species inhabits deep and oligotrophic lakes in Western and Northern Europe (Vuorinen and Lankinen, 1978; Sendek, 2021; Karjalainen et al., 2022) and also occurs in the Baltic Sea, in brackish waters of the Bothnian Bay (Bergenius et al., 2013) and in the eastern part of the Gulf of Finland (Sendek, 2012). The southward distribution of vendace in the Baltic is limited by the increased salinity but it also occurs in estuaries. The upper salinity range of vendace is about 2 to 3 PSU (Lehtonen, 1981) and the Bothnian Bay salinity levels can increase to over 3 PSU in the southern part. Vendace is a short-lived species and can reach maturity already in their first year of life (Bergenius et al., 2013). Vendace spawns from October to December in river estuaries and shallow coastal areas (Lehtonen, 1981) and is known for its strong and unpredictable stock fluctuations caused by large fluctuations in recruitment (Karjalainen et al., 2000). Besides spawning stock biomass, hydro-climatic factors, in particular winter temperature and salinity, have shown to be important variables influencing the temporal variability of recruitment of vendace in the Bothnian Bay (Bergenius et al., 2013). Furthermore, Bergenius et al. (2013) demonstrated that recruitment variability in Bothnian Bay vendace is determined by density-independent factors (Karjalainen et al., 2000; Marjomäki, 2003). The role of trophic factors influencing vendace abundance in the Bothnian Bay have significantly changed with the increasing number of seals in the Bothnian Bay since the beginning of the 90s. The yearly consumption of vendace by seals is larger than the Finnish and Swedish landings combined (Lundström et al., 2014). The vendace in the Swedish part of the Bothnian Bay is mainly fished with pair bottom trawling for its roe, but also a smaller part of the fillets is sold for consumption (Bergenius et al., 2013). The main fishery takes place within the Luleå, Råneå and Kalix archipelagos during five weeks (as maximum) in September and October before spawning. The Swedish vendace roe fishery is one of the economically most important coastal fisheries in Sweden (Bergenius et al., 2018). In Finland, the vendace fishery is a small scale trawl and trap net fishery with increasing catches from early 2000’s to recent years (373 tn in year 2021) (Luke, 2022). Both the roe and fillets are sold for consumption, but as in Sweden, the most of the vendace catch are taken in September and October.
Vendace in the Bothnian Bay (ICES Subdivision 31) is currently assessed and managed as two separate entities, one off the coast of Sweden and one off Finland. Vendace in Sweden has since 2017 been managed according to the concept of Fmsy (maximum sustainable yield) and the fishery regulated by a total allowable quota. The spawning stock biomass of vendace in the Swedish part of the Bothnian Bay peaked in 2003-2004 and 2013- 2014, but has in recent times decreased to about half of what it was during those peaks. The likely explanations for the decrease are weaker recruitment of juvenile fish and increased seal predation (Sundelöf et al., 2022). There are no specific management regulations in place for vendace in Finland and no stock assessment has been conducted. It is only since 2019 that Finland is obliged to collect biological samples and information about discards as part of the EU’s data collection framework also for the vendace in the Bothnian Bay.
The management of vendace in the Bothnian Bay is solely based on the national boundaries between Sweden and Finland, and has in this way been managed as two separate stocks. However, the movement patterns of vendace in the Bothnian Bay are not well understood. A tagging study conducted in the Luleå and Kalix archipelagos in the 1960s and 1970s show that vendace undertake natal homing, i.e. the adults return to their birthplace archipelago to reproduce (Enderlein, 1977; Enderlein, 1986). The studies also show that vendace migrates eastwards in summer to feed in more nutritious waters, during which individuals from different estuaries and bays mix (Enderlein, 1986). Furthermore, we currently do not know whether the spawning aggregations of vendace distributed along the coast of the Bothnian Bay are genetically structured into different sub-populations and thus potentially require a more fine-scale management than what we have today.
Restriction site-associated DNA sequencing (RAD-seq) is a cost-effective and flexible genome complexity reduction technique that enables to effectively screen tens to hundreds of thousands of regions in the genome (Davey et al., 2011; Bruneaux et al., 2013). RAD-seq therefore enables simultaneous characterization of both neutral and adaptive patterns of genetic variation (Andrews et al., 2016) and is particularly suitable for delineating low levels of population genetic differences relevant for exploited fish species with large population sizes (Pujolar et al., 2014; Guo et al., 2015; Euclide et al., 2021). In this study, we screened 21,792 SNPs in 266 vendace from Gulf of Bothnia, Baltic Sea collected at eight spawning locations to test if this economically and ecologically important species forms a single panmictic population or is divided into several genetically distinct units in the Bothnian Bay. We also tested if some loci deviate from neutral genetic patterns and show elevated genetic differentiation indicative of divergent natural selection. To identify potential targets of selection and understand their function, we carried out functional annotation of putative outlier loci. We discuss our results in the light of current fisheries management practices of Bothnian Bay vendace and identify key knowledge gaps for future research.
Methods
Sampling
Vendace were sampled from spawning grounds of the Bothnian Bay during spawning time in autumn 2019 and 2020. In 2019, samples from four sites were collected from passive gears (gillnets and trapnets) in mid-October to guarantee the catch of local spawning fish; two sites located in mouths of Piteå and Kalix rivers (River Pite and River Kalix, Figure 1) and two sites in the coastal area off Piteå and Kalix (Piteå coastal 1 and Kalix coastal, Figure 1). In 2020, two additional samples were collected from survey trawl catches in mid-October, comprising two sites in the coastal area off Piteå and Luleå (Piteå coastal 2 and Luleå coastal, Figure 1). Vendace were also sampled from two locations off Oulu in Finland in 2020 (Oulu costal 1 and Oulu costal 2, Figure 1). These samples were taken from the trawled catch in the harbour during spawning season (October and November).
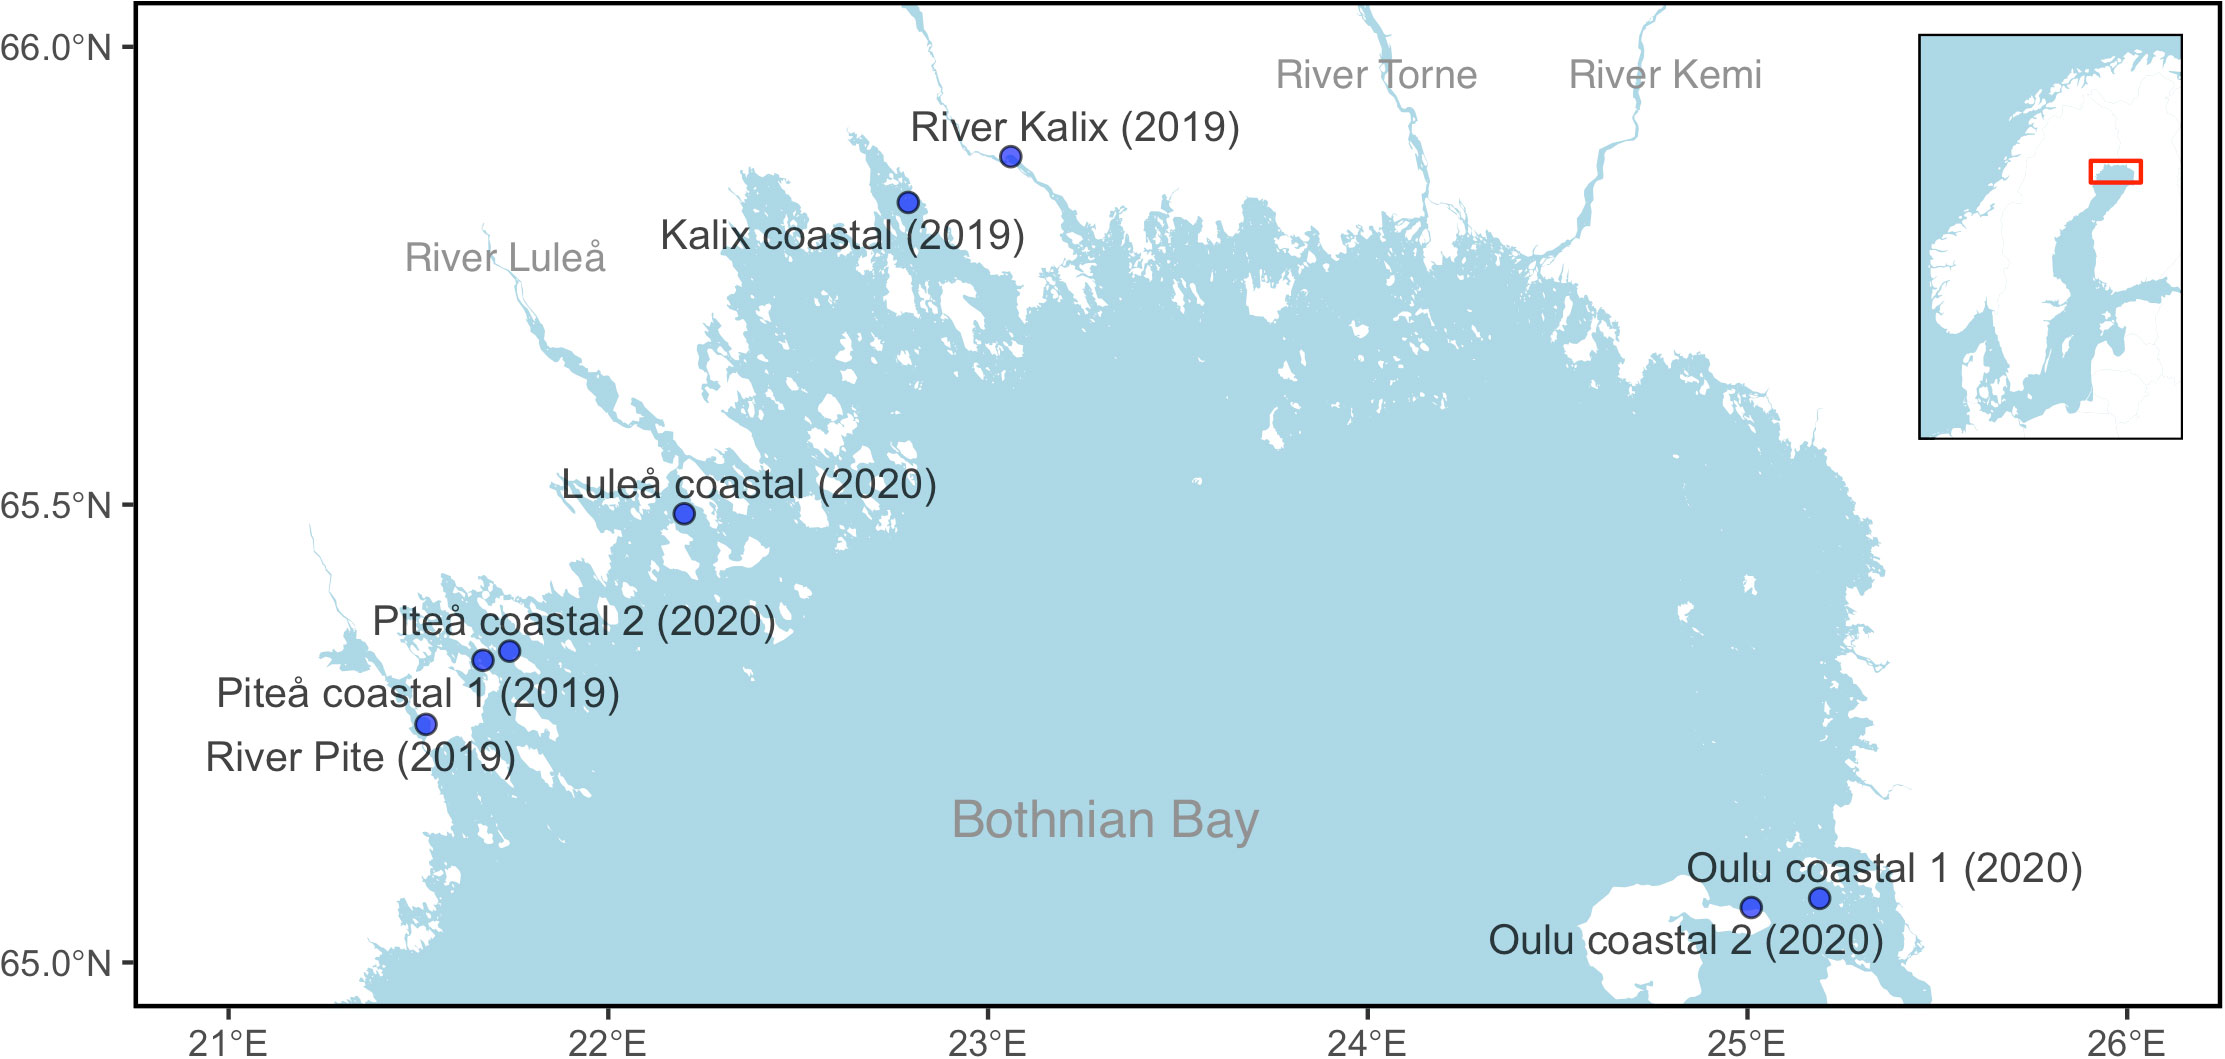
Figure 1 Geographical position of sampling locations for vendace. The main map shows the eight sampling sites in Gulf of Bothnia. The inset map gives an overview of the Scandinavian Peninsula and the location of the sampled area.
From each site, 50 ripe individuals, either in their final stage of maturation or with running roe or sperm, were randomly collected and frozen immediately. Only from one site (Oulu coastal 1) did the sample contain of mostly small immature individuals. In the laboratory individuals were thawed and a small piece of the muscle tissue (ca 0.5 cm3) was taken as soon as possible to ensure minimum degradation of the DNA. The small piece of muscle tissue was taken using a clean scalpel and stored in 95% ethanol.
Genome complexity reduction, sequencing and genotyping
A double-digestion restriction-site associated DNA (ddRAD) approach was employed for SNP discovery and de novo genotyping (Peterson et al., 2012). PstI and ApeKI were used for restriction digestion and a paired-end sequencing (2 × 150 bp) was carried out on an Illumina NextSeq 500/550 v2 platform by LGC Genomics GmbH (Berlin, Germany). SNP calling was carried out using Stacks v2.59 program (Catchen et al., 2013). Detected loci were filtered with Stacks v2.59 populations program setting option –r to 0.8 (minimum percentage of individuals per population required to process a locus), option -p 8 (minimum number of populations where a locus must be present) and option –min-maf to 0.05 (Minor allele frequency cutoff). For further analyses, additional filtering steps were applied with PLINK (Purcell et al., 2007), including samples call rate (–mind 0.2), global SNP call rate (–geno 0.1), and deviation from Hardy-Weinberg equilibrium (–hwe 2e-06) for all individuals.
Genetic diversity, structure and Ne estimation
We measured genetic diversity as the observed (HO) and expected heterozygosity (HE) calculated using summary function in the package R/adegenet (Jombart, 2008; Jombart et al., 2010). We also calculated the inbreeding coefficient (FIS) and the number of private allele using the functions basic.stats in R/hierfstat (Goudet, 2005) and private_alleles in R/poppr (Kamvar et al., 2014), respectively. The genetic differentiation between samples was quantified using pairwise unbiased FST estimator (Weir and Cockerham, 1984) calculated using StAMPP R package (Pembleton et al., 2013). Significance of FST values and 95% confidence intervals were computed using bootstrap methods as implemented in StAMPP R. The number of population clusters was visualized using a discriminant analysis of principal components (DAPC) using the r package adegenet (Jombart, 2008; Jombart et al., 2010). We used the “optim.a.score” function to identify the best number of principal components (PCs) to retain. Too many or too few PCs can lead to low repeatability of results and over- or underfitting the data, respectively (Jombart et al., 2010). We also used the Bayesian clustering method implemented in STRUCTURE to infer genetic structure (Pritchard et al., 2000). All runs were made using PARALLELSTRUCTURE (Besnier and Glover, 2013). We performed three independent runs for each value of K, with 10,000 MCMC permutations and a burn-in of 1,000 permutations. We evaluated K = 1–8, with the largest K reflecting all eight sampling locations. STRUCTURE HARVESTER (Earl and VonHoldt, 2012) was used to infer the most likely value of K using the Evanno’s method (Evanno et al., 2005). We calculated the effective population size (Ne) using the linkage disequilibrium (LD) method implemented in program NeEstimator 2.01 (Do et al., 2014). This method is based on a random mating model and assumes that all loci are physically unlinked (Waples, 2006). We obtained the Ne estimates and parametric 95% confidence intervals for each population a minimum allele frequency cutoff of 0.05 using 1650 SNPs filtered by call rate of 99%; outlier loci detected by BayeScan v.2.1 were also discarded from this analysis. We assessed the relationship between FST and migration rate (m) based on Wright (1943) island model of migration. We calculated FST as 1/[(4*Ne*m) +1)] by using the Ne estimates in each sample and several values of migration rates (m) from 0.02 to 0.4 in order to test possible demographic independence.
Signatures of selection
We identified candidate loci under selection using the Bayesian likelihood method implemented in BayeScan v.2.1, which uses differences in allele frequencies between populations to estimate the posterior probability of loci experiencing selection (Foll and Gaggiotti, 2008). The algorithm uses a reversible-jump Markov Chain Monte Carlo to explore models with or without selection, and applies a Bayes factor for two models: one assuming selection and another assuming neutrality given the data (Foll and Gaggiotti, 2008). Bayescan was carried out in two separated runs: (1) among the eight sampling locations and (2) among seven sampling sites with Kalix River excluded. We used BayeScan v.2.1 default parameters (Prior odds for the neutral model = 10). We considered candidate loci under selection as those that presented a Bayes factor of at least 32 (-log10 = 1.5) and a positive value of α (directional selection), corresponding to a posterior probability of 0.97 and expected as being “very strong” evidence of selection (Foll, 2012).
Gene annotation
Because of the lack of a reference genome of vendace, RAD loci harboring SNP putatively under selection were blasted against the reference genome of Swiss Alpine whitefish (Coregonus sp. “Balchen”) (GenBank: GCA_902810594.1) (De‐Kayne et al., 2020) and lake whitefish (Coregonus clupeaformis) (GenBank: GCA_020615455.1) (Pasquier et al., 2016) using BLAST® Command Line Applications 2.12.0 (NCBI and Camacho, 2008). The aligned sequences were then analyzed with BEDTools/2.29.2 adding 5000 bp upstream/downstream (Quinlan and Hall, 2010) to search genes within these regions using the reference genome annotation files (GFF).
Results
Sequencing and genotyping
Eighteen individuals with the lowest read count were excluded from Stacks analyses. Therefore, we used 270 individuals for SNP calling process. Mean locus coverage across all samples was 11.9x, ranging from 5.3x to 19.4x, with mean length of reads: 206.64 bp. Altogether, 21,792 variants and 266 individuals passed all filters and quality control steps and were used for subsequent population genetic analyses.
Genetic diversity, structure and Ne estimates
Heterozygosity estimates showed similar level of diversity among studied samples (Table 1). Slightly higher expected heterozygosity compared to observed heterozygosity suggested potentially some degree of inbreeding, which was shown by FIS values that ranged 0.019 to 0.026. No private alleles were detected for any of the samples. The eight sampling locations yielded 28 possible pairwise FST comparisons of which 23 were significant (p-value < 0.05) ranging from 0.003 to 0.0096 (Figure 2 and Table 2). Additionally, the analysis of statistical power using POWSIM (Ryman and Palm, 2006) showed that the sample sizes and SNP markers used in this study were adequate for detecting very low level of genetic differentiation (FST = 0.0011) with a high probability (P ~ 1)). The highest genetic differentiation was observed between River Kalix and Oulu costal 2 locations (FST= 0.0096) and River Kalix sample was significantly differentiated from all other studied locations. This pattern was also evident from the DAPC plot (Figure 3), where most of individuals from River Kalix formed a differentiated cluster. In addition, individuals from Oulu costal 1 and 2 locations showed weak separation from the rest of the samples along the second axis of DAPC. Using the STRUCTURE analysis, the Evanno’s method suggested the most likely number of genetic clusters was K=3, although K=2 showed a visually more distinct result (Figure 4 and Supplementary Table S1). Consistent with the DAPC and FST, STRUCTURE revealed that vendace from River Kalix were all clearly differentiated from the rest of the samples, showing a more homogenous pattern in terms of their ancestral proportions, being dominated by one cluster. Estimates of Ne with the RAD-derived SNPs varied across populations, ranging from close to 1288 (95%CI 1004-1794) in Oulu coastal 2 to 3439 (95%CI 1923-16019) for the Kalix coastal sample (Table 1). These estimates were calculated using SNPs that were filtered by call rate of 99%, providing over 1,000,000 pairwise comparisons between loci. Based on Wright (1943) island model of migration, the observed Ne estimates indicated that if the effective population size exceed 3000, low migration rates (m = 0.02-0.1) generate very low levels of differentiation (FST = 0.004-0.0008) (Figure 5). In contrast, if Ne <1000, low migration rates (m = 0.02-0.1) are expected to result in higher levels of differentiation (FST = 0.0025-0.012). Thus, the interpretation of low levels of divergence depends critically on the effective population sizes of studied populations.

Table 1 Observed (HO), expected (HE) heterozygosities, FIS and effective population size (Ne) estimates for the studied vendace samples.
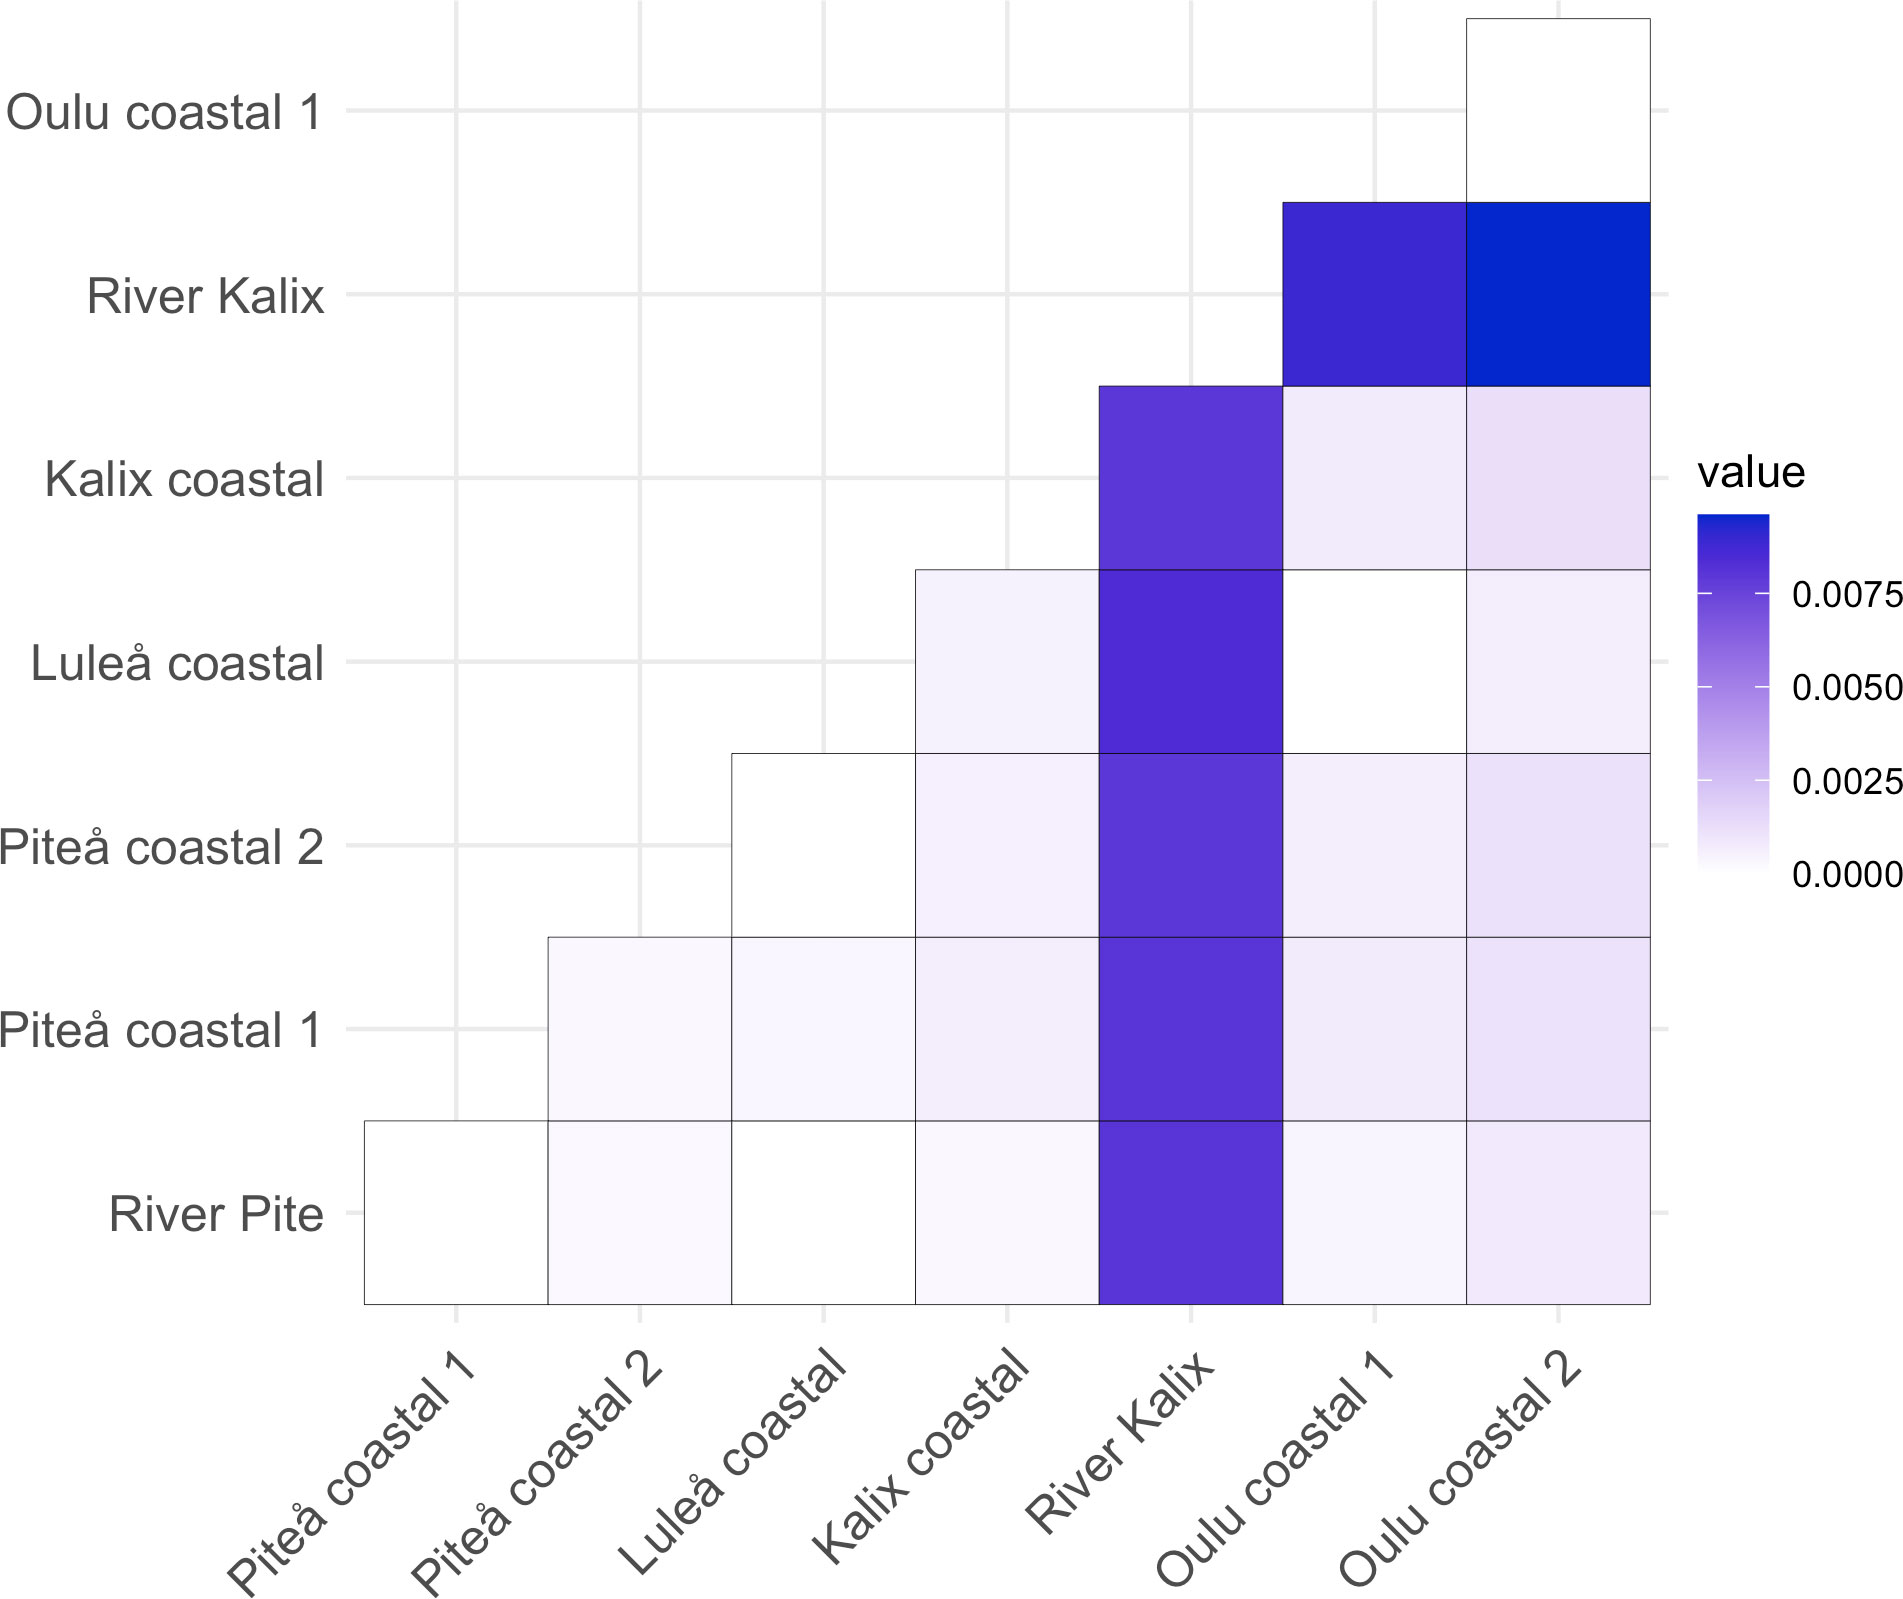
Figure 2 Heatmap for the pairwise FST between populations.
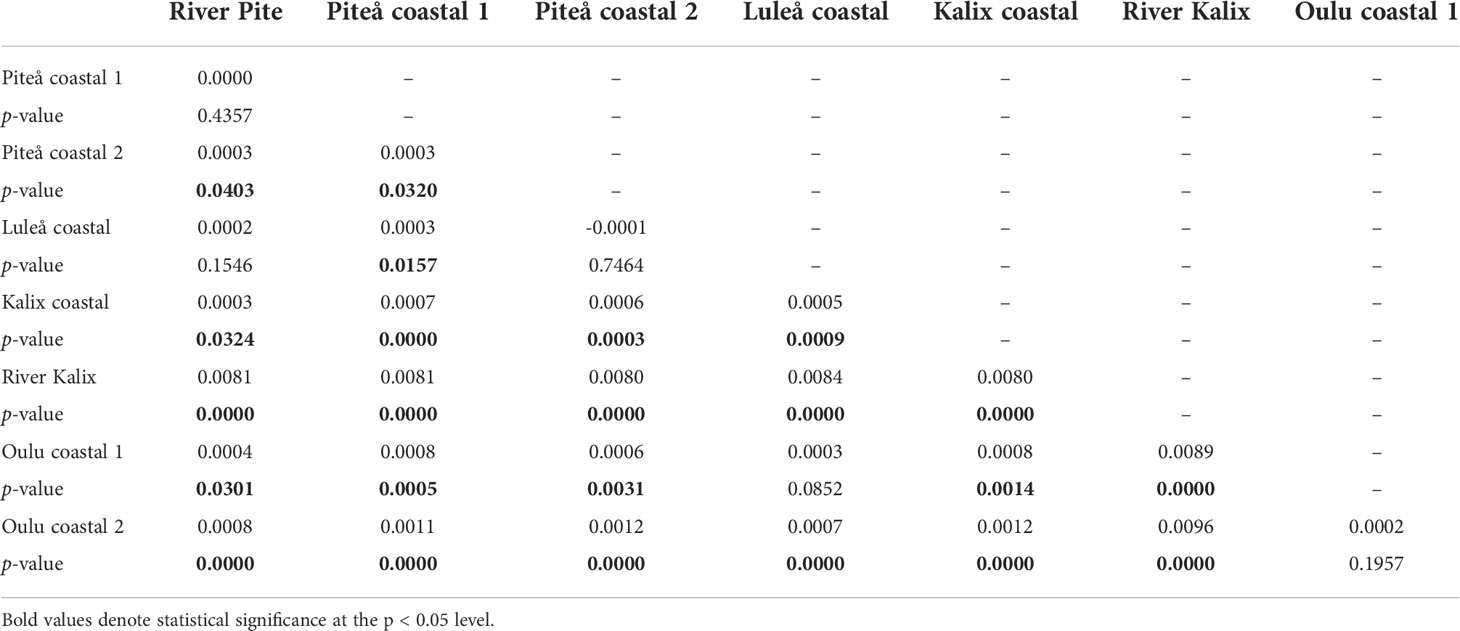
Table 2 Genetic differentiation measured as pairwise FST (Weir and Cockerham, 1984) and its associated p-values based on 21,792 SNPs.
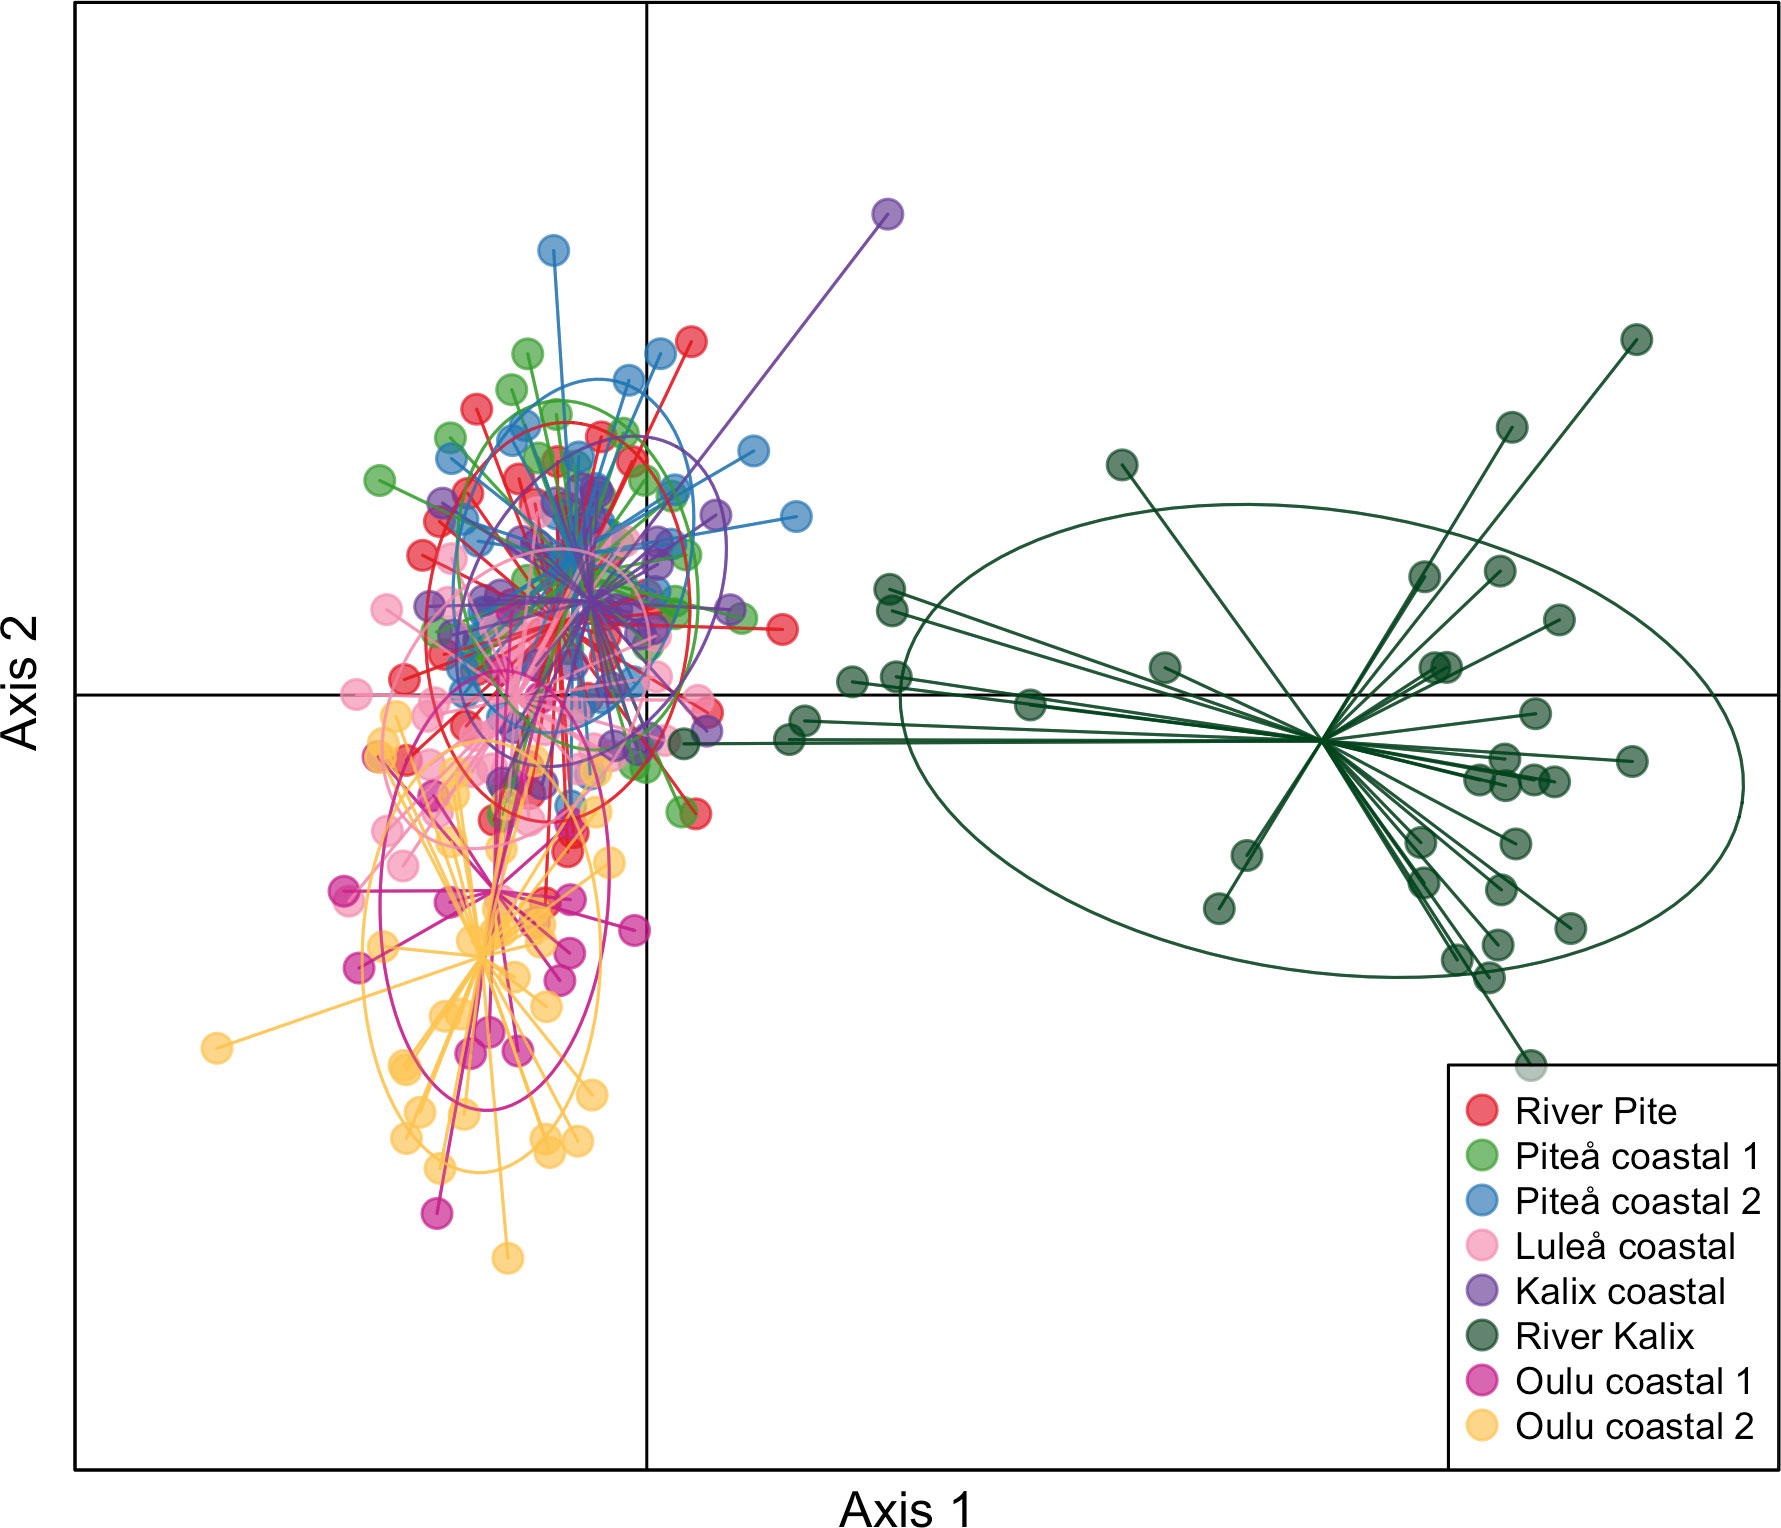
Figure 3 Discriminant Analysis of Principal Components (DAPC) of genetic differentiation of vendace. Individuals from different locations are represented by different colours.
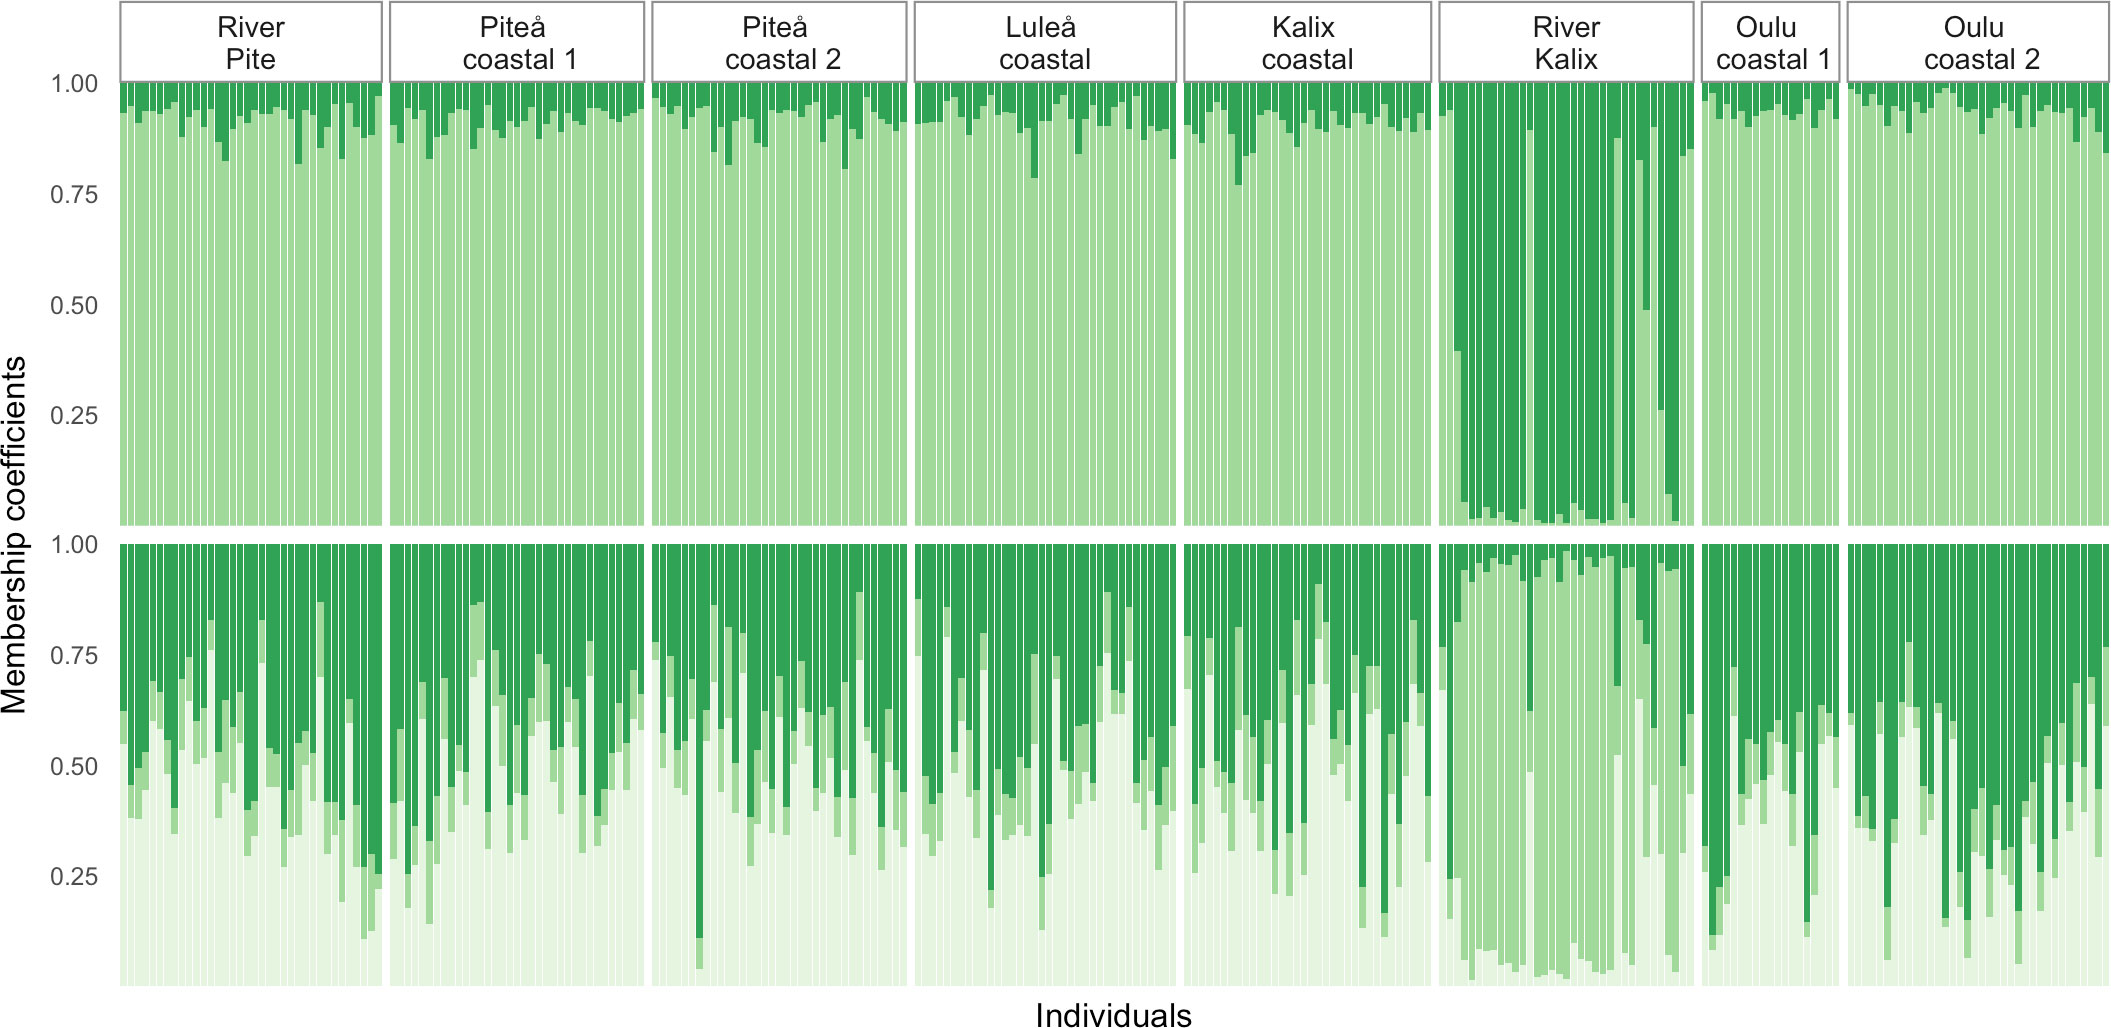
Figure 4 STRUCTURE estimated individual membership coefficients (q) of vendace for K=2 and K=3. Each color represents a cluster, and the ratio of vertical lines represent the membership coefficients for an individual.
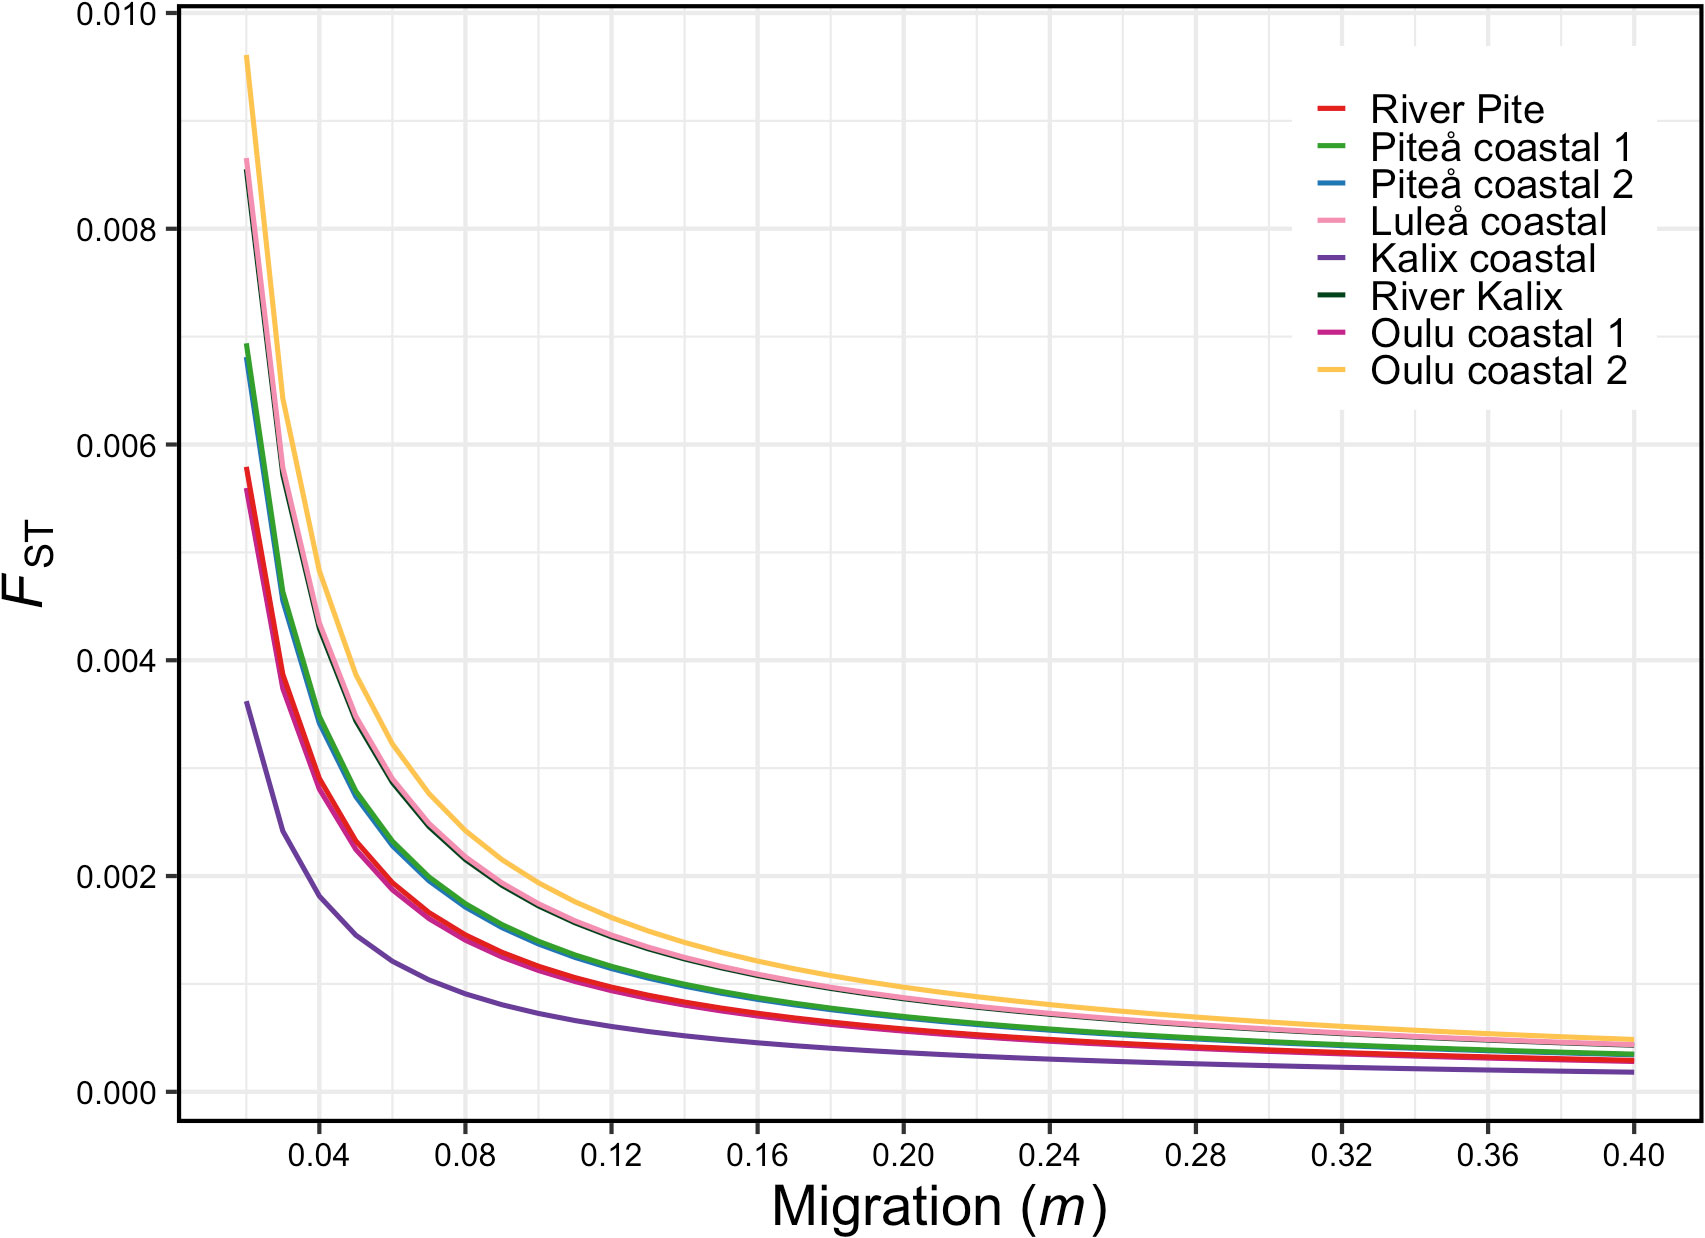
Figure 5 Relationship between FST and migration (m) calculated from Ne estimates of each sample of vendace used in this study. These calculations were based on Wright (1943) island model of migration.
Divergent selection and identification of outlier SNPs
BayeScan analysis detected 41 SNPs putatively under divergent selection when all samples were included to the analysis (Figure 6). However, when the River Kalix sample was removed, no SNP showed evidence of selection (Figure S1). Thus, all identified putative outliers reflected differences between River Kalix and other samples. Outlier loci were further investigated to identify genes by blasting the RAD loci against the Swiss Alpine whitefish and lake whitefish genome reference (S2, S3). The outlier SNPs genes were located within or near 25 genes, including voltage-dependent calcium channel subunit alpha-2 (CACNA2D2), cadherin 26 (CDH26) that have been associated with salt-tolerance in treefrog (Albecker et al., 2021), and the carbonic anhydrase 4-like (CA4) gene that showed to be upregulated in salinity stress in hybrid tilapia (Su et al., 2020). Genes within or adjacent (5000 bp) to the identified outlier loci for each reference genome are shown on Supplementary Files (S4, S5) and Figure 6.
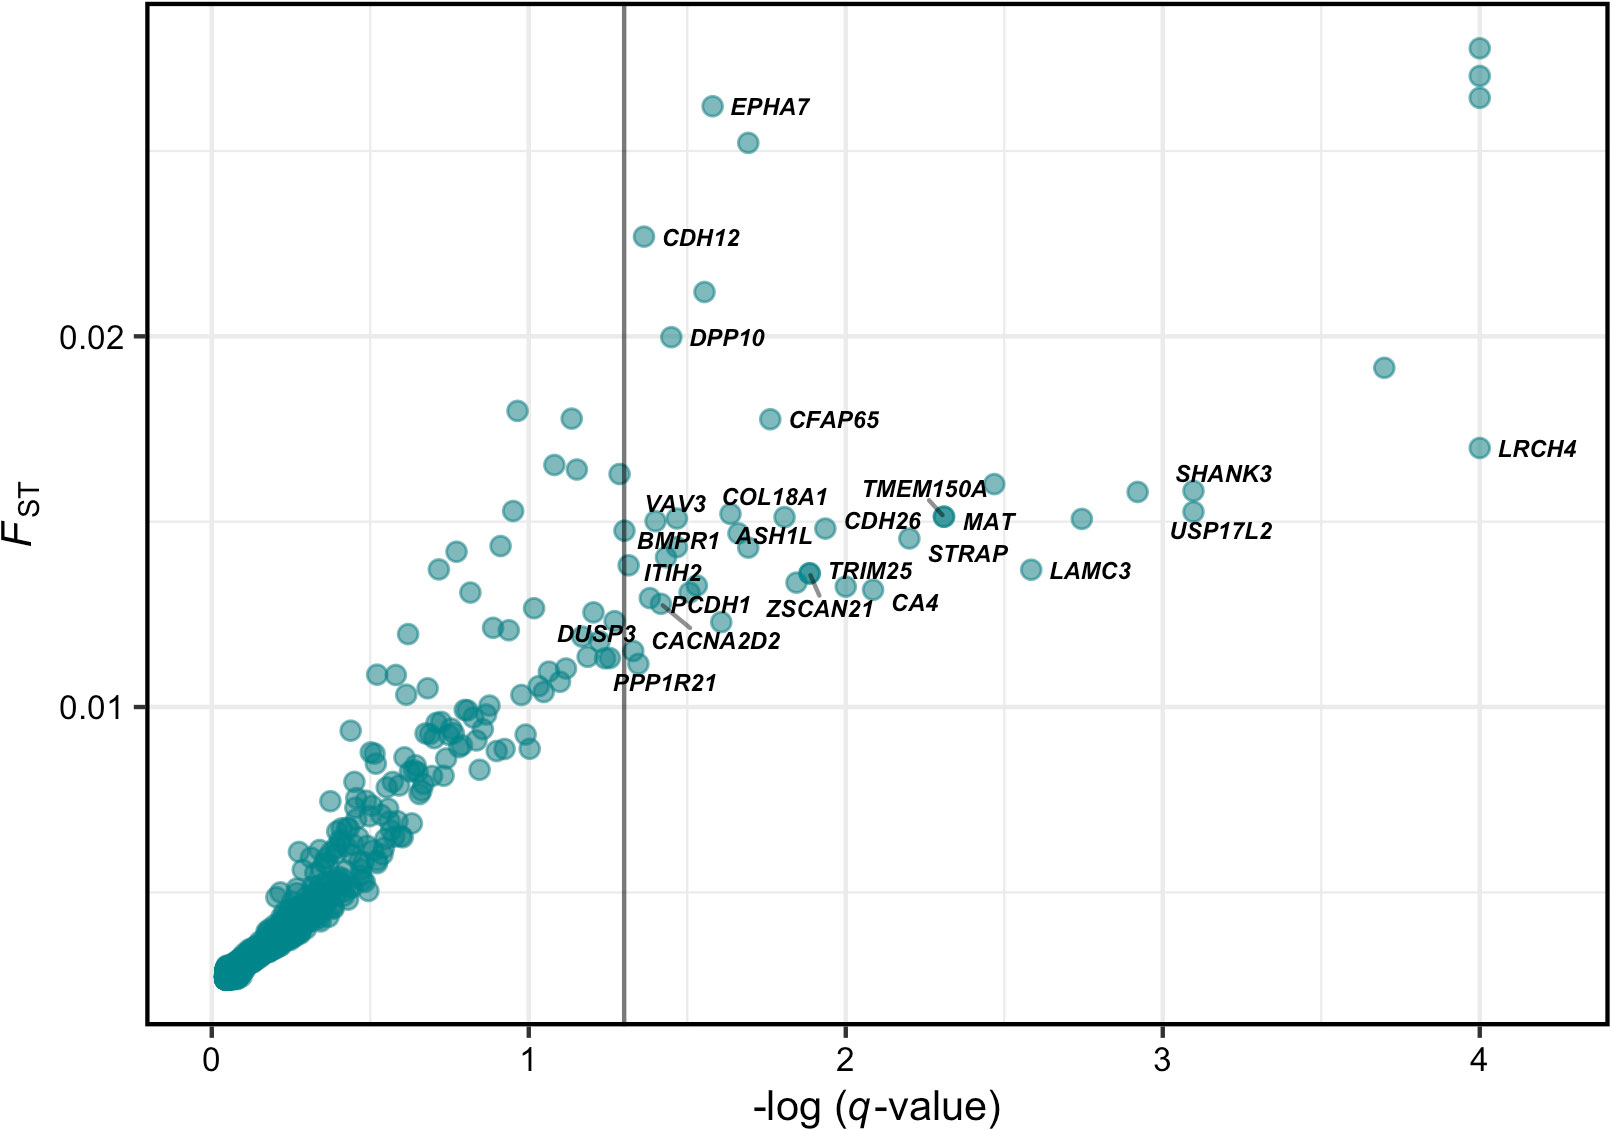
Figure 6 Analysis of divergent selection based on BayeScan. Points represent individual SNPs and their respective -log10(q-values) and FST values together with its closest gene. The vertical line represents the negative logarithm of a false discovery rate (FDR) threshold on 0.05 (1.30103). Dots greater than -log10(0.05) represent outlier loci.
Discussion
The successful management of fisheries depends on an adequate identification of biological populations, combined with the inclusion of spatial distribution information of the populations into management practices (Heath et al., 2014; Bernatchez et al., 2017). Pelagic species, however, that display certain life-history traits, such as high fecundity, large population sizes and high dispersal potential are expected to produce weak patterns of genetic differentiation (Ward et al., 1994; Waples, 1998; Palumbi, 2003; Hedgecock et al., 2007). This can lead to uncertainties about the level of structuring and gene flow between the populations, thus making sustainable fisheries management challenging (Cano et al., 2008). Here, we first evaluated the occurrence of a single panmictic population of vendace in the Bothnian Bay using tens of thousands of SNPs. After the rejection of panmixia, we further tested if some loci deviate from neutral genetic patterns indicative of putative adaptive divergence between populations driven by natural selection. In order to shed light on how much migration (m) is needed to generate the observed levels of low divergence between populations, we estimated the effective population sizes using linkage disequilibrium and inferred m based on Wright (1943) island model of migration. We discuss our findings in the light of demographic dependence, which has been suggested to occur if m>0.1 (Hastings, 1993) and the implications of low level of divergence to conservation and management of vendace in the Bothnian Bay.
Lack of panmixia and varying levels of divergence
Our study revealed weak but significant genetic structuring among studied samples of vendace in Bothnian Bay, ruling out the presence of panmixia. The most notable divergence was observed between River Kalix and the rest of the samples range (FST = 0.0080-0.0096). The Kalix river is one of the few large (drainage area 18 130 km2, runoff 280 m3) and unexploited (in terms of hydroelectric power) rivers in Sweden. The drop height is relatively even with many small rapids and falls. The genetic difference between the River Kalix, the Kalix coastal sample and the rest of the samples point to a complexity in the population structure of vendace not currently captured by the current management regime. The genetic differentiation found between the River Kalix and the other coastal samples likely reflects the relative isolation of the former, suggesting that lower reaches of rivers in the Bothnian Bay may support anadromous vendace populations which are genetically divergent from vendace spawning in coastal areas. In contrast to River Kalix, River Pite individuals were sampled very close to the river mouth, therefore, these samples may be closer to the coastal spawners than to vendace spawning in the river. Furthermore, outlier analysis revealed that the observed genetic divergence between River Kalix and other samples may be affected by divergent selection associated with the river environment. This was supported by identification of 41 outlier SNPs, from which, several of them were located near CACNA2D2 (voltage-dependent calcium channel subunit alpha-2), CDH26 (cadherin 26) and CA4 (carbonic anhydrase 4-like) genes that have previously been associated to salinity related traits in other species (Su et al., 2020; Albecker et al., 2021). For example, the osmoregulatory genes CACNA2D2 and CDH26 showed to be differentially expressed in costal populations of treefrog (i.e., populations with long-term saltwater exposure), while the CA4 gene showed to be upregulated in tilapia under salinity stress playing a role in osmoregulation-related signalling pathways. Thus, these genomic regions in vendace may be associated with divergent selection related to low salinity riverine environment. However, further analysis of other potential anadromous river populations in the Gulf of Bothnia is needed to confirm the occurrence of genetic divergence related to river-spawning and to further understand the impact of selective forces on the vendace genome. It may be that other large rivers, like the River Luleå, have their own genetically distinct population(s) of vendace. As the commercial fishery for vendace during spawning time is prohibited in Swedish rivers, it is possible that fisheries induced mortality is lower for those particular populations compared to coastal spawners.
From genetic differentiation to estimation of connectivity
The second most important finding of our study was the presence of low but statistically significant genetic differentiation (FST = 0.0004-0.0012) between vendace collected from different coastal areas in Sweden and Finland. Further, power analyses indicated our dataset has sufficient ability to uncover weak genetic differentiation. On one hand, the lack of genetic divergence or very low level of differentiation was expected for vendace given its pelagic lifestyle, large population size and dispersal ability, in waters with few physical barriers to gene flow. Such ecological attributes, shared among pelagic, as supposed to demersal, species are generally associated with low levels of genetic differentiation (Hauser and Ward, 1998). Unfortunately, any given FST value is consistent with a range of migration rates and therefore, knowledge on genetic divergence alone is insufficient for assessing demographic connectivity (Waples et al., 2022). Therefore, we inferred m based on Wright (1943) island model of migration [FST ≈1/(4Nem + 1)] by estimating the effective population sizes using linkage disequilibrium (Do et al., 2014). Our Ne estimates ranged from 1288 to 3439 which suggests that the migration rates do not necessarily need to exceed 0.1, the putative threshold suggested by Hastings (1993) for demographic independence (i.e., populations experiencing less migration are expected to act as demographically independent) to reach the current values of FST. Therefore, the observed low level of genetic divergence combined with large effective population size estimates may be associated with low or moderate levels of migration (Figure 5), indicative of some level of demographic independence. The occurrence of multiple genetically distinct populations is further supported by earlier mark-recapture studies which have shown strong homing of vendace to specific spawning grounds in the Bothnian Bay (Enderlein, 1989). However, since our Ne estimates were associated with considerable uncertainty, future studies based on larger sample sizes are needed to more precisely quantify the effective population size of the Bothnian Bay vendace. Furthermore, the Wright’s Island model used here to translate FST and Ne to estimates of migration is based on many simplifying assumptions compared with real populations (Spies et al., 2018). Finally, in contrast to River Kalix, the outlier analyses did not provide support for adaptive divergence among coastal samples. This suggests that the observed low level of divergence may be driven by random genetic drift and not by selection. However, since the analysed 20 000 SNPs only cover a proportion of the variation in the whole genome of vendace, we cannot exclude the possibility that other regions of the genome still harbour variants influenced by divergent selection.
In contrast to the current genome-wide analysis, earlier population genetic studies on vendace have typically been carried out using small numbers of highly variable markers, such as microsatellites. For example, Delling et al. (2014) detected a clear genetic structure in samples collected from 23 localities in Swedish lakes, which grouped into two different clusters, with the mean FST among lakes exceeding 0.15 based on 9 microsatellite loci. Based on 13 microsatellites, Karjalainen et al. (2022) found low to moderate genetic divergence (FST = 0.005-0.059) between the vendace populations of Kymijoki and Vuoksi drainage systems in Finland. Within the highly spatially structured Lake Saimaa system, Karjalainen et al. (2022) also detected low but significant genetic divergence between some local populations (FST = 0.01-0.011). However, despite low levels of genetic structuring consistent with reduced connectivity, Karjalainen et al. (2022) advised that because of similar life history and low genetic diversity, management of local vendace populations of Saimaa to be carried out as one management unit while allocating annually flexible fishing effort to the basins harbouring the strongest exploitation of local populations.
Management implications
The main rationale of this study was to investigate how genetic structure aligns with the current management units for vendace in the Bothnian Bay. Our results provide information that support low genetic divergence between River Kalix and all other samples, as well as weaker divergence between Finnish and Swedish costal locations. Genetic data are usually used to estimate genetic connectivity i.e., the degree to which gene flow affects evolutionary processes within populations. However, genetic methods alone provide limited information on demographic connectivity, i.e., the degree to which population growth and vital rates are affected by dispersal (Lowe and Allendorf, 2010). Furthermore, because of the nonlinear relationship between FST and Ne, estimations of demographic independence become straightforward only at moderate or large FST (Waples et al., 2022). Conversely, when genetic divergence is low, one cannot dismiss that there is significant isolation of stocks on timescales relevant to fisheries managements (Hauser and Carvalho, 2008). Hence, even though the divergence in the studied populations was low, it may still support separate management of vendace in the eastern and western Bothnian Bay, since we cannot rule out that these stocks are demographically independent. Furthermore, in the context of genetic conservation, the consequences of “oversplitting” are thought to be negligible, that is, there are no obvious costs if genetically homogeneous group of individuals are managed as if consisting of multiple divergent populations (Laikre et al., 2005). Tagging studies from the 1960s and 70s do in fact, show that vendace from the Swedish coast migrates eastwards, to feed in more nutritious waters, and on occasions all the way to the Finish coast (Enderlein, 1986). With the climate related changes of the biota in the Bothnian Bay during the last decades, including changes in potential food resources for vendace (Pekcan-Hekim et al., 2016) it is, however, possible that also the migration behaviour of vendace has changed since then. In addition, the location of the border between the two management areas is currently pragmatically following the jurisdictional boundary between the two countries. It may well be that the border for a potential eastern and western vendace stock in the Bothnian Bay should be placed somewhere else, for which the management of vendace would require an international agreement. The main ecological risk of not accounting for groups of individuals or stocks that are spatially distinct and have different productivities is the over harvesting of local spawning components, potentially resulting in reduced productivity and biodiversity combined with deteriorated local and regional stock dynamics (Ricker, 1958; Smedbol and Stephenson, 2001; Kerr et al., 2017). Moreover, not accounting for the degree of connectivity between local spawning components in stock assessments can result in the suboptimal use of the resource (Paulik et al., 1967).
Study design and methodological considerations
The observed level of genetic structuring observed among small number of samples clearly suggest the need for more extensive sampling and population genomic analysis of the Bothnian Bay vendace, as well as increasing the geographic scope including other regions of the Baltic Sea. Furthermore, our results indicate the importance of including rivers and estuaries, as potential habitats supporting genetically diverged Baltic vendace populations. As a result, it may well be that other rivers sustain local spawning populations that were not analysed in this study. Therefore, future work incorporating multidisciplinary analyses such as genomics, biometrics, geostatistics, oceanography as suggested in other studies (Abaunza et al., 2008; Cadrin, 2010; Zemeckis et al., 2014; McKeown et al., 2015; Mapp et al., 2017; McKeown et al., 2017; Cadrin, 2020) could yield additional insights into dispersal and connectivity of this species.
In addition, as no reference genome is available for vendace, the genomic positions of the SNPs of this study and gene annotation are still unknown. Therefore, a future reference genome assembly of this species will enable SNP discovery with greater power, and evade problems commonly met with the de novo RADseq SNP discovery (Díaz-Arce and Rodríguez-Ezpeleta, 2019). Moreover, future work incorporating whole genome resequencing data are expected to reduce ascertainment bias (Lachance and Tishkoff, 2013) allowing more comprehensive characterization of intra-specific genetic variation in vendace. The use of multiple statistical approaches including incorporation of environmental data, i.e. genetic-environment association analyses (GEAs) will likely provide more detailed understanding of key environmental factors driving local adaptation in vendace.
Conclusion
By utilizing 21,792 SNP loci, the present study provides the first genome-wide perspective on genetic differentiation in vendace populations within the northern most part of the Baltic Sea, the Bothnian Bay. Although the overall genome-wide genetic differentiation through the system studied here was low, we detected statistically significant genetic differentiation between a river and coastal samples, suggesting for the first time that at least some large river systems in Bothnian Bay may support anadromous vendace populations that are genetically divergent from vendace spawning in coastal areas. Accordingly, the results provide evidence for divergent selection in loci potentially associated to local adaptation in the river environment. We have also shown here that a weak level of genetic differentiation combined with large effective population sizes may reflect the occurrence of two demographically separated populations of vendace on the Finnish and Swedish coast. However, more comprehensive sampling is needed to identify more accurately the population boundaries. Overall, our findings present new insights into evolutionary processes that shape vendace populations in Bothnian Bay and are expected to assist in the refinement of management policies applied to this species.
Data availability statement
The data presented in the study are deposited in the Dryad Digital Repository, accession number https://doi.org/10.5061/dryad.m37pvmd5q.
Ethics statement
The animal study was reviewed and approved by Swedish Board of Agriculture (Jorbruksverket).
Author contributions
MBN, OK, ZH, and AV conceived and designed the study. M-EL performed bioinformatics and genetic analyses. M-EL, MBN, and AV drafted the manuscript. MBN, OK and ZH acquired the financial support for the project leading to this publication. MBN, ZH, LW, JT, and OK revised the manuscript critically and provided important intellectual content. AV supervised the work. All authors significantly contributed to the improvement and approved the final manuscript.
Funding
This study was partially funded by the Swedish Agency for Marine and Water Management (projects 1706-2020, 2912-2020, and 1788-21).
Acknowledgments
The computations and data handling were enabled by resources in project SNIC 2022/5-147 provided by the Swedish National Infrastructure for Computing (SNIC) at UPPMAX, partially funded by the Swedish Research Council through grant agreement no. 2018-05973. We also thank Konrad Karlsson for his help with drawing the geographic map.
Conflict of interest
The authors declare that the research was conducted in the absence of any commercial or financial relationships that could be construed as a potential conflict of interest.
Publisher’s note
All claims expressed in this article are solely those of the authors and do not necessarily represent those of their affiliated organizations, or those of the publisher, the editors and the reviewers. Any product that may be evaluated in this article, or claim that may be made by its manufacturer, is not guaranteed or endorsed by the publisher.
Supplementary material
The Supplementary Material for this article can be found online at: https://www.frontiersin.org/articles/10.3389/fmars.2022.1028863/full#supplementary-material
References
Abaunza P., Murta A., Campbell N., Cimmaruta R., Comesana A., Dahle G., et al. (2008). Considerations on sampling strategies for an holistic approach to stock identification: The example of the HOMSIR project. Fish. Res. 89 (2), 104–113. doi: 10.1016/j.fishres.2007.09.020
Albecker M. A., Stuckert A. M., Balakrishnan C. N., McCoy M. W. (2021). Molecular mechanisms of local adaptation for salt-tolerance in a treefrog. Mol. Ecol. 30 (9), 2065–2086. doi: 10.1111/mec.15867
Allendorf F. W., Hohenlohe P. A., Luikart G. (2010). Genomics and the future of conservation genetics. Nat. Rev. Genet. 11 (10), 697–709. doi: 10.1038/nrg2844
Andrews K. R., Good J. M., Miller M. R., Luikart G., Hohenlohe P. A. (2016). Harnessing the power of RADseq for ecological and evolutionary genomics. Nat. Rev. Genet. 17 (2), 81–92. doi: 10.1038/nrg.2015.28
Barrio A. M., Lamichhaney S., Fan G., Rafati N., Pettersson M., Zhang H., et al. (2016). The genetic basis for ecological adaptation of the Atlantic herring revealed by genome sequencing. elife 5, e12081. doi: 10.7554/eLife.12081
Bergenius M. A., Gårdmark A., Ustups D., Kaljuste O., Aho T. (2013). Fishing or the environment–what regulates recruitment of an exploited marginal vendace (Coregonus albula (L.)) population? Adv. Limnol. 64, 57–70. doi: 10.1127/1612-166X/2013/0064-0029
Bergenius M., Ringdahl K., Sundelöf A., Carlshamre S., Wennhage H., Valentinsson D. (2018). “Atlas över svenskt kust-och havsfiske 2003-2015,” in Aqua reports, vol. 3. (Drottningholm Lysekil Öregrund: Sveriges lantbruksuniversitet, Institutionen för akvatiska resurser).
Bernatchez L., Wellenreuther M., Araneda C., Ashton D. T., Barth J. M. I., Beacham T. D., et al. (2017). Harnessing the power of genomics to secure the future of seafood. Trends Ecol. Evol. 32 (9), 665–680. doi: 10.1016/j.tree.2017.06.010
Besnier F., Glover K. A. (2013). ParallelStructure: AR package to distribute parallel runs of the population genetics program STRUCTURE on multi-core computers. PloS One 8 (7), e70651. doi: 10.1371/journal.pone.0070651
Bradbury I. R., Hubert S., Higgins B., Bowman S., Borza T., Paterson I. G., et al. (2013). Genomic islands of divergence and their consequences for the resolution of spatial structure in an exploited marine fish. Evolutionary Appl. 6 (3), 450–461. doi: 10.1111/eva.12026
Bruneaux M., Johnston S. E., Herczeg G., Merilä J., Primmer C. R., Vasemägi A. (2013). Molecular evolutionary and population genomic analysis of the nine-spined stickleback using a modified restriction-site-associated DNA tag approach. Mol. Ecol. 22 (3), 565–582. doi: 10.1111/j.1365-294X.2012.05749.x
Cadrin S. X. (2010). Interdisciplinary analysis of yellowtail flounder stock structure off new England. Rev. Fish. Sci. 18 (3), 281–299. doi: 10.1080/10641262.2010.506251
Cadrin S. X. (2020). Defining spatial structure for fishery stock assessment. Fish. Res. 221, 105397. doi: 10.1016/j.fishres.2019.105397
Camacho C, Madden T, Ma N, Tao T, Agarwala R, Morgulis A, et al (2008). BLAST (r) command line applications user manual (National Center for Biotechnology Information (US).
Cano J. M., Shikano T., Kuparinen A., Merilä J. (2008). Genetic differentiation, effective population size and gene flow in marine fishes: Implications for stock management. J. Integr. Field Biol. 5, 1–10.
Catchen J., Hohenlohe P. A., Bassham S., Amores A., Cresko W. A. (2013). Stacks: an analysis tool set for population genomics. Mol. Ecol. 22 (11), 3124–3140. doi: 10.1111/mec.12354
Davey J. W., Hohenlohe P. A., Etter P. D., Boone J. Q., Catchen J. M., Blaxter M. L. (2011). Genome-wide genetic marker discovery and genotyping using next-generation sequencing. Nat. Rev. Genet. 12 (7), 499–510. doi: 10.1038/nrg3012
De-Kayne R., Zoller S., Feulner P. G. (2020). A de novo chromosome-level genome assembly of coregonus sp.“Balchen”: One representative of the Swiss alpine whitefish radiation. Mol. Ecol. Resour. 20 (4), 1093–1109. doi: 10.1111/1755-0998.13187
Delling B., Palm S., Palkopoulou E., Prestegaard T. (2014). Genetic signs of multiple colonization events in Baltic ciscoes with radiation into sympatric spring-and autumn-spawners confined to early postglacial arrival. Ecol. Evol. 4 (22), 4346–4360. doi: 10.1002/ece3.1299
Díaz-Arce N., Rodríguez-Ezpeleta N. (2019). Selecting RAD-seq data analysis parameters for population genetics: The more the better? Front. Genet. 10, 533. doi: 10.3389/fgene.2019.00533
Do C., Waples R. S., Peel D., Macbeth G., Tillett B. J., Ovenden J. R. (2014). NeEstimator v2: Re-implementation of software for the estimation of contemporary effective population size (Ne) from genetic data. Mol. Ecol. Resour. 14 (1), 209–214. doi: 10.1111/1755-0998.12157
Earl D. A., VonHoldt B. M. (2012). STRUCTURE HARVESTER: A website and program for visualizing STRUCTURE output and implementing the evanno method. Conserv. Genet. Resour. 4 (2), 359–361. doi: 10.1007/s12686-011-9548-7
Enderlein O. (1986). Vendace (Coregonus albula (L.)) in the bothnian bay, the Baltic. Inf. Inst. Freshw. Res. (Drottningholm) 1, 130.
Enderlein O. (1989). Migratory behaviour of adult cisco, coregonus albula l., in the bothnian bay. J. fish Biol. 34 (1), 11–18. doi: 10.1111/j.1095-8649.1989.tb02952.x
Euclide P. T., MacDougall T., Robinson J. M., Faust M. D., Wilson C. C., Chen K. Y., et al. (2021). Mixed-stock analysis using rapture genotyping to evaluate stock-specific exploitation of a walleye population despite weak genetic structure. Evolutionary Appl. 14 (5), 1403–1420. doi: 10.1111/eva.13209
Evanno G., Regnaut S., Goudet J. (2005). Detecting the number of clusters of individuals using the software STRUCTURE: A simulation study. Mol. Ecol. 14 (8), 2611–2620. doi: 10.1111/j.1365-294X.2005.02553.x
FAO (2020). The State of World Fisheries and Aquaculture 2020. Sustainability in action. Rome. https://doi.org/10.4060/ca9229en
Foll M., Gaggiotti O. (2008). A genome-scan method to identify selected loci appropriate for both dominant and codominant markers: a Bayesian perspective. Genetics 180 (2), 977–993. doi: 10.1534/genetics.108.092221
Goudet J. (2005). Hierfstat, a package for r to compute and test hierarchical f-statistics. Mol. Ecol. Notes 5 (1), 184–186. doi: 10.1111/j.1471-8286.2004.00828.x
Guo B., DeFaveri J., Sotelo G., Nair A., Merilä J. (2015). Population genomic evidence for adaptive differentiation in Baltic Sea three-spined sticklebacks. BMC Biol. 13 (1), 1–18. doi: 10.1186/s12915-015-0130-8
Guo B., Li Z., Merilä J. (2016). Population genomic evidence for adaptive differentiation in the Baltic Sea herring. Mol. Ecol. 25 (12), 2833–2852. doi: 10.1111/mec.13657
Han F., Jamsandekar M., Pettersson M. E., Su L., Fuentes-Pardo A. P., Davis B. W., et al. (2020). Ecological adaptation in Atlantic herring is associated with large shifts in allele frequencies at hundreds of loci. Elife 9, e61076. doi: 10.7554/eLife.61076.sa2
Hastings A. (1993). Complex interactions between dispersal and dynamics: Lessons from coupled logistic equations. Ecology 74 (5), 1362–1372. doi: 10.2307/1940066
Hauser L., Carvalho G. R. (2008). Paradigm shifts in marine fisheries genetics: Ugly hypotheses slain by beautiful facts. Fish. Fish. 9 (4), 333–362. doi: 10.1111/j.1467-2979.2008.00299.x
Hauser L., Ward R. (1998). “Population identification in pelagic fish: the limits of molecular markers,” in Advances in molecular ecology. Ed. Carvalho G. R. (Amsterdam: IOS Press).
Heath M. R., Culling M. A., Crozier W. W., Fox C. J., Gurney W. S., Hutchinson W. F., et al. (2014). Combination of genetics and spatial modelling highlights the sensitivity of cod (Gadus morhua) population diversity in the north Sea to distributions of fishing. ICES J. Mar. Sci. 71 (4), 794–807. doi: 10.1093/icesjms/fst185
Hedgecock D., Barber P. H., Edmands S. (2007). Genetic approaches to measuring connectivity. Oceanography 20 (3), 70–79. doi: 10.5670/oceanog.2007.30
Hutchinson W. F. (2008). The dangers of ignoring stock complexity in fishery management: The case of the north Sea cod. Biol. Lett. 4 (6), 693–695. doi: 10.1098/rsbl.2008.0443
Jombart T. (2008). Adegenet: A r package for the multivariate analysis of genetic markers. Bioinformatics 24 (11), 1403–1405. doi: 10.1093/bioinformatics/btn129
Jombart T., Devillard S., Balloux F. (2010). Discriminant analysis of principal components: A new method for the analysis of genetically structured populations. BMC Genet. 11 (1), 94. doi: 10.1186/1471-2156-11-94
Kamvar Z. N., Tabima J. F., Grünwald N. J. (2014). Poppr: an r package for genetic analysis of populations with clonal, partially clonal, and/or sexual reproduction. PeerJ 2, e281. doi: 10.7717/peerj.281
Karjalainen J., Auvinen H., Helminen H., Marjomäki T., Niva T., Sarvala J., et al. (2000). Unpredictability of fish recruitment: interannual variation in young–of–the–year abundance. J. Fish. Biol. 56 (4), 837–857. doi: 10.1111/j.1095-8649.2000.tb00876.x
Karjalainen J., Sjövik R., Väänänen T., Sävilammi T., Sundberg L.-R., Uusi-Heikkilä S., et al. (2022). Genetic-based evaluation of management units for sustainable vendace (Coregonus albula) fisheries in a large lake system. Fish. Res. 246, 106173. doi: 10.1016/j.fishres.2021.106173
Kerr L. A., Hintzen N. T., Cadrin S. X., Clausen L. W., Dickey-Collas M., Goethel D. R., et al. (2017). Lessons learned from practical approaches to reconcile mismatches between biological population structure and stock units of marine fish. ICES J. Mar. Sci. 74 (6), 1708–1722. doi: 10.1093/icesjms/fsw188
Lachance J., Tishkoff S. A. (2013). SNP ascertainment bias in population genetic analyses: Why it is important, and how to correct it. Bioessays 35 (9), 780–786. doi: 10.1002/bies.201300014
Laikre L., Palm S., Ryman N. (2005). Genetic population structure of fishes: Implications for coastal zone management. AMBIO: A J. Hum. Environ. 34 (2), 111–119. doi: 10.1579/0044-7447-34.2.111
Lamichhaney S., Barrio A. M., Rafati N., Sundström G., Rubin C.-J., Gilbert E. R., et al. (2012). Population-scale sequencing reveals genetic differentiation due to local adaptation in Atlantic herring. Proc. Natl. Acad. Sci. 109 (47), 19345–19350. doi: 10.1073/pnas.1216128109
Lehtonen H. (1981). Biology and stock assessments of coregonids by the Baltic coast of Finland [Coregonus lavaretus, c. widegreni, c. albula]. Finnish Fish. Res. 3, 31–83
Li Y., Bence J. R., Brenden T. O. (2015). An evaluation of alternative assessment approaches for intermixing fish populations: a case study with great lakes lake whitefish. ICES J. Mar. Sci. 72 (1), 70–81. doi: 10.1093/icesjms/fsu057
Lotze H. K., Lenihan H. S., Bourque B. J., Bradbury R. H., Cooke R. G., Kay M. C., et al. (2006). Depletion, degradation, and recovery potential of estuaries and coastal seas. Science 312 (5781), 1806–1809. doi: 10.1126/science.1128035
Lowe W. H., Allendorf F. W. (2010). What can genetics tell us about population connectivity? Mol. Ecol. 19 (15), 3038–3051. doi: 10.1111/j.1365-294X.2010.04688.x
Luke (2022). Available at: https://www.luke.fi/sv/statistik/statistikinfo/statistikdatabas.
Lundström K., Bergenius M., Aho T., Lunneryd S. (2014). “Födoval hos vikaresäl i bottenviken: Rapport från den svenska forskningsjakten 2007–2009,” in Aqua reports 1. Institutionen för akvatiska resurser, Sveriges lantbruksuniversitet, Lysekil, 23
Mapp J., Hunter E., van der Kooij J., Songer S., Fisher M. (2017). Otolith shape and size: The importance of age when determining indices for fish-stock separation. Fish. Res. 190, 43–52. doi: 10.1016/j.fishres.2017.01.017
Marjomäki T. J. (2003). “Recruitment variability in vendace, coregonus albula (L.), and its consequences for vendace harvesting,” Jyväskylä Studies in Biological and Environmental Science, 127, 1–66
McKeown N. J., Arkhipkin A. I., Shaw P. W. (2015). Integrating genetic and otolith microchemistry data to understand population structure in the Patagonian hoki (Macruronus magellanicus). Fish. Res. 164, 1–7. doi: 10.1016/j.fishres.2014.10.004
McKeown N. J., Arkhipkin A. I., Shaw P. W. (2017). Regional genetic population structure and fine scale genetic cohesion in the southern blue whiting micromesistius australis. Fish. Res. 185, 176–184. doi: 10.1016/j.fishres.2016.09.006
Mehner T., Palm S., Delling B., Karjalainen J., Kiełpińska J., Vogt A., et al. (2021). Genetic relationships between sympatric and allopatric coregonus ciscoes in north and central Europe. BMC Ecol. Evol. 21 (1), 1–17. doi: 10.1186/s12862-021-01920-8
Momigliano P., Jokinen H., Fraimout A., Florin A.-B., Norkko A., Merilä J. (2017). Extraordinarily rapid speciation in a marine fish. Proc. Natl. Acad. Sci. 114 (23), 6074–6079. doi: 10.1073/pnas.1615109114
Palumbi S. R. (2003). Population genetics, demographic connectivity, and the design of marine reserves. Ecol. Appl. 13 (sp1), 146–158. doi: 10.1890/1051-0761(2003)013
Pasquier J., Cabau C., Nguyen T., Jouanno E., Severac D., Braasch I., et al. (2016). Gene evolution and gene expression after whole genome duplication in fish: the PhyloFish database. BMC Genomics 17 (1), 1–10. doi: 10.1186/s12864-016-2709-z
Paulik G., Hourston A., Larkin P. (1967). Exploitation of multiple stocks by a common fishery. J. Fish. Board Canada 24 (12), 2527–2537. doi: 10.1139/f67-202
Pekcan-Hekim Z., Gårdmark A., Karlson A. M., Kauppila P., Bergenius M., Bergström L. (2016). The role of climate and fisheries on the temporal changes in the bothnian bay foodweb. ICES J. Mar. Sci. 73 (7), 1739–1749. doi: 10.1093/icesjms/fsw032
Pembleton L. W., Cogan N. O. I., Forster J. W. (2013). StAMPP: An r package for calculation of genetic differentiation and structure of mixed-ploidy level populations. Mol. Ecol. Resour. 13 (5), 946–952. doi: 10.1111/1755-0998.12129
Peterson B. K., Weber J. N., Kay E. H., Fisher H. S., Hoekstra H. E. (2012). Double digest RADseq: An inexpensive method for de novo SNP discovery and genotyping in model and non-model species. PloS One 7(5), e37135. doi: 10.1371/journal.pone.0037135
Pritchard J. K., Stephens M., Donnelly P. (2000). Inference of population structure using multilocus genotype data. Genetics 155 (2), 945–959. doi: 10.1093/genetics/155.2.945
Pujolar J., Jacobsen M., Als T. D., Frydenberg J., Munch K., Jónsson B., et al. (2014). Genome-wide single-generation signatures of local selection in the panmictic e uropean eel. Mol. Ecol. 23 (10), 2514–2528. doi: 10.1111/mec.12753
Purcell S., Neale B., Todd-Brown K., Thomas L., Ferreira M. A. R., Bender D., et al. (2007). PLINK: A tool set for whole-genome association and population-based linkage analyses. Am. J. Hum. Genet. 81 (3), 559–575. doi: 10.1086/519795
Quinlan A. R., Hall I. M. (2010). BEDTools: A flexible suite of utilities for comparing genomic features. Bioinformatics 26 (6), 841–842. doi: 10.1093/bioinformatics/btq033
Reiss H., Hoarau G., Dickey-Collas M., Wolff W. J. (2009). Genetic population structure of marine fish: Mismatch between biological and fisheries management units. Fish. Fish. 10 (4), 361–395. doi: 10.1111/j.1467-2979.2008.00324.x
Ricker W. (1958). Maximum sustained yields from fluctuating environments and mixed stocks. J. Fish. Board Canada 15 (5), 991–1006. doi: 10.1139/f58-054
Ryman N., Palm S. (2006). POWSIM: A computer program for assessing statistical power when testing for genetic differentiation. Mol. Ecol. Notes 6 (3), 600–602. doi: 10.1111/j.1471-8286.2006.01378.x
Sendek D. (2012). Intra-species alliance of the European whitefish coregonus lavaretus l. and vendace coregonus albula l. from the Russian part of the gulf of Finland and the largest lakes of the eastern Baltic basin. Oceanology 52 (6), 790–796. doi: 10.1134/S0001437012060124
Sendek D. S. (2021). Phylogenetic relationships in vendace and least cisco, and their distribution areas in Western Eurasia. Annales Zool. Fennici 58 (4-6), 289–306. doi: 10.5735/086.058.0413
Smedbol R., Stephenson R. (2001). The importance of managing within-species diversity in cod and herring fisheries of the north-western Atlantic. J. Fish. Biol. 59, 109–128. doi: 10.1111/j.1095-8649.2001.tb01382.x
Spies I., Hauser L., Jorde P. E., Knutsen H., Punt A. E., Rogers L. A., et al. (2018). Inferring genetic connectivity in real populations, exemplified by coastal and oceanic Atlantic cod. Proc. Natl. Acad. Sci. 115 (19), 4945–4950. doi: 10.1073/pnas.1800096115
Su H., Ma D., Zhu H., Liu Z., Gao F. (2020). Transcriptomic response to three osmotic stresses in gills of hybrid tilapia (Oreochromis mossambicus female× o. urolepis hornorum male). BMC Genomics 21 (1), 1–20. doi: 10.1186/s12864-020-6512-5
Sundelöf A. Florin A.-B. rogellB., bolund E., Vitale F. Sundblad G. (2022). Fisk- och skaldjursbestånd i hav och sötvatten 2021, Swedish Agency for Marine and Water Management 342.
Vuorinen J., Lankinen P. (1978). Genetic differentiation between vendace [Coregonus albula (L.)] populations in eastern Finland. SIL Proceedings 1922-2010 20 (3), 2111–2116. doi: 10.1080/03680770.1977.11896826
Waples R. S. (1998). Separating the wheat from the chaff: patterns of genetic differentiation in high gene flow species. J. Hered. 89, 439–450. doi: 10.1093/jhered/89.5.438
Waples R. S. (2006). A bias correction for estimates of effective population size based on linkage disequilibrium at unlinked gene loci. Conserv. Genet. 7 (2), 167–184. doi: 10.1007/s10592-005-9100-y
Waples R. S., Ford M. J., Nichols K., Kardos M., Myers J., Thompson T. Q., et al. (2022). Implications of Large-effect loci for conservation: A review and case study with pacific salmon. J. Hered. 113 (2), 121–144. doi: 10.1093/jhered/esab069
Waples R. S., Punt A. E., Cope J. M. (2008). Integrating genetic data into management of marine resources: How can we do it better? Fish. Fish. 9 (4), 423–449. doi: 10.1111/j.1467-2979.2008.00303.x
Ward R. D., Woodwark M., Skibinski D. O. F. (1994). A comparison of genetic diversity levels in marine, freshwater, and anadromous fishes. J. Fish. Biol. 44(2), 213–232. doi: 10.1111/j.1095-8649.1994.tb01200.x
Weir B., Cockerham C. (1984). Estimating f-statistics for the analysis of population structure. Evolution 38 (6), 1358–1370. doi: 10.1111/j.1558-5646.1984.tb05657.x
Worm B., Barbier E. B., Beaumont N., Duffy J. E., Folke C., Halpern B. S., et al. (2006). Impacts of biodiversity loss on ocean ecosystem services. science 314 (5800), 787–790. doi: 10.1126/science.1132294
Worm B., Hilborn R., Baum J. K., Branch T. A., Collie J. S., Costello C., et al. (2009). Rebuilding global fisheries. science 325 (5940), 578–585. doi: 10.1126/science.1173146
Keywords: coregonids, effective size, population structure, genetic differentiation, fisheries management, Coregonus albula
Citation: López M-E, Bergenius Nord M, Kaljuste O, Wennerström L, Hekim Z, Tiainen J and Vasemägi A (2022) Lack of panmixia of Bothnian Bay vendace - Implications for fisheries management. Front. Mar. Sci. 9:1028863. doi: 10.3389/fmars.2022.1028863
Received: 26 August 2022; Accepted: 06 October 2022;
Published: 07 November 2022.
Edited by:
Fran Saborido-Rey, Spanish National Research Council (CSIC), SpainReviewed by:
Antonia Picornell, University of the Balearic Islands, SpainJuha Karjalainen, University of Jyväskylä, Finland
Copyright © 2022 López, Bergenius Nord, Kaljuste, Wennerström, Hekim, Tiainen and Vasemägi. This is an open-access article distributed under the terms of the Creative Commons Attribution License (CC BY). The use, distribution or reproduction in other forums is permitted, provided the original author(s) and the copyright owner(s) are credited and that the original publication in this journal is cited, in accordance with accepted academic practice. No use, distribution or reproduction is permitted which does not comply with these terms.
*Correspondence: Anti Vasemägi, YW50aS52YXNlbWFnaUBzbHUuc2U=
†These authors have contributed equally to this work and share first authorship