 Lina Cai
 Rong Tang
 Xiaojun Yan
 Yongdong Zhou
 Jingjing Jiang
 Menghan Yu
94% of researchers rate our articles as excellent or good
Learn more about the work of our research integrity team to safeguard the quality of each article we publish.
Find out more
ORIGINAL RESEARCH article
Front. Mar. Sci., 11 October 2022
Sec. Marine Fisheries, Aquaculture and Living Resources
Volume 9 - 2022 | https://doi.org/10.3389/fmars.2022.1022375
Details of the chlorophyll-a (Chl-a) distribution in the water of the Zhoushan archipelago were analyzed based on data from the panchromatic multispectral sensor (PMS) of the GaoFen-6 (GF-6). A new Chl-a inversion model was built using in-situ Chl-a and the green-red bands of the 2 m spatial resolution GF-6/PMS image. Combined with fishery data, the relationship between Chl-a concentration and fish resources were revealed. The results show that: (1) High Chl-a concentration area was mainly concentrated in the nearshore intensive islands waters, and Chl-a concentration changes obviously with the change of tidal currents. Chl-a concentration around islands increases, especially downstream of islands. Seasonally, Chl-a concentration is higher in spring and summer, lower in autumn, and lowest in winter. (2) The change of fish eggs and larvae in the water of the Zhoushan archipelago shows consistency with the spatial distribution and seasonal variation of Chl-a. (3) The interaction between tidal currents and islands results in the diverse currents (upstream upwelling and downstream vortex currents) around the islands, promoting vertical water exchange and the uplifting of nutrients, resulting in a high overall Chl-a concentration in the waters around the islands. The diverse flow conditions, the ideal nutrient-rich environment, and the abundant phytoplankton attract a large number of fish to gather and breed in the waters around the islands. (4) Chl-a of intensive island waters is an essential indicator for fish spawning grounds.
Zhoushan fishing ground is located at the mouth of the Yangtze River and Hangzhou Bay. The superior geographical location and the unique ecological conditions of the Zhoushan fishing ground provide sufficient bait and living space for various marine organisms, forming the largest excellent fishing ground in China (Chang et al., 2012). The Zhoushan Archipelago is dotted with hundreds of islands, which becomes a good spawning and baiting ground for many kinds of economic fishes, as well as a necessary route for marine organisms to anadromous rivers and descend to the sea (Liang et al., 2020). Those superior geographical conditions for Zhoushan fishing ground support its fishery ecosystems as the ideal place of spawning and feeding for numerous fish species, and has been established as the most important fishing ground in China with the highest catching yield. However, the precise description of the environmental conditions for this place, especially the interrelationships between the spatial-temporal distribution of high-resolution chlorophyll-a (Chl-a) and fishery resources is lacking mostly owing to the highly intensive nearshore islands and high contents of suspended substances, namely, the muddy waters. Therefore, the improvement of remote sensing method is necessary for its application to characterize the above scientific question.
With the appearance of traditional satellite data and the increase in data sources, satellite remote sensing has become widely used for fishery analysis. Many environmental factors including sea surface temperature (SST) (Habibullah et al., 2020), Chl-a concentration (Paulino et al., 2016), primary productivity (Lee et al., 2015), ocean front boundaries (Xu et al., 2017), currents and water masses (Sun et al., 2013) and other marine environmental parameters (Kourti et al., 2001; Barbieri et al., 2004), can be obtained from satellite data. Based on these environmental factors, the distribution of fish stocks can be better grasped, and the prediction of the direction of fishery movement can be realized, which reduces the time for fishermen to find fishing grounds.
Chl-a is the main photosynthetic pigment of marine phytoplankton as well as an indicator of phytoplankton biomass, which can indicate the basic state of the aquatic food chain (Bierman et al., 2011). It is the basis of geochemical cycles in the world ocean and a basic indicator for estimating marine productivity, as well as a basic basis for judging the fertility of waters and evaluating the potential productivity of fisheries in waters (Bacher et al., 2003; Huot et al., 2007). In addition, the variation and distribution of Chl-a content are closely related to SST, nutrient salinity, currents, and upwelling (Richardson et al., 2005).
Based on satellite, many methods have been applied to detect Chl-a concentration in class II water. For example, in the study of Canadian nearshore waters using the Moderate Resolution Imaging Spectroradiometer (MODIS) sensor, it was found that the effect of turbid water on Chl-a concentration is based on a foundation that the influence of turbidity water on Chl-a estimation can be attenuated by modifying the absorption characteristics of Colored Dissolved Organic Matter (CDOM) in the GSM01 algorithm (Tilstone et al., 2011). Chl-a in nearshore waters of the Yangtze River estuary in China retrieved from Medium Resolution Imaging Spectrometer (MERIS) improved the estimation of Chl-a concentration in turbid water using the new indicator SCI algorithm. (Shen et al., 2010). Algorithms for Chl-a inversion in turbid nearshore waters were established using Sea-viewing Wide Field-of-view Sensor (SeaWiFS) data (Dall'Olmo et al., 2005) to convert blue-green reflectance ratios to near-infrared and red-light ratios. Landsat’s Thematic Mapper (TM) (Duan et al., 2007; Nazeer and Nichol, 2016), Enhanced Thematic Mapper Plus (ETM+) (Tebbs et al., 2013; Nazeer and Nichol, 2016), and Operational Land Imager (OLI) (Kim et al., 2016; Fu et al., 2018) sensors have also been applied to analyze Chl-a in class II water.
However, limited by the low resolution of these satellite data and the lack of nearshore data, the refined research on nearshore turbid waters and island-reef intensive fisheries are relatively lacking.
With the advantages of high spatial resolution, high spectral resolution and high temporal resolution, multiple data sources, and easy access, GF series satellites have become an effective supplement to remote sensing satellite data sources in the study of inland water environment and small-scale nearshore water quality monitoring (Cai et al., 2020; Zhai et al., 2021).
GaoFen-6 satellite (GF-6) is a low-orbiting optical remote sensing satellite that is equipped with a panchromatic and multispectral sensor (PMS) and a wide field-of-view (WFV) sensor. The PMS sensor has a high resolution of 2 m, which can be well applied to the observation of small-scale features (Wang et al., 2021).
Zhoushan archipelago fishing ground is characterized by thousands of intensive nearshore islands with small spatial scales (from several kilometers to several meters, or even sub-meter level) and complex shapes (Fu et al., 2019). However, the precise description of the environmental conditions for this place, especially the interrelationships between the spatial-temporal distribution of high-resolution Chl-a and fishery resources, is still lacking. We need to combine the perspectives of high spatial resolution (from meter level to sub-meter level) and high temporal resolution satellite observation to carry out research, and there is an urgent need to develop new algorithms for high-resolution Chl-a.
This paper developed a new Chl-a algorithm based on high resolution (2 m) GF-6/PMS data and analyzed the spatial variation of Chl-a in the water of the Zhoushan archipelago. Combined with the measured fishery data in 2014 and 2015 and many other data, we revealed the close correlation between Chl-a and the variation of fishery resources. This paper provides scientific support for the development of nearshore islands type of fisheries.
The Zhoushan archipelago (121°30′E-123°25′E, 29°32′N-31°04′N) is located in the shallow sea area of the continental shelf in the northwestern part of the East China Sea, with many offshore islands and a winding coastline. It is the largest archipelago in China with 4 696 islands, with a total area of 22 200 km2, including 20 800 km2 sea area and 1 440.2 land area. The Zhoushan fishing ground is located at the southern mouth of Hangzhou Bay, adjacent to the confluence of the Changjiang Diluted Water, the Qiantang River’s water, and the East China Sea, and is characterized by strong tides, which are controlled by semidiurnal tides (Chen et al., 1990).
The detailed information about the study area (121°48′E-123°00′E, 29°36′N-31°00′N) was shown in Figure 1.
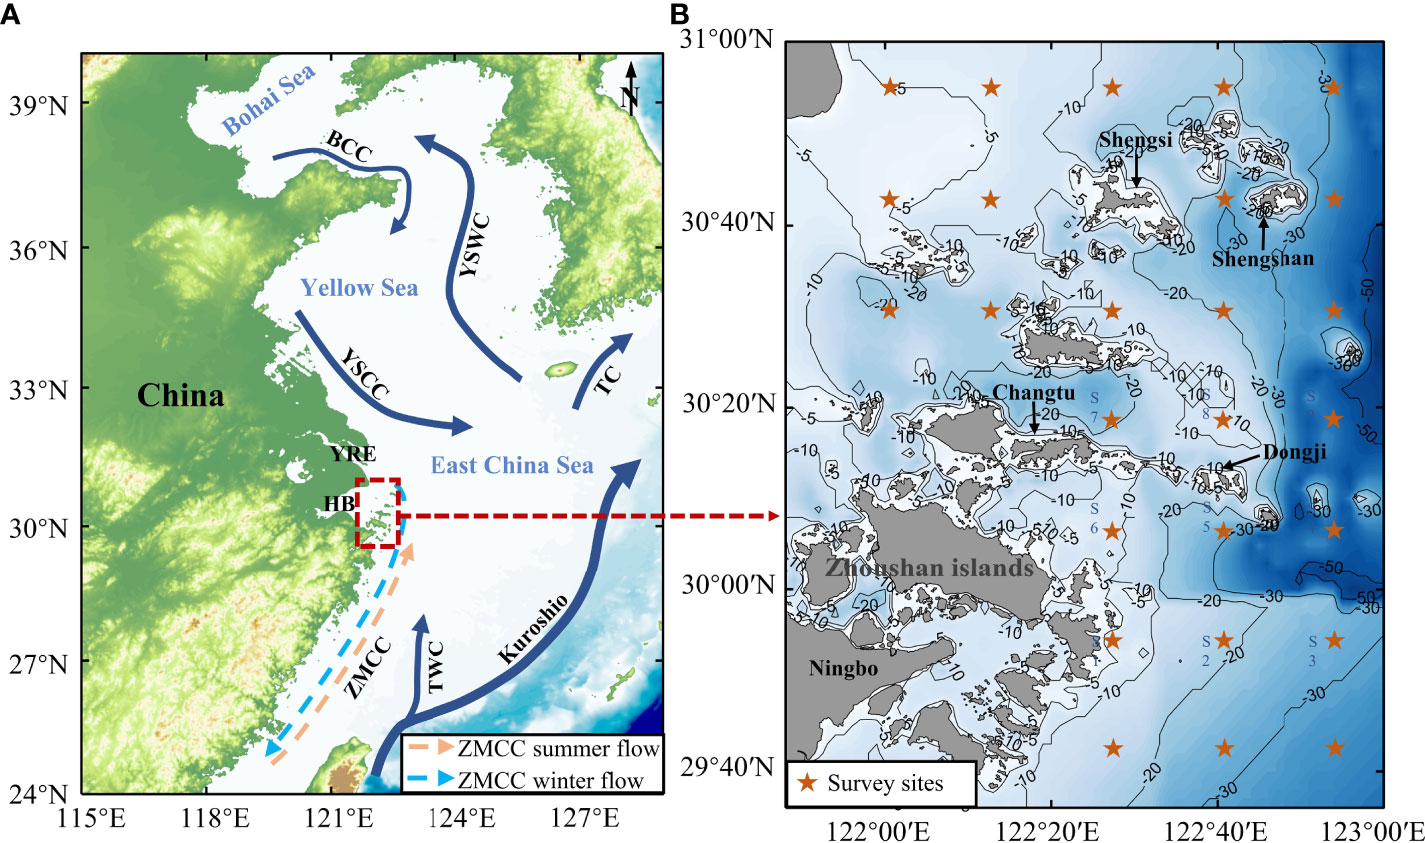
Figure 1 The study area. (A) The location of the Zhoushan archipelago. YRE: Yangtze River Estuary; HB: Hangzhou Bay; BCC: Bohai Coastal Current; YSWC: Yellow Sea Warm Current; YSCC: Yellow Sea Coastal Current; TC: Tsushima Warm Current; ZMCC: Zhemin Coastal Current; TWC: Taiwan Warm Current. (B) Enlarged view of the survey site and adjacent shelf waters in the Zhoushan archipelago during autumn 2020. Orange mark: observation stations.
The GF-6 satellite, launched on June 2, 2018, is a low-orbit optical remote sensing satellite and the first Chinese GaoFen satellite for agricultural observation. The satellite is loaded with a 2 m panchromatic band, 8 m multispectral high-resolution PMS sensor, and 16 m multispectral medium-resolution WFV sensor (Table 1). The PMS sensor carried by GF-6 has the widest observation width among satellites with 2 m resolution, up to 95 km. The satellite adds the “red edge” band and ultraviolet band to the WFV sensor, and the observation width reaches 800 km. This has played an important role in effectively reflecting the specific spectral characteristics of crops, natural resource investigation and monitoring, disaster prevention and mitigation (Deng et al., 2021; Xia et al., 2022). GF-6/PMS images of L1A from 2019 to 2021 used in this study are from the China Ocean Satellite Data Service (https://osdds.nsoas.org.cn/).
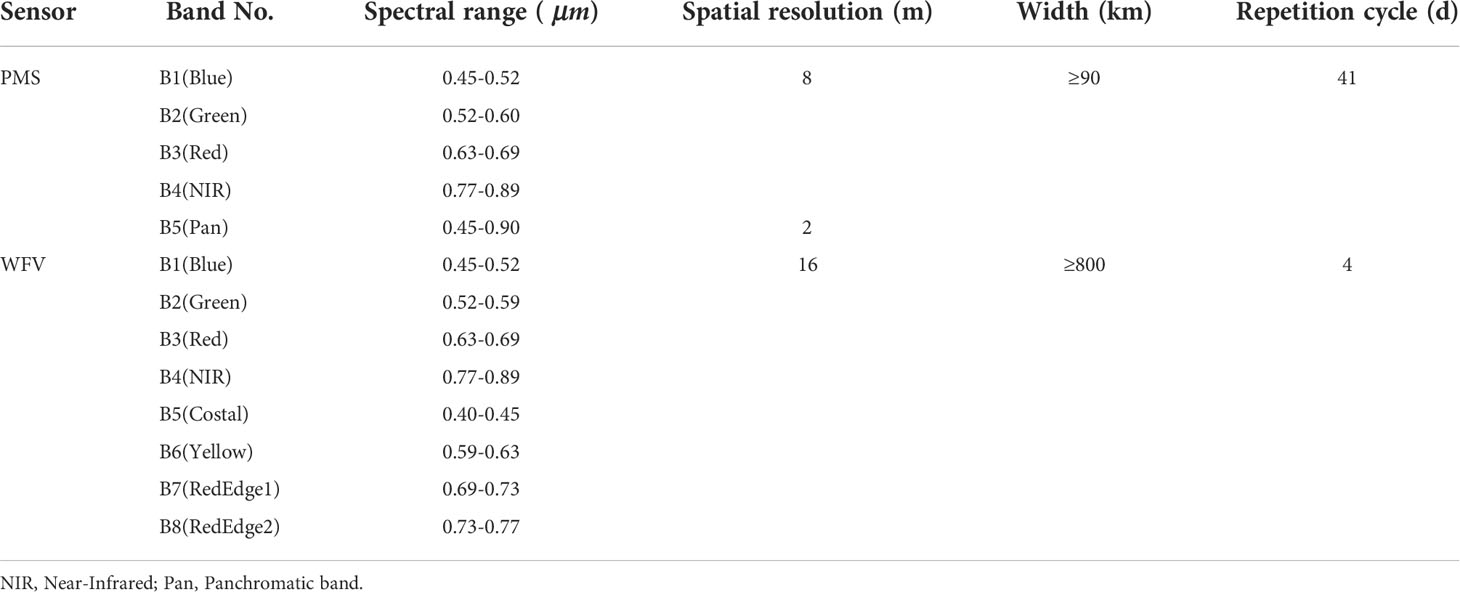
Table 1 Information of GF-6 PMS and WFV.
In addition, Landsat-8 satellite remote sensing images (http://www.gscloud.cn/) were applied as supplementary in this study. Landsat-8 contains both Operational Land Imager (OLI) and Thermal Infrared Sensor (TIRS) sensors with a replay period of 16 d. The OLI sensor includes 9 bands, with a spatial resolution of 30 m for B1-B7 and B9, and 15 m for B8 (Table 2). In this paper, the L1T-level product data of Landsat-8/OLI with geometric refinement correction taken in 2014 and 2015 in the Zhoushan Archipelago Sea area were selected.
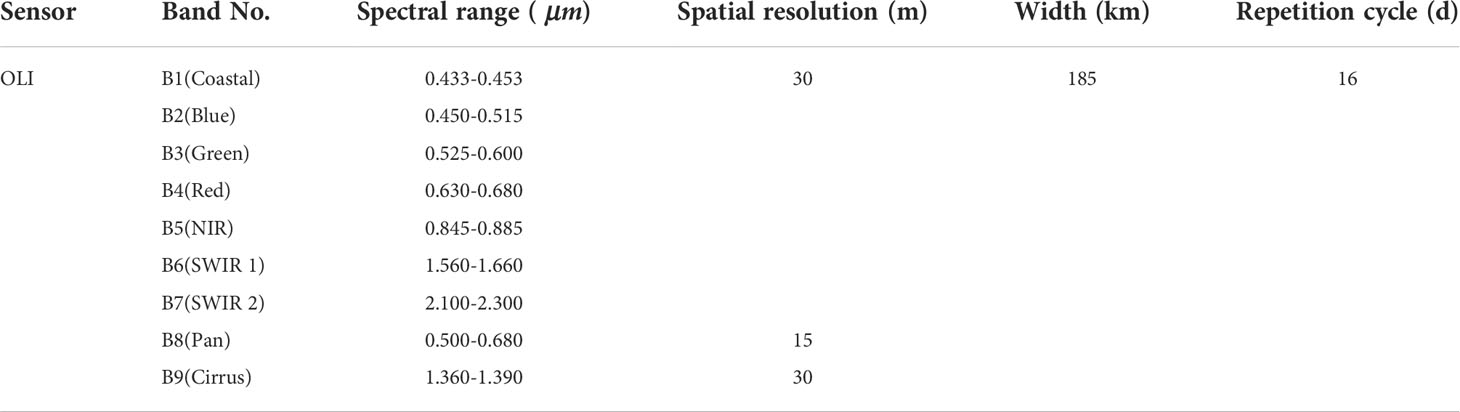
Table 2 Information of Landsat-8 OLI.
A comprehensive operational survey was conducted in the water of the Zhoushan archipelago from 24 to 31 October 2020. Totally, 148 valid Chl-a concentration field sampling observations were collected (Figure 1B). The samples were divided randomly into two groups, including the modeling group and testing group, with samples of 88 and 60, respectively.
The Chl-a concentration was measured spectrophotometrically (Jeffrey and Humphrey, 1975) in this study using 90% acetone (Ritchie, 2018) as the solvent. The specific procedure of the measurement is as follows. Water samples were taken from the surface layer at a depth of 5 m, with a filtered volume of 500 ml of seawater. The water samples were filtered and cryopreserved. The filter membrane containing the Chl-a sample was folded in half into a centrifuge tube, and extracted Chl-a with a 90% acetone solution for 16-24 h at low temperature, protecting from light. After the extraction, Chl-a standard solution was measured using the TU1810D UV-V spectrophotometer. Meanwhile, its absorbance values at 750 nm, 664 nm, 647 nm, and 630 nm were obtained. The absorbance of the sample was corrected by using 90% acetone as a blank absorbance measurement. Chl-a concentration of the extract was obtained using Eq. (1).
Where P1 is the mass concentration of Chl-a in the extract; A1 is the absorbance of the extract at wavelength i nm.
Subsequently, Chl-a concentration in the water samples were calculated using Eq. (2).
Where P is the mass concentration of Chl-a in the water sample; P1 is the mass Chl-a concentration in the extraction solution; V is the volume of the water sample; V1 is the constant volume of the extraction solution; δ is the optical range of the cuvette.
Eq. (1) and (2) refer to the determination criteria in Water Quality - Determination of Chlorophyll a - Spectrophotometric Method (HJ897-2017) (https://www.mee.gov.cn/ywgz/fgbz/bz/bzwb/jcffbz/201712/t20171227_428728.shtml).
The measured data on the total number of fish eggs and larvae in the water of the Zhoushan archipelago was obtained from the fishery resources and ecological environment surveys conducted by the Zhejiang Institute of Marine Fisheries on 11 cruises in 2013, 2014, and 2015 on the nearshore waters of northern Zhejiang. Based on actual fishery measurements of the total number of fish eggs and larvae in March, May, July, November 2014, April, and August 2015, the corresponding spatial and temporal distribution of fish eggs and larvae was analyzed in this study. The distribution of the spawning and baiting grounds of silver pomfret, Japanese anchovy, croaker, and cuttlefish, in the Zhoushan fishing ground, was obtained from the data of the distribution of the three grounds and one channel of the main economic species in the East China Sea area (Zhou and Li, 2018).
In this paper, GF-6/PMS satellite data (2019-2021) and Landsat-8/OLI satellite data (2014-2015) were selected to analyze the seasonal change of Chl-a concentration in the waters of Zhoushan archipelago and the Chl-a change details near islands. Fishery data (2014-2015) was analyzed to reveal the general distribution of fish eggs and larvae in the waters of the Zhoushan archipelago. The MUR-SST (°C) data, SSS (‰) data, Wind data, Ocean current (m/s) data, and Topography (m) data (Table 3) are applied to show the background information of the study area, including the hydrological environment, topography, and hydrodynamic conditions. All these data and methods combined together to reveal the relationship between fishery resources and the environmental factors Chl-a concentration, for example). Meanwhile, these materials and methods can also help us analyze the reasons contributing to the change of Chl-a and fishery resources.
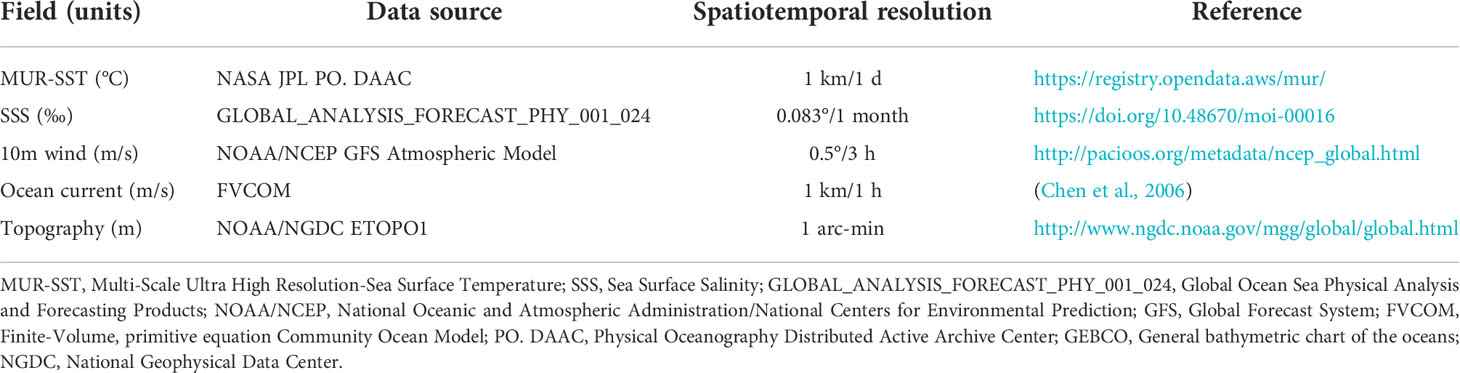
Table 3 Data sources and related information.
The sources of oceanic and atmospheric data and relevant information were shown in Table 3.
The preprocessing of 18 GF-6/PMS multispectral images, including radiometric calibration, atmospheric correction, orthorectification, image fusion, and water extraction, was performed with ENVI 5.3 to improve image quality and usability (Pan et al., 2021).
The radiometric calibration uses the GF-6/PMS image calibration coefficients (Table 4) provided by the China Resources Satellite Application Center (http://www.cresda.com) to convert the Digital Number (DN) recorded in the original settings of the image into reflectance information of the outer surface of the atmosphere (Yang et al., 2020). The calibration equation uses Eq. (3).
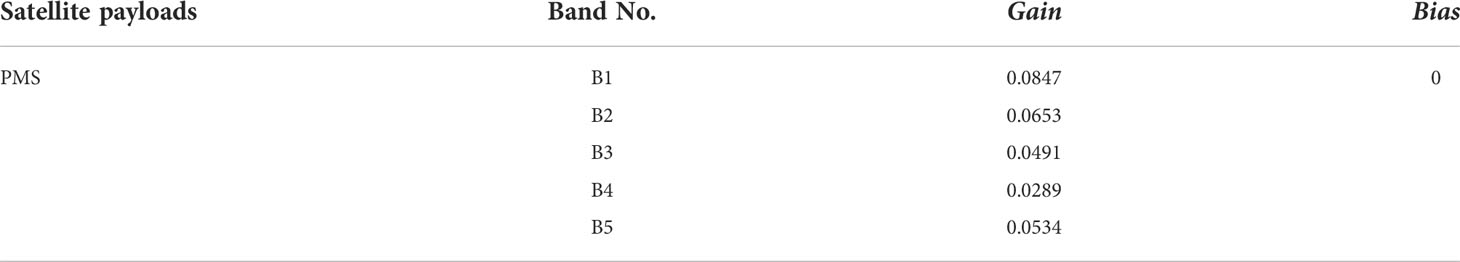
Table 4 GF-6 PMS calibration parameters in 2019.
Where Lλ is the spectral radiation at the sensor entrance pupil, Gain is the gain value, Bias is the offset value, and DN is the Digital Number.
The Fast Line-of-Sight Atmospheric Analysis of Spectral Hypercubes (FLAASH) module was used in this study to perform atmospheric correction of the calibrated Top of Atmosphere reflectance to eliminate the errors caused by the atmosphere during its scattering, absorption, and reflection (Perkins et al., 2005).
The orthorectification correction eliminates the effects of terrain and distortions caused by camera orientation. The study used the Rational Polynomial Coefficients (RPC) geometry correction module to orthorectify the panchromatic and multispectral images of GF-6/PMS using GMTED2010 (The Global Multi-resolution Terrain Elevation Data 2010) data as a reference (Gianinetto and Scaioni, 2008).
Image fusion was performed using the Nearest Neighbor Diffusion (NNDiffuse) Pan Sharpening fusion algorithm, which resulted in good retention of image color, texture features, and spectral information. The fused images have a resolution of 2 m to facilitate subsequent image analysis studies (Wang et al., 2021).
In order to eliminate the influence of land on water information in the image, according to the characteristics of the vast difference between ocean and land reflection spectra, the Normalized Difference Water Index (NDWI) was calculated using the B4 and B2 of GF-6/PMS. The threshold of NDWI was set to achieve water extraction in the nearshore water (Jawak and Luis, 2015).
Significant differences exist in shape and spectral range of the spectral response function curves for each band of GF-6/PMS and Landsat8/OLI. In addition, GF-6/PMS and Landsat-8/OLI differ in altitude, orbit, inclination, and spatial resolution. These factors can have an impact on the observation value of each sensor.
GF-6/PMS data were not available for the period from 2014 to 2015, as a supplement, Landsat-8/OLI images were utilized, and Chl-a was analyzed using the model from previous studies (Huang et al., 2016). The formula is as follows:
Where ρ is Chl-a concentration, and B4 is red band reflectance in Landsat-8 image.
Based on fitted GF-6/PMS spectral data of each channel and the measured Chl-a concentration data, Chl-a inversion models were constructed using the waveband combination, and the best applicable model was applied to inverse Chl-a using the GF-6/PMS remote sensing images.
In order to ensure the reliability of the model, we establish the inversion model using as much data as possible. Therefore, the amount of data is critical, and more data were applied to build the model. As for the percentage, it doesn’t matter how big or how little the percentage is, as long as we can ensure the amount of data for modeling and validation. In prior studies, 20-80 in-situ data were also used to build and to verify a model (Nazeer and Nichol, 2016; Cai et al., 2020).
From 148 measured data samples, we selected 88 for inversion model construction and 60 for model validation.
The spectral features of chlorophyll are the main basis for Chl-a concentration information extraction (Lin et al., 2016). Therefore, the concentration of Chl-a can be estimated based on the different wavelength reflectance. The sensitivity between Chl-a concentration and reflectance in the B1-B4 band of GF-6/PMS images was analyzed. The model accuracy was assessed using the root mean square error (RMSE) (Eq. (5)).
Where Chl-aiestimated is the model estimate value, Chl-aimeasured is the field measurement value, and n is the number of sample points.
The correlation between the B1, B2, and Ln (Chl-a) (natural logarithm of Chl-a) was low and negative, with the coefficient of determination of 0.3786 and 0.4860, respectively (Figures 2A, B). The B3 and B4 were positively correlated with Ln (Chl-a) with R2 of 0.6356 and 0.8172 (Figures 2C, D), indicating that the B4 (NIR) was the most sensitive to Chl-a concentration.
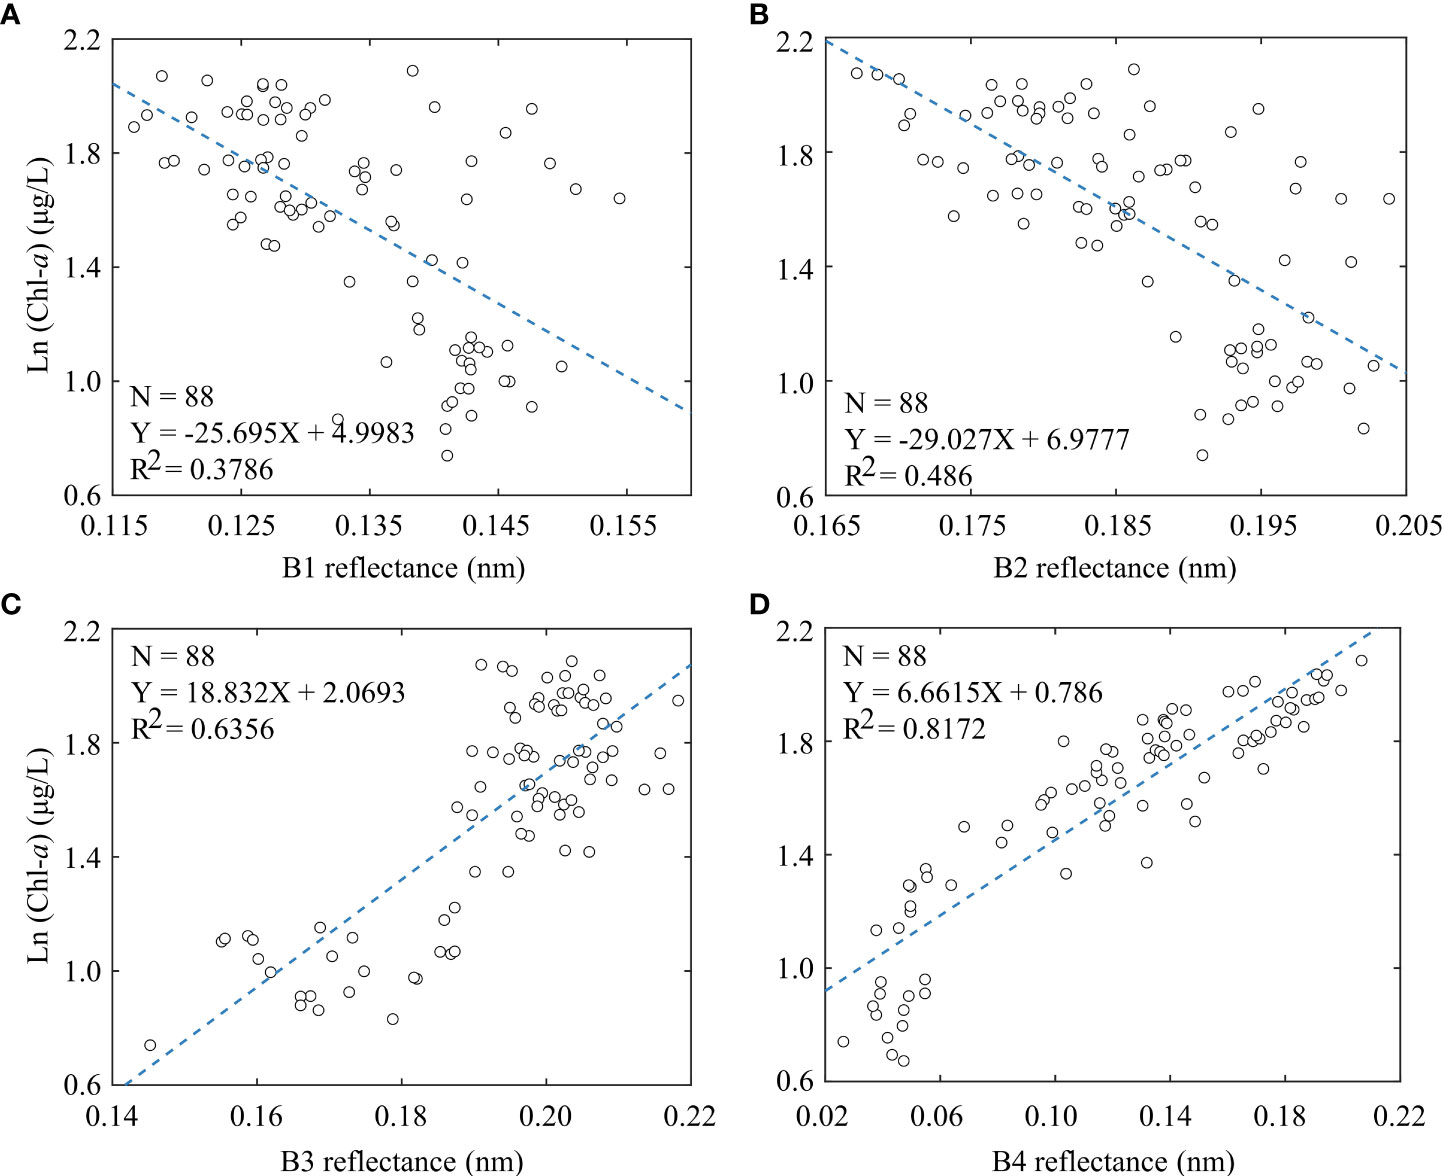
Figure 2 Correlation between the band value retrieved from PMS image after atmosphere correction and sampled Chl-a. (A–D): The linear relationship between the reflectance of band 1, 2, 3, 4 and Chl-a concentration. The abscissa is the reflectance of a single band, and the ordinate is the natural logarithm of Chl-a [Ln (Chl-a)].
Suspended Sediment Concentration (SSC) in the Zhoushan Archipelago Sea area is generally at a high level, up to 1.103 g/L, mainly distributed west of 122.3°E (Cai et al., 2020). In order to reduce the interference of SSC on the spectral characteristics of the Chl-a inversion process and effectively extract the concentration information of Chl-a, B4 (NIR) is not considered in this band combination modelling process.
Some Chl-a inverse models were obtained by combining different bands in prior studies using low spatial resolution satellite data (Le et al., 2009; Moses et al., 2009). Moreover, the combination of multiple bands can effectively eliminate the influence of water bodies and related environmental changes to a certain extent (Chen et al., 2013). This study tried to combine B1, B2, and B3 to establish the Chl-a inverse algorithm. Totally 63 multi-band combinations were listed, from which 26 band combinations with a high correlation with Chl-a concentration (R2 > 0.45) were selected for analysis (Table 5).
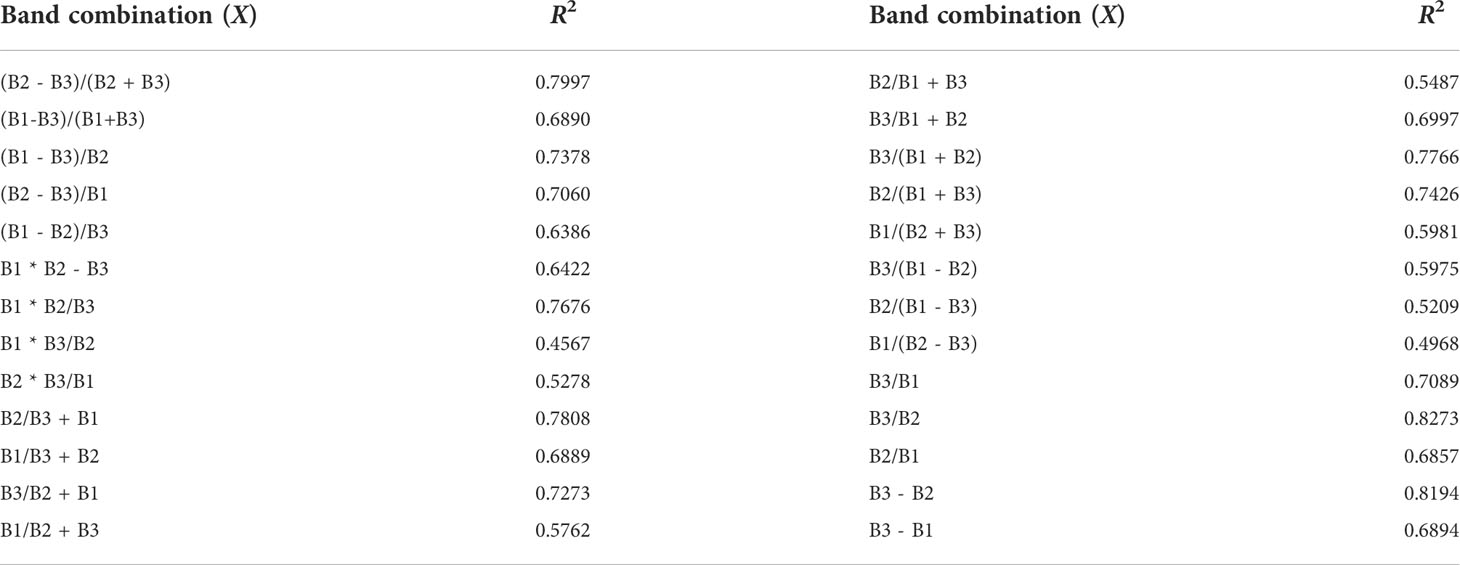
Table 5 Band combination.
Six multispectral band combination models (B2 - B3)/(B2 + B3), B1 * B2/B3, B2/B3 + B1, B3/(B1 + B2), B3/B2 and B3 - B2 with R2 > 0.75 are selected from Table 5 for regression analysis and interpretation.
Using linear, power, and exponential functions as fitting functions (Le et al., 2013; Cai et al., 2020), the model expressions between each band combination and the measured Chl-a concentration data were constructed, and a total of 20 models were analyzed (Table 6).
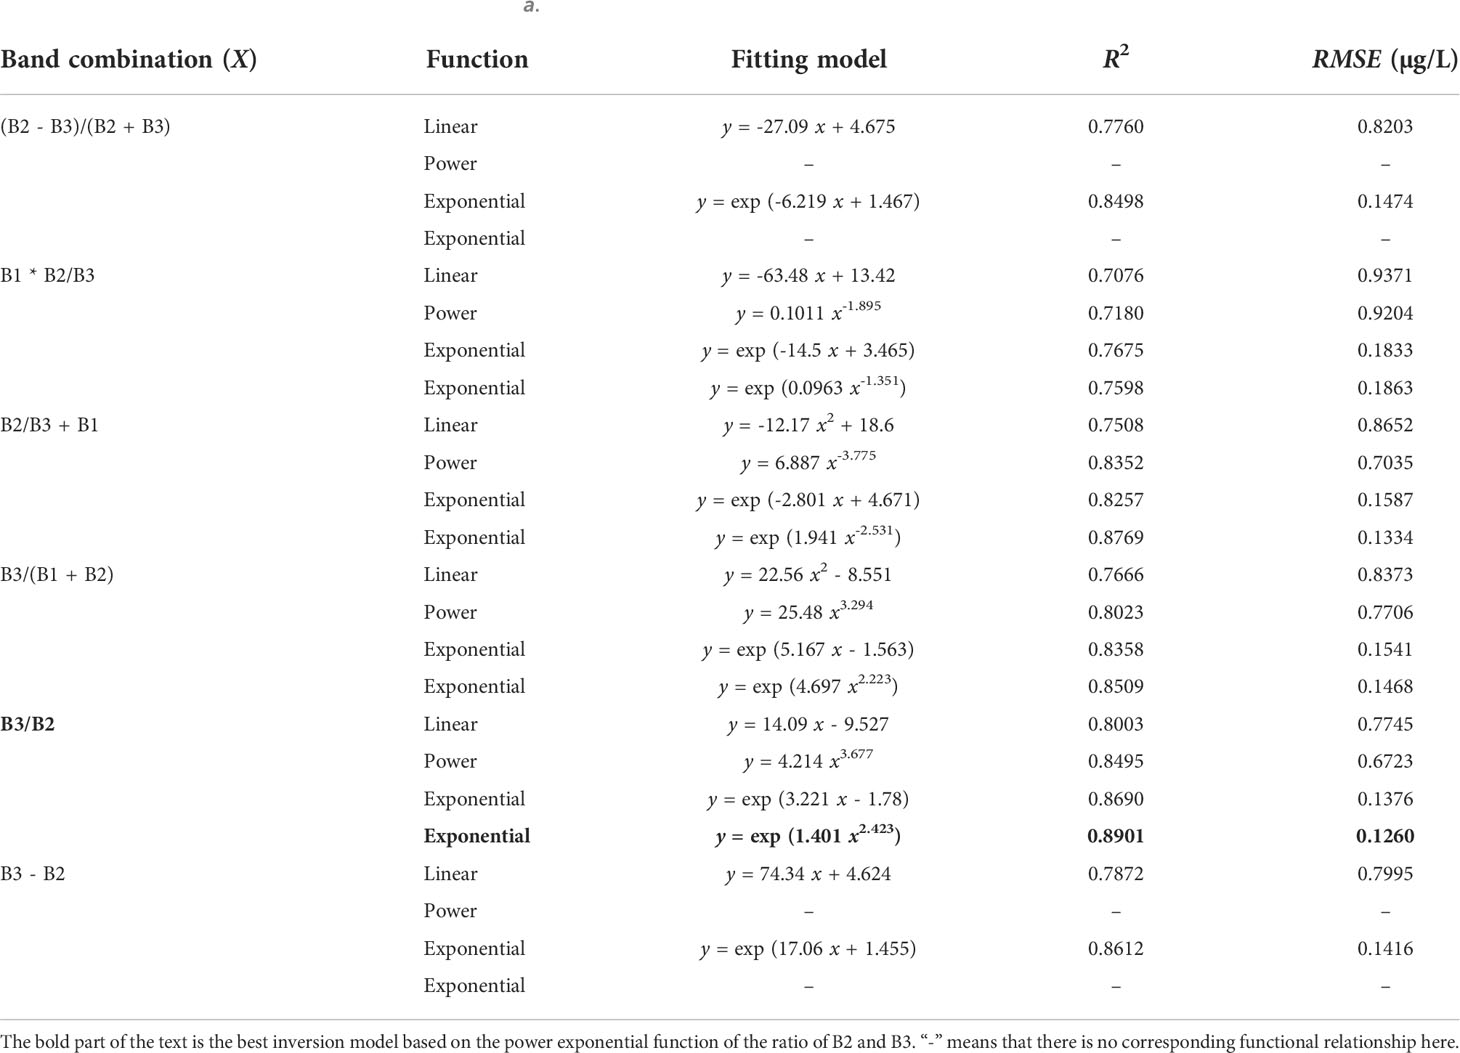
Table 6 Band combination inversion model of Chl-a.
The correlation analysis in Table 6, shows that the model established by the power exponential function of the ratio of B2 and B3 provides the best accuracy (R2 = 0.8901, RMSE = 0.1260 µg/L). Therefore, this model (named PMS-Chla) (Eq. (6) and Eq. (7)) is suitable for retrieving Chl-a concentration in the nearshore waters of the Zhoushan archipelago using GF-6/PMS data.
X=Rrs(B3)/Rrs (B2) (6)
here ρ is the Chl-a concentration in µg/L, Rrs(B2) and Rrs(B3) are the reflectance of PMS data in green and red bands, respectively.
Comparing the modelled data and in-situ value (Zawadzki and Kedzior, 2016) is necessary. The modelled Chl-a in Figures 3A, B were acquired simultaneously with the in-situ data. The results show that the new model (PMS-Chla) based on GF-6/PMS data can be used to invert the Chl-a concentration in the waters of the Zhoushan area with R2 of 0.9065 and RMSE of 0.5377 µg/L (Figure 3A). The model Chl-a values based on the Landsat8/OLI model and the in-situ Chl-a values showed good validation results with R2 of 0.8338 and RMSE of 0.6284 µg/L (Figure 3B).
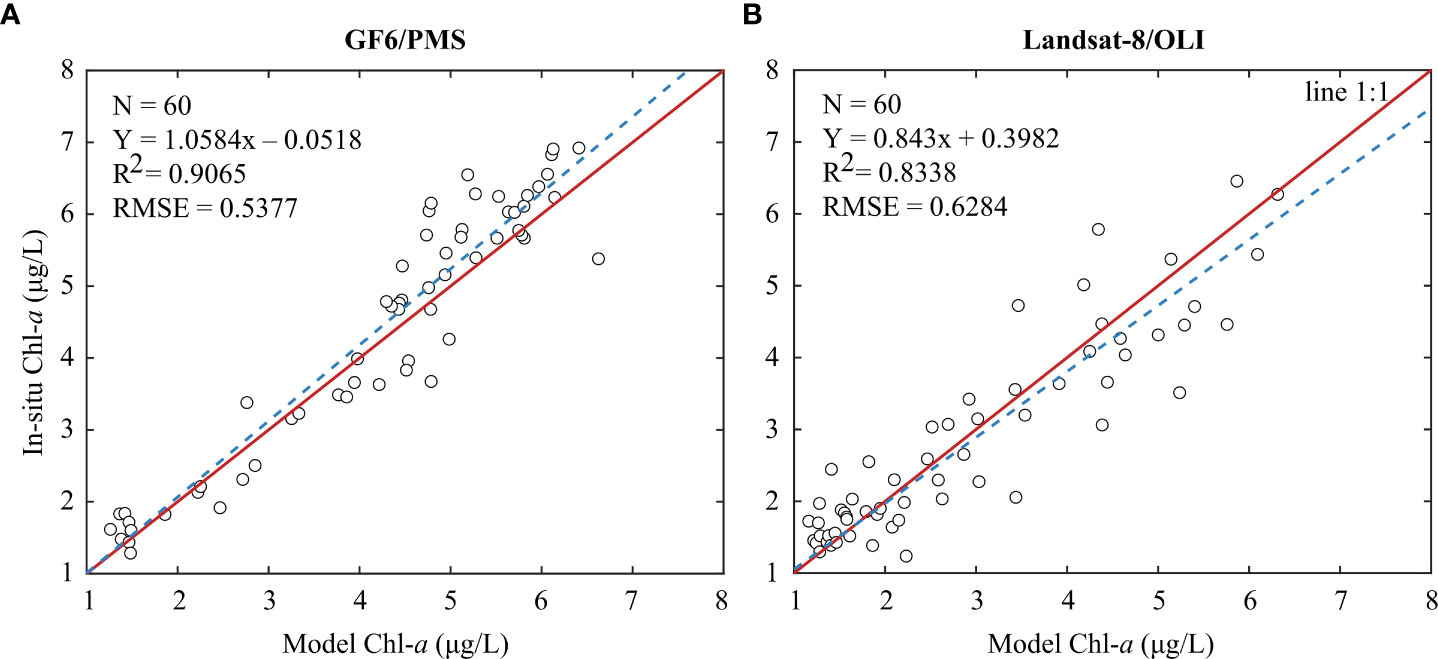
Figure 3 Correlation analysis between model and in-situ Chl-a values. (A) Comparison of Chl-a value of GF-6/PMS model with in-situ Chl-a value; (B) Comparison of Chl-a value of Landsat8/OLI model with in-situ Chl-a value. The x coordinate is the reference value, the y coordinate is the in-situ value, and the unit is µg/L.
Chl-a distribution details in the Zhoushan archipelago area from 2019 to 2021 were analyzed based on the newly built model (PMS-Chla). Meanwhile, as a supplement, Landsat-8/OLI images from 2014 to 2015 were utilized, and Chl-a was analyzed using the model from previous studies (Huang et al., 2016). The Chl-a inversion results of both models were in good agreement with the in-situ Chl-a concentrations in the study area (Figure 3), with R2 of 0.9065 and 0.8338, and RMSE of 0.5377 µg/L and 0.6284 µg/L, respectively. Although both models can better reflect the overall distribution of Chl-a in the Zhoushan archipelago area, the 2 m resolved GF-6/PMS data can observe more detailed changes in Chl-a. Therefore, they can be combined together to study the distribution trend of Chl-a in the islands area.
Chl-a concentration in the nearshore waters of the Zhoushan archipelago is mainly in the range of 1-7 μg/L (Figure 4). Chl-a concentration in the west of 122°20′E (region I in Figures 4K, N, O) near the coastal islands is higher with the Chl-a value of 3.5-7 μg/L, mainly distributes in the Zhoushan archipelago area and the nearshore of Ningbo. Chl-a concentration in the waters within the longitude range of 122°20′E-122°40′E (region II in Figures 4K, N, O) is lower than in the west and the east area. Chl-a concentration in the waters within the longitude range of 122°40′E-123°00′E (region III in Figures 4K, N, O) increased compared to Region II.
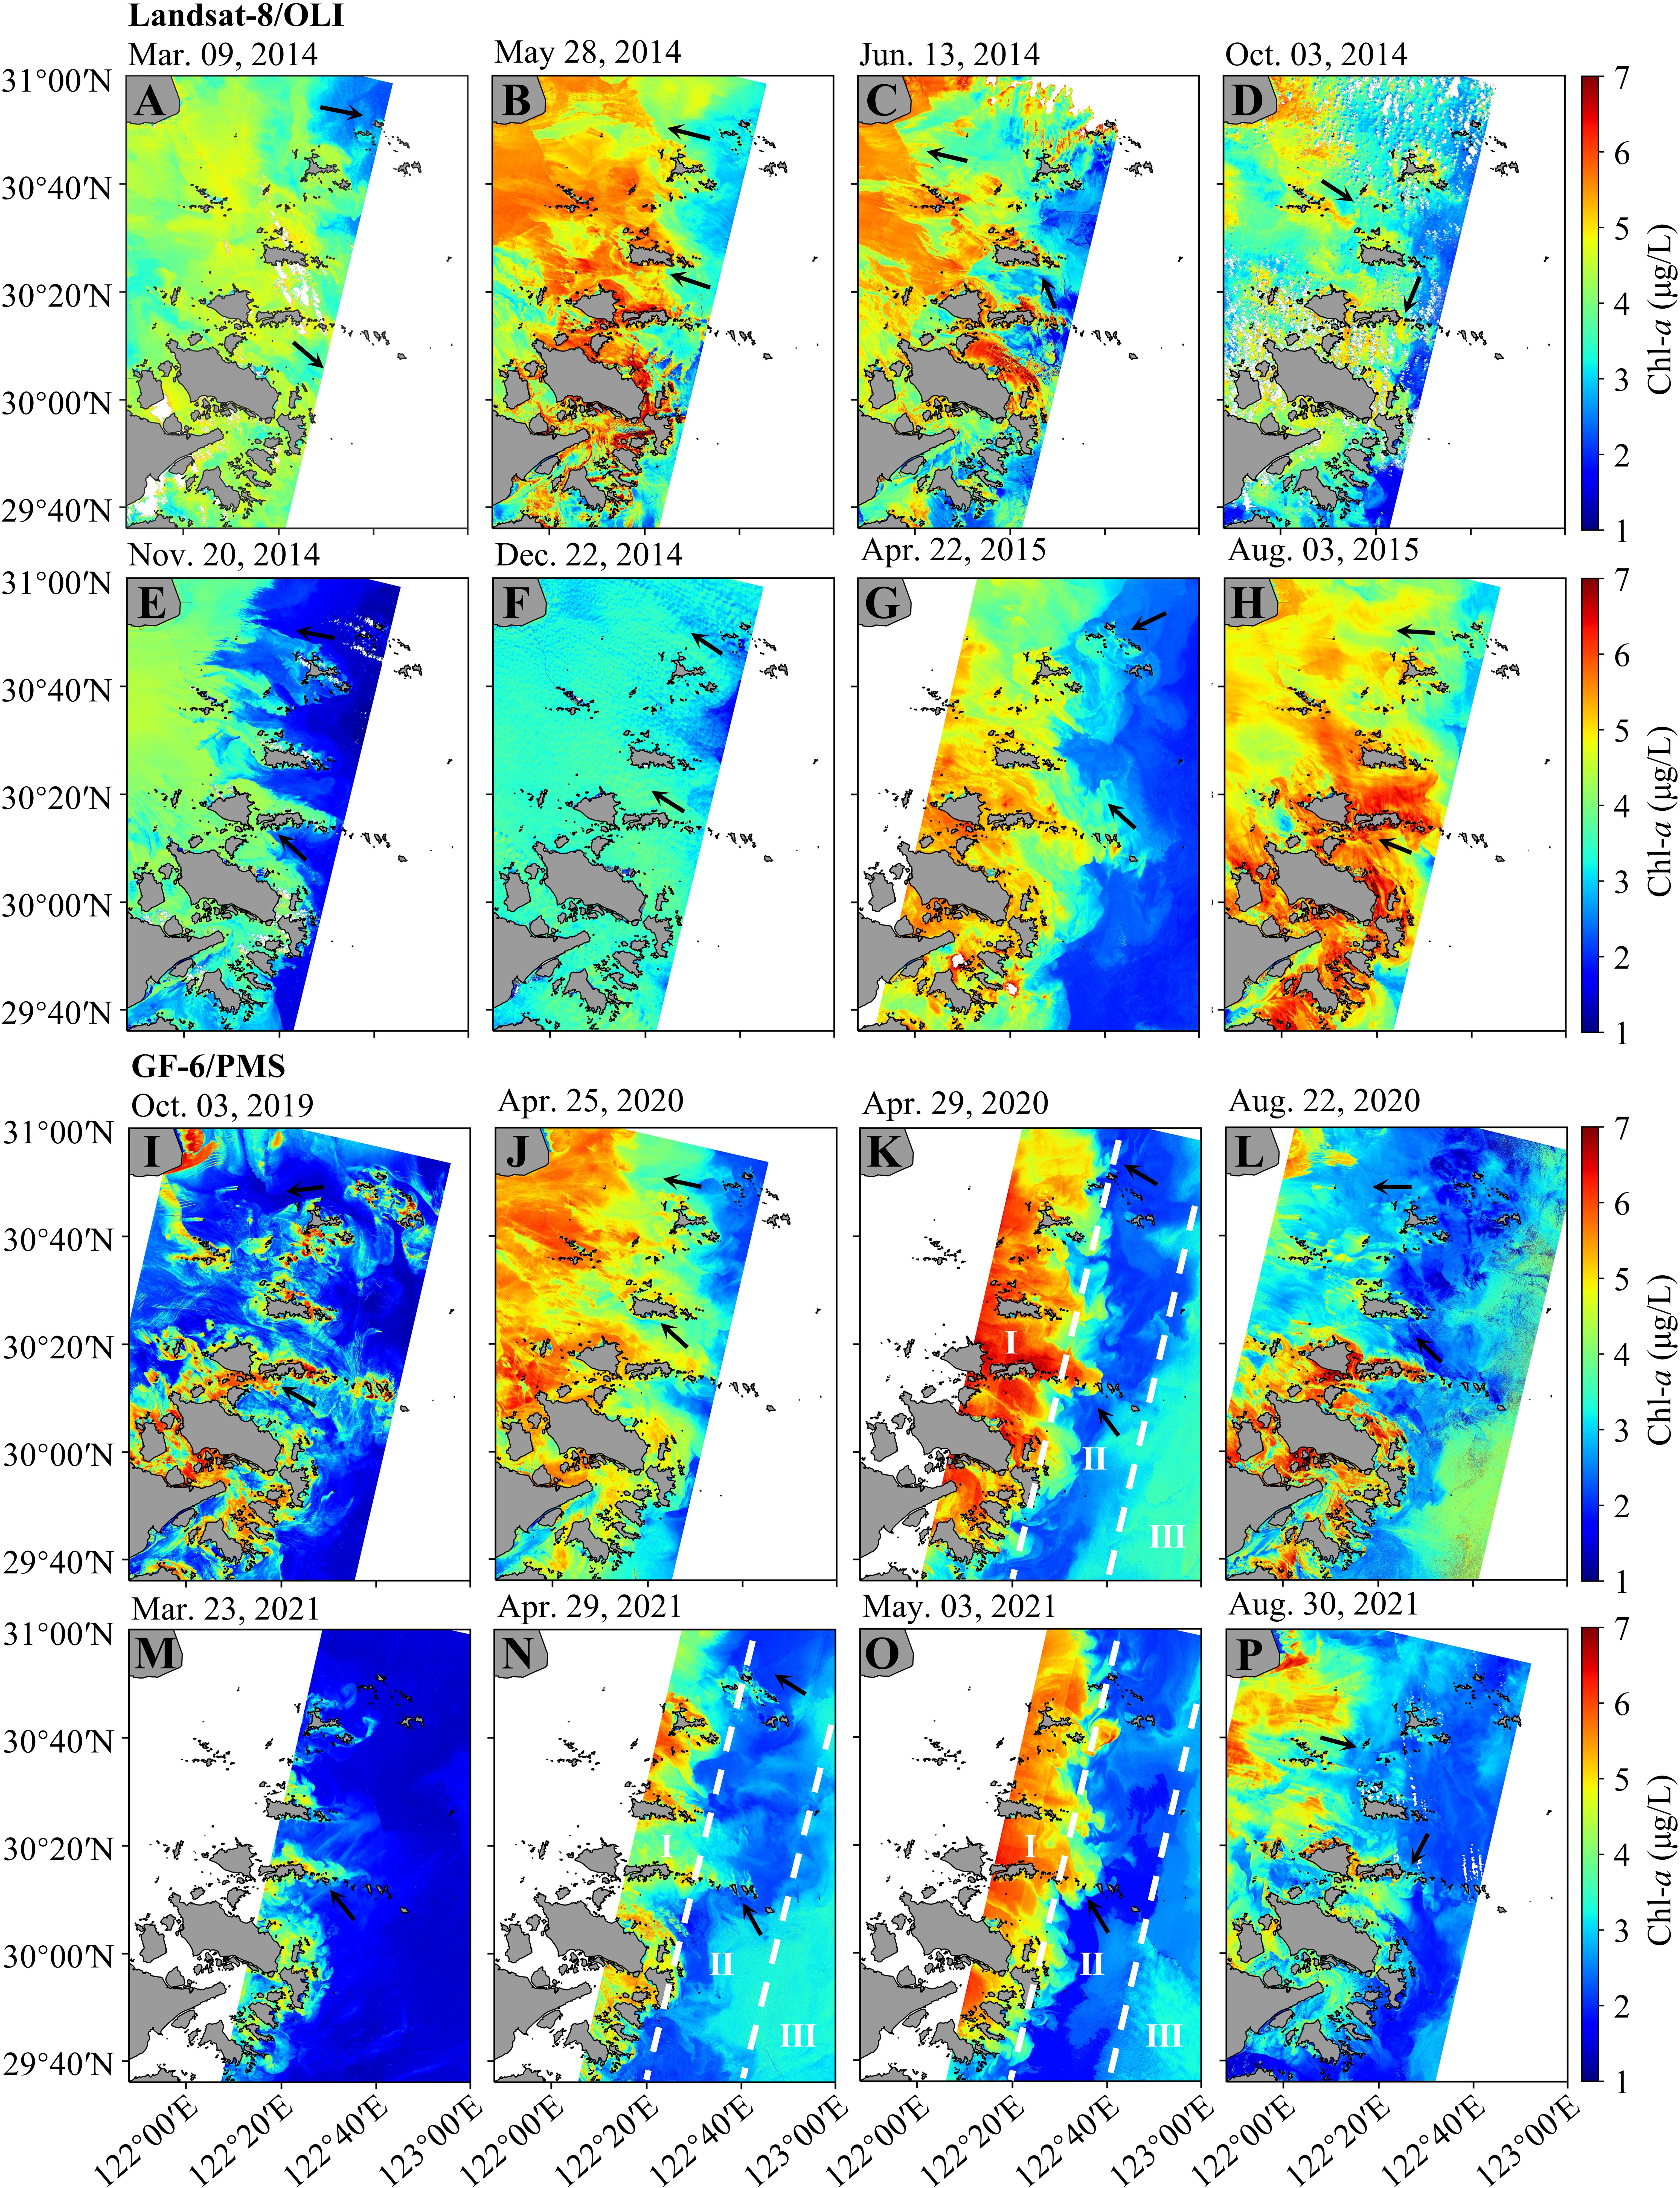
Figure 4 Distribution of Chl-a concentration in Zhoushan archipelago. (A-H) Chl-a obtained from Landsat-8/OLI; (I-P) Chl-a obtained from GF-6/PMS. Black arrow: the direction of the local current. Three regions I (the west of 122°30′E), II (122°30′E-122°50′E), and III (122°50′E-123°E) are delineated in (K, N, O).
Chl-a concentration changes with the change of tidal current. When the ocean current passes through islands, regardless of flooding or ebbing, Chl-a concentration downstream is generally higher than that upstream (Figure 4).
Chl-a concentration in the nearshore waters of the Zhoushan archipelago varies with season. Chl-a concentration is higher in spring (April and May) (Figures 4B, G, J, K, N, O) and summer (June and August) (Figures 4C, H, L, P), with the Chl-a value in the range of 2-7 μg/L. It is lower in autumn (October and November) (Figures 4D, E, I) and early spring (March) (Figures 4A, M), with the Chl-a value in the range of 1-5.5 μg/L; and the lowest Chl-a concentration in winter (Figure 4F), with the Chl-a value of 2-4 μg/L.
The detailed variation of Chl-a in the waters around islands retrieved from the high spatial resolution (2 m) GF-6/PMS images was observed. The four areas of Qushan Islands (Figure 5A), Chuanhu archipelago (Figure 5B), Xizhai and Dongzhai Islands (Figure 5C), and Shengsi archipelago (Figure 5D) were analyzed as examples.
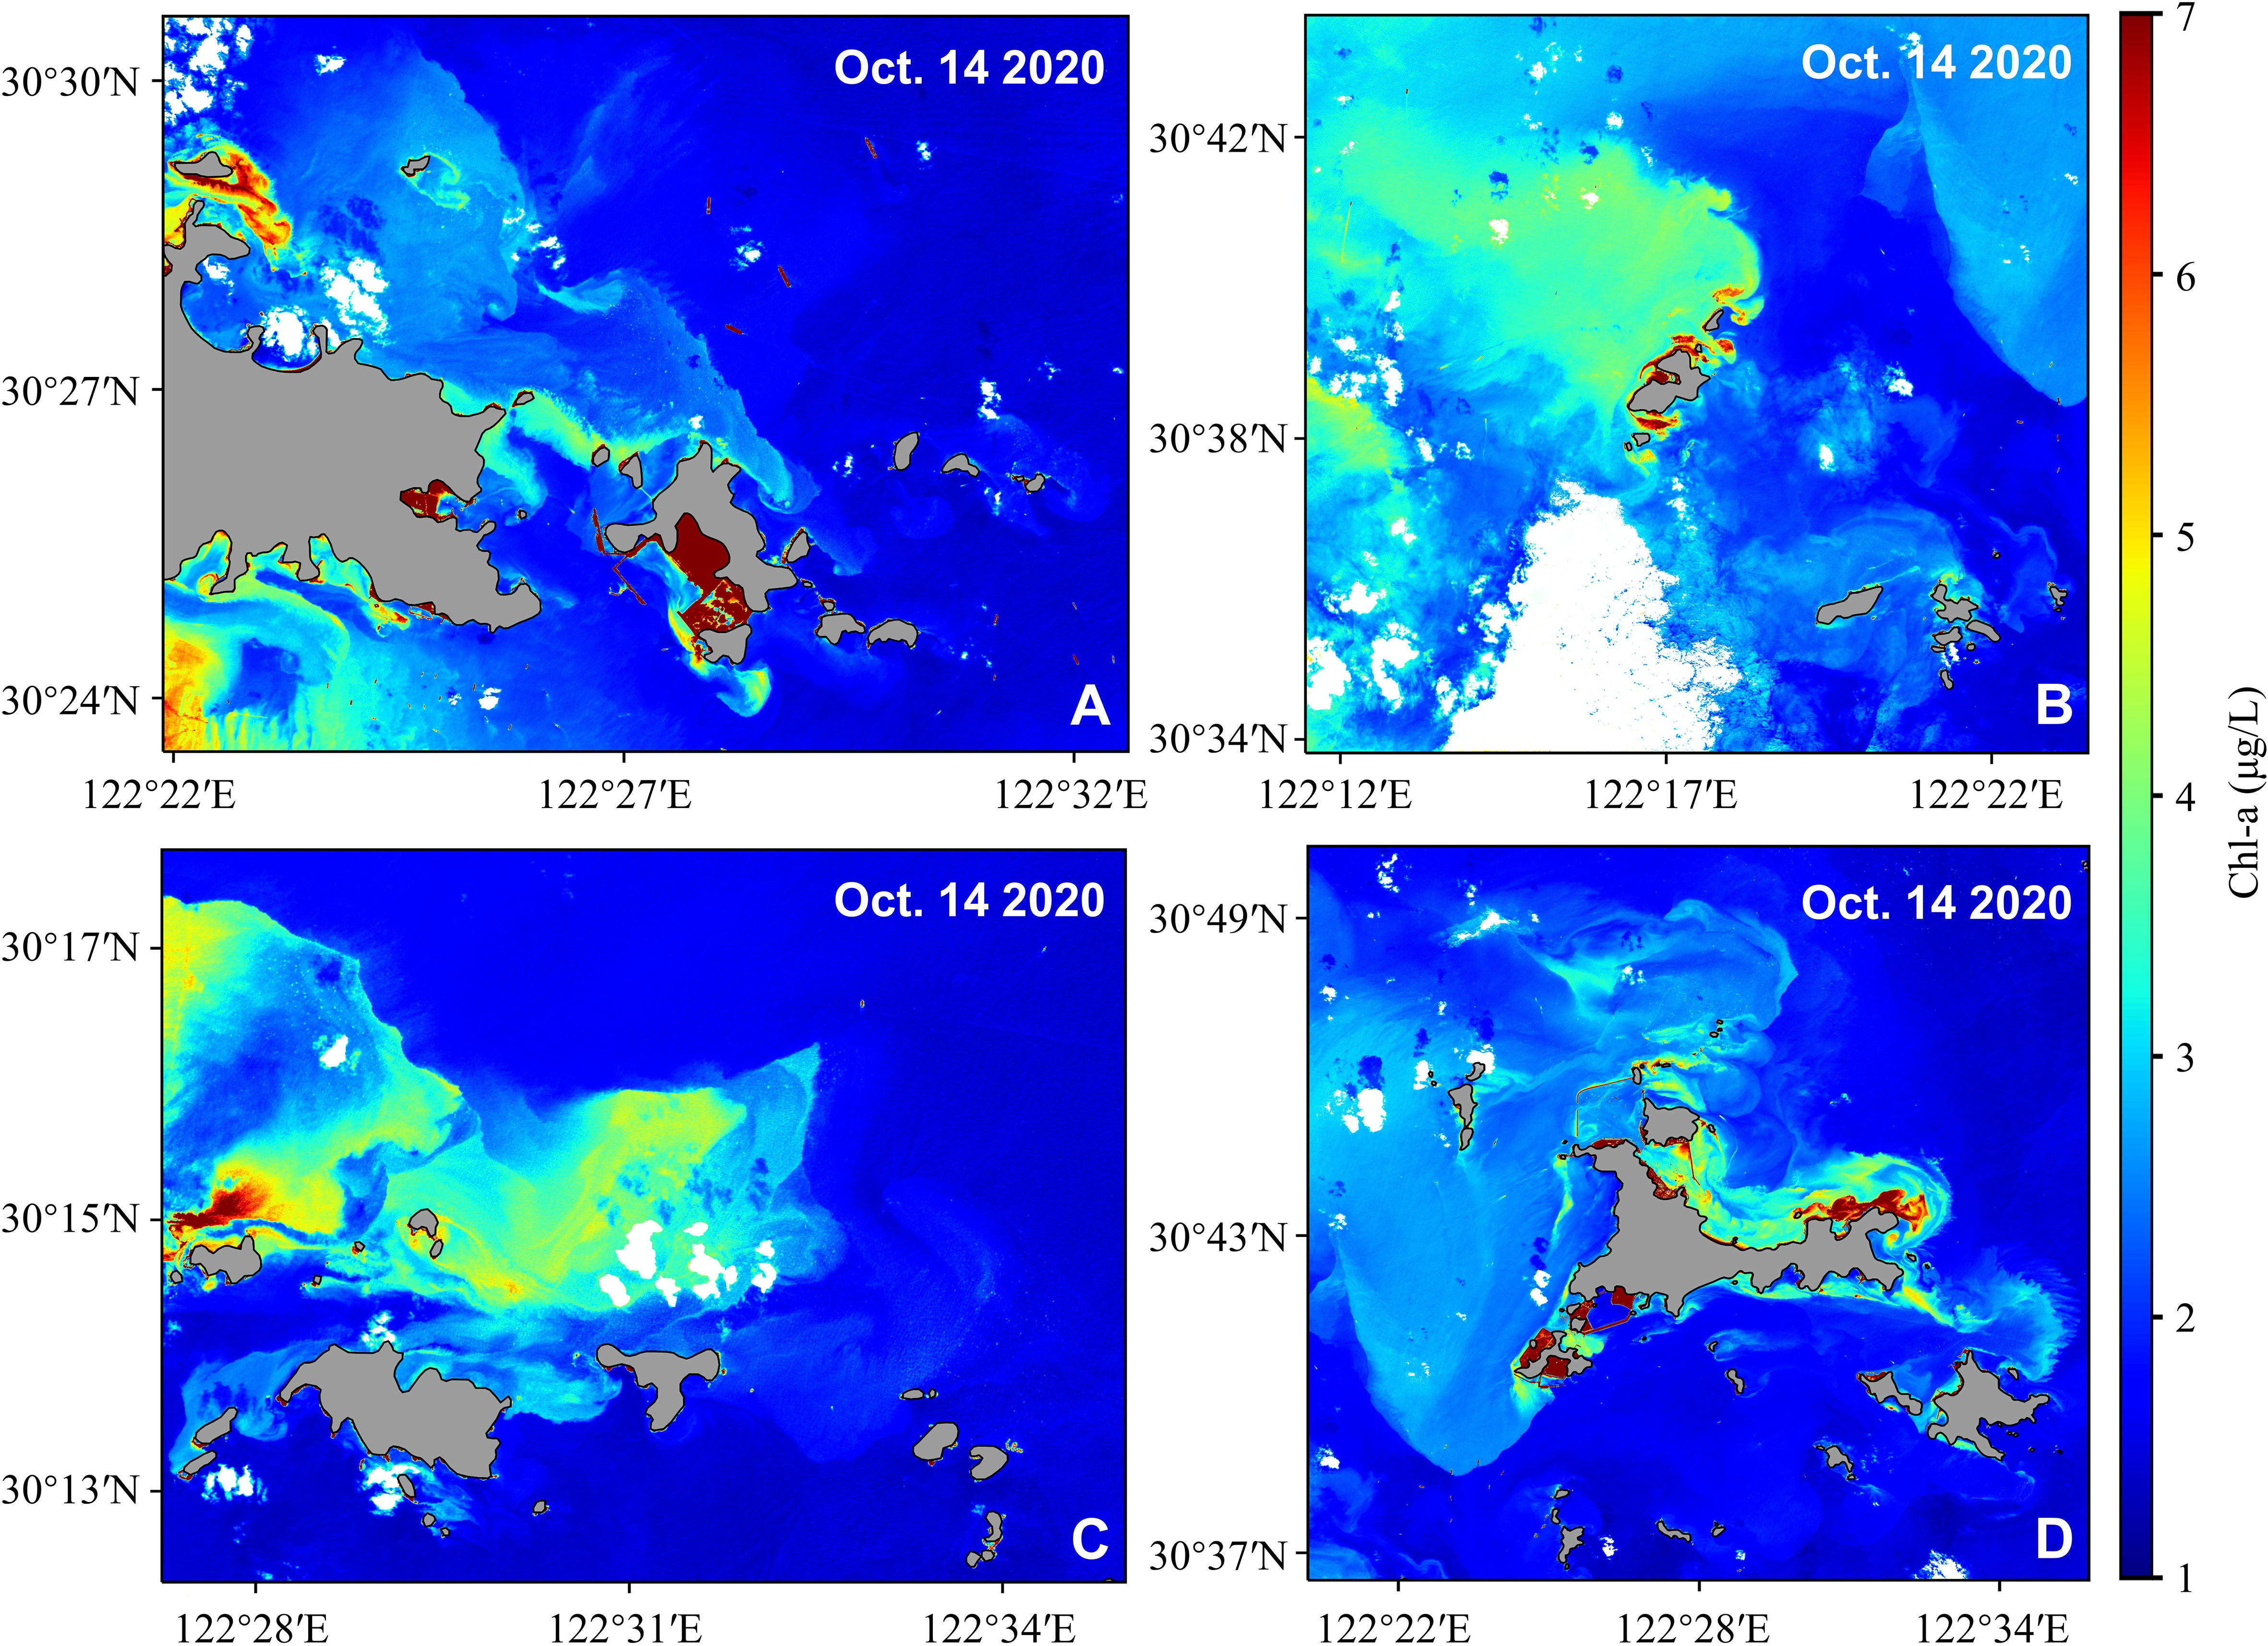
Figure 5 Chl-a concentration distribution details around the water of Zhoushan archipelago. Chl-a distribution in the figure is taken from the GF-6/PMS image on 14 October 2020 and the Chl-a concentration retrieved based on the new model of PMS-Chla. (A) The Qushan Islands; (B) the Chuanhu archipelago; (C) the Xizhai and Dongzhai Islands; (D) the Shengsi archipelago.
Chl-a concentration in the waters around the islands was higher than in the waters farther away (Figure 5), which is in good agreement with previous studies (Zhu et al., 2014; Fu et al., 2019). The high Chl-a concentration area is mainly distributed downstream of the islands (Figures 5A–C). Downstream of the islands, there exists a wake of high Chl-a concentration, which is consistent with the direction of the current, and Chl-a concentration decreases with increasing distance away from the island. In addition, Chl-a concentration along the track of the vortex downstream is also higher than that in the surrounding waters (Figure 6).
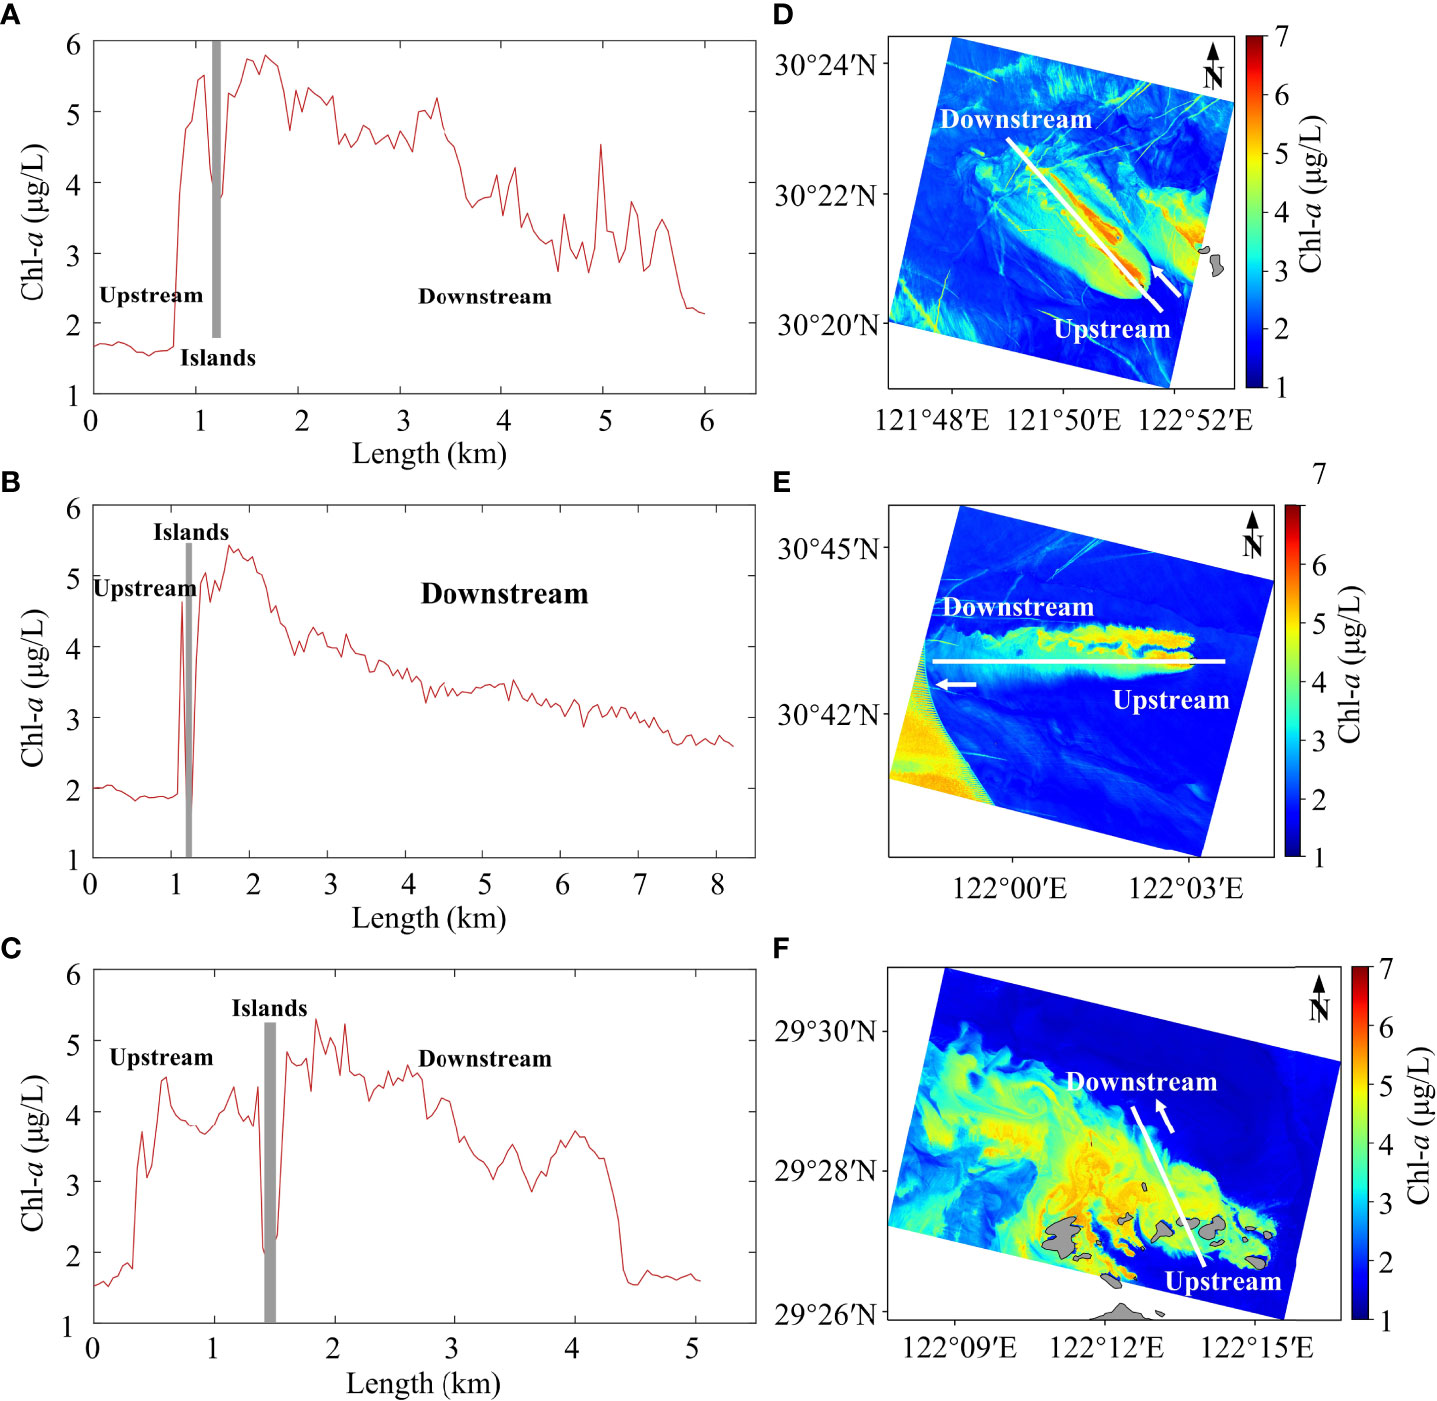
Figure 6 The variation in Chl-a concentrations upstream and downstream of the islands. (A-C) Chl-a concentration variation trends upstream and downstream of the islands on the white line transect; (D-F) Chl-a concentration distribution in waters adjacent to islands. Grey vertical bars: islands.
There was a significant increase in Chl-a concentration upstream and downstream of the island as the current flowing through the island (Figures 6D–F). Chl-a increased over distances of 0.12-1.08 km upstream and 2.80-6.84 km downstream, with Chl-a concentration increasing over shorter distances upstream than downstream (Figures 6A–C).
Spawning areas of four economic fish species, including Silver pomfret (Pampus argenteus, Stromateidae) in April-June (Figure 7A), Japanese anchovy (Engraulis japonicus, Enraulidae) in May-June (Figure 7B), Croaker (Miichthys, Sciaenidae) in August-October (Figure 7C), and Cuttlefish (Sepiella maindroni, Sepiidae) in April-May (Figure 7D) were mainly concentrated in Zhoushan archipelago centered area. Spawning time was mainly in spring and summer, consistent with the appearance of high Chl-a in this area. The feeding grounds are relatively broad, mainly in shallow waters within 50 m isobaths (Figure 7).
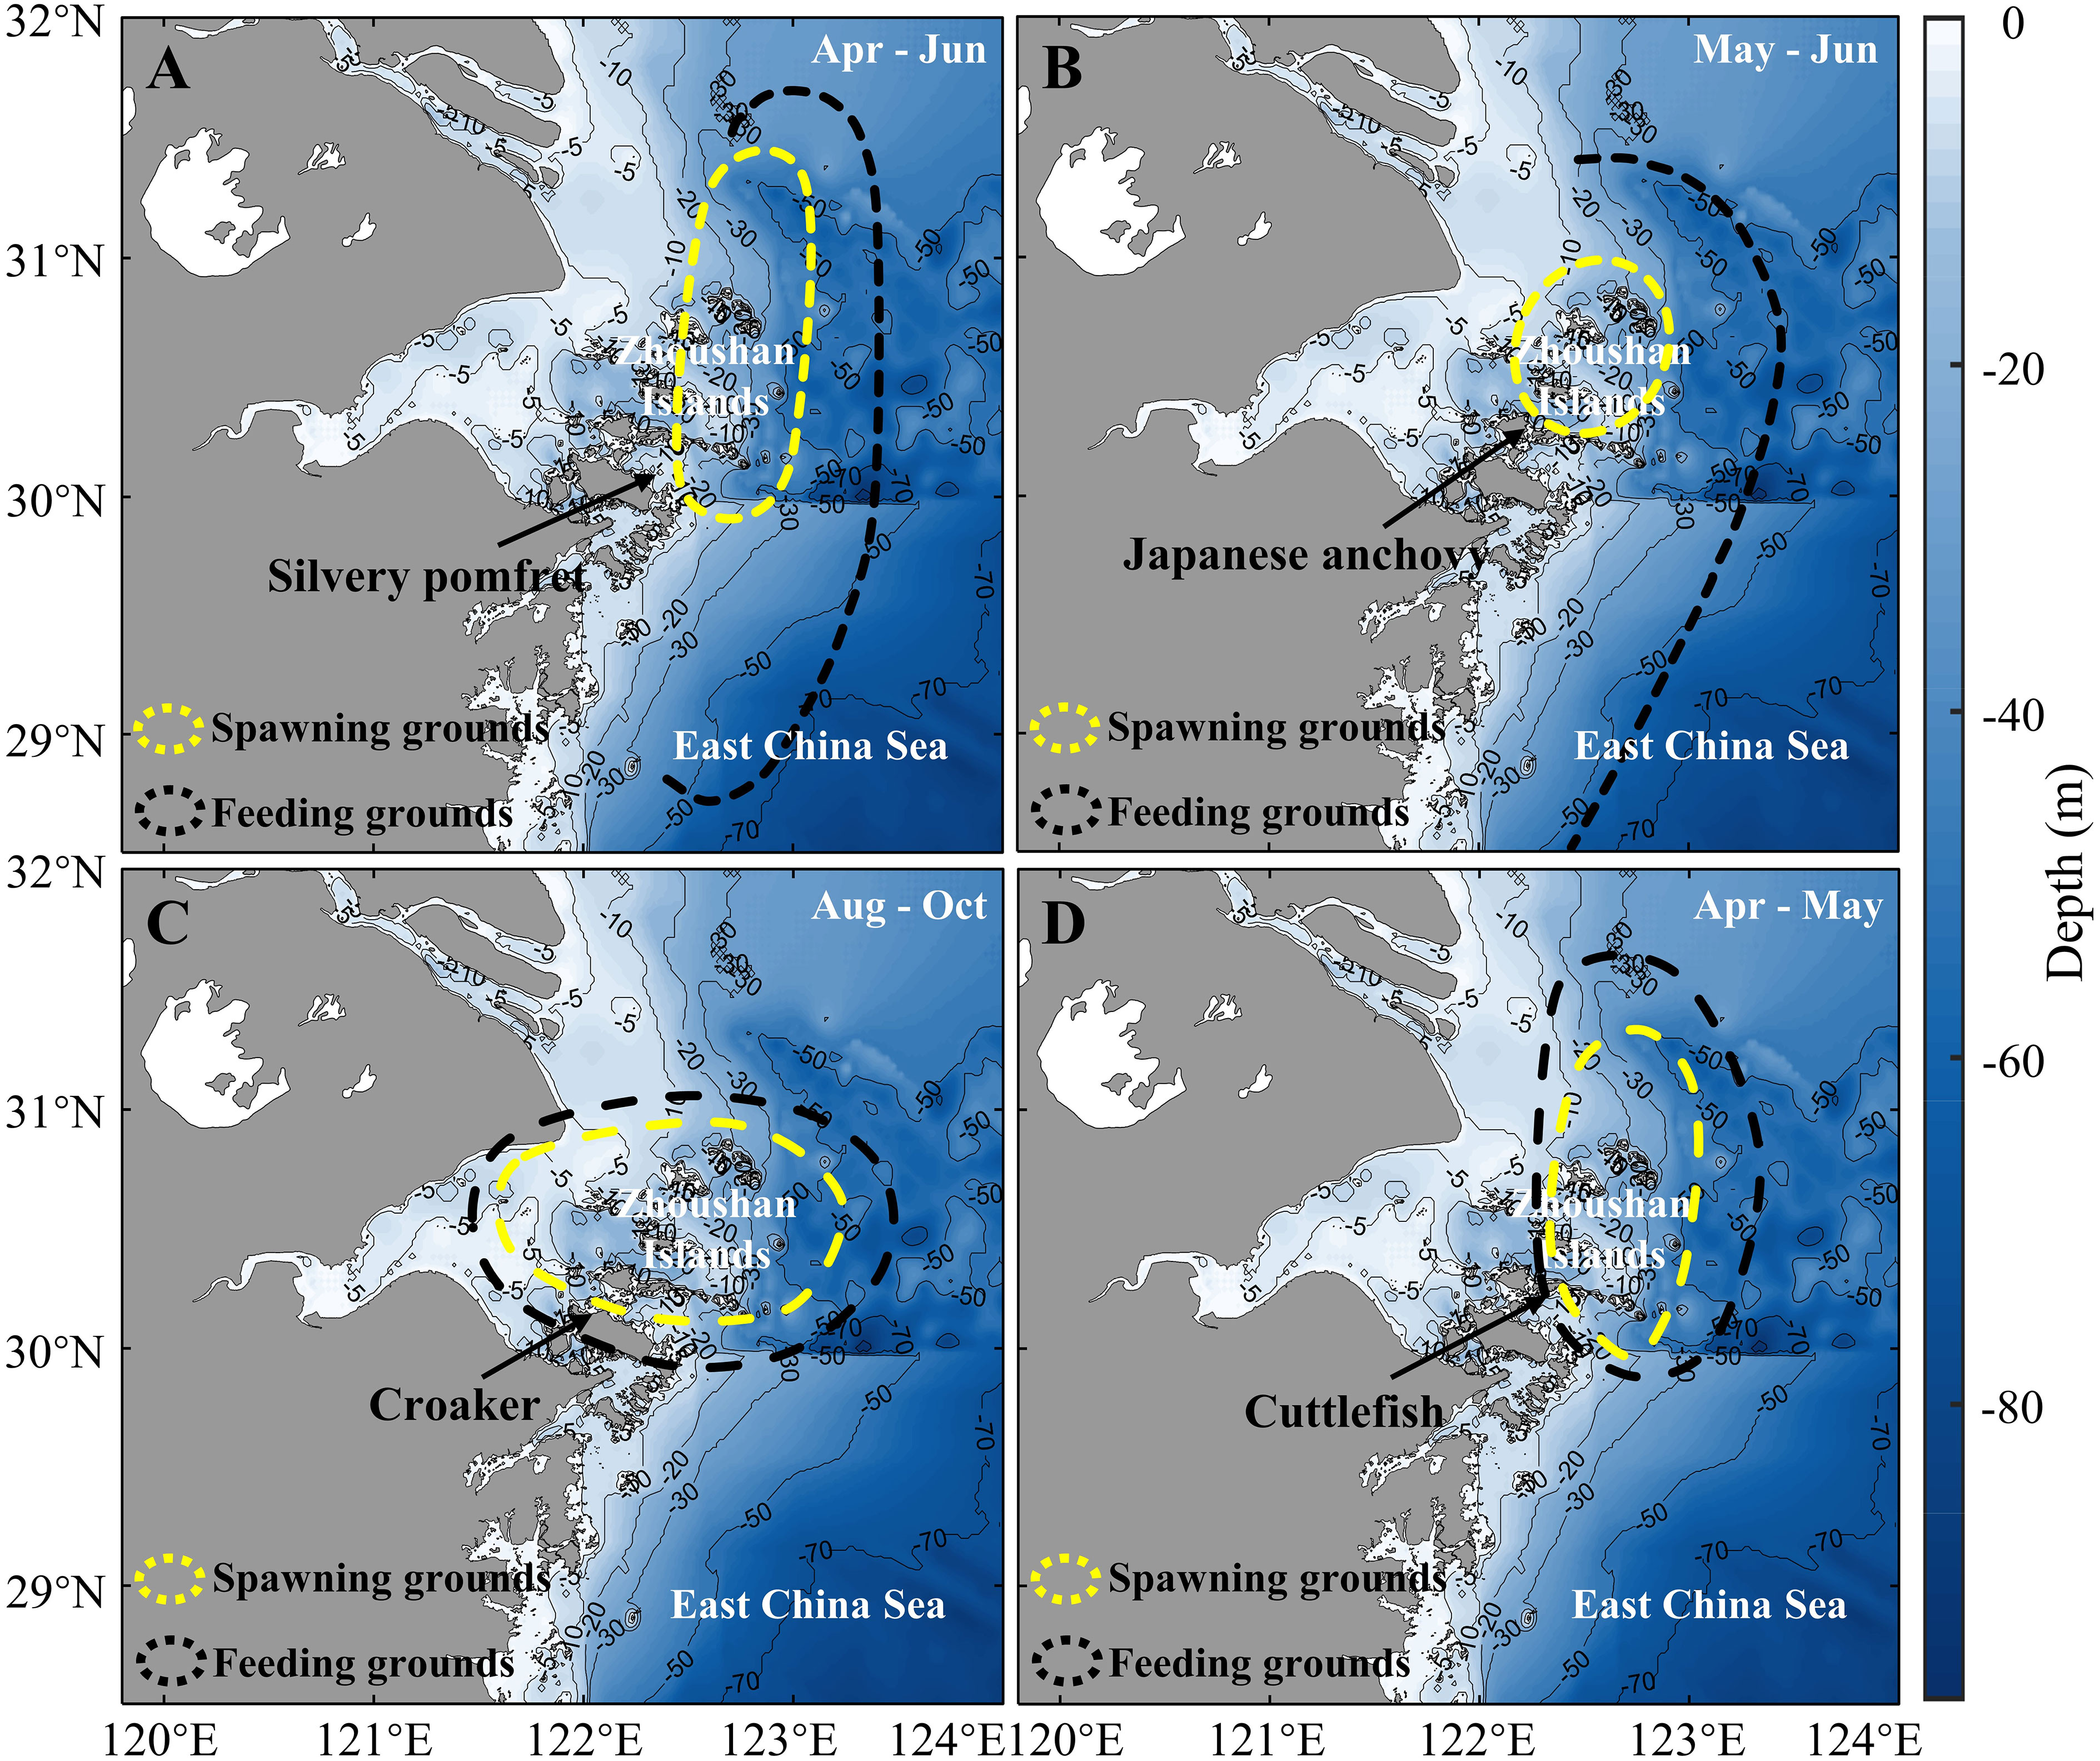
Figure 7 Spawning grounds and feeding grounds for various fish species in the Zhoushan Archipelago Sea area. (A) Silver pomfret; (B) Japanese anchovy; (C) Croaker; (D) Cuttlefish. Yellow circles: spawning grounds; black circles: feeding grounds.
The density of fish eggs and larvae increased in spring and summer in islands and nearshore waters and decreased significantly in autumn (Figuress 8, 9). In the six cruise survey collections, the lowest monthly mean density of fish eggs and larvae was reached in November 2014 (Figures 8G, H), with an average density of 0.01 ind./m3 for fish eggs and 0.005 ind./m3 for larvae. The highest monthly mean density value occurred in June 2014 (Figures 8E, F), with an average density of 0.27 ind./m3 for fish eggs and 0.21 ind./m3 for larvae.
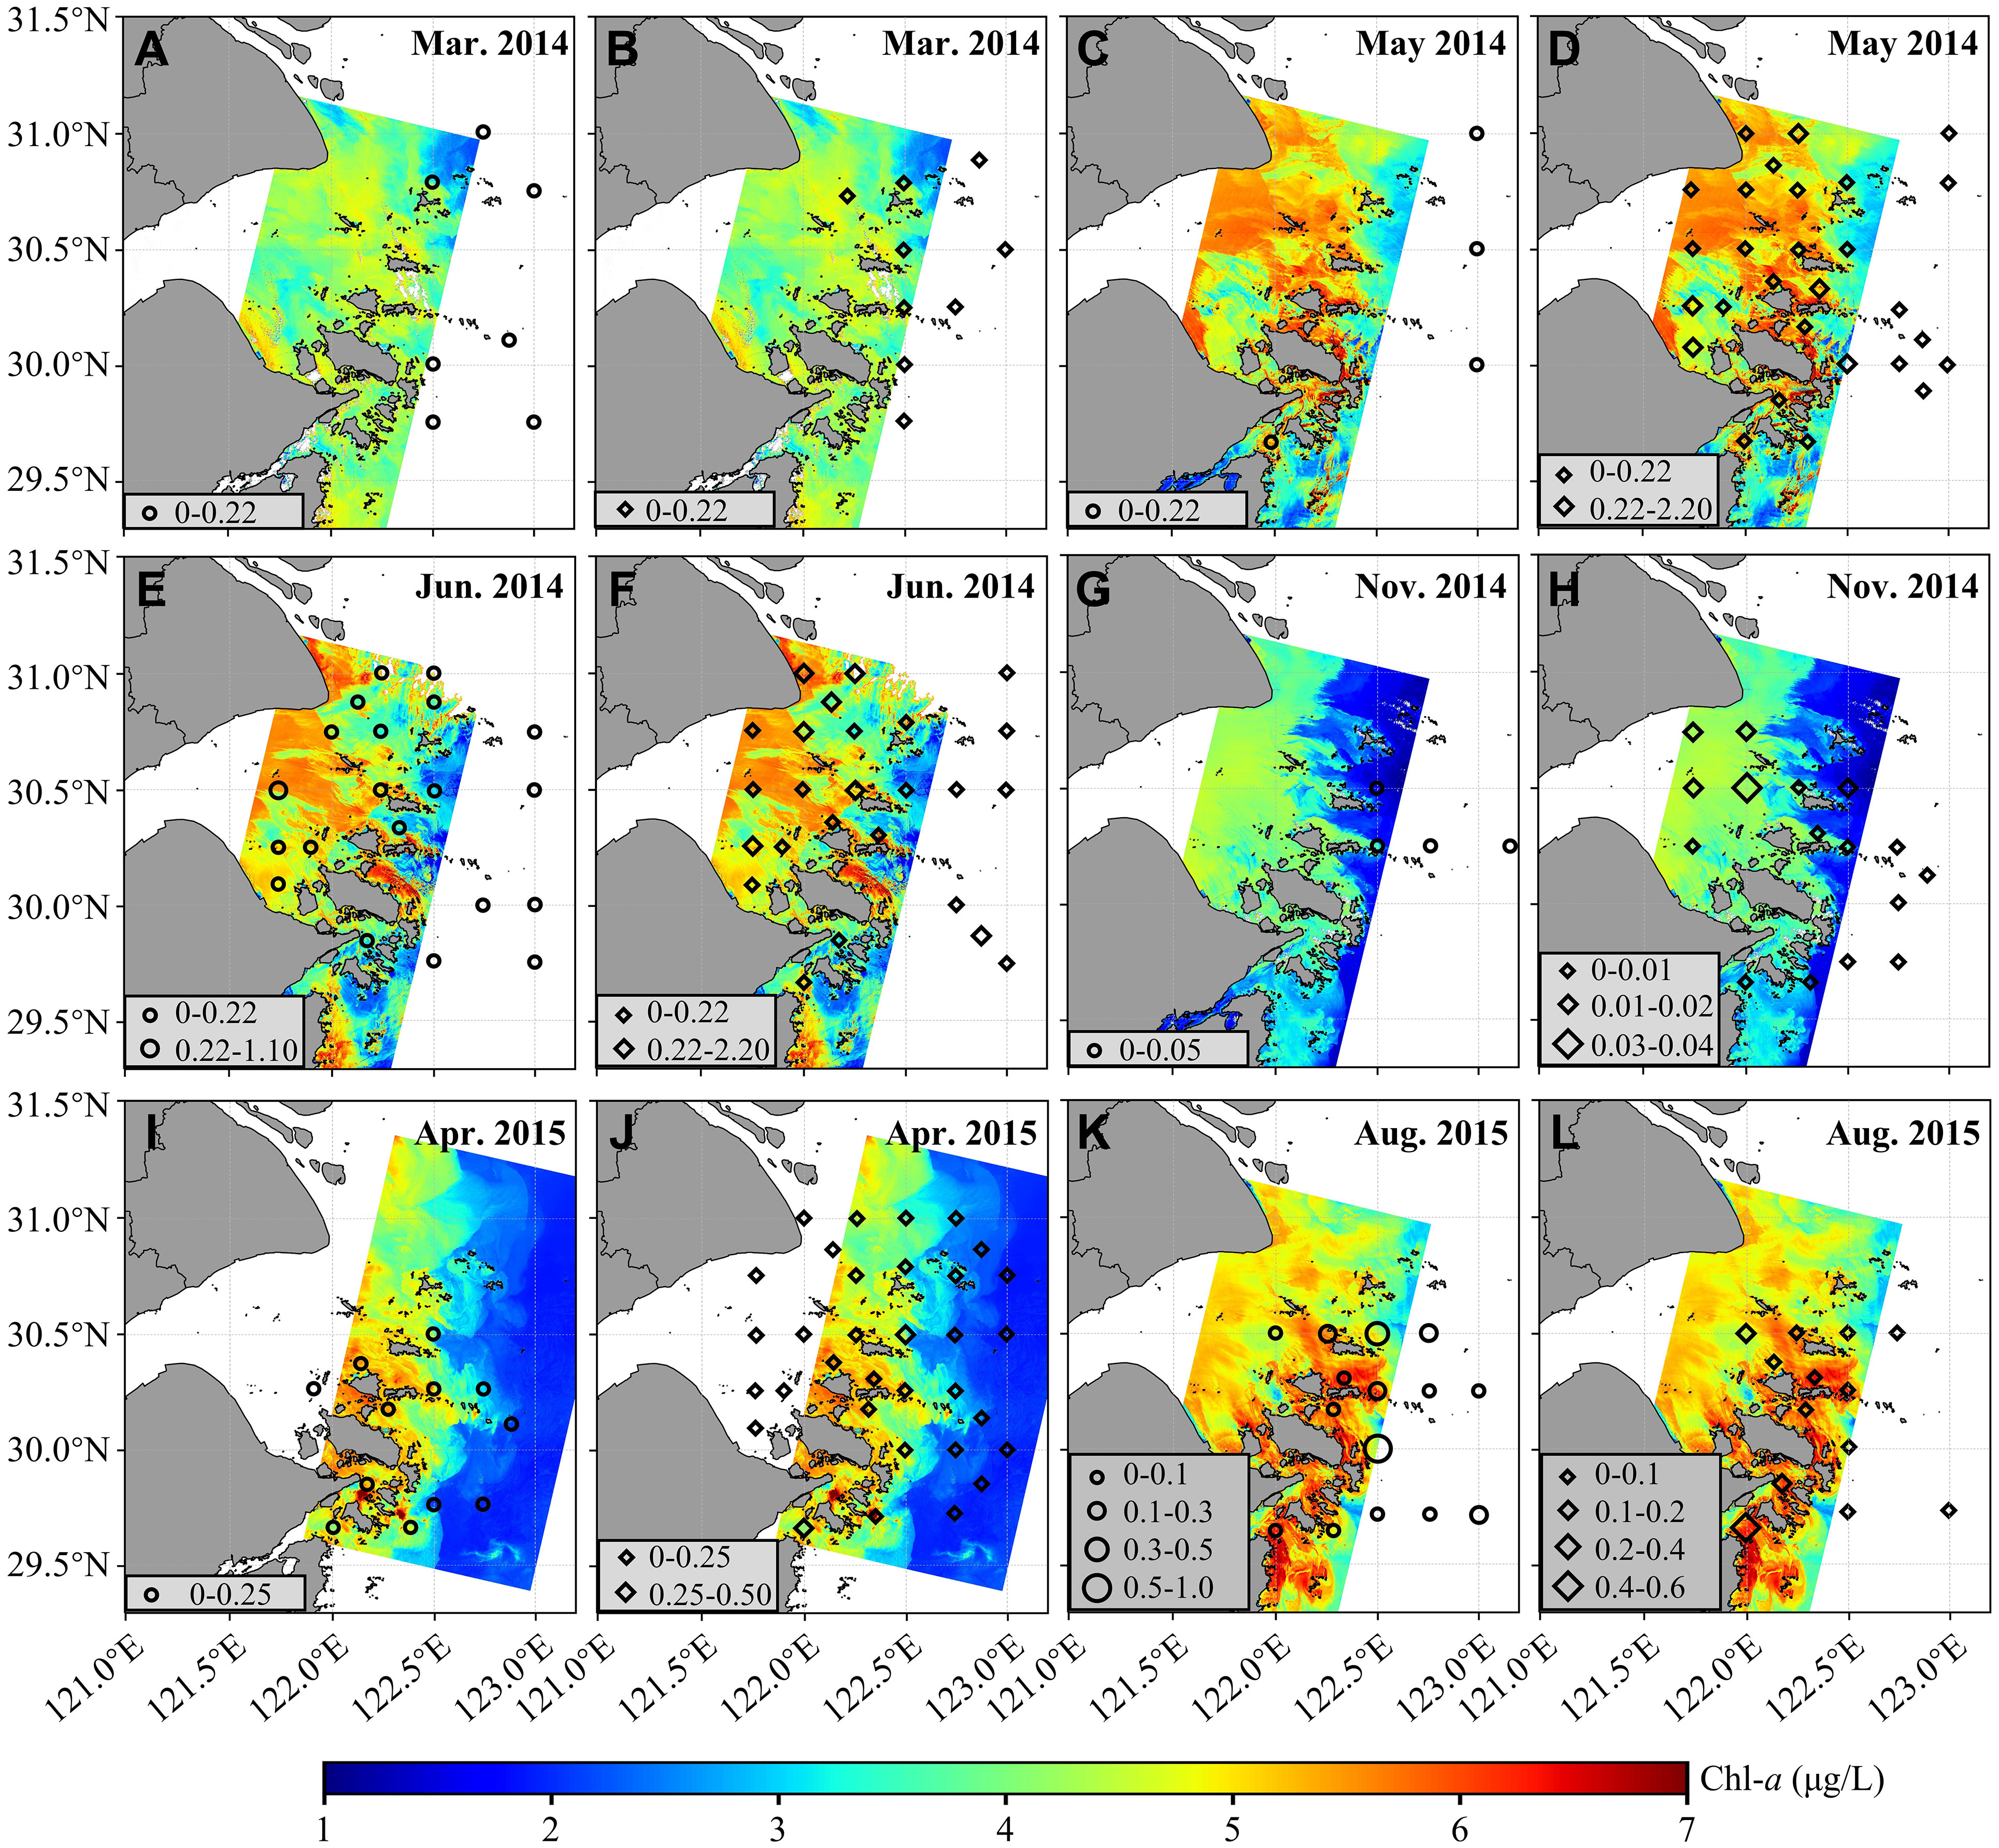
Figure 8 The density (ind./m3) of fish eggs and larvae in spring, summer and autumn in the water of the Zhoushan archipelago from 2014 to 2015. (A–D) In spring; (E, F) in summer; (G, H) in autumn; (I, J) in spring; (K, L) in summer. Black round dots: larvae; black diamond-shaped dots: fish eggs.
Chl-a concentration in the study area also showed seasonal variations during the same period (Figure 9), with high values of Chl-a in spring (April, May) and summer (June, August), with an average monthly Chl-a concentration ranging from 4.31-4.80 μg/L. In contrast, there was a relatively low Chl-a concentration in early spring (March) and autumn (November), with an average monthly Chl-a concentration ranging from 2.84-3.52 μg/L.
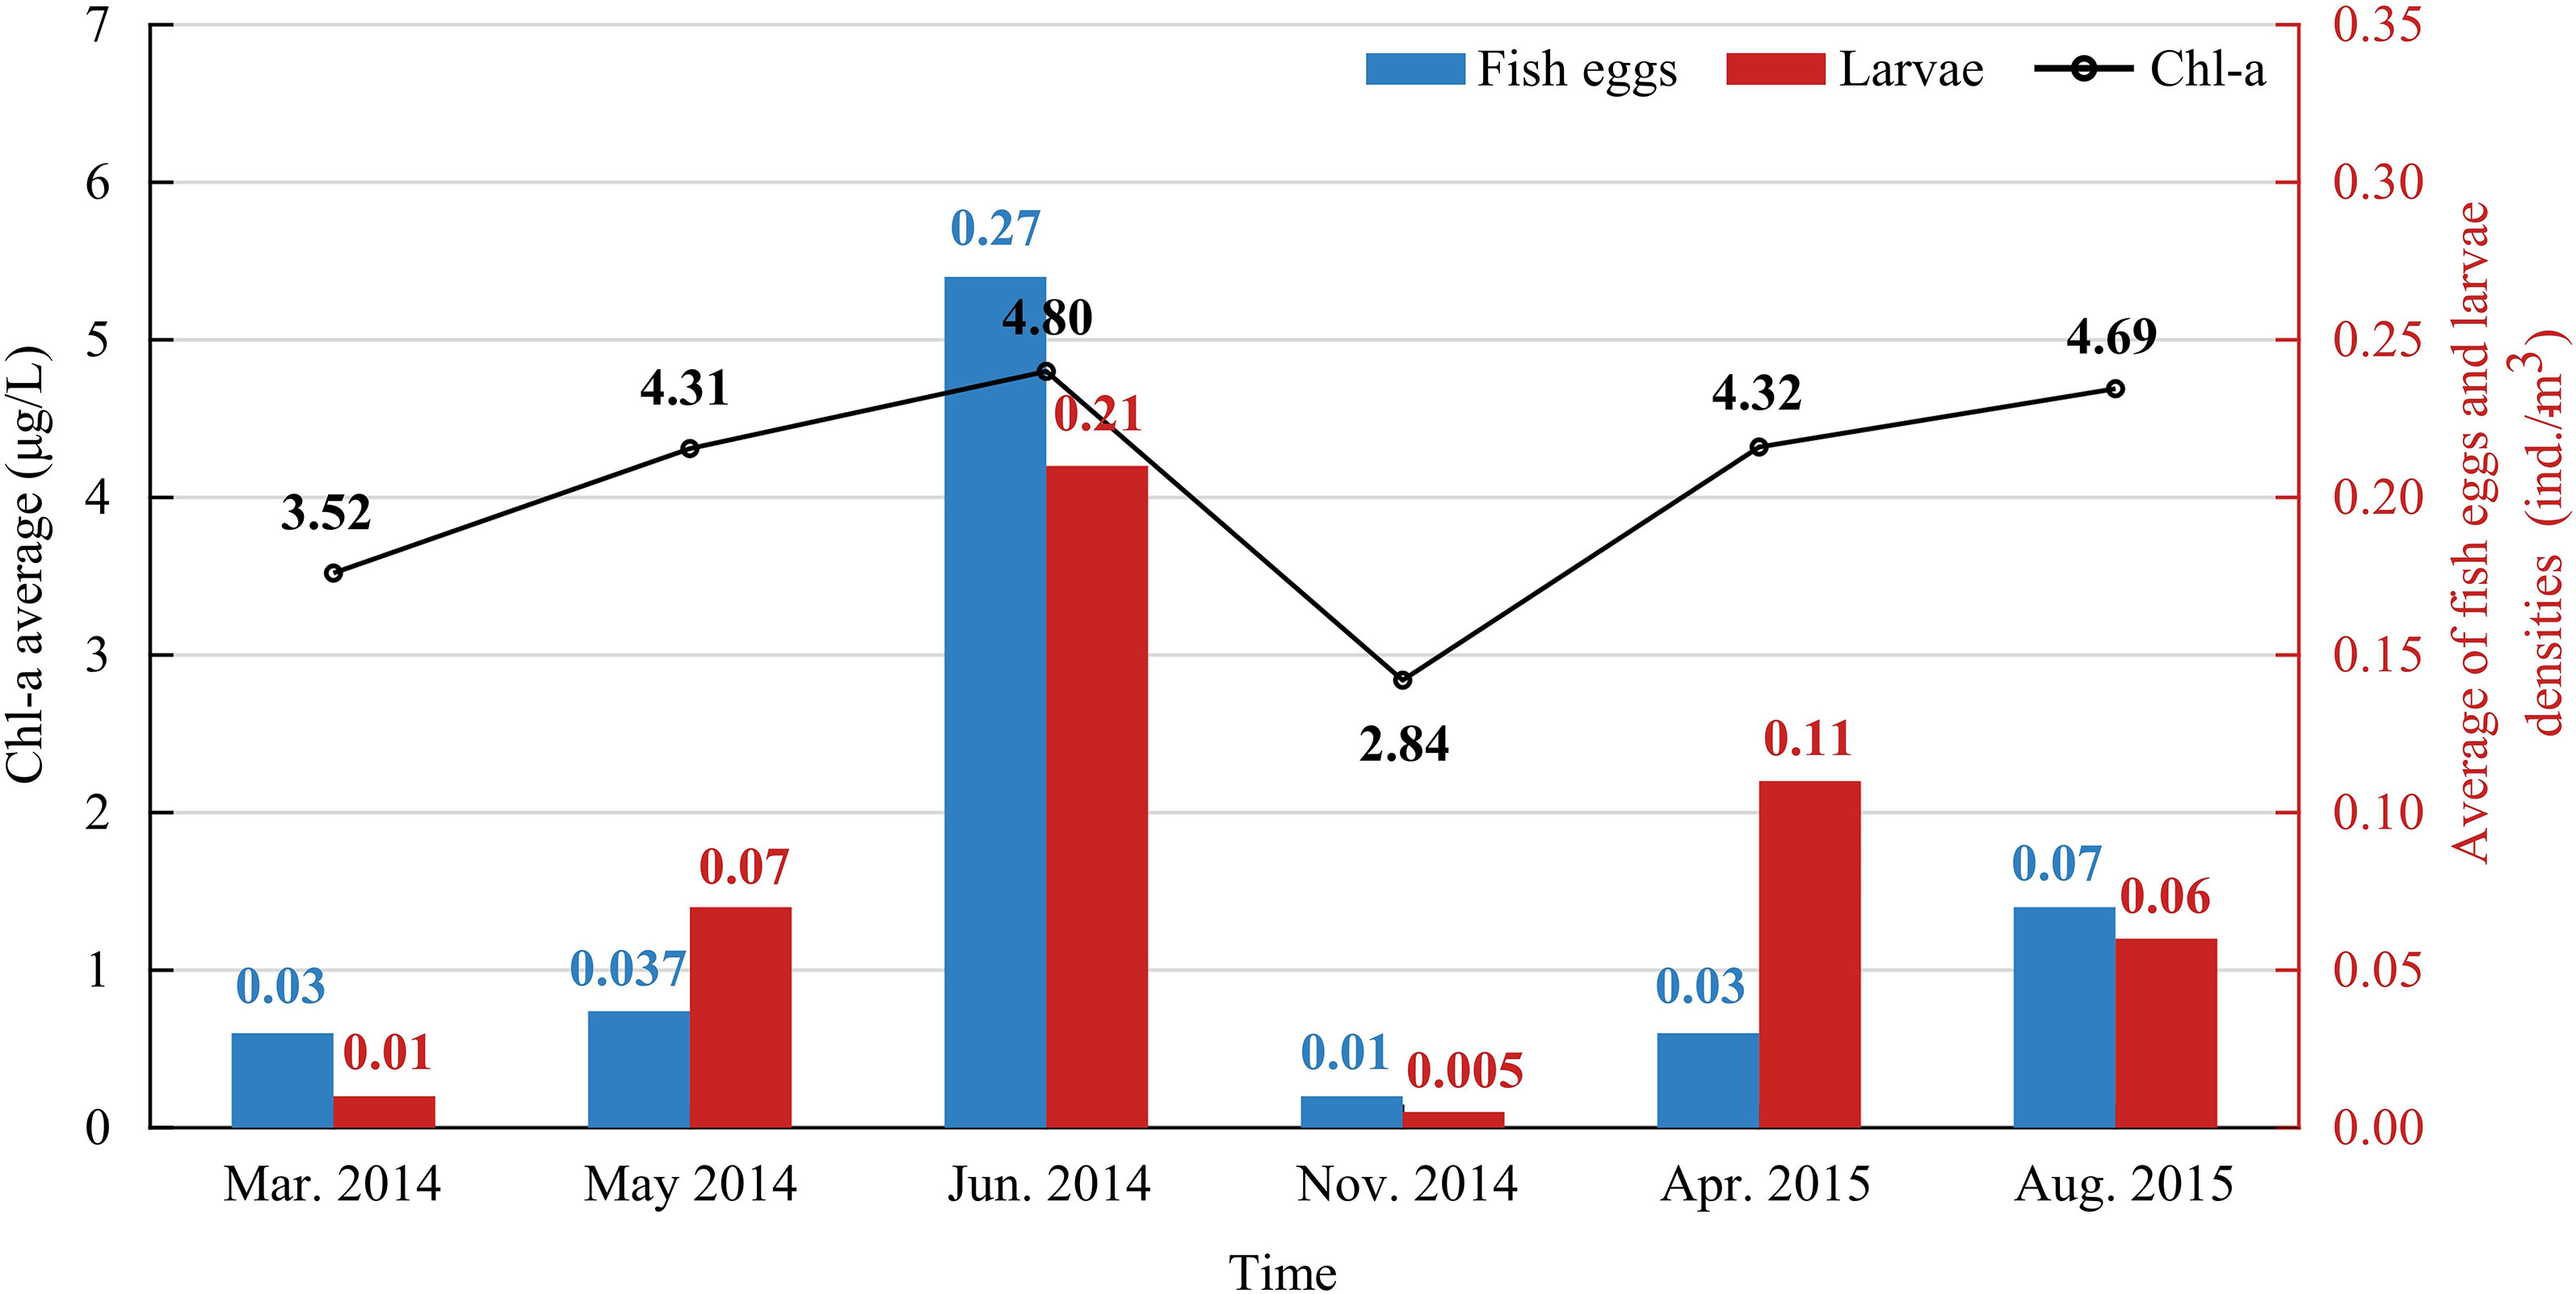
Figure 9 Temporal correlation between the biomass density of fish eggs and larvae and Chl-a concentration in the water of the Zhoushan archipelago.
High and low changes in the biomass density of fish eggs and larvae in the water of the Zhoushan archipelago show a high degree of consistency with the spatial distribution and seasonal variation of Chl-a concentration in the study area waters.
The water in the Zhoushan archipelago area is class II water. The spectral properties of Chl-a are affected by colored dissolved organic matter (CDOM), SSC, and the traditional blue-green band ratio (or combination) algorithm will no longer be suitable for the inversion of Chl-a in class II water (Sathyendranath et al., 1989; Bowers et al., 1996). It was found that the NIR band showed a high correlation with SSC in highly turbid waters, and the magnitude of the correlation increased with the concentration of suspended matter (Tao et al., 2007; Zhu et al., 2020). Therefore, B4 (NIR) was excluded in building the Chl-a inverse model.
Empirical algorithms are still valid for remote sensing ocean color in complex estuaries and nearshore waters (Zhu et al., 2015). The impact of SSC on the Chl-a inversion was effectively reduced by introducing a power exponential form of the red and red-green bands ratio ((B3/B2)a), which is consistent with previous studies (Ma et al., 2005; Tzortziou et al., 2007; Le et al., 2013) as well as our study.
The best band combination was selected to build the Chl-a model, and the Chl-a inversion results of the PMS-Chla model were in good agreement with the in-situ Chl-a concentration in the study area (Figure 3A). Furthermore, the modeled Chl-a in other seasons using the newly built model was consistent with the Chl-a distribution in the corresponding season in prior studies (Ji et al., 2018; Fu et al., 2019). Therefore, the new Chl-a model is applicable in the study area in all seasons.
It was found that detailed variation in Chl-a vortex belts downstream of the islands was revealed in the GF-6/PMS (2 m) particular resolution image (Figure 10A), which was not clearly shown in the Landsat-8/OLI (30 m) medium resolution satellite data (Figure 10B). Therefore, GF-6/PMS (2 m) high spatial resolution satellite data play a crucial role in studying the distribution of Chl-a details in the waters around islands.
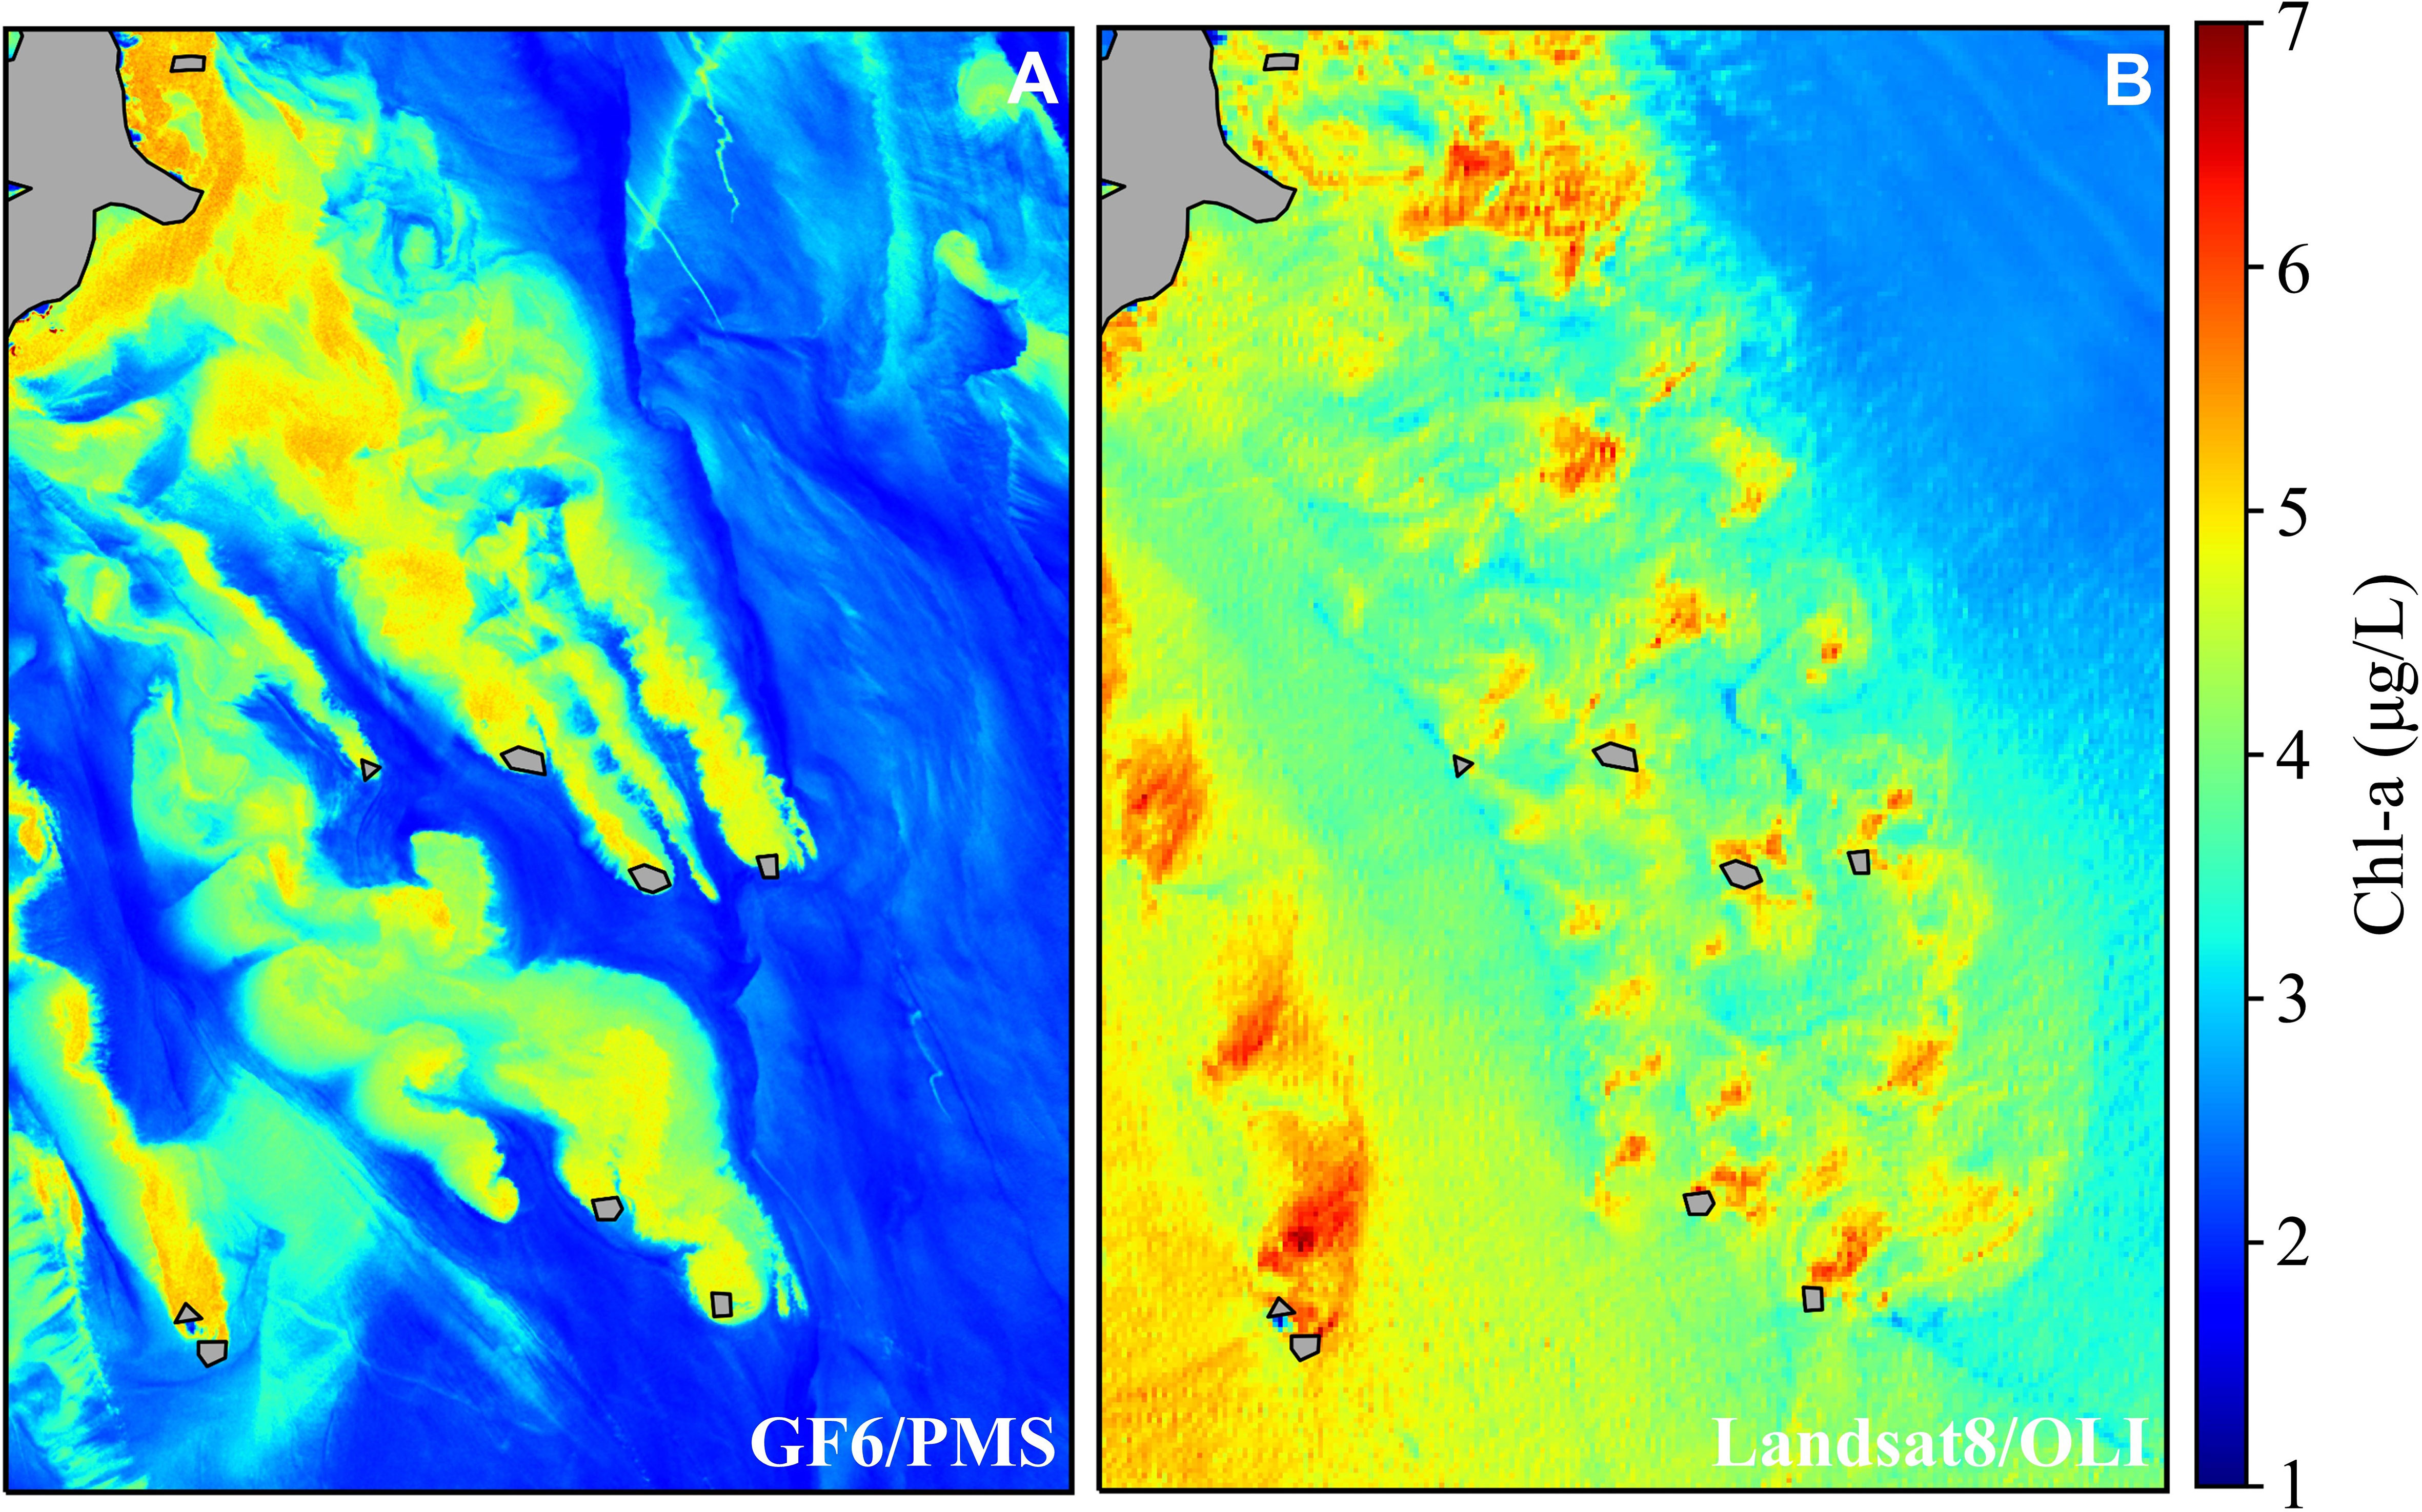
Figure 10 Comparison of the detailed distribution of Chl-a concentrations in the waters around islands on GF-6/PMS and Landsat8/OLI images. (A) Distribution of Chl-a concentration in GF-6/PMS image; (B) distribution of Chl-a concentration in landsat-8/OLI image.
The seasonal variation of environmental factors such as SST, wind, and SSS in the study area (Chen and Liu, 2015) also contribute to Chl-a and fishery resources.
In spring, the Taiwan warm current gradually increases in strength northward (Figure 11I), delivering phosphate-rich hypersaline water to the nearshore waters of Zhoushan archipelago. In addition, SST in the study area rebounded in spring (March-May) and summer (June-August), providing more suitable conditions for the growth and reproduction of phytoplankton. Zhoushan has a predominantly north subtropical monsoon climate with south winds prevailing in spring and summer under the influence of the East Asian monsoon (Figure 11E, F) (Fu et al., 2019). This wind direction was favorable for forming coastal zone upwelling (Ding, 1985; Hu and Zhao, 2007). In the wind-induced upwelling area in the nearshore waters of the Zhoushan archipelago (Figures 11A, B), the upwelling brings the nutrient-rich middle and lower waters of the study area to the strong photosynthetic layer, providing sufficient nutrients and favorable growth conditions for phytoplankton and zooplankton, which in turn attracts a large number of fish aggregations to breed here (Oliveira et al., 2009; Fernando et al., 2018). Islands induced the change of water environmental factors also contribute to fishery development. In addition, the summer coincides with the peak runoff of the Yangtze River, whose diluted water continuously expands eastward under the action of its substantial runoff and southwest monsoon (Figure 11J). Flushing water carried abundant nutrients, which facilitated phytoplankton growth and fish reproduction (Wang et al., 2008; Xu et al., 2020). The light conditions also significantly affect Chl-a concentration (Oliver et al., 2010; Garbulsky et al., 2014).
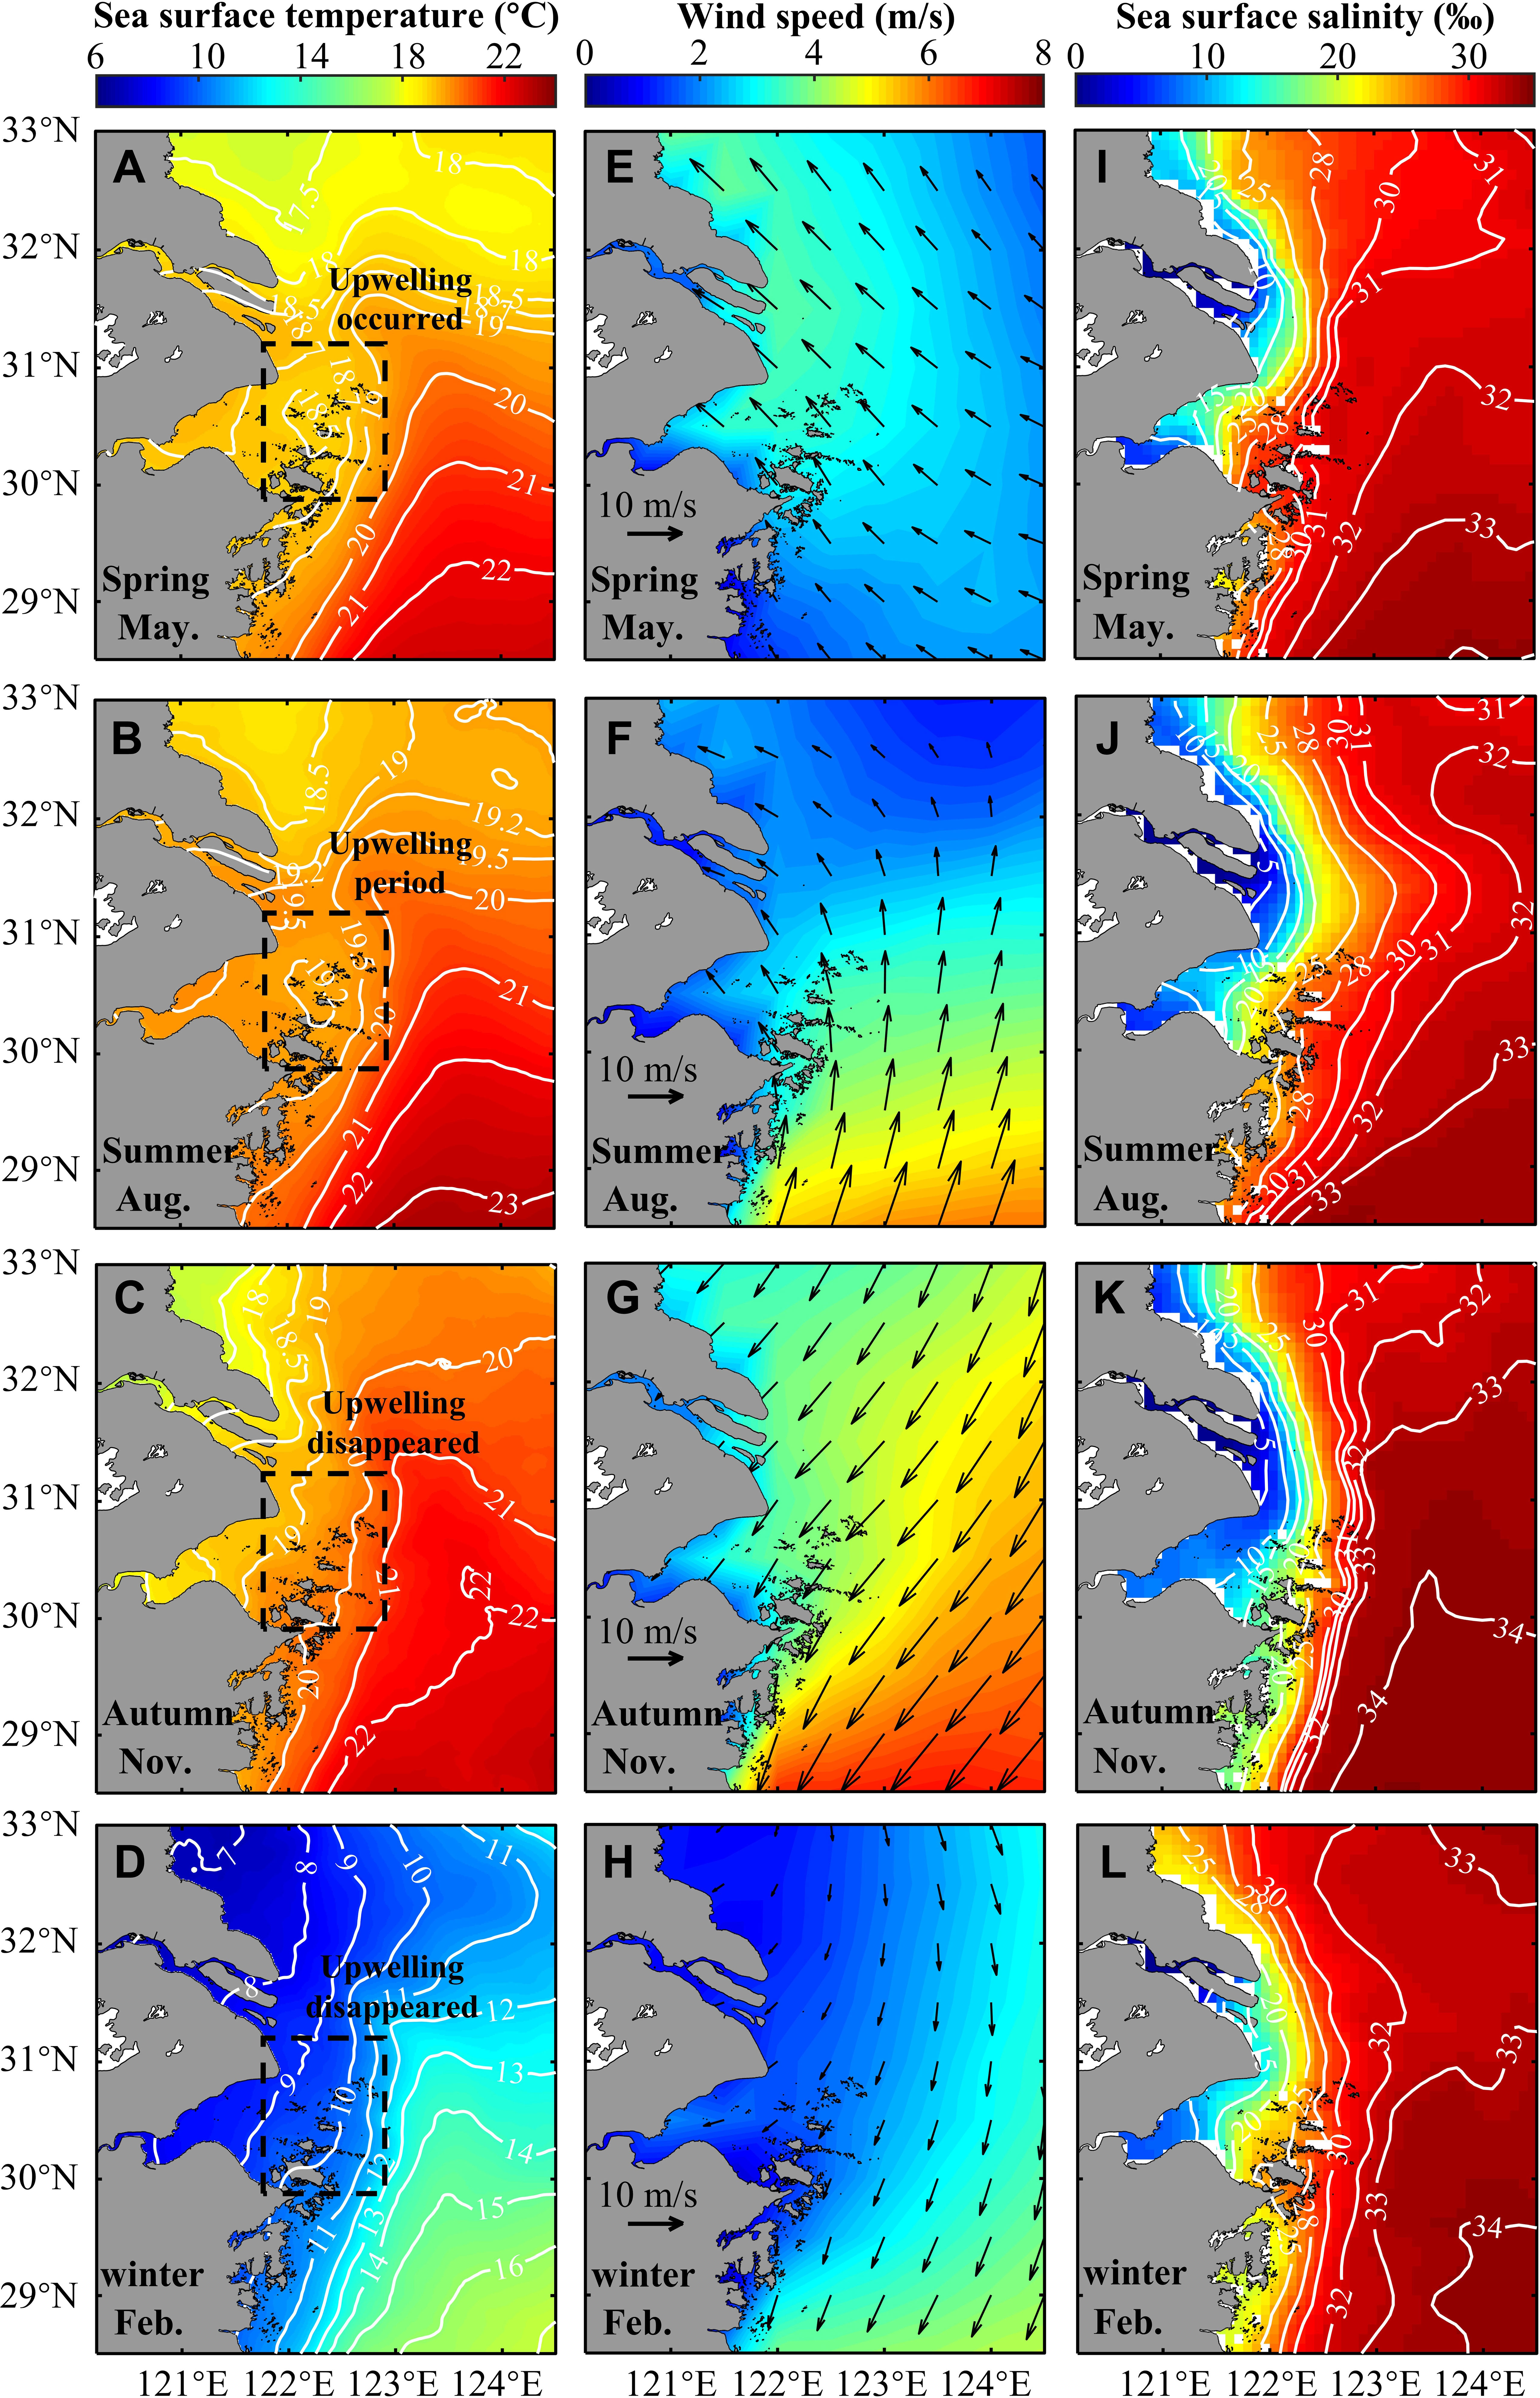
Figure 11 The seasonal variation of SST, wind and SSS for Zhoushan archipelago in 2020. (A-D) SST; (E-H) 10 m wind at the sea surface; (I-L) SSS. The black square is the study area.
The salinity of the study sea decreased (Figure 11K, L) in autumn (September-November) and winter (December-February) when the low saline water tongue of the Yangtze estuary extended to the southwest under the influence of northeasterly winds (Figure 11G, H). Although the southward moving flushing water brought nutrients to the study sea, the disappearance of the upwelling (Figure 11C, D) caused a weakening of convective mixing and a significant decrease in biomass (Hu and Zhao, 2007; Oliveira et al., 2009). Moreover, the reduced light in the East China Sea in autumn and winter limits the growth of phytoplankton (Oliver et al., 2010; Garbulsky et al., 2014), resulting in lower Chl-a concentration in autumn and winter than in spring and summer.
The significant differences in the seasonal distribution of Chl-a and fishery resources show certain consistency of variation with the monsoon, the nutrient supplies, the temperature, light conditions, and so on.
The nearshore waters of the Zhoushan area are one of the strong coastal tidal areas in China, and the change of Chl-a in the study area is closely related to the specific hydrodynamic conditions (currents) of the water (Wolanski and Hamner, 1988; Lévy et al., 2012; Everett et al., 2014).
The current in the study area is characterized by stable irregular semi-daily tides (Figure 12), with two flood and ebb tides in a day. Current speed and direction vary regularly with time (Chen et al., 1990). Similar patterns and tidal features are repeated daily (Cao and Lin, 2000). The tide of any day can be taken as an example to illustrate the changing rules of flooding and ebbing tide in the study area. Due to data limitations, the sea surface current data for the Zhoushan archipelago are taken from November 2020. The study area is dotted with intensive islands, and the coastline is intricate and narrow. The currents are blocked and rubbed by the islands and the seabed, causing strong turbulence around the islands, resulting in some degree of upwelling upstream of the islands and eddies downstream (Wolanski and Hamner, 1988). The isobaths of the nearshore waters of the Zhoushan archipelago are densely distributed, basically parallel to the shoreline and islands, and the topography of the seabed is mostly flat and open (Figure 7) with a depth of 10-50 m, which is an excellent place for marine fishery production (Chang et al., 2012). Its strong semidiurnal tide interacts with the islands, causing regular changes in Chl-a (Liu et al., 2012).
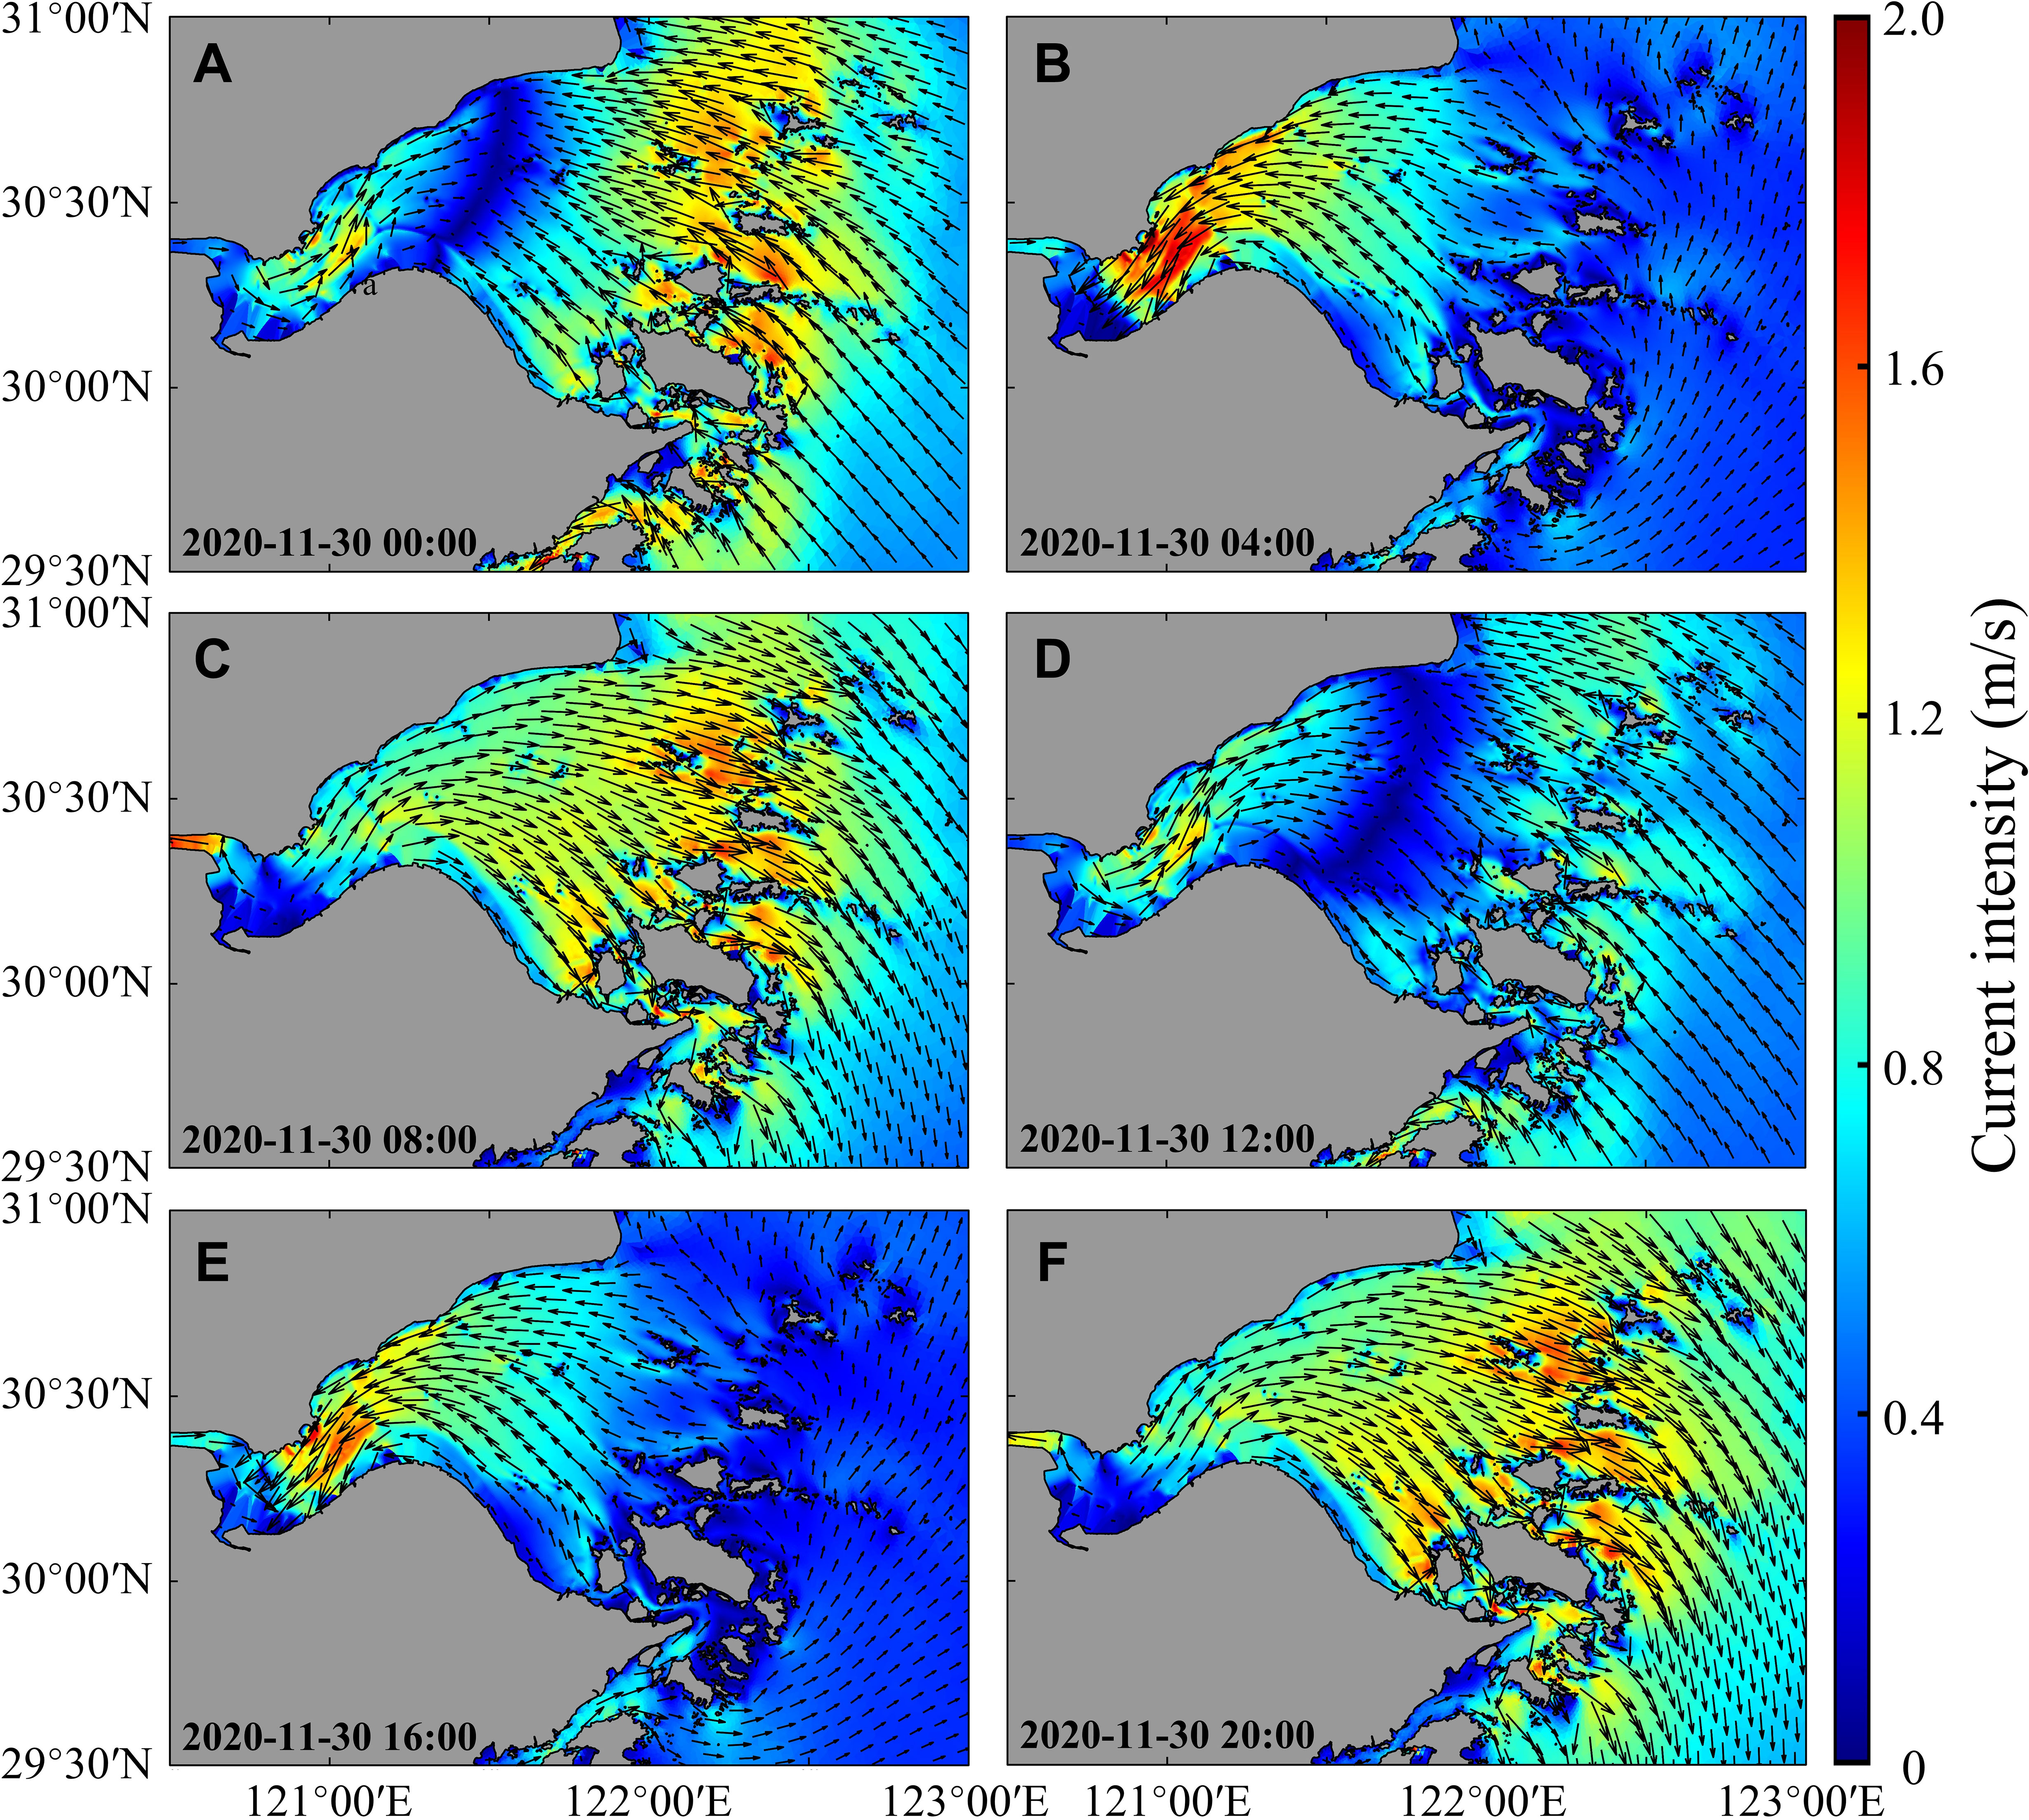
Figure 12 Distribution of currents on the sea surface of Zhoushan archipelago on November 30, 2020. (A) 00:00; (B) 10 m wind at the sea surface; (C) SSS. (A–F) Distribution of currents at 00:00, 04:00, 08:00, 12:00, 16:00, and 20:00, divided by four-hourly intervals.
Upstream of the islands, the formation of upwelling prompts the vertical exchange of waters near the islands. Nutrients and other substances on the seabed are turned up and spread, causing the low-temperature, high-salinity, nutrient-rich seawater from the bottom and near-bottom layers to rise continuously to the surface. This accelerates the rate of nutrient circulation and causes an increase in plankton and improved water quality, allowing fish to congregate here (Simon, 1989; Howe, 2003). The downstream of the islands generate Karman vortex streets eddies, the vertical velocity generated by the eddies carries deep nutrients to the photic zone, allowing phytoplankton to grow, attracting fish (Wolanski and Hamner, 1988; Thomson et al., 2009; Everett et al., 2014).
Studies have shown that fish movement and habitat are correlated with changes in currents in island areas and that island disturbance of currents and their biological effects on coastal ecosystems are important (Harlan et al., 2002; Caldeira and Sangra, 2012).
Based on the analysis above, intensive islands create not only an ideal environment for nutrients, which is conducive to the proliferation of phytoplankton here, making the overall Chl-a concentration values in the waters around the islands higher than in the waters further offshore. It also creates different water flow conditions for fish, providing excellent shelter, baiting grounds, breeding grounds, or habitats for fish, thus impacting the increase of fishery resources.
Therefore, all the environmental factors combine, contributing to fish eggs and larvae density. Chl-a change details can be well revealed by high-resolution satellite data and show consistency with the spatial distribution and seasonal variation of fish eggs and larvae in the water of the Zhoushan archipelago. This indicates that the distribution of Chl-a can helps us analyze and find the spawning grounds.
This study established a new Chl-a inversion model based on in-situ data and GF-6/PMS satellite data using the ratio relationship between B2(green) and B3(red). Chl-a distribution details in the water of the Zhoushan archipelago were analyzed. High Chl-a concentration is mainly concentrated in the nearshore islands area. Chl-a concentration changes obviously with the change of tidal currents, with higher Chl-a concentration appearing around islands, especially downstream of islands. There appears a significant increase in Chl-a concentration both upstream and downstream of the islands as the current flows through the islands. Temporally, Chl-a concentration is higher in spring and summer, lower in autumn, and the lowest Chl-a concentration in winter.
The fish species that spawn in the waters of the Zhoushan archipelago are abundant, and the change of fish eggs and larvae in the waters shows consistency with the spatial distribution and seasonal variation of Chl-a (Figure 13).
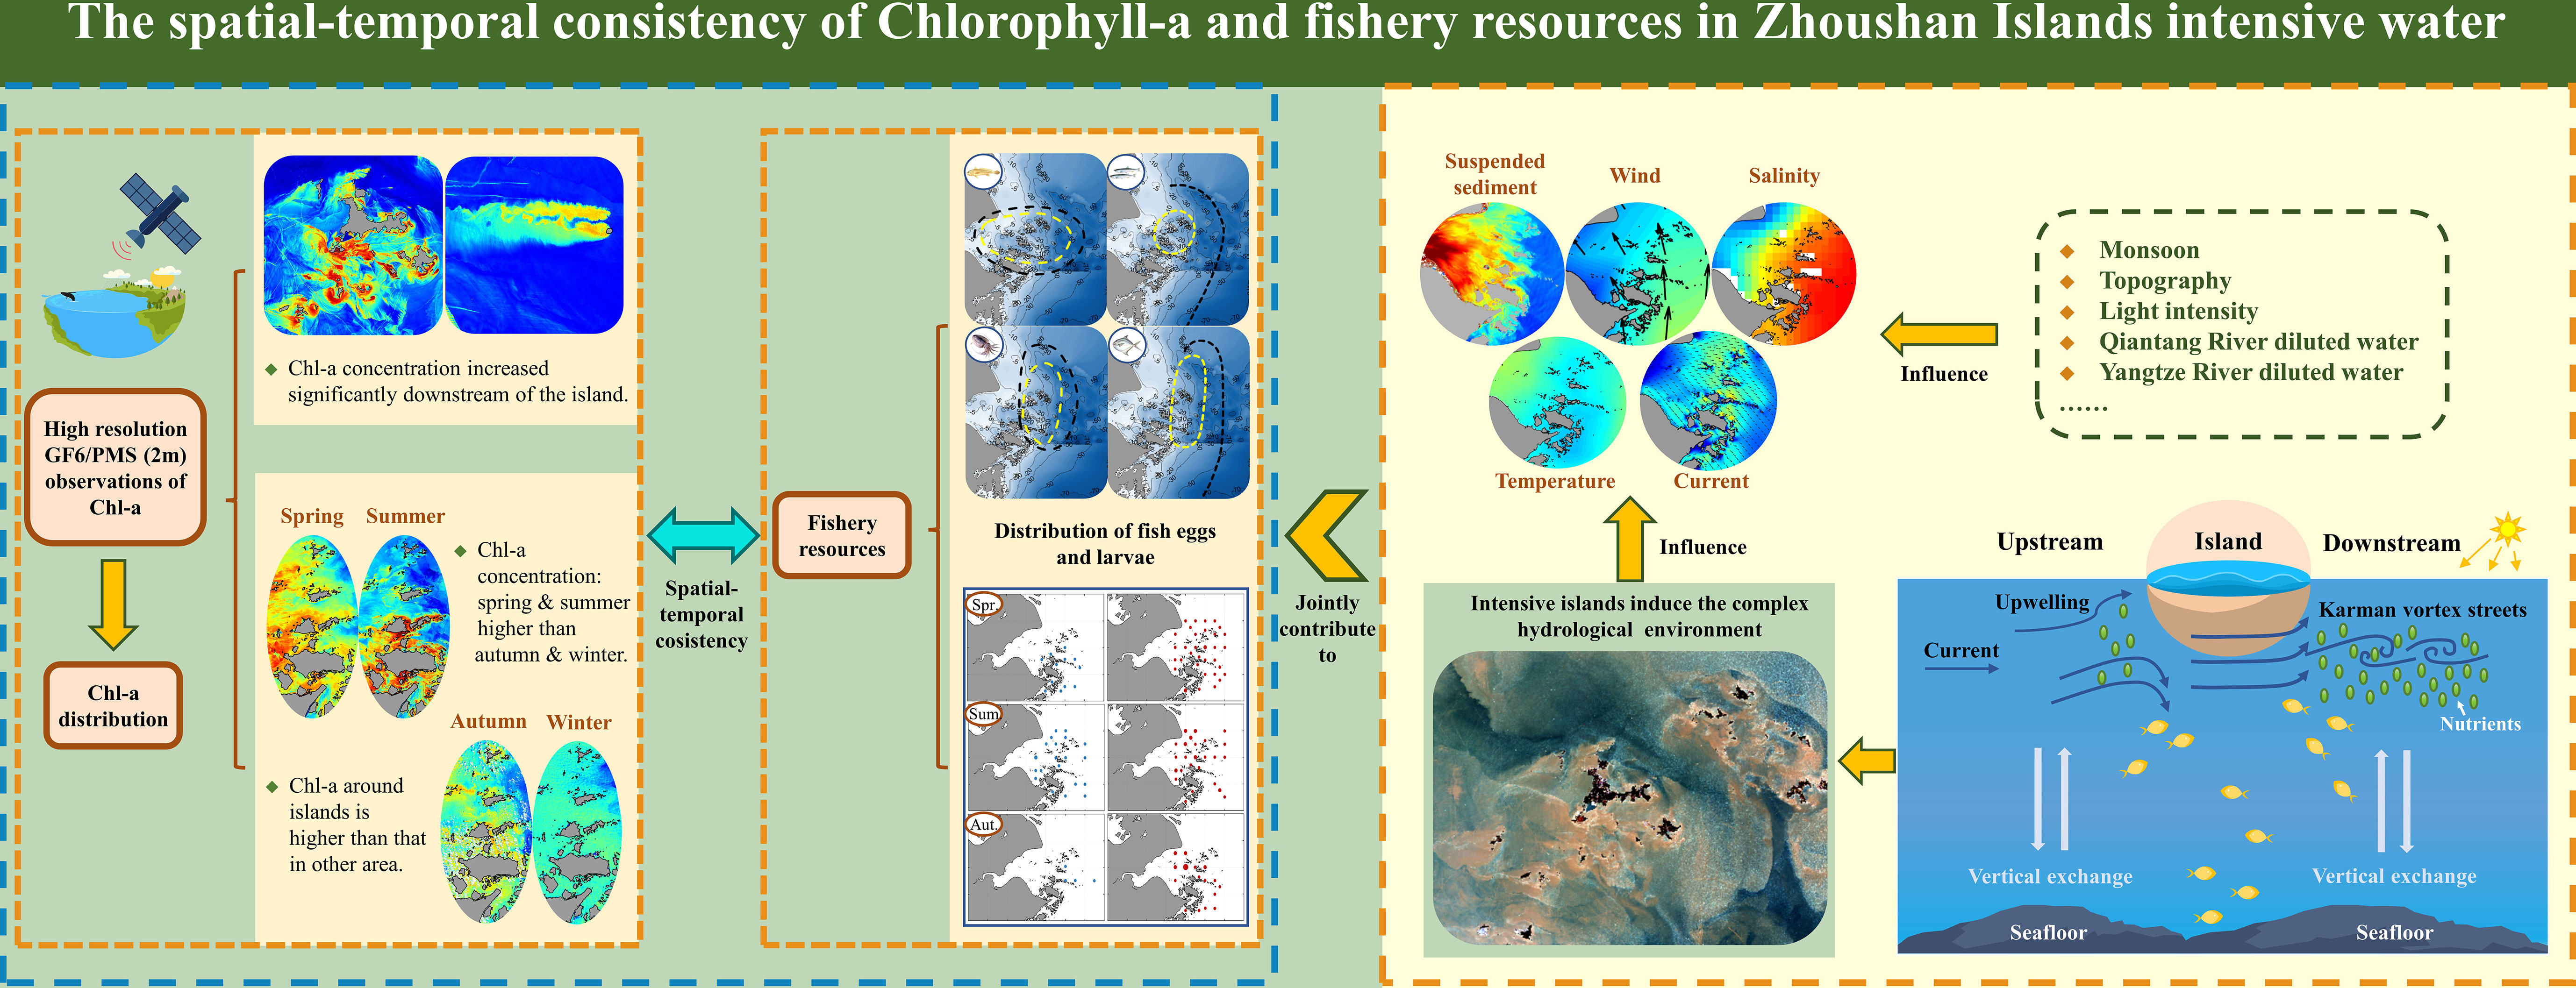
Figure 13 The spatial- temporal consistency of Chlorophyll-a and fishery resources in Zhoushan Islands intensive water.
Island interacts with current resulting in the diverse currents (upstream upwelling and tidal current downstream vortex currents) around the islands, promoting the vertical exchange of water and the uplifting of nutrients, resulting in the increase of Chl-a concentration in the waters around the islands. The diverse flow conditions, the ideal nutrient-rich environment, and the abundant phytoplankton attract a large number of fishes to gather and breed in the waters around the islands. In addition, many seasonal factors also affected the Chl-a concentration distribution and fish eggs and larvae biomass density. Its unique hydrological environment, topography, and hydrodynamic conditions are the basis for forming the Zhoushan fishing ground.
The original contributions presented in the study are included in the article/supplementary material. Further inquiries can be directed to the corresponding author.
LC conducted the research design, data collecting, analysis, and manuscript writing. RT conducted the data processing, and manuscript writing. XY conducted the data collecting and research advisement. YZ the data collecting, analysis. JJ assisted data collecting. MY assisted data collecting. All authors have read and agreed to the published version of the manuscript.
This work was supported by the Zhejiang Key Science and Technology Project (2020C02004); the National Natural Science Foundation of China Key international (regional) cooperative research project (42020104009); the National Key Research and Development Program (2019YFD0901205); the Basic Public Welfare Research Program of Zhejiang Province (LGF21D010004); the Research on group ideological and political subject teaching model of ocean remote sensing (132); the Science Foundation of Donghai Laboratory (DH-2022KF01010).
The authors would like to thank NSOAS for providing the data free of charge. The authors wish to thank the national satellite ocean application center, China and Sophisticated Ocean Front and Fisheries Investigation (SOPHI) for the data support.
The authors declare that the research was conducted in the absence of any commercial or financial relationships that could be construed as a potential conflict of interest.
All claims expressed in this article are solely those of the authors and do not necessarily represent those of their affiliated organizations, or those of the publisher, the editors and the reviewers. Any product that may be evaluated in this article, or claim that may be made by its manufacturer, is not guaranteed or endorsed by the publisher.
Bacher C., Grant J., Hawkins A. J. S., Fang J. G., Zhu M. Y., Besnard M. (2003). Modelling the effect of food depletion on scallop growth in sungo bay (China). Aouat. Living Resour. 16, 10–24. doi: 10.1016/S0990-7440(03)00003-2
Barbieri M. A., Silva C., Larouche P., Nieto K., Yáñez E. (2004). Detection of mesoscale oceanic features using radarsat-1 AVHRR and SeaWiFS images and the possible link with jack mackerel (Trachurus murphyi) distribution in central Chile. Gayana 68, 29–39. doi: 10.4067/S0717-65382004000200006
Bierman P., Lewis M., Ostendor B., Tanner J. (2011). A review of methods for analysing spatial and temporal patterns in coastal water quality. Ecol. Indic. 11, 103–114. doi: 10.1016/j.ecolind.2009.11.001
Bowers D. G., Harker G. E. L., Stephan B. (1996). Absorption spectra of inorganic particles in the Irish Sea and their relevance to remote sensing of chlorophyll. Int. J. Remote Sens. 17, 2449–2460. doi: 10.1080/01431169608948782
Cai L. N., Bu J., Tang D. L., Zhou M. R., Yao R., Huang S. Y. (2020). Geosynchronous satellite GF-4 observations of chlorophyll-a distribution details in the bohai Sea, China. Sensors 20, 5471. doi: 10.3390/s20195471
Cai L. N., Zhou M. R., Liu J. Q., Tang D. L., Zuo J. (2020). HY-1C observations of the impacts of islands on suspended sediment distribution in zhoushan coastal waters, China. Remote Sens. 12, 1766. doi: 10.3390/rs12111766
Caldeira R. M. A., Sangra P. (2012). Complex geophysical wake flows Madeira archipelago case study. Ocean Dyn. 62, 683–700. doi: 10.1007/s10236-012-0528-6
Cao Y., Lin B. Y. (2000). Tidal characteristics of hangzhou bay. Zhejiang Wat. Cons Hydr. Coll. (in Chinese) 12, 14–16.
Chang N. N., Shiao J. C., Gong G. C. (2012). Diversity of demersal fish in the East China Sea: implication of eutrophication and fishery. Cont. Shelf Res. 47, 42–54. doi: 10.1016/j.csr.2012.06.011
Chen C., Beardsley R. C., Cowles G. (2006). An unstructured grid, finite-volume coastal ocean model (FVCOM) system. Oceanography 19, 78–89. doi: 10.5670/oceanog.2006.92
Chen J., Liu J. L. (2015). The spatial and temporal changes of chlorophyll-a and suspended matter in the eastern coastal zones of China during 1997–2013. Cont. Shelf Res. 95, 89–98. doi: 10.1016/j.csr.2015.01.004
Chen J. Y., Liu C. Z., Zhang C. L., Herndon J. W. (1990). Geomorphological development and sedimentation in qiantang estuary and hangzhou bay. J. Coast. Res. 6, 559–572. doi: 10.2307/4297719
Chen J., Zhang X. H., Quan W. T. (2013). Retrieval chlorophyll-a concentration from coastal waters: three-band semi-analytical algorithms comparison and development. Opt. Express. 21, 9024–9042. doi: 10.1364/oe.21.009024
Dall'Olmo G., Gitelson A. A., Rundquist D. C., Leavitt B., Barrow T., Holz J. C. (2005). Assessing the potential of SeaWiFS and MODIS for estimating chlorophyll concentration in turbid productive waters using red and near-infrared bands. Remote Sens. Environ. 96, 176–187. doi: 10.1016/j.rse.2005.02.007
Deng Z. D., Lu Z., Wang G. Y., Wang D. Q., Ding Z. B., Zhao H. F., et al. (2021). Extraction of fractional vegetation cover in arid desert area based on Chinese GF-6 satellite. Open Geosci. 13, 416–430. doi: 10.1515/geo-2020-0241
Ding Z. X. (1985). Influences of wind on vertical structures of temperature and salinity, and upwelling off zhejiang coast in summer. Chin. J. Oceanol. Limnol. 3, 109–117. doi: 10.1007/bf02852908
Duan H. T., Zhang Y. Z., Zhang B., Song K. S., Wang Z. M. (2007). Assessment of chlorophyll-a concentration and trophic state for lake chagan using landsat TM and field spectral data. Environ. Monit. Assess. 129, 295–308. doi: 10.1007/s10661-006-9362-y
Everett J. D., Baird M. E., Roughan M., Suthers I. M., Doblin M. A. (2014). Relative impact of seasonal and oceanographic drivers on surface chlorophyll a along a western boundary current. Prog. Oceanogr. 120, 340–351. doi: 10.1016/j.pocean.2013.10.016
Fernando D., Tang D. L., Xu H. B. (2018). The propensity of chlorophyll a, sea surface temperature and wind speed in the bay of Bengal. J. nanjing Univ. Inf. Sci. Technol. 10, 334–341. doi: 10.13878/j.cnki.jnuist.2018.03.009
Fu J. Q., Chen C., Chu Y. L. (2019). Spatial–temporal variations of oceanographic parameters in the zhoushan sea area of the East China Sea based on remote sensing datasets. Reg. Stud. Mar. Sci. 28, 100626. doi: 10.1016/j.rsma.2019.100626
Fu Y., Xu S., Zhang C., Sun Y. (2018). Spatial downscaling of MODIS chlorophyll-a using landsat 8 images for complex coastal water monitoring. Estuar. Coast. Shelf Sci. 209, 149–159. doi: 10.1016/j.ecss.2018.05.031
Garbulsky M. F., Filella I., Verger A., Peñuelas J. (2014). Photosynthetic light use efficiency from satellite sensors: From global to Mediterranean vegetation. Environ. Exp. Bot. 103, 3–11. doi: 10.1016/j.envexpbot.2013.10.009
Gianinetto M., Scaioni M. (2008). Automated geometric correction of high-resolution pushbroom satellite data. Photogramm Eng. Remote Sens. 74, 107–116. doi: 10.14358/PERS.74.1.107
Habibullah R., Mubarak, Galib M. (2020). Analysis of yellowfin tuna (Thunnus albacares) fishing ground based on sea surface temperature and chlorophyll-a in the West Sumatra waters. Asian J. Aquat. Sci. 3, 236–247. doi: 10.31258/ajoas.3.3.236-247
Harlan J. A., Swearer S. E., Leben R. R., Fox C. A. (2002). Surface circulation in a Caribbean island wake. Cont. Shelf Res. 22, 417–434. doi: 10.1016/S0278-4343(01)00073-5
Howe J. C. (2003). Artificial reef evaluation: with application to natural marine habitats. Fish. Res. 63, 297–298.
Huang L. G., Fang Y., Zhang D. W., Lin L. S. (2016). Quantitative retrieval of chlorophyll a concentration based on landsat-8 OLI in the lakes. Jiangxi Sci. (in Chinese) 34 441–444, 456. doi: 10.13990/j.issn1001-3679.2016.04.009
Huot Y., Babin M., Bruyant F., Grob C., Twardowski M. S., Claustre H. (2007). Does chlorophyll a provide the best index of phytoplankton biomass for primary productivity studies? Biogeosci. Discuss. 4, 707–745. doi: 10.5194/bgd-4-707-2007
Hu M. N., Zhao C. F. (2007). Long-time observation of upwelling in the zhoushan islands and adjacent seas during the summer season. J. Ocean Univ. China. 37, 235–240. doi: 10.16441/j.cnki.hdxb.2007.s1.043
Jawak S. D., Luis A. J. (2015). A rapid extraction of water body features from Antarctic coastal oasis using very high-resolution satellite remote sensing data. Aquat. Procedia. 4, 125–132. doi: 10.1016/j.aqpro.2015.02.018
Jeffrey S. W., Humphrey G. F. (1975). New spectrophotometric equations for determining chlorophylls a, b, c1 and c2 in higher plants, algae and natural phytoplankton. Biochem. Physiol. Pflanz. 167, 191–194. doi: 10.1016/S0015-3796(17)30778-3
Ji C. X., Zhang Y. Z., Cheng Q. M., Tsou J. Y., Jiang T. C., Liang X. S. (2018). Evaluating the impact of sea surface temperature (SST) on spatial distribution of chlorophyll- a concentration in the East China Sea. Int. J. Appl. Earth Obs. Geoinf. 68, 252–261. doi: 10.1016/j.jag.2018.01.020
Kim H. H., Ko B. C., Nam J. Y. (2016). Predicting chlorophyll-a using landsat 8 OLI sensor data and the non-linear RANSAC method – a case study of nakdong river, south Korea. Int. J. Remote Sens. 37, 3255–3271. doi: 10.1080/01431161.2016.1196839
Kourti N., Shepherd I., Schwartz G., Pavlakis P. (2001). Integrating spaceborne SAR imagery into operational systems for fisheries monitoring. Can. J. Remote. Sens. 27, 291–305. doi: 10.1080/07038992.2001.10854872
Lee Y. J., Matrai P. A., Friedrichs M. A. M., Saba V. S., Antoine D., Ardyna M., et al. (2015). An assessment of phytoplankton primary productivity in the Arctic ocean from satellite ocean color/in situ chlorophyll-a based models. J. Geophys. Res.-Oceans. 120, 6508–6541. doi: 10.1002/2015JC011018
Le C., Hu C., English D., Cannizzaro J., Chen Z., Feng L., et al. (2013). Towards a long-term chlorophyll-a data record in a turbid estuary using MODIS observations. Prog. Oceanogr. 109, 90–103. doi: 10.1016/j.pocean.2012.10.002
Le C. F., Li Y. M., Zha Y., Sun D. Y., Huang C. C., Lu H. (2009). A four-band semi-analytical model for estimating chlorophyll a in highly turbid lakes: the case of taihu lake, China. Remote Sens. Environ. 113, 1175–1182. doi: 10.1016/j.rse.2009.02.005
Lévy M., Ferrari R., Franks P. J. S., Martin A. P., Rivière P. (2012). Bringing physics to life at the submesoscale. Geophys. Res. Lett. 39, 1–13. doi: 10.1029/2012GL052756
Liang J., Wang W. D., Xu H. X., Zhou Y. D., Xu K. D., Zhang H. L., et al. (2020). Diel and seasonal variation in fish communities in the zhongjieshan marine island reef reserve. Fish. Res. 227, 105549. doi: 10.1016/j.fishres.2020.105549
Lin Y., Ye Z. L., Zhang Y., Yu J. (2016). Spectral feature analysis for quantitative estimation of cyanobacteria chlorophyll-a. Int. Arch. photogramm Remote sens. spat. Inf. Sci. XLI-B7, 12–19. doi: 10.5194/isprs-archives-XLI-B7-91-2016
Liu S. F., Liu Y. G., Yang G., Qiao S. Q., Li C. X., Zhu Z. W., et al. (2012). Distribution of major and trace elements in surface sediments of hangzhou bay in China. Acta Oceanol. Sin. 31, 89–100. doi: 10.1007/s13131-012-0223-y
Ma C. F., Jiang X. W., Tang J. W., Wang X. M., Li T. J., Huang H. J., et al. (2005). Inverse algorithms of ocean consitituents for HY-1/CCD broadband data. Haiyang xuebao. (in Chinese), 38–44.
Moses W. J., Gitelson A. A., Berdnikov S., Povazhnyy V. (2009). Satellite estimation of chlorophyll-a concentration using the red and NIR bands of MERIS–the Azov Sea case study. IEEE Geosci. Remote. Sens. Lett. 6, 845–849. doi: 10.1109/lgrs.2009.2026657
Nazeer M., Nichol J. E. (2016). Development and application of a remote sensing-based chlorophyll-a concentration prediction model for complex coastal waters of Hong Kong. J. Hydrol. 532, 80–89. doi: 10.1016/j.jhydrol.2015.11.037
Oliveira P. B., Nolasco R., Dubert J., Moita T., Peliz Á. (2009). Surface temperature, chlorophyll and advection patterns during a summer upwelling event off central Portugal. Cont. Shelf Res. 29, 759–774. doi: 10.1016/j.csr.2008.08.004
Oliver R. L., Mitrovic S. M., Rees C. (2010). Influence of salinity on light conditions and phytoplankton growth in a turbid river. River Res. Appl. 26, 894–903. doi: 10.1002/rra.1309
Pan X., Yang Z., Yng Y. B., Sun Y. X. (2022). Comparison and applicability analysis of methods for extracting cyanobacteria from Lake Taihu based on GF-6 data. J. Lake Sci. 34, 1–12. doi: 10.18307/2022.060
Paulino C., Segura M., Chacón G. (2016). Spatial variability of jumbo flying squid (Dosidicus gigas) fishery related to remotely sensed SST and chlorophyll-a concentration 2004-2012). Fish. Res. 173, 122–127. doi: 10.1016/j.fishres.2015.10.006
Perkins T., Adler-Golden S., Matthew M., Berk A., Anderson G., Gardner J., et al. (2005). “"Retrieval of atmospheric properties from hyper and multispectral imagery with the FLAASH atmospheric correction algorithm,",” in Remote sensing of clouds and the atmosphere X. Eds. Schäfer K., Comerón A. T., Slusser J. R., Picard R. H., Carleer M. R., Sifakis N. (Bruges, Belgium: SPIE Press), 114–124. doi: 10.1117/12.626526
Richardson K., Markager S., Buch E., Lassen M. F., Kristensen A. S. (2005). Seasonal distribution of primary production, phytoplankton biomass and size distribution in the Greenland Sea. Deep Sea Res. Part I Oceanogr. Res. Pap. 52, 979–999. doi: 10.1016/j.dsr.2004.12.005
Ritchie R. J. (2018). Measurement of chlorophylls a and b and bacteriochlorophyll a in organisms from hypereutrophic auxinic waters. J. Appl. Phycol. 30, 3075–3087. doi: 10.1007/s10811-018-1431-4
Sathyendranath S., Prieur L., Morel A. (1989). A three-component model of ocean colour and its application to remote sensing of phytoplankton pigments in coastal waters. Int. J. Remote Sens. 10, 1373–1394. doi: 10.1080/01431168908903974
Shen F., Zhou Y. X., Li D. J., Zhu W. J., Salama M. S. (2010). Medium resolution imaging spectrometer (MERIS) estimation of chlorophyll-a concentration in the turbid sediment-laden waters of the changjiang (Yangtze) estuary. Int. J. Remote Sens. 31, 4635–4650. doi: 10.1080/01431161.2010.485216
Simon N. S. (1989). Nitrogen cycling between sediment and the shallow-water column in the transition zone of the potomac river and estuary. II. the role of wind-driven resuspension and adsorbed ammonium. Estuar. Coast. Shelf Sci. 28, 531–547. doi: 10.1016/0272-7714(89)90028-0
Sun L. F., Chang K. E., Zhaoli X. U., Que J. L., Tian F. G. (2013). The influence of upwelling and water mass on the ecological group distribution of zooplankton in zhejiang coastal waters. Acta Ecol. Sin. 33, 1811–1821. doi: 10.5846/stxb201203090320
Tao F., Zhang Y., Wang J. J., Zhang Y. (2007). Study on quantitative remote sensing models for measuring suspended sediment concentration. Ocean Engineering 25, 96–101. doi: 10.1016/S1001-6058(07)60030-4
Tebbs E. J., Remedios J. J., Harper D. M. (2013). Remote sensing of chlorophyll-a as a measure of cyanobacterial biomass in lake bogoria, a hypertrophic, saline–alkaline, flamingo lake, using landsat ETM+. Remote Sens. Environ. 135, 92–106. doi: 10.1016/j.rse.2013.03.024
Thomson R. E., Gower J. F. R., Bowker N. W. (2009). Vortex streets in the wake of the Aleutian islands. Monthly Weather Review. 105, 873. doi: 10.1175/1520-0493(1977)105<0873:VSITWO>2.0.CO;2
Tilstone G. H., Angel-Benavides I. M., Pradhan Y., Shutler J. D., Groom S., Sathyendranath S. (2011). An assessment of chlorophyll-a algorithms available for SeaWiFS in coastal and open areas of the bay of Bengal and Arabian Sea. Remote Sens. Environ. 115, 2277–2291. doi: 10.1016/j.rse.2011.04.028
Tzortziou M., Subramaniam A., Herman J. R., Gallegos C. L., Neale P. J., Harding L. W. (2007). Remote sensing reflectance and inherent optical properties in the mid Chesapeake bay. Estuar. Coast. Shelf Sci. 72, 16–32. doi: 10.1016/j.ecss.2006.09.018
Wang Y. Z., Liu G., Xue B., Guo L., Zhang X. L. (2021). “"Evaluation of fusion methods for GF-6 aiming to water body observation,",” in 2021 3rd international conference on geoscience and environmental chemistry (United Kingdom: EDP Sciences Press), 2–9. doi: 10.1051/e3sconf/202129002009
Wang X. L., Wang B. D., Zhang C. S., Shi X. Y., Zhu C. J., Xie L. P., et al. (2008). Nutrient composition and distributions in coastal waters impacted by the changjiang plume. Acta Oceanol. Sin. 27, 111–125. doi: 10.13140/2.1.3884.6080
Wolanski E., Hamner W. M. (1988). Topographically controlled fronts in the ocean and their biological influence. Science 241, 177–181. doi: 10.1126/science.241.4862.177
Xia T., He Z., Cai Z. W., Wang C., Wang W. J., Wang J. Y., et al. (2022). Exploring the potential of Chinese GF-6 images for crop mapping in regions with complex agricultural landscapes. Int. J. Appl. Earth Obs. Geoinf. 107, 102702. doi: 10.1016/j.jag.2022.102702
Xu Y., Nieto K., Teo S. L. H., McClatchie S., Holmes J. (2017). Influence of fronts on the spatial distribution of albacore tuna (Thunnus alalunga) in the northeast pacific over the past 30 years 1982-2011). Prog. Oceanogr. 150, 72–78. doi: 10.1016/j.pocean.2015.04.013
Xu L. J., Yang D. Z., Greenwood J., Feng X. R., Gao G. D., Qi J. F., et al. (2020). Riverine and oceanic nutrients govern different algal bloom domain near the changjiang estuary in summer. J. Geophys. Res. Biogeosci. 125, e2020JG005727. doi: 10.1029/2020JG005727
Yang A., Zhong B., Hu L., Wu S., Xu Z., Wu H., et al. (2020). Radiometric cross-calibration of the wide field view camera onboard GaoFen-6 in multispectral bands. Remote Sens. 12, 1037. doi: 10.3390/rs12061037
Zawadzki J., Kedzior M. (2016). Soil moisture variability over odra watershed: comparison between SMOS and GLDAS data. Int. J. Appl. Earth Obs. Geoinf. 45, 110–124. doi: 10.1016/j.jag.2015.03.005
Zhai Z. K., Lu S. L., Wang P., Wang C., Tang H. L., Liu D. Y., et al. (2021). “"Ocean chlorophyll-a retrieval using GF1-WFV data-a case study of the central bohai sea,",” in The 2nd international conference on advances in civil and ecological engineering research (USA: IOP Press), 12–21. doi: 10.1088/1755-1315/626/1/012021
Zhou Y. D., Li S. F. (2018). “"the main economic species in East China Sea three channels,",” in The main economic species in East China Sea three channels and a protection zone atlas. Eds. Yu C. G., Xu K. D., Zhang H. L. (Beijing China: China Ocean Press), 44–69.
Zhu J. P., Hu H. M., Gu B. Q., Yu B. C., Li T. J., Zhang Y. Y., et al. (2014). The content of chlorophyll a in Dongji Islands Sea area and its correlation analysis with environmental factors. J. Zhejiang Ocean Univ. (Nat. Sci.). In Chin. 33, 257–261,271.
Zhu W., Pang S., Chen J., Sun N., Huang L., Zhang Y., et al. (2020). Spatiotemporal variations of total suspended matter in complex archipelagic regions using a sigmoid model and landsat-8 imagery. Reg. Stud. Mar. Sci. 36, 101308. doi: 10.1016/j.rsma.2020.101308
Keywords: Gaofen-6, chlorophyll a, fish egg, larvae, Zhoushan archipelago
Citation: Cai L, Tang R, Yan X, Zhou Y, Jiang J and Yu M (2022) The spatial-temporal consistency of chlorophyll-a and fishery resources in the water of the Zhoushan archipelago revealed by high resolution remote sensing. Front. Mar. Sci. 9:1022375. doi: 10.3389/fmars.2022.1022375
Received: 18 August 2022; Accepted: 26 September 2022;
Published: 11 October 2022.
Edited by:
Jose Luis Iriarte, Austral University of Chile, ChileReviewed by:
July Andrea Corredor Acosta, University of Concepción, ChileCopyright © 2022 Cai, Tang, Yan, Zhou, Jiang and Yu. This is an open-access article distributed under the terms of the Creative Commons Attribution License (CC BY). The use, distribution or reproduction in other forums is permitted, provided the original author(s) and the copyright owner(s) are credited and that the original publication in this journal is cited, in accordance with accepted academic practice. No use, distribution or reproduction is permitted which does not comply with these terms.
*Correspondence: Xiaojun Yan, eWFueGpAempvdS5lZHUuY24=
Disclaimer: All claims expressed in this article are solely those of the authors and do not necessarily represent those of their affiliated organizations, or those of the publisher, the editors and the reviewers. Any product that may be evaluated in this article or claim that may be made by its manufacturer is not guaranteed or endorsed by the publisher.
Research integrity at Frontiers
Learn more about the work of our research integrity team to safeguard the quality of each article we publish.