 Yutaka Okumura
 Yoshio Masuda2
 Minenosuke Matsutani
- 1Fisheries Resource Institute/Fisheries Technology Institute, Japan Fisheries Research and Education Agency, Shiogama, Japan
- 2Miyagi Prefecture Fisheries Technology Institute, Ishinomaki, Japan
- 3NODAI Genome Research Center, Tokyo University of Agriculture, Tokyo, Japan
- 4Faculty of Bioindustry, Tokyo University of Agriculture, Abashiri, Japan
The northeastern coast of Japan suffered a massive tsunami in 2011, a natural disaster which ‘reset’ the coastal ecosystem when it destroyed much of the original sealife and scoured the seabed. This has presented an opportunity to learn more about the load on coastal ecosystems exerted by human exploitation such as aquaculture rafts and areas of anchored and float-suspended ropes. We surveyed the coastal environment in Matsushima Bay for approximately four years following the year after the occurrence of the 2011 tsunami. Phytoplankton abundance increased with increasing water temperature. Nutrient concentrations were high at the exit of a small branch of the Ofuna-iri Canal (entering the southwestern inner part of the bay at Shiogama) but no significant differences in nutrient concentrations were observed at other stations, so it is considered that the aquaculture installations in Matsushima Bay currently have no significant effect on observed nutrient concentrations. The composition of eukaryotes in the surface seawater varied with the year and the season, but there were no clear differences between sampling stations. The lack of any differences in nutrient concentrations or eukaryote assemblages between areas with or without aquaculture installations is considered to be a result of efficient seawater exchange, despite the presence of many small islets separating Matsushima Bay from the open ocean. In addition, the aquaculture installations at present number less than half of the maximum number before the tsunami, so the bay is by no means overexploited by aquaculture. It is concluded that the current aquaculture installations have no major negative impact on the environment in Matsushima Bay.
1. Introduction
Matsushima Bay is a small sheltered region of Sendai Bay, just northwest of Sendai in northeastern Honshu, Japan (Figure 1). The area ranges from 35 km2 to about 50 km2 with a maximum depth of 4 to 5 m (Watanabe 1977, Ota et al., 2019). It is the site of many rafts for oyster (Crassostrea gigas) cultivation (Ito and Oshino, 2018), and rope-based installations for cultivation of seaweeds such as wakame (Undaria pinnatifida) and konbu (Saccharina japonica) (Nagaki et al., 2015). These installations comprise natural- or non-feeding aquaculture. Oysters feed themselves by filtering seawater to remove phytoplankton (Akashige et al., 2005), and seaweeds compete with phytoplankton to use nutrients in seawater as they grow (Nagaki et al., 2015; Yoshida et al., 2011). The periphyton attached to the surfaces of oyster shells, ropes, and aquaculture installations also filters seawater and removes phytoplankton (Ciavatta et al., 2020). In addition, larvae derived from shellfish and the periphyton are periodically present in the seawater (Kakehi et al., 2016; Ciavatta et al., 2020).
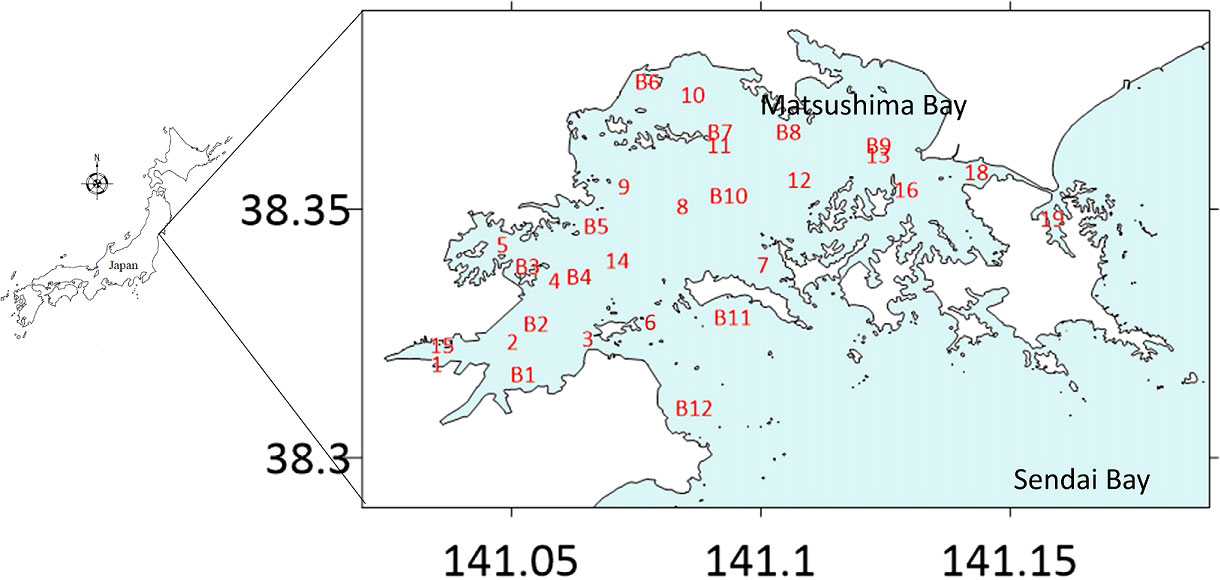
Figure 1 Sampling stations in Matsushima Bay (enlarged map, with the position of Matsushima Bay indicated on a smaller-scale map of Japan at left). Large numerals in black are longitude and latitude coordinates. Alphanumerics in red indicate the position of individual sampling stations. Matsushima Bay is roughly divided into areas of seaweed cultivation (Stn. 2 to Stn. 4), areas free of cultivation (Stn. 1, Stn. 15 to Stn. 2 and Stn. 6), and oyster cultivation (other stations). Stn. 1 (at Shiogama, at the southwestern edge of Matsushima Bay) is at the entrance to the bay from a small branch of Ofuna-iri Canal (the southern portion of the Teizan Canal system, which runs parallel to the coast of Sendai Bay a few hundred metres inland). Stations 13 and B9 are the closest to the entrance to Tona Canal (the northeastern continuation of the canal system which connects with the Naruse River before continuing as the Kitakami Canal to Ishinomaki). Investigations for 2004 to 2005 were conducted at stations B1 to B12.
Aquaculture installations may affect the abundance and the composition of the eukaryote assemblages in seawater, and sheltered bays can be affected easily by anthropogenic sources such as the inflow of water from sewage treatment plants (Okumura et al., 2021a), as well as inflows from rivers during heavy rainfall (Kakehi et al., 2020). Major nutrients include dissolved inorganic nitrogen (DIN) and dissolve inorganic phosphate (DIP) in river water (Officer and Ryther, 1980), and DIN contained in the effluent from wastewater plants (Okumura et al., 2021a). Silica is supplied to the coast by rivers (Officer and Ryther, 1980; Taniuchi et al., 2017).
Both anthropogenic and natural nutrient input can affect phytoplankton growth, since phytoplankton organisms absorb nitrogen (N) and phosphorus (P) for growth, and in addition diatoms require silicate (Si) for frustule formation (Treguer et al., 1995). If nutrient loading is excessive, eutrophication results (Breitburg et al., 2018), and if the balance between N, P and Si is disrupted, phytoplankton composition changes (Officer and Ryther, 1980). Also, eutrophication causes anoxia (Breitburg et al., 2018), and an imbalance of nutrient concentrations leads to an increase in the presence of phytoplankton communities unsuitable for aquaculture (Officer and Ryther, 1980). To ensure that natural- and non-feeding aquaculture are sustainable, it is necessary to avoid overexploitation by overcrowding, which leads to poor growth due to a reduction in available feed and nutrients, extended time for successful cultivation, and culture products of poor quality. Therefore, if the number of aquaculture facilities is properly managed, the effects of eutrophication or problems with the reduced availability of natural feed organisms can be minimized. In this study, we investigated whether the oyster and seaweed culture facilities have an impact on the marine environment and eukaryote assemblages in Matsushima Bay, and the significance of the impact of culture facilities compared with other anthropogenic influences and the natural environment.
Matsushima Bay is located within a region severely affected by the 2011 Great East Japan Earthquake and tsunami. Since it is a sheltered bay protected from the open sea by numerous small islets, the tsunami height in Matsushima Bay was lower than outside the bay (Nagashima et al., 2016; Ota et al., 2019). Even so, the tsunami destroyed almost all of the aquaculture installations in the bay and the environment related to natural- and non-feeding aquaculture was ‘reset’. Outside Matsushima Bay, the broader effects of the tsunami on phytoplankton have been investigated in Sendai Bay: there were apparently no tsunami effects on phytoplankton phenology (Taniuchi et al., 2017) or diatom assemblages (Watanabe et al., 2017) but toxic dinoflagellate species increased after the disaster (Kamiyama et al., 2014; Masuda et al., 2014; Ishikawa et al., 2015), because of easy cyst germination after redeposition of cysts to the seafloor surface following seafloor disturbance by the tsunami. It has been reported that the environment of the seafloor in Matsushima Bay has improved after the tsunami (Oota et al., 2017; Ota et al., 2019), and that deterioration of the functioning of a sewage treatment plant had an unexpectedly small impact (Okumura et al., 2021a). However, there have been few reports concerning phytoplankton other than diatoms and dinoflagellates, microbial assemblages other than phytoplankton, and or the minor phyla.
In Matsushima Bay, a mass mortality of oysters occurred in 2013, which apparently was caused by the oysters being covered with periphyton to which suspended matter was attached, reducing oxygen availability and resulting in death of the oysters (Ito and Oshino, 2018). It is important to understand whether the amount of periphyton increased dramatically due to post-tsunami effects, or was at the same level as before the tsunami, but unfortunately there were no data available on this prior to 2011. In recent years, the development of next-generation sequencing (NGS) has enabled study of a wide range of organisms, from bacteria and other microorganisms to fish (De Vargas et al., 2015; Miya et al., 2015; Nimnoi and Pongsilp, 2020). If appropriate samples have been preserved over the study period required, it is possible to use NGS retrospectively to investigate fluctuations in periphyton organisms.
The present study makes use of samples preserved from environmental and eukaryotes surveys that were conducted in Matsushima Bay over a two-year period a few years before the tsunami. These samples enable comparison with samples taken after the tsunami, from which it is possible to investigate the effects of the presence versus absence of aquaculture installations on the environment and on the eukaryote composition.
2. Materials and methods
2.1. Measurements
The samples used in this study were obtained from Matsushima Bay from 2004 to 2005 (12 stations, B1 to B12), and from 2012 to 2016 (18 stations, non-prefixed numbers; Figure 1). Surface seawater samples were collected with a bucket and analyzed for nutrient concentrations as reported previously (Okumura et al., 2021a). Seawater was also filtered to obtain DNA samples for sequencing and pigment analysis (although no pigment analysis was possible for the 2004 to 2005 samples). Since 2012, salinity, water temperature, dissolved oxygen (DO), and pH have been measured routinely using a Conductivity, Temperature, and Depth (CTD) profiler (RINKO-Profiler, JFE-Advantech, Hyogo, Japan). Water clarity was measured routinely using Secchi Disk depth. The data on salinity and water temperature for the 16 post-tsunami stations have been published already (Okumura et al., 2021a).
2.2. Pigment analyses
The variations in phytoplankton abundance per taxon were approximated by determining seawater pigment composition. Samples (150 ml) of seawater were filtered through Whatman GF/F glass microfiber filters (GE Healthcare UK Ltd., Buckinghamshire, England). Phytoplankton pigments were extracted from the filter with 1 ml methanol at -18°C for at least one day. The methanol-soluble fraction was centrifuged at 17,000 × g for 10 min, and the supernatant was subjected to pigment analysis by high performance liquid chromatography (HPLC; Shimadzu, Kyoto, Japan) using the method of Zapata et al. (Zapata et al., 2000), with the additional insertion of an HPLC guard column before the analytical column. The HPLC system included the following components: auto injector (SIL-10ADvp), degasser (DGU-14A), low pressure gradient unit (FCV-10ALvp), pump (LC-20AD), column oven (CTO-20AC), diode array detector (SPD-M10Avp), fluorescence detector (RF-10AXL), and a communication bus module (CBM-20A). It was controlled by Class-vp software (Shimadzu, Kyoto, Japan).
2.3. DNA sequencing of 18S rDNA by Miseq DNA sequencer and data analysis
To understand the composition of eukaryotic organisms in the seawater in Matsushima Bay and compare them before and after the earthquake, DNA sequencing was conducted on 18SrRNA genes isolated from seawater. Samples (500 ml) of seawater were filtered through a 0.45µm PVDF Durapore membrane filter (Merck, Darmstadt, Germany) and DNA was extracted using 1mL SNET-Cl buffer (20mM Tris•HCl(pH 8.0), 5 mM EDTA, 0.3% SDS; Shimadzu Corporation, (2019)) containing 200 μg/mL proteinase K (final concentration), vortexed and then incubated at 55°C for 2 h and then at 90°C for 10 min. After the filter was removed from the lysis buffer, the liquid phase containing nucleic acids was separated by centrifugation at 17,000 × g for 10 min. The supernatant from each sample was used as a PCR template. The PCR enzyme was KOD FX of DNA polymerase (Toyobo, Osaka, Japan) (TOYOBO, 2019). The primer pair was TAReuk454FWD1 and TAReukREV3 (Stoeck et al., 2010), with an adapter attached outside of the primer for analysis by Miseq (Illumina, California, U.S.A.). All procedures, such as the PCR reaction, treatment of amplicons, DNA sequencing, and data analysis, were performed as reported previously (Okumura et al., 2021b).
2.4. Changes in aquaculture production and the number of aquaculture facilities
To estimate the number of aquaculture facilities in Matsushima Bay, we examined the amounts of oyster, wakame seaweed, and kelp cultivated in each survey year and the number of aquaculture facilities after the earthquake. Cultivation volumes for each organism were aggregated from statistical data (https://www.maff.go.jp/j/tokei/kouhyou/kaimen_gyosei/index.html). The production volume of wakame in Shiogama (near Matsushima Bay) after the earthquake was not available from data provided by the Ministry of Agriculture, Forestry and Fisheries, Japan (MAFF), so we used data provided by the fishery cooperatives.
The number of aquaculture installations for oyster, wakame and konbu was counted based on information provided by the fishing cooperatives of Matsushima Bay.
Annual statistical data in Japan are often published for the financial year period from April to March of the following year, rather than as a complete calendar year from January to December. The data reported here therefore range from April of year ‘n’ to March of year ‘n+1’. The members of some fishing cooperatives used aquaculture rope lengths of 3.9 m up to 2012, but increased the length to 4.5 m after 2013. The rope length was longer, and as a result, the number of aquaculture installations decreased after 2013. In order to make valid comparisons of the amount of aquaculture conducted across the years 2011 to 2017, the number of installations before 2012 was converted to the equivalent of the number of installations for 2012 by multiplying by 3.9/4.5. Data from 2004 to 2005 is not available because records had already been discarded by the fishery cooperatives.
2.5. Statistical analyses
To understand the influence of sampling sites on environmental factors, multiple comparisons were performed using EZR ver. 1.54 (a GUI-based addition to the ‘R’ package; (Kanda, 2013) to test for differences of environment among sampling stations. All data for dissolved inorganic nitrogen (NH4-N, NO3+NO2-N), dissolved inorganic phosphate (DIP), DO, and chlorophyll a (Chl a) concentration were aggregated by station. Multiple comparisons by the nonparametric Kruskal-Wallis test of Steel-Dwass were then performed to make comparisons among three or more groups.
To understand the influence of environmental factors on phytoplankton abundance, the major pigment concentrations and environmental parameters (nutrients NH4-N, NO3+NO2-N, DIP, DO and pH) were subjected to Redundancy Analysis (RDA) using Canoco 5 (ter Braak and Šmilauer, 2018). The pigment concentrations used were Chl a, Chl b, Fucoxanthin (Fuco) and Peridinin (Perid). The concentrations of the four pigments in each sample were entered into Canoco 5 as “samples” items, and the environmental data (NH4-N, NO3+NO2-N, DIP, DO and pH) in each sample were entered as “environment” items.
To assess the yearly, monthly and station variation in diversity of eukaryotes in the seawater samples, non-metric multi-dimensional scaling (MDS) was performed using Primer 6 (Quest Research Ltd., Massey University, Auckland, New Zealand) according to the provider’s manual. MDS proceeded in the following order: data transformation to fourth roots; Bray-Curtis matrix similarity; cluster of group average; and finally MDS. To compare the composition of eukaryotes by year, the ratio of all data obtained by NGS were analyzed by MDS. As the eukaryote composition from 2004 to 2005 was largely different from those after 2012, only data after 2012 were used in the MDS comparison by month and station.
3. Results
3.1. Changes in aquaculture volumes and number of aquaculture facilities
After the earthquake, production figures for oyster and konbu were less than half of pre-earthquake levels, while wakame production increased (Table 1). Oyster production exceeded 1,000 t in 2005, but was halved to approximately 350 t in 2016. Konbu production exceeded 400 t before the earthquake, but was only approximately 100 t at most after the earthquake, although accurate data for 2012 and 2013 are not available due to the post-disaster confusion. Wakame production increased after the earthquake compared to pre-disaster values. In particular, production in 2012 exceeded 600 t, and was more than seven times the pre-disaster level of approximately 80 t. Wakame production declined to around 100 t after 2013.
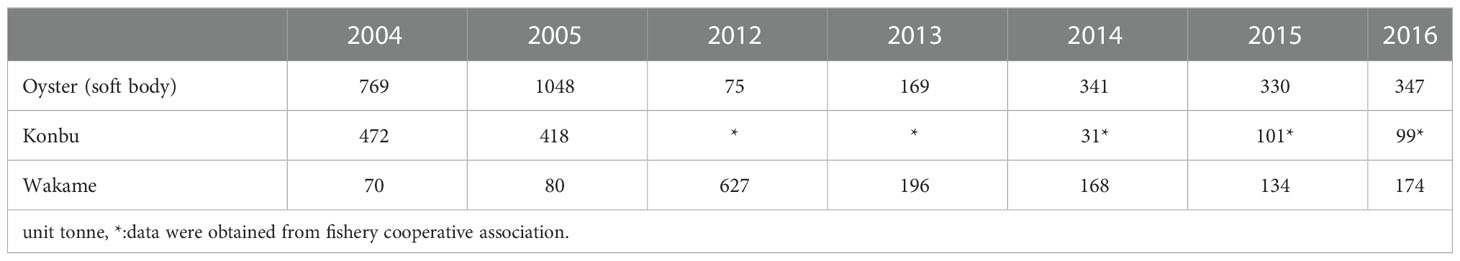
Table 1 Harvest in Matsushima Bay.
The numbers of aquaculture facilities from April 2012 to March 2016 are displayed in Table 2. The mean number of each type of installation was 744 oyster rafts, 1724 wakame ropes, and 100 konbu ropes. There were more konbu installations in 2012: approximately 150 (more than 40 more than in any other year).
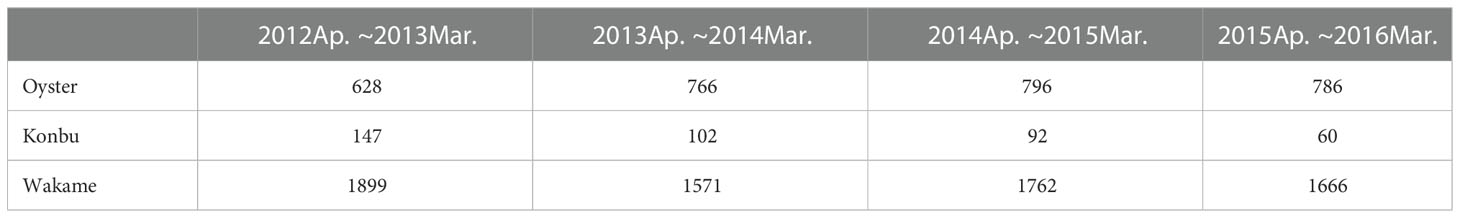
Table 2 The number of aquaculture installations in Matsushima Bay.
3.2. Seasonal changes of water temperature, salinity, phytoplankton pigment content, nutrients, and water clarity
To understand the effect of the environment on phytoplankton communities in Matsushima Bay, mean monthly values (± S.D.) of environmental parameters in surface seawater were compared (Figure 2). The monthly mean water temperature in Matsushima Bay ranged from 3.2°C to 29.9°C, with annual fluctuations of more than 20°C (Figure 2A). The temperature exceeded 20°C from June to October in 2012-2014 and from June to September in 2015. The monthly mean of salinity ranged from 20.2 PSU to 32.5 PSU: salinity declined during the summer to below 30 PSU from June to August 2012, July to October 2013, April to September 2014, May 2015, and July to September 2015. Water temperatures 0.5 m above the seabed tended to be higher than those at the surface during winter, and lower during summer (Supplemental Figure 1A). Salinity 0.5 m above the seabed tended to be higher than at the surface (Supplemental Figure 1A).
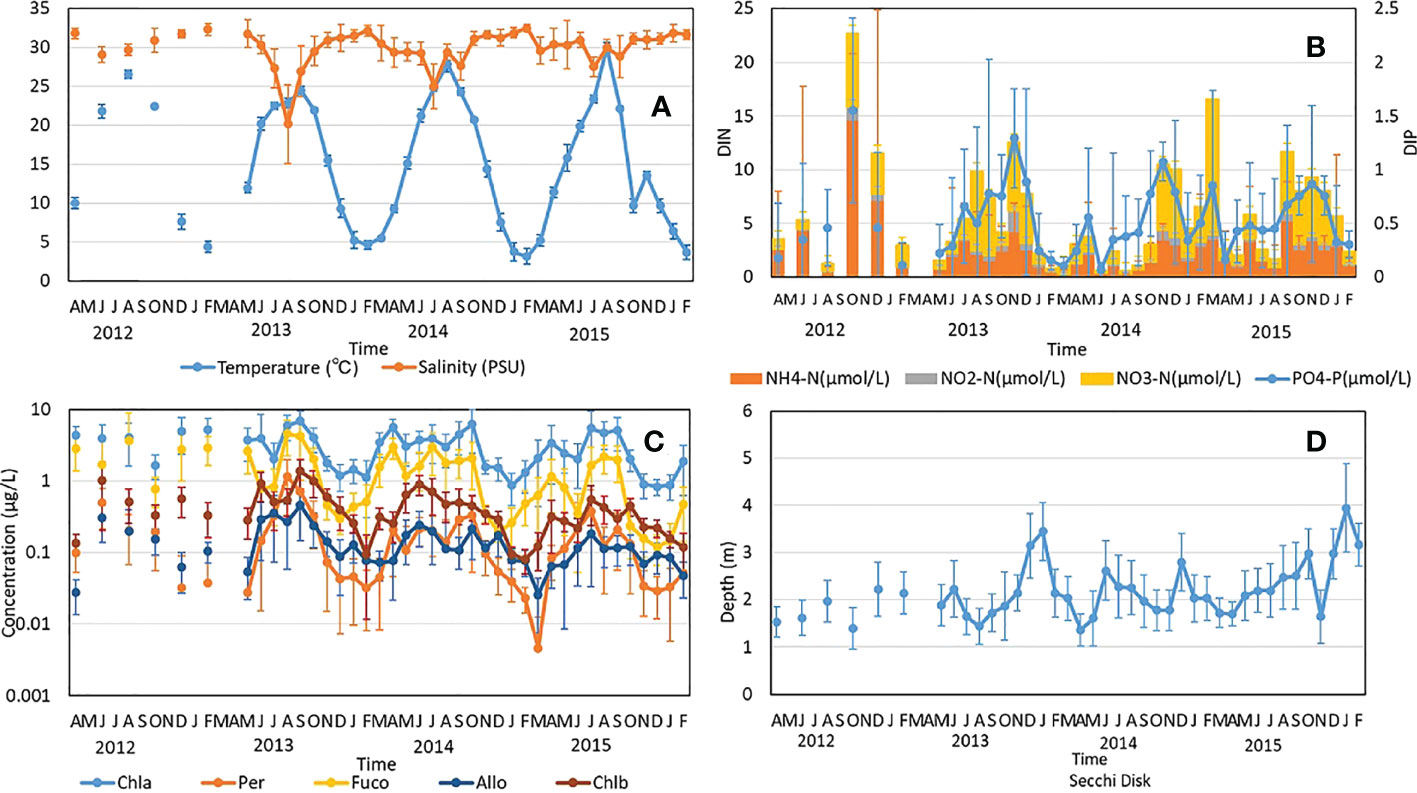
Figure 2 Monthly fluctuations in environmental parameters and pigment concentrations from April, 2012 to Feb., 2016. (A) Sea surface temperature and salinity. (B) Inorganic nitrogen-containing compounds and phosphate. (C) Pigment concentrations (see text for key to abbreviations). (D) Secchi Disk depth.
The monthly mean of dissolved inorganic nitrogen (DIN) and dissolved inorganic phosphorus (DIP) ranged from 0.56 to 22.68 µM, and 0.06 to 1.55 μM, respectively (Figure 2B). DIN and DIP tended to be high in the autumn.
Concerning pigment concentrations, the monthly mean for Chl a tended to be lower from autumn to winter, when water temperatures were lower, and ranged from 0.83 to 6.9 µg/L (Figure 2C). For the periods in October 2012, from November 2013 to February 2014, from November 2014 to February 2015, and from November 2015 to February 2016, mean monthly Chl a was below 2 µg/L. The trend of variation in Chl a was similar to that of other pigments. In particular, there was higher correlation between Fuco and Chl a (correlation r2 = 0.81), than the other pigments measured (for Peridinin, Alloxanthin, and Chl b; r2 = 0.44, 0.57, and 0.67, respectively; Supplemental Figure 2). The monthly mean of water clarity (as measured by Secchi disc) ranged from 1.4 to 4 m, and tended to be clearer during autumn and winter, when Chl a levels were low (Figure 2D).
Although pigment concentrations changed with environmental parameters, and were particularly influenced by water temperature in Matsushima Bay, RDA (Figure 3) reveals that changes of pigment concentrations (measures of total photosynthetic tissue present) were positively related to temperature and negatively related to salinity, nutrient concentrations, Secchi disk reading (indicator of seawater turbidity), DO and pH. The magnitude of the water-temperature vector was the largest among the environmental parameters.
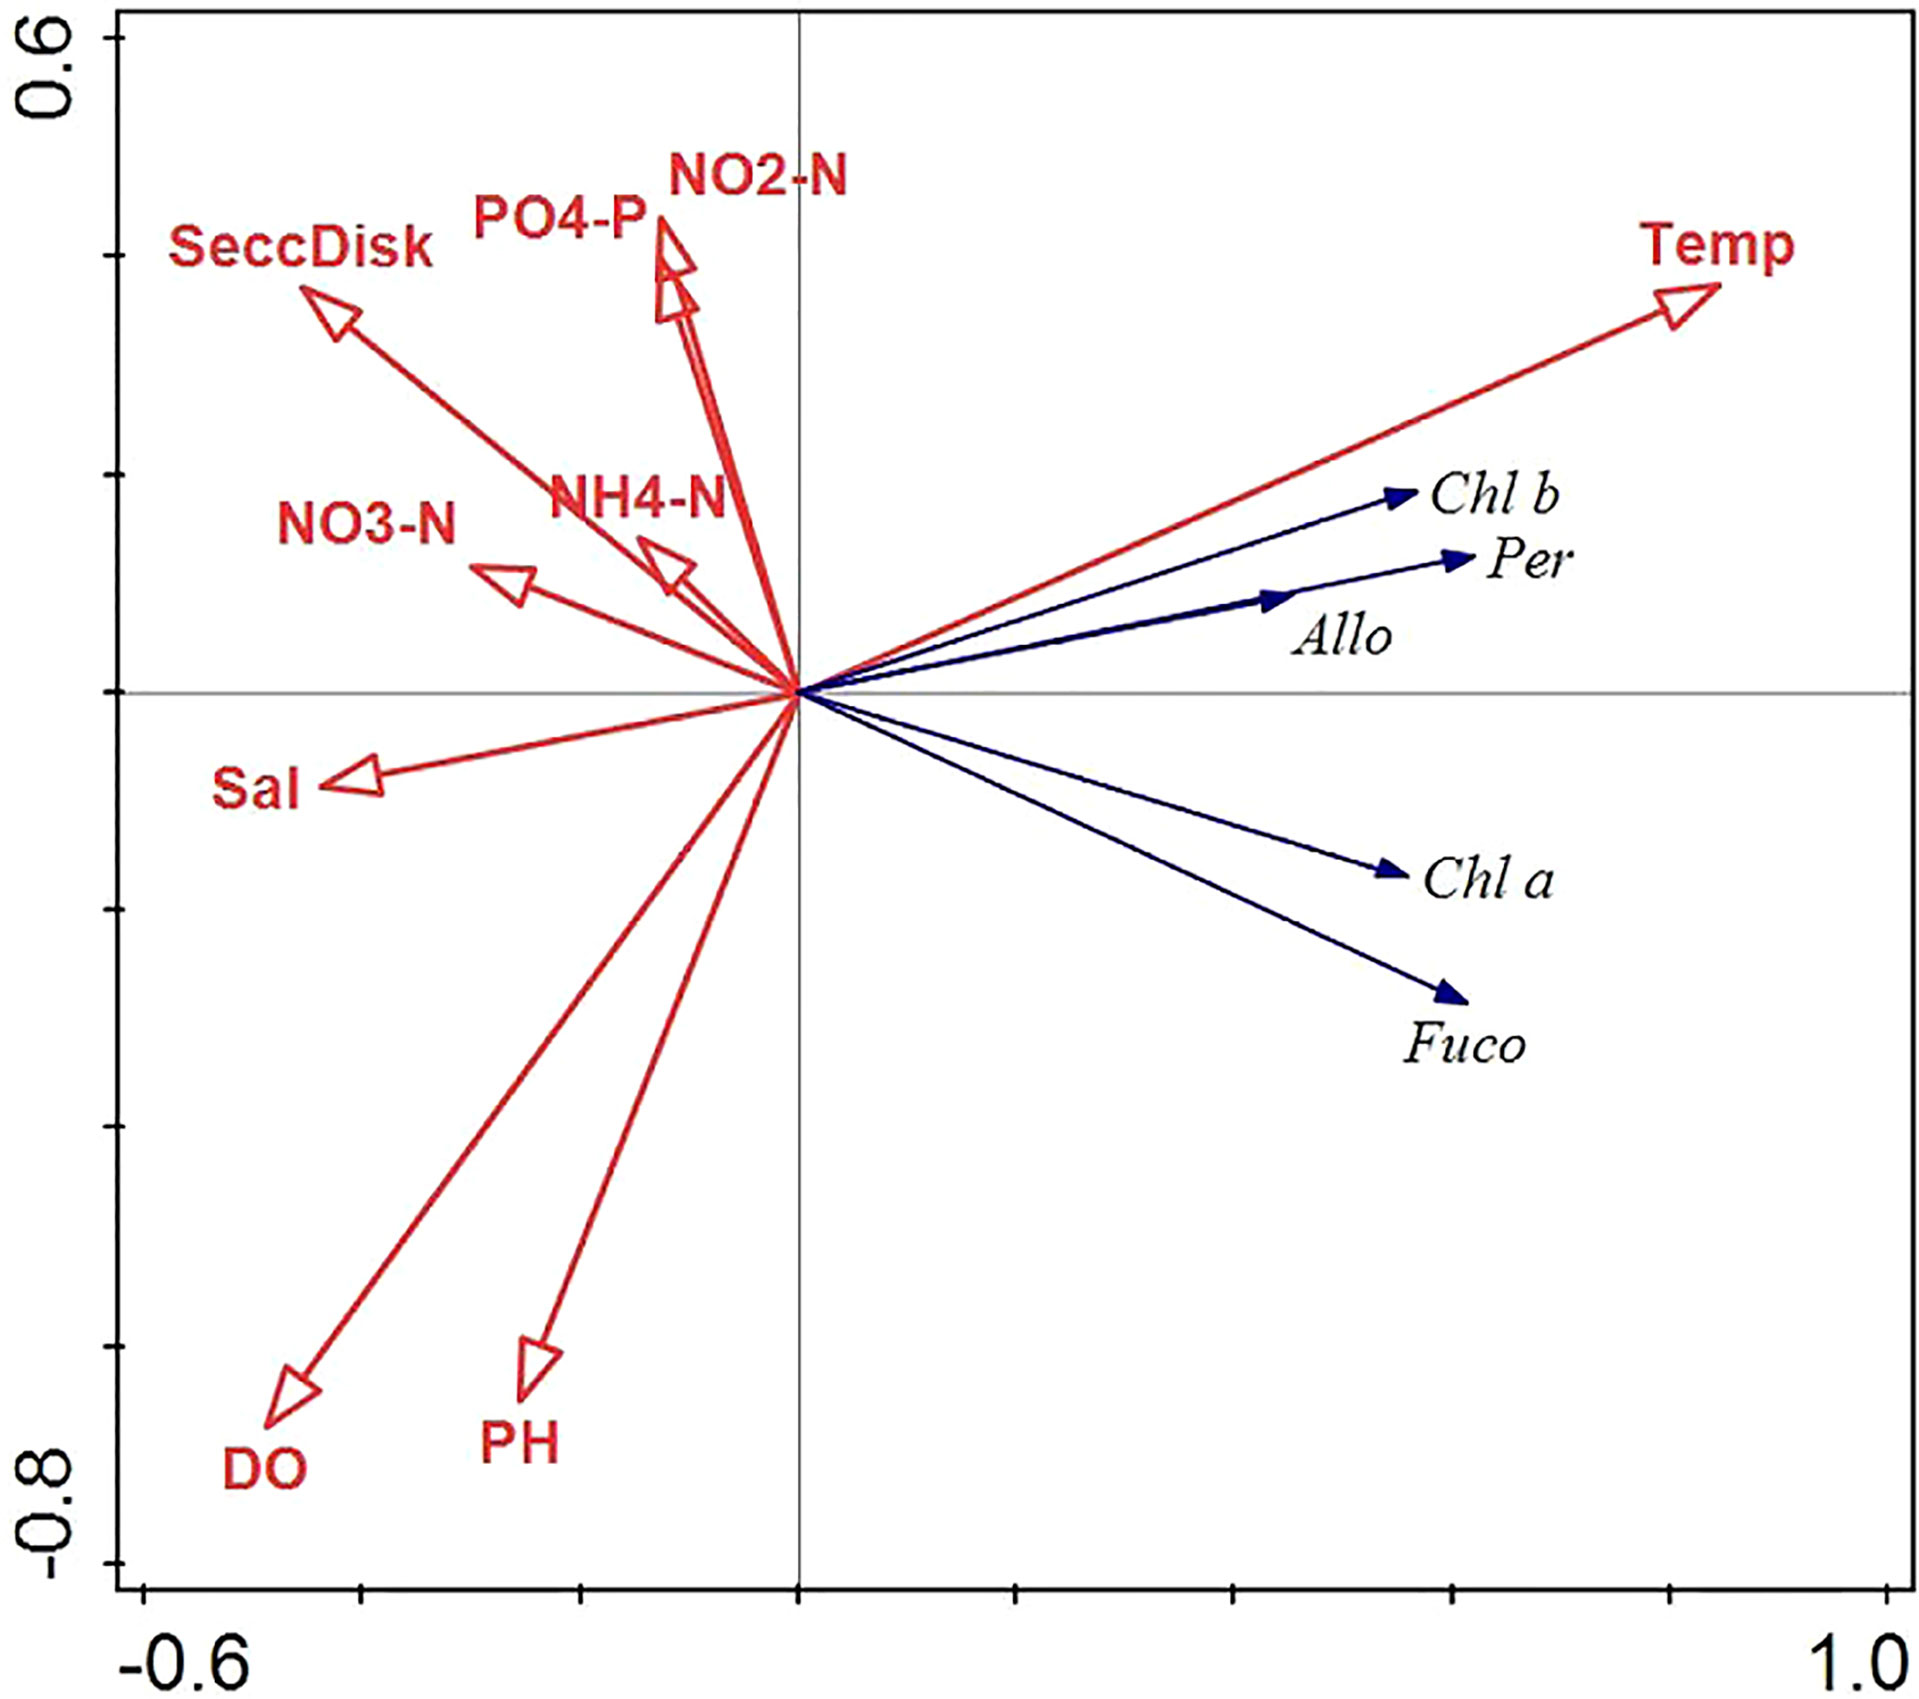
Figure 3 Biplot. Redundancy Analysis loading plot of the influence of environmental factors on phytoplankton abundance. Sal, salinity); DO, dissolved oxygen. Nutrients are represented by measurements of PO4-P, NH4-N, NO2-N and NO3-N. Secchi Disk, Secchi disk depth measure of water clarity.
3.3. The composition of eukaryotes as indicated by 18S rRNA genes
The occurrence of eukaryotes classified according to the Silva database showed the following order of abundance (expressed as mean frequency of occurrence for all periods measured): SAR supergroup (0.63) > Archaeplastida (0.14) > Opisthokonta (0.13) > Cryptophyceae (0.08), and these four taxa accounted for 98% of the total (Figure 4). The SAR monthly means of all stations fluctuated between 0.3 and 0.89, tending to decrease in winter, such as in December 2013, December 2014, and December 2015, except for June 2013. In these periods, Chl a and Fuco concentrations also decreased (Figure 2B). In 2005 (before the earthquake), the mean SAR was 0.64 and the pigment compositions resembled those after the earthquake (Figure 4). However, in 2004, SAR (0.44) and Opisthokonta (0.40) were present in similar amounts, while the occurrence of eukaryotes differed compared to other years.
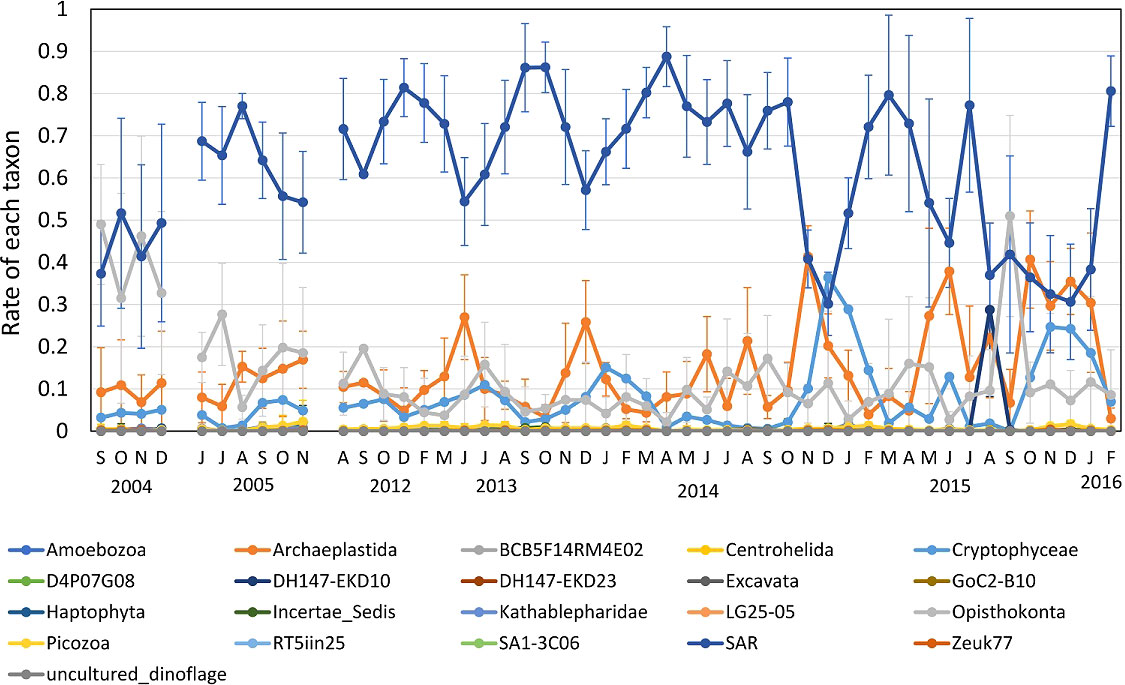
Figure 4 18S rRNA gene composition in surface seawater analyzed by NGS. Classification follows the Silva Database.
The monthly mean frequency of Archaeplastida fluctuated between 0.03 and 0.41, tending to increase during periods when SAR organisms were relatively scarce. The monthly means for Opisthokonta varied between 0.02 and 0.51, with particularly high occurrence (mean 0.40) in 2004. The occurrence of Cryptophyceae varied from almost zero to 0.36, and increased when SAR organisms were relatively scarce, as also with Archaeplastida.
The taxa detected were mostly phytoplankton, ciliates and zooplankton. Among the SAR taxa, Alveolata and Straminopila accounted for a large proportion (with fewer Rhizaria), with means for the entire period of 48% and 42%, respectively (Figure 5A). Within the Alveolata, Dinoflagellata formed the largest proportion, followed by Ciliophora (= ciliates)(Supplemental Figure 3). Within the Straminopila, the commonest were the Bacillariophyceae (= diatoms). Among the Archaeplastida (Rhodophyceae and Chlorophyceae), Chlorophyceae were dominant at more than 90% (Figure 5B, Supplemental Figure 4). Except for the ciliates, almost all the four major taxa were phytoplankton. Among the Opisthokonta, the bryozoan Alcyonidium (Metazoa) was associated with aquaculture rafts and was dominant in 2004; and members of the crustacean group Maxillopoda were the dominant metazoans throughout the period (Figure 5C, Supplemental Figure 5).
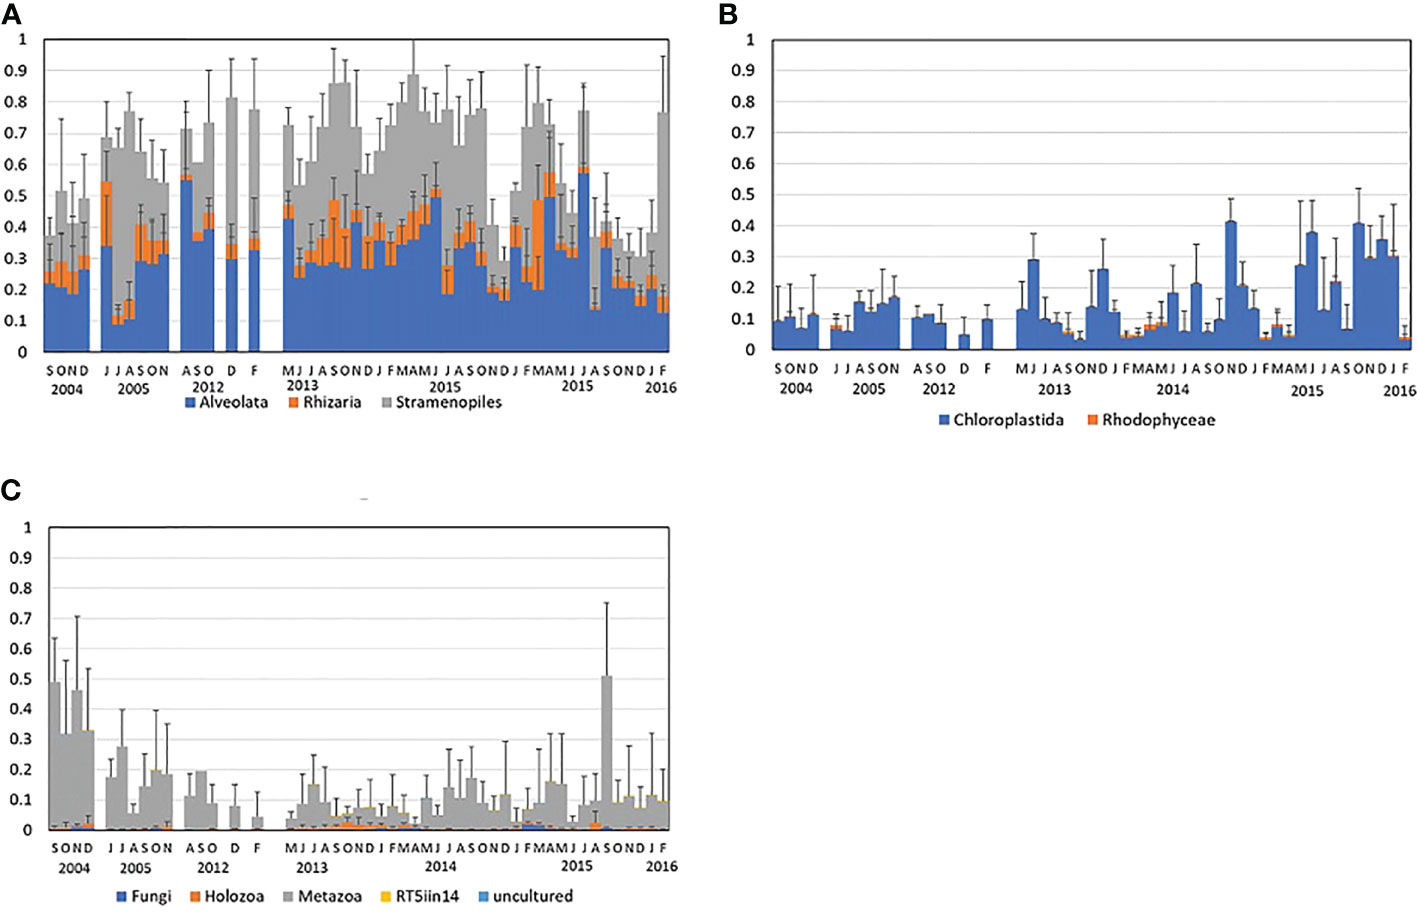
Figure 5 Periodic mean relative composition of the three components of (A) the SAR supergroup for Sept. 2004 to Nov. 2005, and for Aug. 2012 to Feb. 2016; (B) the Chloroplastida and Rhodophyceae; and (C) the Fungi, Holozoa, and Metazoa. The original data is the same as in Figure 5. All classification follows the Silva Database.
3.4. Horizontal distribution of environmental parameters
Chl a and nutrient concentrations at some stations showed significant differences from those at others, while DO was fairly consistent across all stations (Figure 6). The medians of Chl a ranged from 1.1 to 3.9 µg/L, and the concentration showed a three-fold difference among stations (Figure 6A). Chl a at Stn. 19, at the eastern end of the bay (Figure 1), was significantly lower than at the other stations. Chl a in Stns. 2 and 15 (at the western and eastern inner parts of the bay, respectively) appear to be at higher concentrations than the other stations, but the differences were not significant. The median of monthly values of DO ranged from 7.9 to 9.6 mg/L (Figure 6B). DO at Stn. 1, at the mouth of a small branch off the Ofuna-iri Canal, appears to be lower than at the other stations, but there were no significant differences among the stations. The medians of PO4-P (Figure 6C), NH4-N (Figure 6D), and NO2+NO3 (Figure 6E) ranged from 0.19 to 2.16 µM, 0.21 to 10.28 µM, and 0.07 to 14.63 µM, respectively. The median concentrations of PO4-P, NH4-N, and NO2+NO3 differed across stations by about 10, 50, and 200 times, respectively. Both DIP and DIN were significantly higher at Stn. 1 near the mouth of the canal branch (Figures 6C–E). Except for Stn.1, there were no significant differences among the other stations.
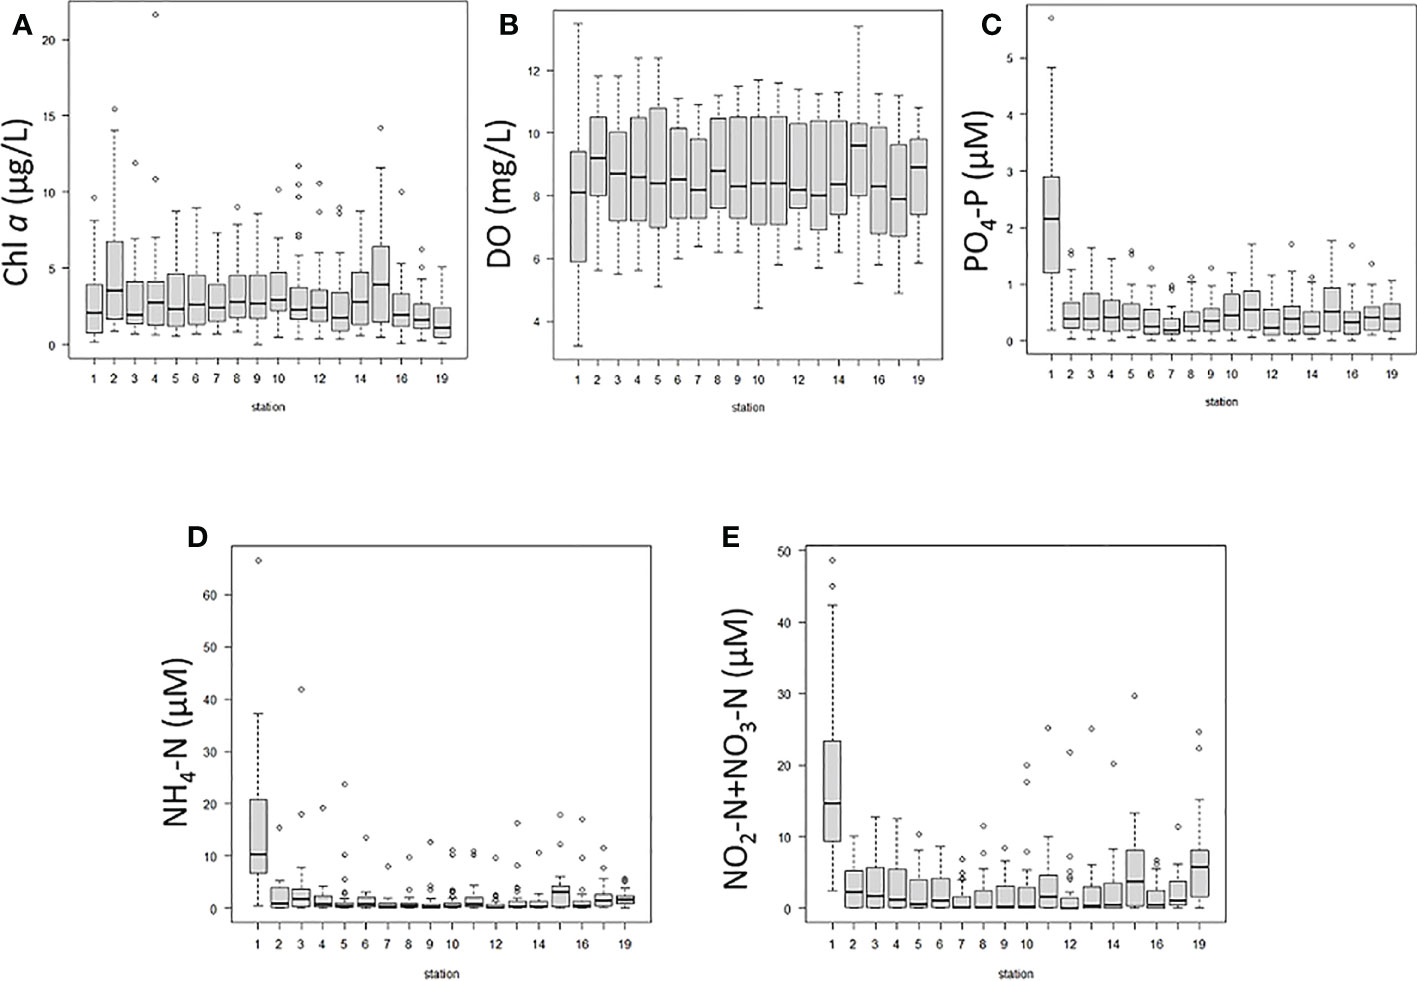
Figure 6 Box plots comparing sampling stations 1-19 (see Figure 1) for each environmental parameter from Oct. 2012 to Feb. 2016, analyzed by EZR. Dark horizontal lines are medians, within boxes indicating lower and upper quartiles. Dotted lines indicate 95 percentile minima and maxima. Circles indicate outliers.
3.5. Non-metric multi-dimensional scaling (MSD) analysis
The degree of biodiversity detected in the seawater of Matsushima Bay tended to vary with the year (Figure 7). Eukaryote assemblages in 2004 differed greatly from other years (Figure 7A). Biodiversity also tended to show monthly variation (Figure 7B). The data after 2012 tended to aggregate as monthly clusters, and the data for July, August, and September each year clustered differently than for the other months (Figure 7B). Composition beyond 2012 showed no clear differences among the stations (Figure 7C). Rather than differences by location, composition tended to vary by month and year (Figures 7A–C).
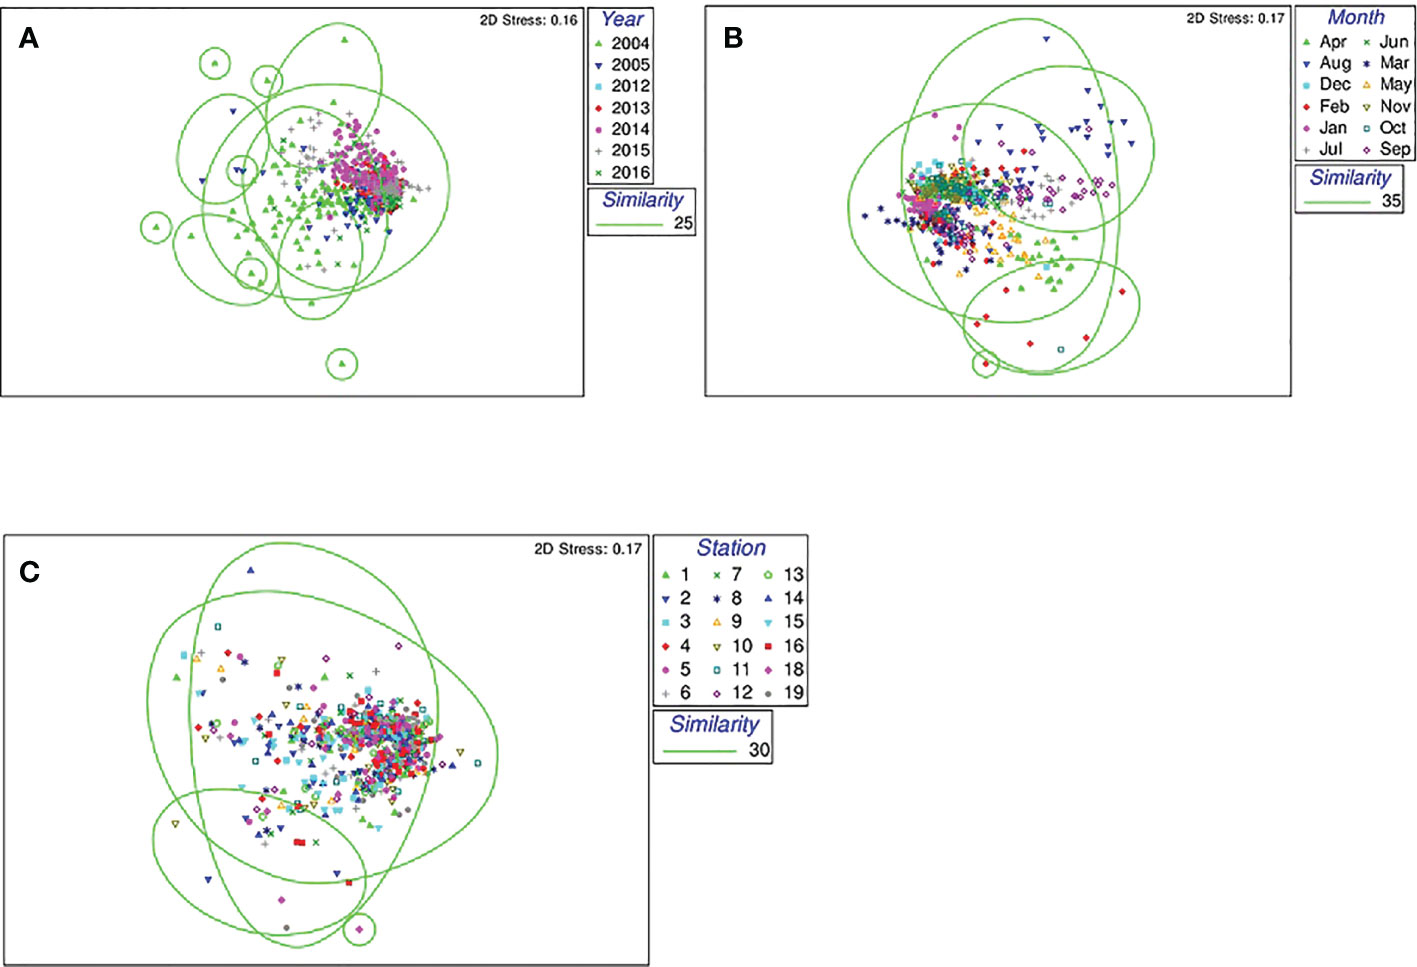
Figure 7 Diversity of eukaryote communities (A) comparing different years; (B) comparing different months of the year after 2012; and (C) sampling stations 1-19 after 2012 by MDS.
4. Discussion
The growth characteristics of phytoplankton in Matsushima Bay differed from the general mechanism of the spring bloom. Normally, vertical mixing in winter raises nutrients from lower layers to the surface layer, where increased solar radiation and water temperature cause a spring bloom; then in summer the nutrient supply is interrupted by establishment of the thermocline, and the bloom ends when phytoplankton have consumed all the dissolved nutrients available. In the rest of Sendai Bay outside Matsushima Bay (see Figure 1), Chl a concentration peaks from winter to spring, while nutrients increase from fall to winter and decrease from spring to summer (Watanabe et al., 2017). From July (after the end of the spring bloom) to January, Chl a concentrations was lower, sometimes less than 1 μg/L (Taniuchi et al., 2017). However Chl a concentrations in Matsushima Bay were often remained above 2 µg/L, and was high almost continuously from spring to fall or even extending into winter (Figure 2C).
RDA analysis showed a negative relationship for salinity, nutrients, turbidity, DO, and pH; and a strong positive relationship between water temperature and pigment concentrations (Figure 3). Therefore, phytoplankton growth in Matsushima Bay was not limited by nutrient concentrations, and changed in line with increasing or decreasing water temperature. Regarding the relationship between nutrients and major pigment concentrations, nutrient levels were low during periods of high Chl a and Fuco concentrations during the spring and autumn in 2014 (Figures 2B, C). The reason for this is considered to be consumption and decrease of nutrients by phytoplankton growth.
Salinity was continuously below 30 during the same period (Figure 2A). The salinity in Sendai Bay, excluding Matsushima Bay, has been reported to decrease in summer in the range of 26.9 to 34.2 (Watanabe et al., 2017), while the salinity in Matsushima Bay was found to be generally lower, in the range of 20.2 to 32.5 (Figure 2A). The lower salinity in Matsushima Bay is attributed to the constant inflow of river water, which is also higher in nutrient concentrations than the seawater nearby (Okumura et al., 2021a). Although lower in quantity than river water, there was also treated-water inflow from wastewater plant via the canal mouth near Stn. 1 (Okumura et al., 2021a). Indeed, the highest concentrations of nutrients in Matsushima Bay were higher than those in the surrounding seawater of Sendai Bay. Even excluding Stn. 1 at the canal mouth (where nutrient concentrations are extremely high due to anthropogenic influences), the highest concentrations of NO2-N+NO3-N and DIP was 29.62 µM and 1.77 µM, respectively, in Matsushima Bay (Figures 6C–E). In Oginohama, further up the coast in the northern part of Sendai Bay, NO2-N+NO3-N and DIP were 18.1 µM and 0.96 µM, respectively (Kamiyama et al., 2005), and 3.07 µM and 0.36 µM in Sendai Bay (Taniuchi et al., 2017). Also, diatoms can store nutrients in vacuoles (Raven, 1987; Falkowski et al., 1998; Falkowski and Oliver, 2007) and may be able to withstand starvation for a short period of time. Since nutrients were maintained at levels that did not cause starvation (because they were constantly being supplied from rivers and anthropogenic sources), it seems that phytoplankton growth was maintained during low nutrient concentrations. As a result, Chl a and Fuco were high even during conditions of low nutrient concentrations.
The NGS results showed that most of the microorganisms detected in the seawater were phytoplankton, with a high proportion of diatoms and dinoflagellates (Figures 4, 5A). High proportions of diatoms and dinoflagellates were also detected in other offshore areas by the sequences of the 18SrRNA genes (De Vargas et al., 2015), and the main phytoplankton composition in Matsushima Bay was similar. Diatoms were the dominantly abundant phytoplankton, since Chl a and Fuco (the latter being a major pigment of diatoms) showed similar fluctuations, and a correlation was also observed (Figure 2, Supplemental Figure 2). A lower correlation than Fuco was observed between Chl a and Peridinin, which is a major pigment of dinoflagellates. It is therefore considered that most of the Chl a obtained was associated with diatoms, although the NGS data showed that diatoms and dinoflagellates in the SAR group were in roughly equal proportions (Supplemental Figure 3). Diatoms are thought to account for about 20% of all phytoplankton on Earth (Malviya et al., 2016), and are generally considered to be dominant in temperate coastal areas (Armbrust, 2009) due to a supply of silicate from rivers (Officer and Ryther, 1980; Treguer et al., 1995; Falkowski et al., 1998; Taniuchi et al., 2017). Diatoms have also been reported to be dominant in Sendai Bay, outside Matsushima Bay (Taniuchi et al., 2017; Watanabe et al., 2017). Resting cells of various diatoms have been recorded from the sediments of Matsushima Bay in the past (Ichinomiya and Taniguchi, 2003), and if they germinate from the sediment, they may be the dominant species. The reason why diatoms appear to be dominant in abundance, while diatoms and dinoflagellates are recorded in almost equal numbers from DNA sequencing, is due to the difference in the copy number of 18SrRNA genes, which is thought to depend on cell volume, so dinoflagellates have more copies of 18SrRNA genes per cell than diatoms (Godhe et al., 2008). In Sendai Bay, dinoflagellates have been reported to be present at an abundance approximately 1/10 that of diatoms (Taniuchi et al., 2017), and in Matsushima Bay, too, dinoflagellate abundance was not dominant.
It is considered that there is no problem with the fact that the preservation period of the DNA samples from 2004-2005 was more than 10 years, because DNA has been sequenced successfully from sediment core samples following tens of thousands of years earlier (Lejzerowicz et al., 2013). Similarly, we have also confirmed that DNA sequencing is possible from samples several hundred years old (Okumura et al., 2021b), so decomposition of DNA samples over several decades preserved in a freezer is expected to be minimal.
If the aquaculture of oyster and seaweeds using rafts and rope installations were too intensive, it may affect the environment, the abundance and composition of phytoplankton and other microorganisms in Matsushima Bay. The total filtration rate by oysters cultured on rafts in Matsushima Bay is calculated to be enormous: the total number of oysters is calculated to be more than 40,000 per culture raft because oyster rafts in Matsushima Bay are installed as a 2 m x 27 m bamboo grid, from which hang 270 ropes with 10 to 20 scallop shells fixed within the twists of each rope (Miyagi Prefectural government, 1994). If oysters were cultured from 15 to 20 per scallop shell, the total number of suspended oysters per raft is 40,500 to 108,000. If one oyster filters 400 L of water per day (Fisheries Agency), the total filtration capacity per raft would be at least 16,200 tonnes per raft. Although the actual filtration rate varies greatly depending on oyster size and water temperature (Akashige et al., 2005), in the presence of more than 100 rafts the overall filtration volume is expected to be enormous. Filtration by oysters will therefore have a large effect on cleaning the marine environment, as well as the amount and composition of the microorganism population.
In addition, seaweed cultivation competes with phytoplankton for nutrients, which in seaweed are assimilated at a rate of about 5.7 mgN/gDW/h, depending on the type of seaweed (Yoshida et al., 2011). However, it is considered that the current number of aquaculture installations in Matsushima Bay probably does not affect the phytoplankton community in surface waters because nutrients, Chl a concentrations, and eukaryote assemblages did not clearly differ between cultured and non-cultured areas (Figures 6A, 7C; refer to Figure 1). The nutrient concentrations at Stn.1 (the canal mouth) appear different, presumably due to a higher anthropogenic effect, but otherwise there were no clear differences in nutrient concentrations among cultivated and non-cultivated areas (Figures 6C–E). Chl a concentration, too, showed no clear differences, except for a lower concentration at the Ofuna-iri Canal mouth (Figure 6A).
Eukaryote assemblages in seawater tended to show similar composition during the same year (Figure 7A), and during the same month each year (Figure 7B), while there were no clear differences among stations (Figure 7C). One reason may be that the biomass of diatoms was strongly dependent on water temperature, a natural environmental change unrelated to the presence or absence of aquaculture facilities (Figures 2A, C). The month-by-month population composition may be related to phenology. The dominant phytoplankton in Matsushima Bay were the diatoms, growth of which is temperature-dependent, so they are more abundant in the summer, declining in winter.
The timing of maturation of shellfish, such as oysters, is known to depend on the accumulated empirical water temperature, and oysters in Matsushima Bay spawn in the summer (Miyagi Prefectural government, 1994; Kakehi et al., 2016). The periphyton, including organisms such as hydrozoans, also demonstrate life cycle turnover (Ciavatta et al., 2020). One of the reasons why composition tended to vary by month (Figure 7B) is the fact that the entire biological community tended to change depending on the season.
In particular, the distribution of eukaryotes in 2004 was different from other years (Figure 7A), and we infer that this was due to the high proportion of Opisthokonta, which is not phytoplankton (Figure 5C). We consider the difference in the distribution of eukaryotes in 2004 to be an annual variation rather than a difference before and after the earthquake because the taxon composition in 2005 was similar to that after the earthquake. Even if there are similar annual seasonal changes, related to phenology, environmental factors fluctuated only slightly (Figure 2). Consequently, it is inferred that the distribution of eukaryotic communities also changed slightly from year to year (Figure 7C).
The shallow depth of Matsushima Bay (5 m maximum; Okumura et al., 2021a), and the associated frequency of seawater exchange (including a tidal range occasionally exceeding 1 m (Japan Meteorological Agency), probably exerts a stronger effect on changes to the phytoplankton assemblages in Matsushima Bay than the amount of cultured oysters and seaweed present. When the tidal range is large, it is estimated that this results in a daily replacement of approximately 1/5 of the seawater in Matsushima Bay. Indeed, seawater exchanges have been shown to be accelerated by the presence of a persistent rain front (Kakehi et al., 2016), flooding from rain over the nearby land (Kakehi et al., 2017), or by marine environmental changes of other kinds (Okumura et al., 2021a). Therefore, although there are more than 600 oyster rafts and 1,300 seaweed rope installations in Matsushima Bay, it is considered that the extent of seawater replacement exceeds the impact of aquaculture facilities on the bay’s environment and phytoplankton assemblages.
Periphyton is also considered to affect aquaculture in Matsushima Bay, contributing as one factor in the occurrence of mass mortality of oysters, such as that which occurred in 2013 (Ito and Oshino, 2018). However, it is considered that the scouring of aquaculture facilities by the 2011 tsunami probably had little effect on oyster mass mortality phenomena. The occurrence of periphyton Metazoa such as Alcyonidium was found to show irregular fluctuations, and although it was much higher in 2004 than in 2013 (Figure 5C), it is considered that periphyton outbreaks were not affected by environmental changes following the tsunami.
It is considered also that the current number of aquaculture installations in Matsushima Bay has little impact on the environment and eukaryote assemblages. The number of fishermen in Miyagi Prefecture, including Matsushima Bay, has been decreasing year by year, as a direct result of the effects of the tsunami (Okumura et al., 2019). As a result, the number of oysters being cultured is less than half what it was in 1960 (Miyagi Prefectural government, 1994). Similarly, current seaweed cultivation is about half of that recorded for 1989 (Nagaki et al., 2015). Oyster and seaweed cultivation in Matsushima Bay are therefore not over-intensive and are within an appropriate range, with little effect on the marine environment and eukaryote assemblages.
5. Conclusion
According to results from NGS analysis of samples, phytoplankton comprised a high proportion of the eukaryote assemblages in Matsushima Bay. Diatoms were the dominant phytoplankton. The growth of diatoms in Matsushima Bay was seen to be dependent on water temperature, and was independent of anthropogenic influences, so aquaculture installations in Matsushima Bay apparently have little effect on the natural microorganisms. Because of the high rate of filtration of phytoplankton in oyster culture, and the competition for nutrients in seaweed cultivation, differences were expected in the phytoplankton and eukaryote assemblages present in comparison with non-cultured areas. However, no such differences were observed, perhaps because of the shallow water depth in Matsushima Bay, the high turnover of seawater replacement, and culture installations probably well below exploitation capacity. However, feces from shellfish, dead shellfish and the periphyton in culture areas generally sink to the seafloor, so it is possible that the bottom environment differs from the environment of the seawater column. Since analysis in this study was conducted using only surface seawater, further investigation of the near-bottom layer and bottom sediment will be necessary to provide a more detailed and comprehensive understanding of the effects of culture facilities in Matsushima Bay.
Data availability statement
The data presented in the study are deposited in the DDBJ repository, BioProject accession number; PRJDB13931, and DRA accession number; DRA014705.
Author contributions
YO designed and wrote manuscript in the study. YM investigated in the Matsushima Bay, and analyses nutrients in the seawater. MM helped with data processing and AS advised on analysis. All authors contributed to the article and approved the submitted version.
Funding
This work was supported by a Grant-in-Aid for Scientific Research B (18H03414) of the Japan Society for the Promotion of Science; the Tohoku Marine Science Project (a grant to assist with recovery from earthquake damage) provided by the Reconstruction Agency of Japan; and a Cooperative Research Grant of the Genome Research for BioResources, NODAI Genome Research Center, Tokyo University of Agriculture.
Conflict of interest
The authors declare that the research was conducted in the absence of any commercial or financial relationships that could be construed as a potential conflict of interest.
Publisher’s note
All claims expressed in this article are solely those of the authors and do not necessarily represent those of their affiliated organizations, or those of the publisher, the editors and the reviewers. Any product that may be evaluated in this article, or claim that may be made by its manufacturer, is not guaranteed or endorsed by the publisher.
Supplementary material
The Supplementary Material for this article can be found online at: https://www.frontiersin.org/articles/10.3389/fmars.2022.1022168/full#supplementary-material
Supplementary Figure 1 | (A). Vertical distribution of water temperature (°C) at the surface and 0.5 m above the seafloor. (B). Vertical distribution of salinity (PSU) at the surface and 0.5 m above the seafloor.
Supplementary Figure 2 | The relationship between Chl a and other pigment concentrations.
Supplementary Figure 3 | Percentage of the major taxonomic groups detected which belong to the SAR supergroup.
Supplementary Figure 4 | Percentage of major taxonomic groups detected which belong to the Archaeplastida.
Supplementary Figure 5 | Percentage of major taxonomic groups detected which belong to the Opisthokonta.
References
Akashige S., Hirata Y., Takayama K., Soramoto K. (2005). Seasonal changes in oxygen consumption rates and filtration rates of the cultured pacific oyster Crasssotrea gigas. Nippon Suisan Gakkaishi (Japanese Ed. 71, 762–767. doi: 10.2331/suisan.71.762
Armbrust E. V. (2009). The life of diatoms in the world’s oceans. Nature 459, 185–192. doi: 10.1038/nature08057
Breitburg D., Levin L. A., Oschlies A., Grégoire M., Chavez F. P., Conley D. J., et al. (2018). Declining oxygen in the global ocean and coastal waters. Science 359, eaam7240. doi: 10.1126/science.aam7240
Ciavatta M. L., Lefranc F., Vieira L. M., Kiss R., Carbone M., van Otterlo W. A. L., et al. (2020). The phylum bryozoa: From biology to biomedical potential. Mar. Drugs 18, 1–32. doi: 10.3390/md18040200
De Vargas C., Audic S., Henry N., Decelle J., Mahé F., Logares R., et al. (2015). Eukaryotic plankton diversity in the sunlit ocean. Science 348, 1261605. doi: 10.1126/science.1261605
Falkowski P. G., Barber R. T., Smetacek V. (1998). Biogeochemical controls and feedbacks on ocean primary production. Science 200, 200–207. doi: 10.1126/science.281.5374.200
Falkowski P. G., Oliver M. J. (2007). Mix and match- how climate selects phytoplankton- falkowski and Oliver. Nature 5, 813–819. doi: 10.1038/nrmicro1751
Fisheries Agency Environmental conservation through fishing activities. Available at: https://www.jfa.maff.go.jp/j/kikaku/tamenteki/kaisetu/gyogyou_katudou/.
Godhe A., Asplund M. E., Härnström K., Saravanan V., Tyagi A., Karunasagar I. (2008). Quantification of diatom and dinoflagellate biomasses in coastal marine seawater samples by real-time PCR. Appl. Environ. Microbiol. 74, 7174–7182. doi: 10.1128/AEM.01298-08
Ichinomiya M., Taniguchi A. (2003). Seasonal variation in abundance and species composition of a planktonic diatom assemblage including viable cells on the bottom in matsushima bay, northeastern japan. J. Ocean Univ. Qingdao 2, 160–166. doi: 10.1007/s11802-003-0045-9
Ishikawa T., Kusaka K., Oshino A., Nishitani G., Kaniyama T. (2015). Distribution patterns of Alexandrium vegetative cells and resting cysts, and paralytic shellfish poisoning in kesennuma bay, after the great East Japan earthquake. Nippon Suisan Gakkaishi 81, 256–266. doi: 10.2331/suisan.81.256
Ito H., Oshino A. (2018). The sessile organisms of cultured oyster and removal methods in matsushima bay. Miyagi Pref. Rep. Fish. Sci. 18, 47–50. Available at: https://www.pref.miyagi.jp/documents/1138/18-7.pdf.
Japan Meteorological Agency A tide table in shiogama. Available at: https://www.data.jma.go.jp/gmd/kaiyou/db/tide/suisan/suisan.php?stn=SG.
Kakehi S., Kamiyama T., Abe H., Hanawa S., Oota H., Matsuura R., et al. (2016). Mechanisms leading to the decline in pacific oyster Crassostrea gigas seedlings in matsushima bay, Japan. Fish. Sci. 82, 499–508. doi: 10.1007/s12562-016-0982-z
Kakehi S., Shirai H., Magome S., Takagi T., Okabe K., Takayanagi K., et al. (2020). Predicting the larval transport of pacific oyster Crassostrea gigas during the seedling collection season. Fish. Oceanogr. 29, 484–504. doi: 10.1111/fog.12491
Kakehi S., Takagi T., Okabe K., Takayanagi K. (2017). Circulation in a bay influenced by flooding of a river discharging outside the bay. Estuar. Coast. Shelf Sci. 187, 204–215. doi: 10.1016/j.ecss.2017.01.013
Kamiyama T., Yamauchi H., Iwai T., Hanawa S., Matsuyama Y., Arima S., et al. (2005). Comparison of environmental conditions in two representative oyster farming areas: Hiroshima bay, western Japan and oginohama bay (a branch of ishinomaki bay), northern Japan. Fish. Sci. 71, 1295–1130. doi: 10.1111/j.1444-2906.2005.01096.x
Kamiyama T., Yamauchi H., Nagai S., Yamaguchi M. (2014). Differences in abundance and distribution of Alexandrium cysts in Sendai bay, northern Japan, before and after the tsunami caused by the great East Japan earthquake. J. Oceanogr. 70, 185–195. doi: 10.1007/s10872-014-0221-0
Kanda Y. (2013). Investigation of the freely available easy-to-use software “EZR” for medical statistics. Bone Marrow Transplant. 48, 452–458. doi: 10.1038/bmt.2012.244
Lejzerowicz F., Esling P., Majewski W., Szczucinski W., Decelle J., Arbizu P. M., et al. (2013). Ancient DNA complements microfossil record in deep-sea subsurface sediments. Biol. Lett. 9, 20130283. doi: 10.1098/rsbl.2013.0283. doi: 10.5061/dryad.b5m0j.
Malviya S., Scalco E., Audic S., Vincent F., Veluchamy A., Poulain J., et al. (2016). Insights into global diatom distribution and diversity in the world’s ocean. Proc. Natl. Acad. Sci. 113, E1516–E1525. doi: 10.1073/pnas.1509523113
Masuda Y., Okumura Y., Ohta H. (2014). Monitoring of causative plankton of shellfish poisoning two decades (from 1993 to 2013) in the middle and southern coastal area of miyagi prefecture. Miyagi Pref. Rep. Fish. Sci. 14, 41–56. Available at: https://www.pref.miyagi.jp/documents/1138/14-6.pdf.
Miyagi Prefectural government (1994) Traditional fishing gear fishing methods in miyagi prefecture VII aquaculture (Oyster). Available at: https://www.pref.miyagi.jp/documents/25039/309091.pdf.
Miya M., Sato Y., Fukunaga T., Sado T., Poulsen J. Y., Sato K., et al. (2015). MiFish, a set of universal PCR primers for metabarcoding environmental DNA from fishes: Detection of more than 230 subtropical marine species. R. Soc Open Sci. 2, 150088. doi: 10.1098/rsos.150088
Nagaki M., Suto A., Nobuhisa A., Hanawa S. (2015). Growth of undaria pinnatifida and laminaria japonica cultivated in matsushima bay and water temperature and nutrient concentration in the cultivating area. Miyagi Pref. Rep. Fish. Sci. 8, 54–61. Available at: https://www.pref.miyagi.jp/documents/1138/15-7.pdf.
Nagashima H., Ishida A., Yoneyama N., Pringle W. J. (2016). Numerical study on the tsunami reduction factor in matsushima bay during the great east Japan earthquake. J. Japan Soc Civ. Eng. Ser. B3 (Ocean Eng. 72, I_151–I_156. doi: 10.2208/jscejoe.72.I_151
Nimnoi P., Pongsilp N. (2020). Marine bacterial communities in the upper gulf of Thailand assessed by illumina next-generation sequencing platform. BMC Microbiol. 20, 1–11. doi: 10.1186/s12866-020-1701-6
Officer C. B., Ryther J. H. (1980). The possible importance of silicon in marine eutrophication. Mar. Ecol. Prog. Ser. 3, 83–91. doi: 10.3354/meps003083
Okumura Y., Masuda Y., Suzuki N., Kakehi S., Hara M. (2021a). Temporal changes in the nutrient status of matsushima bay after a wastewater plant was destroyed by a tsunami on 11 march 2011. Fish. Sci. 87, 845–859. doi: 10.1007/s12562-021-01553-2
Okumura Y., Matsuoka H., Arakawa H., Tokanai F., Suzuki A., Irizuki T., et al. (2021b). The influence and impact of tsunamis on the microorganism assembly of nagatsura-ura lagoon, miyagi, northeastern Japan. Fish. Sci. 87, 121–130. doi: 10.1007/s12562-020-01472-8
Okumura Y., Nawata A., Ito H., Oshino A., Hara M. (2019). “Suitable oyster culture density in oginohama bay, miyagi, Japan,” in Oceanography challenges to future earth (Cham: Springer International Publishing), 351–363. doi: 10.1007/978-3-030-00138-4_28
Oota H., Suzuki N., Gambe S. (2017). Sedimentary environment before and after the great East Japan earthquake in matsushima bay. Miyagi Pref. Rep. Fish. Sci. 17, 35–41. Available at: https://www.pref.miyagi.jp/documents/1138/17-5.pdf.
Ota Y., Suzuki A., Yamaoka K., Nagao M., Tanaka Y., Irizuki T., et al. (2019). Sediments of matsushima bay, northeastern Japan: Insights gained from 5 years of sedimentological analysis following the 2011 tohoku earthquake-tsunami. Geochemistry Geophys. Geosystems 20, 3913–3927. doi: 10.1029/2019GC008381
Raven J. A. (1987). The role of vacuoles. New Phytol. 106, 357–422. doi: 10.1111/j.1469-8137.1987.tb00149.x
Shimadzu Corporation. (2019). Ampdirect® Plus Procedure. Availabe at: https://www.an.shimadzu.co.jp/bio/reagents/amp/amp_emn.pdf.
Stoeck T., Bass D., Nebel M., Christen R., Jones M. D. M., Breiner H. W., et al. (2010). Multiple marker parallel tag environmental DNA sequencing reveals a highly complex eukaryotic community in marine anoxic water. Mol. Ecol. 19, 21–31. doi: 10.1111/j.1365-294X.2009.04480.x
Taniuchi Y., Watanabe T., Kakehi S., Sakami T., Kuwata A. (2017). Seasonal dynamics of the phytoplankton community in Sendai bay, northern Japan. J. Oceanogr. 73, 1–9. doi: 10.1007/s10872-015-0334-0
ter Braak C. J. F., Šmilauer P. (2018). Canoco reference manual and user’s guide: software for ordination (version 5.10). Biometris Wageningen Univ. Res. 356.
TOYOBO (2019) Instruction manual KOD FX 1110. Available at: https://www.toyobo-global.com/.
Treguer P., Nelson D. M., Van Bennekom A. J., DeMaster D. J., Leynaert A., Queguiner B. (1995). The silica balance in the world ocean: A reestimate. Science 268, 375–379. doi: 10.1126/science.268.5209.375
Watanabe T., Taniuchi Y., Kakehi S., Sakami T., Kuwata A. (2017). Seasonal succession in the diatom community of Sendai bay, northern Japan, following the 2011 off the pacific coast of tohoku earthquake. J. Oceanogr. 73, 133–144. doi: 10.1007/s10872-016-0387-8
Watanabe T. (1977). Problems of water exchange in productivity development studies of shallow waterfisheries ground. Bull.Coast.Oceanogr. 14, 65–77. doi: 10.32142/engankaiyo.14.1_65
Yoshida G., Niimura Y., Tarutani K., Hamaguchi M. (2011). Research review on the relationship between macroalgal-production and nutrients, and relative assessment of the nutrient conditions on macroalgae in the seto inland Sea. Bull. Fish. Res. Agen. 34, 1–34. Available at: https://www.fra.affrc.go.jp/bulletin/bull/bull34/1-31.pdf.
Keywords: natural disaster, aquaculture, microorganisms, next generation sequencing, coast
Citation: Okumura Y, Masuda Y, Matsutani M and Shiomoto A (2023) Influence of oyster and seaweed cultivation facilities on coastal environment and eukaryote assemblages in Matsushima Bay, northeastern Honshu, Japan. Front. Mar. Sci. 9:1022168. doi: 10.3389/fmars.2022.1022168
Received: 18 August 2022; Accepted: 19 December 2022;
Published: 10 January 2023.
Edited by:
Daniel Joseph Pondella, Occidental College, United StatesReviewed by:
Hideki Fukuda, The University of Tokyo, JapanGouranga Biswas, Central Institute of Fisheries Education (ICAR), India
Copyright © 2023 Okumura, Masuda, Matsutani and Shiomoto. This is an open-access article distributed under the terms of the Creative Commons Attribution License (CC BY). The use, distribution or reproduction in other forums is permitted, provided the original author(s) and the copyright owner(s) are credited and that the original publication in this journal is cited, in accordance with accepted academic practice. No use, distribution or reproduction is permitted which does not comply with these terms.
*Correspondence: Yutaka Okumura, b2t1bXVyYUBhZmZyYy5nby5qcA==