
94% of researchers rate our articles as excellent or good
Learn more about the work of our research integrity team to safeguard the quality of each article we publish.
Find out more
ORIGINAL RESEARCH article
Front. Mar. Sci., 06 October 2022
Sec. Aquatic Microbiology
Volume 9 - 2022 | https://doi.org/10.3389/fmars.2022.1021952
 Paul A. Den Uyl1*
 Luke R. Thompson2,3
 Reagan M. Errera4
 James M. Birch5
 Christina M. Preston5
 William Ussler III5
 Colleen E. Yancey6
 Subba Rao Chaganti1
 Steven A. Ruberg4
 Gregory J. Doucette7
 Gregory J. Dick1,6
 Christopher A. Scholin5
 Kelly D. Goodwin3,8
Biomolecular analyses are used to investigate the dynamics of cyanobacterial harmful algal blooms (cyanoHABs), with samples collected during monitoring often analyzed by qPCR and sometimes amplicon and metagenomic sequencing. However, cyanoHAB research and monitoring programs face operational constraints due to the reliance on human resources for sample collections. To address this impediment, a third-generation Environmental Sample Processor (3G ESP) integrated with a long-range autonomous underwater vehicle (LRAUV) was tested during seasonal blooms of Microcystis in western Lake Erie (WLE) in 2018 and 2019. The LRAUV-3G ESP successfully performed flexible, autonomous sampling across a wide range of cyanoHAB conditions, and results indicated equivalency between autonomous and manual methods. No significant differences were found between LRAUV-3G ESP and manual sample collection and handling methods in the 12 parameters tested. Analyzed parameters included concentrations of total cyanobacteria and microcystin toxin gene via qPCR; relative abundances of bacterial amplicon sequence variants (ASVs) from 16S rRNA gene amplicon sequencing; and community diversity measures from both 16S amplicon and metagenomic sequencing. The LRAUV-3G ESP provided additional sampling capacity and revealed differences between field seasons for bacterial taxa and concentrations of total cyanobacteria and microcystin toxin gene. Metagenomic analysis of multiple microcystin toxin genes corroborated the use of the mcyE gene as a proxy for the genomic potential of WLE cyanoHABs to produce microcystin. Overall, this study provides support for the use of autonomous ‘omics capability in WLE to help expand the spatial and temporal coverage of cyanoHAB monitoring operations.
Cyanobacterial harmful algal blooms are a serious threat to freshwater environments across the globe, with few places more impacted by their occurrence than western Lake Erie (WLE) (Paerl and Huisman, 2009; Michalak et al., 2013). Transformed habitat, disturbances across ecosystems, development of hypoxic zones, and toxin production can all be traced back to cyanoHAB proliferation in the region (Watson et al., 2016). These consequences have serious ramifications for human, animal, and ecosystem health and significantly impact the region’s economy (Carmichael et al., 2001; Hoagland and Scatasta, 2006; Hernández et al., 2009; Paerl and Otten, 2013). To help communities prepare for and respond to bloom events, monitoring programs have been established to investigate short- and long-term seasonal bloom conditions in an effort to understand, forecast, and mitigate the deleterious effects of cyanoHABs (GLWQA, 2012; Cooperative Institute for Great Lakes Research, 2019; GLRI, 2021).
Current monitoring programs take a multifaceted approach to observe and characterize cyanoHABs, which exhibit high interannual variability and short-term fluctuations in development, persistence, and toxicity. Strategically sited buoys in WLE provide important real-time physico-chemical and biological measurements to aid in observing and modeling algal biomass (Chaffin et al., 2018; Cooperative Institute for Great Lakes Research, 2019). Moored second-generation Environmental Sample Processors (2G ESPs) are currently used to collect and analyze samples in situ for the presence of microcystin toxin (Scholin et al., 2017; U.S. Department of Commerce - NOAA, 2021d). Satellite remote sensing also supplies frequent and spatially widespread observations, identifying changes in cyanobacterial biomass to indicate bloom distribution, trajectory, and intensity over the WLE region (Wynne et al., 2008; Stumpf et al., 2012; Rowe et al., 2016; U.S. Department of Commerce - NOAA, 2021c). Lastly, crewed vessel operations facilitate the collection and analysis of discrete samples at designated stations for targeted chemical, physical, and genetic/genomic parameters (Cory et al., 2017; Steffen et al., 2017; Bosse et al., 2019; Cooperative Institute for Great Lakes Research, 2019) (Figure 1).
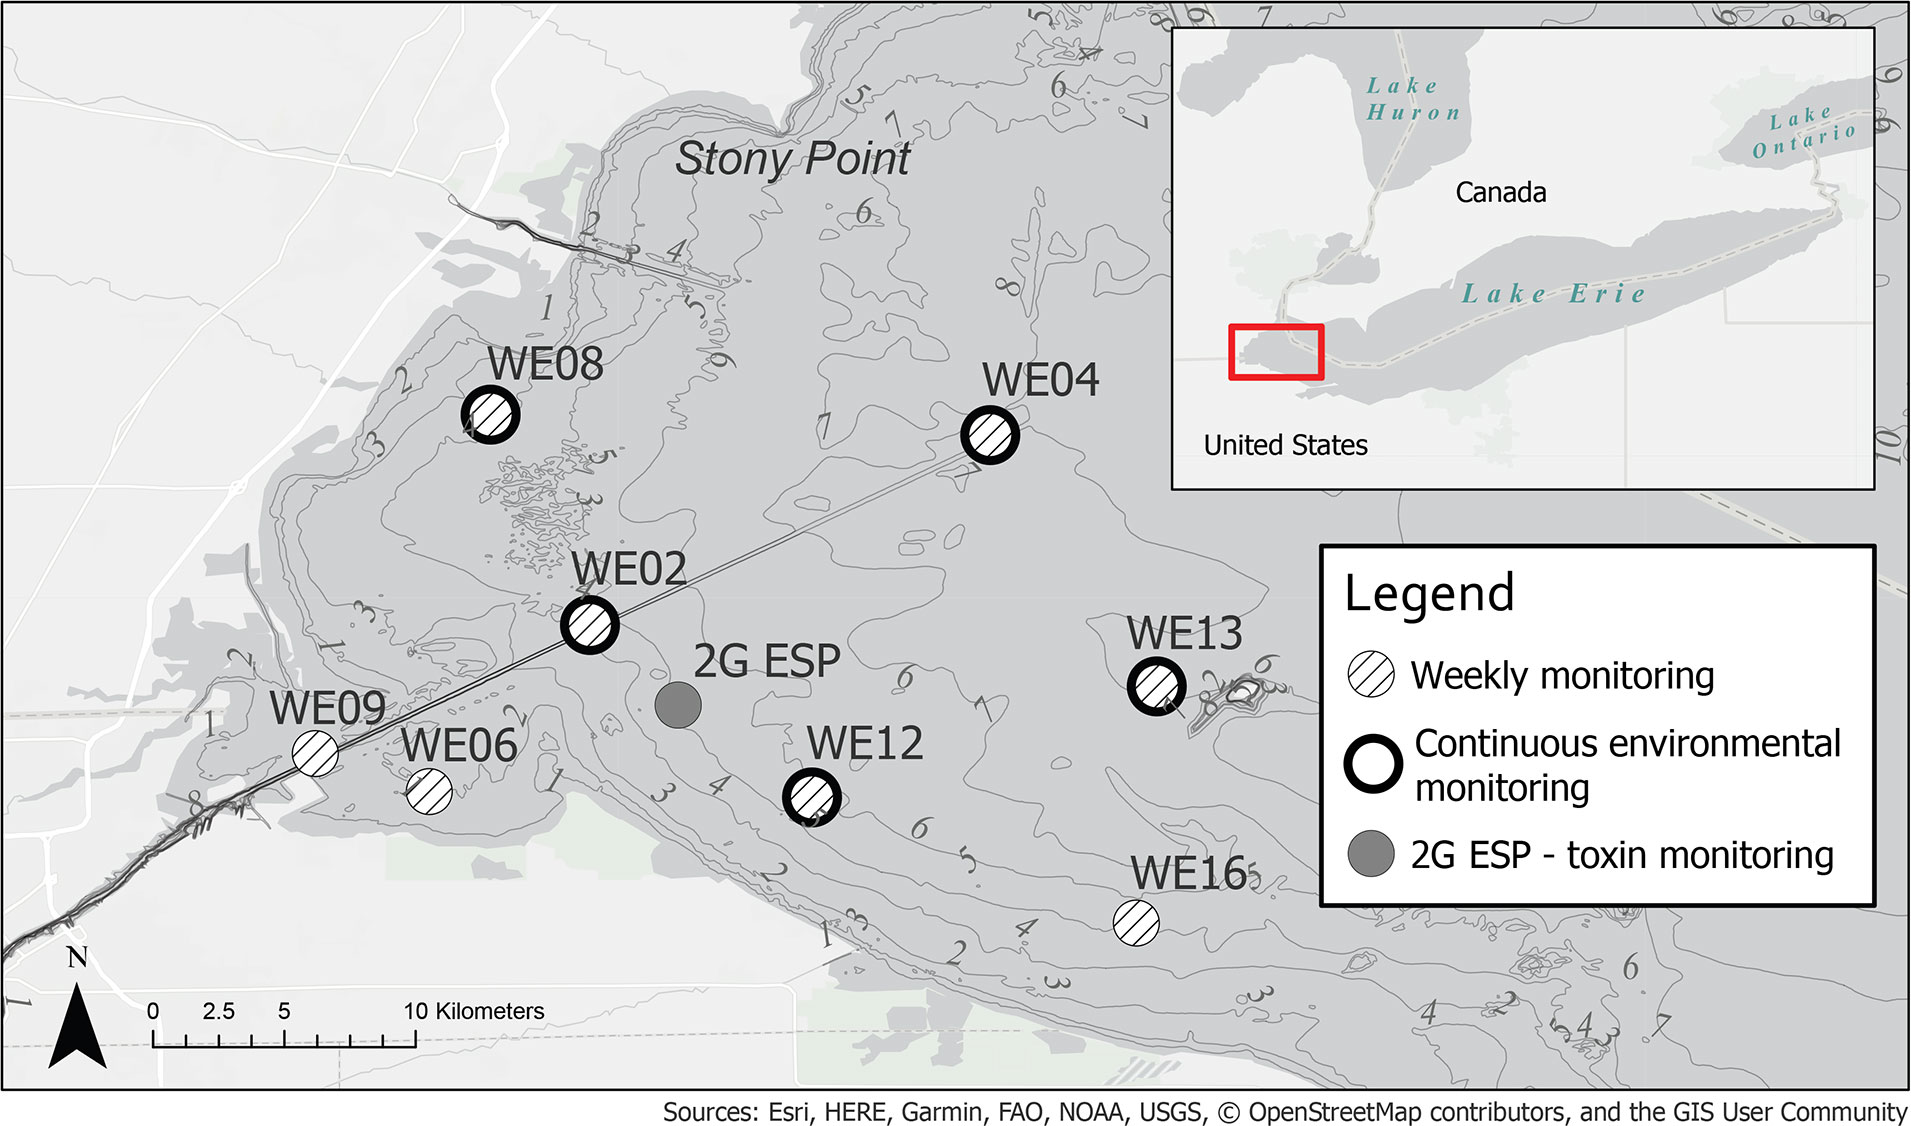
Figure 1 Western Lake Erie (WLE) regular weekly sampling, continuous monitoring sites, and location of 2G ESP in August 2019, during LRAUV-3G ESP deployment. Bathymetry contour lines shown in meters.
Despite the extensive existing monitoring program in WLE (GLWQA, 2012; Cooperative Institute for Great Lakes Research, 2019; GLRI, 2021), disadvantages and limitations associated with each surveillance method in the program motivate a desire to improve overall observational capacity. For example, crewed vessel operations are constrained by weather, costs, and the availability of human resources, limiting how frequently boats can be deployed and how expansive an area can be surveyed. Although the 2G ESP is autonomous, it only collects data from a fixed location, and the instrument mooring is challenging to retrieve and relocate. Satellite remote observations can be obscured by cloud cover, making it difficult to monitor changes in the highly dynamic bloom conditions of WLE. Autonomous sample collection provides the opportunity to enhance cyanoHAB monitoring by removing the limitations of crewed vessel operations.
Robotic water samplers have begun to provide more capable and efficient options for environmental monitoring and sample acquisition, including nucleic acid samples. Nucleic acid analyses over greater spatial and temporal coverage can greatly enhance regional monitoring. For example, nucleic acids can be analyzed by quantitative polymerase chain reaction (qPCR) based on markers for taxonomy or gene function. Examples include cyanobacterial 16S rRNA to detect total cyanobacteria or the mcyE gene to detect the potential to produce the cyanoHAB toxin, microcystin. (Davis et al., 2009; Rinta-Kanto et al., 2009; Al-Tebrineh et al., 2012). Nucleic acids recovered from samples also can be analyzed through amplicon and metagenomic sequencing to provide taxonomic composition and profiles of functional potential of microbial communities (Berry et al., 2017a; Berry et al., 2017b; Meyer et al., 2017; Smith et al., 2021; Yancey et al., 2022). Previous studies have used automated systems to study marine microbes, phytoplankton, zooplankton, and invertebrate larvae (Ryan et al., 2011; Robidart et al., 2014; Govindarajan et al., 2015; Herfort et al., 2015; Taylor et al., 2015; Bowers et al., 2018; Moore et al., 2021).
One recent advancement in autonomous sample processing for nucleic acid analysis is the 3G ESP (Pargett et al., 2015; Scholin et al., 2017). The 3G ESP is a robotic molecular analytical instrument capable of autonomous sample acquisition, preparation, and analysis. It can collect up to 60 discrete samples during a single deployment spanning days to weeks. The 3G ESP is a stand-alone instrument, but due to its size and design, the 3G ESP can also be installed as a payload on a Tethys-class long-range AUV (LRAUV), which provides mobility. The LRAUV-3G ESP is capable of deployment for several weeks, at depths to 300 m, and can be controlled through satellite, radio, cellular, and acoustic communications by an operator. Mission commands can be sent whether the vehicle is nearby, underwater, or in the middle of a mission and are received and implemented by the vehicle upon receiving incoming communications when surfacing. In prior open ocean deployments, the LRAUV-3G ESP has been used successfully to collect and preserve nucleic acid samples near Monterey Bay, CA and north of Oahu, HI (Yamahara et al., 2019; Zhang et al., 2019; Zhang et al., 2021; Truelove et al., 2022) .
This report provides the first evaluation of collection and on-board preservation of samples for nucleic acid analysis using the LRAUV-3G ESP in a freshwater system. This study is noteworthy for operations of the LRAUV-3G ESP in an area as shallow as WLE (average depth 7.4 m). Furthermore, it provides the first assessment of instrument operation in an environment where cyanoHABs reached high densities. This work was developed alongside real-time microcystin toxin detection on the LRAUV-3G ESP, which will be presented in future communications. Complex robotic operations of the LRAUV-3G ESP in the study area, such as adaptive sampling in response to chlorophyll measurements, have been described elsewhere (Unpublished). Here, suitability of the LRAUV-3G ESP instrument to supplement and expand current cyanoHAB observational capabilities was assessed. In addition to providing proof-of-concept for LRAUV-3G ESP use in the shallow and freshwater of WLE, these field trials aimed to test the efficacy of the LRAUV-3G ESP system in a broader range of applications and environments, including the first evaluation of the instrument for the collection of metagenomic data. The overarching goal was to further the development and application of a new generation of observational capabilities employing mobile, autonomous platforms.
To compare the results of robotic vs. hand-sampling, water samples containing varying amounts of biomass were collected using either the LRAUV-3G ESP or nearby ship-based Niskin bottles. These co-collected samples were subjected to qPCR measurements, amplicon, and metagenomic sequencing. The mobile and autonomous sampling capabilities of the LRAUV-3G ESP were employed during the 2018 and 2019 WLE field seasons. Water samples were collected at 18 waypoints in 2018 and 20 waypoints in 2019, details provided in the Supplementary Material (SM).
The LRAUV was designed to operate in the open ocean with several energy-saving features that enable longer deployments. These features (e.g., ballast adjustment, neutral buoyancy, etc.) needed adjustment for freshwater operation, but by far the biggest challenge was the shallowness of WLE. Sampling with the LRAUV-3G ESP was constrained to 1 m above bottom. There were two deployments of approximately 5 days each in 2018 and two deployments of 6 days each in 2019. During both sampling years, the instrument was brought ashore for approximately 24 hours between deployments to recharge its lithium-ion batteries. An additional LRAUV, equipped with only contextual sensors, was deployed in 2019 to test the utility of a sentinel vehicle to help direct the track of the sampling vehicle (Unpublished).
The LRAUV (Figure 2A) carried a 3G ESP (Figure 2B) equipped with 60 reusable cartridges that contained the filters and reagents needed for collecting and processing samples in situ (Scholin et al., 2017). Two cartridge types were used for either (1) sample preservation for post-deployment analysis (Archive) (Figures 2C and S1) or (2) supporting sample homogenization for in situ analysis of cyanoHAB toxin (Lysis) (Figure 2D). Filtration through membrane filters (Figure 2E) for both cartridges was terminated when either a target volume was reached (typically 1L) or the filtration rate fell below 0.2 mL/sec, indicating a sufficient concentration of sample particles collected on the filter.
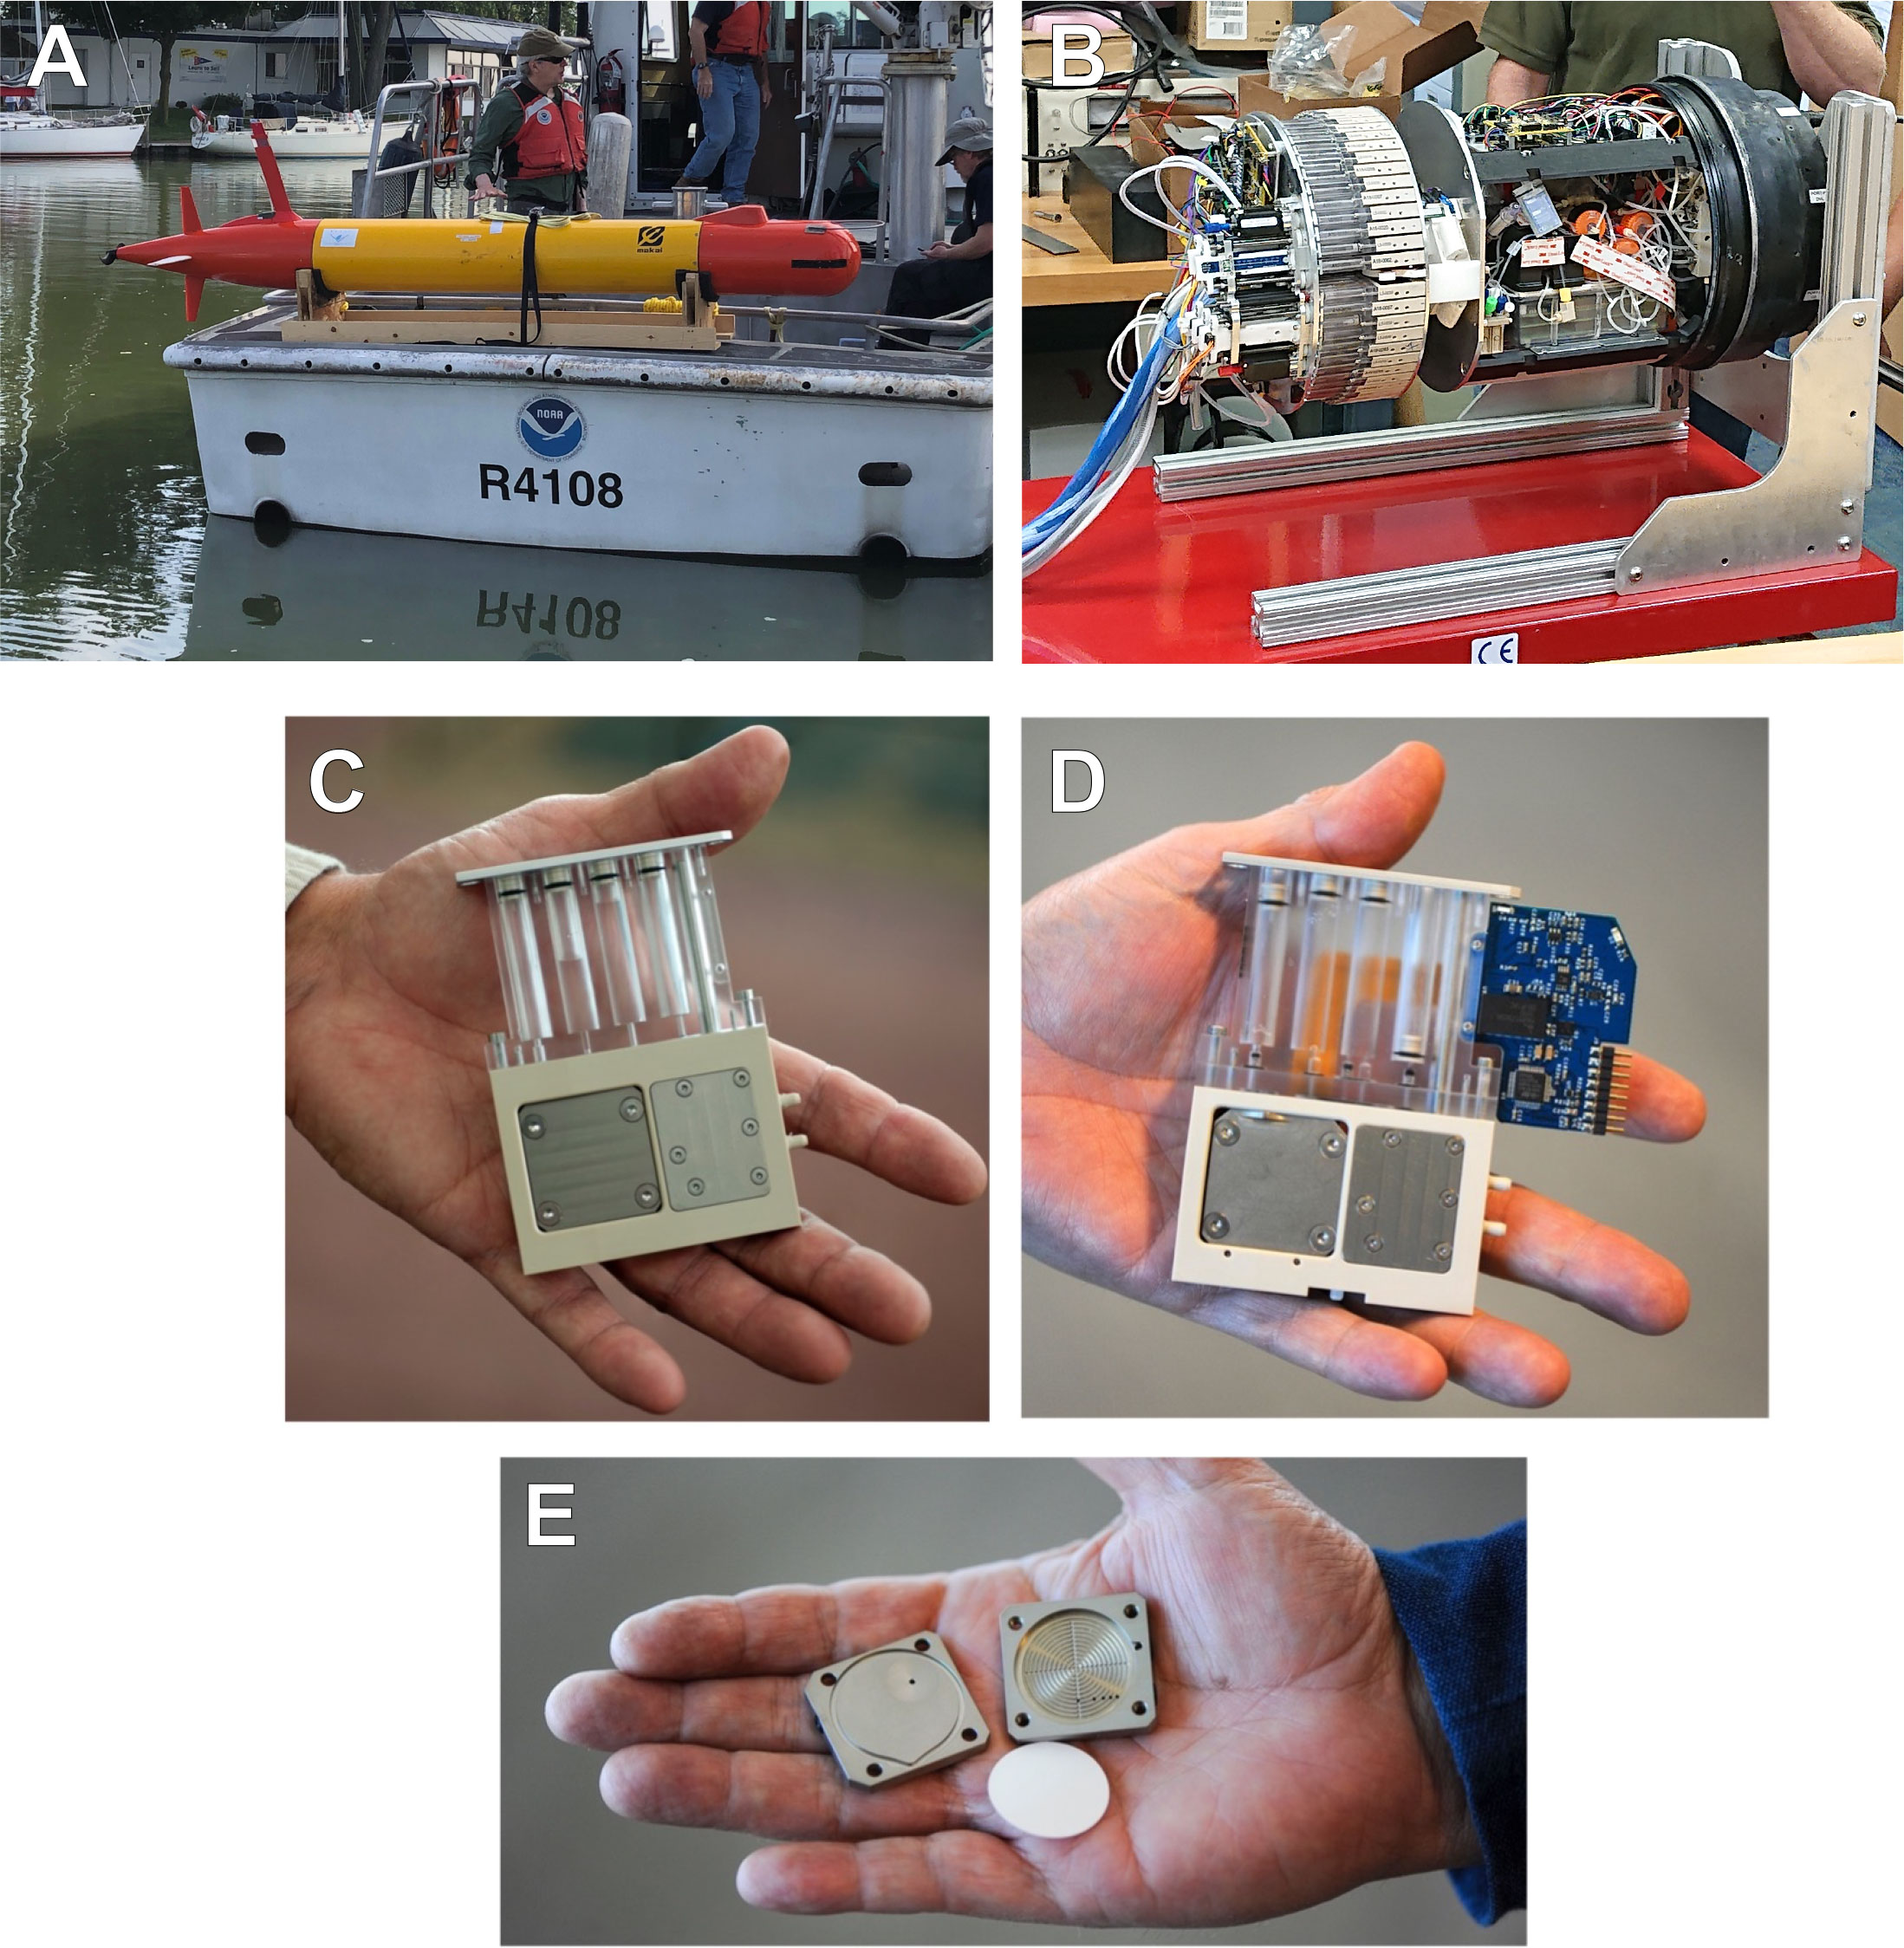
Figure 2 Components of the LRAUV-3G ESP instrument. (A) LRAUV equipped with a 3G ESP payload and ready for deployment from a small research vessel. (B) 3G ESP payload shown outside of the LRAUV. (C) An archive cartridge pulled from the rotating tray of the 3G ESP. (D) A lysis pulled from the rotating tray of the 3G ESP. (E) The filter housing (“puck”) used in both cartridge types that holds 25-mm membrane filter(s).
Archive cartridges concentrated particles in the sample water via filtration through two stacked 25-mm diameter Durapore filters (EMD Millipore, Burlington, MA, USA) consisting of a 5-μm filter sitting directly on top of a 0.22-μm filter. Once filtration completed, the sample volume was recorded and ~1.6 mL of RNALater® Stabilization Solution (Invitrogen, Carlsbad, CA, USA) was added to preserve the particulate samples for subsequent laboratory analyses (Pargett et al., 2015; Yamahara et al., 2019; Truelove et al., 2022). For lysis cartridges, the concentration of particle-associated microcystin in the resulting lysate was measured onboard the LRAUV in near-real-time using a surface plasmon resonance instrument employing a competitive ELISA assay (Ussler et al., 2019).
In 2018, the LRAUV-3G ESP generally collected samples in a triplicate configuration by sequentially engaging archive, lysis, and archive cartridges at a targeted depth of 3 m. In 2019, the LRAUV-3G ESP generally collected samples in a duplicate configuration, an archive followed by a lysis cartridge, at a targeted depth of 3 m. Sampling locations included stations used in the current routine monitoring program (Figure 1) and areas of high or low chlorophyll as determined from real-time data collected by LRAUV-3G ESP, sentinel LRAUV, and satellite. This study reports results of the archive cartridge collections only (Tables S1 and S2).
Conventional collection methods employed during routine monitoring in WLE were used to acquire samples for method comparison in 2019. Water samples were collected aboard NOAA vessel R4108 by manually deploying a Niskin sampling bottle overboard and collecting water at a depth of 3 m to match the depth of 3G ESP collections. Samples were filtered (36 mL–100 mL) through 25-mm stacked 5-μm and 0.22-μm Durapore filters (EMD Millipore, Burlington, MA, USA) using a vacuum manifold set at -7.5 inHg pressure. In this study, “matched” samples refer to a pair of samples collected within 30 minutes of each other and less than 0.5 km apart, in which one sample was collected by Niskin bottle and processed manually and the other collected and processed by the 3G ESP. Ten such “matched pairs” (20 samples total) were collected in 2019 (Tables S1 and S2).
All 3G ESP archive filters were aseptically recovered post-deployment at the Great Lakes Environmental Research Laboratory, placed in separate, sterile 2-mL screw-cap tubes (Sarstedt, Nümbrecht, Germany), and stored frozen at -80°C until processed. Conventionally collected samples were processed in the field (see above) and transported on dry ice to be stored frozen at –80°C alongside the 3G ESP filters. Samples were thawed on a microtube cooler just prior to DNA extraction and any residual RNAlater was removed. To extract DNA, all filters were incubated in 100 μL Qiagen ATL tissue lysis buffer, 30 μL proteinase K, and 300 μL Qiagen AL lysis buffer (Qiagen, Hilden, Germany) for 1 h at 56°C, with brief mixing every 15 min by vortex. After incubation, samples were vortexed at maximum speed for 10 min, lysates were homogenized using a Qiashredder column, and the filtrate was purified using the Qiagen DNeasy Blood and Tissue kit according to the manufacturer’s protocol. Purified DNA was quantified and assessed for purity using a NanoDrop Lite spectrophotometer (Thermo Fisher Scientific, Waltham, MA, USA). DNA extraction blanks consisted of 0.22-μm Durapore filters with 100 mL nuclease-free water filtered through them via vacuum filtration on a manifold. One blank filter was included in each group of extractions (2018: n=9, 2019: n=8).
The concentration of mcyE toxin gene was determined by the Toxin Gene assay (Phytoxigene, Inc., Belrose, AUS; Catalogue No: 205-0051), which targets the mcyE toxin gene in Microcystis species. The concentration of total cyanobacteria was determined by the Total Cyanobacteria assay (Phytoxigene, Inc.; Catalogue No: 205-0050), which targets a 16S rRNA gene marker for cyanobacteria. For each assay, duplicate qPCR reactions were used to amplify DNA extracted from 5-μm pore sized filters for both 3G ESP and manually collected samples. Quantification standards were provided with the assays (20-200,000 gene copies (gc) per μL, Phytoxigene ™ CyanoNAS standards). The concentration (Conc) of gene target in the original environmental sample (gc/mL) was calculated by adjusting the qPCR result for each reaction by the volume of water filtered for each sample according to Formula 1.
where Q is the quantity of template (gc per reaction), Vt is the DNA template volume, Vj is the volume of environmental sample filtered, and Vx is final elution volume for the DNA extracted from the sample filter, with no correction made for extraction efficiency. Additional details regarding qPCR assay runs and controls are available in the SM.
Amplicon sequencing of the 16S rRNA gene was used to characterize community taxonomy. Forward and reverse primers were custom ordered to follow the Earth Microbiome Project 16S Illumina Amplicon Protocol (Apprill et al., 2015; Parada et al., 2015), as detailed in the SM and Table S3. PCR was conducted on DNA extracts from all 5-μm and 0.22-μm filters using a BiooScientific NEXTFlex 16S V4 Amplicon-Seq Kit 2.0 (NOVA-520999/Custom NOVA-4203-04) (BiooScientific, Austin, TX, USA) at the University of Michigan Advanced Genomics Core1. Barcoded 16S amplicons were pooled together and sequenced at the University of Michigan Advanced Genomics Core using the Illumina MiSeq v3 600 cycle (2 x 300 bp) kit with 20% phiX spike-in. ZymoBIOMICS Microbial Community DNA Standards D6306 and D6311 (Zymo Research, Irvine, CA, USA) were included in each sampling run as positive controls.
The bioinformatics workflow Tourmaline was used to process 16S amplicon sequences (Thompson et al., 2022). Sequence quality was initially evaluated by running FastQC/MultiQC using default parameters (Andrews, 2010; Ewels et al., 2016). Primers were trimmed using Atropos (Didion et al., 2017); no quality trimming was performed at this step; and FastQC/MultiQC was rerun on the trimmed samples. Trimmed sequences were imported into Tourmaline for processing within QIIME 2 (Bolyen et al., 2019), utilizing DADA2 (Callahan et al., 2016) to generate amplicon sequence variant (ASV) tables from paired-end sequences. For 2018 16S amplicon sequences, DADA2 truncation values were set to 250 bp for Read 1 and 200 bp for Read 2. For 2019 data, DADA2 truncation values were set to 232 bp for Read 1 and 187 bp for Read 2. Truncation values were decided based on FastQC results and the script fastqc_per_base_sequence_quality_dropoff.py provided with the Tourmaline package.
Amplicon sequence variants (ASVs) classified as archaea, chloroplast, eukaryote, mitochondria, or unassigned were removed from the ASV table prior to analysis. For alpha diversity analysis, the remaining bacterial taxa were rarefied to an even sampling depth of 27,000 reads for 2018 and 20,000 reads for 2019 data. All other analyses using the amplicon sequence data used non-rarefied ASV table counts (Tables S4 and S5). Bacterial taxonomy was assigned to ASVs using a consensus BLAST approach against the Anacapa 16S database (Curd et al., 2019) (Tables S4 and S5). For convenience, ASVs highlighted in the text are provided in Tables S4 and S5 and named based on Microcystis ASVs identified using a previously published naming convention (Berry et al., 2017b) or by combining the lowest taxonomic level assigned to the ASV and the first four characters of the ASV Feature ID provided in the Tourmaline output.
ASV relative abundance was calculated for each sample by dividing the sample’s read count of an individual ASV by the total number of sample reads. ASV mean relative abundance and the standard deviation of relative abundances was calculated across four data subsets, 3G-ESP 5µm archive collections in 2018 and 2019, as well as 3G-ESP 0.22µm archive collections in 2018 and 2019. For comparisons of “matched pairs”, Alpha diversity (Shannon’s diversity index) was calculated using Phyloseq (McMurdie and Holmes, 2013). Beta diversity was calculated using Robust Aitchison PCA using DEICODE implemented in QIIME 2 (Martino et al., 2019). ASVs classified to the phylum cyanobacteria and the genera Microcystis were separately identified and analyzed in QIIME 2 (Bolyen et al., 2019).
Metagenomic sequencing was used to further characterize community taxonomy across samples. Aliquots of DNA extracted from both the 5-μm and 0.22-μm filter fractions of 3G ESP collected samples were submitted to the University of Michigan Advanced Genomics Core for library construction using the NEBNext® Ultra™ II FS DNA Library Prep Kit (New England Biolabs, Ipswich, MA, USA). For each deployment year, submitted samples were sequenced on 25% of an Illumina NovaSeq 6000 sequencing run (300 cycle) with a S4 flowcell. Primers were trimmed from the sequence data using Atropos (Didion et al., 2017), with no quality trimming performed at this step. FastQC/MultiQC was run to evaluate sequences before and after trimming.
Alpha diversity metrics for metagenomic sequences were generated by Nonpareil v.3.4.1 (Rodriguez-R et al., 2018). Trimmed Read 1 FASTQ sequences were processed using the Nonpareil k-mer algorithm (-T kmer) with k-mer length 24 (-k 24) using 10,000 random sequences (-X 10000) with 36 treads (-t 36) and 64 GB of RAM (-R 64000). Nonpareil curves, diversity (Nd) scores, and other statistics were generated in R v.4.2.1 using the command Nonpareil.set(). For beta diversity analysis, species-level counts were generated. Taxonomic assignments and relative abundances were first provided by Kraken 2 v.2.1.1 (Wood et al., 2019) and Bracken v.2.5.0 (Lu et al., 2017) using the reference library PlusPF, composed of the Kraken 2 standard plus protozoa and fungi collection based on NCBI RefSeq2. Non-bacterial counts were filtered from the output using KrakenTools3, and Bracken was run to generate species-level counts. Beta diversity was calculated using Robust Aitchison PCA using DEICODE implemented in QIIME 2 (Martino et al., 2019).
To further explore potential toxin production and provide targeted gene analysis using the metagenomic sequencing data, BLASTN v.2.8.1 was used to identify all mcy genes that comprise the microcystin biosynthetic operons (Tillett et al., 2000; Yancey et al., 2022). Reads were aligned to a BLAST database4 that contained all publicly available mcy genes found on IMG/MER5 (accessed January 2021). This database included all mcy genes from Microcystis, as well as mcy genes from other taxa to provide competitive read mapping. Reads were counted as a positive hit if they aligned to a sequence with at least 80% query coverage and 95% identity. Positive hit reads were relatively quantified and normalized by average length of gene. Hit counts for ambiguously mapped reads (i.e., reads that mapped to more than one sequence with an identical bit score) were divided among the sequences.
Equivalency of sampling methods was examined for a variety of parameters (n=12; Table 1) by performing comparisons between the ten “matched pairs” collected in 2019 (Table S1). qPCR concentrations from both Toxin Gene and Total Cyanobacteria assays were log transformed prior to statistical analysis. Cyanobacteria and Microcystis ASV mean relative abundances were compared to examine agreement between 16S amplicon taxonomic designations for primary cyanoHAB community members. Alpha and beta diversity measures were compared to test whether community diversity was equivalent for both 16S amplicon and metagenomic sequencing results. All comparisons used the Wilcoxon rank-sum test (α = 0.05) with the exception of comparisons of beta diversity, which used PERMANOVA testing in R with the adonis2 function from the vegan package (Oksanen et al., 2015) (Tables 1 and S6). Most statistical comparisons utilized data derived from the 5-μm pore sized filter where cyanoHAB biomass is concentrated in the form of Microcystis colonies and associated bacterial assemblages (Table 1).
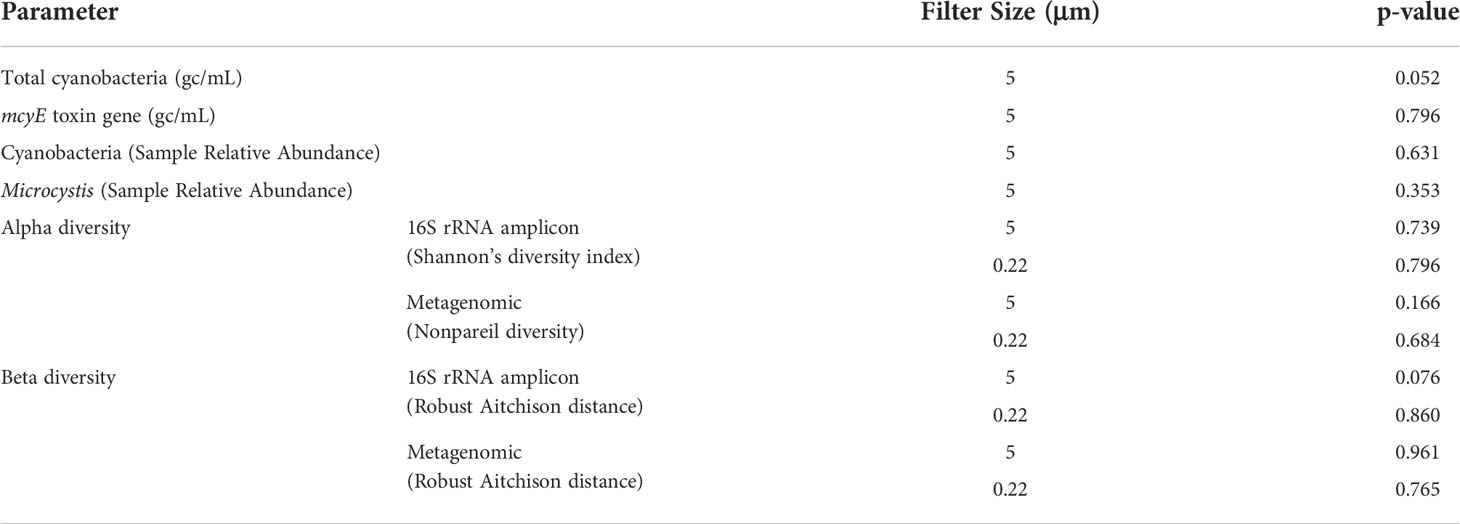
Table 1 Results of statistical analyses to test for equivalency between manual (Niskin) and autonomous (3G ESP) sampling methods.
Cyanobacterial Index (CI) values, a proxy of chlorophyll a absorption representing cyanobacterial biomass (Wynne et al., 2010; Urquhart et al., 2017; Mishra et al., 2019), were extracted from processed satellite imagery (U.S. Department of Commerce - NOAA, 2021a) for 13 of the 20 days in which the LRAUV-3G ESP collected samples (6 days in 2018 and 7 days in 2019). CI values were not calculated if >50% of the area used for the calculation was obscured by cloud cover. CI values were correlated to concentrations obtained from the Total Cyanobacteria qPCR assay. CI values were calculated in three ways: 1) averaged from within a 5-km radius of the sample coordinate, 2) averaged within a 1-km radius, and 3) the nearest to the sample coordinate. Correlations between CI value and total cyanobacterial concentration (log gc/mL) were assessed by Spearman rank correlation.
Operations in WLE created challenges for the LRAUV-3G ESP compared to the deep oceanic environments where the vehicle is typically deployed. Lessons learned in the field were translated into engineering solutions that were implemented over the two years of field testing. Initially, the buoyancy engine could not provide the fine-scale control of vertical movement needed for propulsion-free hovering. A new flight pattern termed the “donut” was created mid-deployment to maintain stabilizer control during sampling. The LRAUV-3G ESP was instructed to operate in level flight with rudder hard over, resulting in ~30 m diameter circles during sampling at station. This adaptation to the flight behavior allowed the instrument to maintain a stable depth in the water column and samples were collected successfully. Engineering modifications coupled with experience allowed for faster and finer buoyancy control during the 2019 deployment to better approximate the type of drift sampling performed in the ocean, but propulsion was still required to maintain vehicle control in WLE. The adjusted flight behavior did impact energy reserves, requiring vehicle recovery halfway through both year’s deployments for overnight battery charging on shore.
Poor buoyancy control in WLE resulted in the LRAUV hitting the bottom in 2018. Mud gathered in the nose section and the vehicle became stuck, although no substantial damage was incurred. The water depth was so shallow that the aft section protruded, allowing the vehicle to maintain cellular communications so the vehicle could be found and dislodged. Despite vehicle limitations, the overall system was found capable of executing on-the-fly modifications to the mission design, allowing for sampling to be adapted to a variety of needs and circumstances.
The LRAUV-3G ESP successfully collected and preserved samples over 11 days in 2018 and 12 days in 2019 (Tables S1 and S2). Archive sample filtration time ranged from 1 to 48 minutes for filter volumes ranging from 15 to 738 mL, depending on particle load. Average collection depth ranged from 2.4–4.0 m in 2018 and 0.2–5.2 m in 2019. Water temperature during collection ranged from 23.7–25.4°C in 2018 and 22.3–25.3°C in 2019. Every archive cartridge deployed in 2018 and 2019 provided sufficient preservation of biomass for recovery of nucleic acids.
Overall, data suggested that equivalent results were obtained whether samples were collected and processed autonomously by the LRAUV-3G ESP or by Niskin bottle with vacuum filtration. No significant differences were observed between “matched pairs” with autonomous versus manual collection strategies for all 12 evaluated parameters (Table 1). Samples yielded similar results for analysis by qPCR (Toxin Gene and Total Cyanobacteria assays), 16S amplicon ASV relative abundance (cyanobacteria and Microcystis), alpha diversity (16S amplicon and metagenomic sequencing) (Figure 3), and beta diversity (Figure 4).
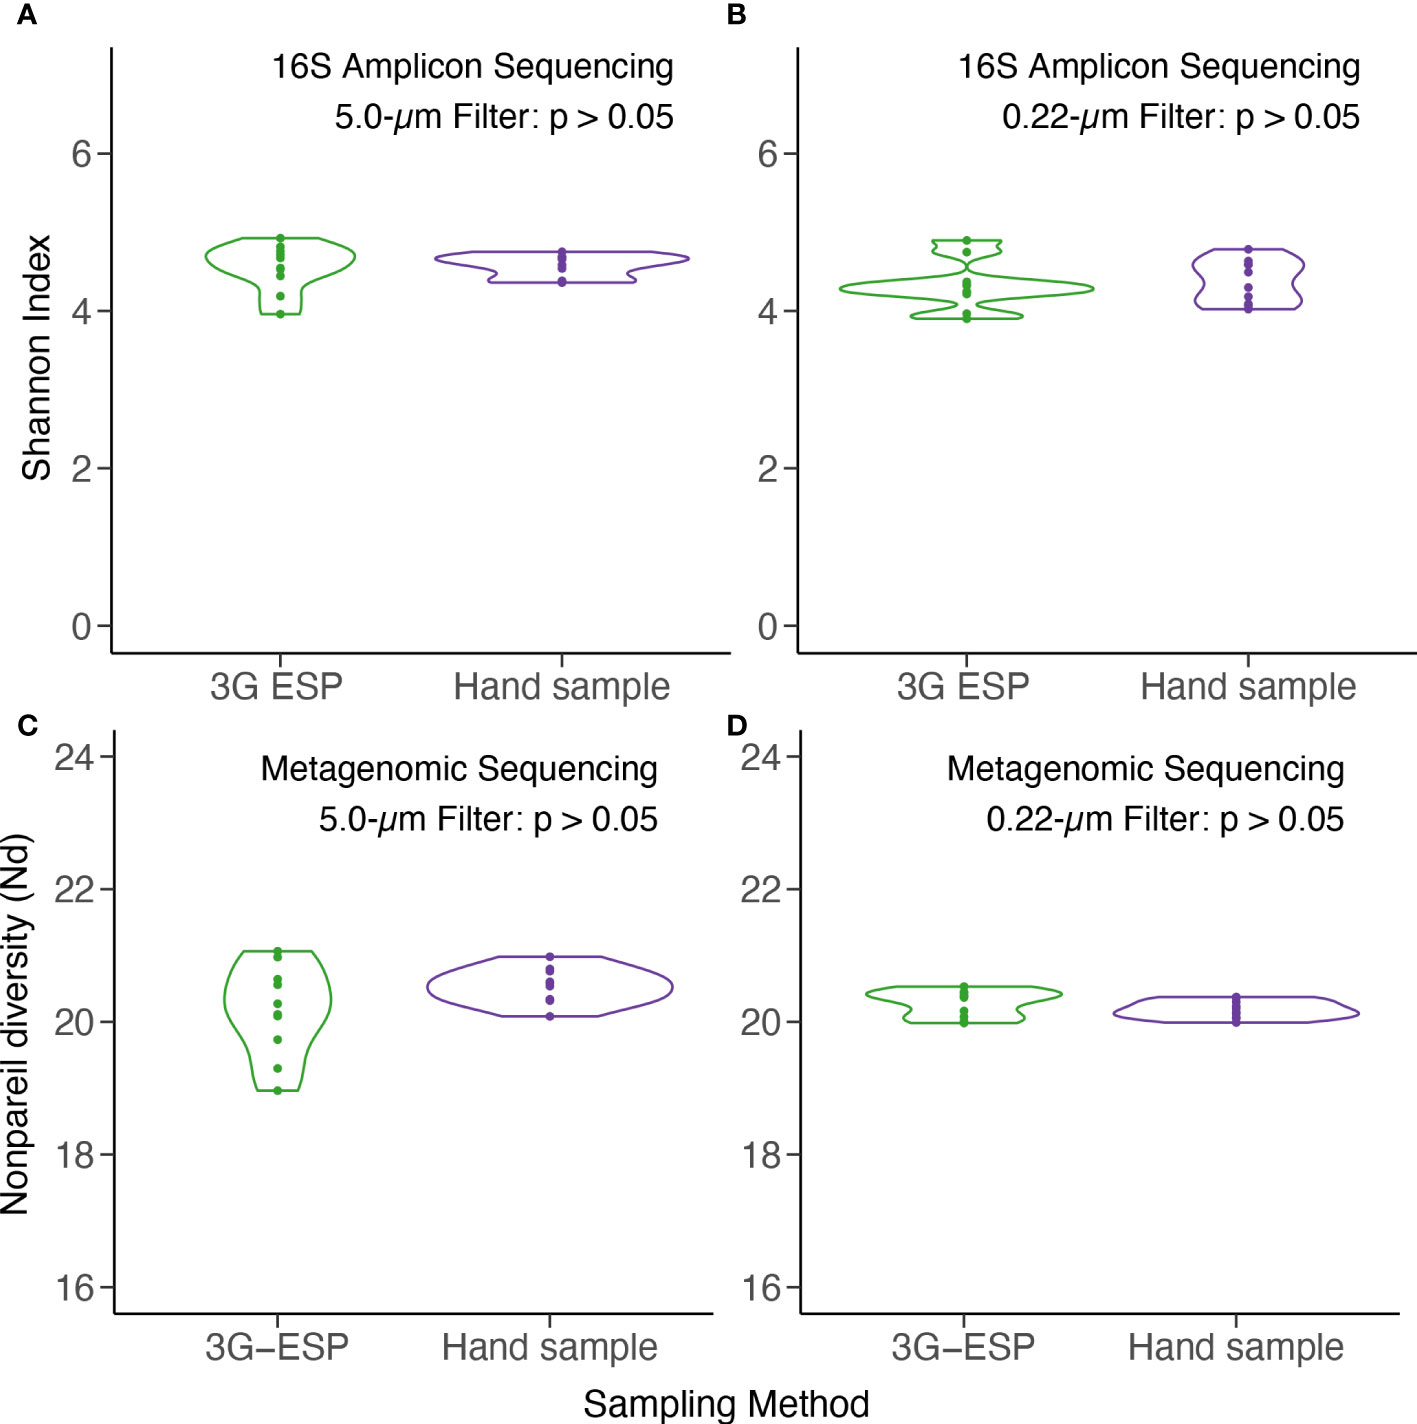
Figure 3 Alpha diversity as measured by Shannon Index for 16S amplicon (top) and Nonpareil Diversity for metagenomic (bottom) sequencing of DNA. Samples were collected autonomously (“3G ESP”) and manually by Niskin (“hand”) and extracted from 5-μm (A, C) and 0.22-μm (B, D) pore size filters. See Table 1 for statistical analysis.
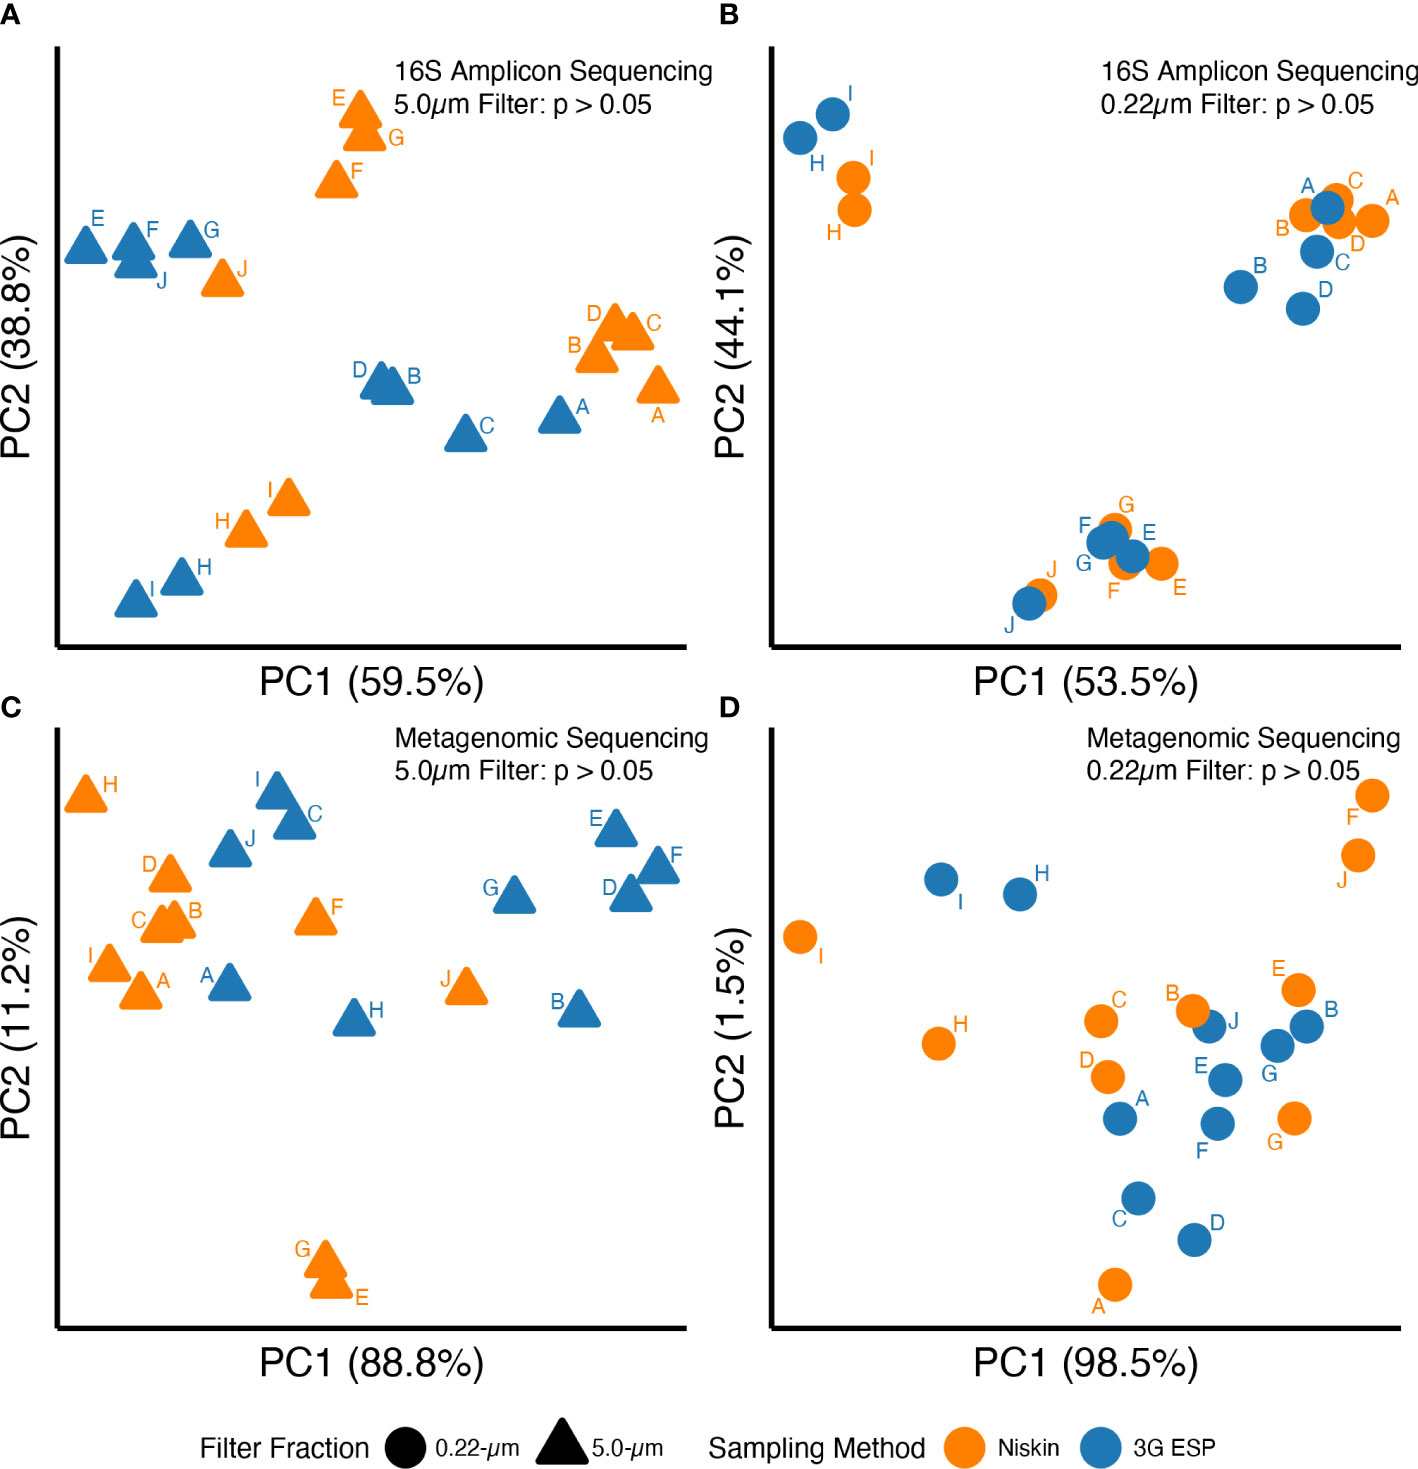
Figure 4 16S amplicon (A, B) and metagenomic (C, D) sequences for DNA extracted from 5-μm (triangles) or 0.22-μm (circles) filters. Samples were collected either manually (orange) or autonomously (blue) and data point labels (A–J) indicate matched pairs (see main text for definition). See Table S6 for PERMANOVA results.
For both the Toxin Gene and Total Cyanobacteria qPCR assays, concentrations varied greatly (spanning several orders of magnitude) depending on sample location (Table S7, Figure S2). Higher mcyE toxin gene and total cyanobacterial concentrations were observed in 2019 relative to 2018 (Figure 5). Linear relationships between total cyanobacteria and mcyE toxin gene were noted (Figures 6, S3) and these parameters were significantly correlated during both years of deployment by Spearman rank correlation (α = 0.05, Table 2).
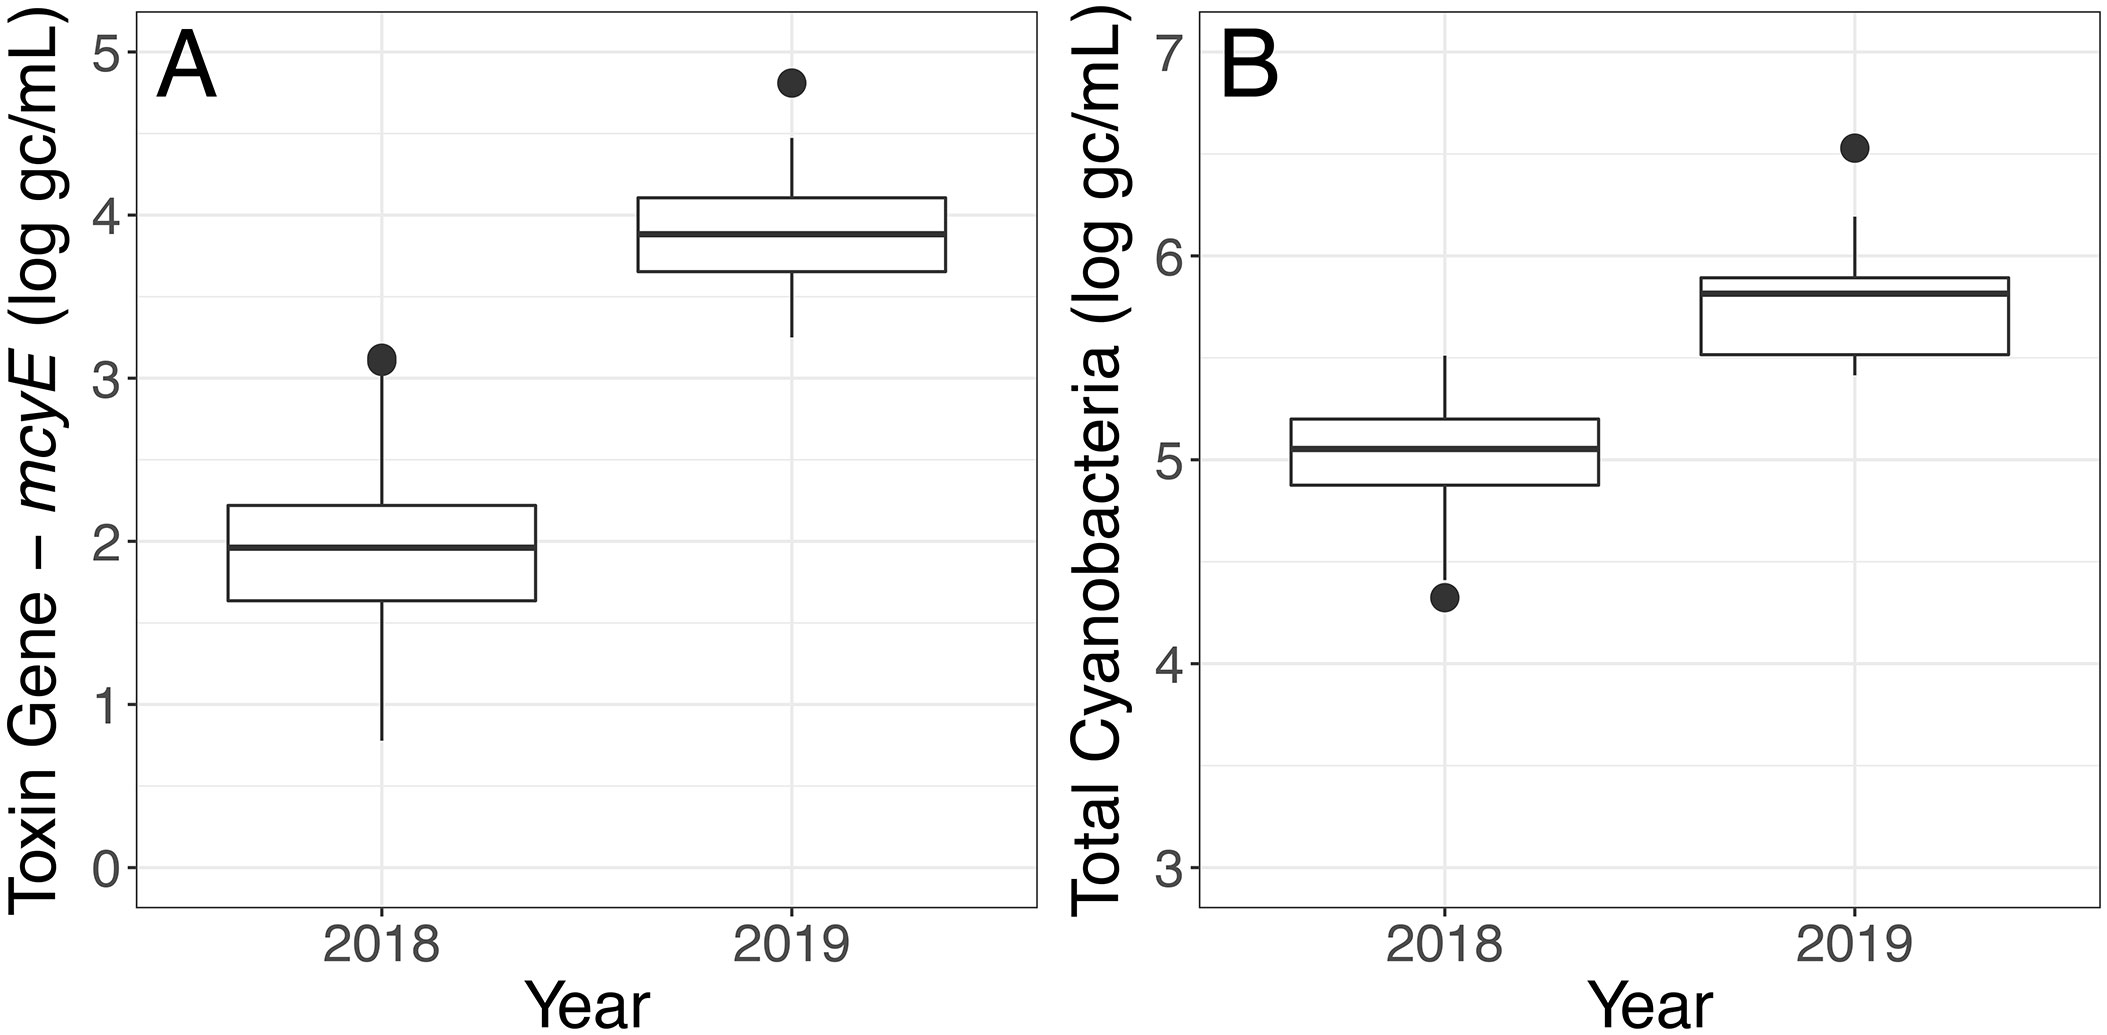
Figure 5 qPCR assay results of samples collected in 2018 and 2019 using the LRAUV-3G ESP. (A) Toxin Gene (log gc/ml) and (B) Total Cyanobacteria (log gc/ml).
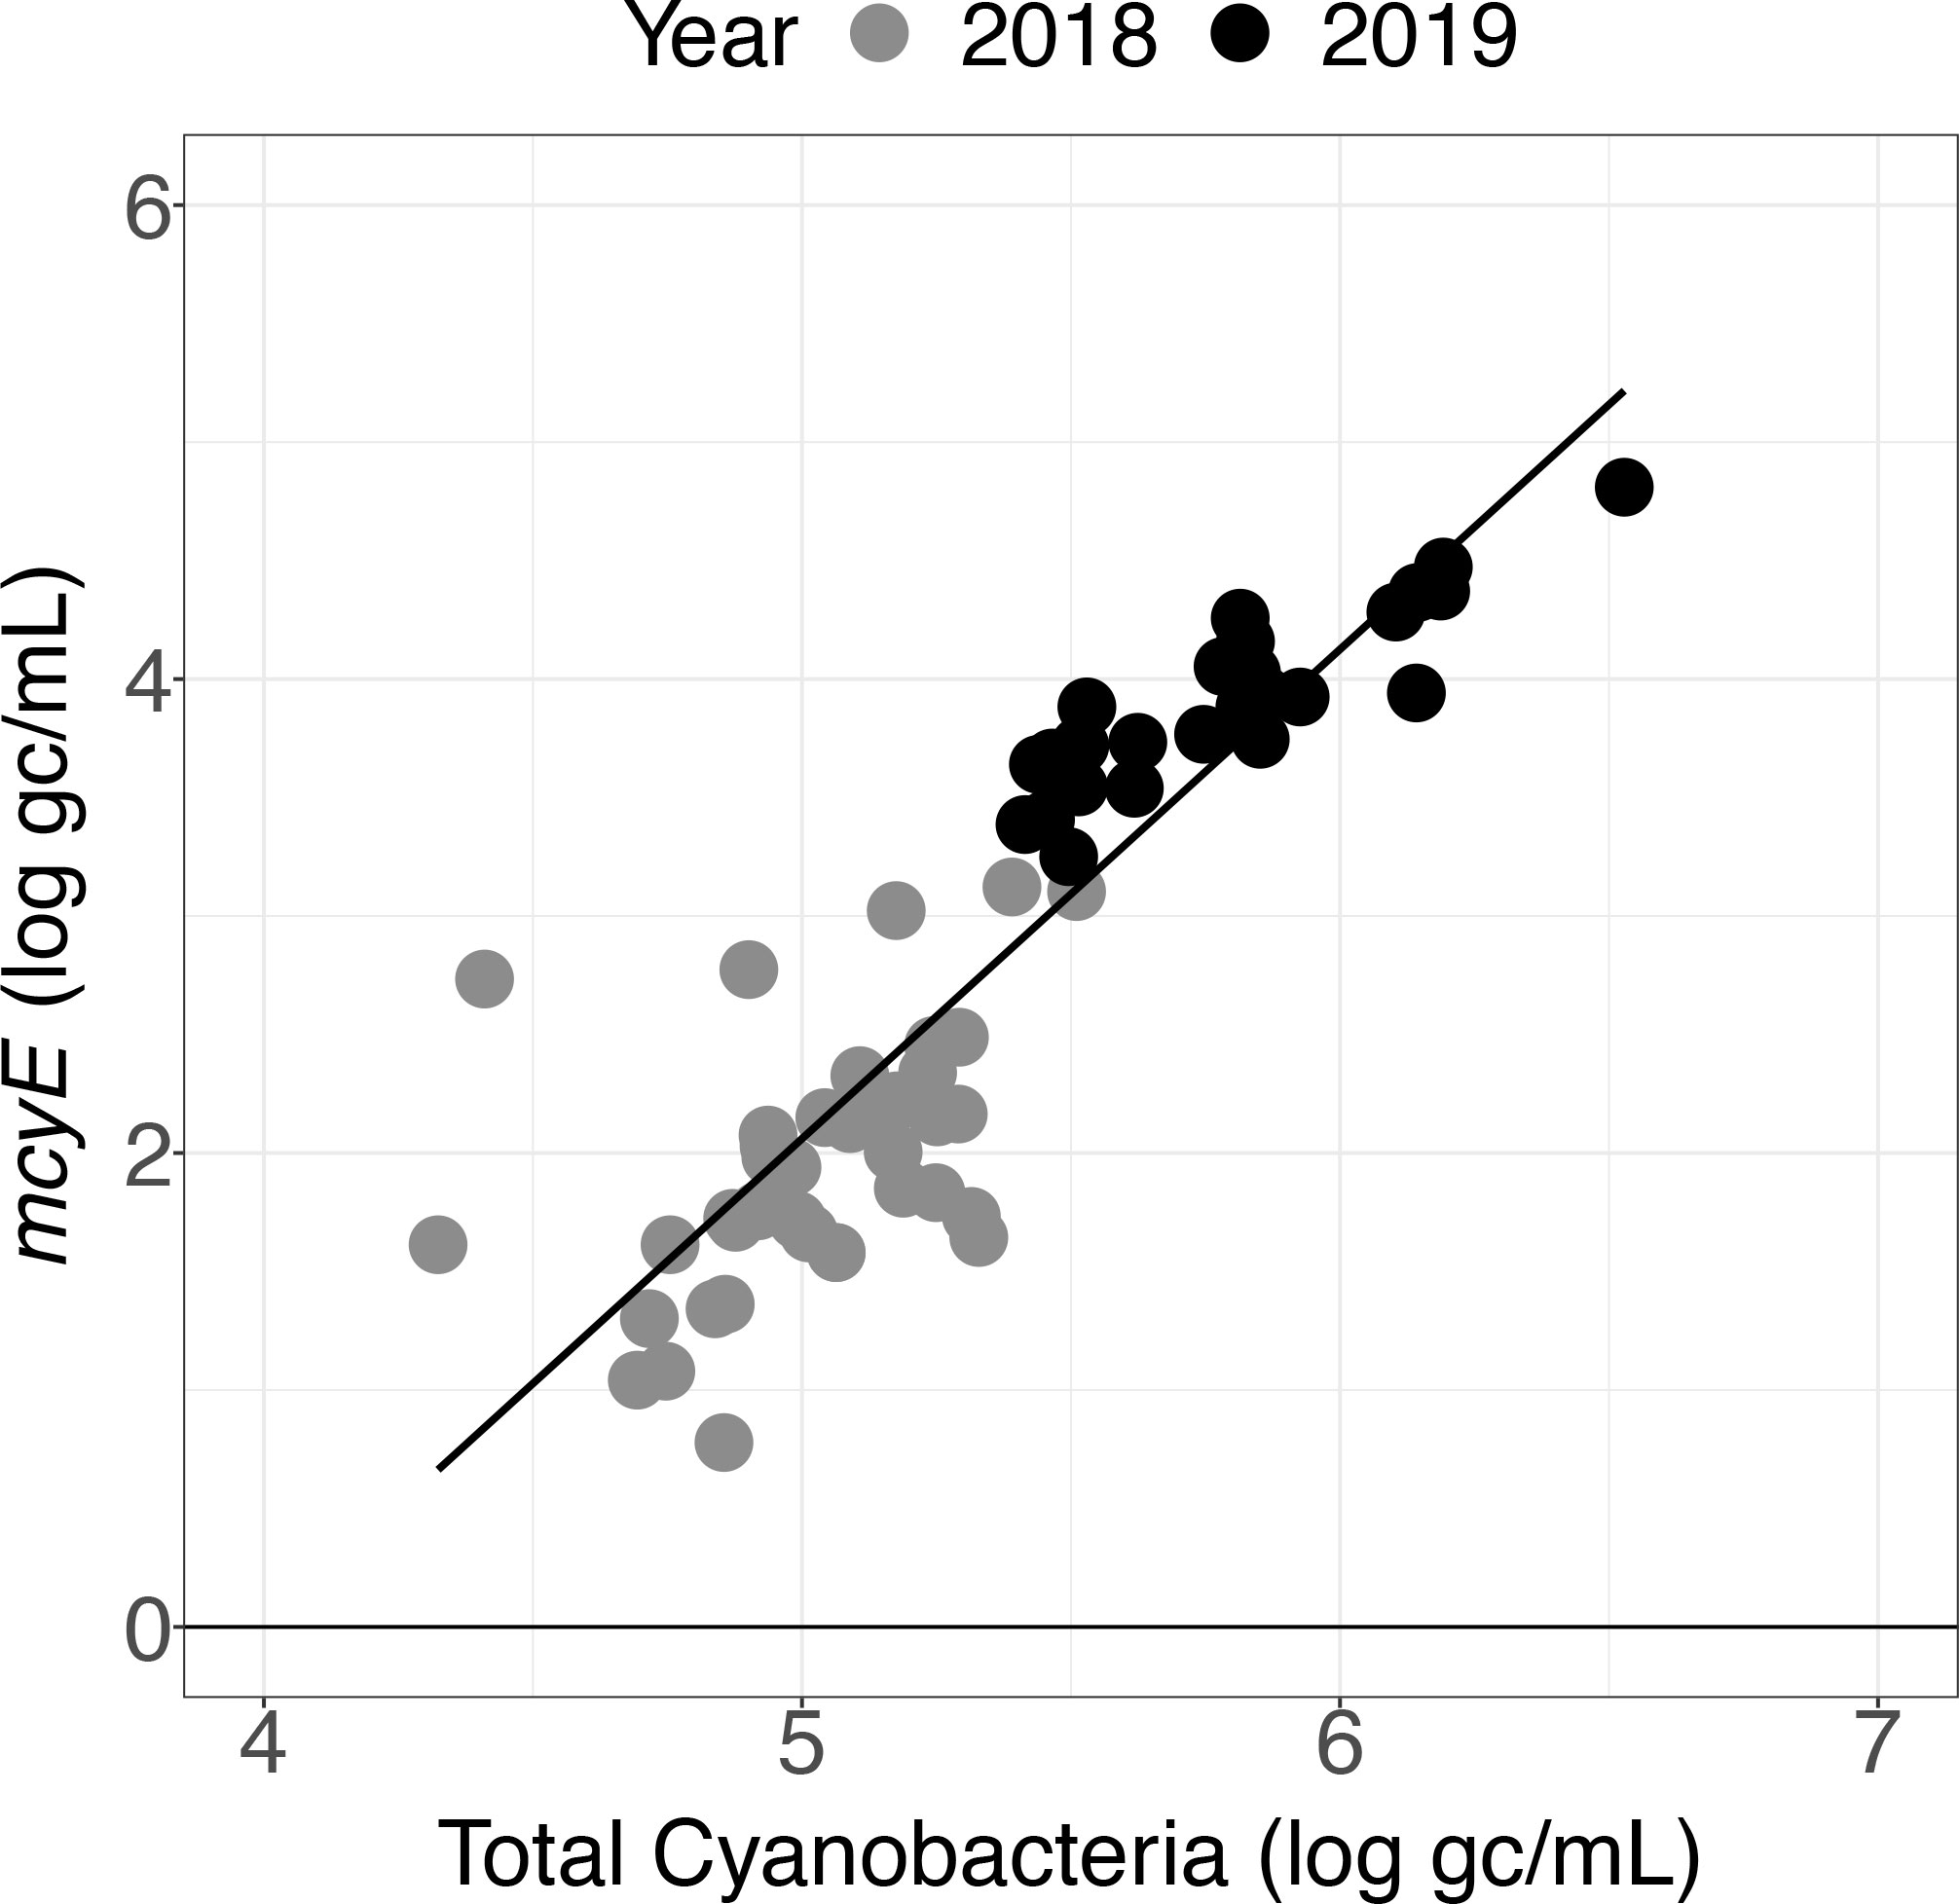
Figure 6 Toxin Gene and Total Cyanobacteria qPCR assay results for samples collected in 2018 and 2019 using the LRAUV-3G ESP.
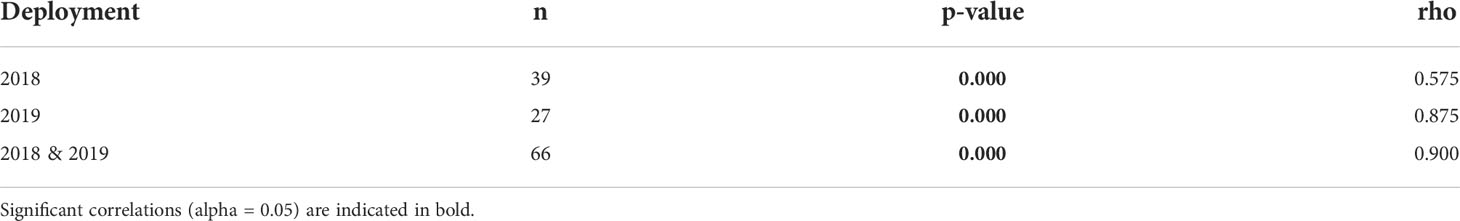
Table 2 Spearman rank correlation results testing correlation between Phytoxigene Toxin Gene and Total Cyanobacteria qPCR assay concentrations (log gc/mL).
Agreement between water collected in situ by the LRAUV-3G ESP and satellite observations was evaluated by comparing the results of the Total Cyanobacteria qPCR assay to CI values (Figures S4 and S5). Correlations between the Total Cyanobacteria qPCR assay and CI were significant for all three methods used to calculate CI values (Spearman rank correlation, α = 0.05) (Table 3). For the 13 sufficiently clear days, the CI values calculated by averaging over a 5 km radius to the nearest autonomously collected water sample provided the strongest correlation to the Total Cyanobacteria qPCR assay (R2 = 0.57; Figure S4). The R2 dropped to 0.42 when the CI was averaged over 1 km radius and 0.36 when a nearest individual CI value was used in the correlation.
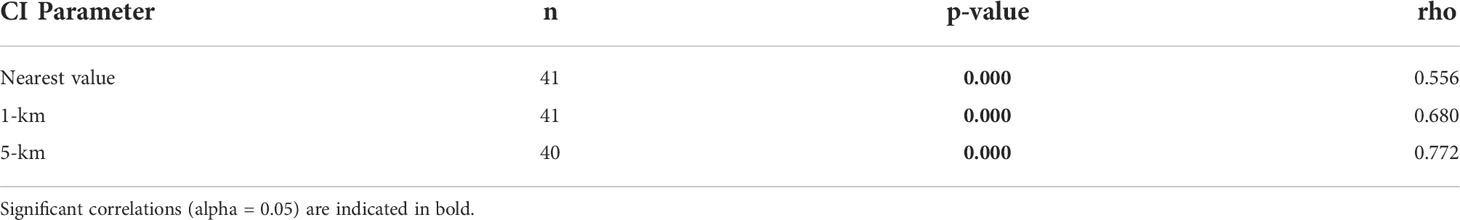
Table 3 Spearman rank correlation results testing correlation of Total Cyanobacteria qPCR assay concentrations (log gc/mL) versus Cyanobacterial Index (CI) calculated based on three conditions.
Metagenomic analysis was utilized to corroborate the assumption that the presence of mcyE (the gene target in the Toxin Gene assay) was proportional to the full complement of genes in the operon used to produce microcystin. Testing the assumption that mcyE gene detection in the qPCR assay infers genomic potential to produce microcystin toxin was valuable because not all Microcystis strains in the Great Lakes contain the full complement of genes (Yancey et al., 2022). In the samples tested here, the normalized abundance of sequence reads for each mcy gene had a strong correlation with the normalized abundance of mcyE reads, with all gene correlations possessing an R2 value of 0.95 or greater (Figure 7).
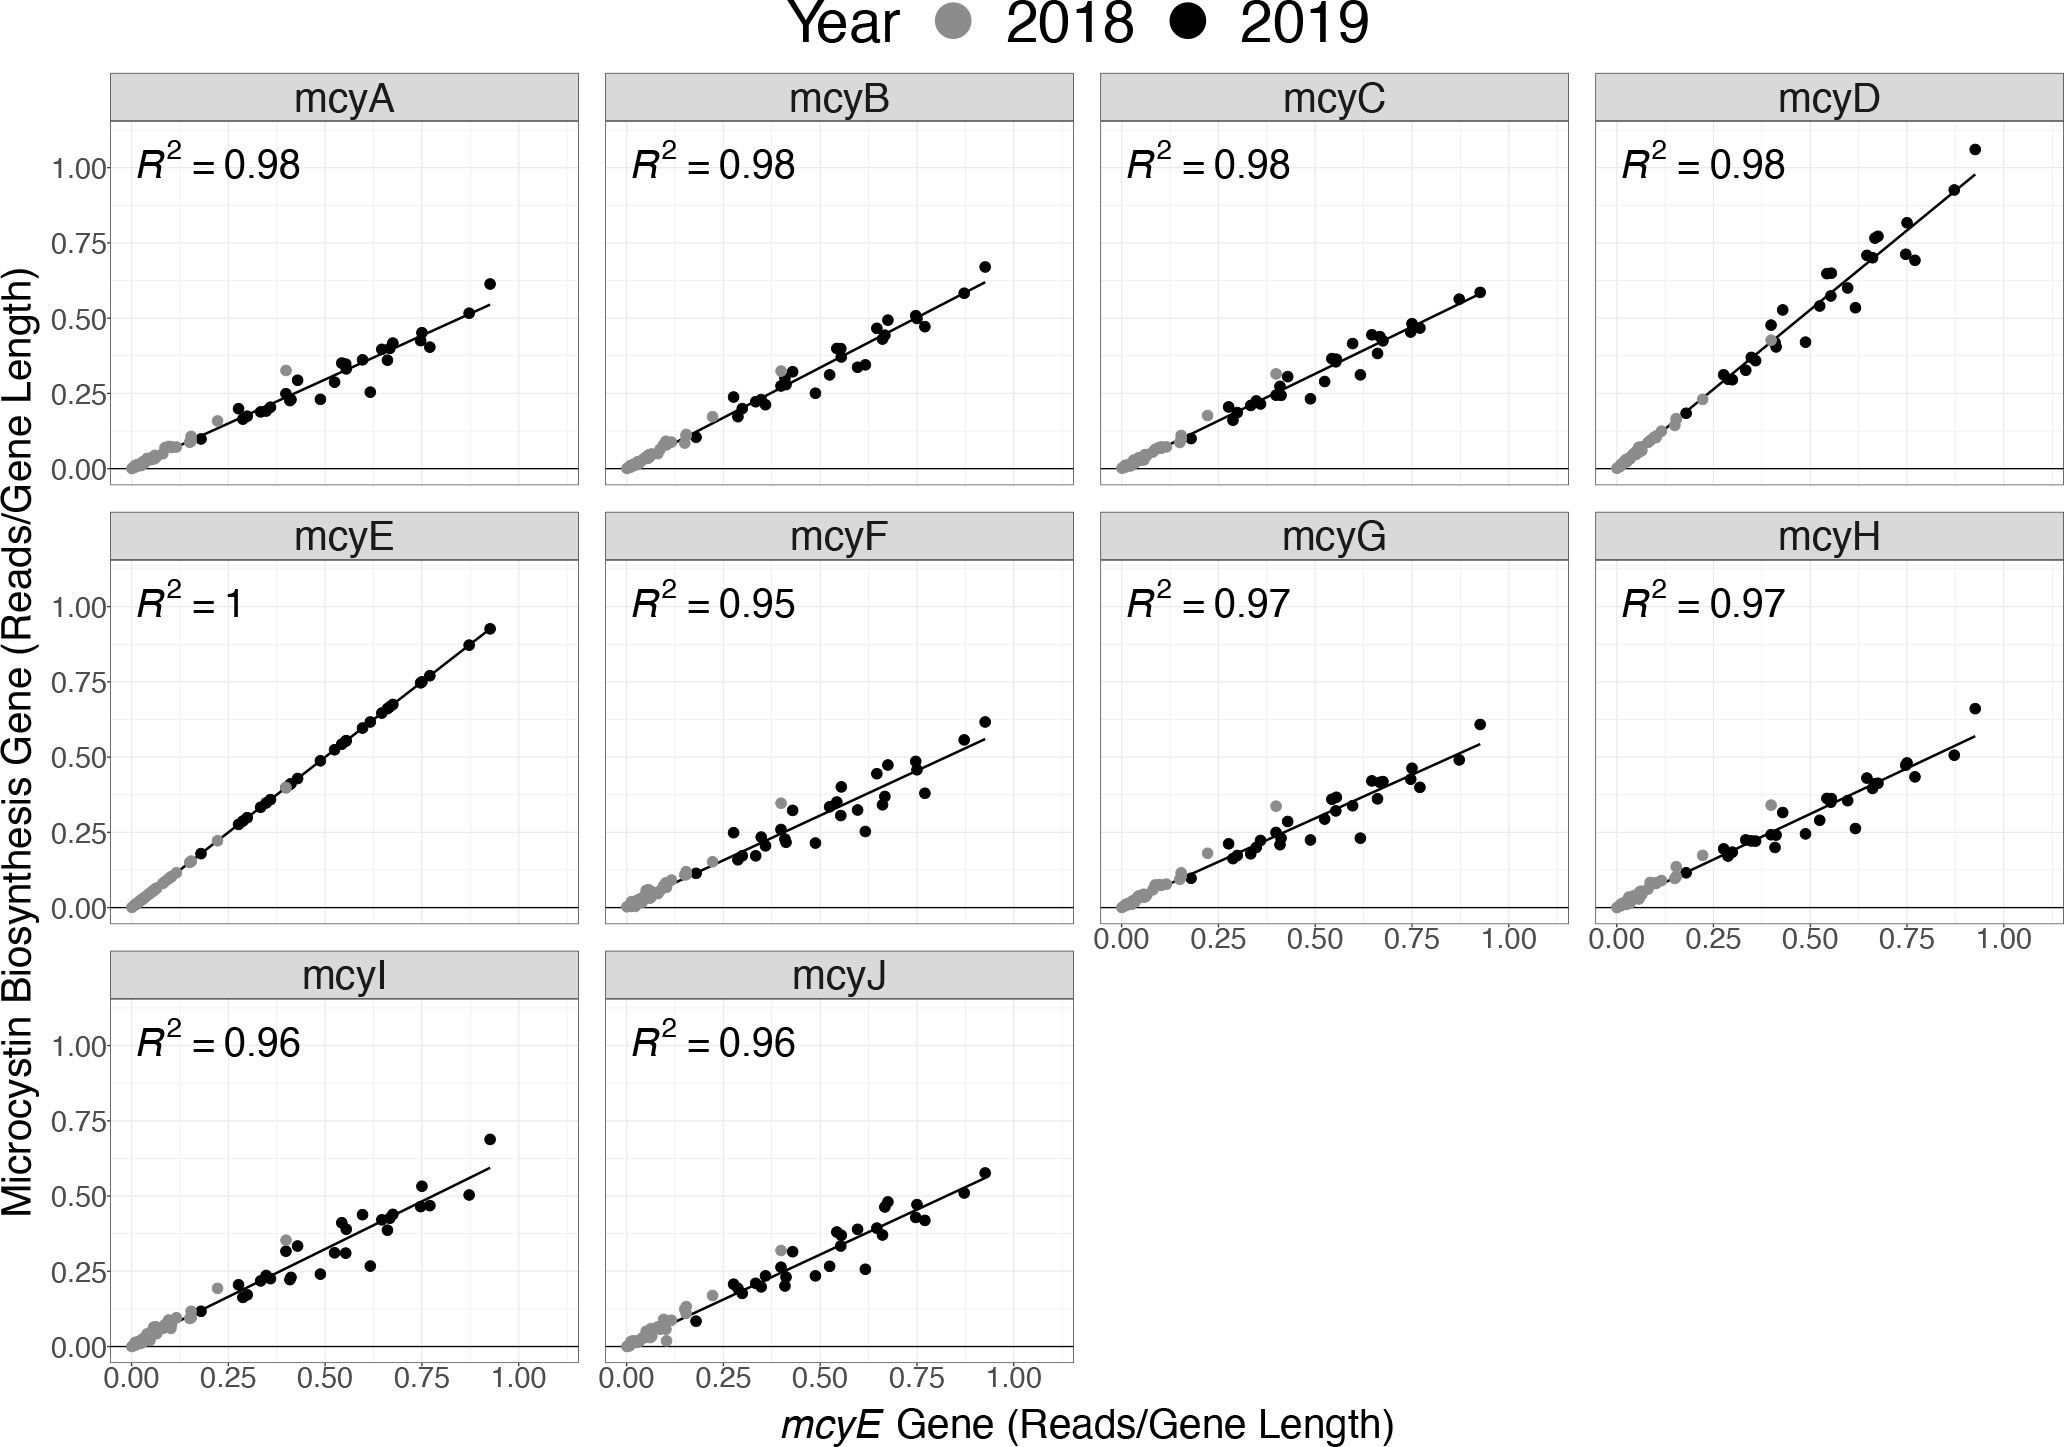
Figure 7 Normalized abundance of sequence reads from genes of the full mcy operon (mcyA–J) versus only the mcyE gene based on the metagenomic data for samples collected in 2018 (grey) and 2019 (black).
In addition to insights on Microcystis in WLE, samples collected via the LRAUV-3G ESP provided information on the broader microbial community. In general, the observed taxonomic composition at the phylum-level was similar for both deployment years, with Cyanobacteria shifting into dominance in 2019 compared to 2018. Overall, the same set of taxa filled the top slots, with the top four phyla representing ~10-30% of the bacterial community and the second set of six phyla representing ~1-7% for the 5-µm size fraction (Table 4). For the 0.22-μm size fraction, the top three phyla were Bacteroidetes, Proteobacteria, and Actinobacteria during both years, representing between 12-39% of the community (Table S8).
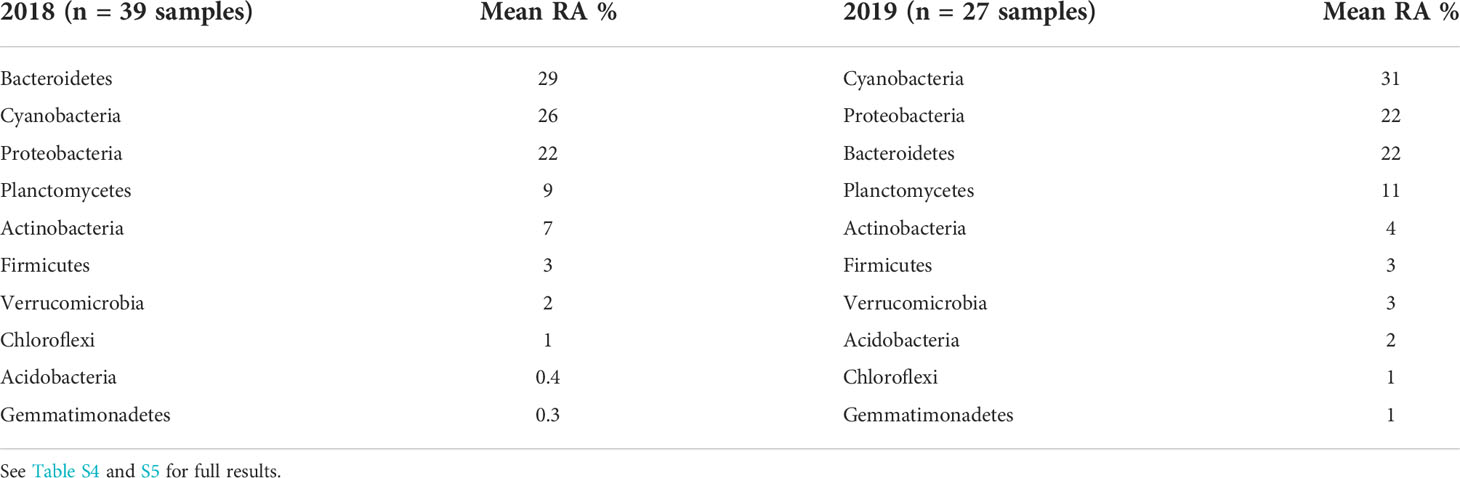
Table 4 Top 10 bacterial taxonomic assignments to the level of phylum for 16S amplicon relative abundances (RA) obtained from the LRAUV-3G ESP 5-µm size fraction samples, by deployment year.
In addition, the amplicon data afforded higher resolution analysis. At the level of ASV, the cyanobacterium Synechococcus 107b was the most abundant in the 5-μm archive filter fraction in 2018, with a mean relative abundance (± standard deviation) of 4.3 ± 3.5% (Figure 8). The next most abundant ASV was identified as Actinobacteria 9cfa (2.2 ± 1.2%) followed by Microcystis CCG (2.1 ± 1.5%), with Microcystis CTT (1.4 ± 1.2%) and Microcystis CTG (0.6 ± 0.4%) also having a notable presence in the bacterial community. In total, 8,829 unique ASVs were identified from all samples collected in 2018 (n=91) (Table S4).
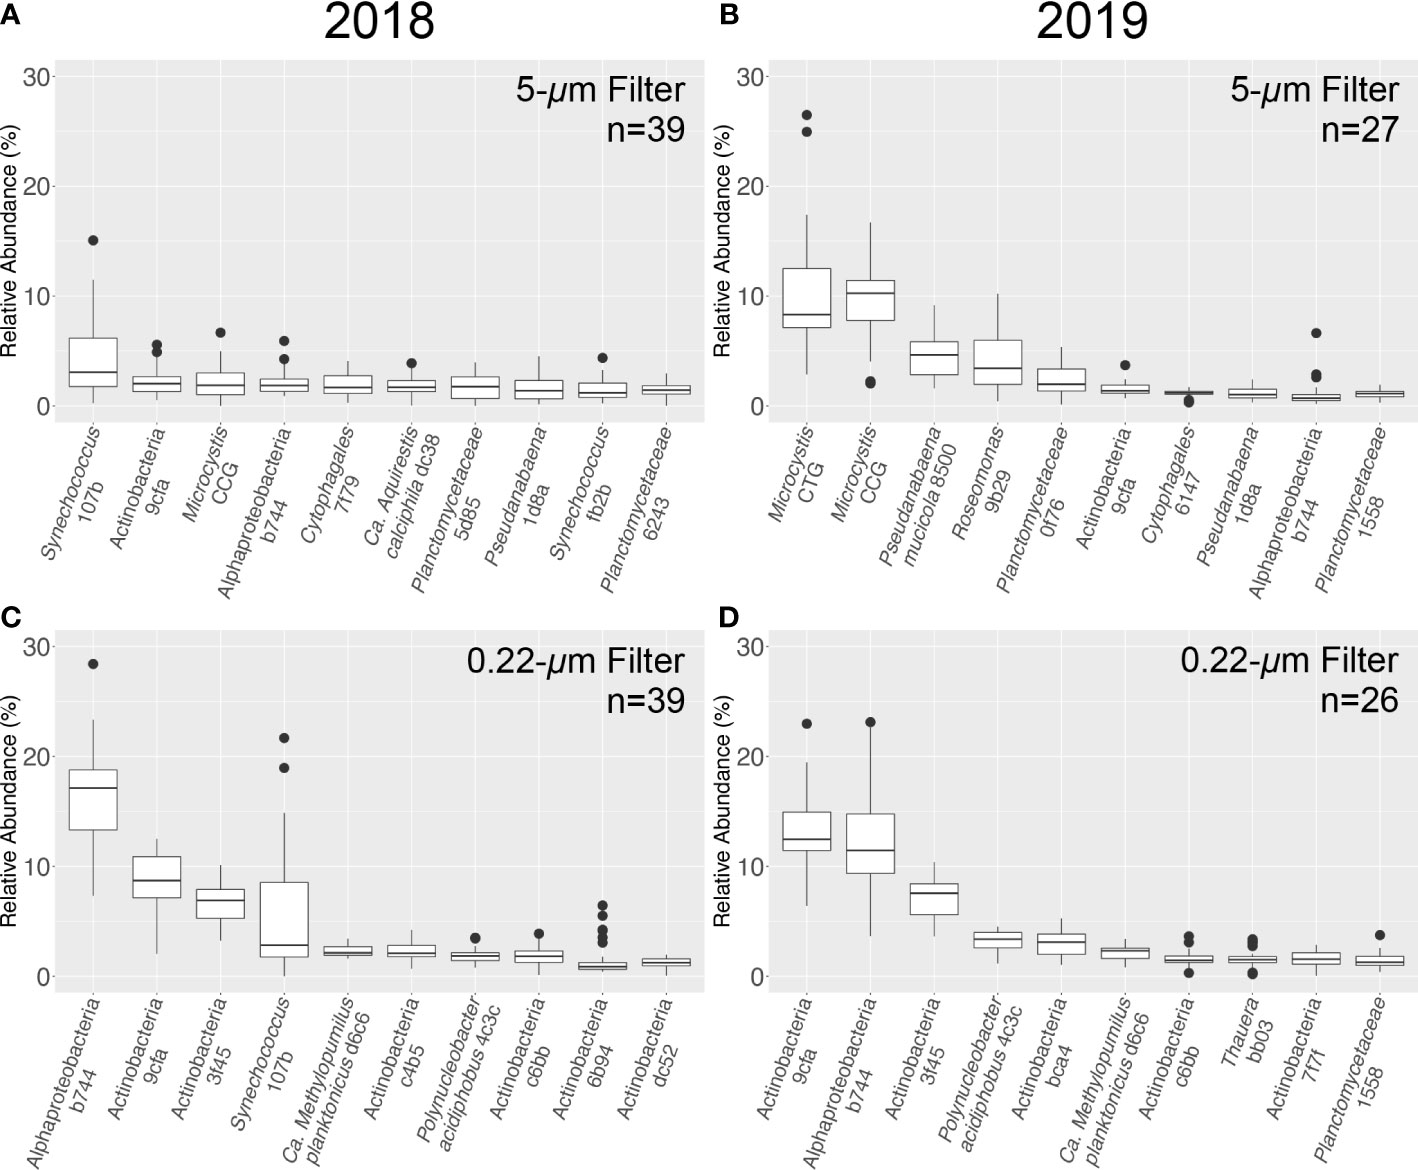
Figure 8 Relative abundance (%) for the ten most abundant 16S ASVs obtained from LRAUV-3G ESP archive cartridge 5-μm (top) and 0.22-μm (bottom) size fractions. Samples collected in 2018 (A, C, left) and 2019 (B, D, right).
Consistent with the higher Toxin Gene qPCR results for 2019 (Figure 5), the two most abundant ASVs collected on the 5-μm archive filters were identified as the potentially toxigenic Microcystis CTG (10.4 ± 5.7%) and Microcystis CCG (9.3 ± 3.6%). In contrast, Synechococcus 107b only comprised a mean relative abundance of 0.2 ± 0.4% of the bacterial community sequenced. In total, 4,354 unique ASVs were identified across all samples collected in 2019 (n=88) (Table S5). Other Microcystis ASVs observed in 2019 included Microcystis CTT (0.6 ± 1.2%) and Microcystis CT(A)G (0.3 ± 0.3%) (Figure 8). Microcystis was the most abundant bacteria retained in the 5-μm fraction for most environmental samples collected in 2019, with the exception of two samples (SC51-50 and SC55-50) (Tables S1 and S2). Roseomonas 9b29, an alphaproteobacteria, was the most abundant ASV in both of these samples.
The three most abundant ASVs identified on the 0.22-μm pore size filters were classified as Actinobacteria 9cfa, Alphaproteobacteria b744, and Actinobacteria 3f45 for both years of deployment (Figure 8). Consistent with the 5-μm fraction, ASVs identified in the 0.22-μm fraction as Synechococcus 107b were more abundant in 2018 (5.3 ± 5.4% relative abundance) compared to 2019 (0.03 ± 0.04%). As expected, cyanobacteria appeared to have been mostly retained on the 5-μm filter; the most abundant cyanobacterial ASV in 2019 from the 0.22-μm filter dataset was Microcystis CTG (0.4 ± 0.3% relative abundance). ASV names, taxonomic assignments, and sequences are detailed in Tables S4 and S5.
The LRAUV-3G ESP system successfully collected and preserved samples for nucleic acid analysis in the Great Lakes, demonstrating adaptability of the system to new environments. The instrument performed within its intended specifications and exemplified an ability to carry out its mission to autonomously sample cyanoHABs with minimal intervention. Success included operation during bloom conditions, where a risk for clogging and potential cross-contamination of samples was a concern. Compared to the stationary 2G ESP, the mobility offered to the 3G ESP by the LRAUV system allowed a freedom to investigate locations that may offer greater insight into bloom dynamics. The vehicle was able to operate and collect data in weather that kept NOAA boats ashore and during cloud-cover that effectively blinded satellites (e.g., Figure S5), further exemplifying its utility for cyanoHAB monitoring operations.
The shallowest depths of WLE (<4m) prevented access to areas of interest (i.e., monitoring stations WE06 and WE09; Figure 1); thereby exposing limitations imposed by the Tethys-class vehicle used during these missions. This operational field experience inspired engineering modifications and the current development of an alternative uncrewed system better suited for the requirements dictated by WLE conditions. Through modular design, the 3G ESP payload that provides the autonomous ‘omics capability of the system can be swapped into a variety of uncrewed system configurations.
Although there were challenges deploying the LRAUV-3G ESP in the shallow waters of the WLE, there were advantages. For example, the availability of numerous marinas surrounding the sampling region simplified launch and recovery. Ubiquitous cell-phone coverage throughout the region allowed the vehicle to be easily monitored and receive commands sent from all deployment locations. Ease of communication is not always the case in oceanic deployments. Offshore cell phone ‘dead’ spots are common during ocean operations, forcing reliance on satellite communication which has latency and bandwidth limitations.
Previously, the instrument had not been challenged by the sticky flocs and patchy distributions that characterize Microcystis blooms in WLE (Figure 9). The biomass of WLE blooms is often unevenly distributed vertically and horizontally in the water column and can change quickly with the surrounding hydrodynamics (Rowe et al., 2016). This patchiness caused concern that agreement between “matched” samples would not be achieved because of temporal (≤30 min) and spatial (≤0.5 km) separation between manual and autonomously collected samples. In addition, sample collection via Niskin is fast compared to the LRAUV-ESP, which can take 30 minutes to filter the sample in situ. The need to keep the vehicle in motion to maintain depth (see above) and to avoid collisions between the instrument and vessel also resulted in autonomous samples collected over a greater area (~30 m diameter) than is surveyed by manual deployment of a Niskin bottle. Despite the environmental conditions and potential to sample different water masses, qPCR and sequencing results did not differ significantly between manual and autonomous sampling for all (12) parameters tested (Table 1). Ultimately, these Great Lakes field trials increased the range of environments in which the LRAUV-3G ESP has been successfully deployed, as previous demonstrations with qPCR (Yamahara et al., 2019) and amplicon data (Truelove et al., 2022) were restricted to open-ocean systems.
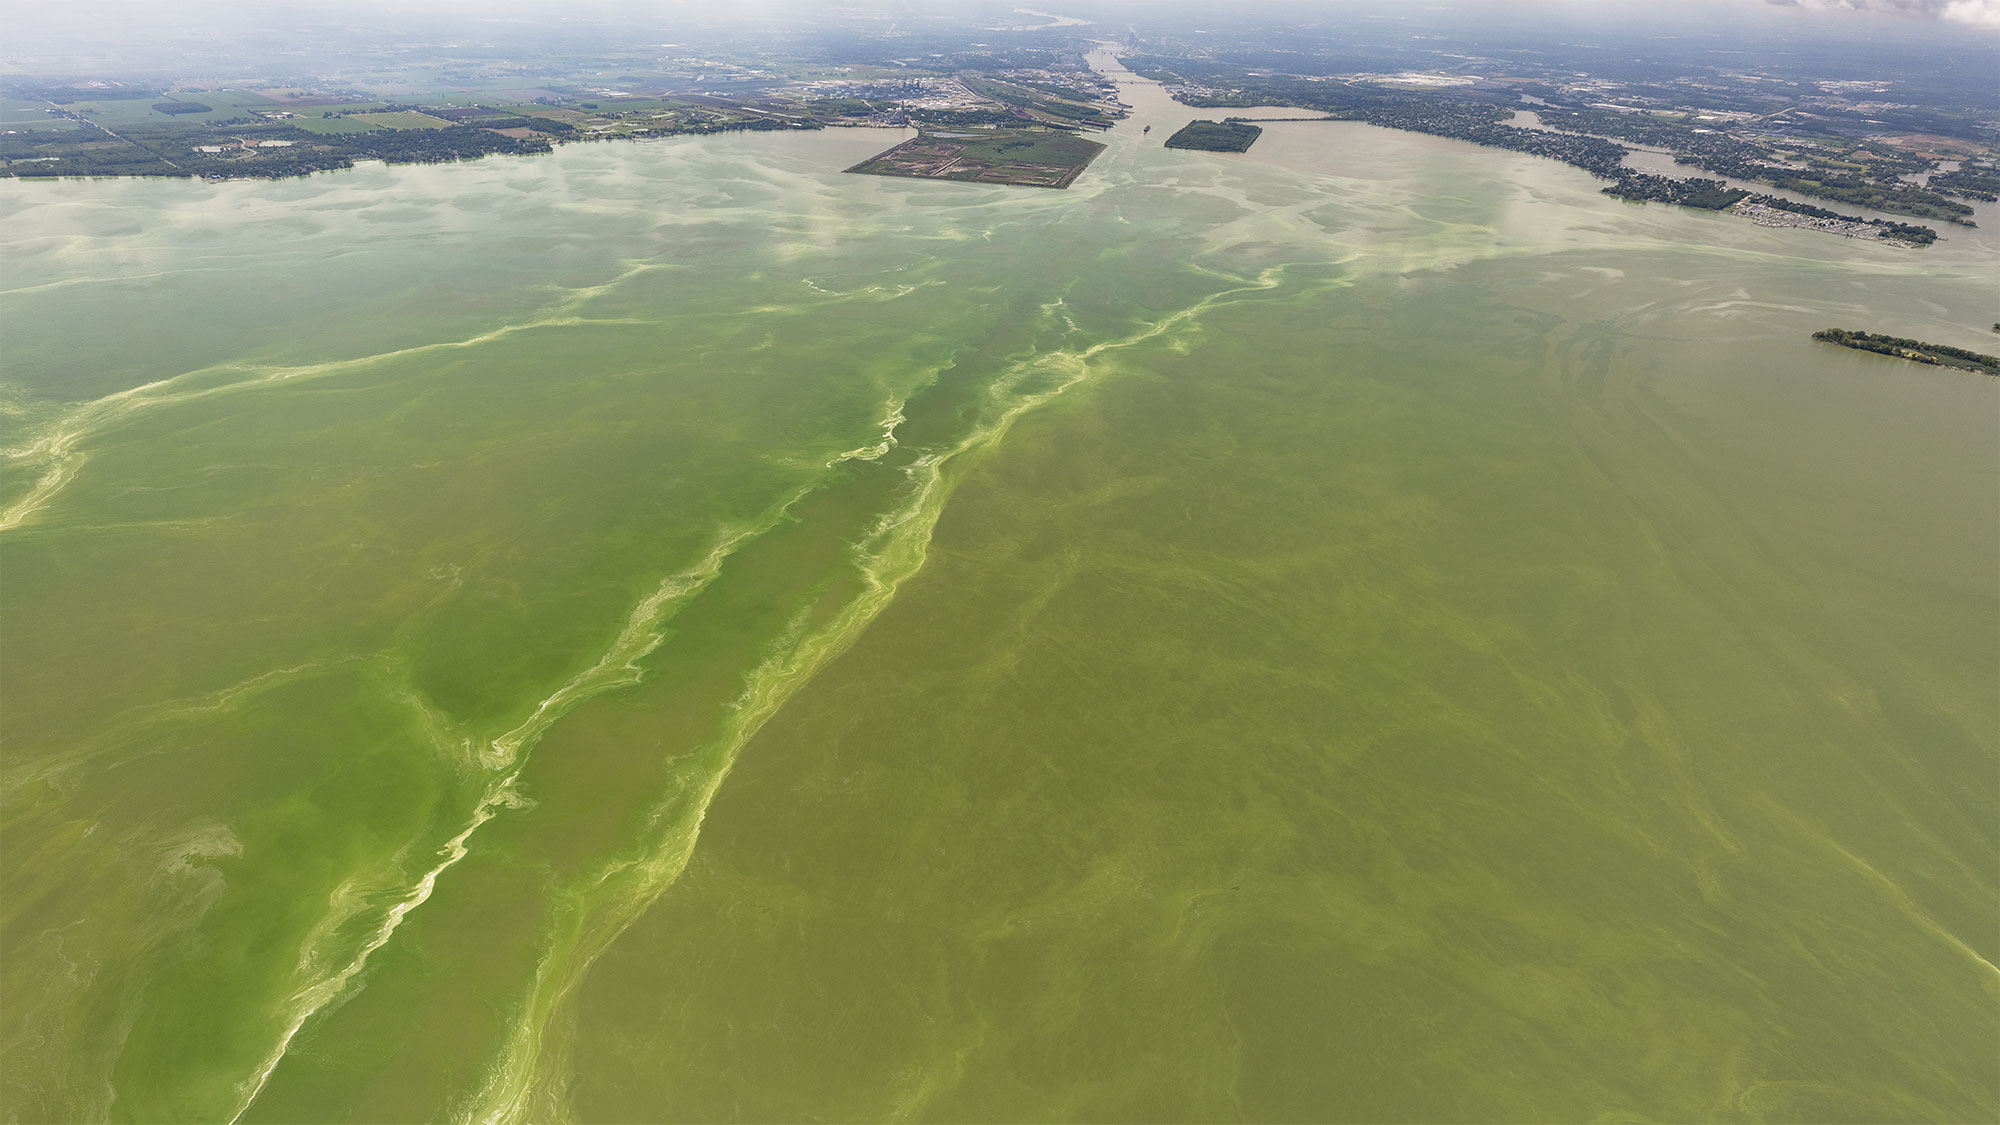
Figure 9 CyanoHAB bloom in WLE captured August 19, 2019 during LRAUV-3G ESP deployment. Credit: NOAA and Zachary Haslick, Aerial Associates Photography Inc.
Overall, the extensive agreement observed between sample collection methods (Table 1) supports the use of the LRAUV-3G ESP to expand and supplement current nucleic acid sample collection strategies. The adaptive sampling provided by the LRAUV-3G ESP can provide characterizations of bloom dynamics that are not feasible using conventional crewed operations. These successful field demonstrations suggest that samples collected via this autonomous platform can be used to enhance spatial and temporal data coverage and contribute to a time series established by more than a decade of seasonal cyanoHAB monitoring (CIGLR, University of Michigan; NOAA GLERL, Cooperative Institute for Great Lakes Research 2019).
These field trials demonstrated that autonomously collected samples can provide qPCR data, including detection of toxin genes. The widespread observations enabled by the LRAUV-3G ESP revealed correlations between concentrations of mcyE toxin gene and total cyanobacteria (Table 2). A linear relationship was observed between these parameters (Figure 6), although the slope varied between deployment years (Figure S3). Differences were expected because the total cyanobacterial population includes both toxigenic and non-toxigenic populations, which have been documented to shift over time (Dick et al., 2021).
The increased sampling capability of the LRAUV 3G-ESP can be employed to help understand periods during which a cyanobacterial population is toxigenic or non-toxigenic. Current cyanoHAB monitoring anticipates a 48-h turnaround time for sample processing after collection to obtain qPCR results, which may be similarly accomplished on autonomously collected samples upon retrieval of the instrument. Future inclusion of onboard qPCR measurements would further the ability to incorporate ‘omics data into routine observing programs.
Autonomous sampling identified shifts in the bacterial community across deployment years with important implications for bloom toxigenicity. According to data obtained from the LRAUV-3G ESP, total cyanobacterial concentrations were higher and had increased potential to produce microcystin in 2019 relative to 2018 (Figure 5). These results were supported by routine manual sampling observations of chlorophyll taken near or during the period of autonomous deployments (Figure S6). The autonomously-collected information also was consistent with the annual bloom analysis provided by the Operational Lake Erie Harmful Algal Bloom Forecast (HABs Forecast) (U.S. Department of Commerce - NOAA, 2021c), which classified 2019 as a severe bloom with a severity index of 7.3 and 2018 as a mild bloom with a severity index of 3.6 (U.S. Department of Commerce - NOAA, 2021b). The HABs Forecast characterizes biomass over the peak 30 days of the bloom using core observing and ensemble modeling components that combine weather forecasts, satellite imagery, and current models (Stumpf et al., 2012; Bridgeman et al., 2013; Obenour et al., 2014).
Amplicon sequencing indicated the dominance of the non-toxic cyanobacterium Synechococcus 107b during the 2018 deployment. In contrast, Microcystis ASVs dominated in 2019 (Figure 8), consistent with the more severe bloom conditions observed during that time. The Microcystis ASVs observed here (Tables S4, S5) matched Microcystis CTG, CCG, and CCT oligotypes that have been demonstrated to produce microcystin toxin (Berry et al., 2017b). An additional Microcystis ASV, termed Microcystis CT(A)G, was identified regularly in the 2019 dataset, comprising up to 1% relative abundance of sample sequences. This ASV was identical to Microcystis CTG except that it possessed an A (adenine) at position 105 instead of a G (guanine) (Figure S7). These findings support autonomous sample collection for the purpose of delivering molecular analyses with a high level of genetic resolution. Autonomous real-time toxin detection onboard the LRAUV-3G ESP is under development and will allow a deeper understanding of the relationship between bloom genetic profiles and toxin levels in the water.
It has become conventional practice to assume that the individual gene mcyE is always associated with the entire microcystin biosynthesis operon, thus indicating a genetic potential to produce microcystin (Zhu et al., 2014; Kramer et al., 2018; Chaffin et al., 2019; McKindles et al., 2019). However, Microcystis has recently been identified as possessing a partial microcystin biosynthesis operon in WLE (Yancey et al., 2022). A partial microcystin biosynthesis operon does not have the capacity to produce the toxin microcystin, yet quantification of the mcy genes retained in a partial operon could result in the artificial inflation of toxigenic populations. Therefore, it is important to identify whether the mcyE gene corresponds with each individual gene of the microcystin biosynthesis operon. Overall, the correlations observed here between the presence of mcyE and all microcystin biosynthesis operon genes (Figure 7) supports the utility of mcyE gene as a proxy to represent the presence of the entire microcystin biosynthesis operon required to produce the toxin microcystin. This analysis illustrates the utility of broad collection of ‘omics data, and more extensive analysis of the metagenomic data recovered by the LRAUV-3G ESP remains available for future studies.
Correlations between total cyanobacteria results collected aboard the LRAUV-3G ESP during these deployments and the chlorophyll index calculated from satellite imagery (Table 3) suggested that in situ measurements collected autonomously may be used to complement and expand satellite data. Further surveys with tighter coupling between observations will be needed to confidently resolve the relationship between these two monitoring approaches. If the relationship suggested here holds, autonomous capabilities coupled with ‘omics analyses, may be used to supplement satellite measurements, particularly when observations are obscured due to cloud cover. The ability to integrate such data sets would allow increased delivery of data products.
The main limitation observed in this study was related to operations of the particular LRAUV rather than autonomous sample collection. The 3G ESP performed well as a payload on this LRAUV, providing observations of taxonomic (Total Cyanobacteria qPCR assay and 16S rRNA gene amplicon) as well as functional gene shifts (Toxin Gene qPCR assay and microcystin biosynthesis operon metagenomics). To further expand the reach of the 3G ESP sample collection and processing capabilities in WLE, the 3G ESP will be installed in an alternative vehicle. The uncrewed surface vehicle will be able to reach the shallowest regions of WLE, where cyanoHABs often show highest toxicity. This additional vehicle will further expand the instrument’s potential range of sampling environments. Furthermore, incorporation of transcriptomics, proteomics, and eDNA surveys is planned for future deployments. All of these approaches have previously shown successes in marine surveys using ESP technology (Saito et al., 2011; Yamahara et al., 2019; Zhang et al., 2019; Zhang et al., 2021). The implementation of transcriptomics and proteomics will further increase the utility of the instrument to investigate molecular-level population dynamics within cyanoHABs, while eDNA can be used to monitor fish populations or screen for invasive species. While neither the 3G-ESP nor LRAUV are currently available commercially, future licensing agreements are expected to make both instruments available to the broader public in the coming year.
Successful autonomous sample collection demonstrated the ability to expand the practical capabilities of current monitoring efforts in WLE. These field tests demonstrated the benefits of mobile and flexible operations associated with autonomous observing platforms. Autonomous sampling provides a powerful means to inform cyanoHABs monitoring and forecasting whether used alone or combined with current monitoring operations to expand coverage. Importantly, these LRAUV-3G ESP field trials provided valuable data to characterize cyanoHABs bacterial communities.
Demultiplexed sequences were deposited with NCBI and are publicly available under Umbrella BioProject PRJNA702128. Microcystis ASV sequences are available through GenBank accession numbers: MZ424262-MZ424265. Source code for figures provided in this study is available at https://github.com/GLomics.
Written informed consent was obtained from the individual(s) for the publication of any potentially identifiable images or data included in this article.
PD, CP, WU, and KG collected the samples. CP, WU, and GDo prepared and operated the vehicle. PD performed the laboratory analyses. PD, KG, LT, and CY analyzed the data. PD, KG, LT, CY, GDi, and SC drafted the manuscript. SR, GDo, JB, KG, RE, CS, and PD conceived the study. All authors contributed to the article and approved the submitted version.
This work was supported by NOAA OAR ‘Omics and AUV Testbed funding. Funding was awarded to the Cooperative Institute for Great Lakes Research (CIGLR) through the NOAA Cooperative Agreement with the University of Michigan (NA17OAR4320152), supporting PD and SC. LT was supported by award NA16OAR4320199 to the Northern Gulf Institute (NGI) at Mississippi State University from NOAA’s Office of Oceanic and Atmospheric Research (OAR), U.S. Department of Commerce. GDi, CY, and GDo were supported by funding from the National Institutes of Health (NIH) (1P01ES028939-01) and National Science Foundation (OCE-1840715) awards to the Bowling Green State University Great Lakes Center for Fresh Waters and Human Health. GDo was also supported by NOAA/NOS operational funds.
We gratefully thank Brian Kieft, Ben Yair Raanan, and Erik Trauschke for their work preparing and deploying the LRAUV, Captain Kent Baker for his support in vessel operations, Sean Anderson for discussions on running Tourmaline, Nastassia Patin for help with alpha and beta diversity analysis on the amplicon sequence data, and Mark Rowe for the HABs Forecast code. This work is listed under GLERL contribution number: 2013 and CIGLR contribution number: 1200. NOAA Disclaimer: This publication does not constitute an endorsement of any commercial product or intend to be an opinion beyond scientific or other results obtained by NOAA.
The authors declare that the research was conducted in the absence of any commercial or financial relationships that could be construed as a potential conflict of interest.
All claims expressed in this article are solely those of the authors and do not necessarily represent those of their affiliated organizations, or those of the publisher, the editors and the reviewers. Any product that may be evaluated in this article, or claim that may be made by its manufacturer, is not guaranteed or endorsed by the publisher.
The Supplementary Material for this article can be found online at: https://www.frontiersin.org/articles/10.3389/fmars.2022.1021952/full#supplementary-material
Al-Tebrineh J., Pearson L. A., Yasar S. A., Neilan B. A. (2012). A multiplex qPCR targeting hepato- and neurotoxigenic cyanobacteria of global significance. Harmful Algae 15, 19–25. doi: 10.1016/j.hal.2011.11.001
Andrews S. (2010) Babraham Bioinformatics - FastQC: A quality control tool for high throughput sequence data. Available at: https://www.bioinformatics.babraham.ac.uk/projects/fastqc.
Apprill A., McNally S., Parsons R., Weber L. (2015). Minor revision to V4 region SSU rRNA 806R gene primer greatly increases detection of SAR11 bacterioplankton. Aquatic Microbial Ecology, 75(2), 129–137. doi: 10.3354/ame01753
Berry M. A., Davis T. W., Cory R. M., Duhaime M. B., Johengen T. H., Kling G. W., et al. (2017a). Cyanobacterial harmful algal blooms are a biological disturbance to Western lake Erie bacterial communities. Environ. Microbiol. 19 (3), 1149–1162. doi: 10.1111/1462-2920.13640
Berry M. A., White J. D., Davis T. W., Jain S., Johengen T. H., Dick G. J., et al. (2017b). Are oligotypes meaningful ecological and phylogenetic units? a case study of microcystis in freshwater lakes. Front. Microbiol. 8. doi: 10.3389/fmicb.2017.00365
Bolyen E., Rideout J. R., Dillon M. R., Bokulich N. A., Abnet C. C., Al-Ghalith G. A., et al. (2019). Reproducible, interactive, scalable and extensible microbiome data science using QIIME 2. Nat. Biotechnol. 37 (8), 852–857. doi: 10.1038/s41587-019-0209-9
Bosse K. R., Sayers M. J., Shuchman R. A., Fahnenstiel G. L., Ruberg S. A., Fanslow D. L., et al. (2019). Spatial-temporal variability of in situ cyanobacteria vertical structure in Western lake Erie: Implications for remote sensing observations. J. Great Lakes Res. 45 (3), 480–489. doi: 10.1016/j.jglr.2019.02.003
Bowers H. A., Ryan J. P., Hayashi K., Woods A. L., Marin R., Smith G. J., et al. (2018). Diversity and toxicity of pseudo-nitzschia species in Monterey bay: Perspectives from targeted and adaptive sampling. Harmful Algae 78, 129–141. doi: 10.1016/j.hal.2018.08.006
Bridgeman T. B., Chaffin J. D., Filbrun J. E. (2013). A novel method for tracking western lake Erie microcystis blooms 2002–2011. J. Great Lakes Res. 39 (1), 83–89. doi: 10.1016/j.jglr.2012.11.004
Callahan B. J., McMurdie P. J., Rosen M. J., Han A. W., Johnson A. J. A., Holmes S. P. (2016). DADA2: High-resolution sample inference from illumina amplicon data. Nat. Methods 13 (7), 581–583. doi: 10.1038/nmeth.3869
Carmichael W. W., Azevedo S. M., An J. S., Molica R. J., Jochimsen E. M., Lau S., et al. (2001). Human fatalities from cyanobacteria: chemical and biological evidence for cyanotoxins. Environ. Health Perspect. 109 (7), 663–668. doi: 10.1289/ehp.01109663
Chaffin J. D., Kane D. D., Stanislawczyk K., Parker E. M. (2018). Accuracy of data buoys for measurement of cyanobacteria, chlorophyll, and turbidity in a large lake (Lake Erie, north america): implications for estimation of cyanobacterial bloom parameters from water quality sonde measurements. Environ. Sci. pollut. Res. 25 (25), 25175–25189. doi: 10.1007/s11356-018-2612-z
Chaffin J. D., Mishra S., Kane D. D., Bade D. L., Stanislawczyk K., Slodysko K. N., et al. (2019). Cyanobacterial blooms in the central basin of lake Erie: Potentials for cyanotoxins and environmental drivers. J. Great Lakes Res. 45 (2), 277–289. doi: 10.1016/j.jglr.2018.12.006
CIGLR, University of Michigan, NOAA GLERL (2019). Physical, chemical, and biological water quality monitoring data to support detection of harmful algal blooms (HABs) in western lake Erie, collected by the great lakes environmental research laboratory and the cooperative institute for great lakes research since 2012. NOAA Natl. Centers Environ. Inf. doi: 10.25921/11da-3x54. accession number 0187718 and 0209116.
Cory R. M., Davis T. W., Dick G. J., Johengen T., Denef V. J., Berry M., et al. (2017). Corrigendum: Seasonal dynamics in dissolved organic matter, hydrogen peroxide, and cyanobacterial blooms in lake Erie. Front. Mar. Sci. 4. doi: 10.3389/fmars.2017.00377
Curd E. E., Gold Z., Kandlikar G. S., Gomer J., Ogden M., O'Connell T., et al. (2019). Anacapa toolkit : An environmental DNA toolkit for processing multilocus metabarcode datasets. Methods Ecol. Evol. 10 (9), 1469–1475. doi: 10.1111/2041-210x.13214
Davis T. W., Berry D. L., Boyer G. L., Gobler C. J. (2009). The effects of temperature and nutrients on the growth and dynamics of toxic and non-toxic strains of microcystis during cyanobacteria blooms. Harmful Algae 8 (5), 715–725. doi: 10.1016/j.hal.2009.02.004
Dick G. J., Duhaime M. B., Evans J. T., Errera R. M., Godwin C., Kharbush J. J., et al. (2021). The genetic and ecophysiological diversity of microcystis. Environ. Microbiol. 23 (12), 7278–7313. doi: 10.1111/1462-2920.15615
Didion J. P., Martin M., Collins F. S. (2017). Atropos: specific, sensitive, and speedy trimming of sequencing reads. PeerJ 5, e3720–e3720. doi: 10.7717/peerj.3720
Ewels P., Magnusson M., Lundin S., Käller M. (2016). MultiQC: summarize analysis results for multiple tools and samples in a single report. Bioinf. (Oxford England) 32 (19), 3047–3048. doi: 10.1093/bioinformatics/btw354
Govindarajan A. F., Pineda J., Purcell M., Breier J. A. (2015). Species- and stage-specific barnacle larval distributions obtained from AUV sampling and genetic analysis in buzzards bay, Massachusetts, USA. J. Exp. Mar. Biol. Ecol. 472, 158–165. doi: 10.1016/j.jembe.2015.07.012
Great Lakes Restoration Initiative (2021). Act of 2019 (Washington D.C., USA: U. S. Government), 134. 116–294.
Great Lakes Water Quality Agreement of 2012 (2012). Annex 4 Vol. 33 (Canada and the United States of America: The government of Canada and the government of the United States of America), USC 1251.
Herfort L., Seaton C., Wilkin M., Roman B., Preston C. M., Marin R., et al. (2015). Use of continuous, real-time observations and model simulations to achieve autonomous, adaptive sampling of microbial processes with a robotic sampler. Limnology Oceanography: Methods 14 (1), 50–67. doi: 10.1002/lom3.10069
Hernández J. M., López-Rodas V., Costas E. (2009). Microcystins from tap water could be a risk factor for liver and colorectal cancer: A risk intensified by global change. Med. Hypotheses 72 (5), 539–540. doi: 10.1016/j.mehy.2008.11.041
Hoagland P., Scatasta S. (2006). The Economic Effects of Harmful Algal Blooms. In: Granéli E., Turner J. T. (eds) Ecology of Harmful Algae. Ecological Studies 189, 91–402. Springer, Berlin, Heidelberg. doi: 10.1007/978-3-540-32210-8_30
Kramer B. J., Davis T. W., Meyer K. A., Rosen B. H., Goleski J. A., Dick G. J., et al. (2018). Nitrogen limitation, toxin synthesis potential, and toxicity of cyanobacterial populations in lake Okeechobee and the st. lucie river estuary, Florida, during the 2016 state of emergency event. PLoS One 13 (5), e0196278–e0196278. doi: 10.1371/journal.pone.0196278
Lu J., Breitwieser F. P., Thielen P., Salzberg S. L. (2017). Bracken: estimating species abundance in metagenomics data. PeerJ Comput. Sci. 3, e104. doi: 10.7717/peerj-cs.104
Martino C., Morton J. T., Marotz C. A., Thompson L. R., Tripathi A., Knight R., et al. (2019). A novel sparse compositional technique reveals microbial perturbations. mSystems 4 (1), e00016–e00019. doi: 10.1128/mSystems.00016-19
McKindles K. M., Zimba P. V., Chiu A. S., Watson S. B., Gutierrez D. B., Westrick J., et al. (2019). A multiplex analysis of potentially toxic cyanobacteria in lake Winnipeg during the 2013 bloom season. Toxins 11 (10), 587. doi: 10.3390/toxins11100587
McMurdie P. J., Holmes S. (2013). Phyloseq: An r package for reproducible interactive analysis and graphics of microbiome census data. PLoS One 8 (4), e61217. doi: 10.1371/journal.pone.0061217
Meyer K. A., Davis T. W., Watson S. B., Denef V. J., Berry M. A., Dick G. J. (2017). Genome sequences of lower great lakes microcystis sp. reveal strain-specific genes that are present and expressed in western lake Erie blooms. PLoS One 12 (10), e0183859. doi: 10.1371/journal.pone.0183859
Michalak A. M., Anderson E. J., Beletsky D., Boland S., Bosch N. S., Bridgeman T. B., et al. (2013). Record-setting algal bloom in lake Erie caused by agricultural and meteorological trends consistent with expected future conditions. Proc. Natl. Acad. Sci. United States America 110 (16), 6448–6452. doi: 10.1073/pnas.1216006110
Mishra S., Stumpf R. P., Schaeffer B. A., Werdell P. J., Loftin K. A., Meredith A. (2019). Measurement of cyanobacterial bloom magnitude using satellite remote sensing. Sci. Rep. 9 (1), 18310. doi: 10.1038/s41598-019-54453-y
Moore S. K., Mickett J. B., Doucette G. J., Adams N. G., Mikulski C. M., Birch J. M., et al. (2021). An autonomous platform for near real-time surveillance of harmful algae and their toxins in dynamic coastal shelf environments. J. Mar. Sci. Eng. 9 (3), 336. doi: 10.3390/jmse9030336
Obenour D. R., Gronewold A. D., Stow C. A., Scavia D. (2014). Using a Bayesian hierarchical model to improve lake Erie cyanobacteria bloom forecasts. Water Resour. Res. 50 (10), 7847–7860. doi: 10.1002/2014wr015616
Oksanen J., Blanchet F. G., Kindt R., Legendre P., Minchin P., O'Hara B., et al. (2015). Vegan: Community ecology package. R Package Version 2.2-1 2, 1–2. Available at: https://CRAN.R-project.org/package=vegan
Paerl H. W., Huisman J. (2009). Climate change: a catalyst for global expansion of harmful cyanobacterial blooms. Environ. Microbiol. Rep. 1 (1), 27–37. doi: 10.1111/j.1758-2229.2008.00004.x
Paerl H. W., Otten T. G. (2013). Harmful cyanobacterial blooms: Causes, consequences, and controls. Microbial Ecol. 65 (4), 995–1010. doi: 10.1007/s00248-012-0159-y
Parada A. E., Needham D. M., Fuhrman J. A. (2015). Every base matters: assessing small subunit rRNA primers for marine microbiomes with mock communities, time series and global field samples. Environ. Microbiol. 18 (5), 1403–1414. doi: 10.1111/1462-2920.13023
Pargett D. M., Birch J. M., Preston C. M., Ryan J. P., Zhang Y., Scholin C. A. (2015). “Development of a mobile ecogenomic sensor,” in OCEANS 2015 - MTS/IEEE Washington. New York City, NY, USA: IEEE. doi: 10.23919/oceans.2015.7404361
Rinta-Kanto J. M., Konopko E. A., DeBruyn J. M., Bourbonniere R. A., Boyer G. L., Wilhelm S. W. (2009). Lake Erie microcystis: Relationship between microcystin production, dynamics of genotypes and environmental parameters in a large lake. Harmful Algae 8 (5), 665–673. doi: 10.1016/j.hal.2008.12.004
Robidart J. C., Church M. J., Ryan J. P., Ascani F., Wilson S. T., Bombar D., et al. (2014). Ecogenomic sensor reveals controls on N2-fixing microorganisms in the north pacific ocean. ISME J. 8 (6), 1175–1185. doi: 10.1038/ismej.2013.244
Rodriguez-R L. M., Gunturu S., Tiedje J. M., Cole J. R., Konstantinidis K. T., Fodor A. (2018). Nonpareil 3: Fast estimation of metagenomic coverage and sequence diversity. mSystems 3 (3), e00039–e00018. doi: 10.1128/mSystems.00039-18
Rowe M., Anderson E., Wynne T., Stumpf R., Fanslow D., Kijanka K., et al. (2016). Vertical distribution of buoyant microcystis blooms in a Lagrangian particle tracking model for short-term forecasts in lake Erie. J. Geophysical Research: Oceans 121, 5296–5314. doi: 10.1002/2016JC011720
Ryan J., Greenfield D., Marin R. III, Preston C., Roman B., Jensen S., et al. (2011). Harmful phytoplankton ecology studies using an autonomous molecular analytical and ocean observing network. Limnology Oceanography 56 (4), 1255–1272. doi: 10.4319/lo.2011.56.4.1255
Saito M. A., Bulygin V. V., Moran D. M., Taylor C., Scholin C. (2011). Examination of microbial proteome preservation techniques applicable to autonomous environmental sample collection. Front. Microbiol. 2. doi: 10.3389/fmicb.2011.00215
Scholin C., Birch J., Jensen S., Marin Iii R., Massion E., Pargett D., et al. (2017). The quest to develop ecogenomic sensors: A 25-year history of the environmental sample processor (ESP) as a case study. Oceanography 30 (4), 100–113. doi: 10.5670/oceanog.2017.427
Smith D. J., Tan J. Y., Powers M. A., Lin X. N., Davis T. W., Dick G. J. (2021). Individual microcystis colonies harbour distinct bacterial communities that differ by microcystis oligotype and with time. Environ. Microbiol. 23, 5652–5657. doi: 10.1111/1462-2920.15514
Steffen M. M., Davis T. W., McKay R. M. L., Bullerjahn G. S., Krausfeldt L. E., Stough J. M. A., et al. (2017). Ecophysiological examination of the lake Erie microcystis bloom in 2014: Linkages between biology and the water supply shutdown of Toledo, OH. Environ. Sci. Technol. 51 (12), 6745–6755. doi: 10.1021/acs.est.7b00856
Stumpf R. P., Wynne T. T., Baker D. B., Fahnenstiel G. L. (2012). Interannual variability of cyanobacterial blooms in lake Erie. PLoS One 7 (8), e42444–e42444. doi: 10.1371/journal.pone.0042444
Taylor C. D., Edgcomb V. P., Doherty K. W., Engstrom I., Shanahan T., Pachiadaki M. G., et al. (2015). Fixation filter, device for the rapid in situ preservation of particulate samples. Deep Sea Res. Part I: Oceanographic Res. Papers 96, 69–79. doi: 10.1016/j.dsr.2014.09.006
Thompson L. R., Anderson S. R., Den Uyl P. A., Patin N. V., Lim S. J., Sanderson G., et al. (2022). Tourmaline: A containerized workflow for rapid and iterable amplicon sequence analysis using QIIME 2 and snakemake. GigaScience 11, giac066. doi: 10.1093/gigascience/giac066
Tillett D., Dittmann E., Erhard M., von Döhren H., Börner T., Neilan B. A. (2000). Structural organization of microcystin biosynthesis in microcystis aeruginosa PCC7806: an integrated peptide–polyketide synthetase system. Chem. Biol. 7 (10), 753–764. doi: 10.1016/s1074-5521(00)00021-1
Truelove N. K. P., Nastassia V., Min M., Pitz K. J., Preston C. M., Yamahara K. M., et al. (2022). Expanding the temporal and spatial scapes of environmental DNA research with autonomous sampling. Environ. DNA. 4, 972–984. doi: 10.1002/edn3.299
Urquhart E. A., Schaeffer B. A., Stumpf R. P., Loftin K. A., Werdell P. J. (2017). A method for examining temporal changes in cyanobacterial harmful algal bloom spatial extent using satellite remote sensing. Harmful algae 67, 144–152. doi: 10.1016/j.hal.2017.06.001
U.S. Department of Commerce - NOAA (2021a) CI processed MODIS satellite imagery index. Available at: www.ncei.noaa.gov/data/oceans/co-ops/hab/lakeerie/.
U.S. Department of Commerce - NOAA (2021b) Lake Erie HABs bulletin archive. Available at: https://www.glerl.noaa.gov/res/HABs_and_Hypoxia/lakeErieHABArchive/.
U.S. Department of Commerce - NOAA (2021c) Lake Erie harmful algal bloom forecast. Available at: https://tidesandcurrents.noaa.gov/hab/lakeerie.html.
U.S. Department of Commerce - NOAA (2021d) WLE 2G-ESP data. Available at: https://www.glerl.noaa.gov/res/HABs_and_Hypoxia/esp-data/.
Ussler W., Preston C., Lingerfelt L., Mikulski C., Den Uyl P., Johengen T., et al. (2019). “The 3rd generation ESP/long-range AUV: First tests of autonomous, underway sampling and analysis of microcystin in western lake erie,” in 10th US Symposium on Harmful Algae, Orange Beach, AL, USA, 3–8. 2019.
Watson S. B., Miller C., Arhonditsis G., Boyer G. L., Carmichael W., Charlton M. N., et al. (2016). The re-eutrophication of lake Erie: Harmful algal blooms and hypoxia. Harmful Algae 56, 44–66. doi: 10.1016/j.hal.2016.04.010
Wood D. E., Lu J., Langmead B. (2019). Improved metagenomic analysis with kraken 2. Genome Biol. 20 (1), 257–257. doi: 10.1186/s13059-019-1891-0
Wynne T. T., Stumpf R. P., Tomlinson M. C., Dyble J. (2010). Characterizing a cyanobacterial bloom in Western lake Erie using satellite imagery and meteorological data. Limnology Oceanography 55 (5), 2025–2036. doi: 10.4319/lo.2010.55.5.2025
Wynne T. T., Stumpf R. P., Tomlinson M. C., Warner R. A., Tester P. A., Dyble J., et al. (2008). Relating spectral shape to cyanobacterial blooms in the laurentian great lakes. Int. J. Remote Sens. 29 (12), 3665–3672. doi: 10.1080/01431160802007640
Yamahara K. M., Preston C. M., Birch J., Walz K., Marin R., Jensen S., et al. (2019). In situ autonomous acquisition and preservation of marine environmental DNA using an autonomous underwater vehicle. Front. Mar. Sci. 6. doi: 10.3389/fmars.2019.00373
Yancey C. E., Smith D. J., Den Uyl P. A., Mohamed O. G., Yu F., Ruberg S. A., et al. (2022). Metagenomic and metatranscriptomic insights into population diversity of microcystis blooms: Spatial and temporal dynamics of mcy genotypes, including a partial operon that can be abundant and expressed. Appl. Environ. Microbiol. 88 (9), e02464–e02421. doi: 10.1128/aem.02464-21
Zhang Y., Ryan J. P., Hobson B. W., Kieft B., Romano A., Barone B., et al. (2021). A system of coordinated autonomous robots for Lagrangian studies of microbes in the oceanic deep chlorophyll maximum. Sci. Robotics 6 (50), eabb9138. doi: 10.1126/scirobotics.abb9138
Zhang Y., Ryan J. P., Kieft B., Hobson B. W., McEwen R. S., Godin M. A., et al. (2019). Targeted sampling by autonomous underwater vehicles. Front. Mar. Sci. 6. doi: 10.3389/fmars.2019.00415
Zhu P., Zhang B.-F., Wu J.-H., Dang C.-Y., Lv Y.-T., Fan J.-Z., et al. (2014). Sensitive and rapid detection of microcystin synthetase e gene (mcyE) by loop-mediated isothermal amplification: A new assay for detecting the potential microcystin-producing microcystis in the aquatic ecosystem. Harmful Algae 37, 8–16. doi: 10.1016/j.hal.2014.04.018
Keywords: Great Lakes, metagenomes, LRAUV-3G ESP, uncrewed systems, Microcystis, mcyE, eDNA, cyanoHAB
Citation: Den Uyl PA, Thompson LR, Errera RM, Birch JM, Preston CM, Ussler W III, Yancey CE, Chaganti SR, Ruberg SA, Doucette GJ, Dick GJ, Scholin CA and Goodwin KD (2022) Lake Erie field trials to advance autonomous monitoring of cyanobacterial harmful algal blooms. Front. Mar. Sci. 9:1021952. doi: 10.3389/fmars.2022.1021952
Received: 18 August 2022; Accepted: 21 September 2022;
Published: 06 October 2022.
Edited by:
Chris Dupont, J. Craig Venter Institute, United StatesReviewed by:
Raphael M Kudela, University of California, Santa Cruz, United StatesCopyright © 2022 Den Uyl, Thompson, Errera, Birch, Preston, Ussler, Yancey, Chaganti, Ruberg, Doucette, Dick, Scholin and Goodwin. This is an open-access article distributed under the terms of the Creative Commons Attribution License (CC BY). The use, distribution or reproduction in other forums is permitted, provided the original author(s) and the copyright owner(s) are credited and that the original publication in this journal is cited, in accordance with accepted academic practice. No use, distribution or reproduction is permitted which does not comply with these terms.
*Correspondence: Paul A. Den Uyl, cGRlbnV5bEB1bWljaC5lZHU=
Disclaimer: All claims expressed in this article are solely those of the authors and do not necessarily represent those of their affiliated organizations, or those of the publisher, the editors and the reviewers. Any product that may be evaluated in this article or claim that may be made by its manufacturer is not guaranteed or endorsed by the publisher.
Research integrity at Frontiers
Learn more about the work of our research integrity team to safeguard the quality of each article we publish.