 Abraham Guerrero1†
94% of researchers rate our articles as excellent or good
Learn more about the work of our research integrity team to safeguard the quality of each article we publish.
Find out more
ORIGINAL RESEARCH article
Front. Mar. Sci. , 20 October 2022
Sec. Marine Pollution
Volume 9 - 2022 | https://doi.org/10.3389/fmars.2022.1020136
This article is part of the Research Topic Novel Insights into the Circulation, Biogeochemistry, and Ecosystem Function of the Gulf of Mexico: A Perspective from Mexican Waters in Support of Oil Spill Preparedness View all 17 articles
Selected water masses and sediment samples from the Southern Gulf of Mexico, were studied by bacterial sequencing the 16S rRNA to establish their community structure and discuss the results in relation to those reported by other authors using deep water masses or sediment samples. Forty-five water and 21 sediment samples were collected at selected sampling localities. Proteobacteria was the most abundant phylum of the bacterial community in both environments as well as the class Gammaproteobacteria and the order Alteromonadales. Concerning the family taxonomic category, Alteromonadaceae was the most abundant in the water masses, showing an increase in the deepest water masses. Woeseiaceae and Kiloniellaceae were the most abundant families in the sediments. The statistical pairwise comparison among the water masses showed significant differences between the maximum fluorescence (maxF), the minimum oxygen (minO), the Antarctic Intermediate Water (AAIW), and the North Atlantic Deep Water (NADW) water masses. Also, significant differences were observed between the maxF, minO, AAIW, NADW water masses, and the sediment environment. It was concluded that the maxF water mass showed significant differences in the deepest water masses and that the sediment environment presented a different structure of families from the water environment.
Water mass characteristics in the Gulf of Mexico (GoMex), have been recorded by Nowlin and McLellan since 1967 (Nowlin and McLellan 1967). Rivas et al. (2005), indicated that the water masses registered in the GoMex mainly entered through the Yucatan Channel. They describe the subsurface water, which always shows a maximum fluorescence water mass (maxF; 50 to 100 m), and the Tropical Atlantic Central Water (TACW; 400-600 m) is characterized by a minimum of dissolved oxygen water mass (minO). The next described water mass is the Antarctic Intermediate Water (AAIW; 600 -900 m), which is identified by its minimum salinity, and finally, there is the North Atlantic Deep water (NADW; 1000 m to maximum registered depth), presenting low temperatures (4°C), a salinity lower than surface waters (~35%o), and high dissolved oxygen (>5 mL/L). These water masses have been detected with CTD equipment onboard an oceanographic vessel (Figure 1). Therefore, water samples can be assessed with high accuracy at those specific water masses.
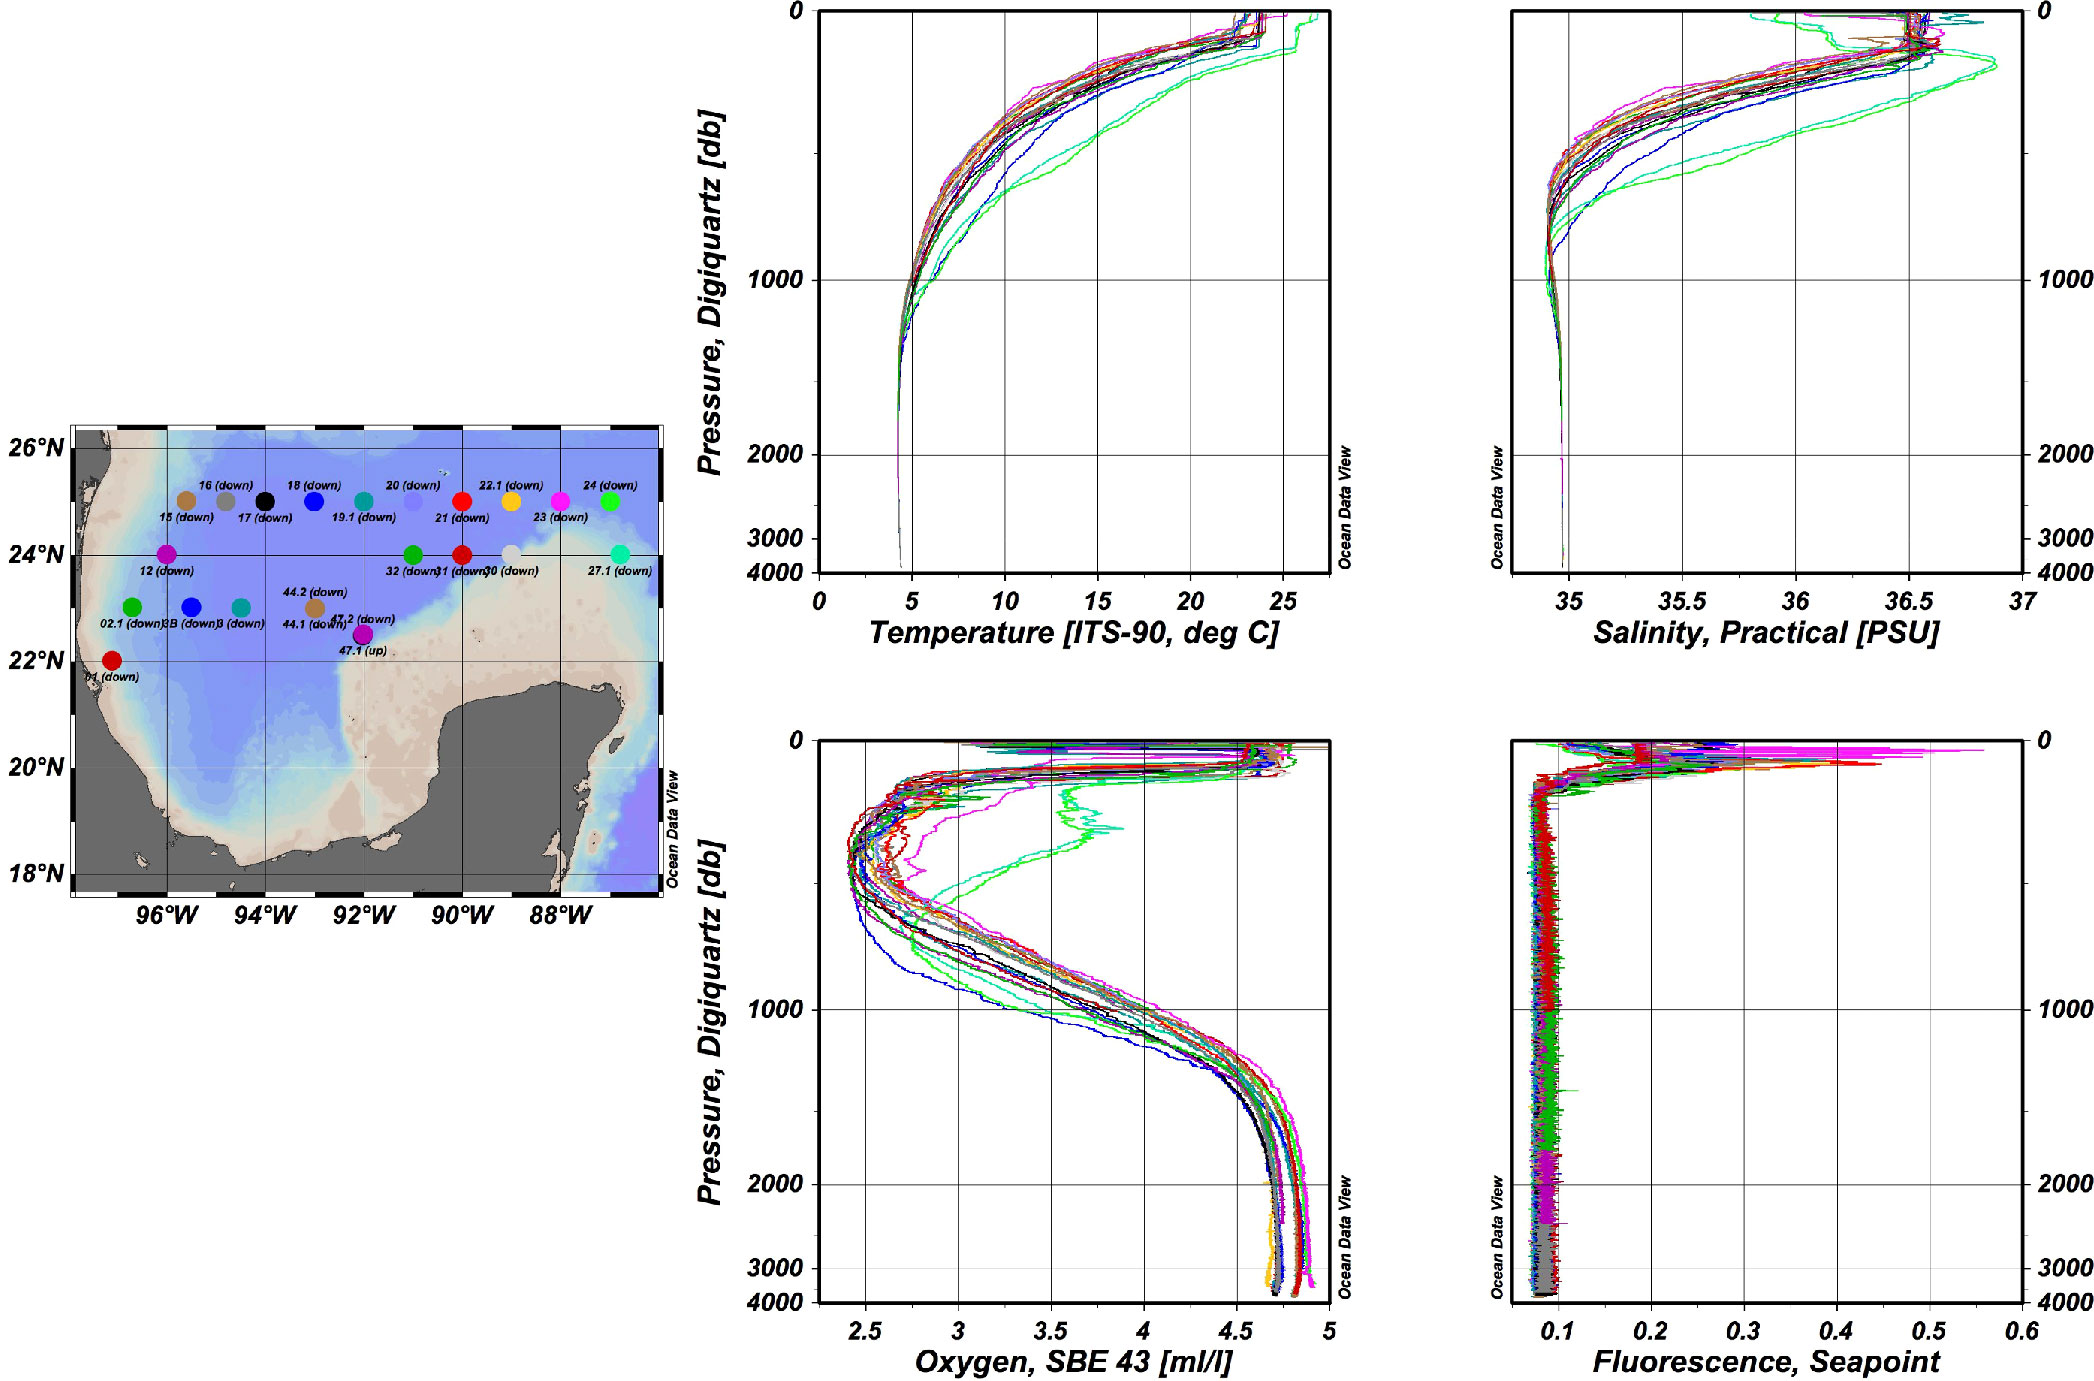
Figure 1 CTD data of temperature in °C, salinity in PSU, dissolved oxygen in mL/L and fluorescence, registered at sampling localities from the northern region of the SGoMex. Color dots correspond to color lines.
Different studies have identified specific bacterial communities in water masses and sediments. Agogué et al. (2011) studied the bacterial communities in the North Atlantic Ocean transect, concluding that deep water masses hosted specific bacterial communities. In addition, their results indicated sharp differences in the bacterial communities’ composition, between water and sediment environments. Walsh et al. (2015) also indicated notorious differences in bacterial communities between the water samples and surface sediments (0-10 cm), at the Equatorial Pacific Ocean and the North Pacific gyre.
Therefore, the objective of this study was to characterize the bacterial communities by sequencing the 16S rRNA from four water masses and sediment samples located in the Southern GoMex (SGoMex) collected during three oceanographic cruises, running between 2015 to 2017, to corroborate differences or similarities between bacterial communities structure among water masses, that present different physicochemical characteristics, but also among water masses and sediments, as have been reported by other authors using deep water masses or sediment samples (Agogué et al., 2011; Walsh et al., 2015).
Samples were collected at defined geographic localities (Figure 2) during three oceanographic cruises (XIXIMI’s; XIX) onboard the research vessel Justo Sierra (Universidad Nacional Autónoma de México, UNAM), XIX-4 in September 2015, XIX-5 in June 2016 and XIX-6 in August-September 2017. Forty-five water samples were taken from the sampling localities (Figure 2) at each of the selected water masses: maximum fluorescence (maxF), minimum oxygen (minO), Antarctic Intermediate Water (AAIW), and North Atlantic Deep Water (NADW). A 60L sample was collected using three 20-L Niskin bottles fixed in on oceanographic rosette system, which were closed remotely at select depths according to data from the Seabird™ CTD, recording the conductivity, depth, temperature, fluorescence, and dissolved oxygen onboard. The select depths were related to the water masses that have been reported for the GoMex (Rivas et al., 2005). The subsurface water was where the maxF water mass (50-100 m) was located, the Tropical Atlantic Central Water (TACW) was where the minO water mass was recorded (~ 400 m), the next sampling depth correspond to the AAIW (~1000m), and finally, the deepest water mass corresponded to the NADW (1200 – maximum sampling deep), a water mass that originates in the North Atlantic Ocean.
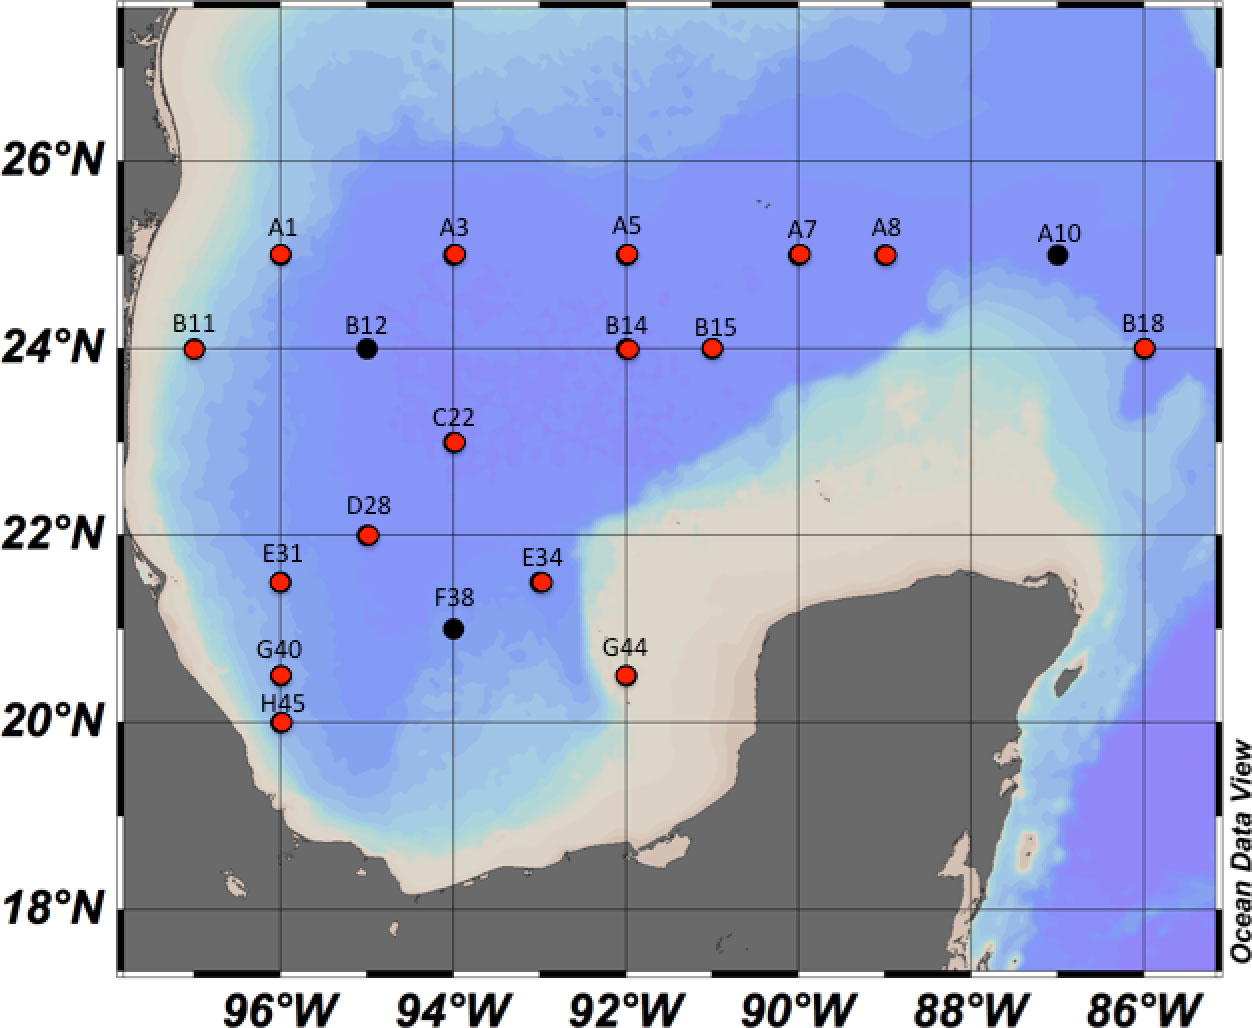
Figure 2 Water and sediment sampling localities in the SGoMex, for the XIX-4, XIX-5 and XIX-6 oceanographic cruises. Black dots indicate the locaties were only water was collected and red dots where water and/or sediment were collected.
As a sampling strategy, the 20 L Niskin bottles were always the same for each depth at the sampling localities. Sampling was performed during the recovery of the rosette and a 5 min stabilization time elapsed at each sampling depth before the bottles were closed. According to Bernáldez-Sarabia et al. (2021), the use of specific bottles for each depth, the 20L Niskin bottles, as well as the sampling procedure, reduce the risk of bacterial contamination.
Sixty liters of each water layer were passed through a 0.22-μm Sterivex™ filter (EMD Millipore, Burlington, MA, USA) after collection. The filters were transported in a liquid nitrogen container at 4°C to the CICESE laboratory (Ensenada BC, Mexico) and were stored at -20°C until DNA extraction.
A total of 21 sediment samples distributed in the SGoMex were collected at select 16 localities during the XIX-4 and XIX-5 cruises (Figure 2) using a Reineck box corer. A subsample from the surface sediment layer (~10 cm depth) was taken using a sterile 10 cc cut-off syringe. The samples were immediately frozen in liquid nitrogen and transported at 4°C to CICESE, Ensenada BC, Mexico, where they were stored at -20°C until DNA extraction.
DNA from the water samples was extracted using the Wizard Genomic DNA Purification Kit (Promega, Madison, WI, USA). For the sediment samples, DNA was extracted using the MoBio DNA Power Soil kit (MoBio, Carlsbad, CA). The DNA was extracted according to the manufacturer’s instructions and was kept at -20°C until use. The quality and quantity of the obtained DNA were estimated using a NanoDrop Lite spectrophotometer (Thermo Fisher Scientific, Waltham, MA). The amplified target was the hypervariable region from V2 to V4 and V6 to V9 of the 16S rRNA gene. The product was sequenced with an Ion Personal Genome Machine (PGM) system (Thermo Fisher Scientific). Library construction and sequencing were carried out according to the Ion 16S Metagenomics Kit protocol (A26216; manual MAN0010799, Thermo Fisher Scientific).
Raw reads were trimmed with the fastx tools V0.0.14 (http://hannonlab.cshl.edu/fastx_toolkit/; accessed September 2021), and then the sequences were filtered at 200 to 400 bp and quality ≥27 (QC). The obtained sequences were used in the analyses. Chimeric sequences were removed with Vsearch V2.15.2 (Rognes et al., 2016), using the Gold database (http://drive5.com/uchime/uchime_download.html). The chimeric free sequences were classified into operational taxonomic units (OTU), implemented with QIIME V1.9 (Caporaso et al., 2010) using the close reference model implemented at 97% similarity with the Silva database release 132 (Quast et al., 2013).
The community structure analysis was performed by processing the OTUs table with Phyloseq V1.30 (McMurdie and Holmes, 2013) and Vegan V2.5.6 (Oksanen et al., 2017) packages in R V3.6.3 using RStudio. The OTUs table was evaluated to eliminate Eukaryotic sequences and singletons. The relative abundance was analyzed with the 25 most abundant families. The Shannon index was used to calculate diversity and was implemented using the Microbiome V1.8 package (Lahti and Shetty, 2017; https://github.com/microbiome/microbiome). Differences among Shannon diversity index were evaluated by two-way analysis of variance (ANOVA) followed by Tukey’s multiple comparison of means (p<0.05), among the water masses (maxF, minO, AAIW, and NADW) and sediment samples collected during the XIX-4, XIX-5, and XIX-6 cruises. Registered values are show in Figure 3 and Table 1.
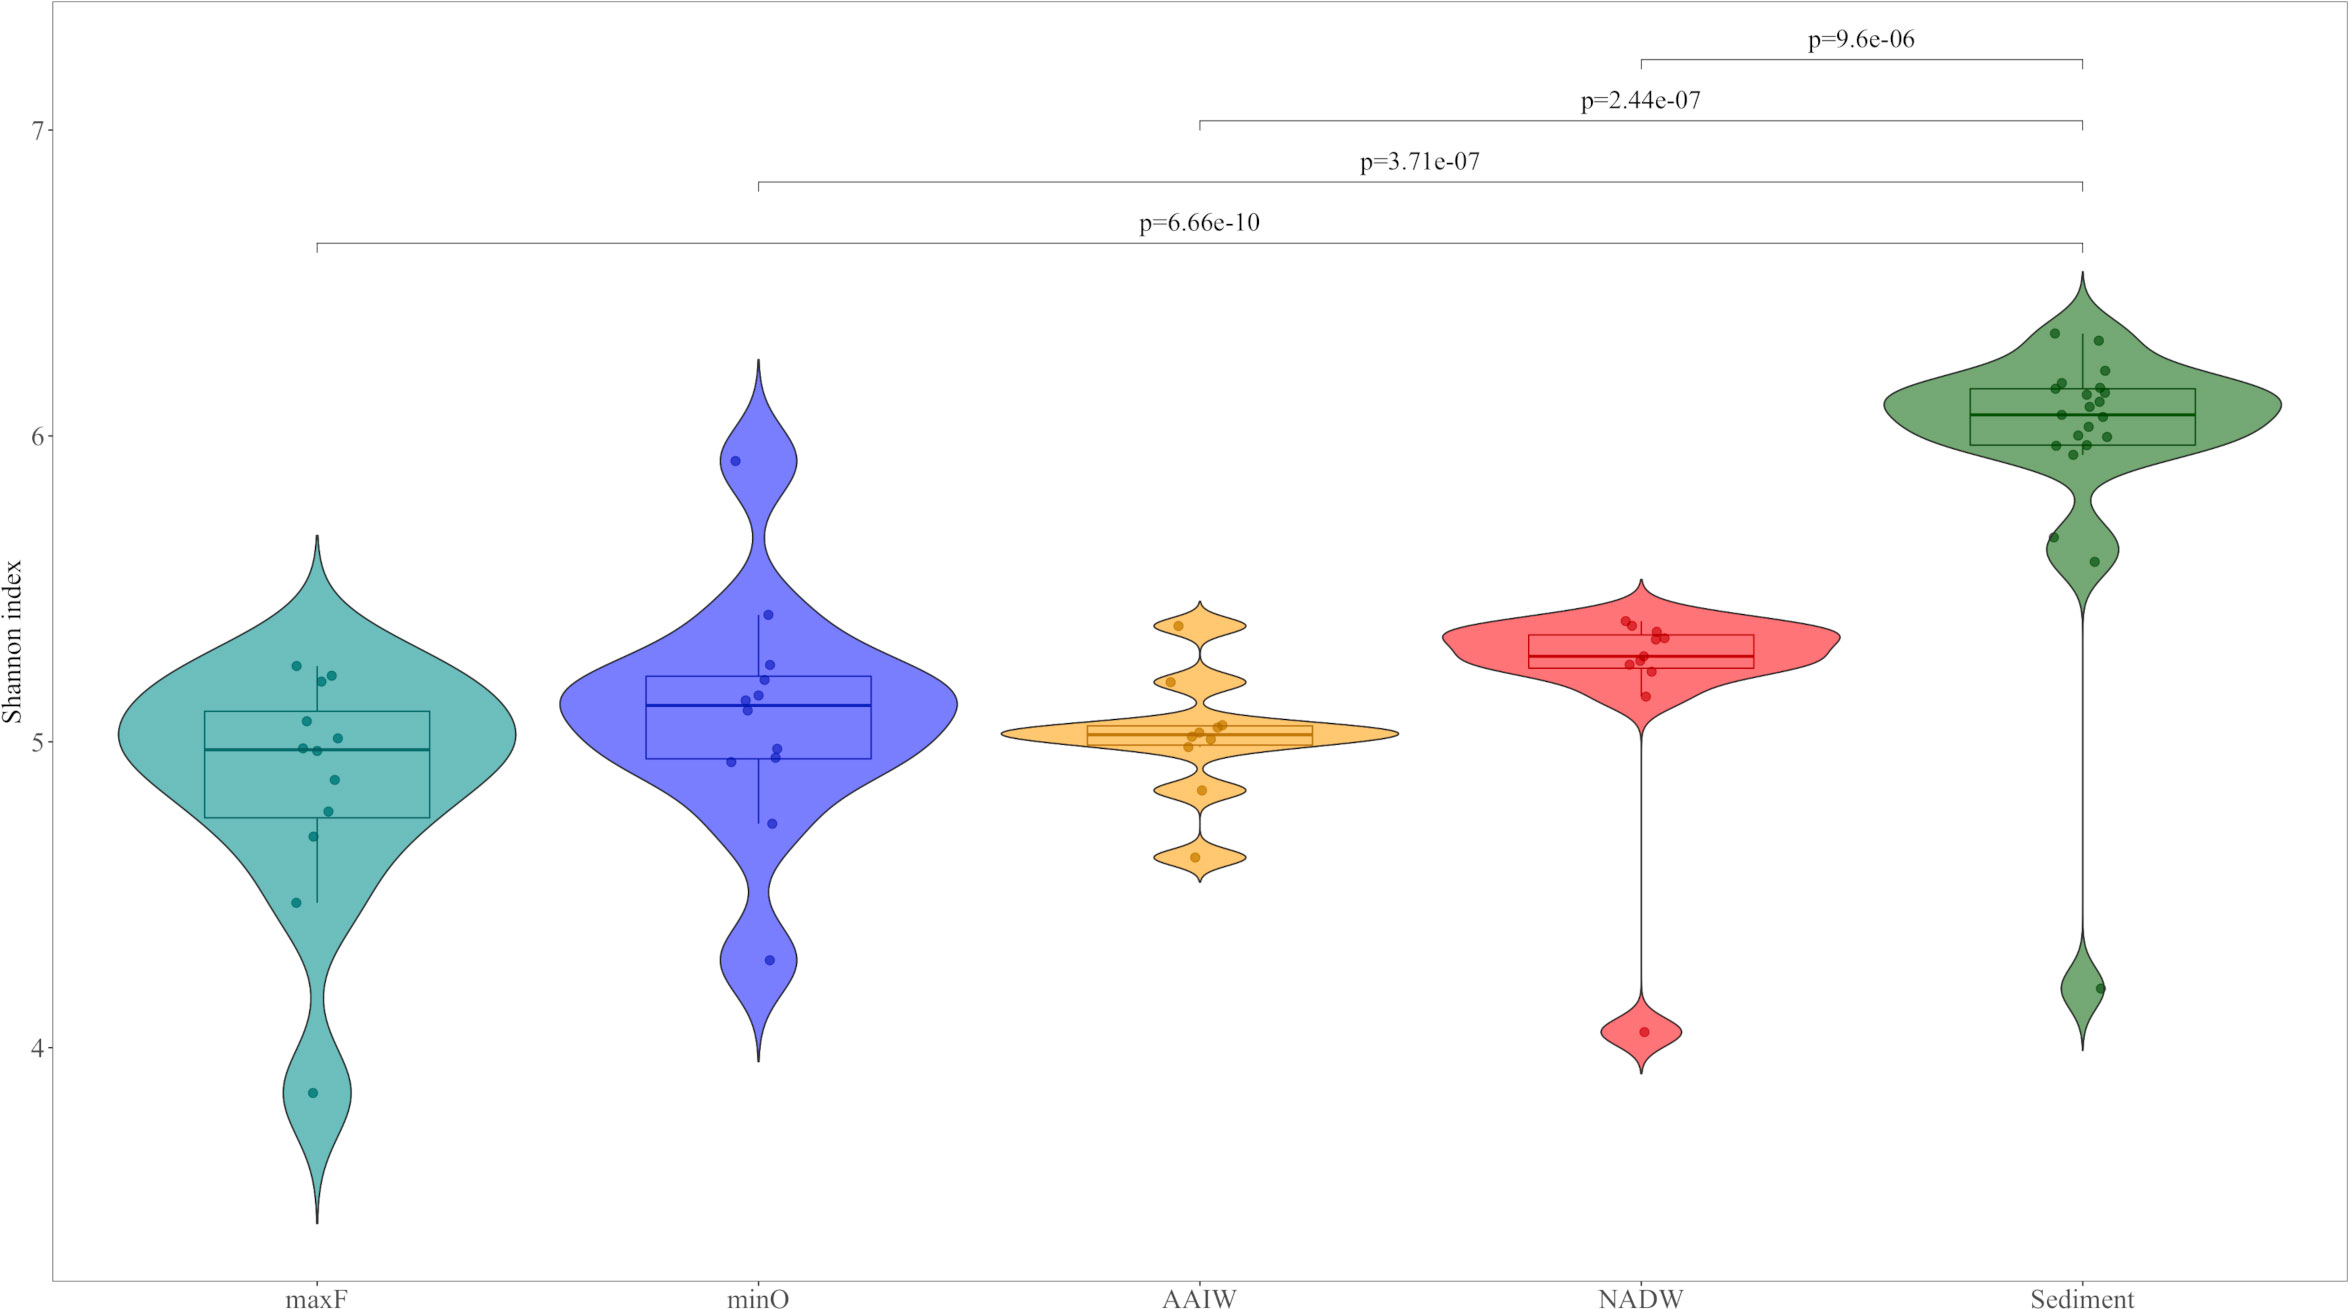
Figure 3 Violin representation of the Shannon diversity Index for water and sediment environments. The results are presented according to water masses: maxF, minO, AAIW, NADW and sediments. The upper lines show the differences between water masses and sediment, based on two-way ANOVA followed by Tukey’s multiple comparison of means (p <0.05).
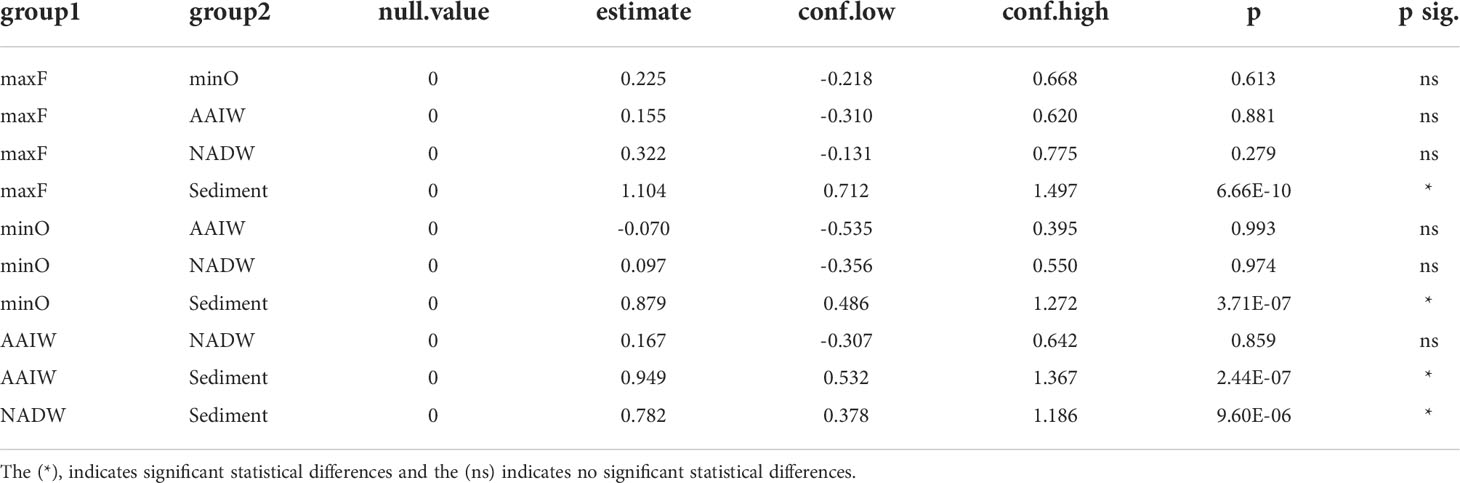
Table 1 Shannon diversity index among water masses and sediment were evaluated by two-way analysis of variance (ANOVA) followed by Tukey’s multiple comparison of means (p<0.05).
The community structure was explored with the registered OUTs with non-metric multidimensional scaling (NMDS) ordination based on Bray-Curtis distance (999 permutations) implemented in Phyloseq. The differences in the community structure and samples from the different water masses and sediments were evaluated with the Permutational Multivariate Analysis of Variance (PERMANOVA), accomplish with ADONIS (vegdist, 999 permutes, Bray-Curtis distance) using pairwiseAdonis V0.4 (Martinez Arbizu, 2017).
Raw reads of 16S rRNA genes sequences analyzed for this study were deposited in the NCBI’s Sequence Read Archive (SRA) database under the BioProject (PRJNA831849) and accession numbers SRR18919396 to SRR18919461.
Figure 1 shows the representative physical-chemical data registered in the water column during the XIXIMI cruises, which is indicative of the historically reported water masses in the GoMex. Differences between those water masses were defined by the CTD recorded parameters. Figure 1 also shows the homogeneity of the CTD data at the different sampling localities in the northern region of the SGoMex. The water masses presented similar profiles for the southern region of the SGoMex (data not shown). In the localities, A10 and B18 were registered until 1200 m, with different profiles for temperature, salinity, and dissolved oxygen, since they are located within the loop current, in precedence from the Caribbean Sea.
The microbial community compositions were characterized based on the hypervariable region V2 to V4 and V6 to V9 from the 16S rRNA sequencing obtained from 66 water and sediment samples. From the obtained reads (8,416,840), a low percentage (~6.4%) were chimeric sequences. The OTUs clustering and taxonomy assignments were implemented with 7,873,068 (~257 bp) chimeric-free sequences and clustered into 13,784 OTUs. From those, the OTUs assigned to Eukaryota (~2.9%) and singletons (~22.5%) were eliminated. Therefore, the analyses were implemented with 10,269 OTUs. Most of them were assigned to bacteria (99.25%), and a small percentage were assigned to archaea (~0.75%).
The Shannon diversity index was 5.33 on average for both environments. The index for maxF was 4.86, minO was 5.09, AAIW was 5.02, NADW was 5.18, and sediments was 5.97. The statistical analysis accomplished with the Shannon diversity index among the studied environments showed significant differences between sediments and water masses (Figure 3), based on two-way ANOVA followed by Tukey’s multiple comparison of means
Proteobacteria were the most abundant phylum of the bacteria community in both environments, representing ~61.99% of the detected bacteria. The other phyla were Marinimicrobia (SAR406 clade) ~7.82%, Actinobacteria ~6.59, Acidobacteria ~5.31%, and Bacteroidetes ~4.80%. Forty-three phyla were detected with <3% relative abundance.
For the water environment, the most abundant phylum was Proteobacteria (63.39%), followed by Marinimicrobia (SAR406 clade, 11.46%), Actinobacteria (7.48%), Bacteroidetes (6.07%), Planctomycetes (2.22%), Cyanobacteria (1.72%), Verrucomicrobia (1.33%), Euryarchaeota (1.25%), Gemmatimonadetes (1.24%), and Acidobacteria (1.01%). The remaining phyla detected presented <1% relative abundance. In sediment, the most abundant phyla were Proteobacteria (59.0%), Acidobacteria (14.52%), Gemmatimonadetes (5.23%), Actinobacteria (4.68%), Planctomycetes (3.82%), Rokubacteria (2.32%), Nitrospirae (2.21%), Bacteroidetes (2.07%), Chloroflexi (1.41%). Other phyla presented <1% of relative abundance.
At the class taxonomic category, the most abundant classes in both environments were Gammaproteobacteria (38.72%), Alphaproteobacteria (16.98%), Deltaproteobacteria (12.28%), Acidimicrobiia (6.0%), and Bacteroidia (4.74%). The remaining classes (122) represented <2% of the relative abundance.
For the water environment, the most abundant classes were Gammaproteobacteria (42.55%), Alphaproteobacteria (18.31%), Deltaproteobacteria (11.16%), Acidimicrobiia (7.20%), Bacteroidia (6.41%), Oxyphotobacteria (1.80%), and Verrucomicrobiae (1.53%). The other classes identified represented <1.5% of the relative abundance. In the sediment environment, the most abundant classes were Gammaproteobacteria (30.53%), Deltaproteobacteria (14.67%), Alphaproteobacteria (14.12%), Acidimicrobiia (3.43%), and Thermoanaerobaculia (2.48%). The other classes identified represented <2.4% of the relative abundance.
At the order taxonomic category, the most abundant orders in the water and sediment environments were Alteromonadales (8.71%), SAR86 clade (8.18%), SAR324 clade (Marine group B, 5.81%), NB1-j (5.39%), Rhodospirillales (5.17%), Actinomarinales (4.77%), and Flavobacteriales (3.8188). The remaining identified (339) represented <3.5% of the relative abundance.
For the water environment, the most abundant orders were the SAR86 clade (12.0%), Alteromonadales (11.36%), SAR324 clade (Marine group B, 8.18%), and Rhodospirillales (7.07%), The other orders identified represented <5.5% of the relative abundance. In the sediment, the most abundant orders were NB1-j (14.70%), Steroidobacterales (7.35%), Rhodovibrionales (6.81%), AT-s2-59 (5.87%), MBMPE27 (5.02%), and Actinomarinales (4.03%). The others identified represented <3.3% of the relative abundance.
Concerning the family taxonomic category (Table 2), a total of 566 families were detected in the water and sediment samples. The most abundant families in both environments, were Alteromonadaceae (9.52%), AEGEAN-169 marine group (5.38%), Thioglobaceae (5.36%), Actinomarinaceae (4.82%), Woeseiaceae (4.47%), Kiloniellaceae (3.85%), Flavobacteriaceae (3.66%), and Rhodobacteraceae (3.23%), The other 558 families represented <2.2% of the relative abundance.
Concerning the water masses, the most abundant families (Table 2) in the maxF layer were Actinomarinaceae (22.64%), Flavobacteriaceae (11.40%) Cyanobiaceae (7.38%), AEGEAN-169 marine group (6.71%) and Rhodobacteraceae (6.70%). At the minO layer, the most abundant were Thioglobaceae (14.38%), Alteromonadaceae (11.68%), AEGEAN-169 marine group (9.59%), Rhodobacteraceae (5.30%), SS1-B-06-26 (5.22%), and Flavobacteriaceae (4.55%). At the AAIW layer, the most abundant were Alteromonadaceae (18.10%), Thioglobaceae (13.66%), AEGEAN-169 marine group (10.06%), Alcanivoracaceae (5.85%), and Magnetospiraceae (3.38%). At the deepest water layer (NADW), the most abundant were Alteromonadaceae (26.28%), AEGEAN-169 marine group (5.31%), Methylomonaceae (4.82%), and Magnetospiraceae (4.55%). In the sediments, the most abundant families were Woeseiaceae (13.08%), Kiloniellaceae (12.04%), Methylomirabilaceae (5.24%), Nitrospiraceae (4.97%), and Colwelliaceae (4.90%).
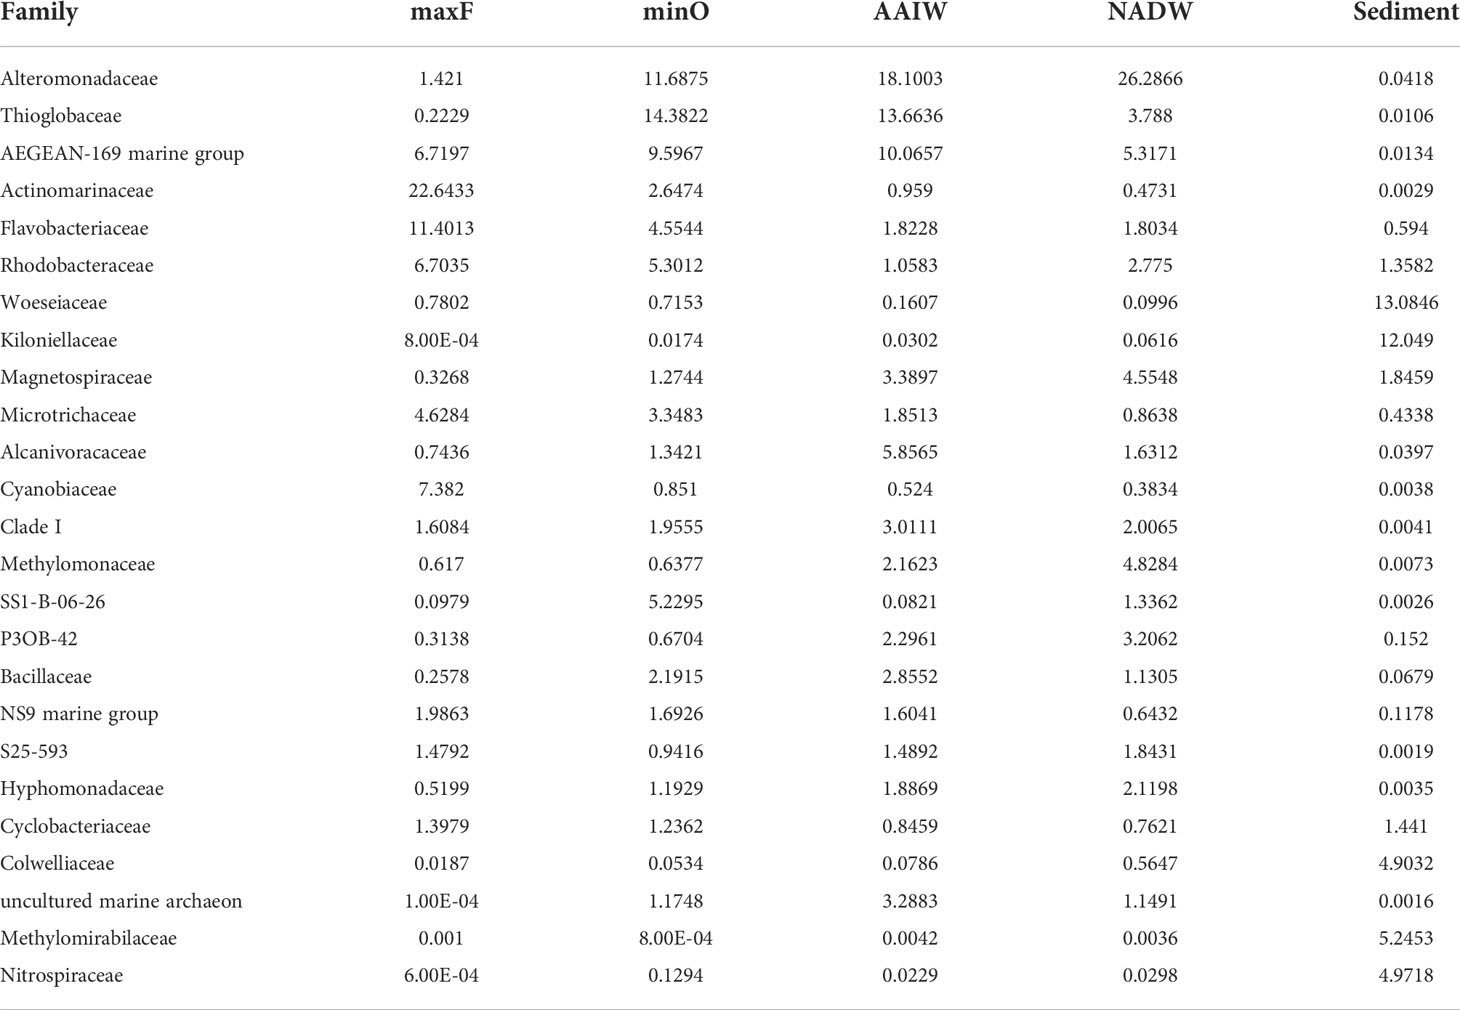
Table 2 Relative abundance (%) of the 25 most abundant families registered in the water masses (maxF, minO, AAIW, and NADW) and sediment.
Figure 4 shows bacterial community differences in relative abundance between the studied environments. The four water masses present a different family structure, especially the maxF with the other three. Actinomarinaceae was the most abundant family at the maxF layer, in contrast to the Alteromonadaceae family, which showed a progressive increase from the minO level to the deepest waters.
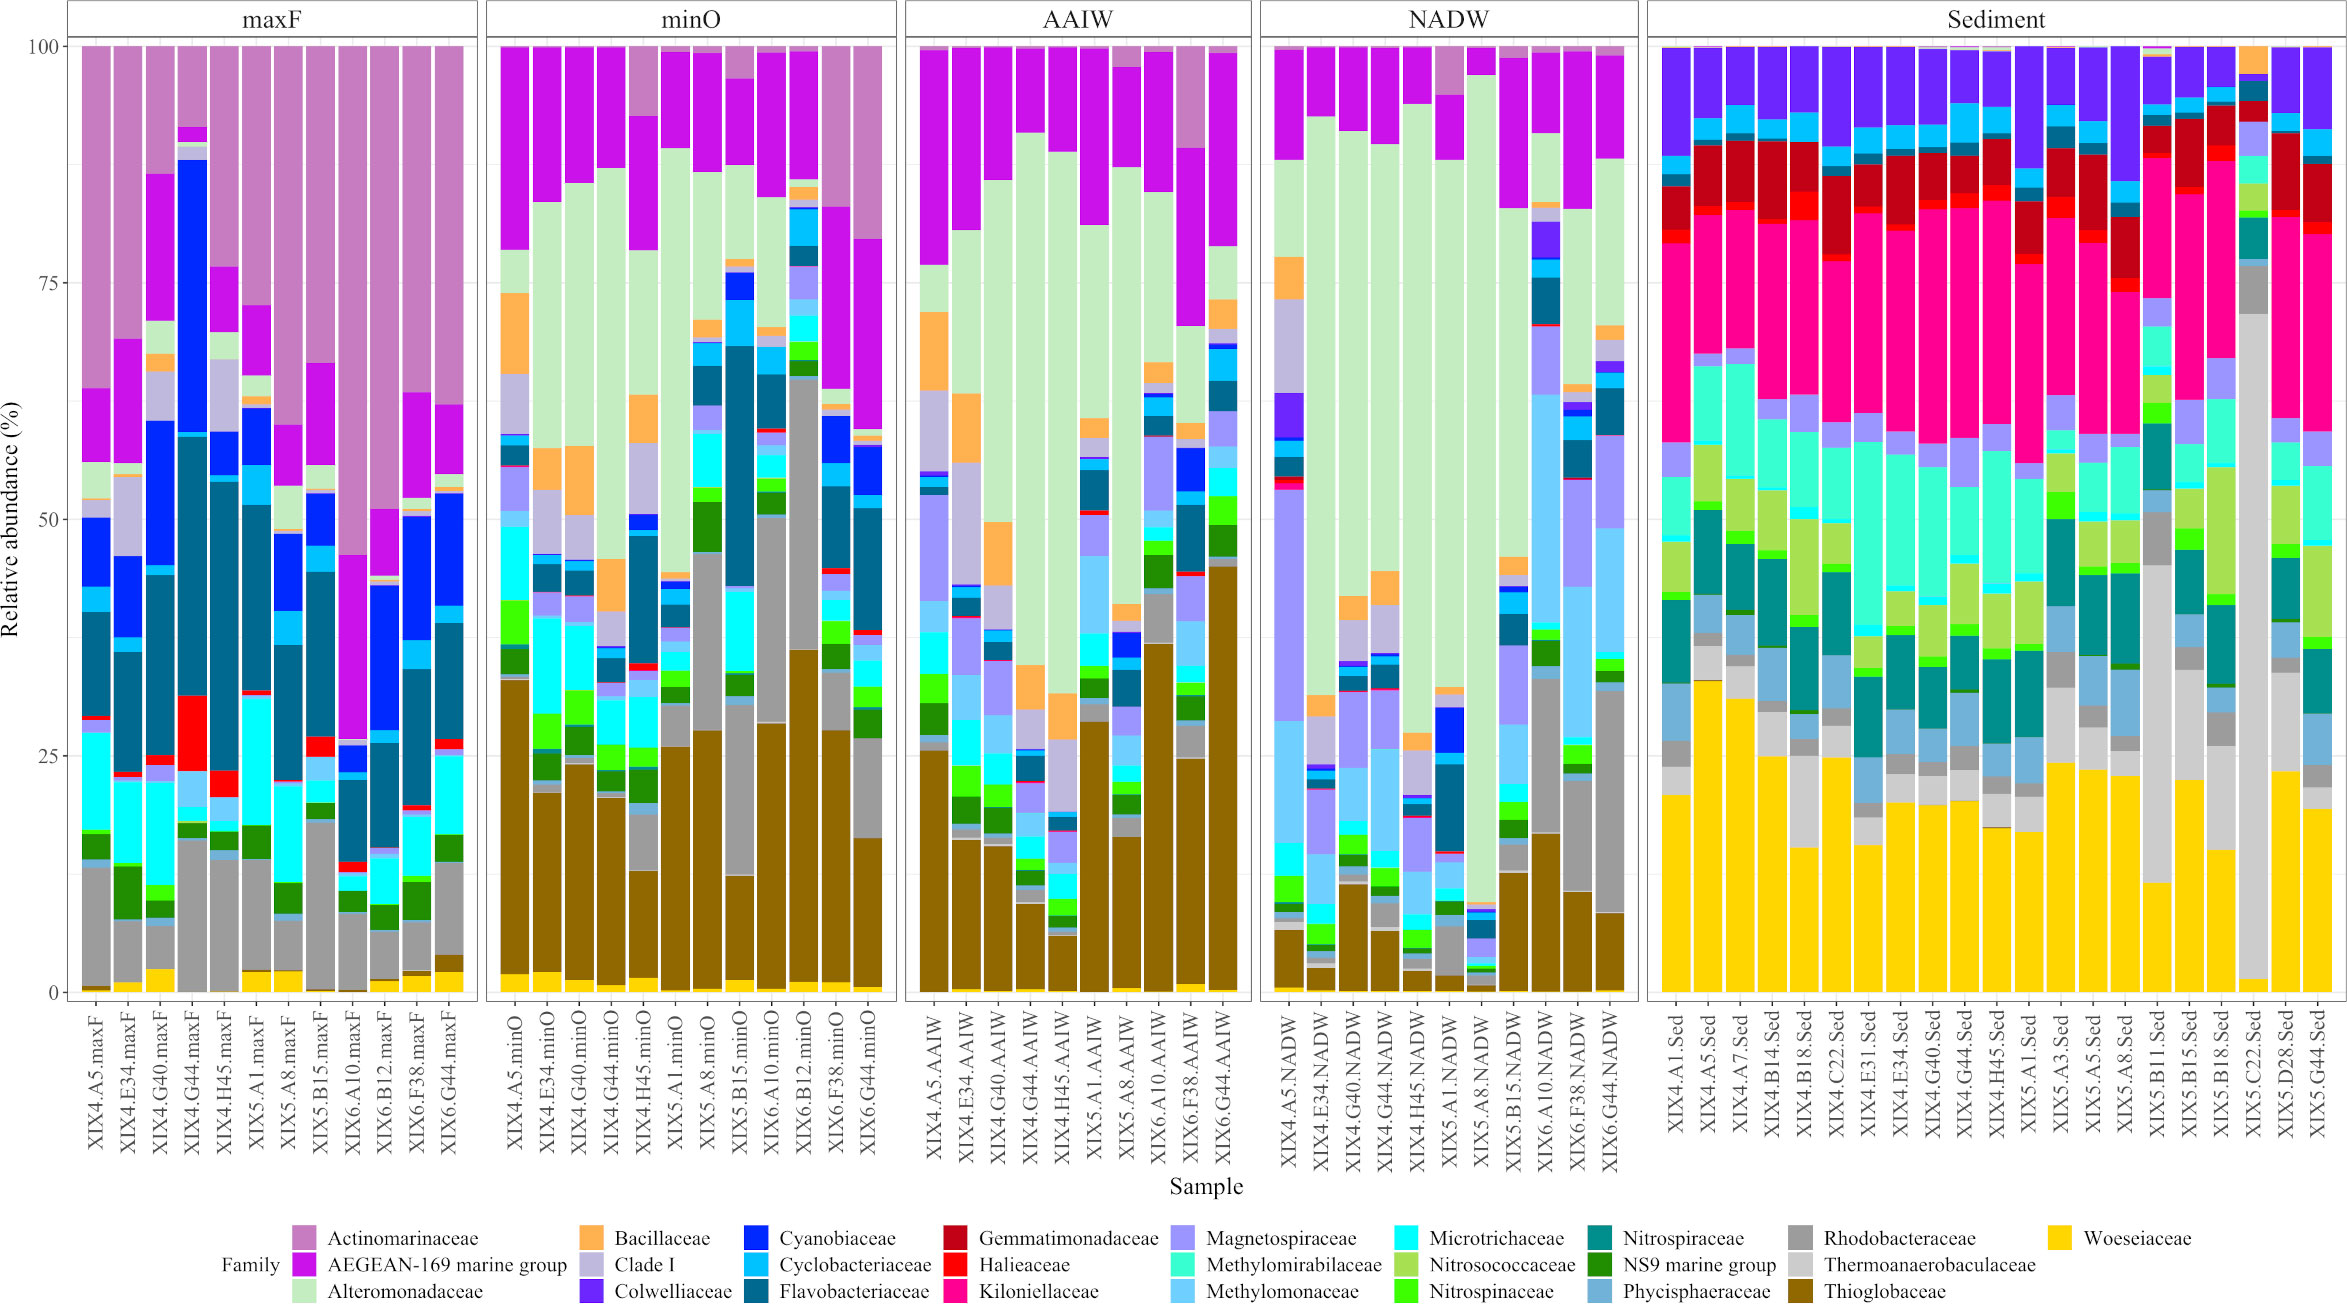
Figure 4 Taxonomic composition and relative abundance of the 25 most abundant families, based on the16S rRNA analysis. Labels on the bottom indicate cruise, sample, and water mass (ex: XIX-4.A5.maxF).
Comparative analyses of the microbial communities based on non-metric multidimensional scaling (NMDS) ordination are shown in Figure 5 (axes A, B, and C), where is clear the separation among bacterial communities into three clusters. In the water column, the maxF samples were grouped in one cluster and separated from the other water masses (minO, AAIW, and NADW). The sediment samples were grouped in a cluster that was separate from the four water samples. In the three axes, the microbial communities of deep water masses are grouped in one cluster separated from the maxF and sediment.
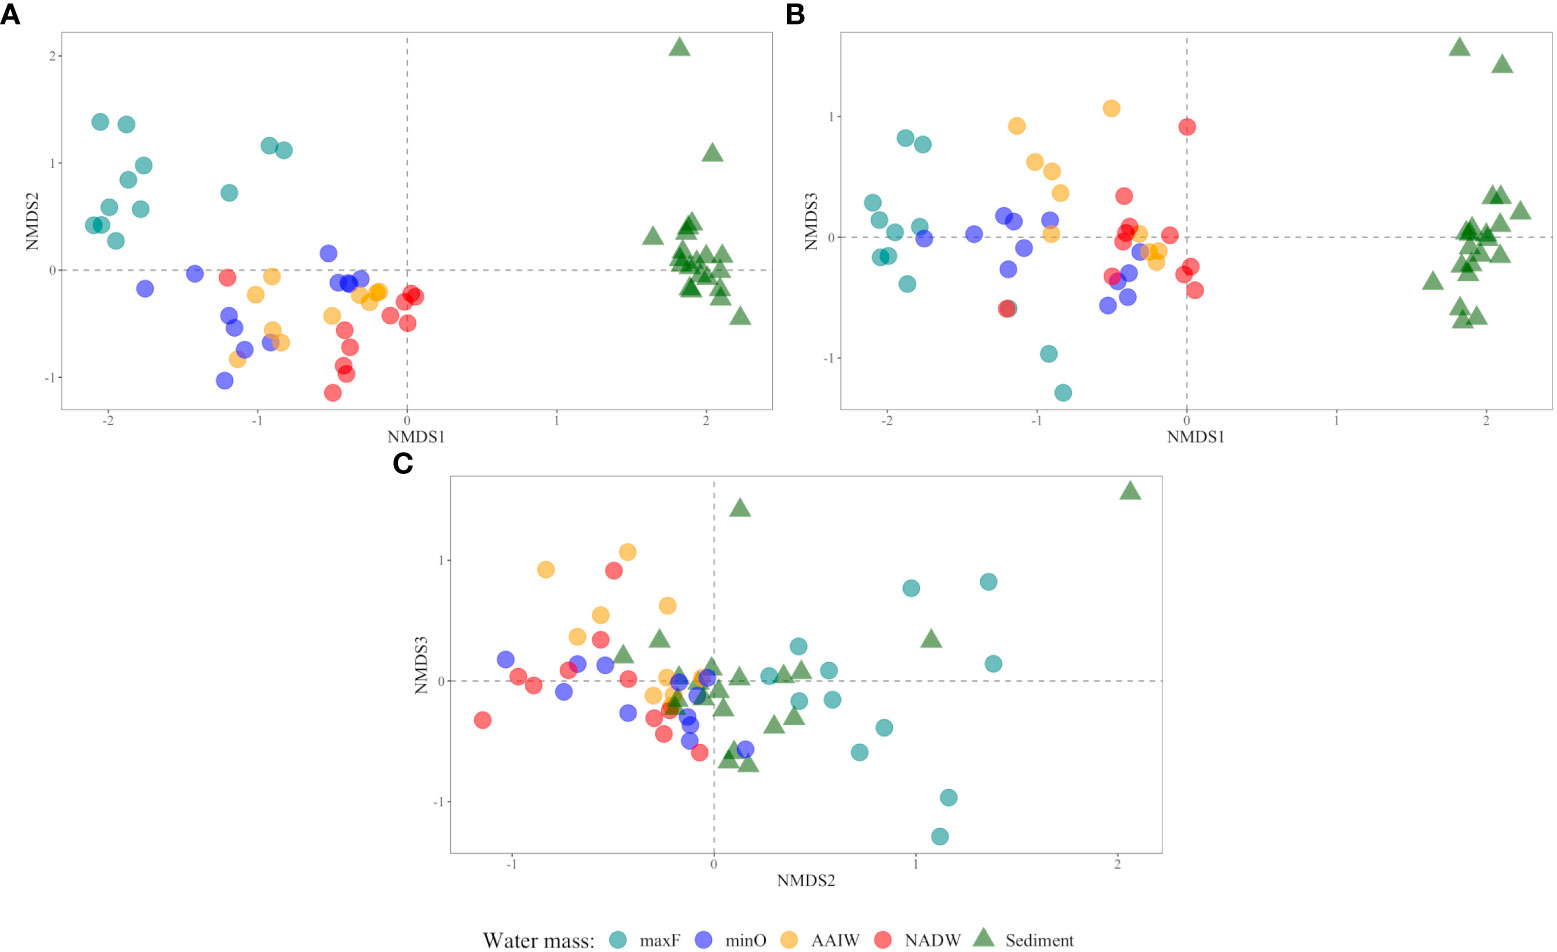
Figure 5 Comparative analyses of microbial communities based on non-metric multidimensional scaling (NMDS) ordination axis: (A) 1 vs 2, (B) 1 vs 3, and (C) 2 vs 3). The sediment samples are represented by a triangle (▴) and water samples by a circle (•) according to water masses (maxF, minO, AAIW, NADW).
Based on the statistical differences from PERMANOVA (p<0.05) test, the pairwise comparison among the OTUs identified in the water masses (Table 3), showed significant differences (p=0.001), between the maxF layer with the minO, AAIW, and NADW water masses, and sediments, also between the minO layer and the NADW. Non-significant differences were identified between the AAIW with minO and AAIW with NADW. Significant differences were registered among the maxF, minO, AAIW, NADW water masses, and the sediment environment.
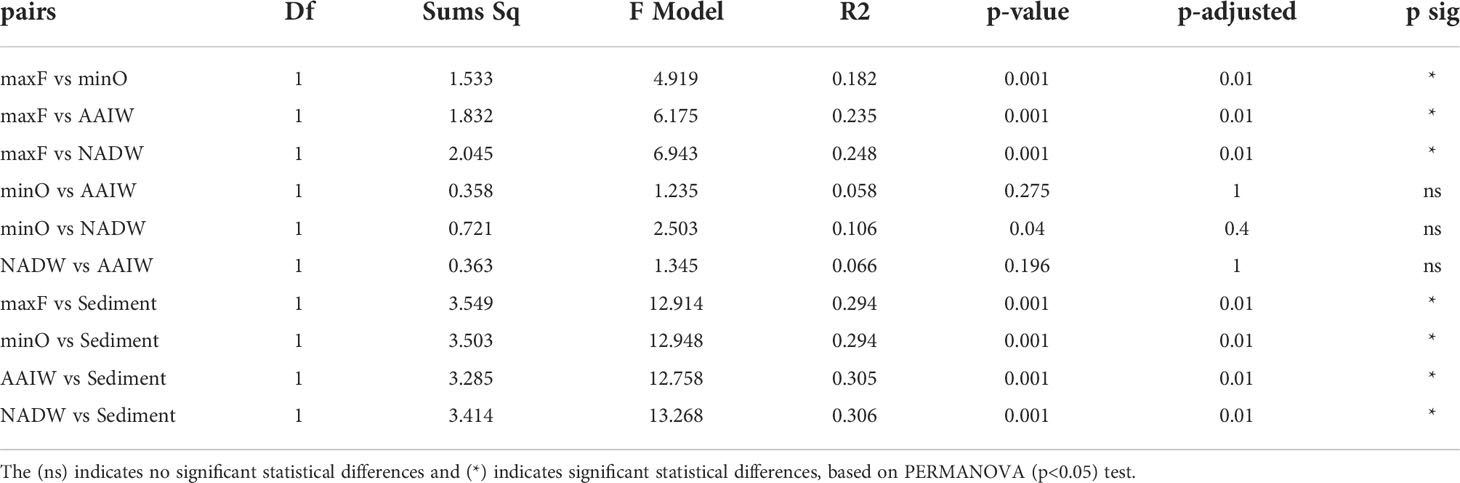
Table 3 Pairwise comparisons among water masses and sediment environments.
The water masses of the GoMex have been extensively described by their physical/chemical characteristics, but limited information exists about their bacterial communities. Metagenomics 16S rRNA has opened the possibility to such characterization, as well as the opportunity to make comparisons with other water masses from different geographic areas, due to the standardization of bacterial sequencing analyses. The water masses described in the GoMex present an stratification according to their origin that can be detected using the dissolved oxygen content, salinity, or temperature onboard an oceanographic vessel. Therefore, bacteriological sampling was accomplished accurately at selected water depths.
Water masses show differences between the sub-surface water mass (photic zone) and the deepest ones. In the photic zone, there is major phytoplankton and zooplankton productivity in marine waters, through a complex cycle of dissolved organic matter, where bacteria play an important role in the so-called microbial loop (Azam, 1998). Therefore, is not surprising to find the existence of a particular bacterial community, where fluorescence is registered at its maximum level, far different from deep water bacteria, where they depend, mainly, on the organic matter produced at the photic zone. Nevertheless, statistical analysis show in Table 1, indicate significant differences in bacterial diversity between water masses and the sediment, as has been reported by Walsh et al. (2015). In addition, the diversity of the water column community, did not display statistically differences among the studied water masses, indicating that bacterial diversity presented similar characteristics in the water column.
Most of the studied OTUs, in both environments, were assigned to bacteria (99.25%), and a small percentage to archaea (~0.75%). Similar results were reported for oil impacted sediment samples from the Northern GoMex (Kimes et al., 2013), where the bacteria domain represented 95 to 97% and archaea 2.2 to 4.2% of the microbial community. Those results indicate that the Bacteria domain is predominant in different marine environments, even at oil impacted areas.
The results indicated that Proteobacteria was the dominant phylum in water and sediment environments in the SGoMex, as has been reported in different metagenomic studies in the oceans worldwide. The classes Gammaproteobacteria and Alphaproteobacterial were dominant, as is also frequently reported in other studies (Agogué et al., 2011; Biddle et al., 2011; Rakowski et al., 2015; Walsh et al., 2015, among others). Particular to the present study, it was found that the family Alteromonadaceae, was the most abundant in the water masses, showing an increase in the deepest waters.
Walsh et al. (2015) reported differences in compositional bacterial communities (based on Bray-Curtis similarity) between the photic zone (at the deep chlorophyll maximum; DCM), the sub-photic (below the DCM), and the superficial sediment (0-10 cm) at the Equatorial Pacific Ocean and the North Pacific gyre. They found that Cyanobacteria, Flavobacteria, and Alphaproteabacteria were dominant in the photic-zone samples, instead of in the aphotic zone, where Alphaproteobacteria, Gammaproteobacteria, Deltaproteobacteria, and Deferribacteres were dominant. For the superficial sediments (1-10 cm), Alphaproteobacteria, Gammaproteobacteria, Deltaproteobacteria, Nitrospira, and Pnactomycetes were dominant within the bacterial community. In the present study, the sediment environment displayed a very different structure of families from the water samples, with a clear dominance of the families Woeseiaceae and Kiloniellaceae.
According to Rodríguez-Salazar et al. (2021), significant differences between deep sediments (2800 to 3700 m) and shallow sediments (20 to 600 m) from the SGoMex were observed. In this region, taxonomic diversity in the sediments was found for members of the classes Deltaproteobacteria (12– 35%), Gammaproteobacteria (2–24%), Alphaproteobacteria (1– 20%), and Dehalococcoidia (0.3–17%). In water samples, these authors reported Alteromonas as the most abundant genus at the maxF level. In the present study, it was found that the family Alteromonadaceae have been detected at the maxF, increasing in abundance towards deepest waters.
Differences among the water masses and sediments are shown in Table 3, where it is indicated that the maxF samples registered significant differences for the deepest water masses and between those water masses with the sediment environment. These differences are also shown in Figure 5, where all the maxF samples are grouped in a separate cluster from the deepest waters and all the sediment samples are grouped in a cluster separate from the water samples.
This study revealed that water masses and sediments from the SGoMex show a dominance of the phylum Proteobacteria, which has been reported in other metagenomic studies from the GoMex and from the Pacific and Atlantic oceans. The Class Gammaproteobacteria is also frequently reported as dominant, as reported in this study. The reported data worldwide indicate that the predominance of the phylum Proteobacteria, is a common trend in different marine environments. Furthermore, data generated by other authors seems to indicate that phylum Proteobacteria and the classes Gammaproteobacteria and Alphaproteobacteria are predominant in open ocean marine environments.
In the present study, the maxF layer presented a dominance of Actinomarinaceae family, compared to the deep water communities, which showed a dominance of the family Alteromonadaceae (Class Gammaproteobacteria) that increased progressively to the deepest waters, from the minO until the NADW. These results confirm that the photic zone where is registered the maxF water mass, harbor a particular bacterial community that could be related to the carbon cycle that take place at surface waters.
Concerning the bacterial community in the water masses, the maxF water mass and the deepest water masses were significantly different. In contrast, no significant differences were found between the minO and the AAIW and with this water mass and the NADW, suggesting a mix of bacterial communities within the SGoMex, unlike to results reported by Agogué et al. (2011). These authors have reported a cluster for maxF, a second cluster for the AAIW and a third cluster for the NADW, indicating that separation of those clusters are best defined at the North of the Atlantic than in the South, reflecting the importance of the water masses origin, concerning the deep water bacterial community. According to Rivas et al. (2005), a renewal of deep water (NADW) take place in the Caribbean Sea, in a complex process they called “ventilation”; they pointed out that a similar process could take place in the Gulf of Mexico, which could explain the mix of bacterial communities among minO, AAIW and NADW water masses, reported in this study. Based on PERMANOVA (Table 3) and the NMDS (Figure 5) analyzes, this study registered a separate cluster for maxF water mass, as was also reported by Agogué et al. (2011).
The sediment environment revealed a vastly different bacterial community structure from the water samples, confirming results reported by other authors (Agogué et al., 2011; Walsh et al., 2015), probably as result of the higher concentration and complexity of the organic carbon present in marine sediments, as a consequence of the marine snow event, as has been reported by other authors.
The datasets presented in this study can be found in online repositories. The names of the repository/repositories and accession number(s) can be found below: https://www.ncbi.nlm.nih.gov/, BioProject (PRJNA831849) https://www.ncbi.nlm.nih.gov/, accession numbers SRR18919396 to SRR18919461.
MP Conceptualization, supervision, funding acquisition, writing the original draft, and draft review. AG Conceptualization, methodology, formal analysis, writing the original draft, and draft review. AN Conceptualization, project administration, funding acquisition, and draft review. All authors contributed to the article and approved the submitted version.
This research was funded (2016-2020) by the Fondo Sectorial CONACYT-SENER-Hidrocarburos, project 201441, as well as by the CICESE internal project 682135 (2016 to present).
The technical assistance of Edna Sánchez Castrejón and Edna Lorena Hernández López from the Marine Biotechnology Laboratory, CICESE, is deeply appreciated. This research is a contribution of the Gulf of Mexico Research Consortium (CIGoM) under the sub-project “Determinación de la composición bacteriana hidrocarbonoclástica en aguas profundas del Golfo de México”. We thank Blue Pencil Science (http://www.bluepencilscience.com/) for editing an English draft of this manuscript.
The authors declare that the research was conducted in the absence of any commercial or financial relationships that could be construed as a potential conflict of interest.
All claims expressed in this article are solely those of the authors and do not necessarily represent those of their affiliated organizations, or those of the publisher, the editors and the reviewers. Any product that may be evaluated in this article, or claim that may be made by its manufacturer, is not guaranteed or endorsed by the publisher.
Agogué H., Lamy D., Neal P. R., Mitchell l., Sogin M. I., Herndl G. J. (2011). Water mass-specificity of bacterial communities in the north Atlantic revealed by massively parallel sequencing. Mol. Ecol. 20, 258–274. doi: 10.1111/j.1365-294X.2010.04932.x
Azam F. (1998). Microbial control of oceanic carbon flux: the plot thickness. Science 280, 694–696. doi: 10.1126/science.280.5364.694
Bernáldez-Sarabia J., Lizárraga-Partida M. L., Hernández-López E. L., Gasperin-Burbarela J., Licea-Navarro A. F., Guerrero A., et al. (2021). Distribution of pathogenic vibrios and vibrio spp. in the water column and sediment samples from the southern gulf of Mexico. Mar. pollut. Bull. 173. doi: 10.1016/j.marpolbul.2021.113116
Biddle J. F., White J. R., Teske A. P., House C. (2011). Metagenomics of the subsurface brazos-trinity basin (IODP site 1320): comparison with other sediment and pyrosequenced metagenomes. ISME J. 5, 1038–1047. doi: 10.1038/ismej.2010.199
Caporaso J. G., Kuczynski J., Stombaugh J., Bittinger K., Bushman F. D., Costello E. K., et al. (2010). QIIME allows analysis of high-throughput community sequencing data. Nat. Methods 7, 335–336. doi: 10.1038/nmeth.f.303
Kimes N. E., Callaghan A. V., Aktas D. F., Smith W. L., Sunner J., Golding B., et al. (2013). Metagenomic analysis and metabolite profiling of deep-Sea sediments from the gulf of Mexico following the deepwater horizon oil spill. Front. Microbiol. 4. doi: 10.3389/fmicb.2013.00050
Lahti L., Shetty S. (2017)Tools for microbiome analysis in r. In: Microbiome package version 1.9.14. Available at: https://github.com/microbiome/microbiome/ (Accessed 10 October, 2021).
Martinez Arbizu P. (2017) pairwiseAdonis: Pairwise multilevel comparison using Adonis. Available at: https://github.com/pmartinezarbizu/pairwiseAdonis (Accessed 10 October, 2021).
McMurdie P. J., Holmes S. (2013). Phyloseq: An r package for reproducible interactive analysis and graphics of microbiome census data. PloS One 8 (4), e61217. doi: 10.1371/journal.pone.0061217
Nowlin W. D. Jr., McLellan A. (1967). A characterization of the gulf of Mexico waters in winter. J. Mar. Res. 25, 29–59.
Oksanen J., Guillaume B. F., Friendly M., Kindt R., Legendre P., McGlinn D., et al. (2017)Vegan: community ecology package. In: The comprehensive r archive network. Available at: https://CRAN.R-project.org/package=vegan (Accessed September, 2021).
Quast C., Pruesse E., Yilmaz P., Gerken J., Schweer T., Yarza P., et al. (2013). The SILVA ribosomal RNA gene database project:Improved data processing and web-based tools. Nucleic Acids Res. 41, D590–D596. doi: 10.1093/nar/gks1219
Rakowski C., Magen C., Bosman S., Gillies L. E., Rogers K. L., Chanton J. P., et al. (2015). Methane and microbial dynamics in the gulf of Mexico water column. Front. Mar. Sci. 2. doi: 10.3389/fmars.2015.00069
Rivas D., Badan A., Ochoa J. (2005). ). the ventilation of the deep gulf of Mexico. J. Phys. Oceanog. 35, 1763–1781.
Rodríguez-Salazar J., Loza A., Ornelas-Ocampo K., Gutierrez-Rios R. M., Pardo-López L. (2021). Bacteria from the southern gulf of Mexico: Baseline, diversity, hydrocarbon-degrading potential and future applications. Front. Mar. Sci., 8 8. doi: 10.3389/fmars.2021.625477
Rognes T., Flouri T., Nichols B., Quince C., Mahé F. (2016). VSEARCH: a versatile open source tool for metagenomics. PeerJ 4, e2584. doi: 10.7717/peerj.2584
Keywords: Southern Gulf of Mexico, 16S rRNA bacterial communities, deep sea water bacteria, deep Sea sediment bacteria, metagenomic analysis of deep marine environments
Citation: Guerrero A, Licea AF and Lizárraga-Partida ML (2022) Metagenomic analysis among water masses and sediments from the Southern Gulf of Mexico. Front. Mar. Sci. 9:1020136. doi: 10.3389/fmars.2022.1020136
Received: 15 August 2022; Accepted: 07 October 2022;
Published: 20 October 2022.
Edited by:
M. Leopoldina Aguirre-Macedo, Center for Research and Advanced Studies - Mérida Unit, MexicoReviewed by:
Carlos Paz, Universidad Autónoma de Campeche, MexicoCopyright © 2022 Guerrero, Licea and Lizárraga-Partida. This is an open-access article distributed under the terms of the Creative Commons Attribution License (CC BY). The use, distribution or reproduction in other forums is permitted, provided the original author(s) and the copyright owner(s) are credited and that the original publication in this journal is cited, in accordance with accepted academic practice. No use, distribution or reproduction is permitted which does not comply with these terms.
*Correspondence: M. L. Lizárraga-Partida, lizarra@cicese.mx
†These authors have contributed equally to this work
Disclaimer: All claims expressed in this article are solely those of the authors and do not necessarily represent those of their affiliated organizations, or those of the publisher, the editors and the reviewers. Any product that may be evaluated in this article or claim that may be made by its manufacturer is not guaranteed or endorsed by the publisher.
Research integrity at Frontiers
Learn more about the work of our research integrity team to safeguard the quality of each article we publish.