
94% of researchers rate our articles as excellent or good
Learn more about the work of our research integrity team to safeguard the quality of each article we publish.
Find out more
ORIGINAL RESEARCH article
Front. Mar. Sci., 22 December 2022
Sec. Marine Evolutionary Biology, Biogeography and Species Diversity
Volume 9 - 2022 | https://doi.org/10.3389/fmars.2022.1019473
 Maslin Osathanunkul1,2*
 Nipitpong Sawongta1
 Nuankanya Sathirapongsasuti3,4Thunyaporn Poonsawat5,6Usawadee Detsri7,8Charatsee Aungtonya8Chatmongkon Suwannapoom9
Accurate species identification is critical for highly venomous jellyfish studies particularly for evaluation of their distribution as it is important not only for understanding population dynamics but also predicting risk to locals and tourists. Hazardous jellyfish species have been determined using methods such as comparative morphology and chemistry, which are less useful and practical in some cases. A few molecular methods have been developed in aiding hazardous jellyfish species identification. However, no studies have focused on designing and developing high resolution melting (HRM) assays to distinguish jellyfish species from each other. This is despite several studies showing the potential of HRM in effectively distinguishing plants and animals. In this study, we developed an HRM method to differentiate jellyfish species in five box jellyfish families (Carukiidae, Chirodropidae, Chiropsalmidae, Chiropsellidae, and Tripedaliidae) and Physaliidae found in Thai waters. All jellyfish samples (10 species) were able to be distinguished by the HRM with 16S rRNA primers. Even closely related species in the same genus could be clearly discriminated by their melting profiles. The melting curves of the 10 species were then used as references. By comparing the normalized melting curves of twenty-two jellyfish specimens with the reference curves, the tested specimens were assigned into species. In addition, HRM results of all jellyfish specimens tested in this study were similar to those of morphological based identification by experts. This is the first attempt of using HRM analysis to determine species of jellyfish collected from Thai waters.
There are almost 200 known species of jellyfish worldwide. Most Cnidarian envenomations result in mild signs and symptoms but envenomation by some species can be life-threatening. The possibility of encountering of the deadliest jellyfish is sometime difficult to avoid as some of them are translucent and very small. Some of the most dangerous are box jellyfish, named for their cuboidal or box-like bell shape. Box jellyfish are grouped into two orders, the Carybdeida and Chirodropida, based largely on their morphology. As of 2022, at least 61 species of box jellyfish were described (WoRMS; Collins and Jarms, 2022). Depending on species, some are as small as a thumbnail whilst some can reach 20 cm wide along each box side and have tentacles up to 3 m in length. Most types that are lethal to humans live in the Indo-Pacific region and northern Australia. While most documented lethal stings occur in these regions, abundances of medically relevant cubozoans including chirodropids along the African and South American coastlines are not well documented but appears to be very high in certain locations. Jellyfish species are usually localized within a restricted geographical area or habitat, although some of them were found distribute worldwide (Kingsford and Mooney, 2014). Nevertheless, taxonomic issues in some of carybdeids should not be overlooked. For example, Carybdea marsupialis found in tropical and subtropical regions and in the South African seas were later confirmed by genetic and morphological studies as C. xaymacana and C. branchi, respectively. Thus, this led to the suggestion that the C. marsupialis could have a restricted distribution only in the Mediterranean Sea as it is the only box jellyfish that has been reported there (Boero and Minelli, 1986; Bettoso, 2002; Acevedo et al., 2019). Several box jellyfish species have been documented in Thailand. Both qualitative and quantitative data on the spatial and temporal distribution of box jellyfish in Thai oceans mainly from survey attempts of Department of Marine and Coastal Resources (DMCR). There are five families of box jellyfish and other two venomous jellyfish found in Andaman Sea and Gulf of Thailand (Table 1).
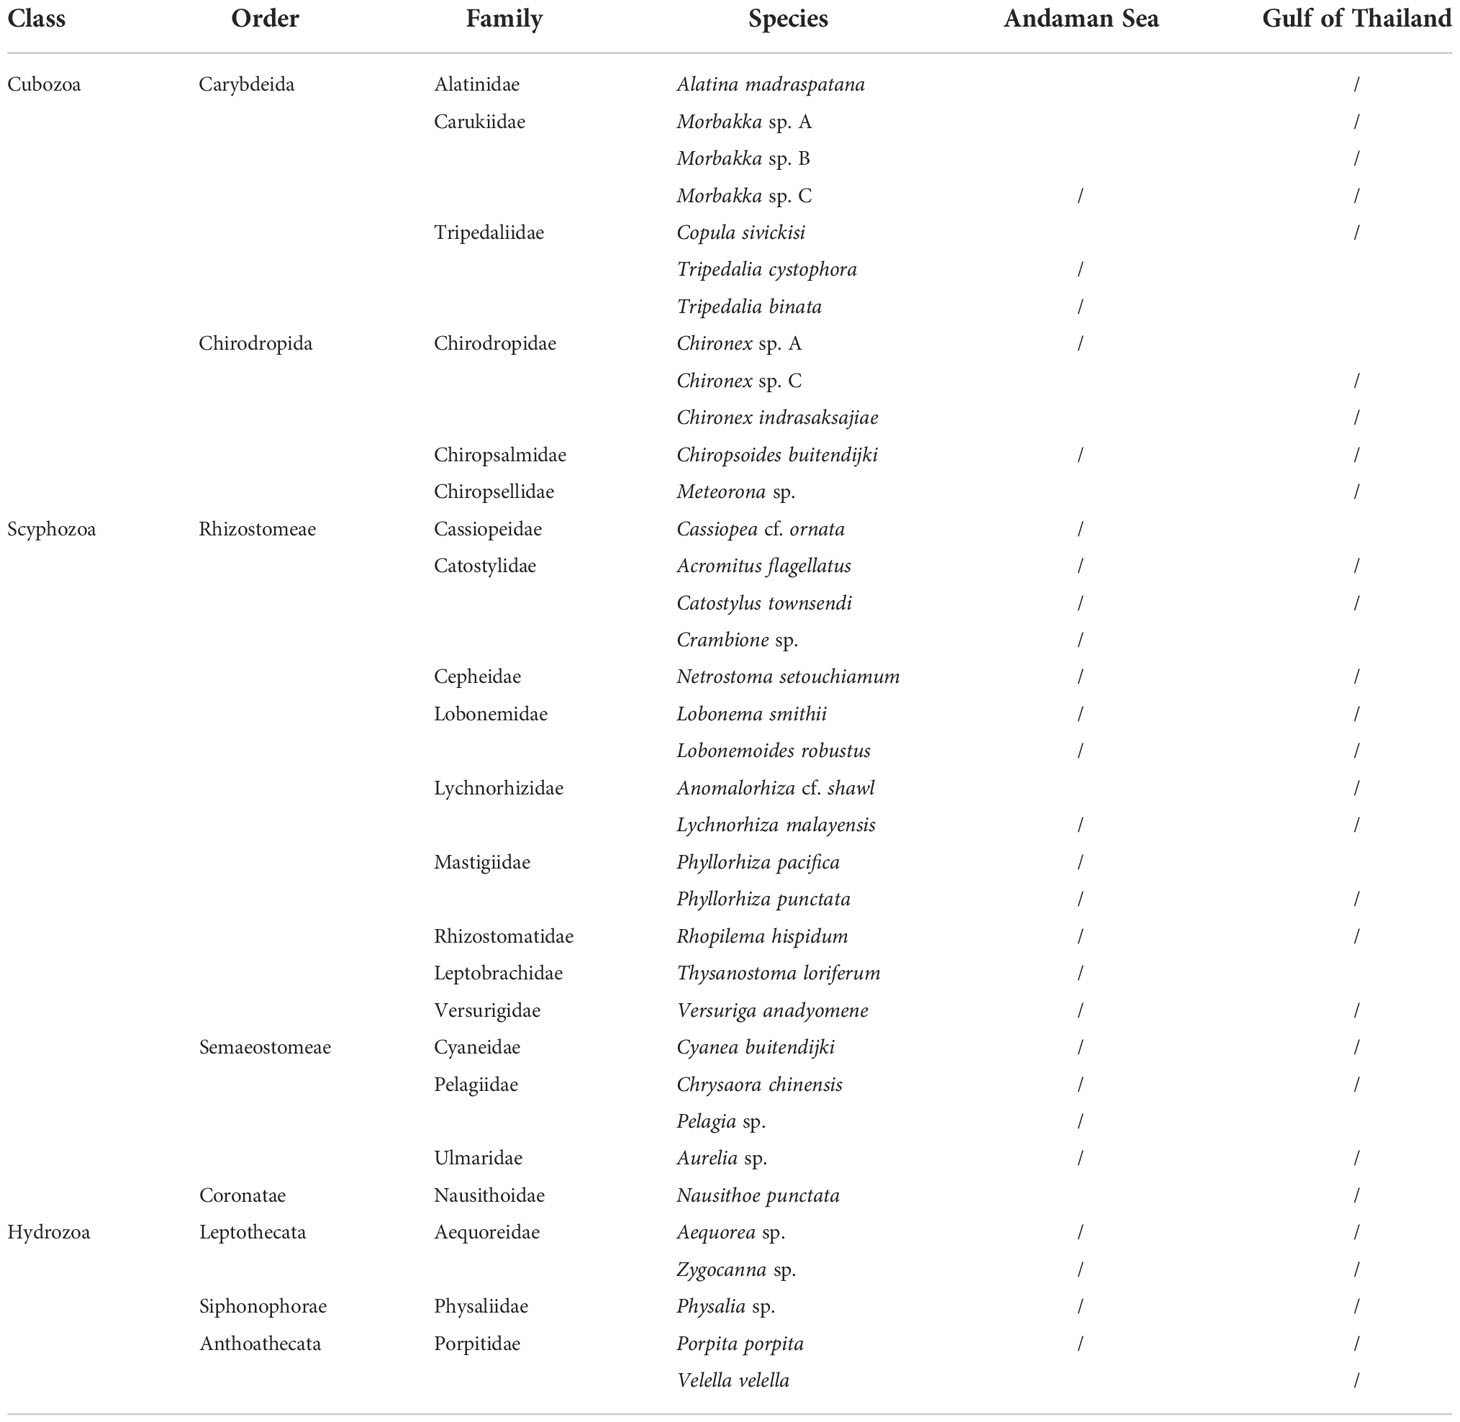
Table 1 List of venomous jellyfish found in Andaman Sea and Gulf of Thailand (data from Department of Marine and Coastal Resources).
Accurate species identification is critical for venomous jellyfish studies particularly in the evaluation of their distribution. Knowledge of their distribution or presence is important not only for understanding population dynamics but also for predicting risk to locals and tourists. Hazardous jellyfish species have been determined using methods such as comparative morphology and chemistry, which are not useful in cases. Recently, species-specific polymerase chain reaction was developed to aid species identification of a particular group of box jellyfish (Chironex) in Thailand.
Recent literature reports applying high resolution melting (HRM) in species identification or authentication. These studies showed the potential of HRM effectively distinguish plants (e.g., Osathanunkul et al., 2015; Osathanunkul et al., 2016; Song et al., 2016) animals (e.g., Everman and Wang, 2019; Baudrin et al., 2020; Chen et al., 2021), and bacteria (e.g., Miller et al., 2015; Pakbin et al., 2022). HRM analysis characterizes nucleic acid samples based on their disassociation behavior and detects sequence differences in PCR-amplified sequences. Samples are discriminated based on their composition, length, and guanine-cytosine (GC) content (Wittwer et al., 2003). An obvious advantage of HRM is that the analysis is performed immediately after the amplification. Thus, post-PCR procedures such as DNA sequencing (which it is not a cost-effective method for developing countries) were not required. However, no studies have focused on designing and developing HRM assays to distinguish jellyfish species from each other. In this study, we developed an HRM method to differentiate jellyfish species in five box jellyfish families (Carukiidae, Chirodropidae, Chiropsalmidae, Chiropsellidae, and Tripedaliidae) and Physaliidae found in Thai waters.
Sequences of 16S rRNA gene used for further analyses (nucleotide variation and content and simulation HRM) were retrieved from a public database, GenBank (https://www.ncbi.nlm.nih.gov/genbank/). Details of the sequences are shown in Table 2.
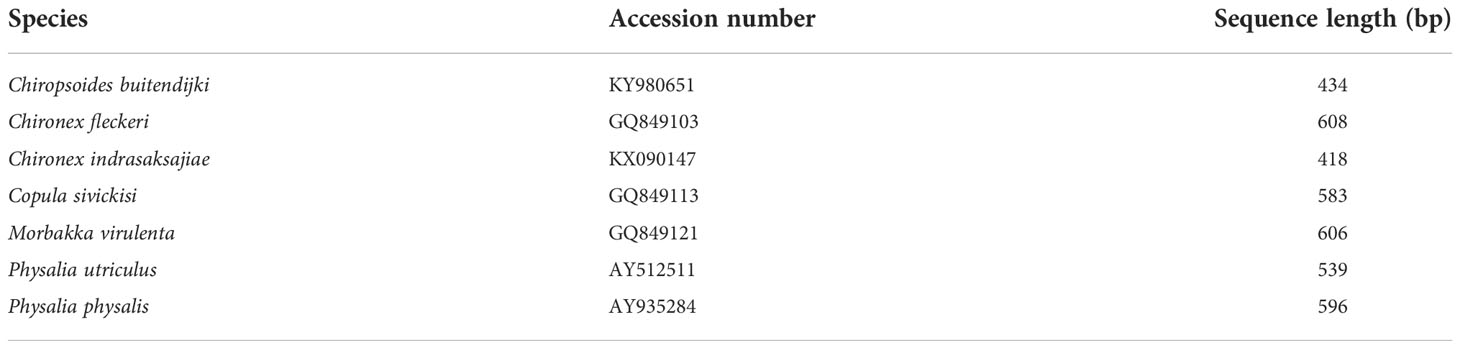
Table 2 Details of the 16S rRNA sequences used in this study.
DNA samples of jellyfish used for this study were taken from Sathirapongsasuti et al. (2021), listed in Table 3.
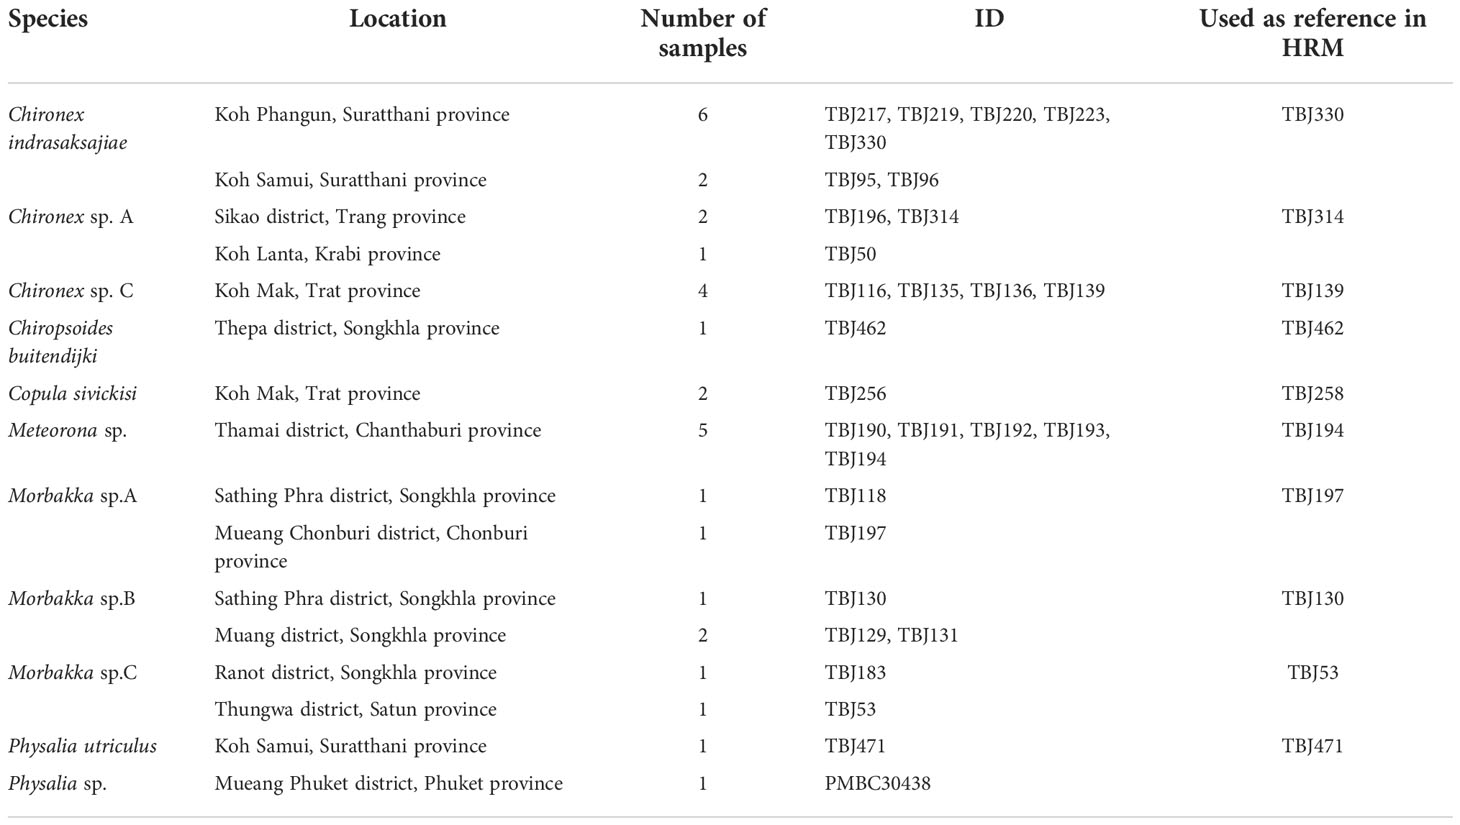
Table 3 Jellyfish samples included in the analyses.
All 16S rRNA sequences retrieved from GenBank were trimmed to have the same length, 235 base pairs (bp). The trimmed fragments were then uploaded into an uMELT Quartz online tool version 3.6.2 (https://www.dna-utah.org/umelt/quartz/um.php).
HRM analysis was carried out according to previous studies (Osathanunkul et al., 2015). The DNA was amplified using the Rotor-Gene Q 5plex HRM system (Qiagen, Hilden, Germany). The reaction mixture consisted of a total volume of 20 µL, containing 4 µL of Evagreen HRM Master Mix, 0.5 µL of 10 mM forward primer, 0.5 µL of 10 mM reverse primer, 2 µL of 15 ng/µL DNA, and 13 µL of ddH2O. Thermal cycling conditions were as follows: an initial denaturing step at 95°C for 5 min, followed by 40 cycles of 95°C for 30 s, 57°C for 30 s and 72°C for 20 s. Sequences of 16S rRNA primer pair used in this experiment are 5’- CGA GAA GAC CCT ATG GAG CTT -3’for forward primer and 5’- AAT GGA TTG CGC TGT TAT CCC -3’ for reverse primer. Melting curves were generated after the last extension step at a temperature range of 65 to 95°C, rising by 0.1°C every 2s. The fluorescence acquisition setting was followed as recommended by the manufacturer. The melting profiles were normalized by adjusting before and after the major fluorescence decrease, respectively. The melting data of the samples were recorded and analyzed using Rotor-gene Q series software v.2.3.1. To examine the reliability of the method (consistency of melting curve of each sample), the HRM tests were conducted three times with three replicates of each sample, using the same conditions, reagent, and DNA templates. To identify species of the 22 tested samples, normalized melting plot of reference samples including Chironex sp. A (Chironex sp. C, Chironex indrasaksajiae, Chiropsoides buitendijki, Copula sivickisi, Meteorona sp., Morbakka sp. A, Morbakka sp. B, Morbakka sp. C, and Physalia utriculus were generated and then used to compare with the curves of tested samples. A percentage of confidence interval (CI) of ≥ 90% was used to determine whether the melting plot of sample was showing similarity with the reference’s curve. HRM analyses were carried out in triplicates.
DNA sequences of 16S rRNA gene obtained from GenBank were aligned and calculated for nucleotide variations and nucleotide content, results shown in Table 4. The final alignment of jellyfish 16S sequences contained 235 sites; of the 175 variable characters, 112 were parsimony informative. Nucleotide variation found among all seven tested jellyfish species was as high as 74.5%. Whereas variation sites of analyzed fragments of the two Chironex species was 47.2% and of the two Physalia species was 6.8%. GC content of all analyzed DNA sequences ranges from 30.1% - 41.3%.
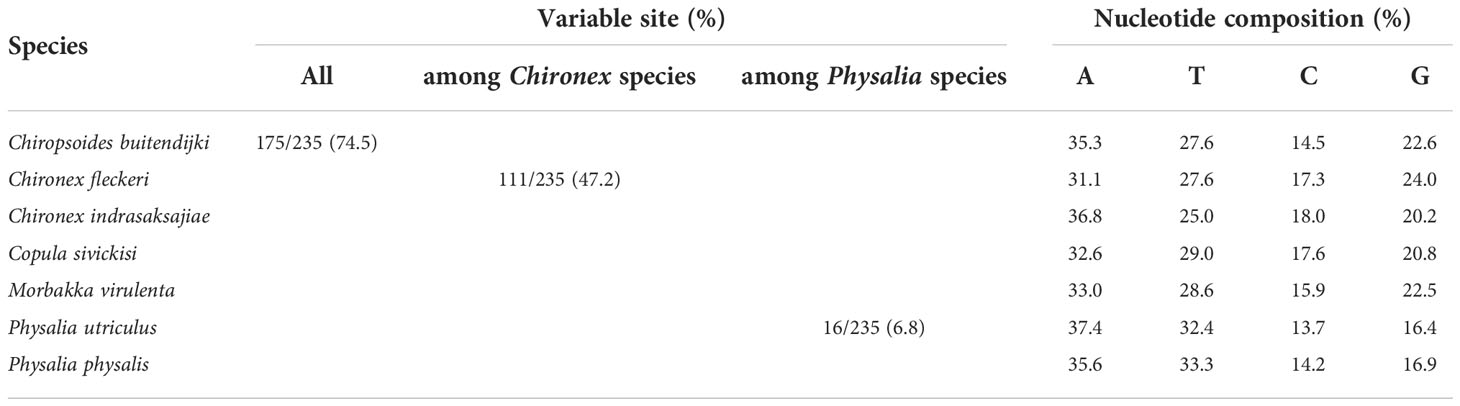
Table 4 showing nucleotide variations and content of seven venomous jellyfish species.
Prior performing in vitro HRM, uMELT Quartz was used to predict the normalized melting plot of each tested jellyfish species. The 16S rRNA DNA fragments of all studied species were uploaded into the program and a result showing in Figure 1. Overall, melting curves can be used to distinguish the seven tested species. Although, melting curves of the two Physalia were found to be nearly identical (at temperature >83°C), the melting curves of them were clearly separated at temperature around 75-83°C. Therefore, the 16S rRNA region showed a great potential in differentiating the tested jellyfish species.
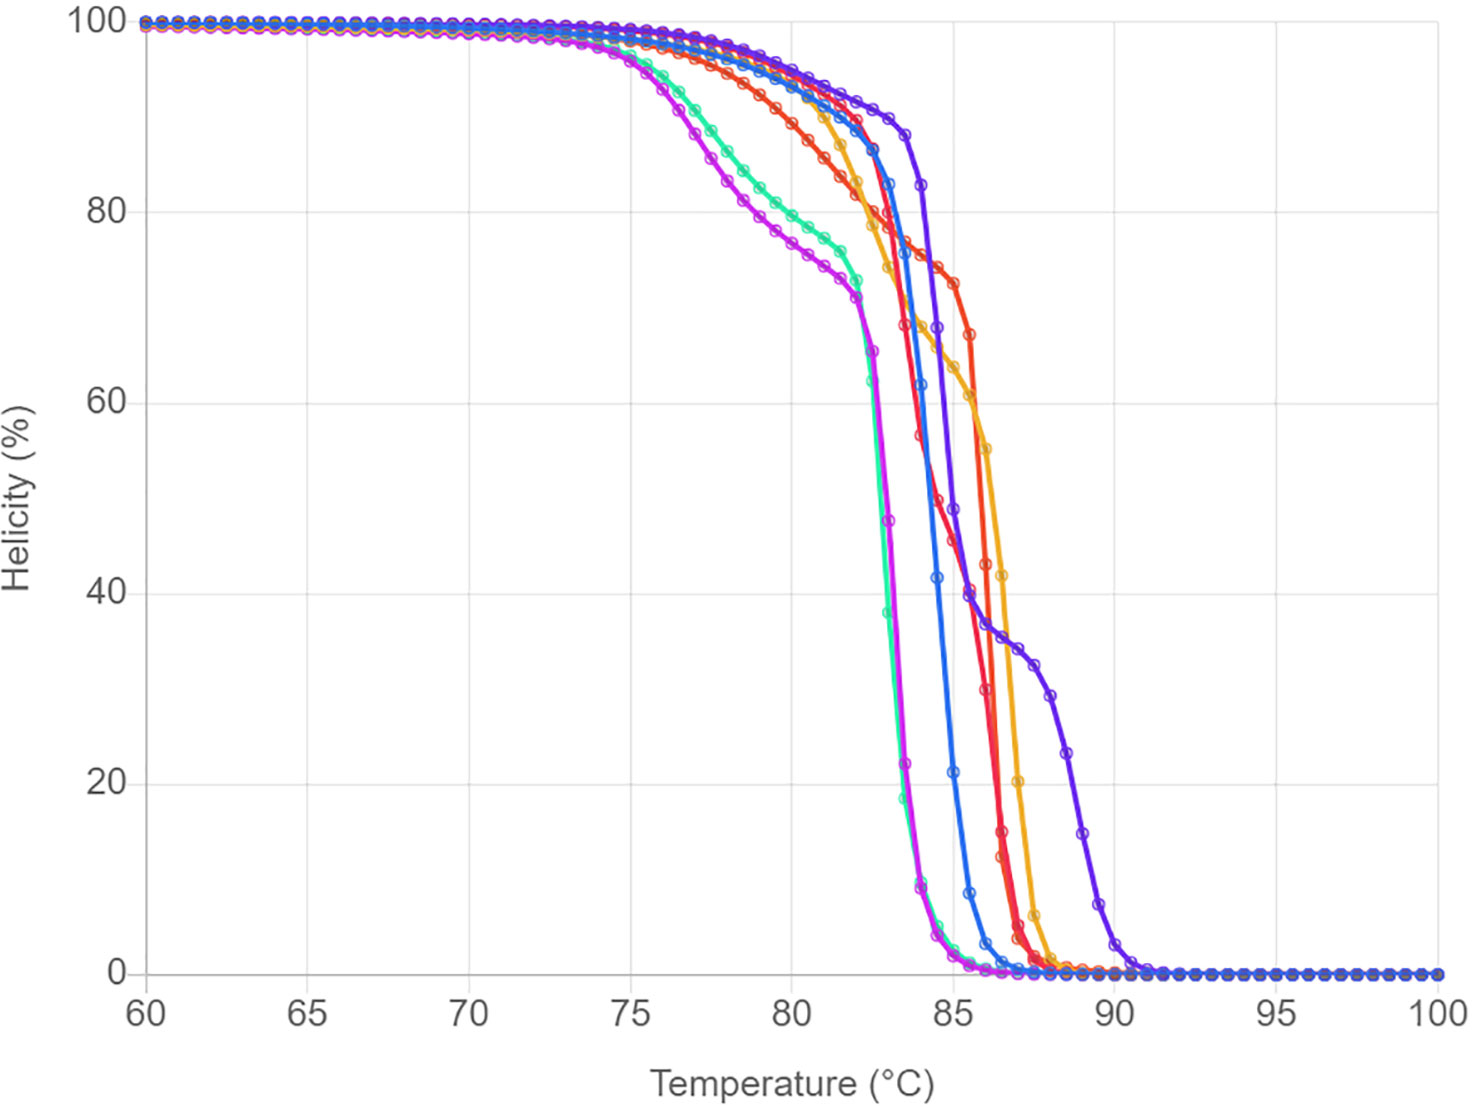
Figure 1 HRM profiles of seven jellyfish species analyzed with the uMELT Quartz. The curves showing in normalized melting plot.
In vitro HRM was then carried out, first to test a reliability of the technique. Each sample was used in the analysis in triplicate expecting that each replicate would generate the same melting curve. The HRM profiles of each sample were shown in Figures 2A–D. Whilst, all three replicates of each sample produced similar melting curves, each species has distinctive melting curve. Thus, the ten tested jellyfish species in six families could be distinguished using the HRM. Melting curves of all tested species in genus Chironex, Chiropsoides, Copula, Meteorona, Morbakka, and Physalia were clearly separated. Although melting curves’ shape of Chironex sp. A, Chironex sp. C, and Chironex indrasaksajiae were found to be overlap at temperature around 83-85°C, the curves at 80-83°C were totally different (Figure 3).
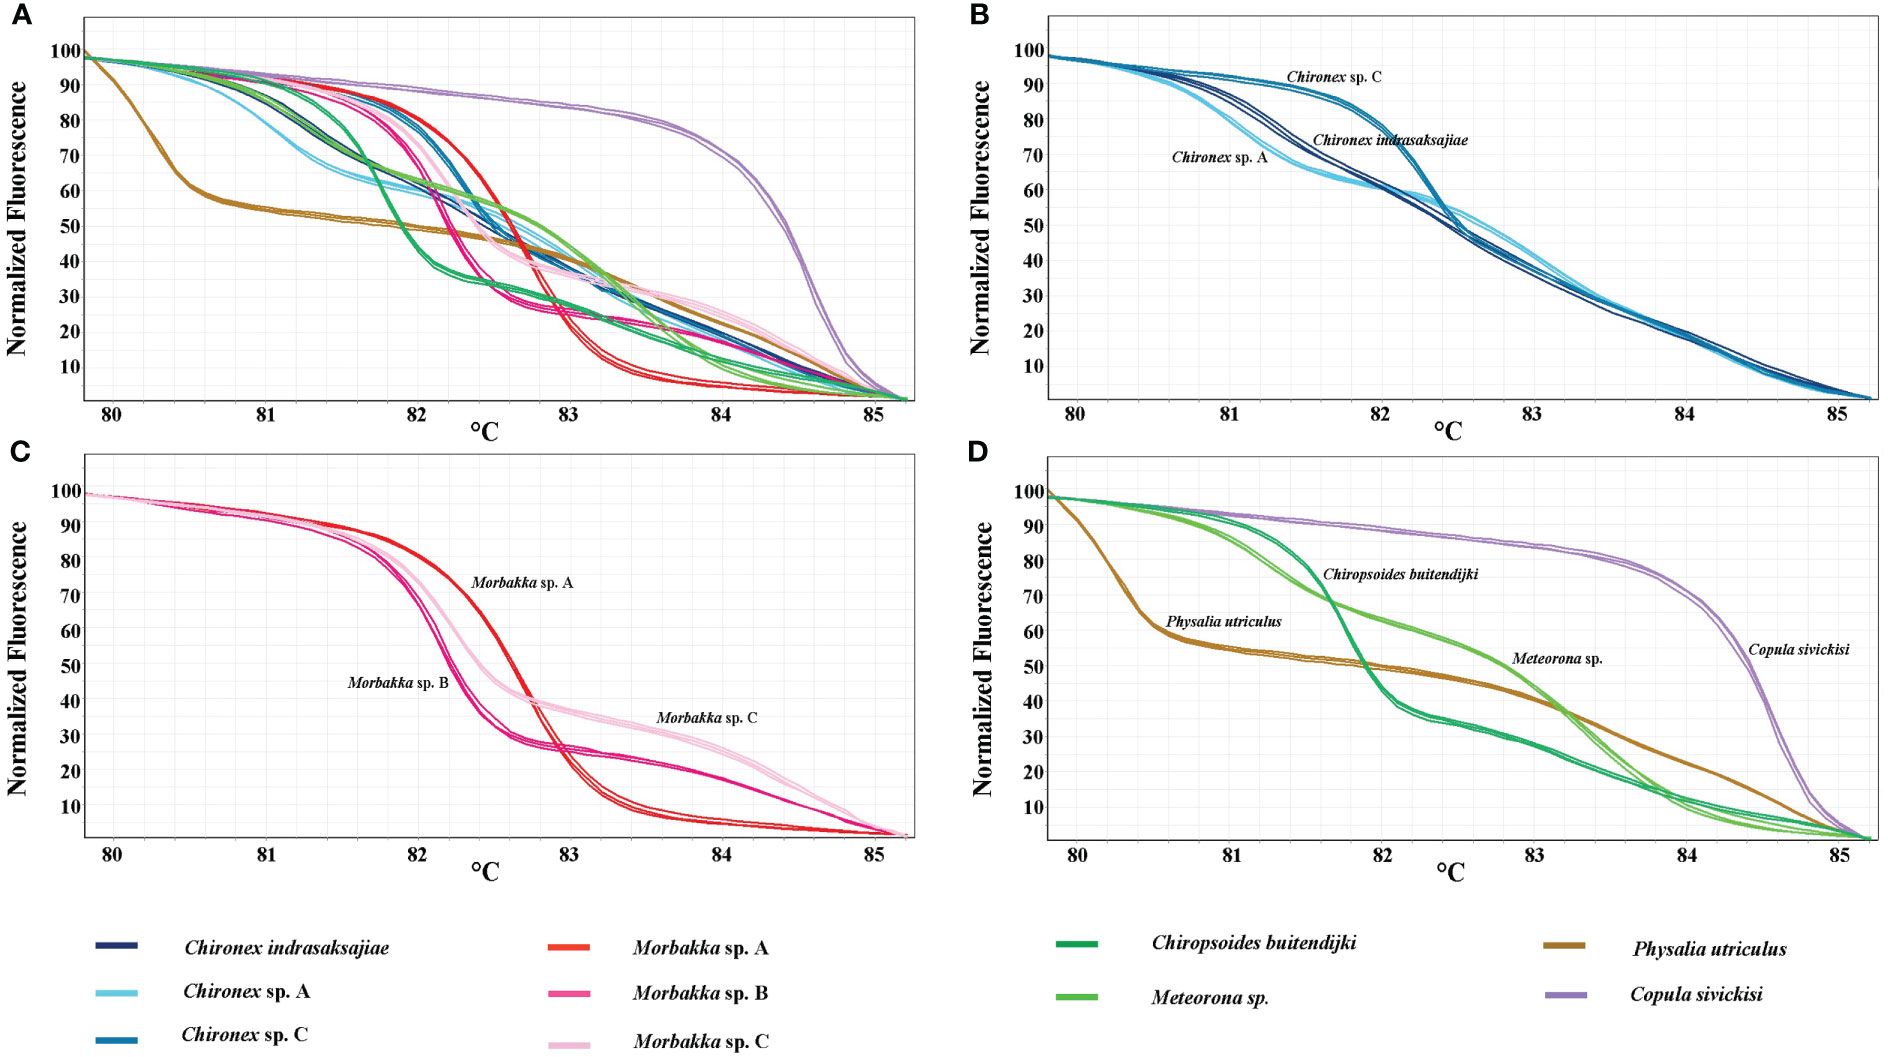
Figure 2 Normalized melting curves of tested jellyfish species. (A) all ten species, (B) Chironex species, (C) Morbakka species, and (D) Chiropsoides, Copula, Meteorona, and Physalia species.
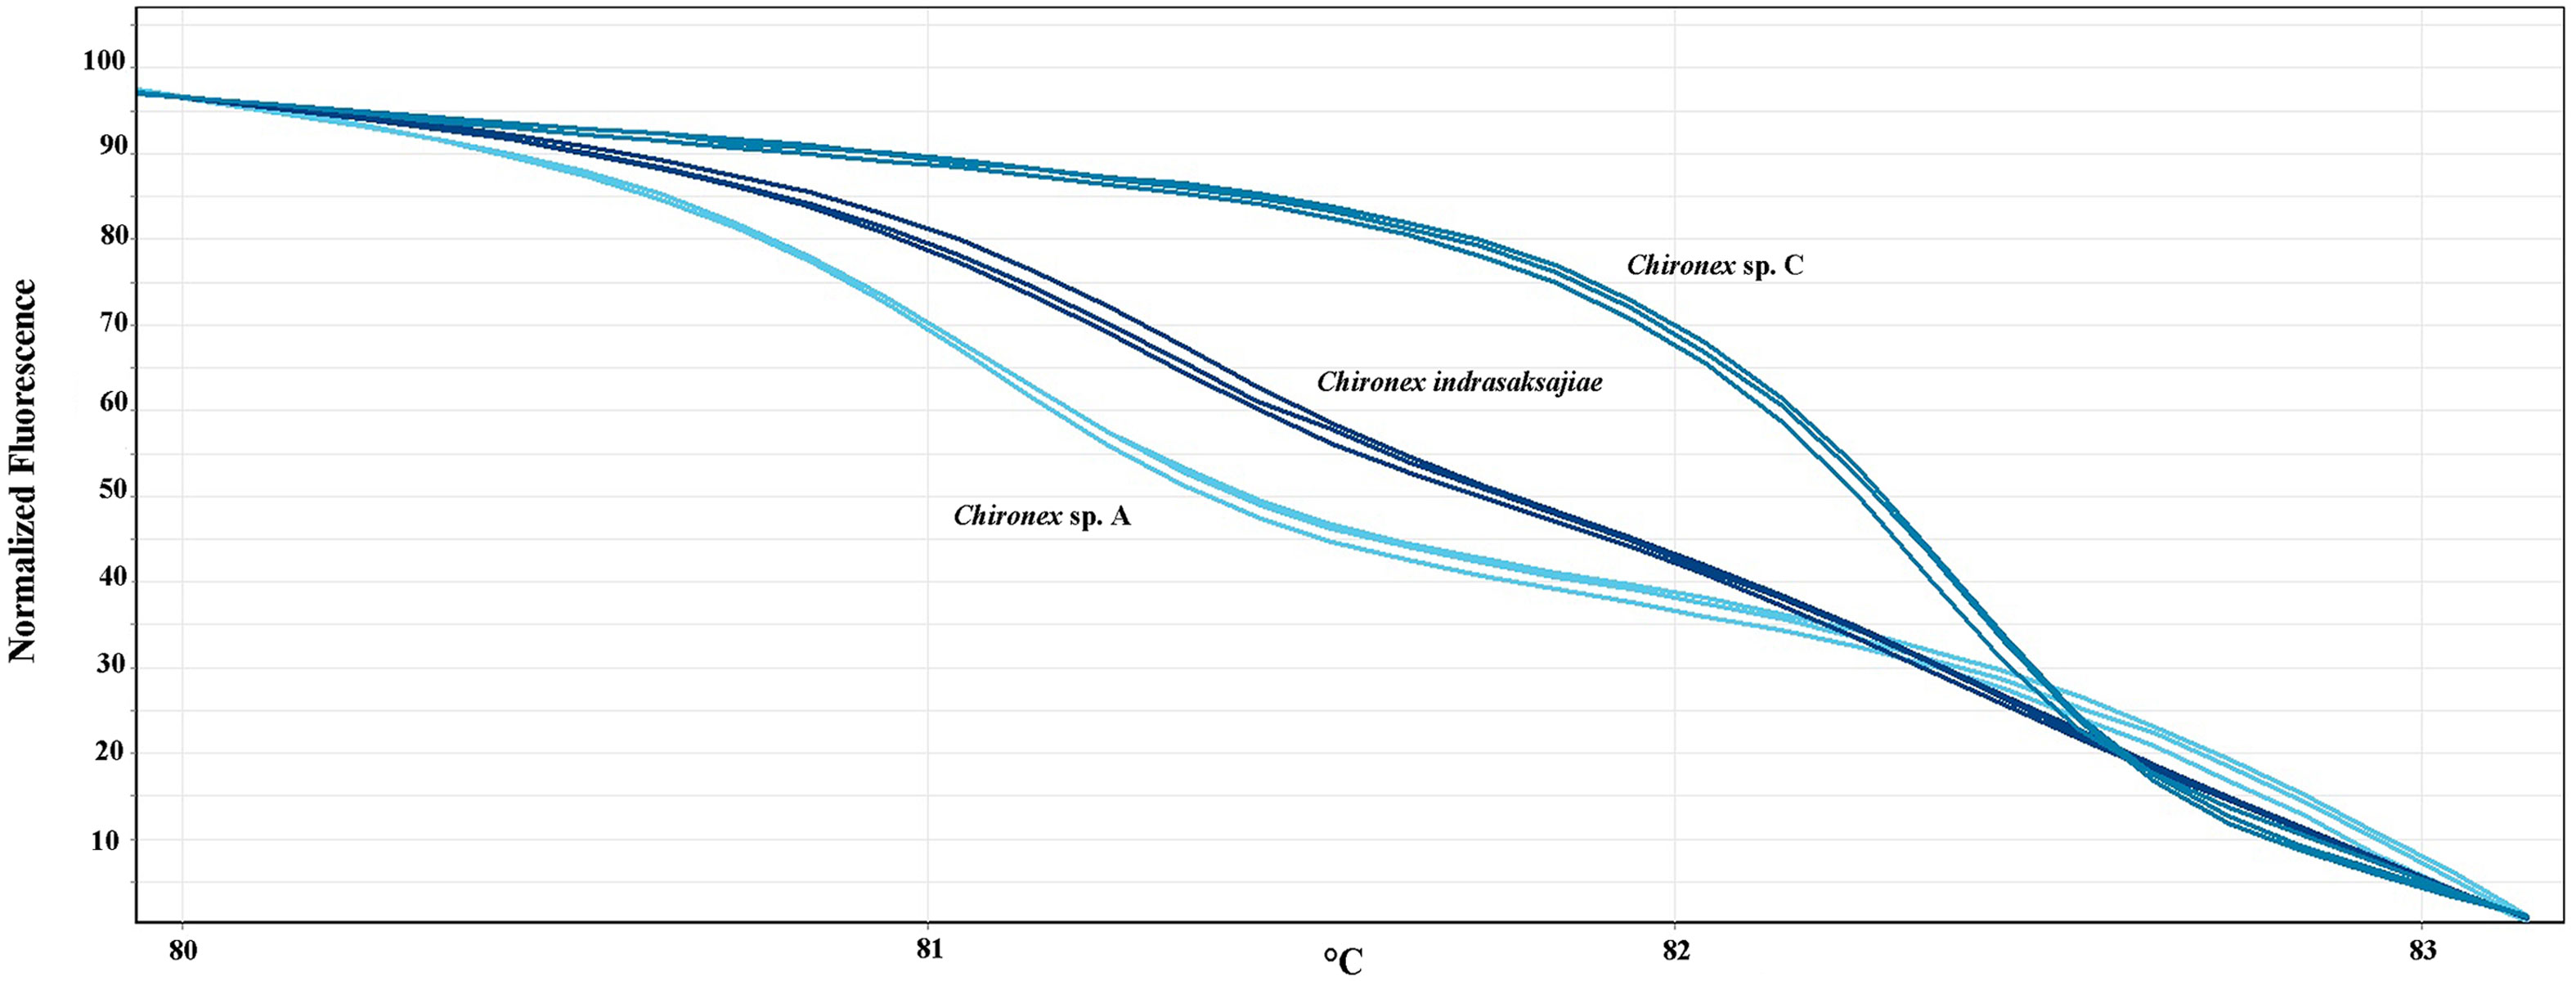
Figure 3 Normalized melting curves of three chironex species showing at temperatures 80-83°C.
All available samples were then analyzed to determine their species (Chironex samples; n=12, Copula sample; n=1, Meteorona samples; n=4, Morbakka samples; n=4, and Physalia sample; n=1), results shown in Figures 4A–E and Table 5. Based on the generating melting curves, from 12 Chironex samples, two were found to be Chironex sp. A, three were Chironex sp. C, and seven were Chironex indrasaksajiae (Figure 4A). The melting curve of one Morbakka sample was found to be similar to the Morbakka sp. A, two of them were comparable to the Morbakka sp. B, and the remaining sharing a same melting curve with the Morbakka sp. C (Figure 4B). The Copula sample’s melting curve was identical to the curve of Copula sivickisi (Figure 4C). All four Meteorona samples produced the same melting curves as the Meteorona sp. (Figure 4D). In addition, the only Physalia sample tested here was confirmed to have a different melting curve from the Physalia utriculus (Figure 4E).
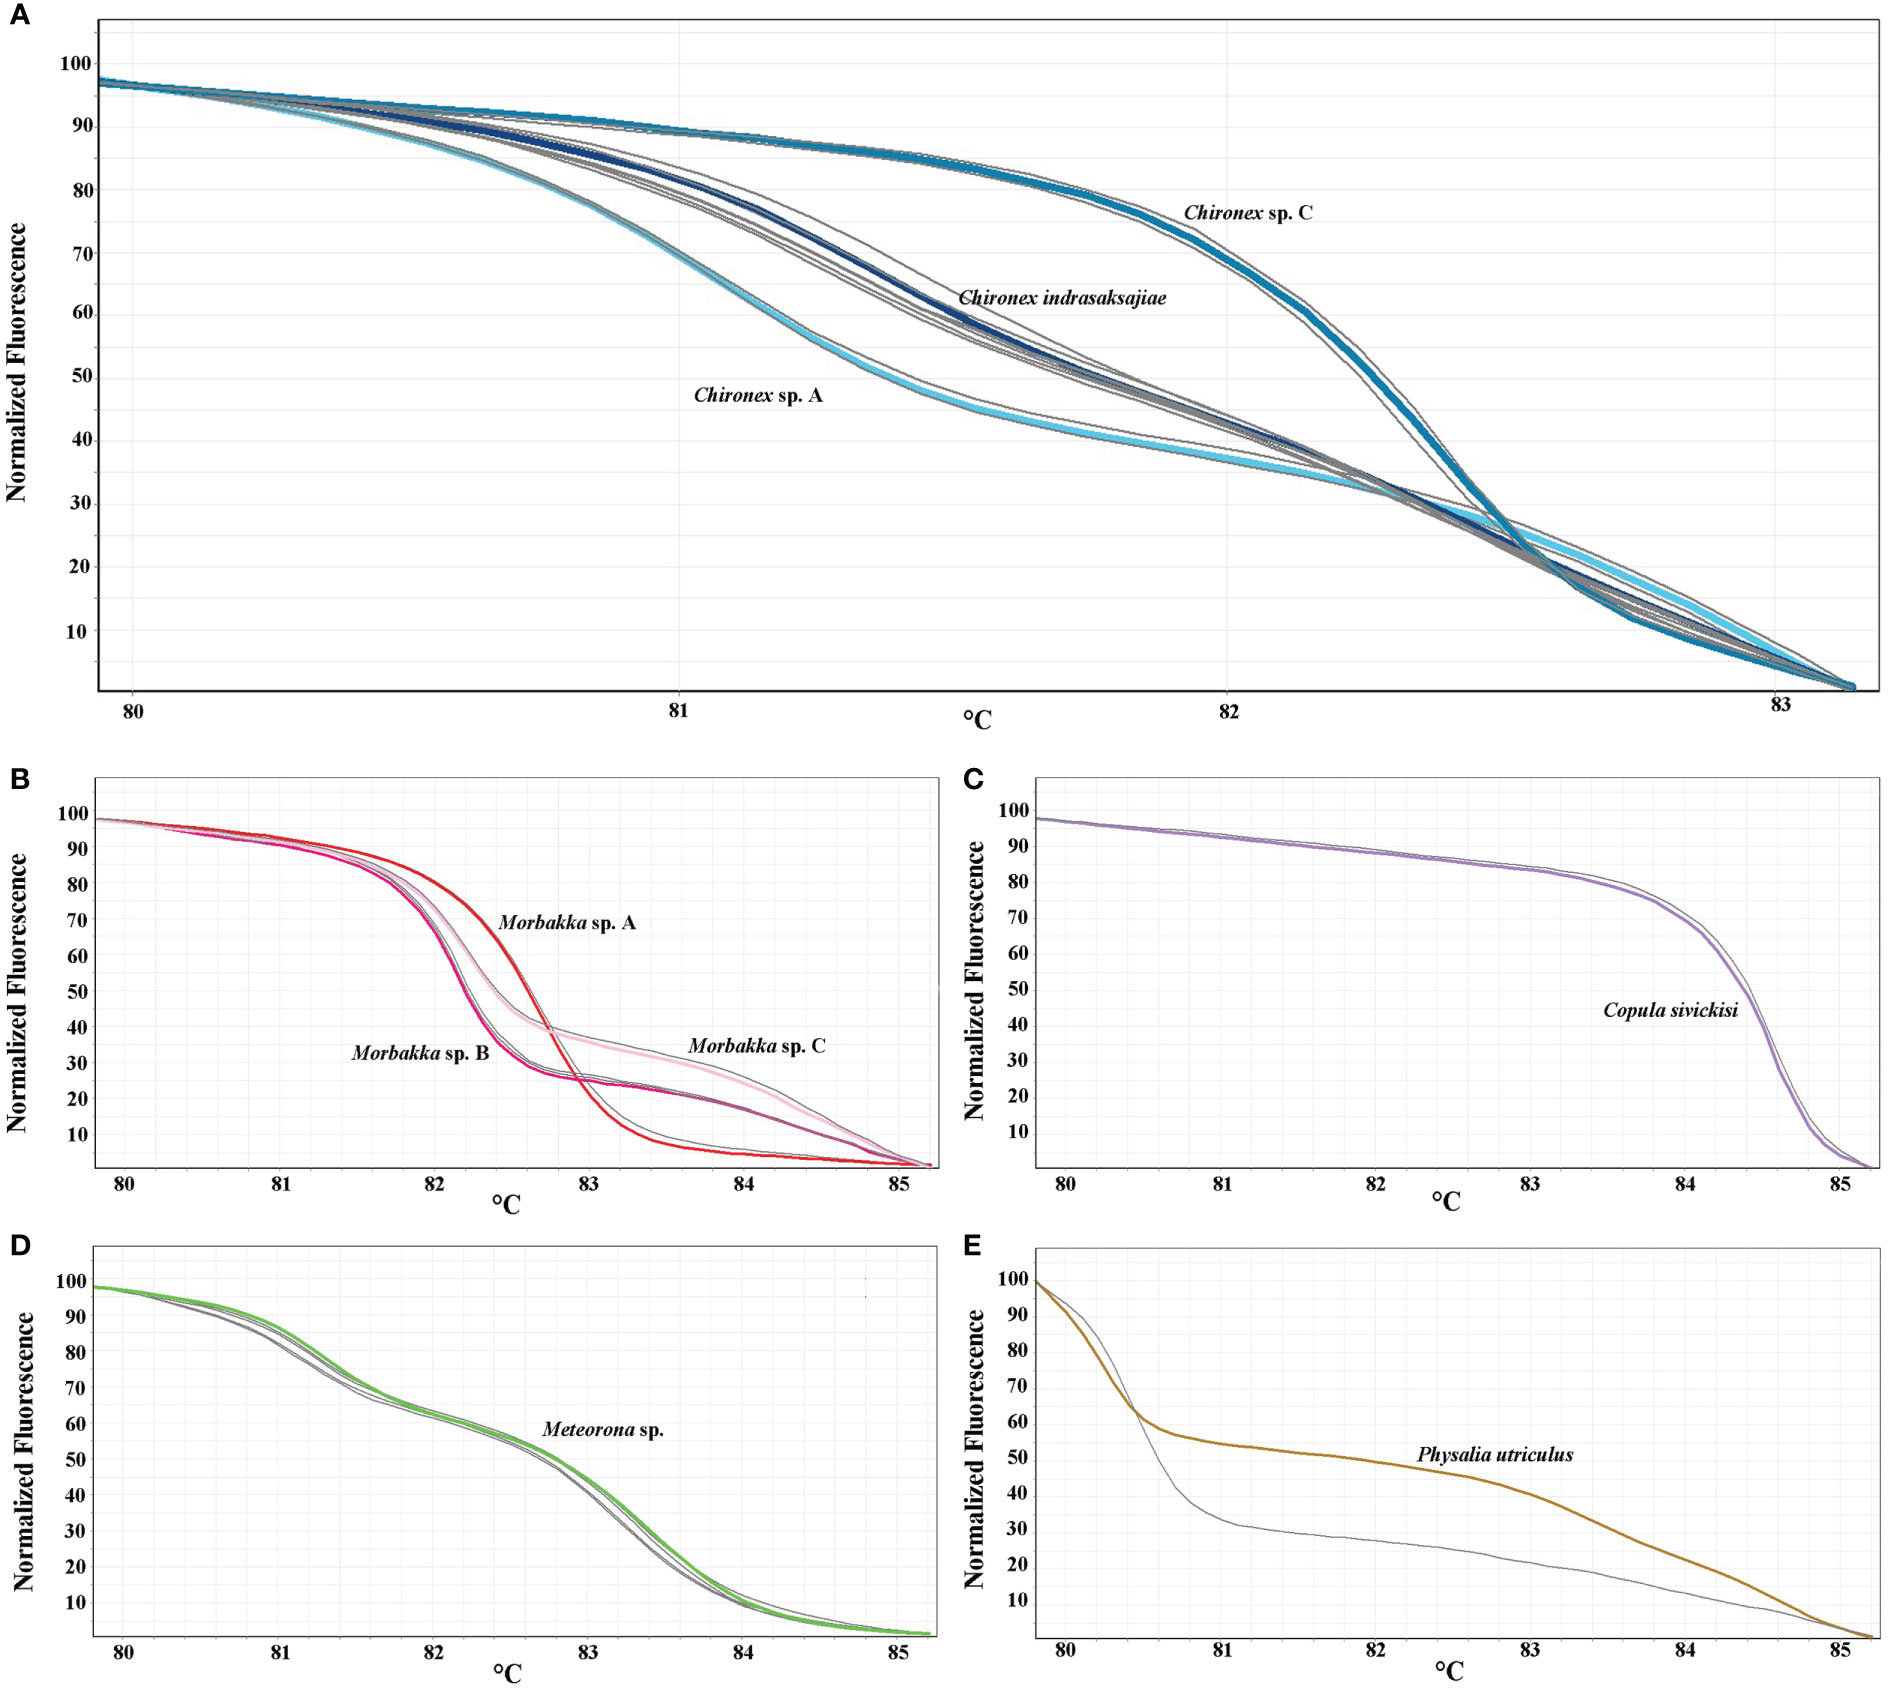
Figure 4 HRM profiles of 22 analyzed jellyfish samples (gray color) with the 16S rRNA primers. HRM curves showing in normalized melting plot. (A) Chironex samples (n=12), (B) Copula sample (n=1), (C) Meteorona samples (n=4), (D) Morbakka samples (n=4), (E) Physalia sample (n=1).
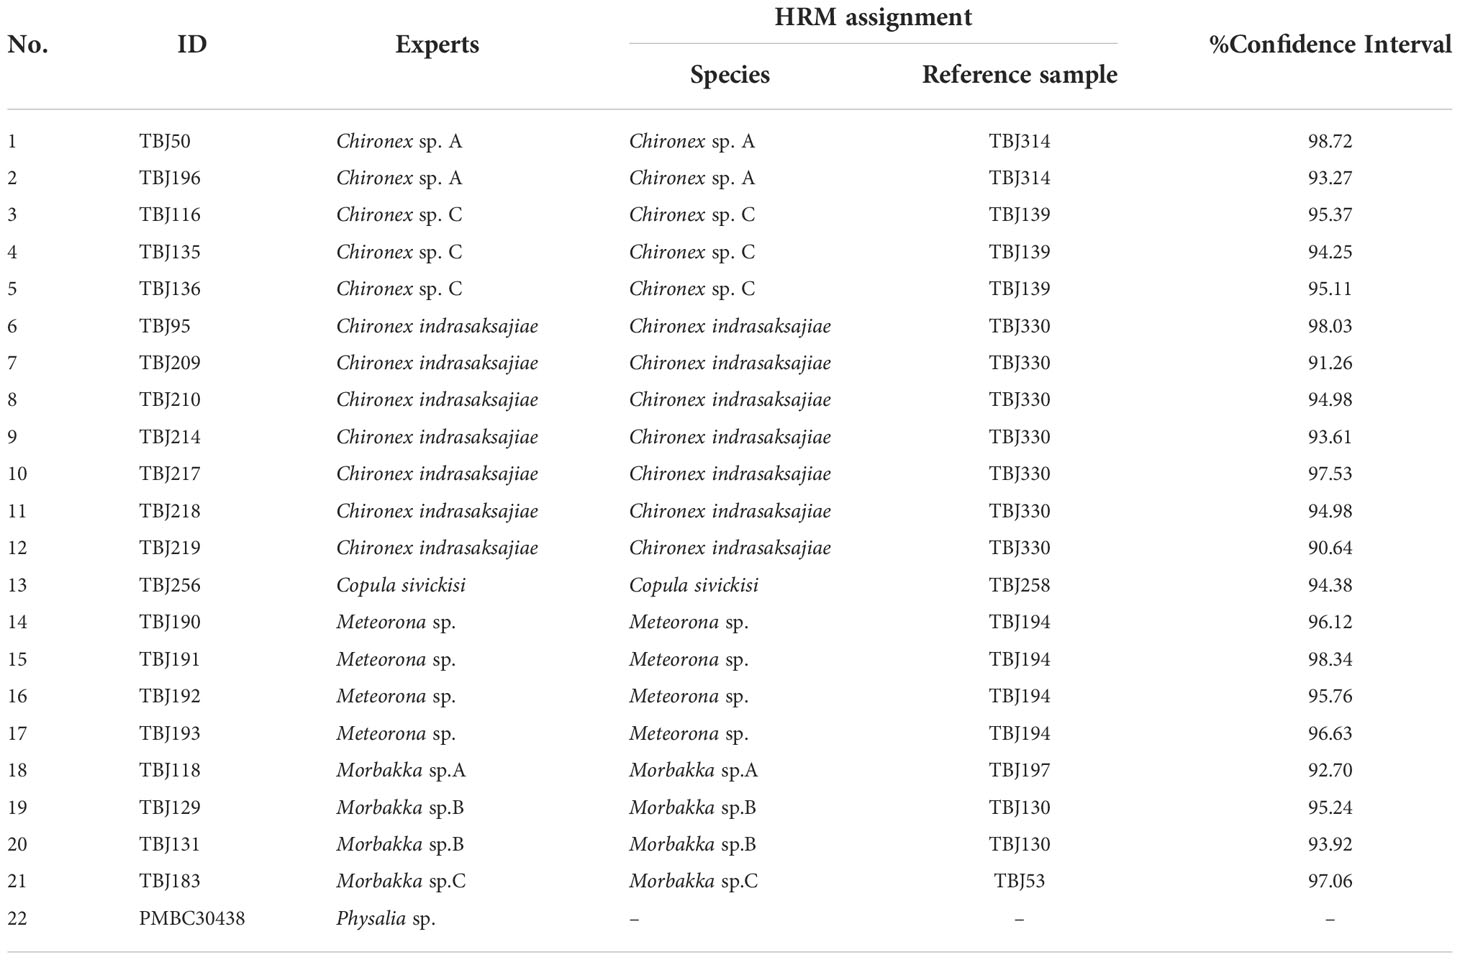
Table 5 Species determination via HRM.
Any identification at the species level using morphological characteristics for certain jellyfish species alone can be challenging. Two Cyanea species (C. capillata and C. lamarckii) can be differentiated mainly when they are in adult stage by (1) counting their tentacles and muscle folds on the umbrella underside or (2) comparing the structure of the medusa bell surface (Russell, 1970). However, the number of tentacles or muscle folds can be difficult to count and time consuming, so it is a potentially inaccurate method of species identification. In addition, muscle folds are only present in adult medusae (Holst, 2012), particularly in individual with medusae as large as ∼30 mm in diameter for C. capillata (Russell, 1970). Therefore, it is hard to identify these jellyfish when they are in stages other than medusa phase. Also, Bentlage et al., 2010 claimed that Carybdea marsupialis could have been misidentified. Specimens of C. marsupialis included in several works (e.g., Collins, 2002; Stangl et al., 2002; Fischer and Hofmann, 2004; Straehler-Pohl and Jarms, 2005; Collins et al., 2006) are derived from a polyp culture originally collected from Puerto Rico. Bentlage et al., 2010 stated that polyp stock of C. marsupialis should be a close relative species, Alatina spp. which is commonly found in Puerto Rico. Thus, identification of polyps is also necessary. Moreover, taxonomic uncertainties and misidentification may impede venom studies. Some box jellyfish are extremely venomous, and envenoming can cause death within minutes after severe exposure, so that rapid and accurate species identification would allow a right choice of treatments and precise risk management. Morphological species identification from adhered tentacle to the skin (wound) seems to be impossible therefore alternative identification approach such as a molecular-based method is needed.
There are 36 species in 22 families of jellyfish found in Thai waters (Andaman Sea and Gulf of Thailand) as stated in Table 1 (with 12 venomous species). However, not all species have DNA sequences deposited in the public database (GenBank). Commonly used DNA region for species identification in animals was cytochrome oxidase I gene (COI), however it is not a prominent marker for jellyfish. Instead, 16S rRNA showed a great potential for jellyfish identification so that previous studies aimed to use the gene (Sathirapongsasuti et al., 2021). Apart from COI and 16S rRNA, 18S and 28S rRNA are other DNA regions used for jellyfish studies (Bentlage et al., 2010). Lack of available DNA sequences can hamper development of molecular species identification method. However, the HRM developed here is a sequencing free method so even when there were no sequences the method works by predicting and analyzing sequences of closely related species and project the success of the method.
To evaluate success potential of HRM analysis in discriminating the tested and closely related jellyfish species, available DNA sequences in the GenBank were retrieved and used in analyses. Amplified fragment length, nucleotide variation and GC content are important and keys to success of HRM analysis. Basically, the amplicons should be shorter than 300 bp (235 bp in this study) as longer fragment tends to produce less difference in melting curve between samples as a result from small nucleotide variation (Rezaei et al., 2017). Sequence variations among the tested and closely related species was as high as 74.5% which was a good indicator for a success in HRM analysis. Although, the nucleotide variations in Physalia species were found to be as low as 6.8%, a simulation HRM still could be used to differentiate between the two Physalia species. As not only the variation of the sequences could influence DNA duplex stability but also nucleotide composition. The nearest-neighbor (NN) model showing that the stability of DNA depends on type and orientation of neighboring base pairs (Turner and Mathews, 2010). Thus, the NN effect has been considered in DNA melting analysis works and also simulation HRM tools used to predict melting curves for DNA duplexes of interest including the uMELT Quartz (Dwight et al., 2011).
Several HRM studies have shown that the prediction program was good enough to indicate whether the in vitro HRM of the interested samples will be successful (Osathanunkul et al., 2015; Osathanunkul et al., 2016; Osathanunkul and Madesis, 2021). This was also the same here as the uMELT Quartz showed that melting curves of all tested and closely related jellyfish species were not identical and clearly separated. The results of the in vitro HRM were comparable to that from the prediction. The HRM was proved to be a quick and reliable species identification/discrimination in other animal groups such as vertebrate (Ouso et al., 2020), invertebrate (Baudrin et al., 2020), and fish (Chen et al., 2021). However, this is the first attempt of using HRM analysis to determine the species jellyfish samples collected from Thai waters. Samples used for HRM can be just a small tissue and the method is sequencing free. Therefore, the HRM was found to be useful when morphological based identification is difficult as well as when there were no available sequences of the interested species for DNA identification.
This study describes, for the first time, a rapid and accurate method to differentiate jellyfish species in five box jellyfish families (Carukiidae, Chirodropidae, Chiropsalmidae, Chiropsellidae, and Tripedaliidae) and Physaliidae found in Thai waters, by HRM. The developed method was useful to identify jellyfish samples without sequencing.
The original contributions presented in the study are included in the article/supplementary material. Further inquiries can be directed to the corresponding author.
Conceptualization, MO. Formal analysis, MO and CS. Funding acquisition, MO. Investigation, MO and CS. Methodology, MO and NiS. Project administration, MO. Resources, NuS, TP, UD, and CA. Visualization, MO and NiS. Writing–original draft, MO. Writing–review & editing, MO. All authors have read and agreed to the published version of the manuscript.
This project is funded by National Research Council of Thailand (NRCT) and Chiang Mai University, grant number N42A650302.
We are thankful to colleagues and students, for every little help from them. We would like to thank Dr Lauren R. Clark for English editing.
The authors declare that the research was conducted in the absence of any commercial or financial relationships that could be construed as a potential conflict of interest.
All claims expressed in this article are solely those of the authors and do not necessarily represent those of their affiliated organizations, or those of the publisher, the editors and the reviewers. Any product that may be evaluated in this article, or claim that may be made by its manufacturer, is not guaranteed or endorsed by the publisher.
Acevedo M. J., Straehler-Pohl I., Morandini A. C., Stampar S. N., Bentlage B., Matsumoto G. I., et al. (2019). Revision of the genus Carybdea (Cnidaria: Cubozoa: Carybdeidae): Clarifying the identity of its type species Carybdea marsupialis. Zootaxa 4543 (4), 515–548. doi: 10.11646/zootaxa.4543.4.3
Baudrin G., Roy V., Gigon A., Dupont L. (2020). Bar-HRM for identification of cryptic earthworm species. Pedobiologia 80, 150634. doi: 10.1016/j.pedobi.2020.150634
Bentlage B., Cartwright P., Yanagihara A. A., Lewis C., Richards G. S., Collins A. G. (2010). Evolution of box jellyfish (Cnidaria: Cubozoa), a group of highly toxic invertebrates. Proc. R. Soc. B: Biol. Sci. 277 (1680), 493–501. doi: 10.1098/rspb.2009.1707
Bettoso N. (2002). First record of Carybdea marsupialis (L. 1758) (Cnidaria, cubozoa) in the gulf of Trieste. Period. biol. 104 (2), 233–233. doi: 10.1080/11250003.2015.1045945
Boero F., Minelli A. (1986). First record of Carybdea marsupialis (L. 1758) (Cnidaria, cubozoa) from the Adriatic Sea. Bollettino del Museo civico di Storia naturale di Venezia 35, 179–180. doi: 10.1080/11250003.2015.1045945
Chen C., Ding Y., Wang Y., Jiang Q., Wang F., Lu C., et al. (2021). High-resolution melting analysis of COI sequences distinguishes pufferfish species (Takifugu spp.) in China. J. Agric. Food Chem. 69 (2), 794–804. doi: 10.1021/acs.jafc.0c06584
Collins A. G. (2002). Phylogeny of medusozoa and the evolution of cnidarian life cycles. J. Evol. Biol. 15 (3), 418–432. doi: 10.1046/j.1420-9101.2002.00403.x
Collins A. G., Jarms G. (2022) World list of cubozoa. cubomedusae. accessed through: World register of marine species. Available at: http://www.marinespecies.org (Accessed 25 July 2022).
Collins A. G., Schuchert P., Marques A. C., Jankowski T., Medina M., Schierwater B. (2006). Medusozoan phylogeny and character evolution clarified by new large and small subunit rDNA data and an assessment of the utility of phylogenetic mixture models. Syst. Biol. 55 (1), 97–115. doi: 10.1080/10635150500433615
Dwight Z., Palais R., Wittwer C. T. (2011). uMELT: prediction of high-resolution melting curves and dynamic melting profiles of PCR products in a rich web application. Bioinformatics 27 (7), 1019–1020. doi: 10.1093/bioinformatics/btr065
Everman S., Wang S. Y. (2019). Distinguishing anuran species by high-resolution melting analysis of the COI barcode (COI-HRM). Ecol. Evol. 9 (23), 13515–13520. doi: 10.1002/ece3.5808
Fischer A. B., Hofmann D. K. (2004). “Budding, bud morphogenesis, and regeneration in carybdea marsupialis linnaeus 1758 (Cnidaria: Cubozoa),” in Developments in hydrobiology–coelenterate biology 2003. Eds. Fautin D. G., Westfall J. A., Cartwright P., Daly M., Wyttenbach C. R. (Dordrecht, The Netherlands: Springer), 331–337.
Holst S. (2012). Morphology and development of benthic and pelagic life stages of north Sea jellyfish (Scyphozoa, cnidaria) with special emphasis on the identification of ephyra stages. Mar. Biol. 159 (12), 2707–2722. doi: 10.1007/s00227-012-2028-0
Kingsford M. J., Mooney C. J. (2014). “The ecology of box jellyfishes (Cubozoa),” in Jellyfish blooms. Eds. Pitt K., Lucas C. (Dordrecht: Springer). doi: 10.1007/978-94-007-7015-7_12
Miller M., Zorn J., Brielmeier M. (2015). High-resolution melting curve analysis for identification of pasteurellaceae species in experimental animal facilities. PloS One 10 (11), e0142560. doi: 10.1371/journal.pone.0142560
Osathanunkul M., Madesis P. (2021). The identification of several dipterocarpaceae and fagaceae trees by barcode DNA coupled with high-resolution melting analysis. Forests 12 (11), 1466. doi: 10.3390/f12111466
Osathanunkul M., Madesis P., De Boer H. (2015). Bar-HRM for authentication of plant-based medicines: evaluation of three medicinal products derived from acanthaceae species. PloS One 10 (5), e0128476. doi: 10.1371/journal.pone.0128476
Osathanunkul M., Suwannapoom C., Osathanunkul K., Madesis P., De Boer H. (2016). Evaluation of DNA barcoding coupled high resolution melting for discrimination of closely related species in phytopharmaceuticals. Phytomedicine 23 (2), 156–165. doi: 10.1016/j.phymed.2015.11.018
Ouso D. O., Otiende M. Y., Jeneby M. M., Oundo J.W., Bargul J.L., Miller S.E., et al. (2020). Three-gene PCR and high-resolution melting analysis for differentiating vertebrate species mitochondrial DNA for biodiversity research and complementing forensic surveillance. Sci. Rep. 10, 4741. doi: 10.1038/s41598-020-61600-3
Pakbin B., Basti A. A., Khanjari A., Brück W. M., Azimi L., Karimi A. (2022). Development of high-resolution melting (HRM) assay to differentiate the species of shigella isolates from stool and food samples. Sci. Rep. 12 (1), 1–13. doi: 10.1038/s41598-021-04484-1
Rezaei F., Haeili M., Fooladi A. I., Feizabadi M. M. (2017). High resolution melting curve analysis for rapid detection of streptomycin and ethambutol resistance in Mycobacterium tuberculosis. Maedica 12 (4), 246. doi: 10.1016/j.nmni.2020.100665
Russell F. S. (1970). The medusae of the British isles volume II: pelagic scyphozoa, with a supplement to the first volume of hydromedusae. Cambridge University Press 56(4):686. doi: 10.1002/iroh.19710560438
Sathirapongsasuti N., Khonchom K., Poonsawat T., Pransilpa M., Ongsara S., Detsri U., et al. (2021). Rapid and accurate species-specific PCR for the identification of lethal chironex box jellyfish in Thailand. Int. J. Environ. Res. Public Health.; 18 (1), 219. doi: 10.3390/ijerph18010219
Song M., Li J., Xiong C., Liu H., Liang J. (2016). Applying high-resolution melting (HRM) technology to identify five commonly used artemisia species. Sci. Rep. 6 (1), 1–7. doi: 10.1038/srep34133
Stangl K., Salvini-Plawen L. V., Holstein T. (2002). Staging and induction of medusa metamorphosis in carybdea marsupialis (Cnidaria, cubozoa). Vie Milieu/Life Environ. 52 (4) 131–140. Availabe at: https://hal.sorbonne-universite.fr/hal-03198891.
Straehler-Pohl I., Jarms G. (2005). Life cycle of Carybdea marsupialis linnaeus 1758 (Cubozoa, carybdeidae) reveals metamorphosis to be a modified strobilation. Mar. Biol. 147, 1271–1277. doi: 10.1007/s00227-005-0031-4
Turner D. H., Mathews D. H. (2010). NNDB: the nearest neighbor parameter database for predicting stability of nucleic acid secondary structure. Nucleic Acids Res. 38 (suppl_1), D280–D282. doi: 10.1093/nar/gkp892
Keywords: Andaman Sea, box jellyfish, Gulf of Thailand, melting profile, species discrimination approach
Citation: Osathanunkul M, Sawongta N, Sathirapongsasuti N, Poonsawat T, Detsri U, Aungtonya C and Suwannapoom C (2022) Distinguishing venomous jellyfish species via high resolution melting analysis. Front. Mar. Sci. 9:1019473. doi: 10.3389/fmars.2022.1019473
Received: 15 August 2022; Accepted: 22 November 2022;
Published: 22 December 2022.
Edited by:
Panagiotis Madesis, University of Thessaly, GreeceReviewed by:
Ioannis Ganopoulos, Hellenic Agricultural Organization – ELGO, GreeceCopyright © 2022 Osathanunkul, Sawongta, Sathirapongsasuti, Poonsawat, Detsri, Aungtonya and Suwannapoom. This is an open-access article distributed under the terms of the Creative Commons Attribution License (CC BY). The use, distribution or reproduction in other forums is permitted, provided the original author(s) and the copyright owner(s) are credited and that the original publication in this journal is cited, in accordance with accepted academic practice. No use, distribution or reproduction is permitted which does not comply with these terms.
*Correspondence: Maslin Osathanunkul, bWFzbGluLmNtdUBnbWFpbC5jb20=
Disclaimer: All claims expressed in this article are solely those of the authors and do not necessarily represent those of their affiliated organizations, or those of the publisher, the editors and the reviewers. Any product that may be evaluated in this article or claim that may be made by its manufacturer is not guaranteed or endorsed by the publisher.
Research integrity at Frontiers
Learn more about the work of our research integrity team to safeguard the quality of each article we publish.