 Jingfang Lu1
 Honghua Shi
 Xianqing Lv
- 1Frontier Science Center for Deep Ocean Multispheres and Earth System (FDOMES) and Physical Oceanography Laboratory, Ocean University of China, Qingdao, China
- 2First Institute of Oceanography, Ministry of Natural Resources, Qingdao, China
- 3Pilot National Laboratory for Marine Science and Technology (Qingdao), Qingdao, China
Coastal regions are highly vulnerable to the impacts of human activities, land cover change, sea level rise (SLR), and climate extremes. In this study, we attempt to address this issue by simulating the spatial interactions among natural hazards, ever-increasing human activities, and social vulnerability in the south coast of the Bohai Sea, China. It is found that the activities occurring on land, especially within coastal environments, such as agricultural pond and ports, and those in the ocean (tide and residual current) both impose disaster risks on the marine environment. In 2020, 25.2% of the total study area is highly vulnerable, which is 21% larger than that in 1997. The socially vulnerable areas are mainly distributed in the southeast coast of the Laizhou Bay. These areas should be strengthened to reduce and prevent the storm surge and flood disasters. Ultimately, we emphasize the urgent needs to implement effective policy measures for reducing tomorrow’s risks from natural hazards.
1 Introduction
The south coast of the Bohai Sea (SCBHS) is an important region of mariculture and salt pan in China (Shi et al., 2022). In recent years, due to their special locations and unique natural resources, the artificial landscape areas in the coastal regions have been expending, and consequently, their landscape patterns have been remarkably changed (Zhu et al., 2018). Other than the land-based sources, the marine construction boom driven by the expansions of coastal cities, increasing population and economic development including the constructions built in the marine environment with a wide range of purposes (ports and dams of aquaculture) also contributes to the changes in coastline and hydrodynamics, and causes natural disasters (SLR, storm surge and typhoons) (Arkema et al., 2013; Jiang et al., 2021; Huang et al., 2022). The natural disasters in the SCBHS mostly result from storm surges. The catastrophic storms in the Bohai Sea usually occur in summer and autumn, on an average frequency of once every 4 years, and smaller storms happen on the average frequency of 1-2 times a year, yet which have caused inestimable losses (Feng et al., 2018; Jiang et al., 2022). In particular, the coastal regions of the Bohai Bay and Laizhou Bay have undergone several severe storm disasters. The mean rate of SLR in the Bohai Sea was 3.8 mmyr-1 between 1993 and 2015 (Peng and Han, 2013). Therefore, it is essential to analyze the coastal vulnerability to human activities.
The quantification of coastal vulnerability index (CVI) has been extensively studied and well developed in the past several years. Koroglu investigated effects of the specific hydro-geomorphological condition ranges in the CVI model parameter (Koroglu et al., 2019). Sajjad coupled the human and natural systems to highlight the necessity of reclamation in coastal conservation (Sajjad et al., 2018). However, reclamation changes the coastline and subsequently alters the hydrodynamics. Therefore, it becomes a key driving force of increasing the CVI caused by the changes of tidal residual currents, yet is neglected in previously produced scenarios (Jin et al., 2016). So far, very few models map the relative vulnerability of a coastal area to erosion and inundation from the perspective of land-sea coordination with the urban development characteristics of the region taken into consideration. It is our goal to fill this gap with a coastal vulnerability model.
Among the various impacts of SLR, city waterlogging and storms are the most devastating ones that can cause significant losses of lives and properties in the coastal regions (Koks et al., 2015). The original CVI model does not include the unique socio-economic and demographic characteristics, such as gender, age, income, access to education and health services of the region. In addition, the traditional approaches generally examine the impacts of a single natural hazard, while overlooking the relationships/interactions between multiple hazards and human activities. The concept of social vulnerability index (SoVI) proposed by Sodhi is defined as “the propensity across different population segments to be affected by natural hazards and other shocks” (Sodhi, 2016). It can help to identify the critical locations where disaster risks should be prioritized in the regional policy.
Herein, we conducted a comprehensive survey on reclamation, landscape type, hydrodynamic condition, urbanization, coastline change, and protection-development status of the SCBHS. The nature hazard susceptibility of the region was examined using a CVI model that included the changes in coastline and hydrodynamics caused by reclamation. The urban sprawl and reclamation activities were detected by remote sensing. The SoVI of the region was assessed with a composite index tailored for the case-study area. Finally, the spatial interaction between the CVI and SoVI was studied. Based on the results, we attempt to provide a guidance for the regulation of human activities which can facilitate the coastal management in the nearshore waters and promote the sustainable development of the area.
2 Materials and methods
2.1 Study area
The study area is a semi-enclosed area located from 37°N to 38.5°N and from 117.5°E to 121°E with 615 km long coastline from the south of the Binzhou Port to the Longkou Qimu Corner. The area is surrounded by land in the west and south, including the sea area from the Yellow River estuary to the Laizhou Bay and the corresponding coastal area (Figure 1). Coastal area is defined as a 20 km wide area along the coastline based on the definition of coastal zone in the Wetland Convention (Nature, International Union for Conservation of, and Natural Resources and Ramsar Convention Bureau, 1984). The study area runs across five cities including Binzhou City, Dongying City, Weifang City, Qingdao City and Yantai City in Shandong Province, China with a total regional GDP of 2327.7 billion RMB and a total population of 31.4 million (Shandong Statistical Yearbook, 2021).
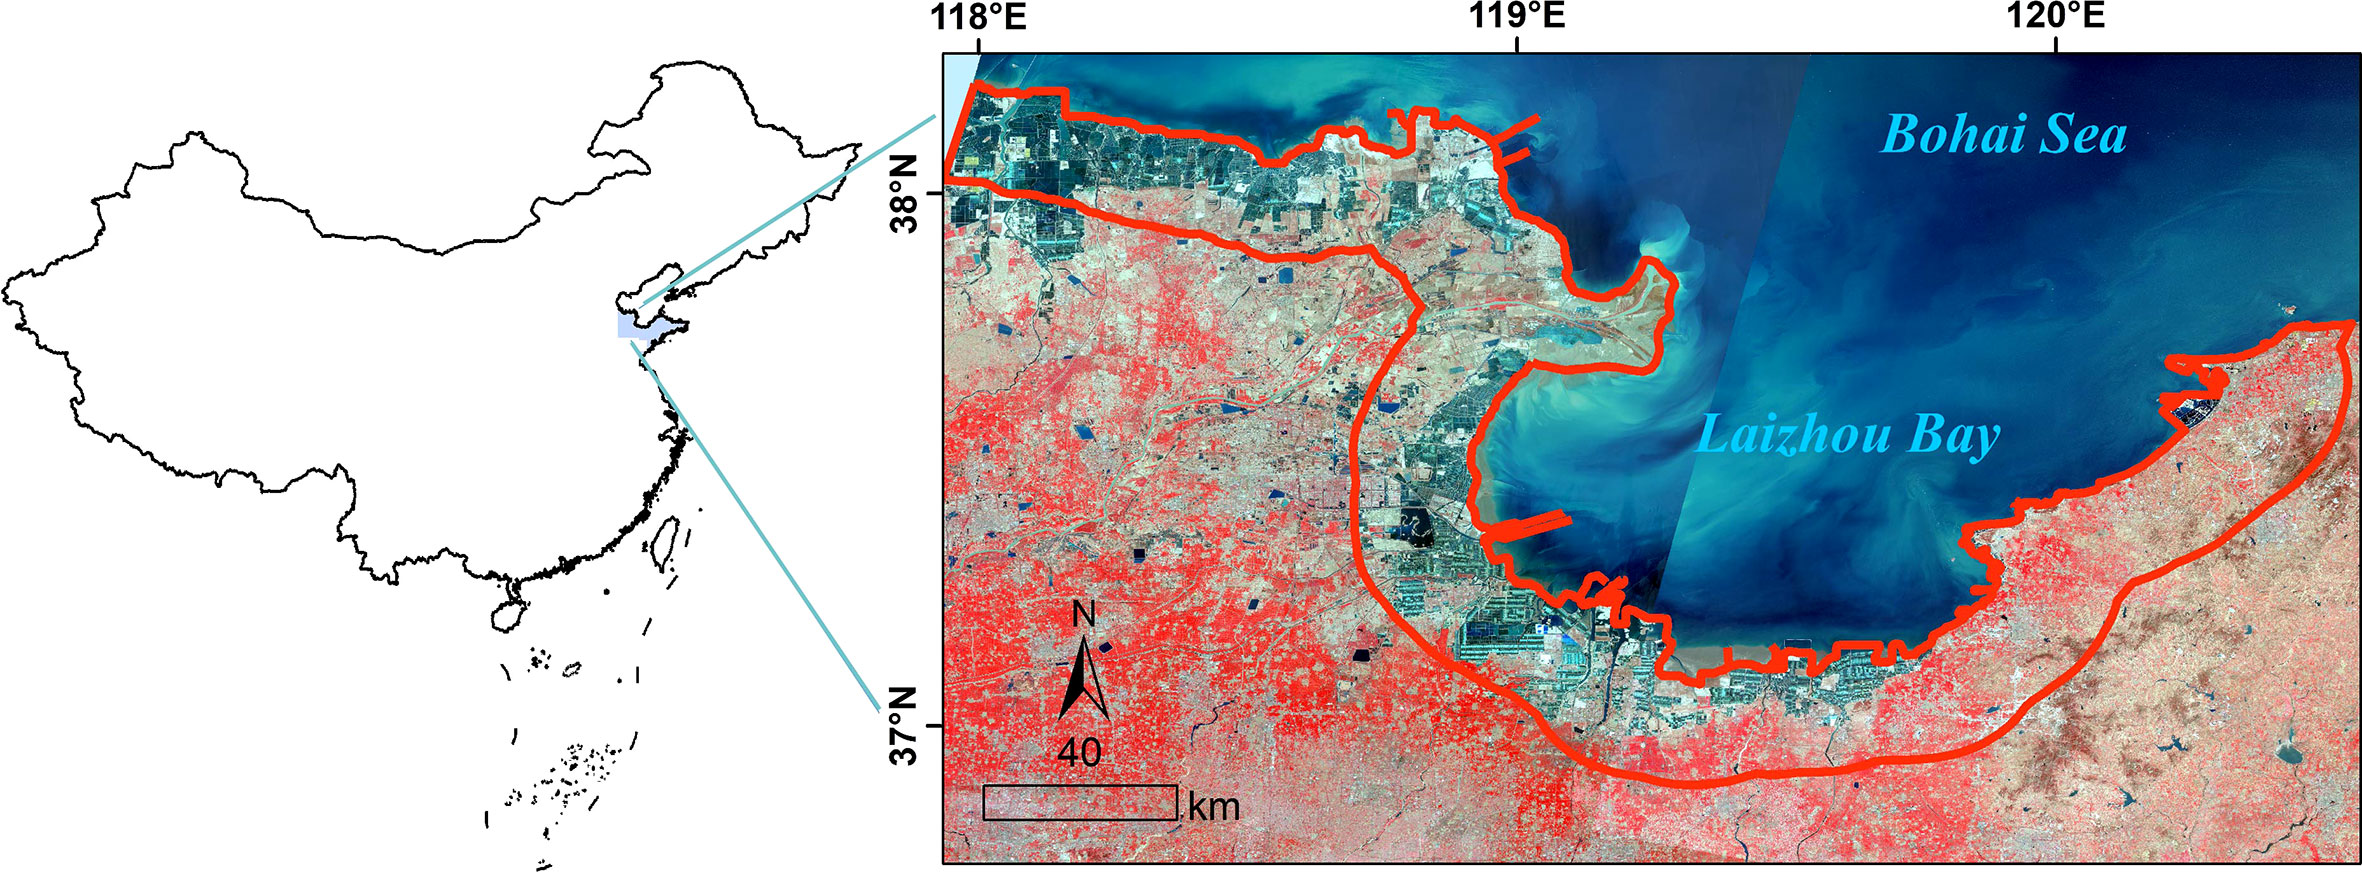
Figure 1 Location and topography of study area.
2.2 Coastal vulnerability index
The CVI model proposed by Gornitz (1990) can assess the coastal vulnerability to SLR, particularly due to erosion and/or inundation. The model ranks the exposure index of each point of the coastline at a specified interval, but does not directly value any ecosystem service, such as coastal zone and coastal wetland (Gornitz et al., 1997; Hammar and Thieler, 2001). It is known that the characteristics of a given coastline result from the interactions among geomorphology, SLR, wave height, tidal range, and storm frequencies. The relative magnitudes of these variables change from place to place, which induces nonuniform responses of the coastline to SLR. Therefore, we attempt to establish a coastal vulnerability model under anthropogenic impacts, aiming to cover the deficiencies of the conventional model.
The CVI under the human activity framework involves the coastal assessment that quantifies the coastal vulnerability using remote sensing and satellite altimeter observation data. The conceptual framework is shown in Figure 2A. The traditional human activities on land, such as agricultural production and urban development, alter the natural landscapes and increase artificial landscapes (Yang et al., 2021). The ocean-based human activities, such as reclamation and mariculture, directly affect marine habitats. By incorporating the human activity responses into the CVI model, the parameters are determined as detailed in Figure 2B. The CVI is then calculated using a spatial representation of the bio-geophysical variables including geomorphology, SLR, coastal slope, regional elevation, coastline change, significant wave height and tidal range. The obtained CVIs are ranked from very low exposure (rank=1) to very high exposure (rank=7) based on the combination of the user- and model- defined criteria by the method of Gornitz (Gornitz et al., 1997; Hammar and Thieler, 2001). The score ranges and ranking are summarized in Table 1 (Koroglu et al., 2019; Wang et al., 2021). The calculation using a spatial representation of the bio-geophysical variables was referred to the InVEST User’s Guide (https://naturalcapitalproject.stanford.edu/). The adjustments of major parameters are shown in Figure 2B.
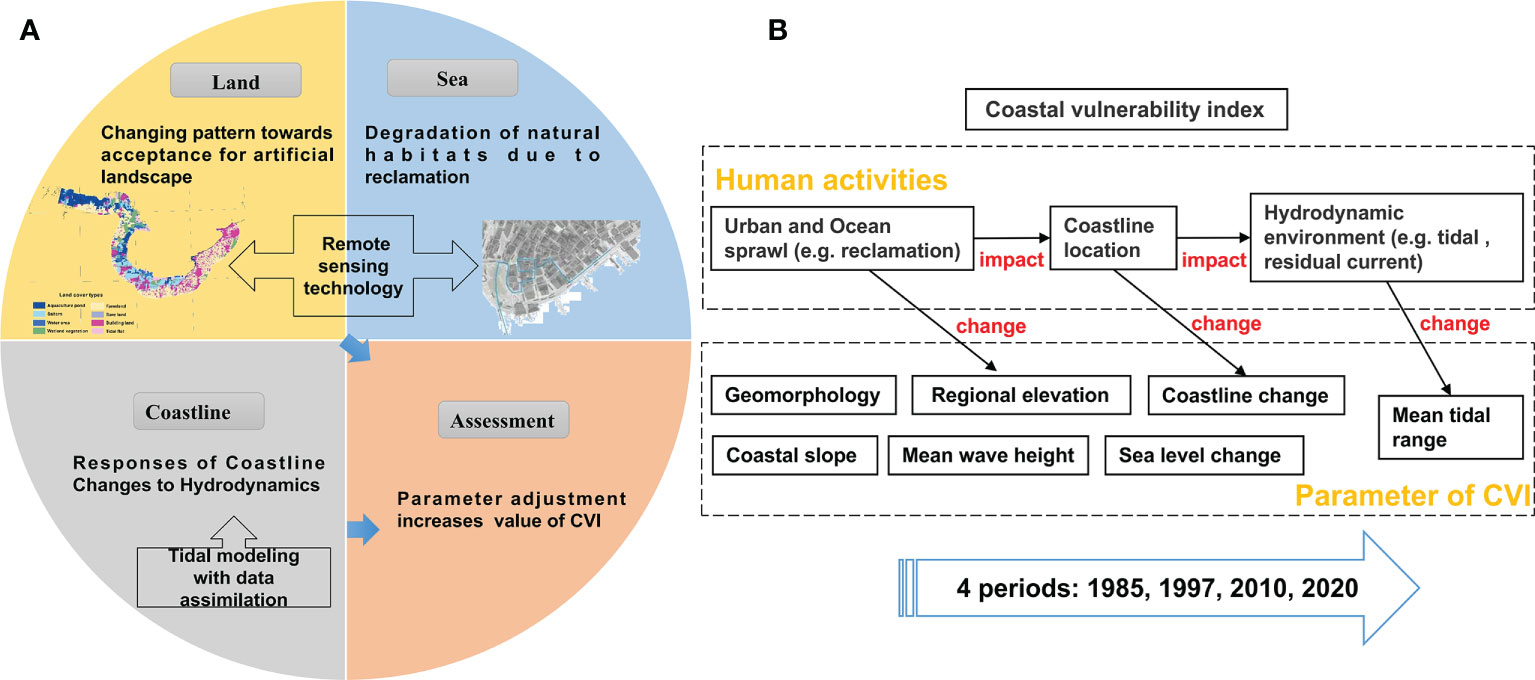
Figure 2 CVI under the human activity framework (A); Parameter adjustment of the CVI model (B).
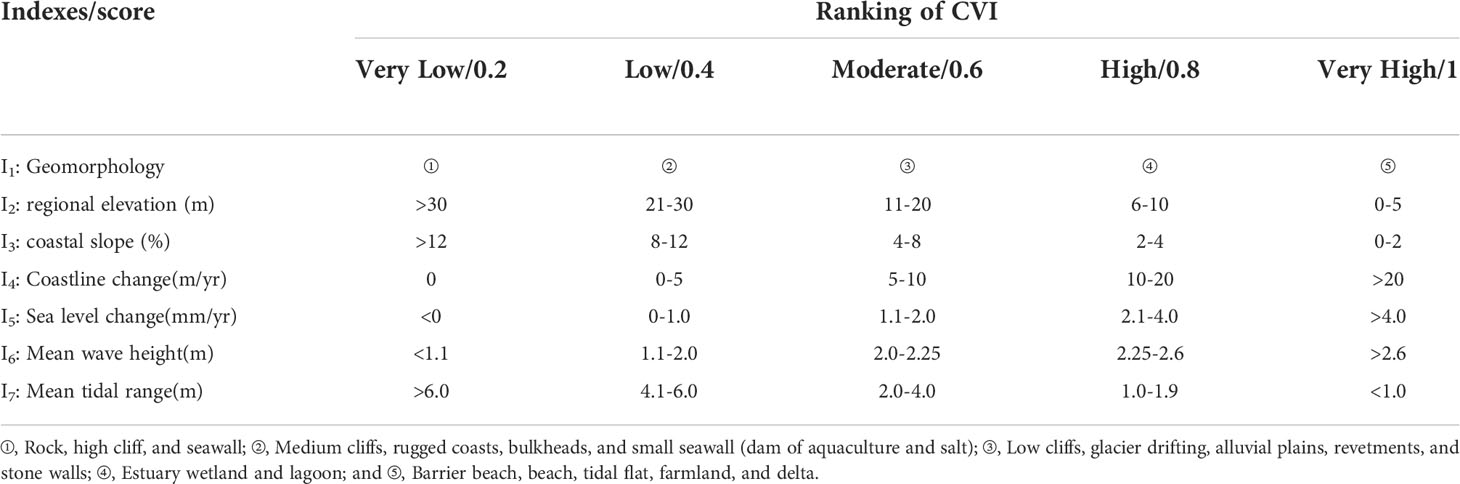
Table 1 Evaluation system of CVI.
2.2.1 Geomorphology
Geomorphology refers to the geomorphological features resistant to erosion. Rocky cliffs play a vital role in reducing the impacts of coastal hazards. They are less prone to erosion than beaches and deltas. Different coastline geomorphologies are ranked by the method of Hammar and Thieler, 2001. Since we will further assess the coastline in the study area by remote sensing (See 2.3.1), two more coastline geomorphologies, dams of aquaculture and salt, are included in this index based on the remote sensing images.
2.2.2 Coastal slope and regional elevation
Coastal slope and regional elevation are the indexes evaluating the relative risks of inundation. For the gently sloping coasts, any rise in sea level would inundate a large extent of land. The coastal slope and elevation data of the study area are downloaded from http://www.gscloud.cn.
2.2.3 Coastline change
Reclamation activities for industrial and agricultural developments expand the land area and change the coastline position. In the CVI model, coastline change is also an index for assessing the potential impacts of natural hazards (Koroglu et al., 2019). The change rate of coastline position is calculated using the ArcMap extension module and Digital Shoreline Analysis System (DSAS). DSAS generates a landward baseline from which orthogonal transects are cast at 3-km intervals. The intercepts between the transects and coastline are recorded to calculate the annual change rates (Thieler et al., 2009). A total of 205 change rates, each corresponding to a DSAS transect, are obtained.
2.2.4 Mean wave height
The data of wind and wave was obtained by reanalysis of the six-year (2005-2010) WAVEWATCH III model HINDCAST from NOAA (Gornitz, 1990; Sajjad et al., 2018).
2.2.5 Tidal range
To estimate the spatial variation range of tide in the SCBHS, multi-mission satellite observations from the TOPEX/Poseidon were assimilated into a 2-D tidal model by the adjoint method (Lu and Zhang, 2006). The assimilation process can be summarized as follows.
1) Land-sea grid construction
The land-sea grid is constructed by the following steps:
Step 1. A 2-dimensional (2D) hydrodynamic model with the medium resolution square meshes (2’×2’ grid, approximately 30 m) fitting the coastline is constructed using the Arakawa C grid.
Step 2. By comparing the current geographic distribution data of land-sea from the National Earth System Science Data Center (http://www.geodata.cn/data) and those of different years, the shrinkage or expansion of coastline is processed.
Step 3. The ETOPO1 bathymetric data are matched to the grids and the values of the rest nodes are interpolated.
Step 4. The coastline in each grid versus water depth are matched, and the grids are divided based on the dryness and wetness to obtain the control field of sea-land distribution.
2) Tidal modeling with adjoint method
The distributions of the M2 tidal constituent in the SCBHS in 1985, 1997, 2010 and 2020 are simulated by combining the T/P observation data. The numerical schemes for the forward model and the adjoint model are given in the Appendix A1 and A2. The coastline changes caused by reclamation and the corresponding hydrodynamic changes (tide level and velocity) are also included in the tidal model.
3) Model configuration
The 2-D tidal model covers the area of SCBHS from 37°N to 38.5°N and from 117.5°E to 121°E with the spatial resolution of 1/12°×1/12°. The gridded topography is adopted from ETOPO1. The maximum water depth of the study area is 85 m. The topography is gridded with the Arakawa C grid, where the water level is put at the grid center and the two velocity components are defined to be perpendicular to the edges of the grid.
The closed boundary conditions for our model are zero flow normal to the coast. That is, for the grid points at closed boundary, where is the outward unit vector and is the velocity vector. The Beijing standard time (referred to the meridian of 120°E) is adopted throughout this study.
Along the open boundaries, the water elevation of the M2 tide at the jth time step is given as , where (ml,nl) stands for the grid points at the open boundaries, ω is the frequency of the M2 constituent, and al, bl are the Fourier coefficients. The open boundary conditions of water elevation are obtained by assimilating the T/P data using the adjoint method, and are fixed in all experiments (He et al., 2004).
4) Model validation
The reliability of the assimilation was evaluated by testing the harmonic constants using amplitude difference, phase difference and vector difference as the evaluation criteria. The vector difference can be expressed as:
The evaluation results are listed in Table 2.The simulation results are validated with the observation data of the 59 tide gauge stations. The mean absolute errors (MAEs) between the simulated and measured amplitudes, phases and vectors are less than 3.1 cm, 5.3°, and 4.4 cm, respectively. The root mean square errors (RMSEs) between the simulated and measured amplitudes, phases and vectors are smaller than 3.6 cm, 7.1°, and 5.1 cm, respectively. The MAEs and RMSEs of the three parameters meet the requirements, and thus the model is valid (Cheng et al., 2007; Pan et al., 2021).
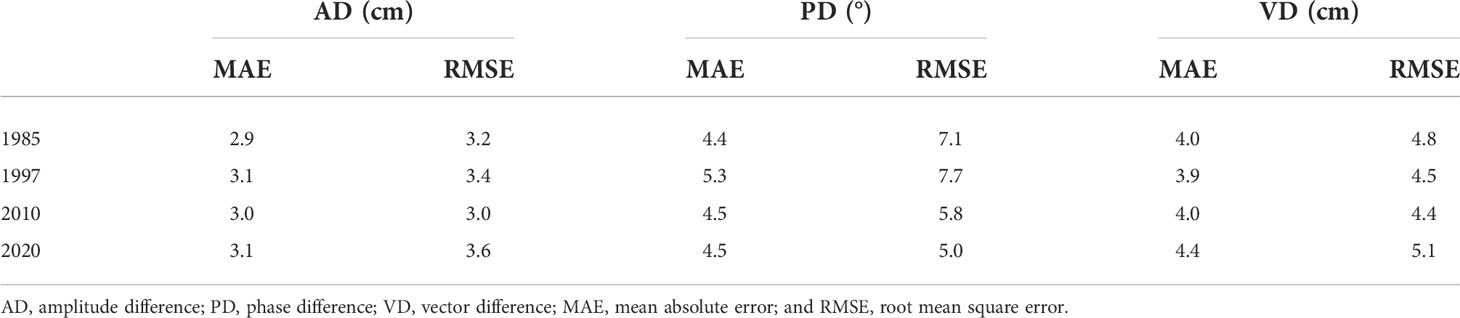
Table 2 The comparison of the calculated and measured.
2.2.6 SLR
A polygonal vector that can describe a unified range of sea level change is needed to characterize SLR. In this work, it is assumed that the eustatic sea-level in China is similar to the global SLR projected by IPCC in the 5th assessment report (IPCC, 2013).
2.2.7 Calculation of CVI
The CVI of the i-th section in the coastal wetland ecosystem is then calculated with Eq. (2).
where “I” is the exposure rank of each variable.
2.2.8 Spatial visualization of CVI
The obtained CVIs are visualized by the GIS analysis method and equal interval breakpoint method with the vulnerability ranks of very low (0-1.39), low (1.40-2.79), medium (2.80-4.19), high (4.20-5.59) and very high (5.60-7.0). The amplified risks of natural hazards can lead to life-threatening storm surge and flooding and destruction of ports, villages, roads and other coastal infrastructures, which alarms the low-lying of SCBHS. To accommodate spatial heterogeneity, the visualization is extended 20 km inland from the edge of the coastline.
2.3 Human activity intensity
HAI refers to the degree of disturbance of an area affected by human activities (Wen, 1998; Xu et al., 2015). At present, the quantification of HAI based on the comprehensive indexes and land-use change has become the most widely used method with its advantages of simplicity and universal (Feng et al., 2017; Liu et al., 2018). In this study, HAI is calculated with the areas and influence coefficients of different types of land within a specific region to evaluate the disturbance of human activities to the nature (Chi et al., 2017; Chi et al., 2018a).
2.3.1 Remote sensing data processing
Landsat products of 1985, 1997, 2010, and 2020 (cloud cover: 0-5.46, resolution: 30 m×30 m) were obtained from the Geospatial Data Cloud site (http://www.gscloud.cn). Based on the remote sensing images, the landscapes in the study area are classified as natural landscape or artificial landscape. Wetland vegetation, tidal flats, bare lands, and water areas are natural landscapes. Farmland, aquaculture pond, saltern, and building land are considered as artificial landscapes (Sun et al., 2016; Chi et al., 2018a). The information of the remote sensing images (Table A1) and specific interpretation signs of different land cover types (Table A2) can be found in the Supplementary Material.
The verification method of remote sensing data: accurate control of landscape types is through corresponding Google Earth map with a resolution< 1 m, a total of 2145 validation sites (one site is set every 4 km) are selected, the contrast between our land cover types and the Google Earth map is conducted using an error matrix, the overall accuracy is 92.1%, which achieves a good performance (Chi et al., 2018b).
2.3.2 Spatial visualization of HAI
To characterize the spatial heterogeneity of HAI in the study area, the impact intensity of different types of landscape are estimated. The maximum impact intensity is applied to the center of the landscape. Each type of landscape is assigned with a human impact value, 1 for building area, 0.4 for saltern and aquaculture pond, and 1 for farmland (Chi et al., 2018b).
The spline function can interpolate points onto a grid surface by the 2D minimum curvature spline method to form a smooth surface passing exactly through the input points (Shi et al., 2020). Herein, the evaluation indexes are spatially interpolated. HAI is ranked from low vulnerability (0-0.33), medium vulnerability (0.34-0.66) to high (>0.67) vulnerability and visualized by the equal interval breakpoint method and the GIS analysis method.
2.4 Social vulnerability index
SoVI emphasizes the different burdens of disaster losses within and between places (Chen et al., 2014). It has been well recognized, and can be adapted to other different contexts (Boruff and Cutter, 2007; Holand and Lujala, 2013). The most frequently used SoVI methods are based on composite indicators (Boruff and Cutter, 2007). This paper aims to provide the empirical analysis of the spatial distribution of SoVI and its underlying social, economic, and political causes in SCBHS region at the local scale.
2.4.1 SoVI identification
The rapid economic development and population growth have caused more natural hazards in the SCBHS (Feng et al., 2018). With the focus on assessing the social vulnerability and responses of coastal cities to natural hazards, we identified 7 secondary indexes from the most recent Statistical Bulletin of Shandong Province and placed them into three first level indexes, e.g., population, informatization level, and social security (Table 3). The population index is composed of two variables. Young children (under 14 years old) and older adults (over 60 years old) are commonly regarded as the most vulnerable members of the population. The urban areas with higher population densities are more challenging in evacuation after a disaster. The informatization level index is composed of two variables, e.g., the number of mobile telephone subscribers and the number of broadband internet subscribers, that reflect the accessibility to disaster information for timely rescue. The lack of access to these services indicates a lower capability of hazard warning. The social security index is composed of three secondary indexes. The lack of access to basic social security services, such as health institutions and hospitals, may compromise the health and safety of the local population (Siagian et al., 2013; Mesta et al., 2022).
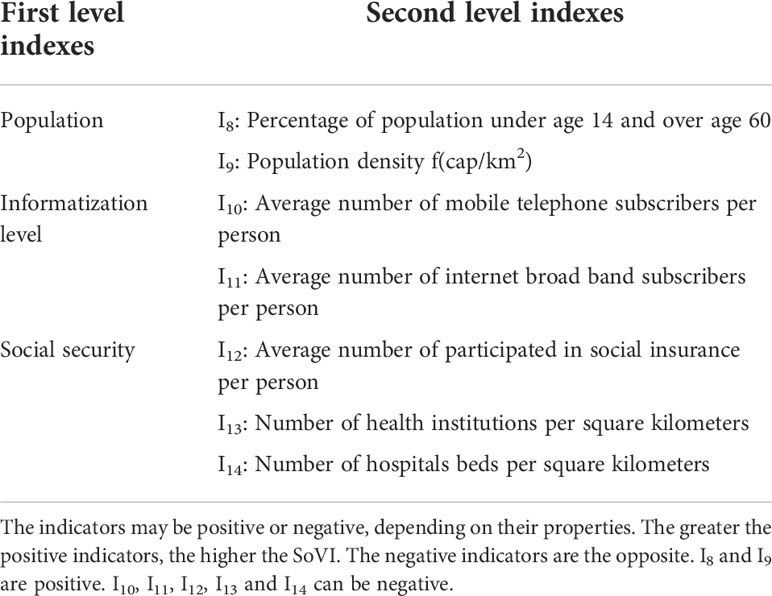
Table 3 Evaluation system of SoVI.
Given the unique local characteristics of the study area, we only chose the 7 variables from those leveraged by Mesta et al. (2022) for further analysis. The study area has undergone rapid urbanization and substantial economic growth since the Chinese economic reform. The nine-year compulsory education has been implemented since 2006, which provides basic safety education and training for all minors. Therefore, the economy and education indexes are excluded, but the indexes of health institutions and hospital beds proposed by Holand and Lujala (2013) are included in our study.
Previous studies suggest that social vulnerability remains in a stable state over time. Zhou et al. (2019) reported that only 18% of counties in China underwent significant increases/decreases in social vulnerability in the past 30 years. However, the potential changes in social vulnerability can occur gradually due to the influences of population changes, such as aging and family planning policy, or take place almost instantaneously owing to typhoon and flood disasters that cause casualties, losses of constructions, and decreases in crop land. These changes are ongoing, which makes it more difficult to measure and quantify social vulnerability. Therefore, this paper excludes the effects of potential changes in indexes.
2.4.2 Calculation of SoVI
Each index value (Im) is normalized into the score range of 0-1.0, where the minimum index value (minm) is 0 and the maximum index value (maxm) is 1. Maxm and Minm are the maximum value and minimum value, respectively, of indicator I within each administrative unit. The normalized value (NVm) is calculated with the equations below.
The score of each index is defined as the arithmetic mean of the corresponding NVm values. The overall SoVI is obtained as the weighted average of each of the first level indexes, i.e.:
2.4.3 Spatial visualization of SoVI
The obtained SoVIs were then ranked from low vulnerability (rank=0) to high vulnerability (rank=1) and visualized by the equal interval breakpoint method and the GIS analysis method.
3 Results
3.1 Coastal vulnerability index
3.1.1 Evaluation results of sub-indexes
3.1.1.1 Changes in reclamation and change rate
Figure 3A shows the three development stages of reclamation in the SCBHS which have resulted in 1139.5 km2 increase in the cumulative reclamation area. During the study period, reclamation activities mainly occurred on the north coast of the Yellow River estuary (36.5%) and the south coast of the Laizhou Bay (28.0%). The activities caused the mean net coastline movement of 184.8 m/yr (median, 73 m/yr). Most coastline movements were distributed on the north coast of the Yellow River and the south coast of the Laizhou Bay, with the mean net values of 344.8 m/yr and 263.2 m/yr, respectively. 81.3% of the SCBHS coastline mapped in 2020 is within 0-140.4 m from their positions in 1985, and more than 52.3% of coastline expands more than 1 km to the sea (Figures 3B–D). In particular, the reclamation in 1985-1997 is much more aggressive than those in other periods, and the reclaimed lands are mainly used for agriculture and mariculture.
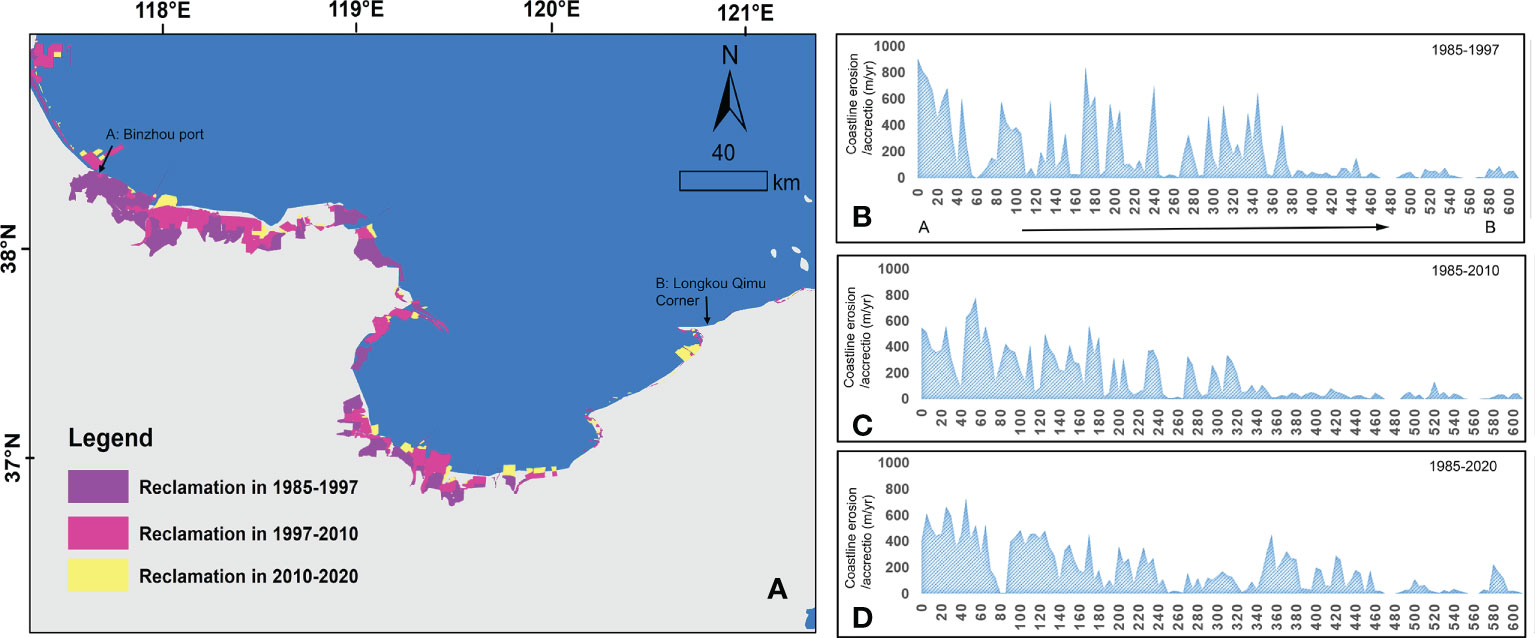
Figure 3 Spatial distribution of reclamation activities (A) and coastline change rates determined by DSAS from 1985 to 1997 (B), 2010 (C) and 2022 (D).
3.1.1.2 Changes in hydrodynamics
In the past 35 years, the coastline in SCBHS has already undergone significant spatial-temporal changes. Marine constructions, such as ports and wharves, rapidly bulge along the coast and extend toward the ocean. In addition, a ginormous amount of sediment from the loess region has formed a mega-delta in the Yellow River Estuary (Figures 4A–D).
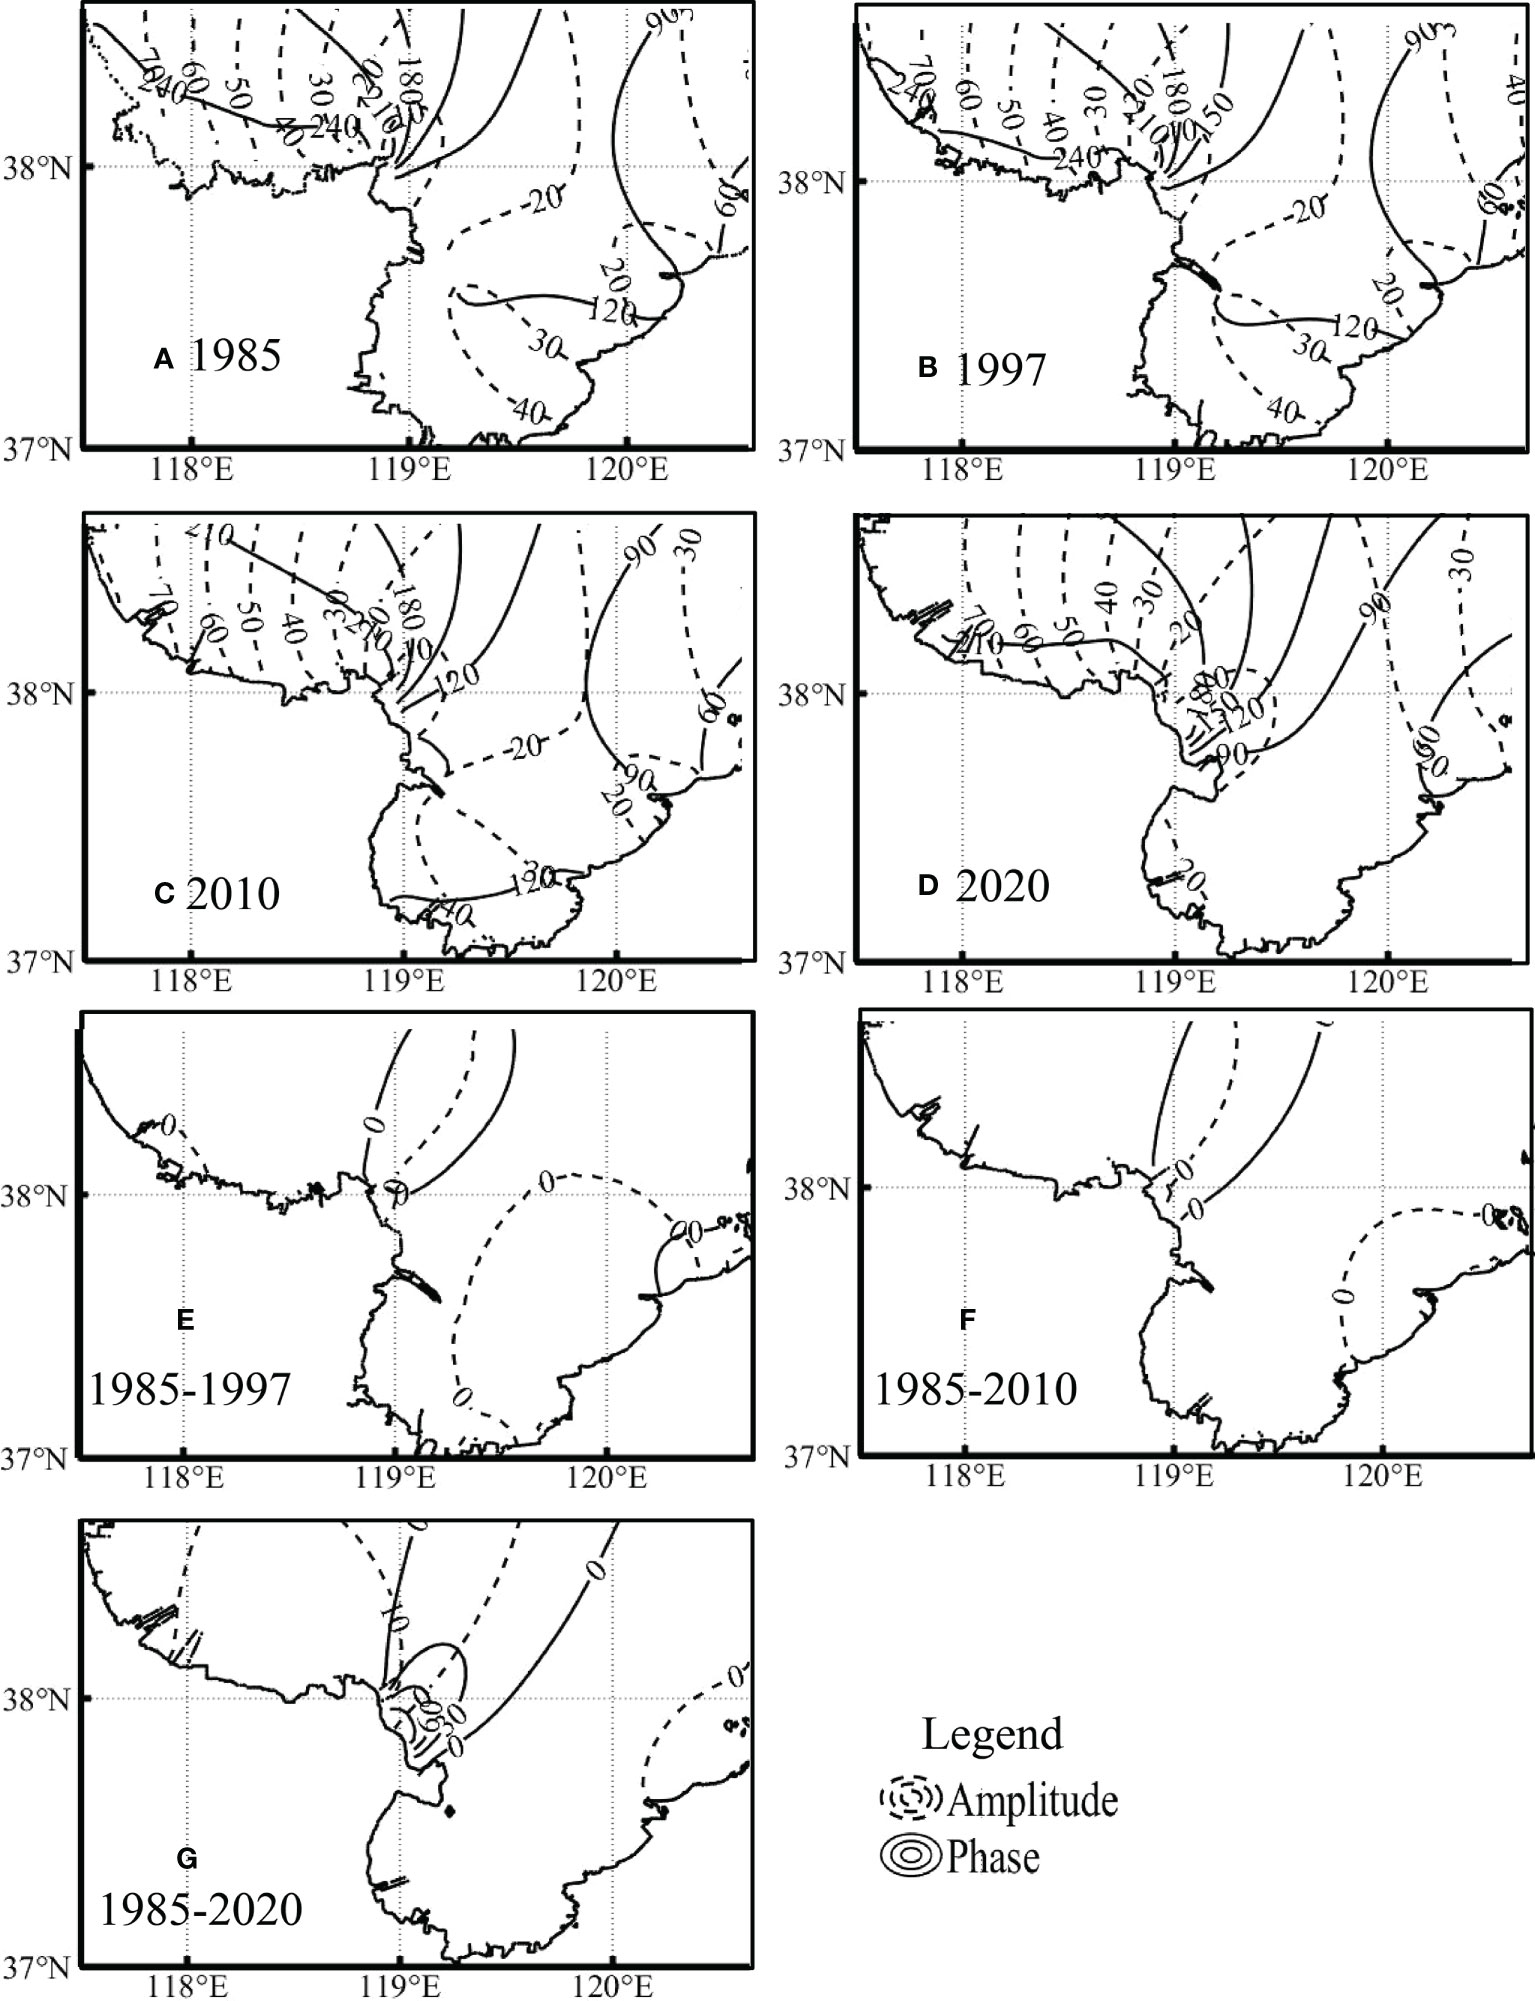
Figure 4 Amplitudes and phases of M2 tidal constituents in 1985 (A), 1997 (B), 2010 (C) and 2020 (D). Solid black lines represent the phase (°), and dotted black lines denote the amplitude (cm). (E–G) show the changes in M2 tidal constituents during these three periods. Solid black lines represent the phase (°) and dotted black lines denote the amplitude (cm).
Figure 4 shows the co-tidal charts in 1985, 1997, 2001, and 2020. The M2 tidal constituent was stable in 1985, and only slight movements were observed on the amphidromic points, but its amplitude increased in 1997, 2010 and 2020 as the coastline changed (Figures 4A–D). It is worth noting that, compared with that in 1985, the amplitude of the M2 tidal constituent in the north of the Yellow River Estuary increased by 14-20 cm in 2020, equivalent to the 14-20 cm rise of seabed (Figures 4E–G).
3.1.2 Spatial-temporal changes in CVI
From 1997 to 2020, the high-intensity urban construction, reclamation and the corresponding hydrodynamic changes led to the rapid natural habitat loss and significantly increased the coastal vulnerability. In particular, the very high vulnerability area increased by 3.6-folds in 2010 (Figure 5D). The CVI on the coast is 1.1 (very low vulnerability) in 1997, 3.4 (medium vulnerability) in 2010, and 4.1 (medium vulnerability) in 2020 (Figures 5A–C). In terms of spatial distribution, most locations in the central of less elevated wetland plains, especially the western area of the SCBHS, show very low or low vulnerabilities. In contrast, the vulnerabilities of many artificial landscapes, mostly in the southeastern areas of the SCBHS, are high or very high.
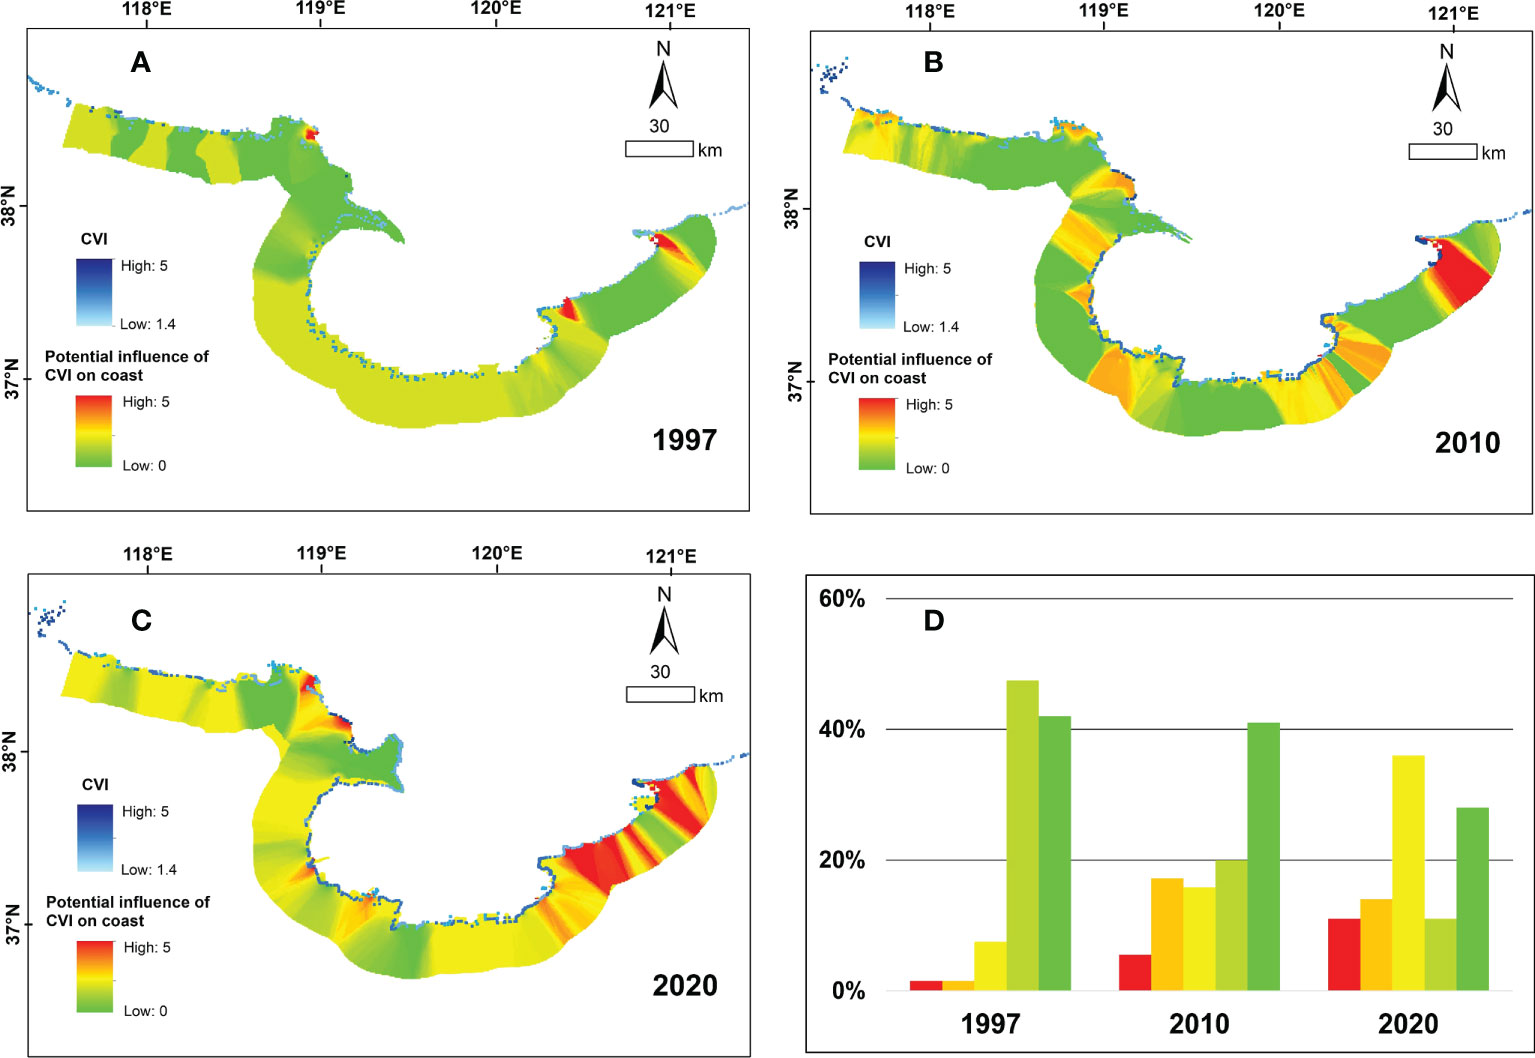
Figure 5 Temporal-spatial distribution of CVI in 1997 (A), 2010 (B), and 2020 (C), and the area proportions of different ranks of CVI visualized by the equal interval breakpoint method with red, orange, yellow, light green, and green representing very high vulnerability, high vulnerability, medium vulnerability, low vulnerability and very low vulnerability (D).
The spatial distribution of CVI in 2020 reveals that 35.8% of the study area with the total area of 3082 km2 is moderately vulnerable, and the highly vulnerable areas with the CVI values of 4.1-6.0 account for 11.4% of the total area. These highly vulnerable areas are mainly distributed along the eastern coastline of the Laizhou Bay.
3.2 Spatial-temporal changes in HAI
3.2.1 Natural landscape degradation
Figures 6, 7 summarize the spatial and temporal distributions and area changes of artificial landscape in the SCBHS during 1985-2020. The artificial landscape area including saltern, aquaculture ponds and building land increased from 504 km2 (6% of the total area) to 2647 km2 (31% of the total area) in the 35 years. The changing trends of the areas of different types of artificial landscapes are different. The total building land area showed an obvious increasing trend, especially an increase of 17% from 1997 to 2010, due to the rapid urbanization. The areas of aquaculture pond and salt pan consistently increased by 5% and 11%, respectively, from 1985 to 2020. On the contrary, the areas of farmland, wetland land and tidal flat consistently decreased by 16%, 6% and 11%, respectively.
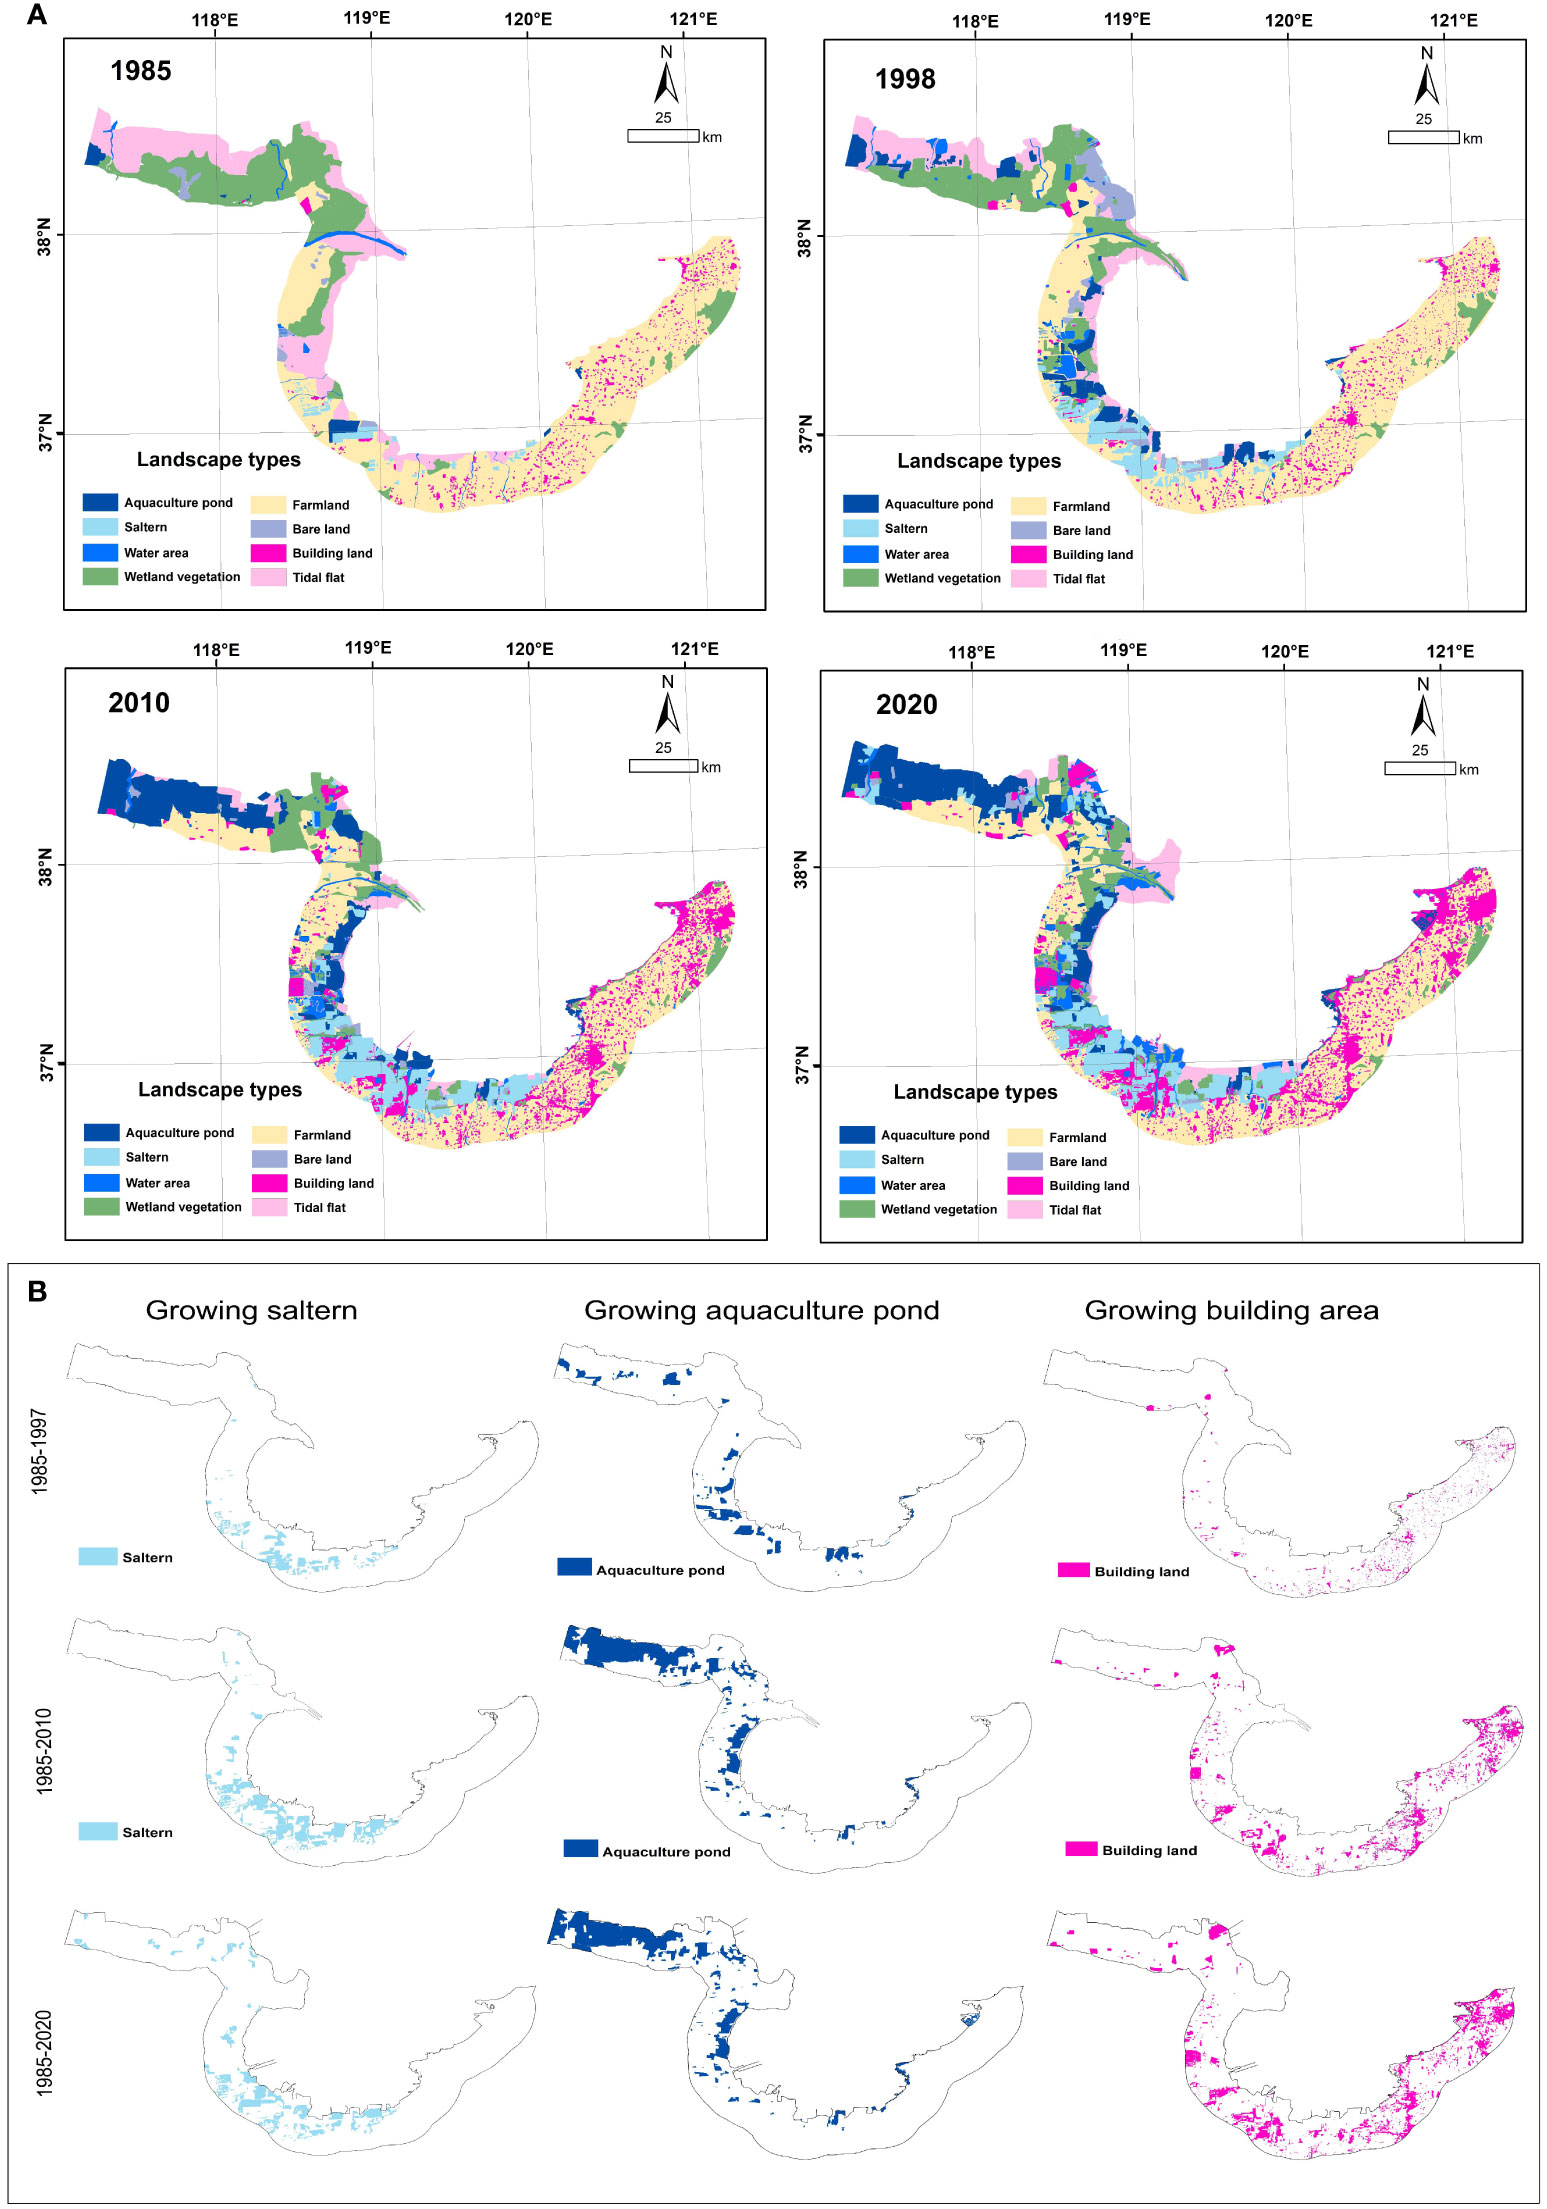
Figure 6 Landscape types and their distributions in 1985, 1997, 2010 and 2020 (A); Temporal and spatial distributions of the increases in the areas of saltern, aquaculture pond and building land (B).
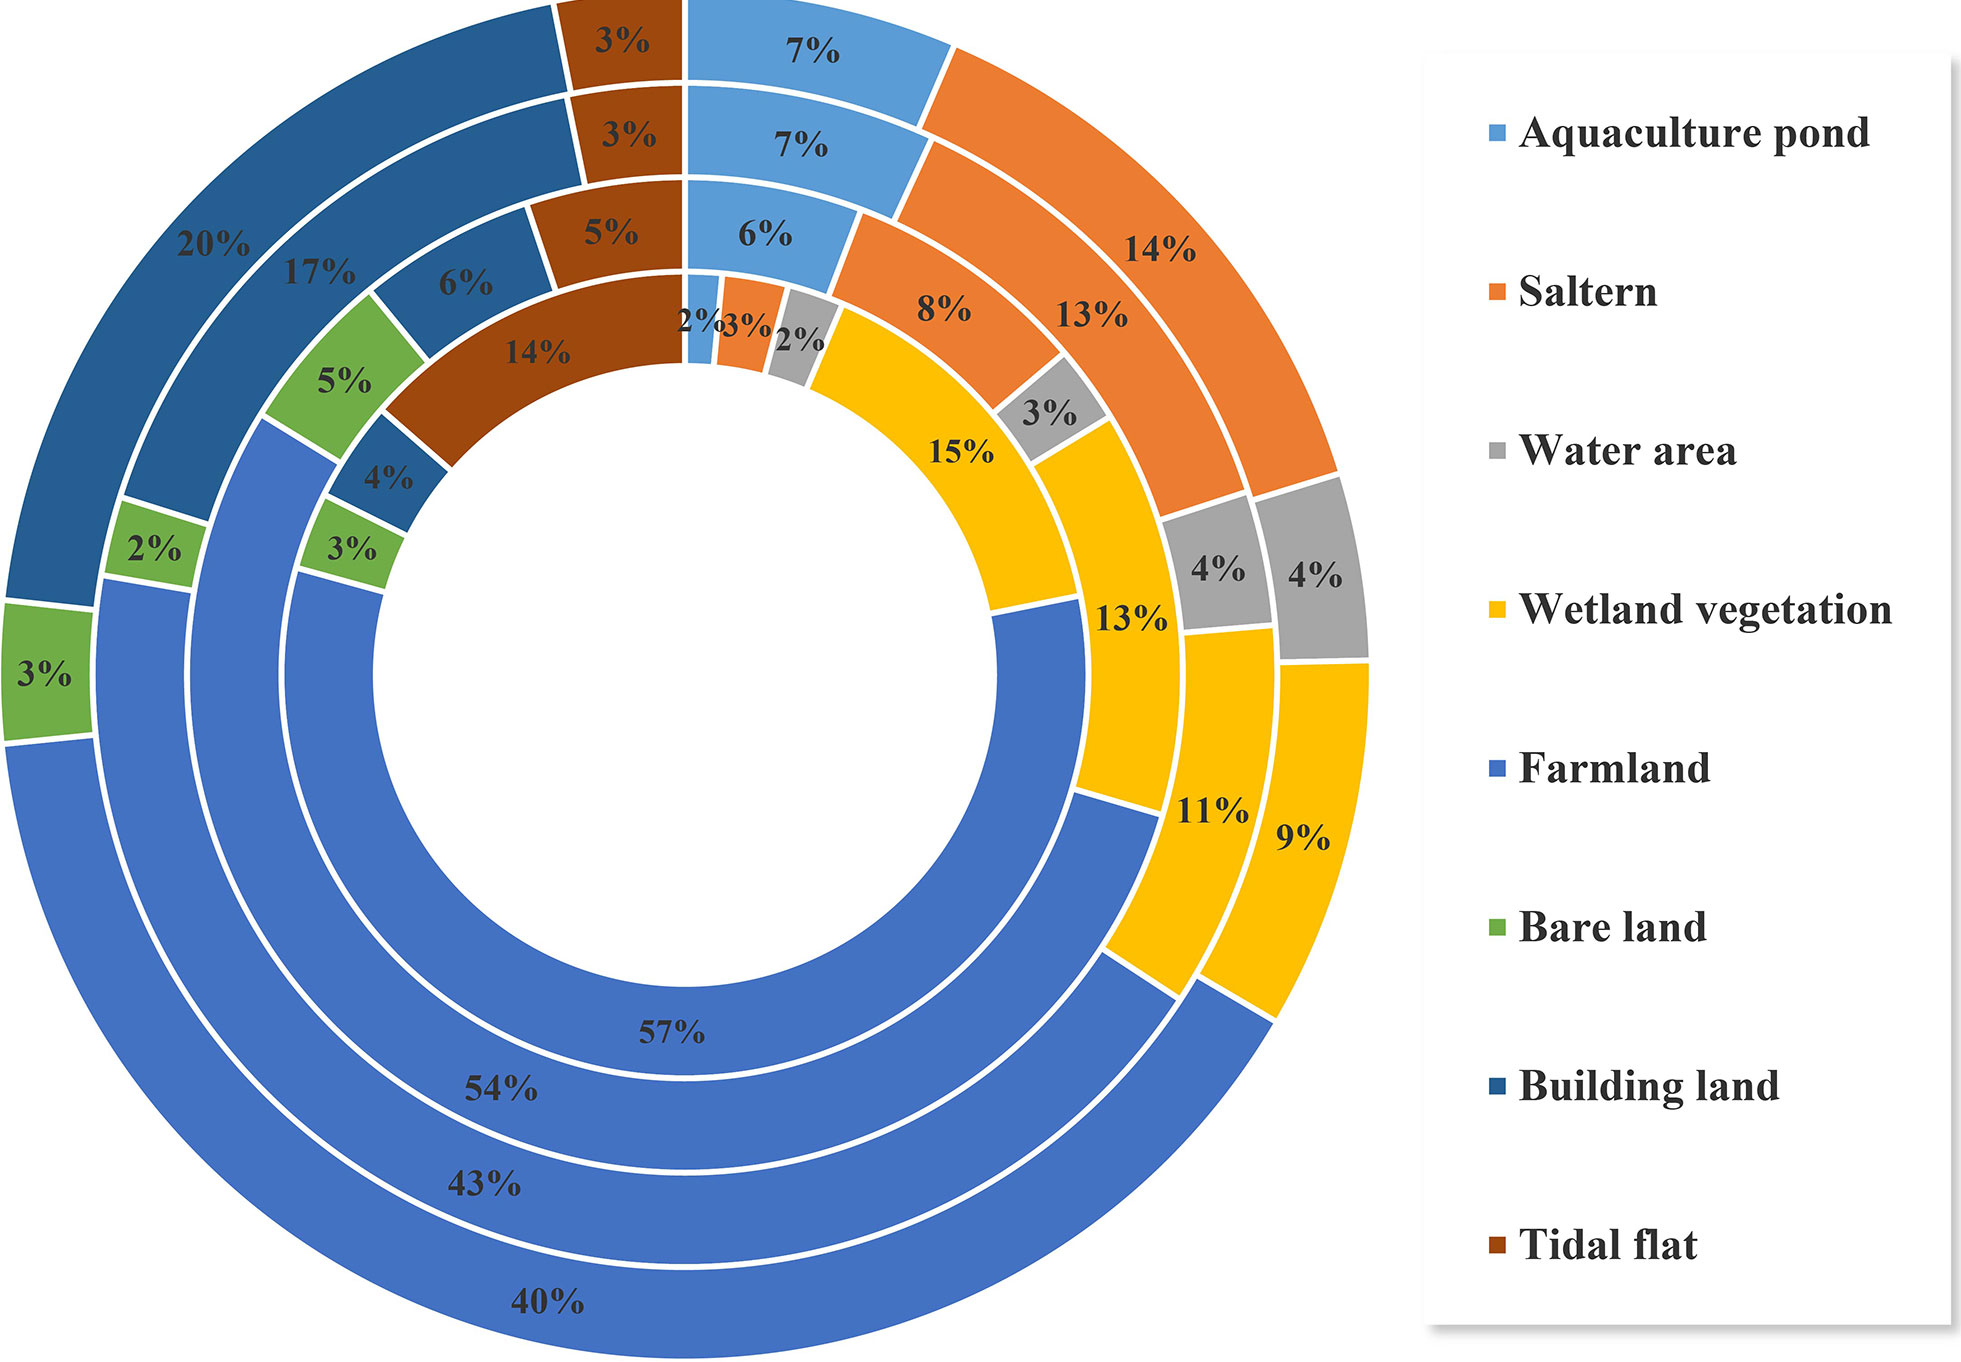
Figure 7 Area distributions by land use type in 1985 (most inside circle), 1997 (second most inside circle), 2010 (second most outside circle), and 2020 (most outside circle).
3.2.2 Spatial-temporal changes of HAI
The spatial distributions of HAI in SCBHS during different periods of time are obtained by the spatial analysis in GIS. It is found that the HAI of SCBHS in 2020 is highly intense with the average value of 0.74, and its spatial change is dramatic. From 1985 to 2020, the total area of moderate and high vulnerabilities increased from 935 km2 (11% of the total area) to 1532 km2 (18% of the total area) and the high HAI areas were mainly distributed in the western and central regions (Figure 8). The HAI of urban expansion is 0.92 in Yantai City, 0.70 in Weifang City, 0.85 in Qingdao City, 0.58 in Dongying City, and 0.46 in Binzhou City. From 1985 to 1997, building land experienced the highest annual growth rate of 7.6% during the three periods, showing a very high HAI. The comparison of the spatial distribution maps of CVI and HAI suggests that the increases in artificial landscape area cause the rise of HAI to 0.78, and 77% of artificial landscape area show high or very high CVIs.
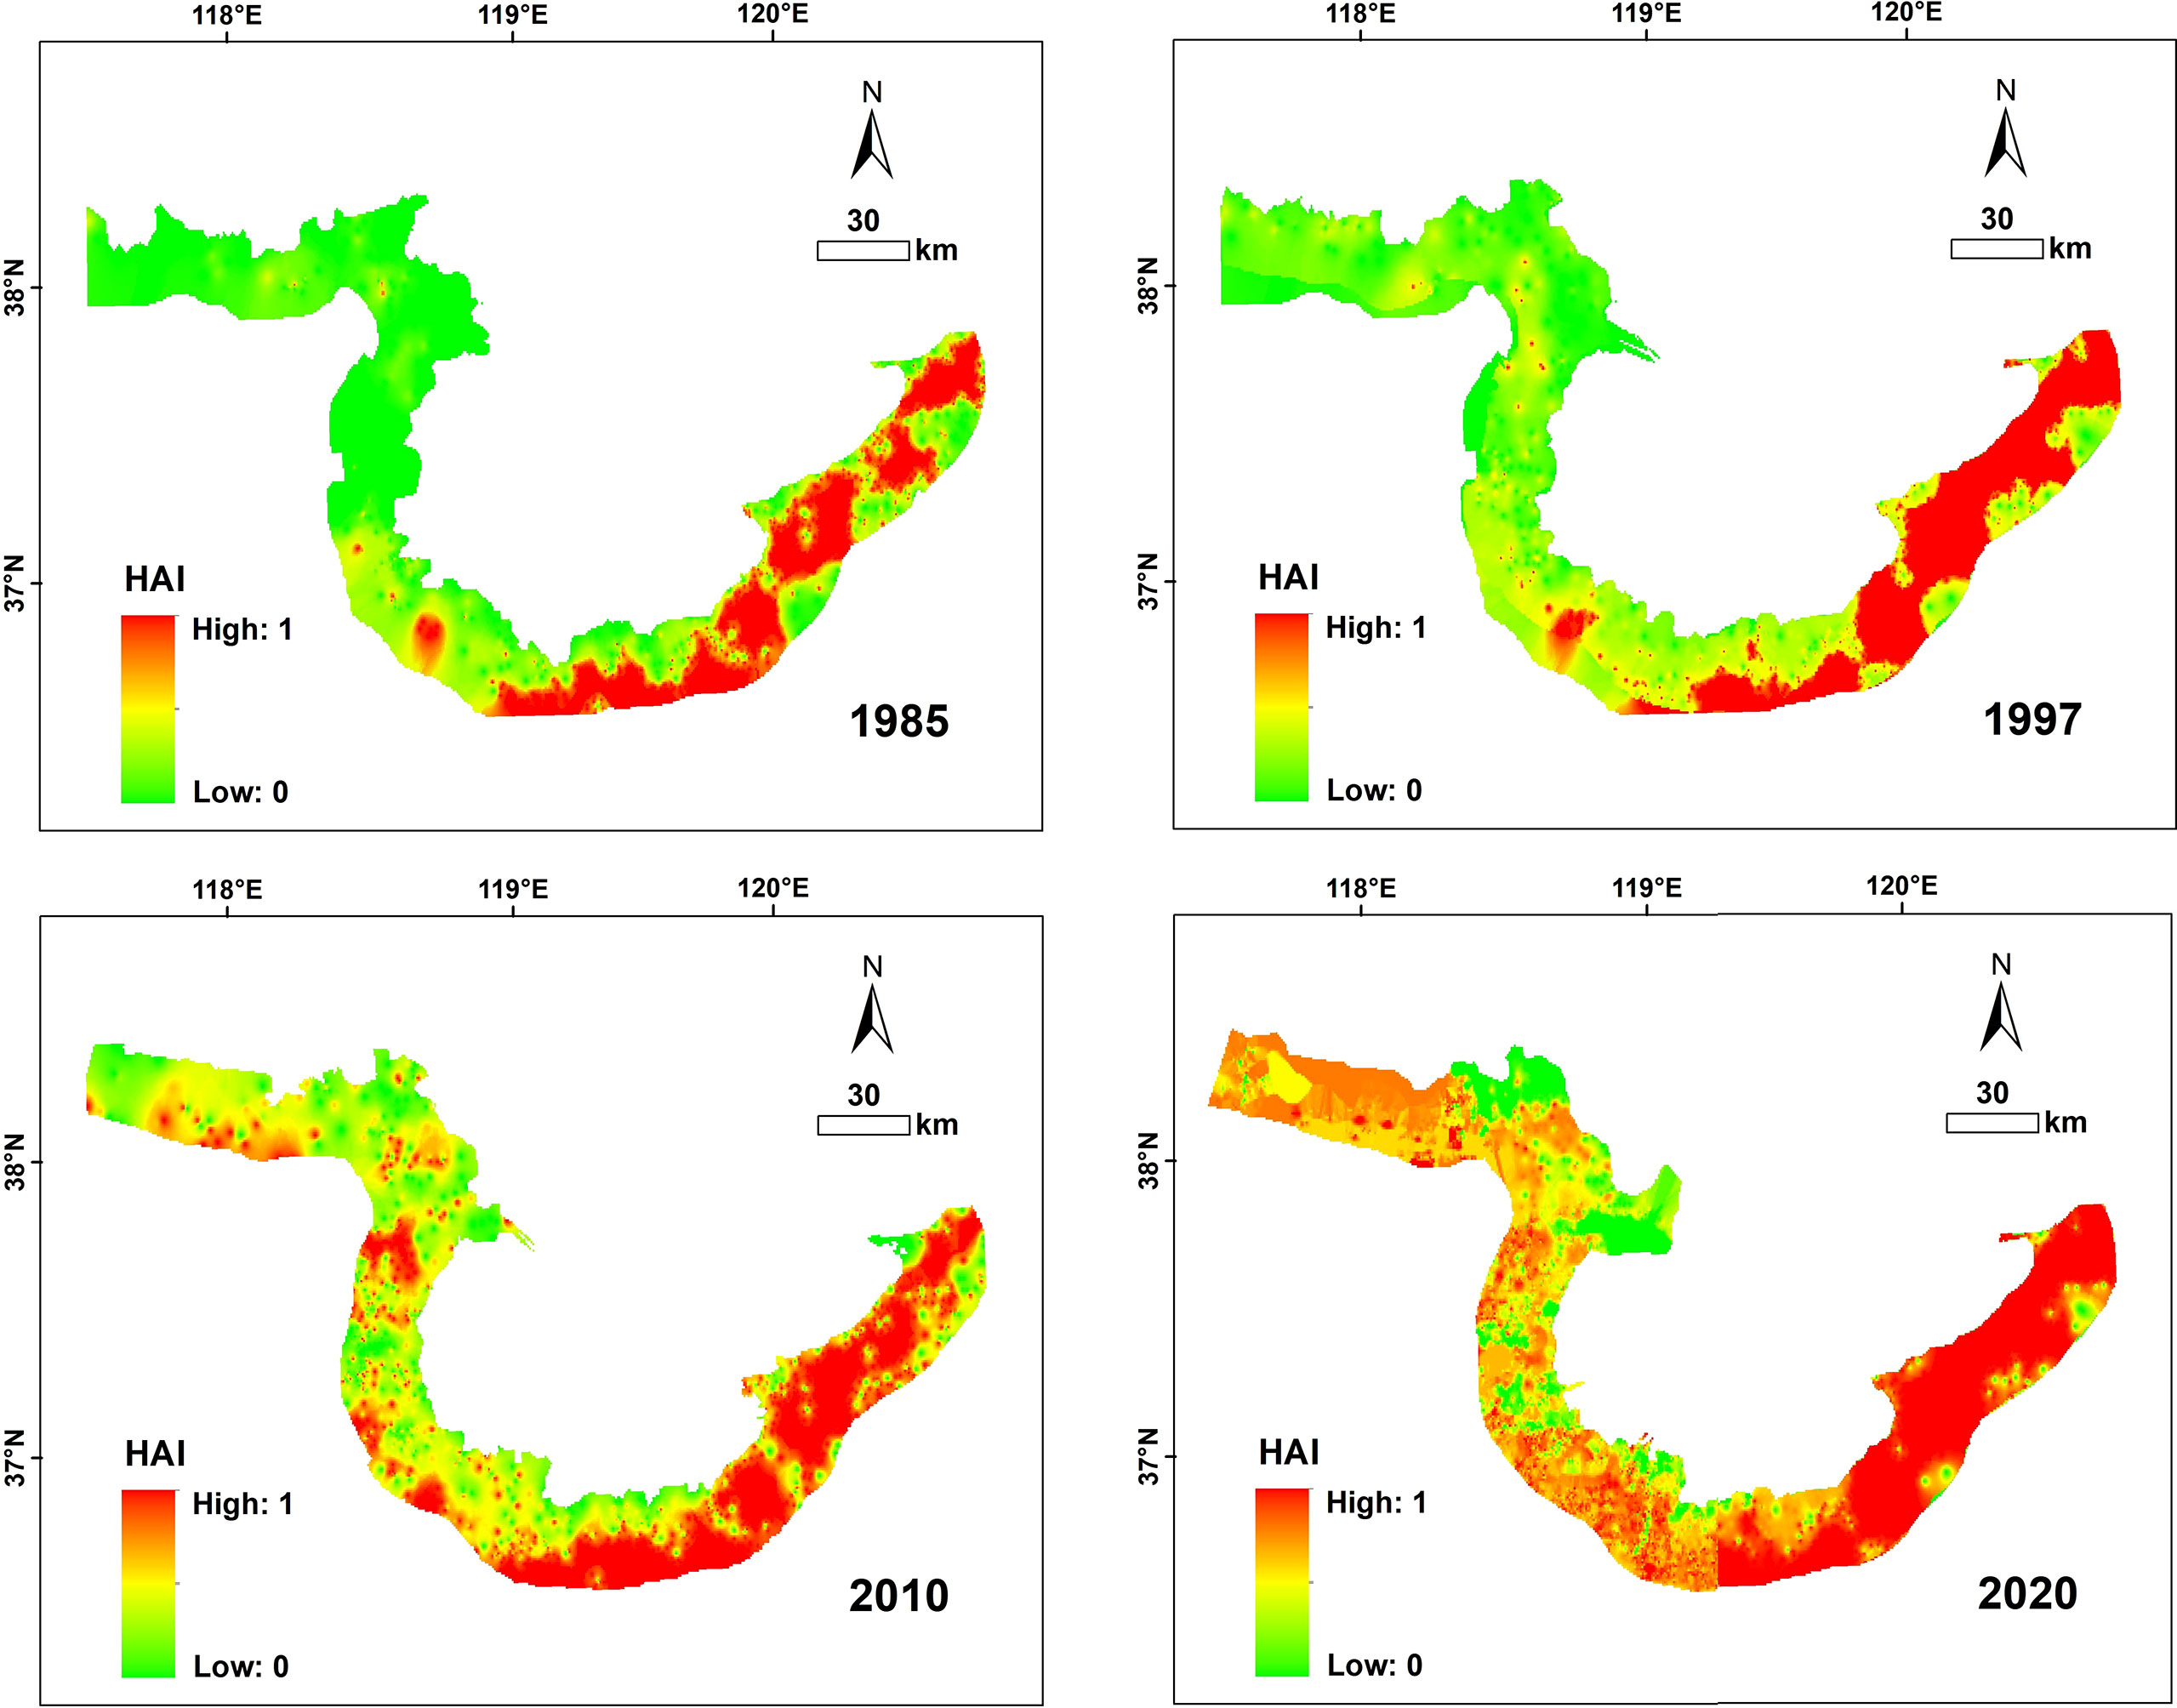
Figure 8 Temporal-spatial evolution of HAI from 1985 to 2020.
3.3 SoVI
The SoVIs of the 5 cities involved in the study area are then calculated with the socio-economic data. (Figures 9) shows the distribution of SoVI and those of the 7 second level indexes over the five cities. The overall SoVI of the study area in 2020 is 0.49, suggesting that the area is moderately vulnerable. The SoVI of Weifang City is the highest with the value of 0.84 and that of Dongying City is the lowest (0.32). Yantai City is ranked the second highest with the SoVI of 0.51, followed closely by Binzhou City (0.41) and Qingdao City (0.40). The score of each secondary index is calculated with the normalization Eq. (5). Weifang City is scored the highest in health institution and the number of telephone subscribers, which explains its high vulnerability. The index sores of Dongying City are low in population under age 14 and over age 60, hospitals beds, and number of mobile telephone subscribers, suggesting its low vulnerability, which is consistent with its low SoVI. The relatively high SoVI of Yantai City can be attributed to its high scores in the indexes of population density and number of telephone subscribers.
3.4 Overall assessment
The CVI and SoVI of the entire study area in 2020 are 4.1 and 0.49, respectively, with distinct spatial heterogeneity, which both are classified as moderate vulnerability. The overall HAI is determined to be 0.74, suggesting that the area is highly vulnerable. In terms of the specific regions, the CVI of Yantai City is the highest and the SoVI of Weifang City is the highest. Both cities show very high HAIs. Figure 5, Figure 8 and Figure 9 summarize the spatial-temporal changes in the CVI, HAI and SoVI of SCBHS. In the spatial scale, the CVI values along most parts of the coastline are low, except for the western coastline of the Laizhou Bay that is the most vulnerable to the impact of natural hazard. Yantai City shows the highest score of SoVI, which is highly vulnerable to coastal flooding.
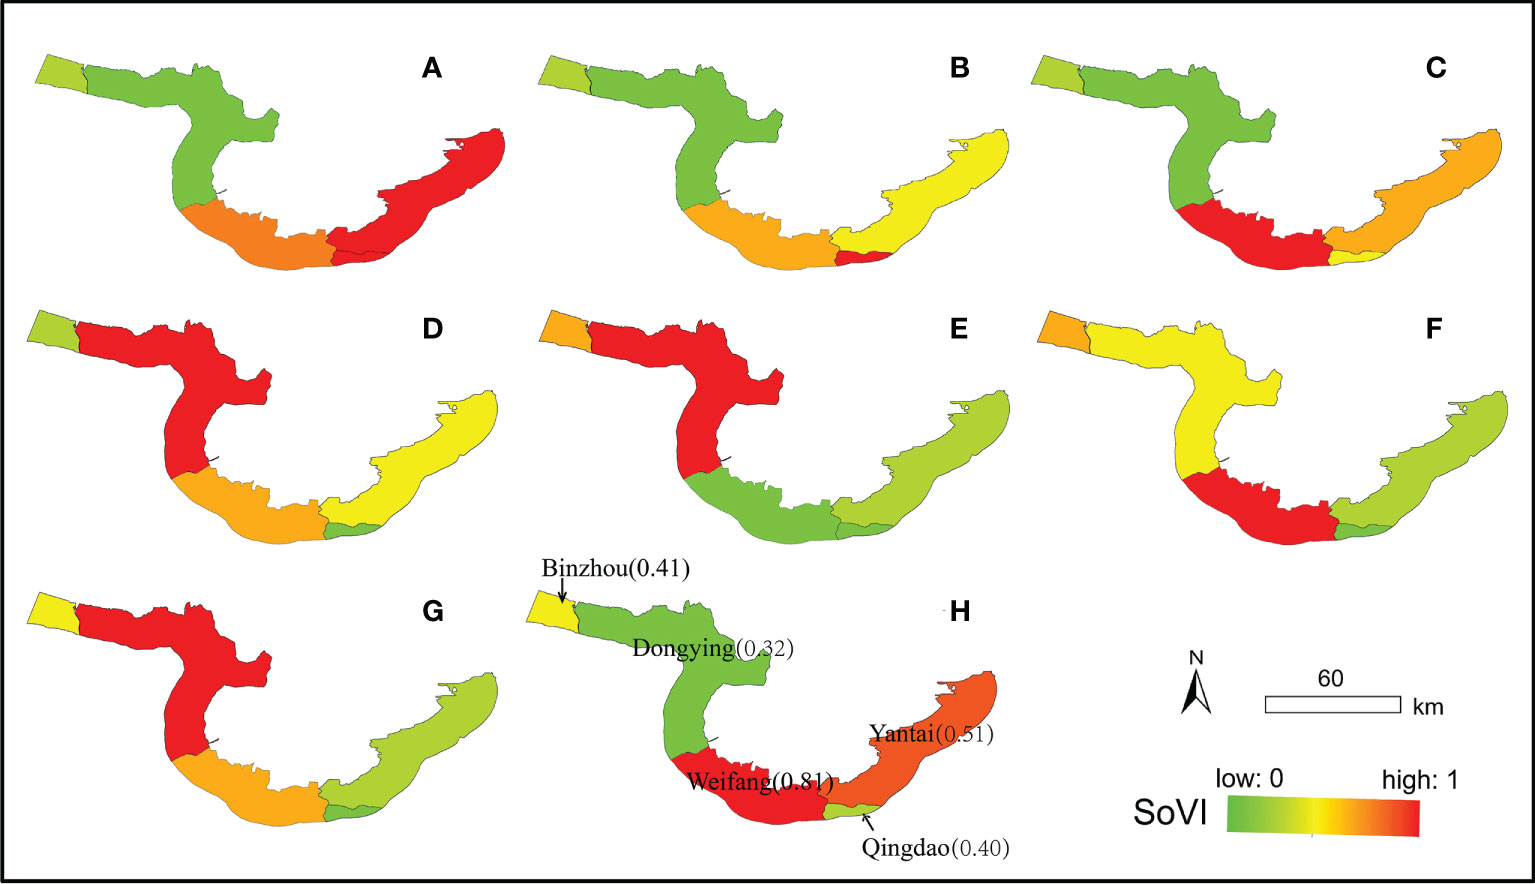
Figure 9 Social vulnerability score per index in 2020: (A) I8: percentage of people under age 14 and over age 60; (B) I9: population density; (C) I10: average number of mobile telephone subscribers per people; (D) I11: average number of internet broad band subscribers per people; (E) I12: average number of participated in social insurance per people; (F) I13: number of health institutions per square kilometers; (G) I14: number of hospitals beds per square kilometers; and (H) SoVI.
4 Discussion
4.1 CVI model validation
The natural hazard susceptibility of SCBHS is characterized by a comparative spatial assessment of the regional response to coastal hazards using a modified CVI model that integrates the changes in reclamation activities, coastline and hydrodynamics between 1985 and 2020. The modeling reveals that the M2 amplitude constituent in the northern coast of Yellow River Estuary increased by 20 cm-40 cm, consistent with the results of previous studies (Pelling et al., 2013). The increases in M2 amplitude constituent mostly occur around the coastline, and thus are directly related to mean tidal range (I7). In addition, the CVI assessment results of the studied area are compared with the coastal natural hazard index under current sea level scenario published by Sajjad et al. (2018) over the same period. Sajjad et al. predicated that the eastern coast region of the Laizhou Bay would meet the high-risk criteria by 2020. Their simulated CVI values in the SCBHS are also similar to our modeling results, except that their predicated values of the northern coast of Yellow River Estuary are generally greater possibly due to insufficient evaluation of the numerical tidal model.
4.2 Interactions among HAI, CVI and SoVI
The recent severe storm surges and occurrence of extensive floods that cause numerous casualties and significant economic losses in the SCBHS have reignited the need to understand the risks resulting from the intersection of vulnerable populations and marine hazards (Wang et al., 2018). It has been evidenced that the populations with higher social vulnerabilities, such as low-income and less support from social security and communication technology (insurance, mobile phone and internet), disproportionally suffer from the impacts of natural hazards. Therefore, our study includes these indexes to portray the dynamic representation of risks from natural hazards that affect local social vulnerability.
The CVI modeling indicates that the CVI of SCBHS has been increasing from 1985 to 2020, and the increasing trend is related to the HAI in the area. With the acceleration of human activities, such as industrialization and urbanization, large areas of natural wetlands are occupied by aquaculture pond, saltern, and building land in the south coast of the Laizhou Bay, which destructs natural habitats and results in the higher CVIs. Natural habitats, such as marshes, coastal dunes, and so on, play a vital role in resisting the impacts of coastal hazards that erode shorelines and harm coastal communities. Low revetments and seawalls are classified as highly vulnerable as they have limited abilities in preventing inundation and may fail during extreme events (Gornitz, 1990).
The second influencing factor to be considered is storm surge in the area. Studies have confirmed the significant inter-decadal variations of storm in the Bohai Sea, and the extreme storm surge events have been intensifying since 2010 (Feng et al., 2018). The visualization of the spatial distributions of HAI and SoVI facilitates the identification of the critical areas where disaster risks tend to increase drastically, and potential hazard events are likely to occur in the future. It is found in our study that the building land area in the north coast of Yantai City has dramatically expanded, and its exposure to storm surge risk has been increasing, which challenges the habitat stability of the surrounding areas.
The coastal region is a complex area with land-ocean interactions. Changes in coastline and artificial reclamation, as well as coastal landscape, can intensify marine hazards. The relationships of coastal land, offshore areas, and the ocean should be considered in the coastal vulnerability assessment, and it is necessary to study the human activities, natural processes, and social-economic aspects as one system. Attentions should be particularly paid to the coastal development regulation in disaster risk management and control. Understanding and identifying the populations vulnerable to natural hazard risks can improve future mitigation measures and reduce potential impacts of natural disasters.
4.3 Implications for coastal management
By providing a relative ranking of coastal areas in terms of CVI, the outcome of this study can be used by the coastal managers to define and prioritize risk management and adaptation measures. First, banning destructive economic activities and coastal development can improve the restoration of coastal natural habitats in the SCBHS. Second, man-made engineering structures, such as sea dikes, breakwaters, and spur dams, should be constructed along the western coast of the Laizhou Bay. For the CVI assessment model, dams are undoubtedly stronger for the resistance to marine hazards than rocks and high cliffs. Third, the coastal projects should be regulated to cause minimum changes in tidal regime and thus lower flood risk. Importantly, the most stringent management and control measures should be implemented on reclamation projects in the future.
By providing a relative ranking of coastal areas in terms of the SoVI, the outcome of this study can be used by the coastal managers to understand the underlying social, economic, and political context, and consequently address the factors that increase risk and vulnerability of the area. Based on the regional assessment, special attentions should be paid to the most vulnerable study units including Yantai City and Weifang City, as well as the identification of the driven indexes of the social vulnerability. By gradually bridging the gap between rural and urban areas in income, social and medical service levels, overall societal vulnerability is likely to be reduced (Chen et al., 2014).
5 Conclusion
Our study has made the following contributions: 1) An InVEST coastal vulnerability model including the influences of human activities is put forward; 2) the changes in coastline and hydrodynamics caused by reclamations are integrated into the model. 3) The spatial interactions between natural hazards and social vulnerability in the south coast of Bohai Sea are revealed.
The comprehensive evaluation of the vulnerability of SCBHS suggests that: 1) Coastal reclamation changes the coastline position and alters marine hydrodynamics, which influences the CVI; 2) The rapid coastal urbanization increases the artificial landscape area and causes high HAIs, which results in irreversible natural-hazard risks and thus increases the CVI; 3) The spatial distributions of HAI and SoVI obtained in this study can help to identify the critical locations where natural hazards related disasters likely occur and potentially cause great losses in the future.
Data availability statement
The original contributions presented in the study are included in the article/Supplementary Material. Further inquiries can be directed to the corresponding authors.
Author contributions
JL: Conceptualization, Data curation, Formal analysis, Investigation, Methodology, Software, Validation, Visualization, Writing - original draft, Writing - review & editing. YZ: Data curation, Formal analysis, Methodology, Supervision, Visualization. HS: Conceptualization, Funding acquisition, Methodology, Project administration, Resources. XL: Formal analysis, Methodology, Writing - review & editing, Project administration, Resources. All authors contributed to the article and approved the submitted version.
Funding
This study is supported by the National Natural Science Foundation of China (No.U1806214 & No.51779048) and the National Key Research and Development Program of China (No. 2018YFD0900806).
Conflict of interest
The authors declare that the research was conducted in the absence of any commercial or financial relationships that could be construed as a potential conflict of interest.
Publisher’s note
All claims expressed in this article are solely those of the authors and do not necessarily represent those of their affiliated organizations, or those of the publisher, the editors and the reviewers. Any product that may be evaluated in this article, or claim that may be made by its manufacturer, is not guaranteed or endorsed by the publisher.
Supplementary material
The Supplementary Material for this article can be found online at: https://www.frontiersin.org/articles/10.3389/fmars.2022.1015781/full#supplementary-material
References
Arkema K. K., Guannel G., Verutes G., Wood S. A., Silver J. M. (2013). Coastal habitats shield people and property from sea-level rise and storms. Nat. Climate Change 3, 913–918. doi: 10.1038/nclimate1944
Boruff B. J., Cutter S. L. (2007). The environmental vulnerability of Caribbean island nations. Geograph. Review. 97 (1), 24–45. doi: 10.1111/j.1931-0846.2007.tb00278.x
Chen W., Cutter S. L., Emrich C. T., Shi P. (2014). Measuring social vulnerability to natural hazards in the Yangtze River Delta region, China. Int. J. Disaster Risk Sci. 4, 169–81. doi: 10.1007/s13753-013-0018-6
Cheng Y., Lv X. Q., Liu Y. G., Xu Q. (2007). Application of adjoint assimilation technique in simulating tides and tidal currents of the bohai Sea, the yellow Sea and the East China Sea. High Technol. Newslett. 13 (1), 7. (in Chinese with English abstract)
Chi Y., Shi H. H., Sun J. K., Li J., Yang F., Fu Z. Y. (2017). The temporal and spatial characteristics and main influencing factors of vegetation net primary productivity of the yellow river delta in recent 30 years. Acta Ecol. Sin. 38 (08), 82–96. doi: 10.5846/stxb201705301000
Chi Y., Shi H., Zheng W., Sun J., Fu Z. (2018a). Spatiotemporal characteristics and ecological effects of the human interference index of the yellow river delta in the last 30 years. Ecol. Indicators. 89, 880–892. doi: 10.1016/j.ecolind.2017.12.025
Chi Y., Zheng W., SHI H. H., Sun J. K., Fu Z. Y. (2018b). Spatial heterogeneity of estuarine wetland ecosystem health influenced by complex natural and anthropogenic factors. Sci. Tot. Environ. 634, 1445–1462. doi: 10.1016/j.scitotenv.2018.04.085
Feng J., Li D., Li Y., Liu Q., Wang A. (2018). Storm surge variation along the coast of the Bohai Sea. Sci. Rep. 8, 11309. doi: 10.1038/s41598-018-29712-z
Feng Z., Zhang J., Hou W., Zai L. (2017). Dynamic changes of hemeroby degree based on the land cover classifcation: A case study in Beijing. Chin. J. Ecol. 36 (2), 508–516.
Gornitz V. (1990). Vulnerability of the east coast, U.S.A. to future sea level rise. J. Coast. Res. 9, 201–237. doi: 10.2307/44868636
Gornitz V. M., Beaty T. W., Daniels R. C. (1997). A coastal hazards database for the U.S. West coast. ORNL/CDIAC-81, NDP-043C (Oak Ridge, Tennessee: Oak Ridge National Laboratory).
Hammar K., Thieler E. R. (2001). “Coastal vulnerability to Sea-level rise,” in A preliminary database for the U.S. Atlantic, pacific, and gulf of Mexico coasts. U.S (Denver, CO: Geological Survey, Digital Data Series DDS-68, 1 CD-ROM).
He Y., Lu X., Qiu Z., Zhao J. (2004). Shallow water tidal constituents in the bohai Sea and the yellow Sea from a numerical adjoint model with TOPEX/POSEIDON altimeter data. Cont. Shelf Res. 24, 1521–1529. doi: 10.1016/j.csr.2004.05.008
Holand I. S., Lujala P. (2013). Replicating and adapting an index of social vulnerability to a new context: A comparison study for Norway. Prof. Geographer. 65 (2), 312–328. doi: 10.1080/00330124.2012.681509
Huang M., Xia C., Li Y., Zeng C., Zhang B. (2022). Coupling responses of landscape pattern to human activity and their drivers in the hinterland of three gorges reservoir area. Global Ecol. Conserv. 33, e01992. doi: 10.1016/j.gecco.2021.e01992
IPCC (2013). “Climate change 2013: The physical science basis,” in Contribution of working group I to the fifth assessment report of the intergovernmental panel on climate change. Eds. F.Stocker T., Qin D., Plattner G.-K., Tignor M., Allen S. K., Boschung J., Nauels A., Xia Y., Bex V., Midgley P. M. (Cambridge, United Kingdom and New York, NY, USA: Cambridge University Press).
Jiang T., Wu G., Niu P. L., Cui Z. G., Bian X. D., Xie Y. X., et al. (2022). Short-term changes in algal blooms and phytoplankton community after the passage of super typhoon lekima in a temperate and inner sea (Bohai Sea) in China. Ecotoxicol Environ. Saf. 232, 113223. doi: 10.1016/j.ecoenv.2022.113223
Jiang S., Xu N., Li Z., Huang C. (2021). Satellite derived coastal reclamation expansion in China since the 21st century. Global Ecol. Conserv. 30, e01797. doi: 10.1016/j.gecco.2021.e01797
Jin Y., Yang W., Sun T., Yang Z., Li M. (2016). Effects of seashore reclamation activities on the health of wetland ecosystems: A case study in the yellow river delta, China. Ocean Coast. Manage. 123, 44–52. doi: 10.1016/j.ocecoaman.2016.01.013
Koks E. E., Jongman B., Husby T. G., Botzen W. J. W. (2015). Combining hazard, exposure and social vulnerability to provide lessons for food risk management. Environ. Sci. Policy 47, 42–52. doi: 10.1016/j.envsci.2014.10.013
Koroglu A., Ranasinghe R., Jiménez J., Ali D. (2019). Comparison of coastal vulnerability index applications for Barcelona province. Ocean Coast. Manag. 178, 104799. doi: 10.1016/j.ocecoaman.2019.05.001
Liu S., Liu L., Wu X., Hou X., Zhao S., Liu G. (2018). Quantitative evaluation of human activity intensity on the regional ecological impact studie. Acta Ecol. Sin. 38 (19), 6797–6809. doi: 10.5846/stxb201711172048
Lu X. Q., Zhang J. C. (2006). Numerical study on spatially varying bottom friction coefficient of a 2D tidal model with adjoint method. Cont. Shelf Res. 26, 1905–1923. doi: 10.1016/j.csr.2006.06.007
Mesta C., Cremen G., Galasso C. (2022). Urban growth modelling and social vulnerability assessment for a hazardous Kathmandu valley. Sci. Rep. 12, 6152. doi: 10.1038/s41598-022-09347-x
Nature, International Union for Conservation of, and Natural Resources, Ramsar Convention Bureau (1984). Convention on Wetlands of International Importance especially as Waterfowl Habitat. Proceedings of the second conference of the contracting parties, Groningen, Netherlands, 1984, 7–12.
Pan H. D., Wang Y. Z., Lv X. Q. (2021). The study of the trends of tidal amplitudes of major constituents in the south China Sea. Hai yang Xuebao 43 (6), 26–34. doi: 10.12284/hyxb2021096
Pelling H. E., Uehara K., Green J. A. M. (2013). The impact of rapid coastline changes and sea level rise on the tides in the bohai Sea, China. J. Geophys. Res.: Oceans. 118, 3462–3472. doi: 10.1002/jgrc.20258
Peng F., Han Z. L. (2013). Characteristics of climate change in coastal cities around the bohai Sea and their responses to urban development. Mar. Dev. Manage. 11, 30–34. doi: 10.3969/j.issn.1005-9857.2013.11.008
Sajjad M., Li Y. F., Tang Z. H., Cao L., Liu X. P. (2018). Assessing hazard vulnerability, habitat conservation and restoration for the enhancement of china’s coastal resilience. Earths Future. 6 (3), 326–338. doi: 10.1002/2017EF000676
Shandong Statistical Yearbook (2021) Shandong Provincial bureau of statistics. Available at: http://tjj.shandong.gov.cn.
Shi H. H., Lu J. F., Zheng W., Sun J., Li J., Guo Z., et al. (2020). Evaluation system of coastal wetland ecological vulnerability under the synergetic influence of land and sea: A case study in the yellow river delta, China. Mar. pollut. Bulletin. 161, 111735. doi: 10.1016/j.marpolbul.2020.111735
Shi H. H., Yu D. L., Yin L. T., Sui Y. D., Liu Y. Z., Qiao S. Q., et al. (2022). Source-sink process of microplastics in watershed-estuary-offshore system. J. Cleaner Prod. 338, 130612. doi: 10.1016/j.jclepro.2022.130612
Siagian T. H., Purhadi P., Suhartono S., Ritonga H. (2013). Social vulnerability to natural hazards in Indonesia: driving factors and policy implications. Natural Hazards. 70, 1603–1617. doi: 10.1007/s11069-013-0888-3
Sodhi M. S. (2016). Natural disasters, the economy and population vulnerability as a vicious cycle with exogenous hazards. J. Operations Manag. 45, 101–113. doi: 10.1016/j.jom.2016.05.010
Sun T., Lin W., Chen G., Guo P., Zeng Y. (2016). Wetland ecosystem health assessment through integrating remote sensing and inventory data with an assessment model for the hangzhou bay, China. Sci. Total Env. 566–567, 627–640. doi: 10.1016/j.scitotenv.2016.05.028
Thieler E. R., Himmelstoss E. A., Zichichi J. L., Ergul A. (2009) The digital shoreline analysis system (DSAS) version 4.0-an ArcGIS extension for calculating shoreline change. Available at: http://woodshole.er.usgs.gov/projectpages/DSAS/version4/index.html.
Wang C., Cai L., Wu Y., Ouyang Y. (2021). Numerical simulation of the impact of an integrated renovation project on the maowei Sea hydrodynamic environment. Sci. Rep. 11, 17059. doi: 10.1038/s41598-021-96441-1
Wang Y., Mao X., Jiang W. (2018). Long-term hazard analysis of destructive storm surges using the ADCIRC- SWAN model: A case study of bohai Sea, China. Int. J. Appl. Earth Observation Geoinformat. 73, 52–62. doi: 10.1016/j.jag.2018.03.013
Wen Y. (1998). Preliminary discussion on quantitative evaluation method of human activity intensity. Science and Society. (Beijing: University of Posts and Telecommunications Press), 56–61.
Xu Y., Sun X., Tang Q. (2015). Human activity intensity of land surface: concept, method and application in China. J. Geogr. Sci. 70 (7), 1068–1079. doi: 10.1007/s11442-016-1331-y
Yang F., Li J., Wang J., Huang J., Zhao L. (2021). Spatiotemporal characteristics of human activity on coastal landscape of laizhou bay. Wetlands Ecol. Manage. 29, 789–808. doi: 10.1007/s11273-021-09810-y
Zhou Y., Varquez A. C. G., Kanda M. (2019). High-resolution global urban growth projection based on multiple applications of the SLEUTH urban growth model. Sci. Data. 6, 34–34. doi: 10.1038/s41597-019-0048-z
Keywords: coastal vulnerability index, reclamation, hazards, hydrodynamic environment, coastline change
Citation: Lu J, Zhang Y, Shi H and Lv X (2022) Coastal vulnerability modelling and social vulnerability assessment under anthropogenic impacts. Front. Mar. Sci. 9:1015781. doi: 10.3389/fmars.2022.1015781
Received: 10 August 2022; Accepted: 22 September 2022;
Published: 14 October 2022.
Edited by:
Qiang He, Fudan University, ChinaCopyright © 2022 Lu, Zhang, Shi and Lv. This is an open-access article distributed under the terms of the Creative Commons Attribution License (CC BY). The use, distribution or reproduction in other forums is permitted, provided the original author(s) and the copyright owner(s) are credited and that the original publication in this journal is cited, in accordance with accepted academic practice. No use, distribution or reproduction is permitted which does not comply with these terms.
*Correspondence: Honghua Shi, c2hpaG9uZ2h1YUBmaW8ub3JnLmNu; Xianqing Lv, eHFpbmdsdkBvdWMuZWR1LmNu