 Shenyang Shi
 Yi Xu
Yi Xu Weiqi Li
 Jianzhong Ge
95% of researchers rate our articles as excellent or good
Learn more about the work of our research integrity team to safeguard the quality of each article we publish.
Find out more
ORIGINAL RESEARCH article
Front. Mar. Sci. , 17 October 2022
Sec. Marine Biogeochemistry
Volume 9 - 2022 | https://doi.org/10.3389/fmars.2022.1012127
This article is part of the Research Topic Multi-scale Variability of Ecosystem Functioning in European and Chinese Shelf Seas View all 16 articles
The riverine nutrient inputs to the ocean reflects land-use changes and can affect the health of coastal environments over time, especially for a highly-anthropogenically influenced river-estuary-shelf system. To investigate the impact of riverine inputs on the Changjiang Estuary ecosystem at a multi-decadal time scale where long-term observations are limited, we built a three-dimensional physics-biogeochemistry-coupled model system based on the Finite-Volume Community Ocean Model (FVCOM) and the European Regional Shelf Ecosystem Model (ERSEM). Our model successfully simulated the temporal and spatial nutrient variabilities in the river-estuary-shelf con7tinuum from 1960 to 2018. The results showed increasing trends of nitrate and phosphate and fluctuating silicate variability, thereby leading to rising nitrogen (N) to phosphorus (P) ratios and decreasing silicon (Si) to N and P ratios. Such changes in the stoichiometric relationship of nutrient species also alter the community structure of the primary producers in estuaries. Our model showed a general increase of diatoms over the 59 years, corresponding to decreased proportions of micro-phytoplankton and pico- phytoplankton. With different backgrounds of light and nutrient limitations in the river and inner shelf, our model suggests that the trend of the diatom proportion in the light-limited river mouth is more associated with silicate variability, with decreased diatom proportions occurring in the 2000s. Our model relates the hydroclimate, nutrient load, and biogeochemical cycling, reproducing estuarine ecosystem variability and clarifying issues such as the causality of the ecosystem interactions.
Human civilization originated in areas around large rivers; the ecological environment of rivers and estuaries is closely related to human life. Agriculture and industry developed rapidly after the Second World War, leading to extensive use of fertilizers and detergents (Bennett et al., 2001; Galloway and Cowling, 2002; Duan et al., 2007). Disposal of sewage and wastewater has caused the water quality of rivers and estuaries to deteriorate. While pollution accumulates in rivers, estuaries are influenced by both point and non-point pollution sources, which has changed such ecosystems significantly in the last century (Rabalais et al., 2009; Wang et al., 2013; Powers et al., 2015; Dai et al., 2016). Large rivers are essential in this terrestrial-estuary linkage. Therefore, anthropogenic perturbations inevitably affect rivers, and so are estuaries (Howarth et al., 2000; Scavia et al., 2000; Howarth and Marino, 2006; Bricker et al., 2008; Oviatt et al., 2017). To some degree, nutrients and phytoplankton can be indicators of productivity and ecological health of estuaries (Glé et al., 2008; Enawgaw and Lemma, 2018). Over the past few decades, many large estuaries around the world have experienced dramatic ecological changes. In North America, the Mississippi River has shown a drastic increase in nitrogen and phosphorus since the 1950s, with dissolved inorganic nitrogen (DIN) and total phosphorus frequently exceeding 150 μM and 7 μM, respectively during the 1980s (Lohrenz et al., 2008), and riverine silicon has decreased since 1960 because of the stimulation and burial of freshwater diatoms (Rabalais et al., 1996; Houser et al., 2010; Leong et al., 2014). Therefore, the nutrient ratio and phytoplankton species composition in the coastal area of the Mississippi River has changed (Dortch et al., 2001; Smits et al., 2019; Stackpoole et al., 2021). In Europe, the nutrient concentration in the Scheldt Estuary increased significantly from 1965 to the mid-1970s and decreased from 1980 to 2002, which was positively correlated with the river discharge. Because of the difference in nutrient change ratios, the function of the estuary has shifted from a net nitrate producer to a net consumer (Soetaert et al., 2006; Middelburg et al., 2011).
The Changjiang Basin is 1.8 million square kilometers in total, accounting for 18.8% of China’s land area (Zheng et al., 2020). It has abundant natural resources and is the most densely populated area in China. Like other giant rivers and estuaries, anthropogenic activities significantly affect the Changjiang Basin and estuary (Huang et al., 2001; Chen et al., 2015; Xu et al., 2015; Dai et al., 2016). Many studies have focused on ecosystem changes in the Changjiang Estuary, including eutrophication, nutrient stoichiometry, and a regime shift. Hydraulic engineering and wastewater discharge are considered as a critical factor impacting the Changjiang Estuary ecosystem during the past few years (Yang et al., 2006; Gao and Wang, 2008; Dai et al., 2011; Li et al., 2015). As of 2018, over 50,000 dams have been built in the Changjiang Basin. These dams mediate water volume and mitigate floods while decreasing sediment discharge to approximately 140 Mt/y (Dai et al., 2008; Hu et al., 2009; Yang et al., 2018b). Concurrently, dissolved silicate has decreased by 30% from the 1960s to the 2000s due to large amounts of sediment trapping by the dams (Dai et al., 2011; Wang et al., 2018). Agriculture and industry began to develop in the 1960s, drastically increasing nitrate and phosphate loads which are associated with fertilizer usage and domestic sewage (Xing and Zhu, 2002; Duan et al., 2007; Zhou et al., 2008; Yan et al., 2010; Liang and Xian, 2018). From the 1960s to the 1990s, the amount of nitrogen fertilizer rapidly increased 15-fold from 1.0×10⁸ kg to 1.50×10⁹ kg, and phosphorus fertilizer increased approximately 12-fold from 4×10⁷ kg to 5.0×10⁹ kg (Duan et al., 2000; Duan et al., 2007; Shen and Liu, 2009; Shen et al., 2020). The use of nitrogen and phosphorus fertilizer still increased steadily after 1990s (Liu et al., 2022). As a result, the DIN concentration increased threefold, and the concentrations of dissolved inorganic phosphorus (DIP) and dissolved organic phosphorus increased by 30% (Yu et al., 2012; Liu, 2017). Because of the different nutrient loading rates, the N: P: Si ratio has changed (Jiang et al., 2014). For example, the N/P ratio was ~30-40 in the early 1960s, and it was reported to reach 103 and 268 in 1985 and 1997, respectively (Gu et al., 1981; Wong et al., 1998; Shen and Liu, 2009); a factor of 17-fold greater than the Redfield ratio (Si:N:P: ~16:16:1). The increased input of N and P into an estuary can result in eutrophication, directly or indirectly linked to harmful algal blooms (Wang, 2006; Shen and Liu, 2009) and hypoxia (Wang et al., 2016a). Concerning the bloom frequency in the Changjiang Estuary, diatom blooms have decreased due to silicate trapping. Dinoflagellate blooms tend to be more frequent because of nutrient increases (Jiang et al., 2014).
Our knowledge of the Changjiang nutrient flux is essentially based on hydrographic data measured at river gauge stations, which are usually located upstream (Zhang et al., 2021). How these riverine nutrients are processed downstream and their contribution to the estuary ecosystem over a longer time scale are poorly understood. The times and places of the existing studies of Changjiang Estuary are limited (Li et al., 2007; Zhou et al., 2008; Jiang et al., 2014; Yang et al., 2015; Luan et al., 2016; Jiang et al., 2017; Jiang et al., 2018a). Available studies mostly used sediment core sampling and satellite datasets (Henson et al., 2010; Jin et al., 2010; Cheng et al., 2014; Zhu et al., 2014; Chen et al., 2017; Zhang et al., 2021). Therefore, the data based on riverine hydrographic stations and dispersed sampling could be biased concerning the seaward river fluxes and the ratios of nutrient species related to estuary ecosystem dynamics (Zhang et al., 2021).
Numerical models coupled with physical and biogeochemical dynamics are an effective way to improve our understanding of the impact of riverine nutrient inputs on ecosystem function in this land-sea boundary. Different models have been developed to compensate for the lack of empirical data and study how ecosystems respond to environmental changes (Riley, 1949; Fasham et al., 1990; Sarmiento et al., 1993; Franks and Chen, 2001; Spitz, 2003; Gruber et al., 2006). In Ge et al. (2020a), the Finite-Volume Community Ocean Model (FVCOM) and the European Regional Shelf Ecosystem Model (ERSEM), was used to study the effect of offshore sediment front on seasonal marine ecosystem dynamics; the interannual variability of nutrient and phytoplankton in the Changjiang Estuary and shelf from 1999 to 2017 were discussed based on this model in Ge et al. (2020a). However, none of these studies involved simulations on a multi-decadal scale. In this study, based on a delicate grid design that can refine different spatial scale from the river channel to the estuary and the shelf, we used the same FVCOM and ERSEM coupled model to simulate long-term (59 years) variations of major ecosystem components along the Changjiang Estuary, with the objectives of (1) presenting the historical state, including the temporal and spatial distribution of nutrients in the river-estuary-shelf continuum; (2) investigating when and where the phytoplankton communities have changed in the estuary and inner shelf and how these changes relate to the trends of nutrient variability. For this study, we hope to use the coupled model driven by long-term empirical upstream nutrient data to assess the present state of the Changjiang Estuary and compare it to previous states.
Our study area included the downstream of the Changjiang Basin, west of Datong (DT) station, to the east at 124°E, representing a continuum of river channel, river mouth, and inner shelf (Figure 1). Regarding river discharge, we only considered the Changjiang River, the fourth largest river in the world (Milliman and Farnsworth, 2011), originates in the Qinghai-Tibet Plateau (Wang et al., 2016b), flows through 19 provinces, and then into the East China Sea (Figure 1A). Until the end of the twentieth century, DT (Figure 1A) was still the most downstream hydrographic station in the Changjiang Basin. River discharge used in this study was collected at DT (Figure 1A) (http://xy.cjh.com.cn/). Nutrient data at the DT station and nearby sites were collected from different sources, i.e., previous studies conducted from 1960 to 2019 (Dai et al., 2011; Gao et al., 2012; Zhu et al., 2014; Li et al., 2021), and our own measurements made since 2013 (Ge et al., 2020a; Ge et al., 2020b; Ge et al., 2021). A detailed description of the nutrient sources can be found in Table 1.
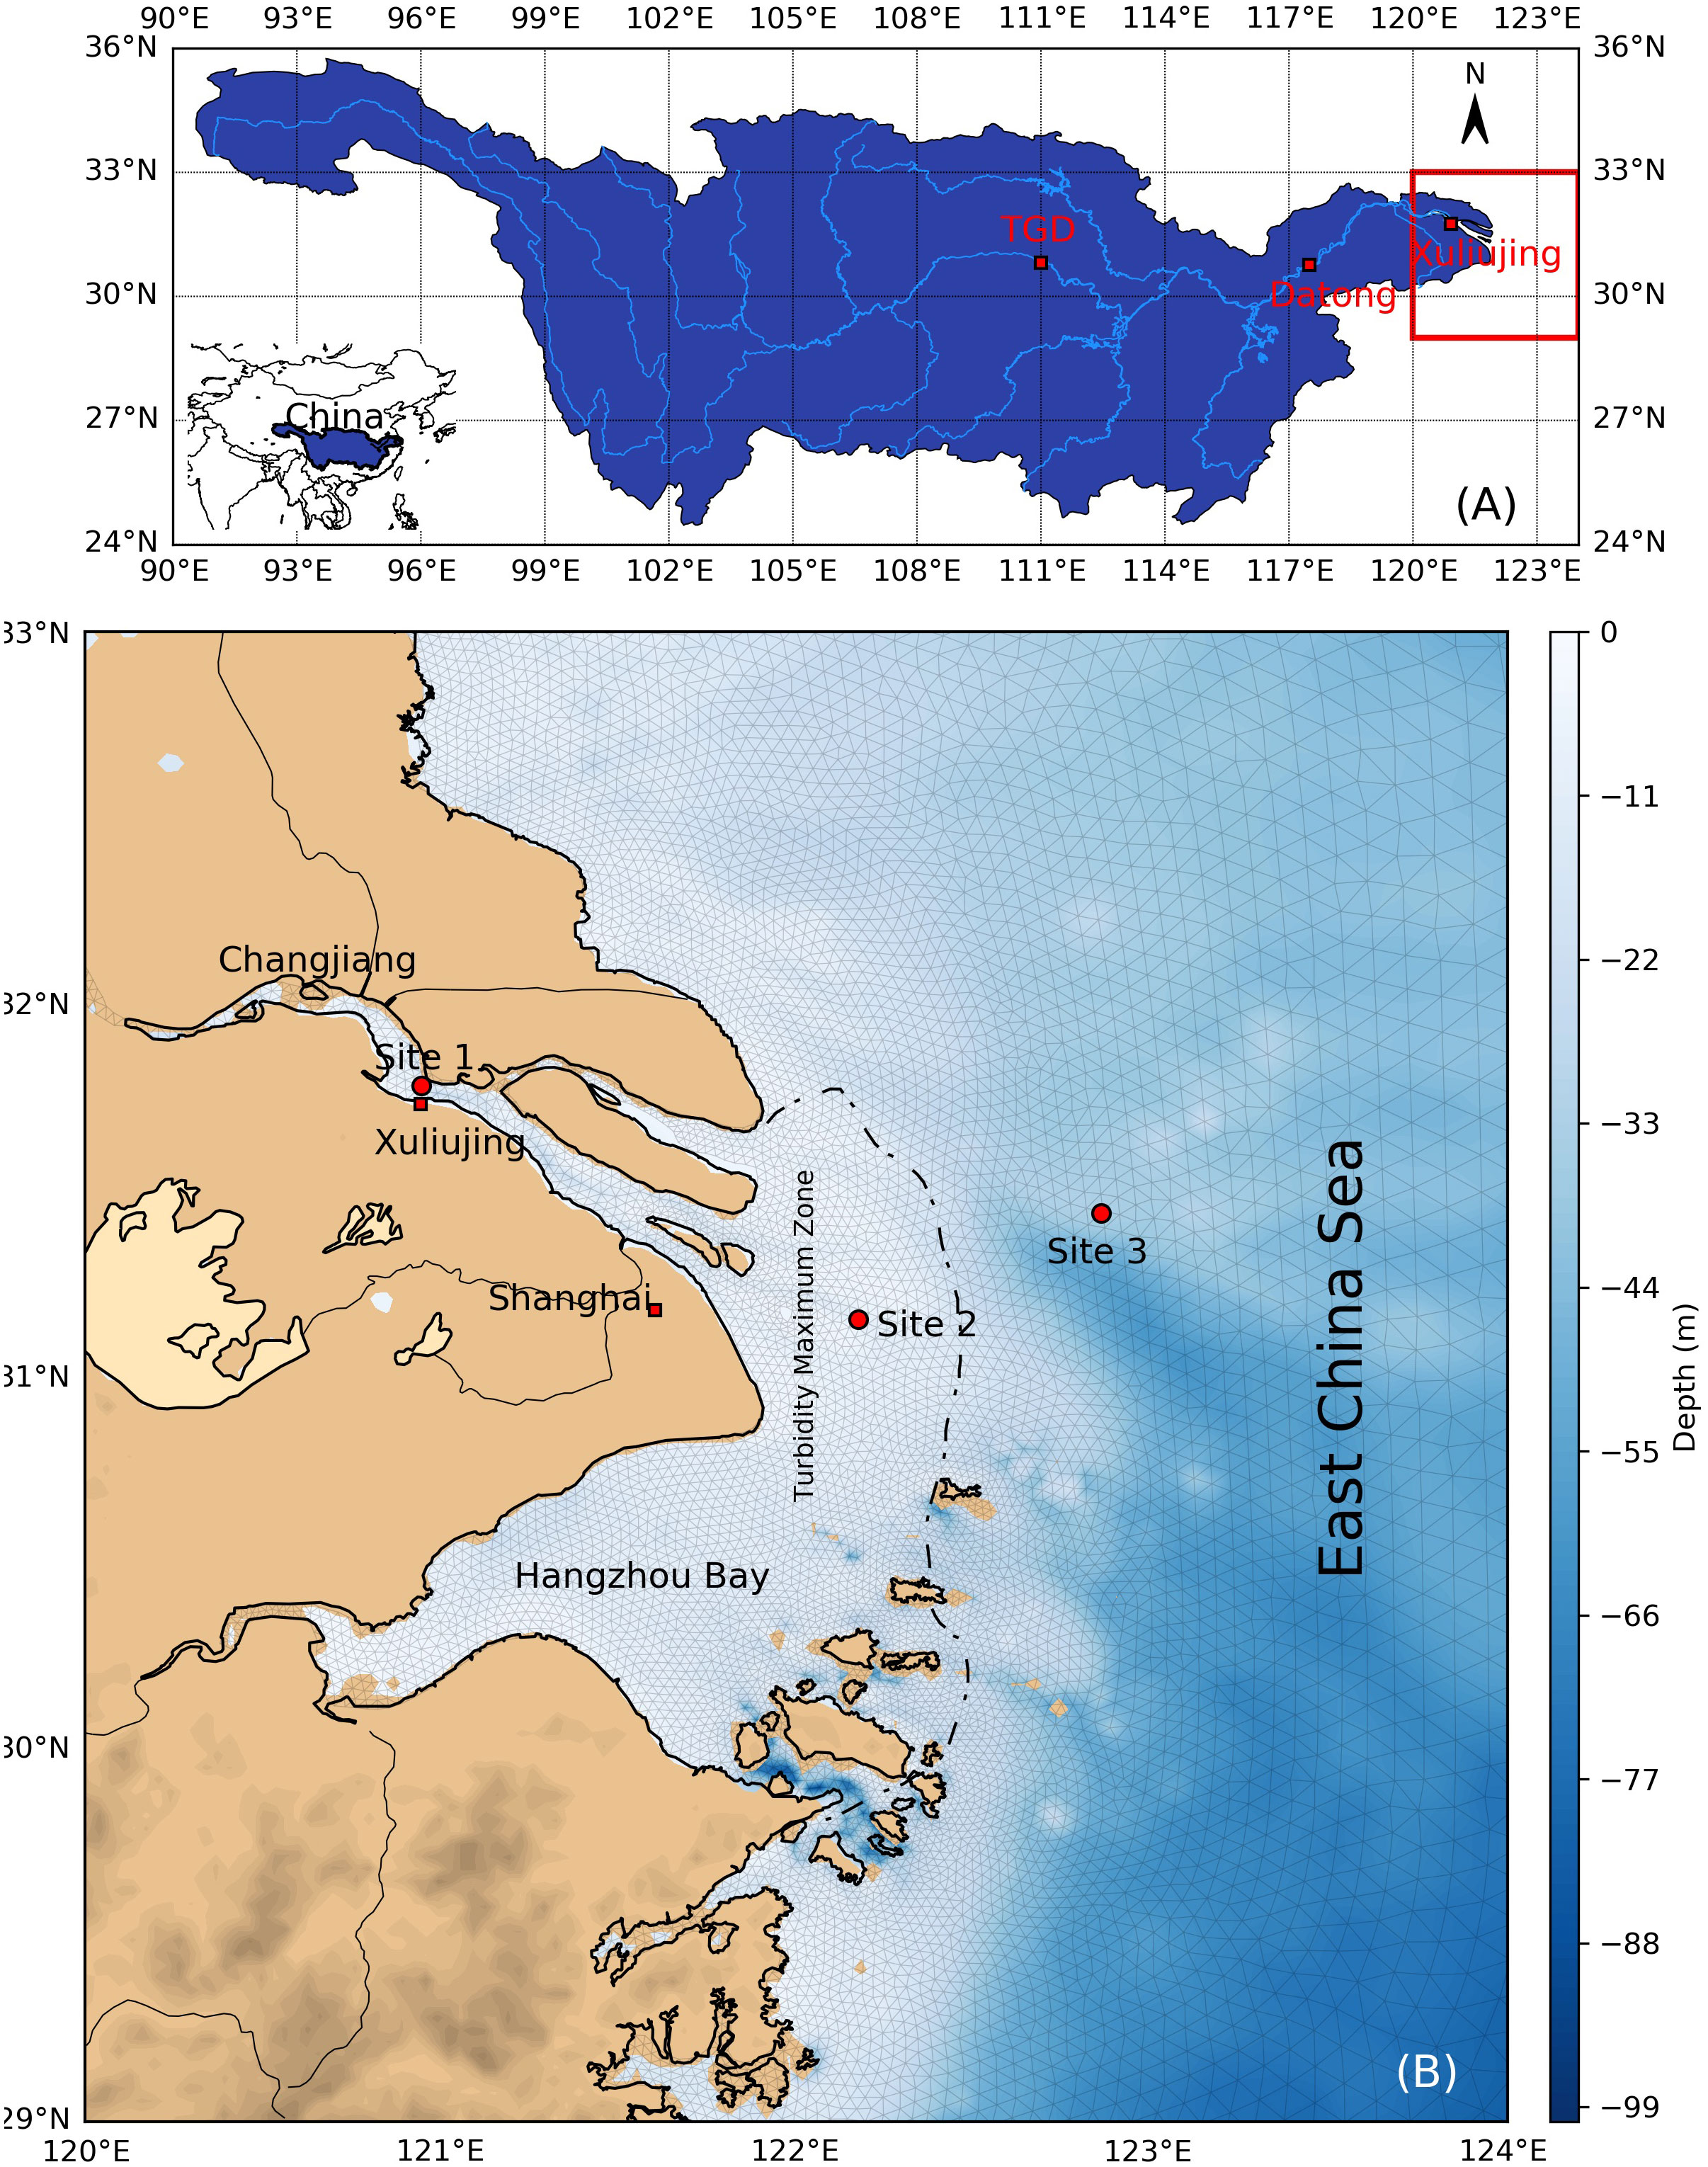
Figure 1 Diagram of the study area [modified from Ge et al. (2020a)] (A) Location of the Changjiang Basin, the Three Gorges Dam (TGD), Datong Station, and Xuliujing Station. (B) Changjiang Estuary and inner shelf of East China Sea. Site 1 (at the river channel), site 2 (at the river mouth), and site 3 (at the inner shelf) are typical sites that were chosen (red dots). The dashed line denotes the boundary of the turbidity maximum zone.
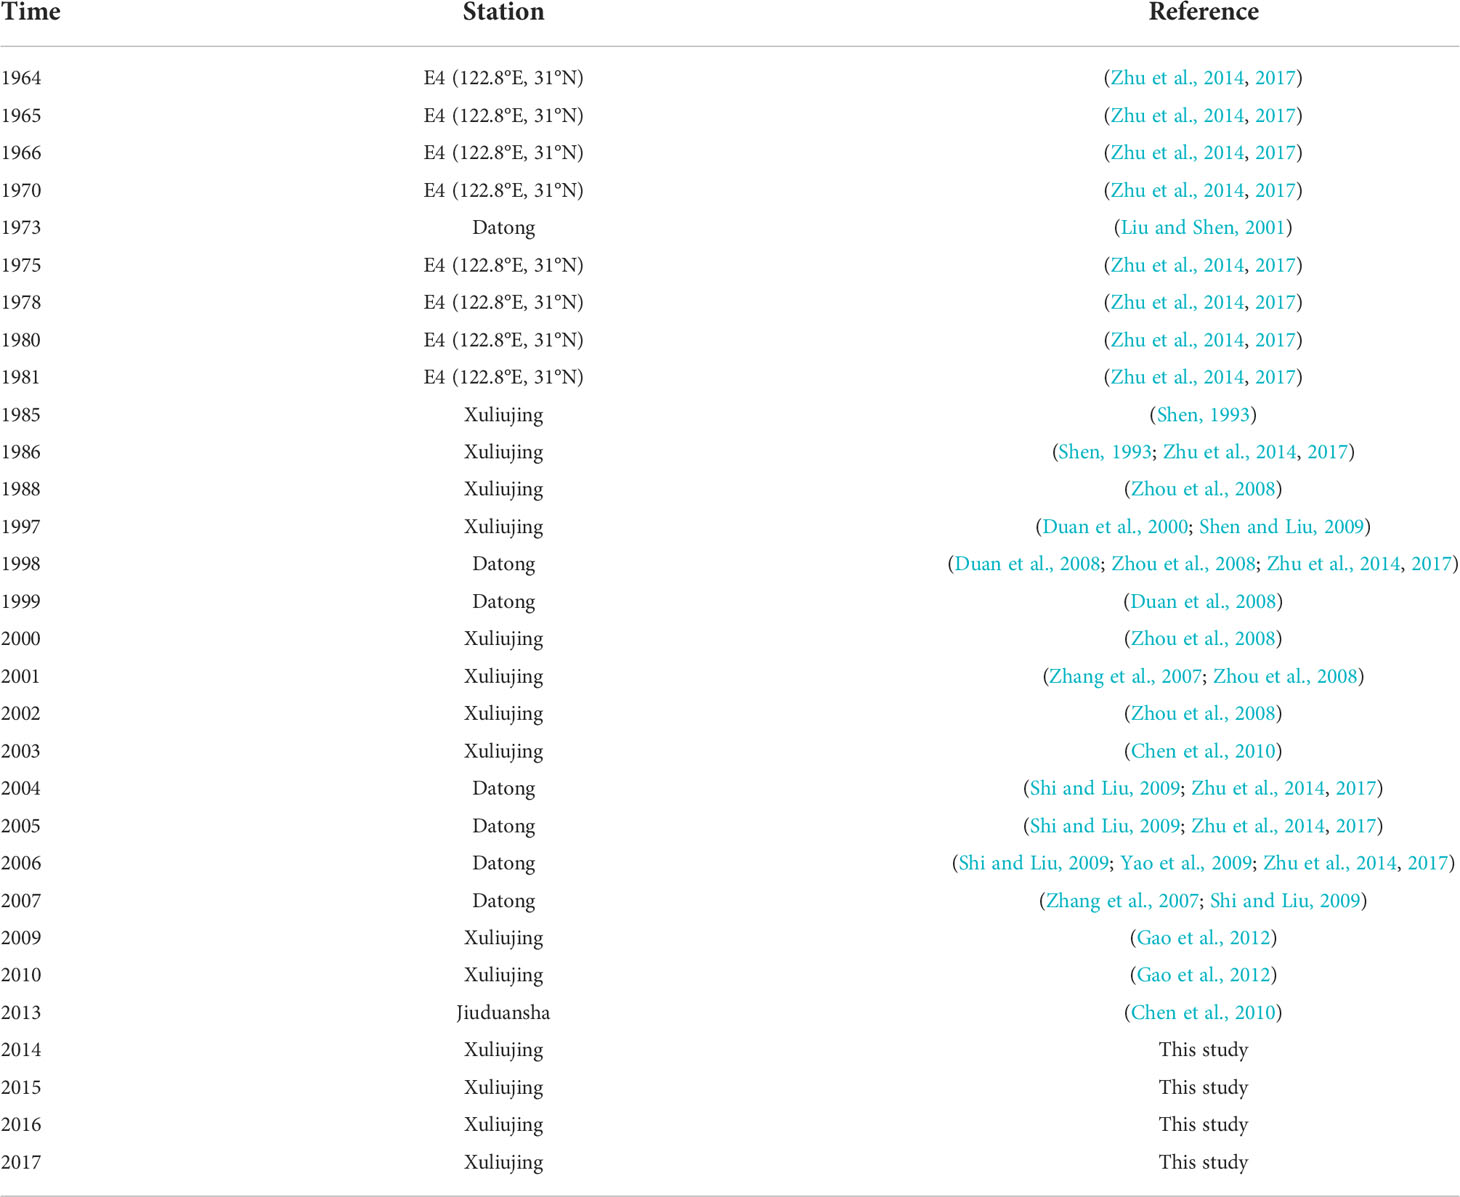
Table 1 Different sources of nutrient data collected from 1960 to 2018.
We collected approximately 60 years of annual mean surface runoff and riverine nutrient data (Figure 2). Significant interannual variability occurs along this time series. The strongest inundation in 1998 corresponded with the most extensive runoff in 1998 in the time series (over 1.2×10¹² m3/yr). In contrast to the fluctuating annual discharge, the sediment load clearly decreased, from to 500 Mt/yr to 100 Mt/yr continuously (the red curve in Figure 2A). This phenomenon is consistent with the results in Luan et al. (2016), that sediment was trapped in reservoirs mainly due to the construction of water conservation projects (Yang et al., 2015; Luan et al., 2016; Yang et al., 2018b). Riverine nutrient variabilities also showed distinct trends. Increasing trends from 1960 to 1980 were clearly seen in the nitrate and phosphate time series (with slopes of 1.98 (p<0.001) and 0.02 (p<0.001), respectively). By 2018, the nitrate and phosphate levels had increased by approximately 15-fold and two-fold, respectively, compared to the early 1960s. In contrast, silicate showed only a slightly increasing trend (Figure 2D). The Pearson correlation coefficients for these three nutrients were less than 0.001. Therefore, the fitted curves showed significant correlation, and the trends for the nitrate, phosphate, and silicate concentrations were reliable. However, there is little empirical data for ammonium, so that trend line does not accurately represent the ammonium concentration (Figure 2E).
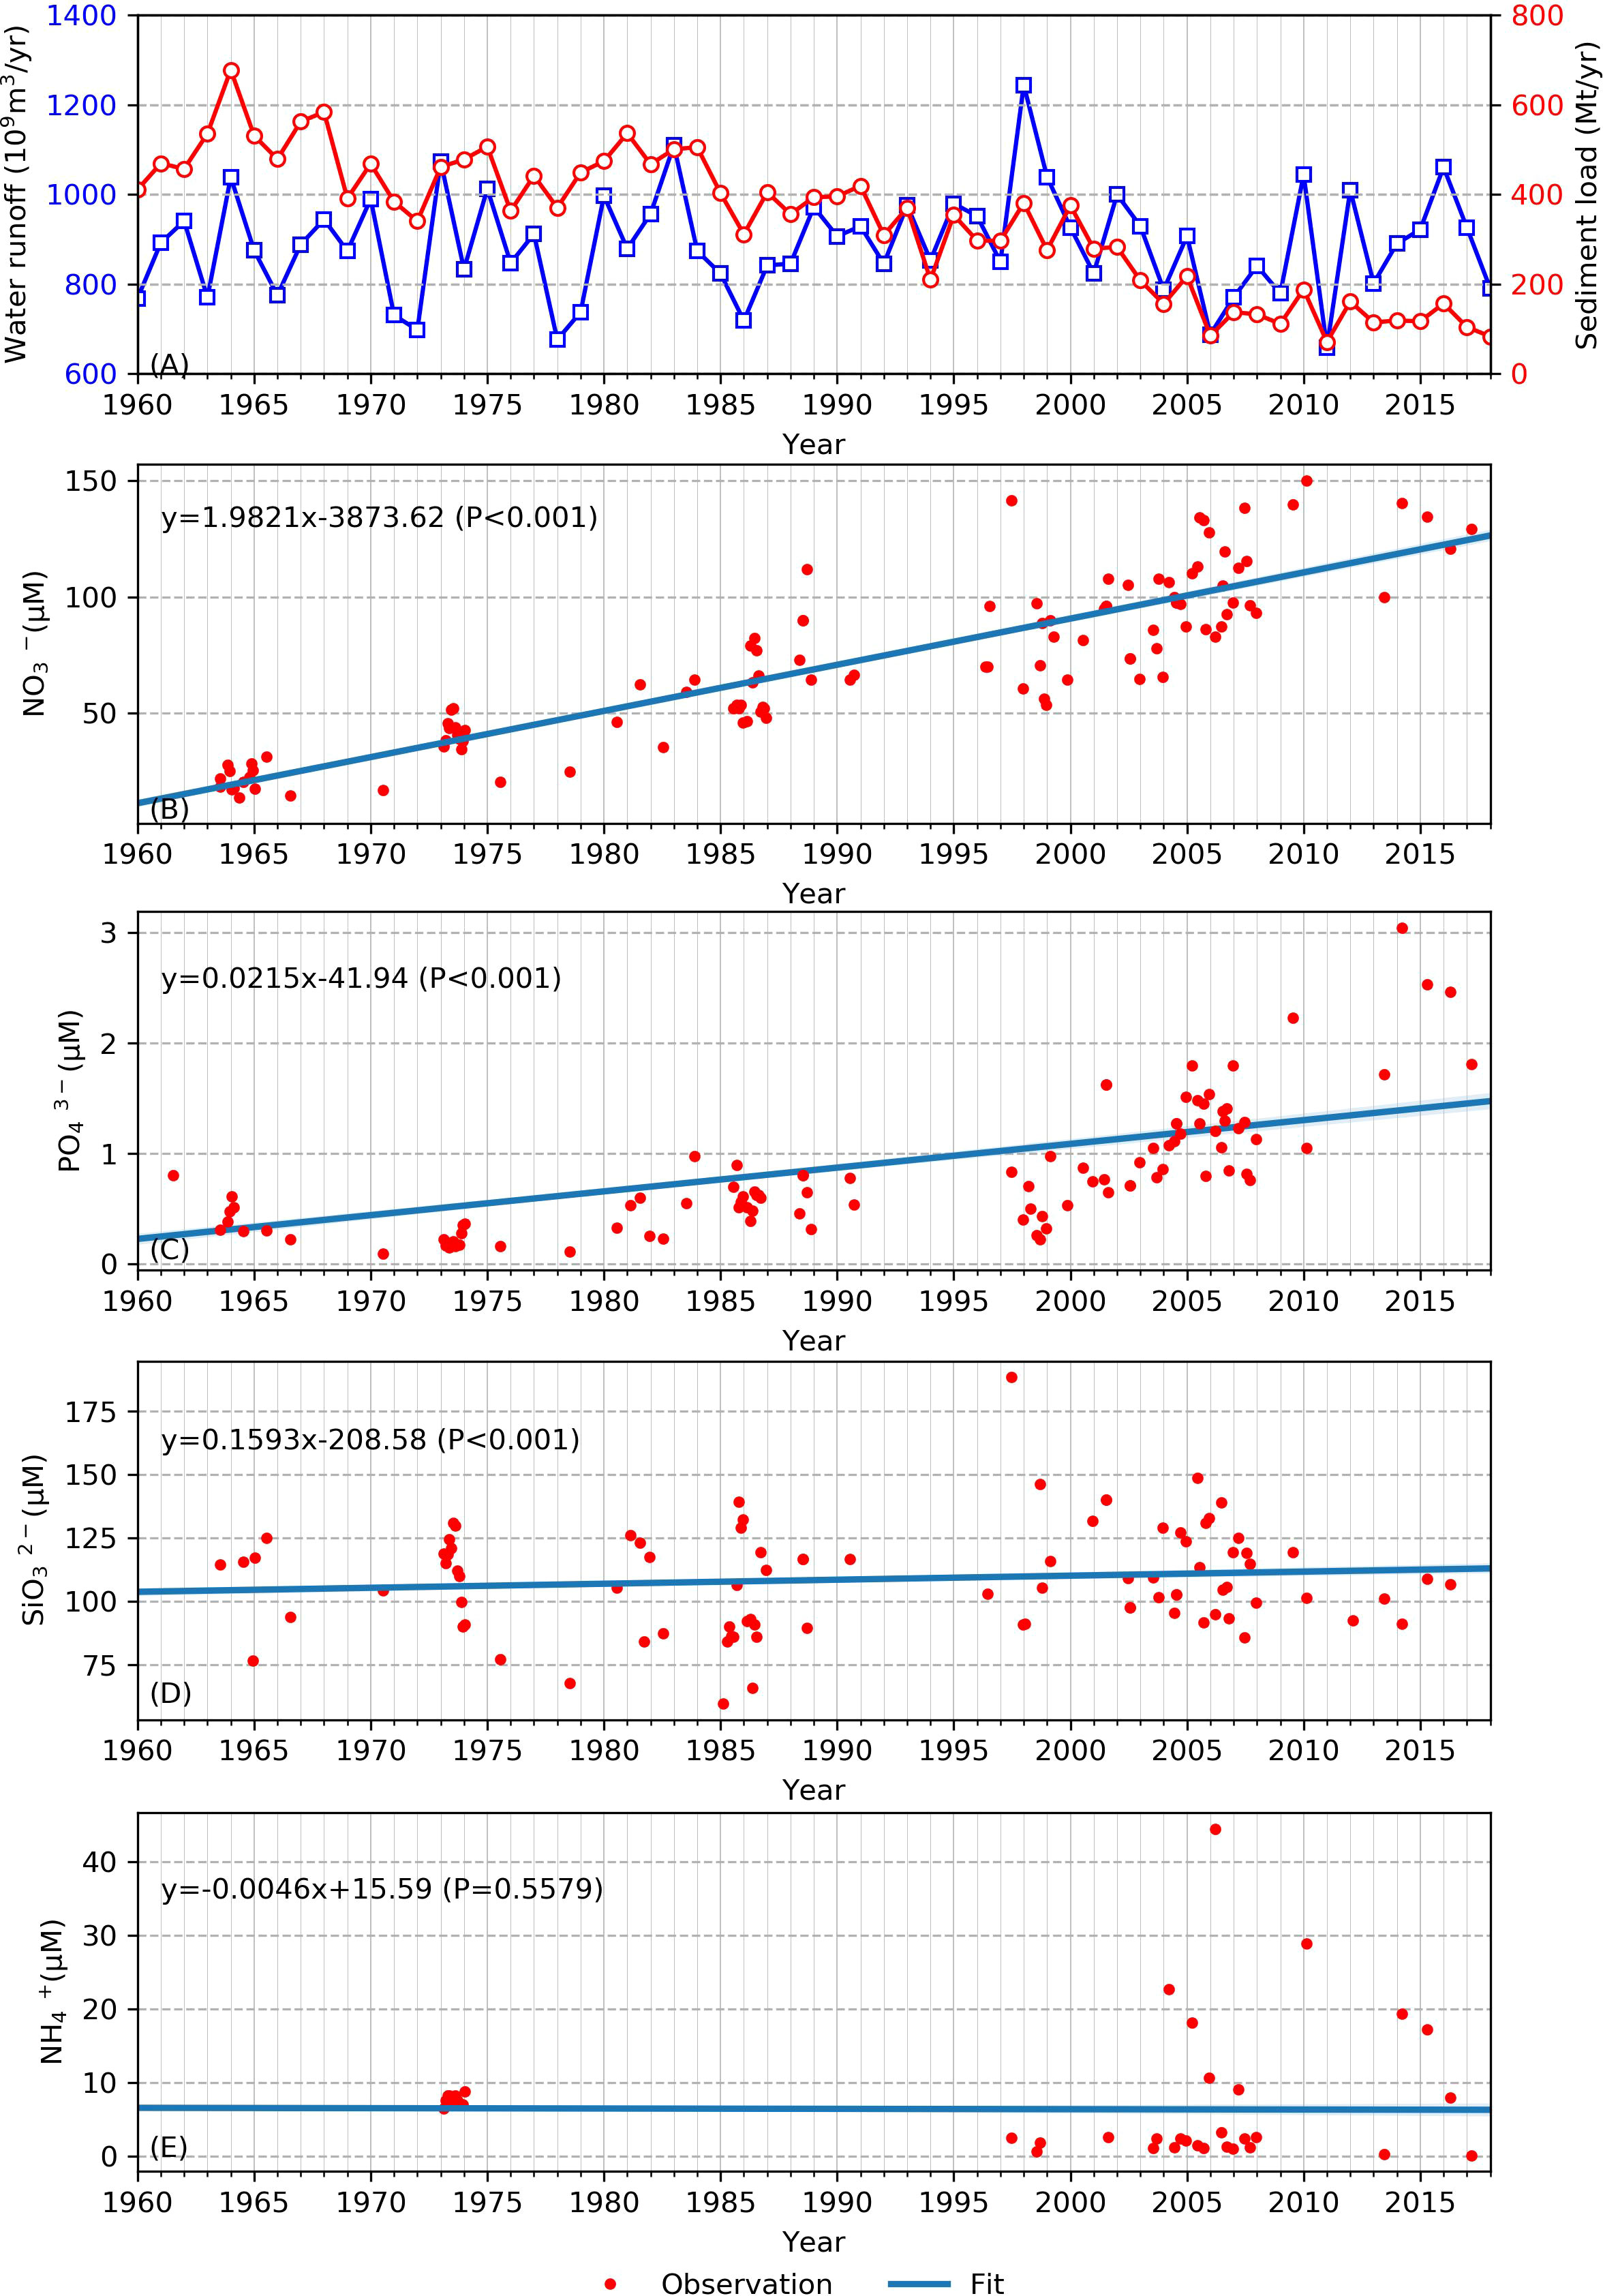
Figure 2 Empirical annual water runoff data (blue line) and sediment load (red line) at Datong Station (A). Observed (red dots) and empirical data (blue lines) for nitrate (B), phosphate (C), silicate (D), and ammonium (E) at Datong and nearby sites.
To describe the long-term variations of ecosystems in the Changjiang Estuary continuum during dramatic environmental changes, we used a physics-biogeochemistry coupled FVCOM-ERSEM model to describe the variability of major nutrients and the phytoplankton community during the past few decades. FVCOM (Chen et al., 2003) discretizes space into an unstructured triangular grid in the horizontal direction and uses terrain tracking coordinates vertically; thus, it is suitable for the complex situations that characterize estuarine and coastal areas. The use of scalar conservation equations makes FVCOM user-friendly for multidisciplinary research. The ERSEM model is one of the most comprehensive models for the low-trophic marine food web (Butenschon et al., 2016) and has been widely used in the simulation of biogeochemical processes in coastal areas (Elkalay et al., 2012; Sankar et al., 2018; Jardine et al., 2021). The ERSEM has complex ecosystem components, including nutrients, phytoplankton, zooplankton, benthos, bacteria, iron, light extinction, calcification, and alkalinity. In ERSEM, four functional types of primary producers were considered (diatoms, micro-phytoplankton, pico-phytoplankton, and nano-phytoplankton), which allowed us to identify the long-term changes in phytoplankton communities when nutrient concentrations and ratios change. The coupling of these two models has been successfully applied in physical and ecosystem modeling in the Changjiang Estuary and adjacent regions for both episodic events and decade-scale modeling (Ge et al., 2020a; Ge et al., 2020b; Ge et al., 2021).
The unstructured triangle grid used in this study is of medium-resolution and covers the entire study area. It covers the Changjiang Estuary, Hangzhou Bay, and the inner shelf of the East China Sea. In the coastal region, river mouth, and in other complex terrains, the resolution of the grid was adjusted to 2-3 km to ensure that detailed hydrodynamic processes could be geometrically fitted in the model. The hydrodynamic model FVCOM involves FVCOM-SED and FVCOM-SWAVE with current-wave–sediment interactions (Wu et al., 2011). The simulation period was 1960–2018, and the output was daily averaged. The nutrients and dissolved oxygen of the open boundary were monthly climatologies obtained from the 2013 World Ocean Atlas dataset. The model was driven by a reanalysis of atmospheric forcing data at 3-h intervals, provided by the National Centers for Environmental Prediction from 1960 to 1980 and datasets of ERA-Interim from the European Center for Medium-Range Weather Forecasts (ECMWF) from 1980 to 2018. We used surface air temperature, pressure, relative humidity, winds at a 10m altitude above the sea surface, downward longwave radiation, and net shortwave radiation to specify the surface fluxes of momentum and buoyancy based on bulk formulae (Fairall et al., 2003). At the open boundary, we specified the temperature, salinity, nitrate, total inorganic carbon, alkalinity, and dissolved oxygen using the output of a regional model in this study domain described in Ge et al. (2013). The major tidal components along the lateral open boundary, including eight primary harmonic constituents M2, S2, N2, K2, K1, P1, O1, Q1, were determined from the TPXO 8-atlas (Egbert and Erofeeva, 2002). The riverine inputs of nutrients and freshwater were based on the empirical data plotted in Figure 2. In our simulation, we also included the benthic components of the ERSEM to consider the effects of the benthic ecosystem on the pelagic ecosystem. The flux from the benthos to the water column was simplified as a remineralization process from dissolved organic matter to inorganic matter.
EOF is a method that extracts an eigenvalue from a large-scale dataset. Such EOF analyses were widely used to compress the spatial and temporal variability of large datasets down to a set of dominant, mathematically orthogonal (independent) spatial functions and associated time-varying amplitudes (PCs) (Briggs, 2007; Dawson, 2016). It has been widely used in meteorology and oceanography (Lian and Chen, 2012; Qi et al., 2014; Roundy, 2015; Zhong et al., 2020; Grams, 2021). The EOF analysis was used to evaluate when and where the most dominant phytoplankton structure variabilities occurred during the 59-year time series.
To investigate nutrient and phytoplankton, we selected three specific sites downstream of Xuliujing to 124°E, which represented the river channel, the river mouth, and the inner shelf (red dots in Figure 1B) dynamics during the past 59 years. We used various in-situ observational data to verify the reliability of our numerical biogeochemical model results. We used various in-situ observational data to verify the reliability of our numerical biogeochemical model results. Based on previous studies, the nitrate concentration in the 1960s in Changjiang was ~20 μM and was maintained at this level for the next two decades. In the 1980s, the DIN concentration increased to 80 μM, then exceeded 100 μM in the 2000s (Jiang et al., 2010; Jiang et al., 2014; Liang and Xian, 2018; Shen et al., 2020). This is consistent with our simulated nitrate concentration at the site near Xuliujing station (Figure 3A, site 1). For the saline sites, the documented nitrate concentration was ~10 μM in the 1960s, which increased to ~30 μM in the 1980s, then continued to grow to ~45 μM in the 2000s (Jiang et al., 2014). Our simulated time series of nitrate concentrations at representative stations in the saline section (Figure 3B) exhibited the same magnitude as Jiang’s, however, it was slightly lower than that reported by Liang and Xian (2018). The observed phosphate concentration in the river site fluctuated from ~0.5 μM before 1980, increasing to ~1.5 μM in the 1990s (Shen et al., 2020). Our simulated phosphate (Figure 4A) are larger than those in Jiang et al. (2010), which were ~0.5 μM before the 1980s, ~0.7 μM during the 1980s and ~1.2 μM in the 2000s. After 2003, the phosphate concentration increased quickly with sharp fluctuations (Figure 4A). The fluctuations since 2003 can be found in Liang and Xian (2018); however, they occurred early in our simulation. For the phosphate concentration in the saline section (site 3), our model successfully reproduced the concentrations observed by Jiang et al. (2014) and Liang and Xian (2018) (Figure 4C). We didn’t see a significant trend for the simulated silicate concentration. It essentially remained between 100-150 μM from 1985 to 2014. This is consistent with the results of Jiang et al. (2014) and Liang and Xian (2018) (Figure 5A). For the saline site (site 3), the long-term silicate trend is similar to that of Jiang et al. (2014), however, the annual average silicate was less than 20 μM, but in Jiang et al. (2014), it fluctuated around 30 μM (Figure 5C). The simulated nutrient concentrations were in the same order of magnitude and indicated similar temporal variability as the observations.
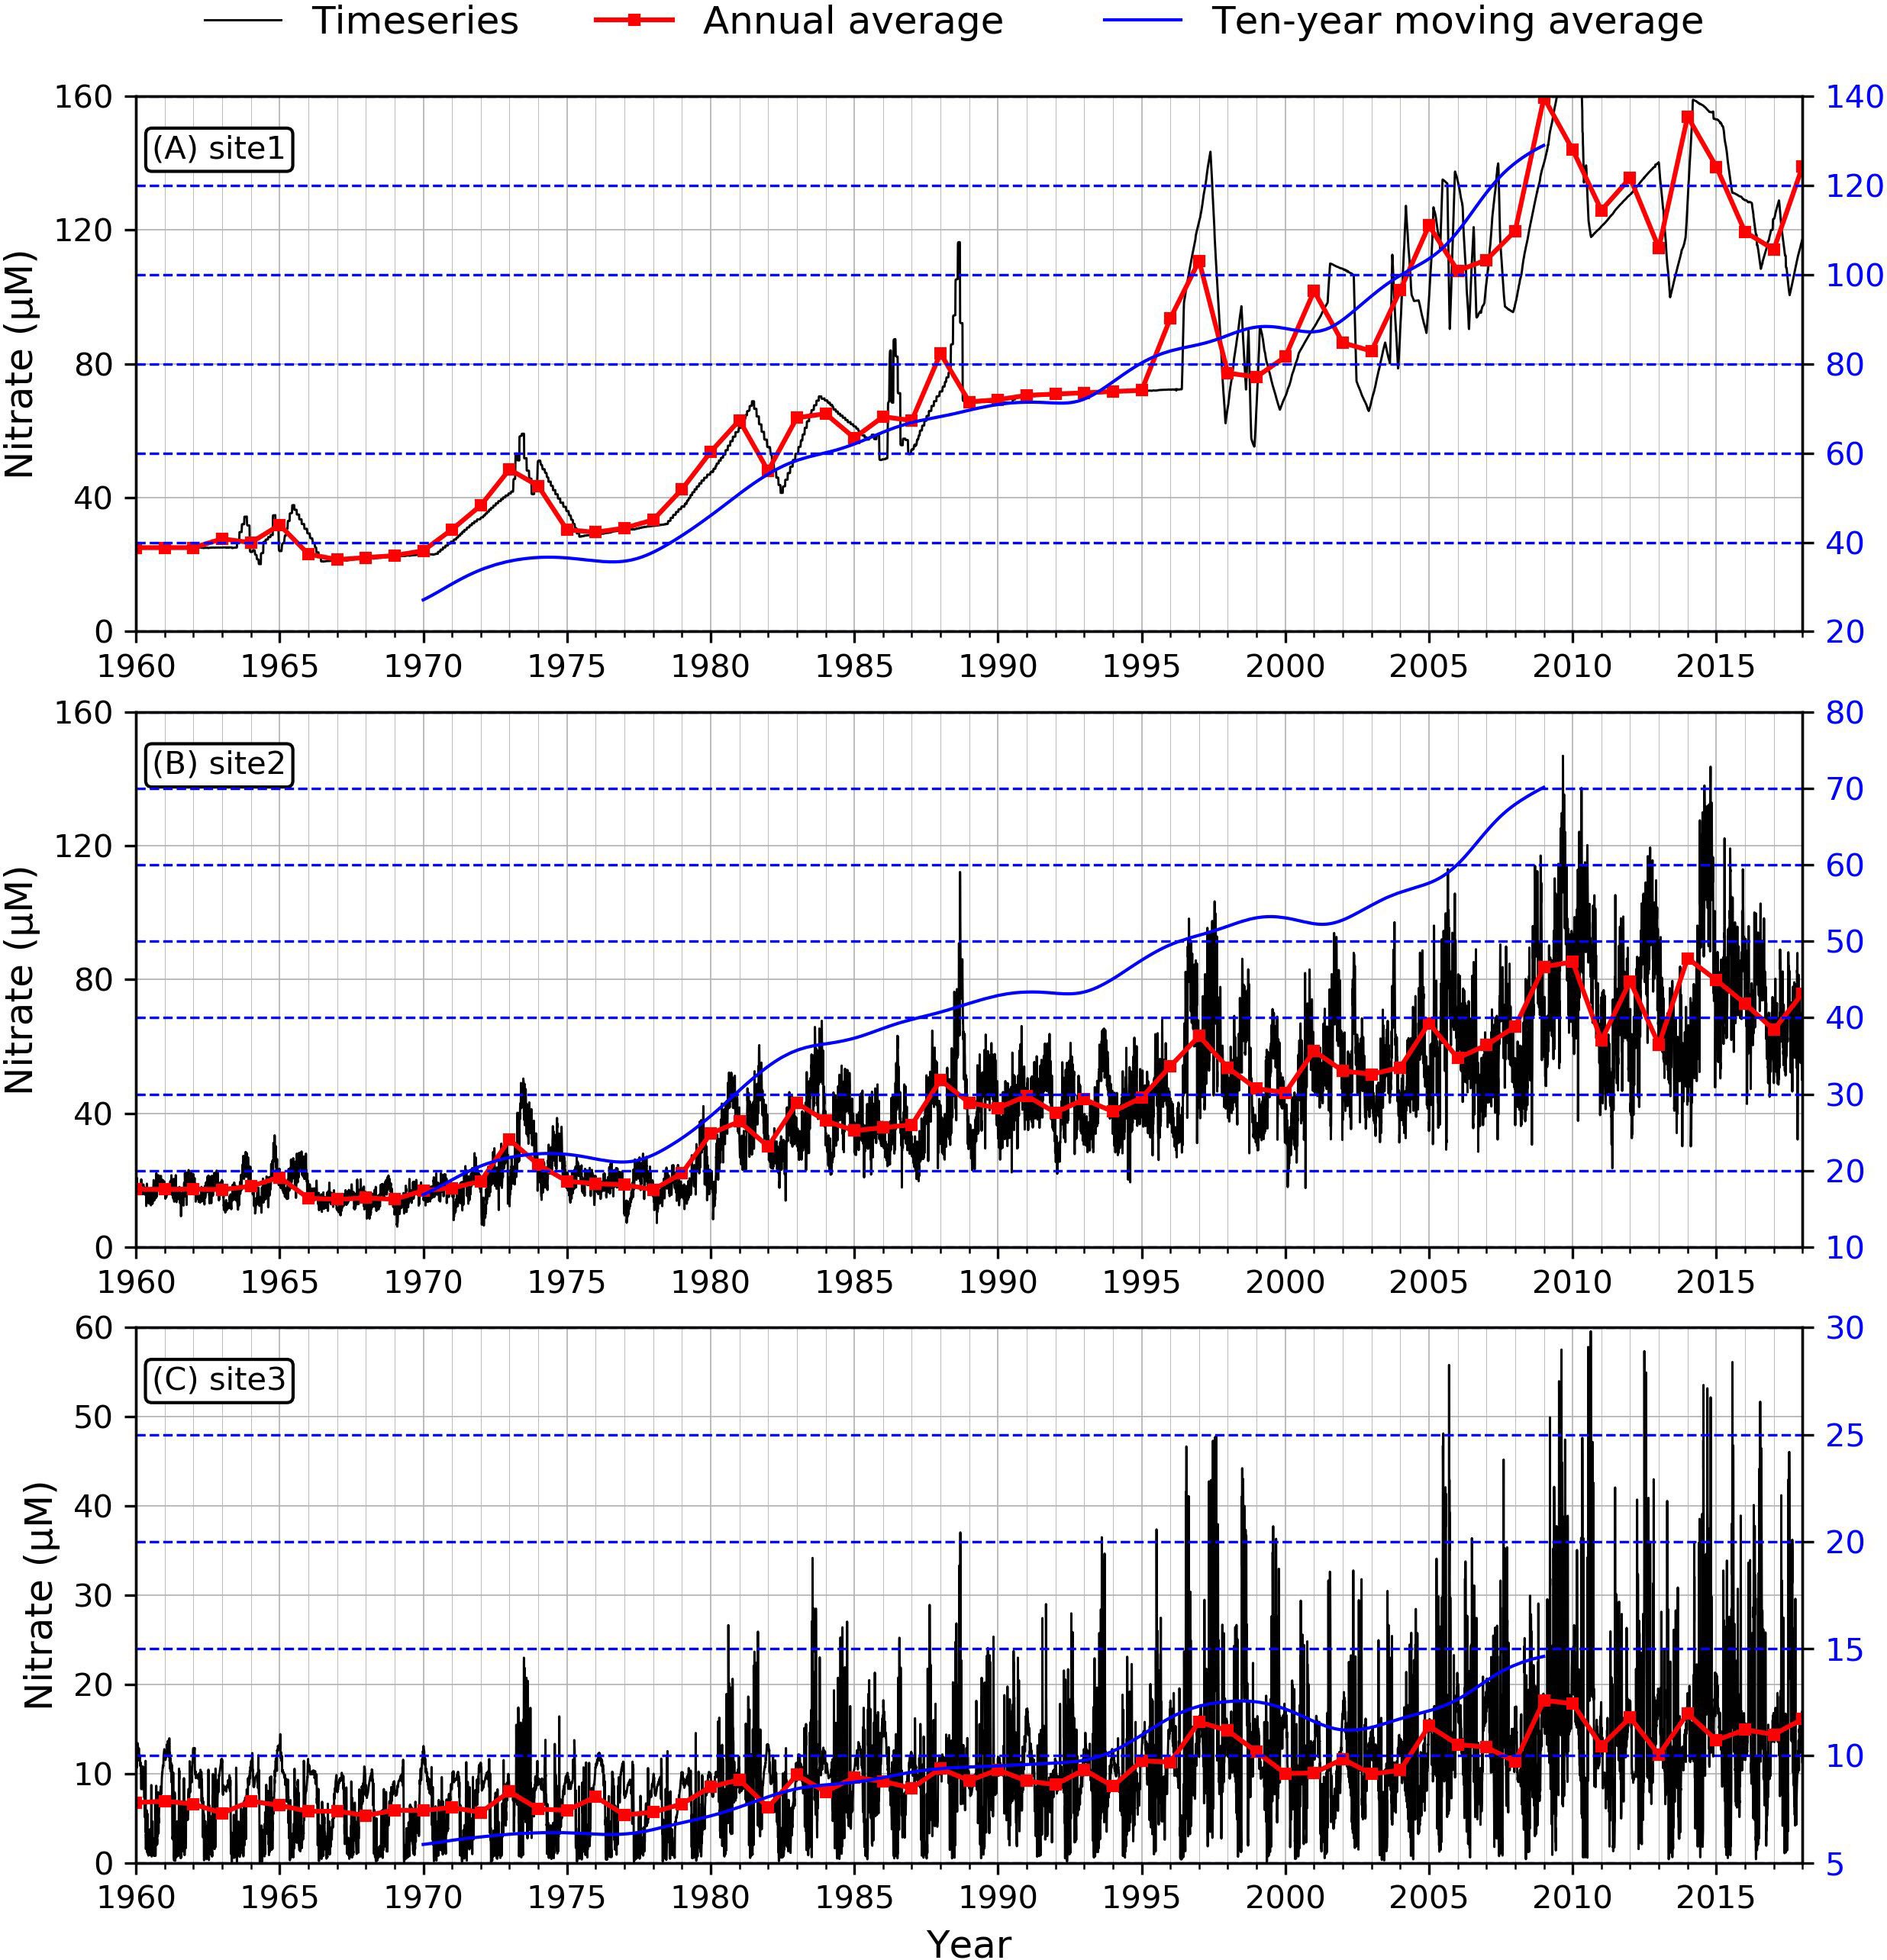
Figure 3 Modeled time series of nitrate concentration at the three sites. (A: site1, B: site2, C: site3). Black lines demonstrate the daily averaged nitrate concentration, red lines are annual averaged values, and blue lines indicate ten-year moving averaged trend.
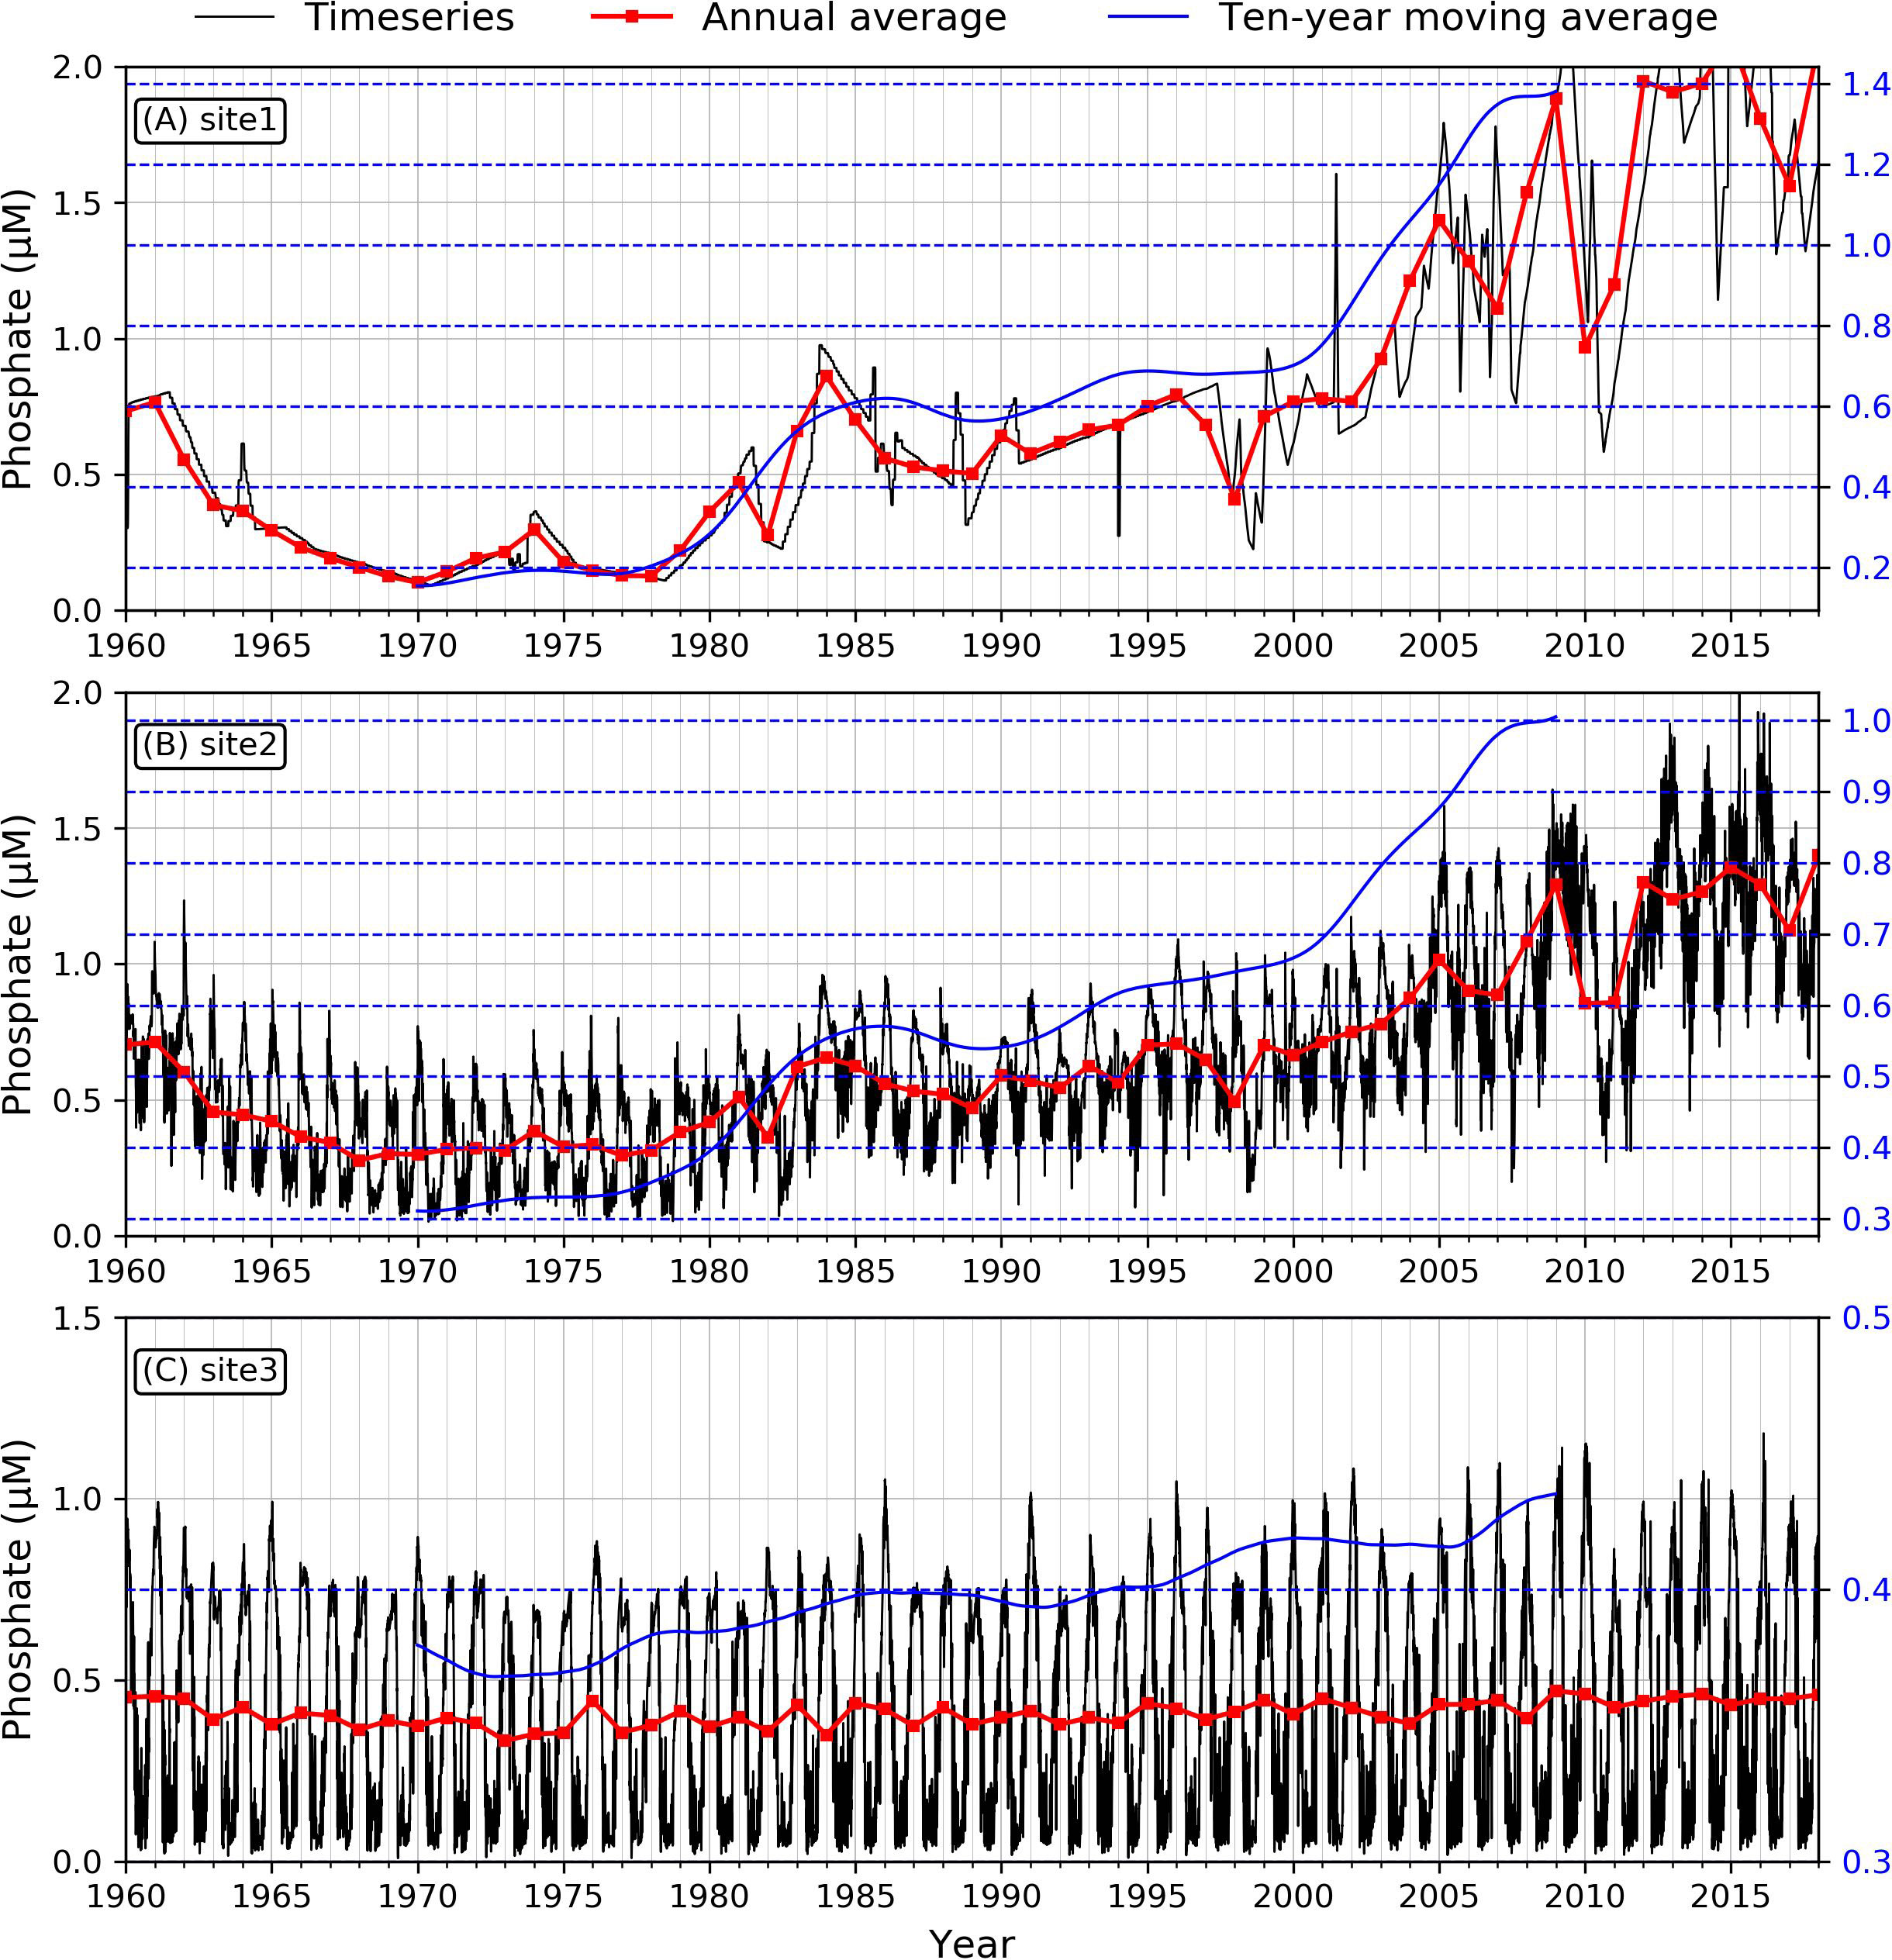
Figure 4 Modeled time series of phosphate concentration at the three sites. (A: site1, B: site2, C: site3). Black lines demonstrate the daily averaged phosphate concentration, red lines are annual averaged values, and blue lines indicate ten-year moving averaged trend.
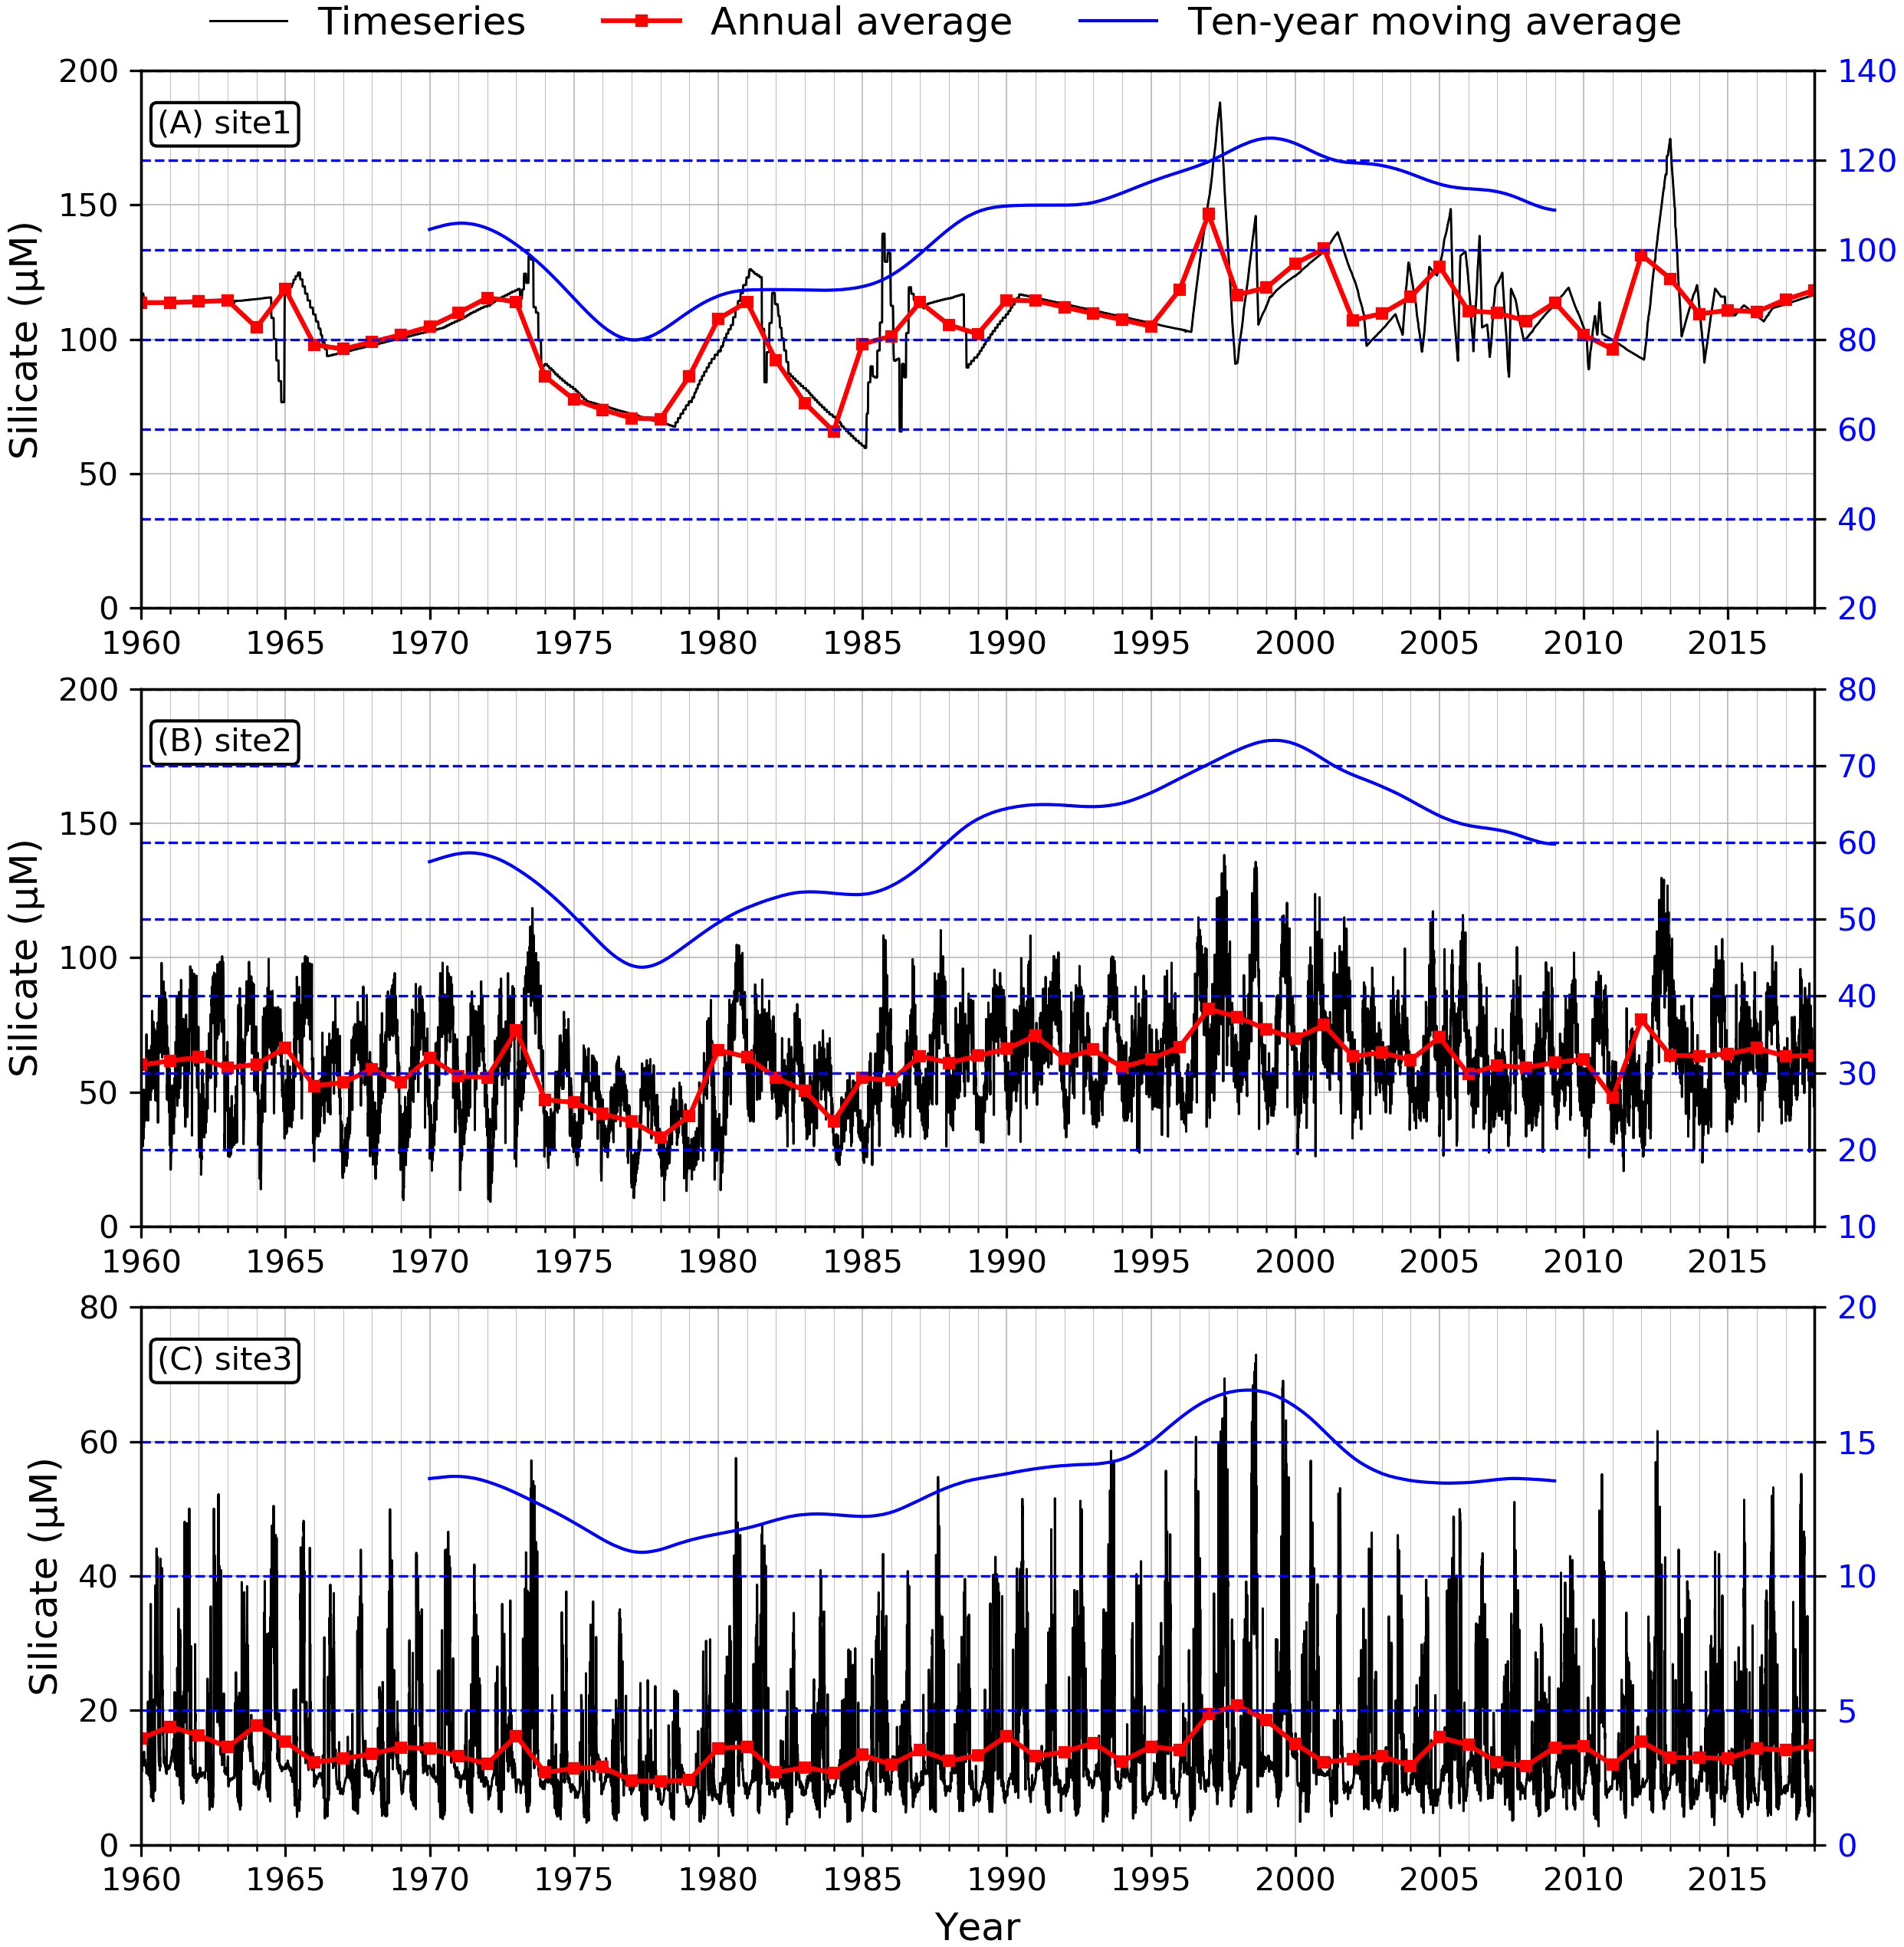
Figure 5 Modeled time series of silicate concentration at the three sites. (A: site1, B: site2, C: site3). Black lines demonstrate the daily averaged silicate concentration, red lines are annual averaged values, and blue lines indicate ten-year moving averaged trend.
Data collection for the validation of the dominant phytoplankton species is more complicated. According to the sampling method, the empirical phytoplankton data can be divided into net-collected and water-collected phytoplankton. These different sampling methods can yield phytoplankton of different sizes and species. The parameters representing the condition of the phytoplankton, such as composition, abundance, and biomass, are also different. Phytoplankton also agglomerate; therefore, observations vary greatly over time and space. Hence, there was a deviation between the data from previous studies and the model results. Previous studies have documented that the annual mean diatom ratio in the phytoplankton communities was over 80% before 1990 and then decreased to 69.8% (Zhou et al., 2008; Jiang et al., 2014). The simulated data showed a similar trend, but the annual mean diatom ratio was lower, which varied in the range of 51.5% – 52% and 48.3 – 51.2% after 2000 at site2 and site3, respectively (Figure 7).
Our model fit the observed data well for a specific time frame, it successfully simulated the seasonal and long-term nutrients variations at different geographical locations. Compared with site 1, which is influenced by riverine nutrients, the time series of nutrients at sites 2 and 3 are influenced more by oceanic water, thus indicating significant seasonal variations because of nutrient uptake by phytoplankton (Figures 3–5).
The nitrate concentration at the three sites showed a pronounced increasing trend from 1960 to 2019 (Figure 3). The Mann-Kendall test (Table 2) suggested a significant increasing trend (the τ value of the three sites was greater than 0.7, and the slope was positive with p< 0.001). Site 1, which is located in the river channel, had a nitrate concentration above 160 μM during the last decade. It was 140 μM for site 2, located in the river mouth, and much lower for site 3, located on the shelf. This suggests that the farther offshore the location, the lower the nutrient concentration. This phenomenon is associated with the geographical features in this continuum. The nutrient concentration is more greatly affected by freshwater dilution at the river mouth, while it is more influenced by the phytoplankton uptake offshore beyond the maximum turbidity zone. The same pattern can be observed from the ten-year moving average (blue lines in Figure 3).
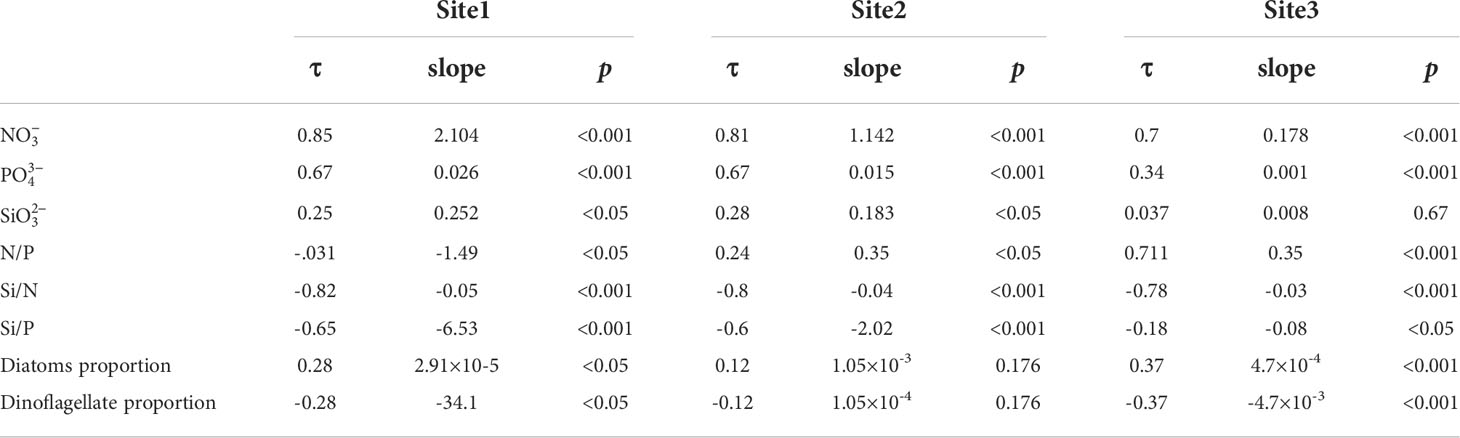
Table 2 Mann-Kendall test of nutrients and phytoplankton at three sites.
The long-term variability of nitrate during the 59 years of simulations can be divided into three phases: 1960–1980 (a steady increase), 1980–2010 (a rapid increase), and 2010–2018 (violent fluctuation). From 1960 to 1980, nitrate at the three sites was maintained at a relatively low level (~20 to ~30 μM in the estuary area and ~7 μM in the coastal region). The concentration gradually increased to 60 μM by the end of the 1970s. During the second phase, nitrate increased rapidly following the rapid economic growth in China since the early 1980s. The nitrate concentration at site 1 almost tripled owing to increasing emissions of industrial and agricultural sewage, which led to eutrophication in the Changjiang River during this period (Wang, 2006). During the last phase, the nitrate concentration fluctuated; however, it generally showed a steady increasing trend.
Similar to nitrate, the phosphate concentration increased at the three sites during the 59 years (Figure 4), but at a lower rate. Both site 1 and site 2 showed decreasing trends from 1960 to 1970, with the phosphate concentration falling from 0.7 μM to 0.1~0.2 μM. From 1970 to 2018, the concentration showed a steadily increasing pattern in the river channel (from ~0.2 μM to ~2 μM) and from ~0.2 μM to ~1.5 μM in the river mouth (Figures 4A, B). For the inner shelf at site 3, the phosphate concentration showed a slightly increasing trend compared with sites 1 and 2. From the Mann-Kendall test for phosphate, the slopes of these three sites were all positive (P< 0.001) (Table 2). The τ values for sites 1 and 2 were 0.67, but for site 3 it was 0.34, suggesting a weaker increasing trend at site 3 compared with the other two sites.
The temporal trends in the silicate concentrations suggested that silicate was the most stable nutrient component in the river-estuary-shelf continuum. There was no pronounced trend in the variability of silicate during our simulation period, especially for the river site (site 1) (Figure 5). This was also confirmed by the Mann-Kendall test, which suggested non-significant trends showing much higher P values (Table 2). Such a difference is reasonable because N, P, and Si are associated with different biogeochemical processes. The N and P concentrations have been strongly influenced by anthropogenic nutrient sources, whereas the primary silicate source within the Changjiang Basin is the weathering of rocks. From the time series for the silicate concentration, we can interpret the interannual fluctuations of silicate during specific periods. After 2003, the silicate content decreased significantly when the Three Gorges Dam (TGD) was completely put into operation (during 2003–2011: r = -0.46, p< 0.001), which suggests a retention effect of the TGD (Ding et al., 2019). For the oceanic site, a decreasing trend of silicate in the 2000s could be associated with its increased utilization by a diatom bloom as a result of increases in DIN and DIP after 2000.
The nutrient stoichiometry also dramatically changed because of the different rates of change in nutrients. Generally, sites 2 and 3 showed similar increasing trends in the nitrate-to-phosphate ratio (N/P), with slopes of 0.38/a and 0.37/a, respectively (Figure 6A). The N/P ratio at site 2 was almost three times the Redfield ratio (16:1) by the end of 2018, and that of site 3 was close to the Redfield ratio before 1980 and increased significantly thereafter, reaching ~35:1 by the end of 2018. Our results suggest that water in the river mouth was more likely to be phosphate-limited during the 59 years, whereas on the inner shelf, there was no phosphorus limitation before 1980, but it became phosphate-limited after that.
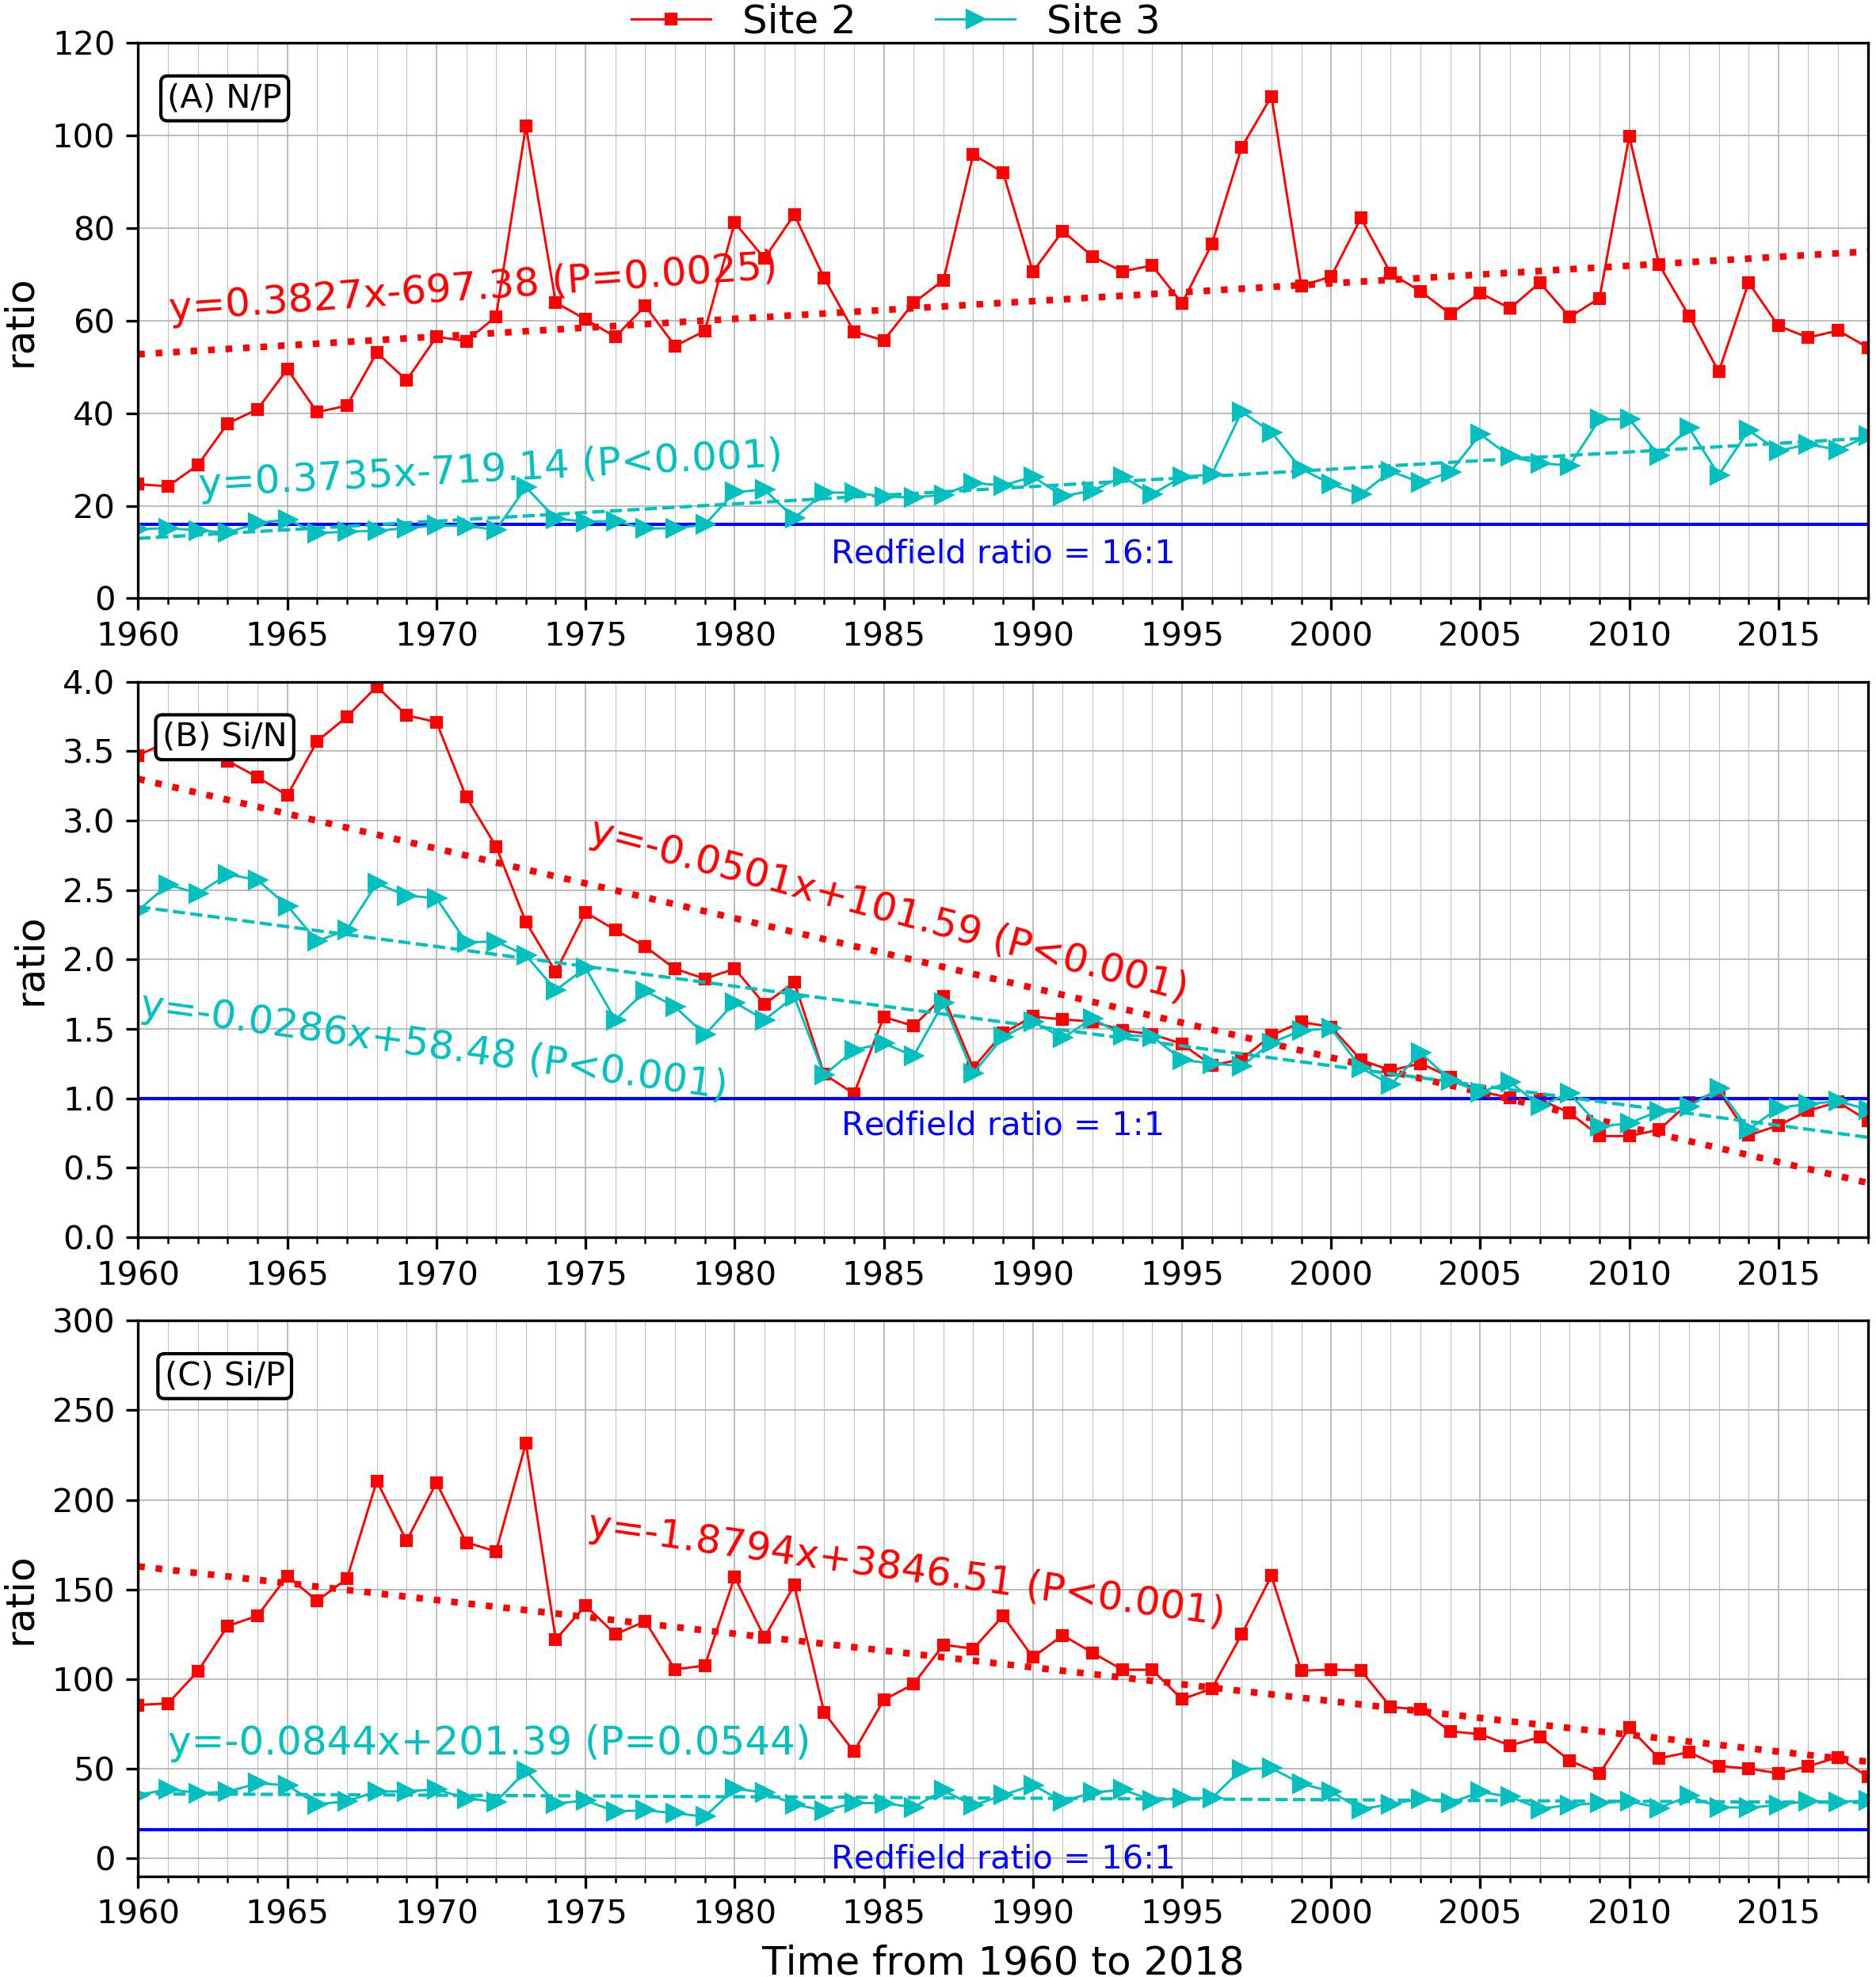
Figure 6 Nutrient ratios of N/P (A), Si/N (B), Si/P (C) at site 2 (red) and site 3 (green). The dashed lines are the regression fitting of the nutrient ratios. Blue lines indicate threshold of the Redfield ratio.
Si/N and Si/P decreased owing to the rapid increase in N and P, while silicate evidenced a stable change (slope=-0.05/a and -0.03/a, respectively) (Figures 6B, C). At site 2, the Si/N ratio decreased from ~3.5-fold of the Redfield ratio (Si/N=1) to half of that at the end of our simulation. The cut-off point when the Si/N became less than 1 occurred around 2007, which suggests a possibility of silicate limitation since that time. The same variability occurred at site 3, but with a lower decreasing rate of Si/N. We attribute this to a less significant increasing trend of N at Site 3 when compared with the rapidly increasing N trend at site 2 (Figure 6B). The trend for Si/P also decreased at site 2; however, we did not find a significant decreasing trend at site 3 (Figure 6C), probably because of a much more drastic increase in the phosphate concentration at site 2 than at site 3.
Changes in the stoichiometric relationship of the nutrient species could alter the community structure of the primary producers in the Changjiang Estuary (Zhou et al., 2008; Chu et al., 2014). Previous studies have demonstrated that diatoms are the dominant species in the Changjiang Estuary (Jiang et al., 2014). Therefore, we assessed the variability of the diatom proportion in the phytoplankton community first. Our results were arrived at by calculating the percentage of diatom chlorophyll in the primary producers. In our simulation, diatoms dominate the phytoplankton community at sites 2 and 3, accounting for an average of 52.6% and 50.8%, respectively. As shown in Figure 7, the diatom proportions in the river mouth and inner shelf have been changed over the 59 years. Specifically, there was an increased frequency of diatom proportion by the year of the 2000, and decrease of that after. The long-term change of diatom proportion could be associated with changes in the riverine nutrient loads, including a consistent increase in nitrate and a decline in silicate after 2003 due to sediment trapping in the upstream reservoirs. With the decrease in Si/N after 2003, the proportion of diatom species began to decrease.
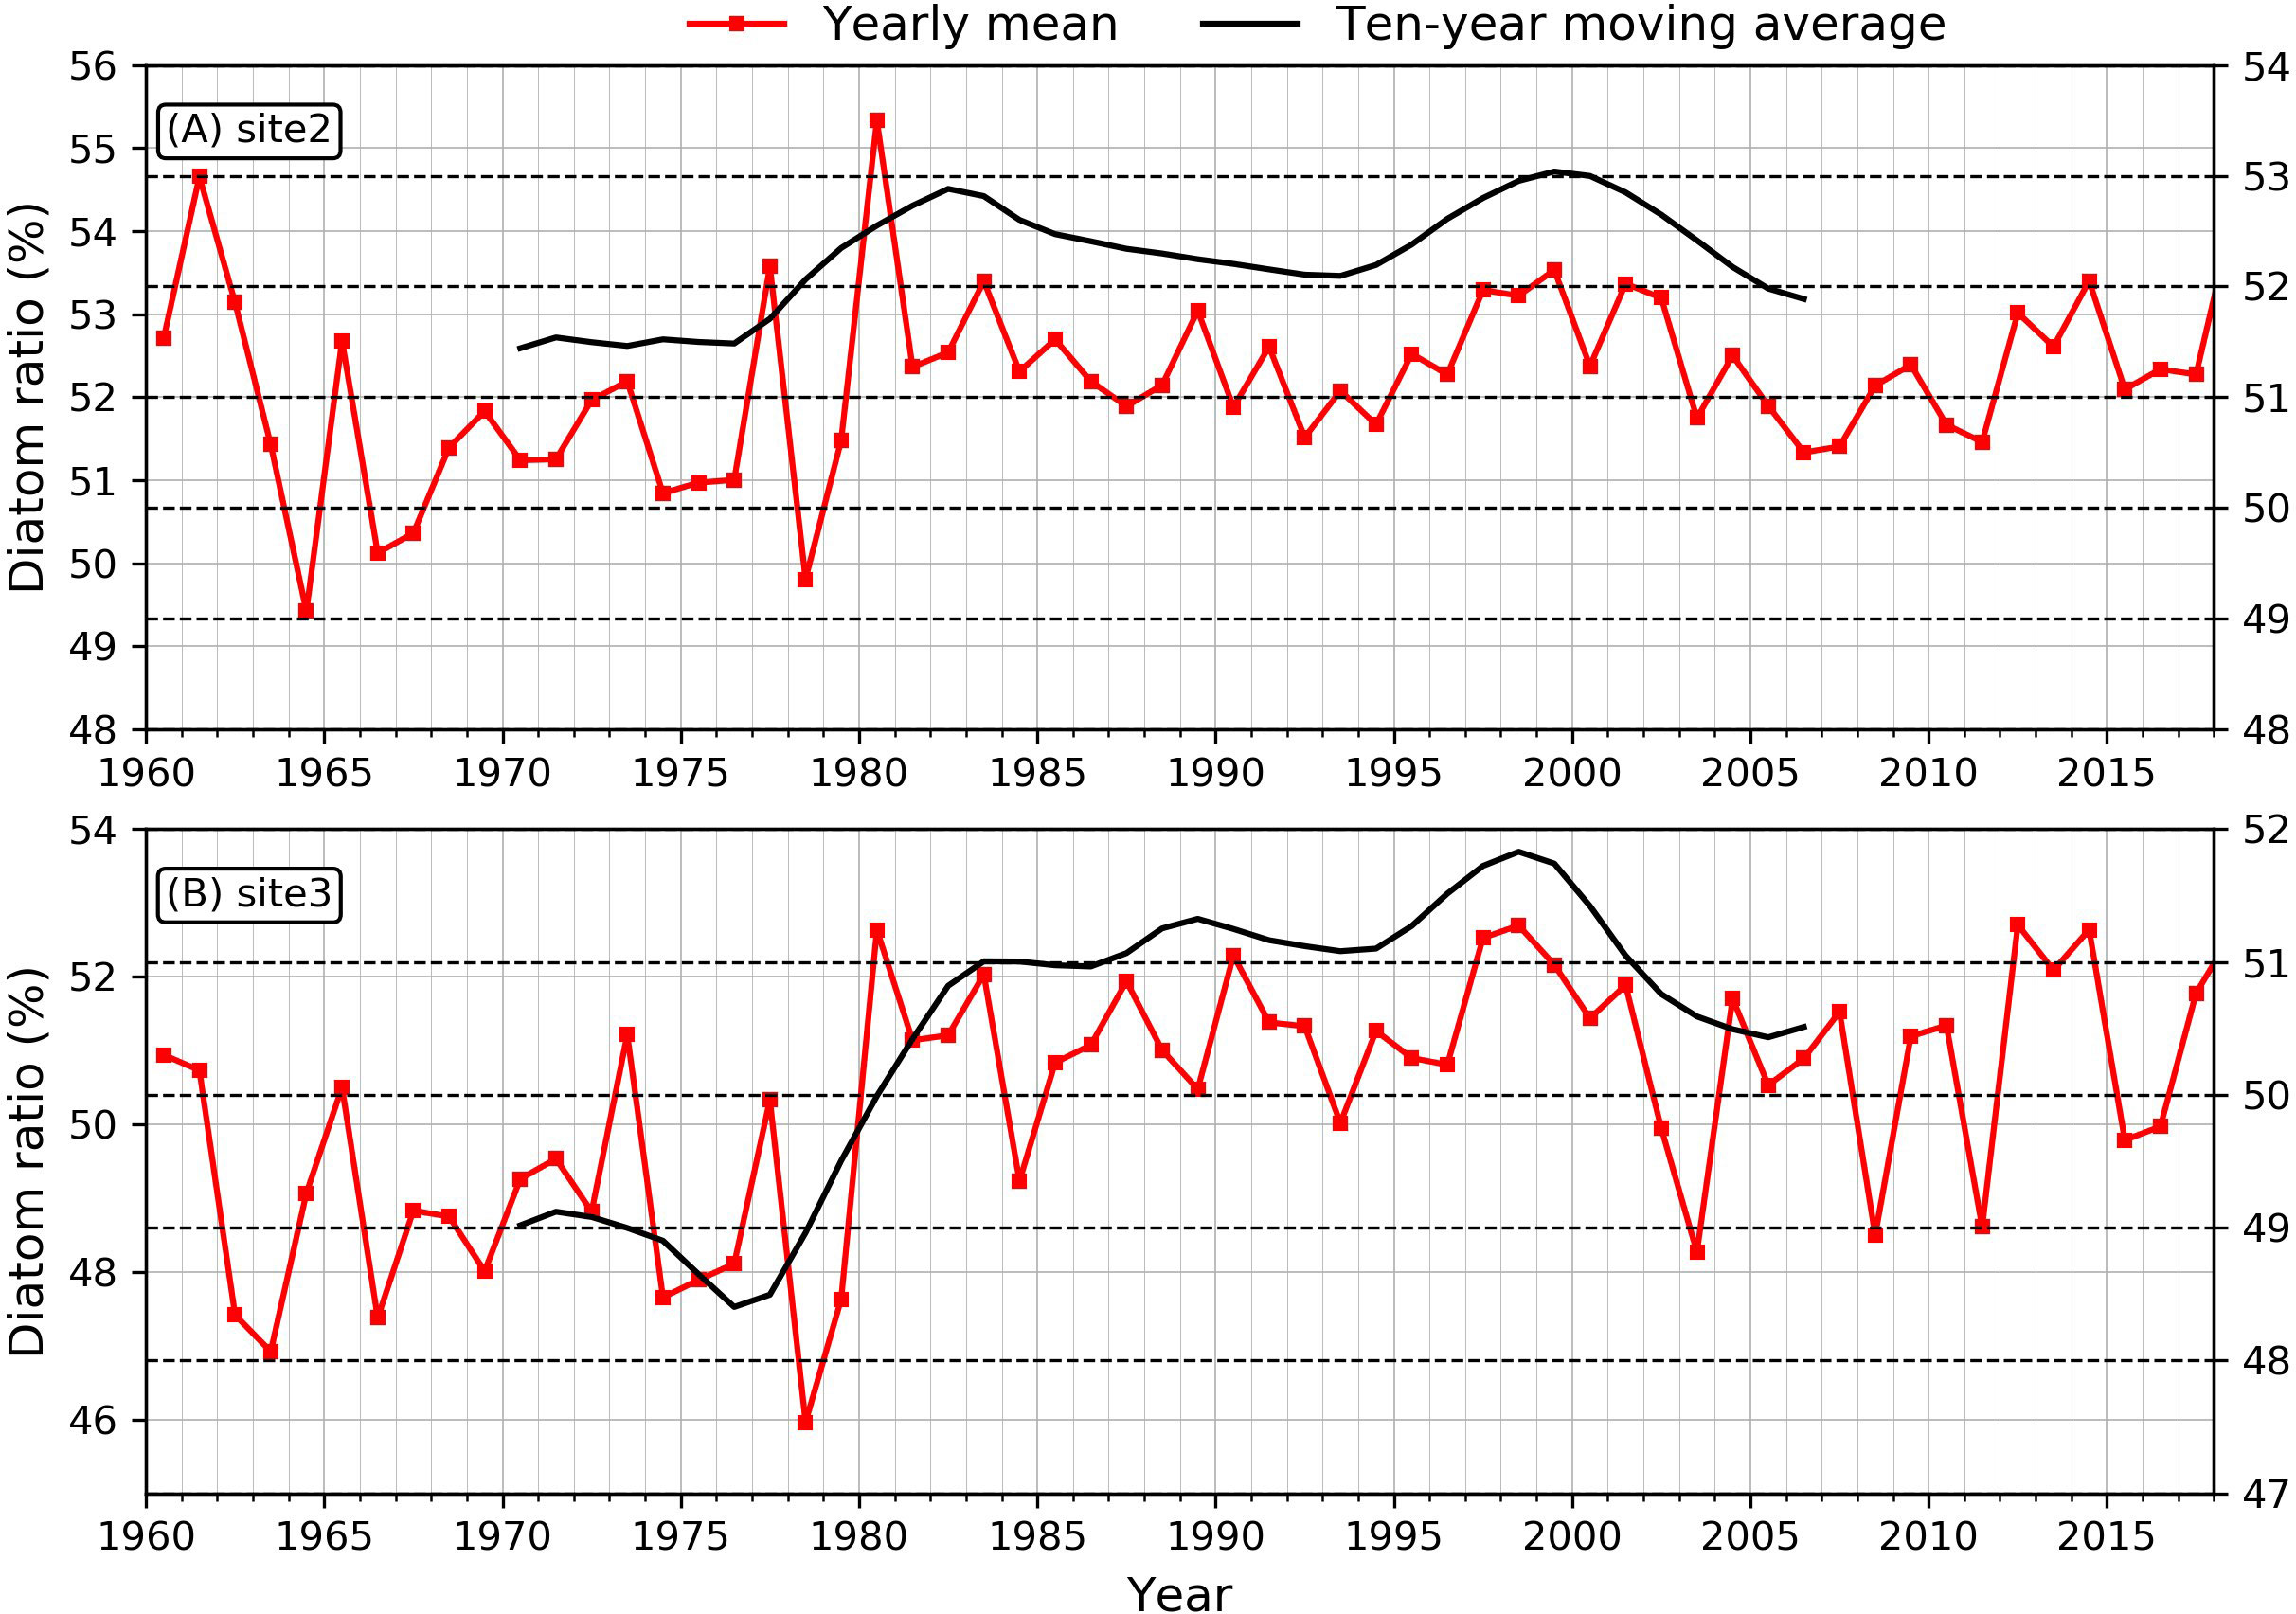
Figure 7 Time series of the diatoms proportion at (A) site 2 and (B) site 3. The black lines are ten-year filtered.
To further address the variabilities of other phytoplankton species on the estuary and inner-shelf. We checked the timeseries of micro-phytoplankton, nano-phytoplankton and pico-phytoplankton at site 2 and site 3 (Figure 8). It demonstrated that the fraction of micro-phytoplankton at site 2 (Figure 8A) is more than 20% and is larger than that of nano-phytoplankton (~15%) and pico-phytoplankton (~10%). However, at site 3 which located further offshore (Figure 8B), the nano-phytoplankton becomes the dominant specie among the three species. The proportion of micro-phytoplankton and pico-phytoplankton both remain at ~15%. As for the trended changes, the fraction of micro-phytoplankton at site 2 has declined since the late 1960s (Figure 8A). For site 3, both the pico-phytoplankton indicates the most significant decreasing trend (Figure 8B). These declines of smaller phytoplankton species correspond with the increase of diatoms proportions simultaneously, which is associated with the change of nutrient ratios.
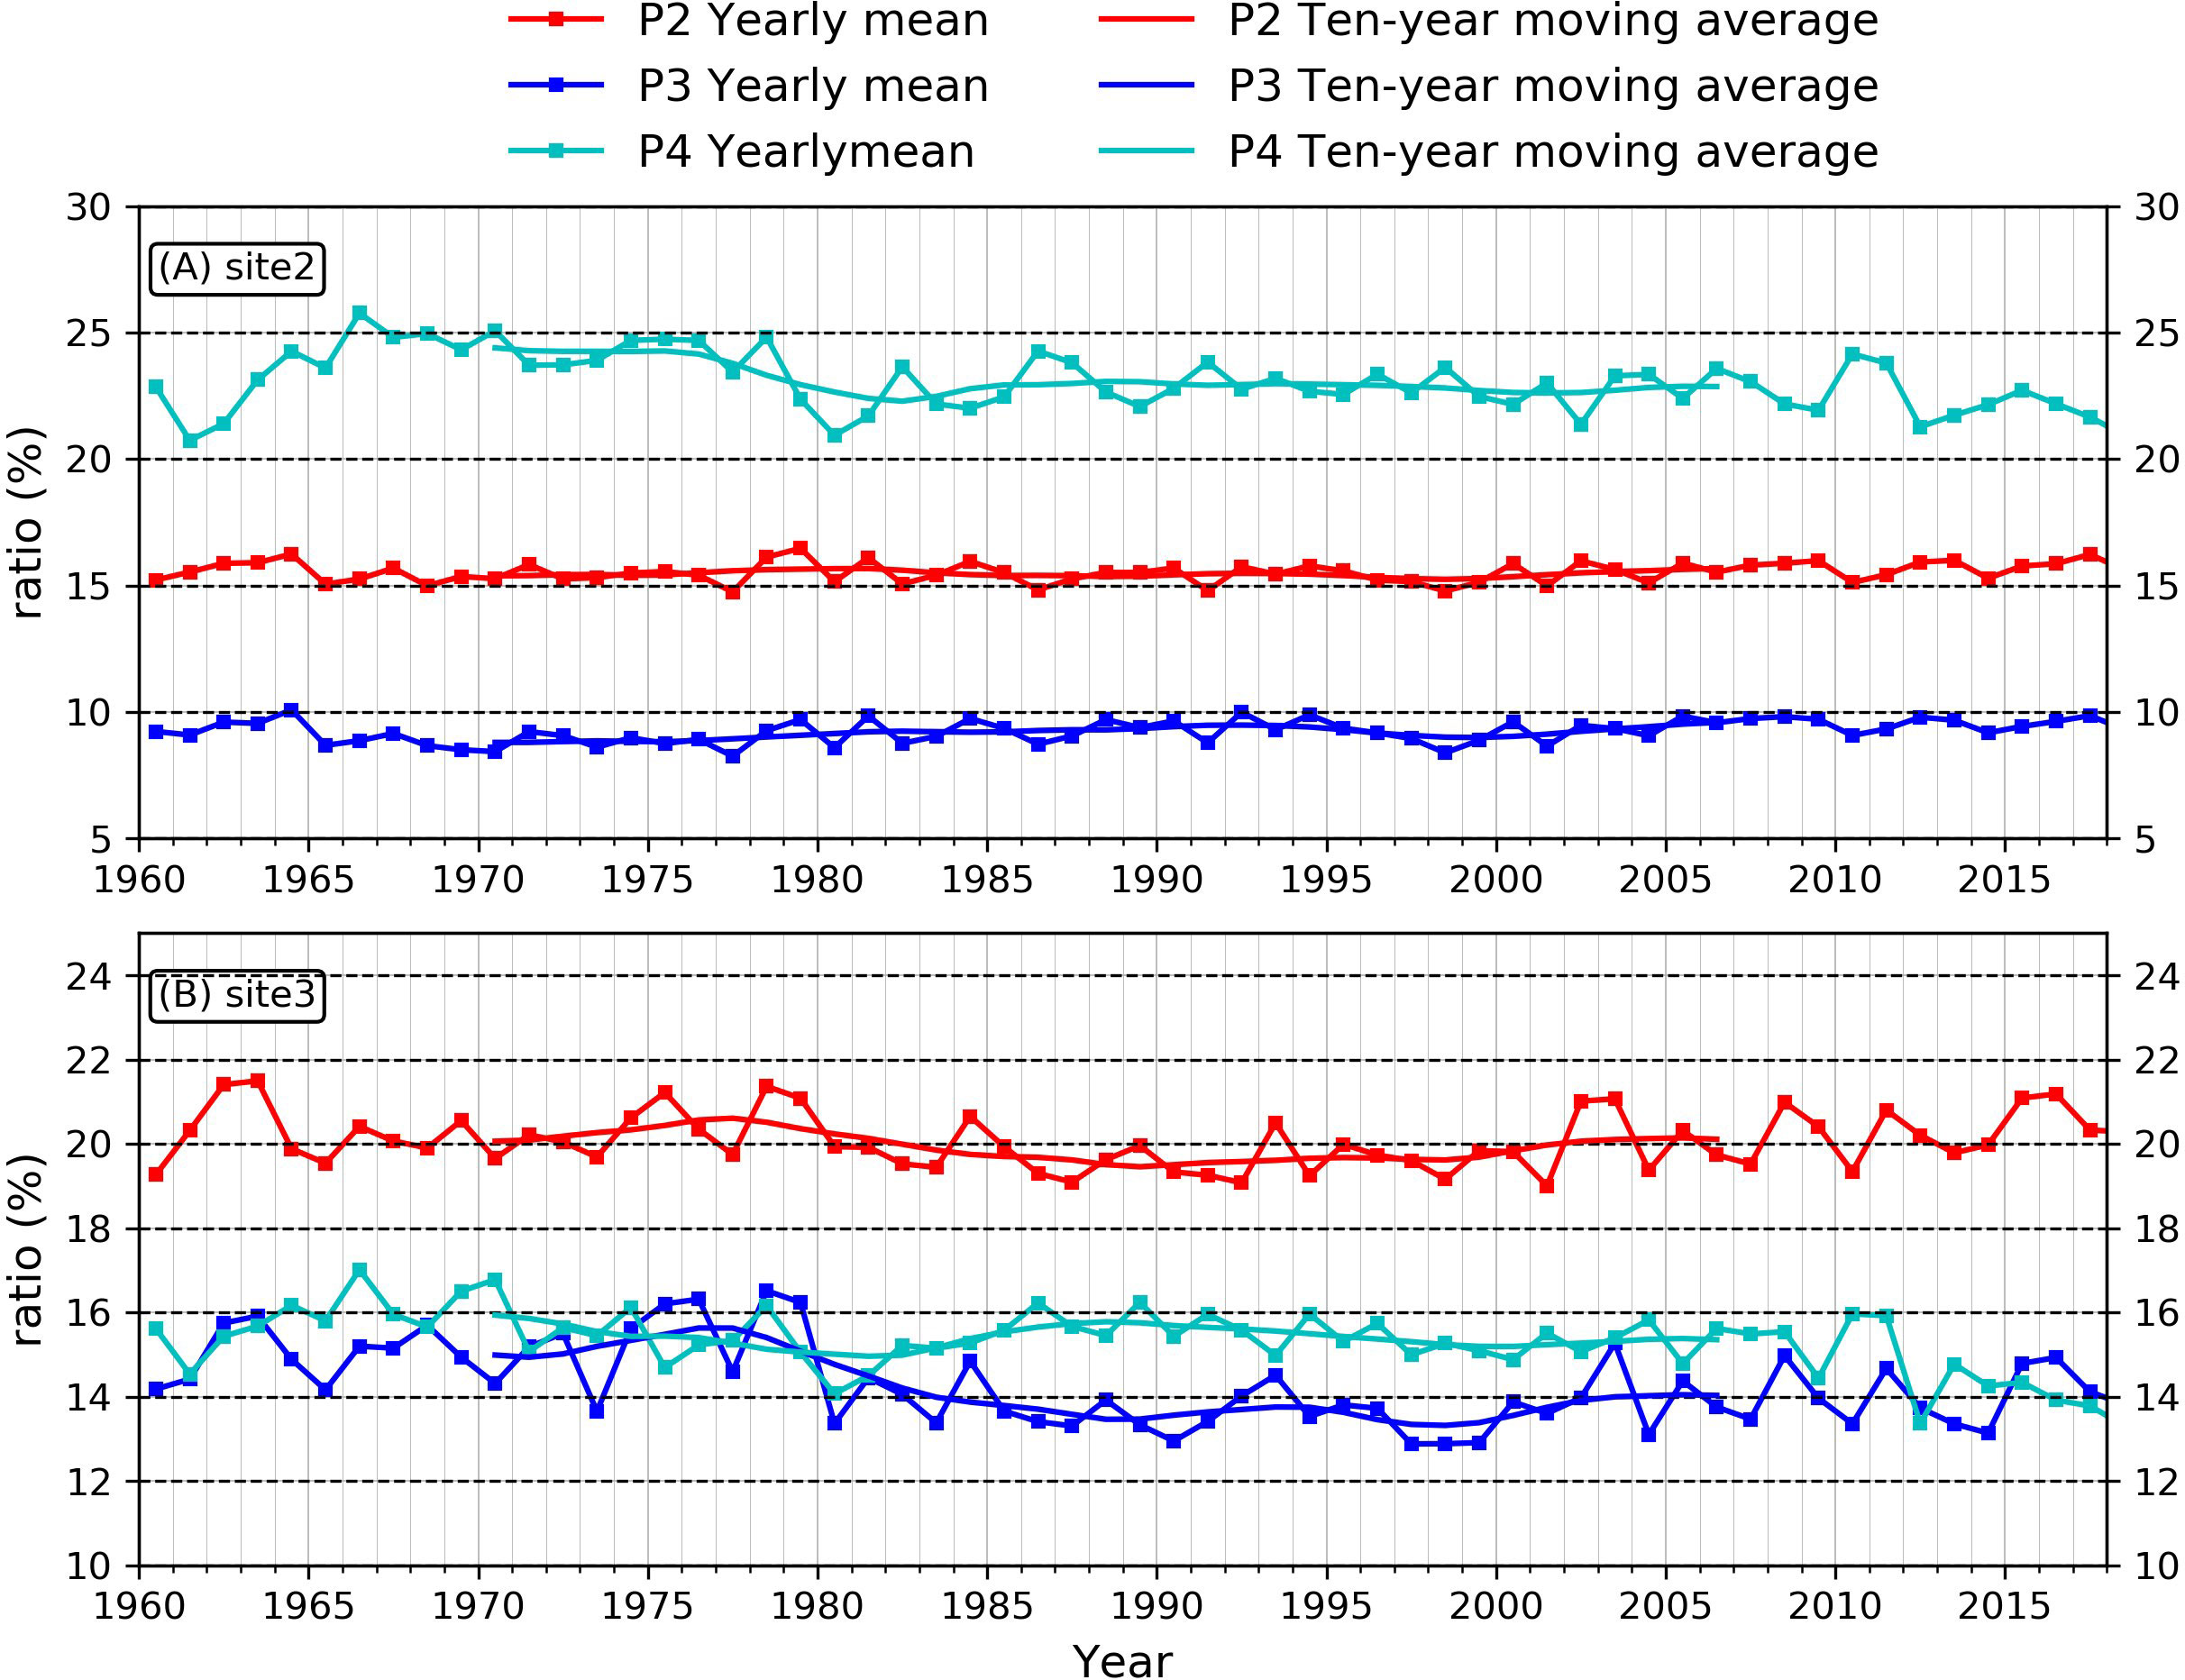
Figure 8 Time series of other phytoplankton proportions at (A) site 2 and (B) site 3. P2 denotes nano-phytoplankton, P3 denotes pico-phytoplankton, P4 denotes micro-phytoplankton.
After analyzing the time series of nutrients and phytoplankton at the selected sites, we investigated how the changes in riverine nutrient inputs led to the temporal and spatial variability of nutrients and the associated phytoplankton distributions in this river-estuary-shelf continuum. We used the concentration in 1960 as the background value and calculated the percentage changes of nutrients in the next 10, 20, 30, 40, 50, and 60 years. From 1960 to 1969 (Figure 9), the nitrate concentration barely changed in the entire study area. As the nitrate input from the Changjiang increased gradually, it accumulated in the estuary and began to spread out to the sea. By the end of the 1970s, a small part of the inner shelf, the nitrate concentration increased by about 50% of its original value and nearly 80% in the river channel (Figure 9B). After 1980, the Changjiang Basin experienced a rapid nutrient increase over the next 30 years. In 1989, the river mouth and Hangzhou Bay nitrate concentrations were ~1.5-fold greater than those in 1960. Then, the nutrients started to spread further south of Hangzhou Bay (Figure 9C). This pattern persisted during the 1990s (Figure 9D). Until 2009 (Figure 9E), a large portion of the inner shelf was affected by nitrate from the Changjiang runoff, which could reach as far as 124.5°E in the east. At the river mouth, the nitrate concentration increased to 400% of the background value in 1960. During the 2010s, the nutrients from the Changjiang runoff remained stable because of wastewater discharge control (Shen et al., 2012; Shen et al., 2020). The riverine input affected area expanded north of the Jiangsu coastal area (Figure 9F). Phosphate showed a different pattern than nitrate (Figure 10), beginning to increase rapidly in the 2000s to a maximum of 200% (Figure 10E). At the same time, high phosphate levels also extended offshore, but unlike nitrate, this extension was limited to 123°E (Figures 10E, F).
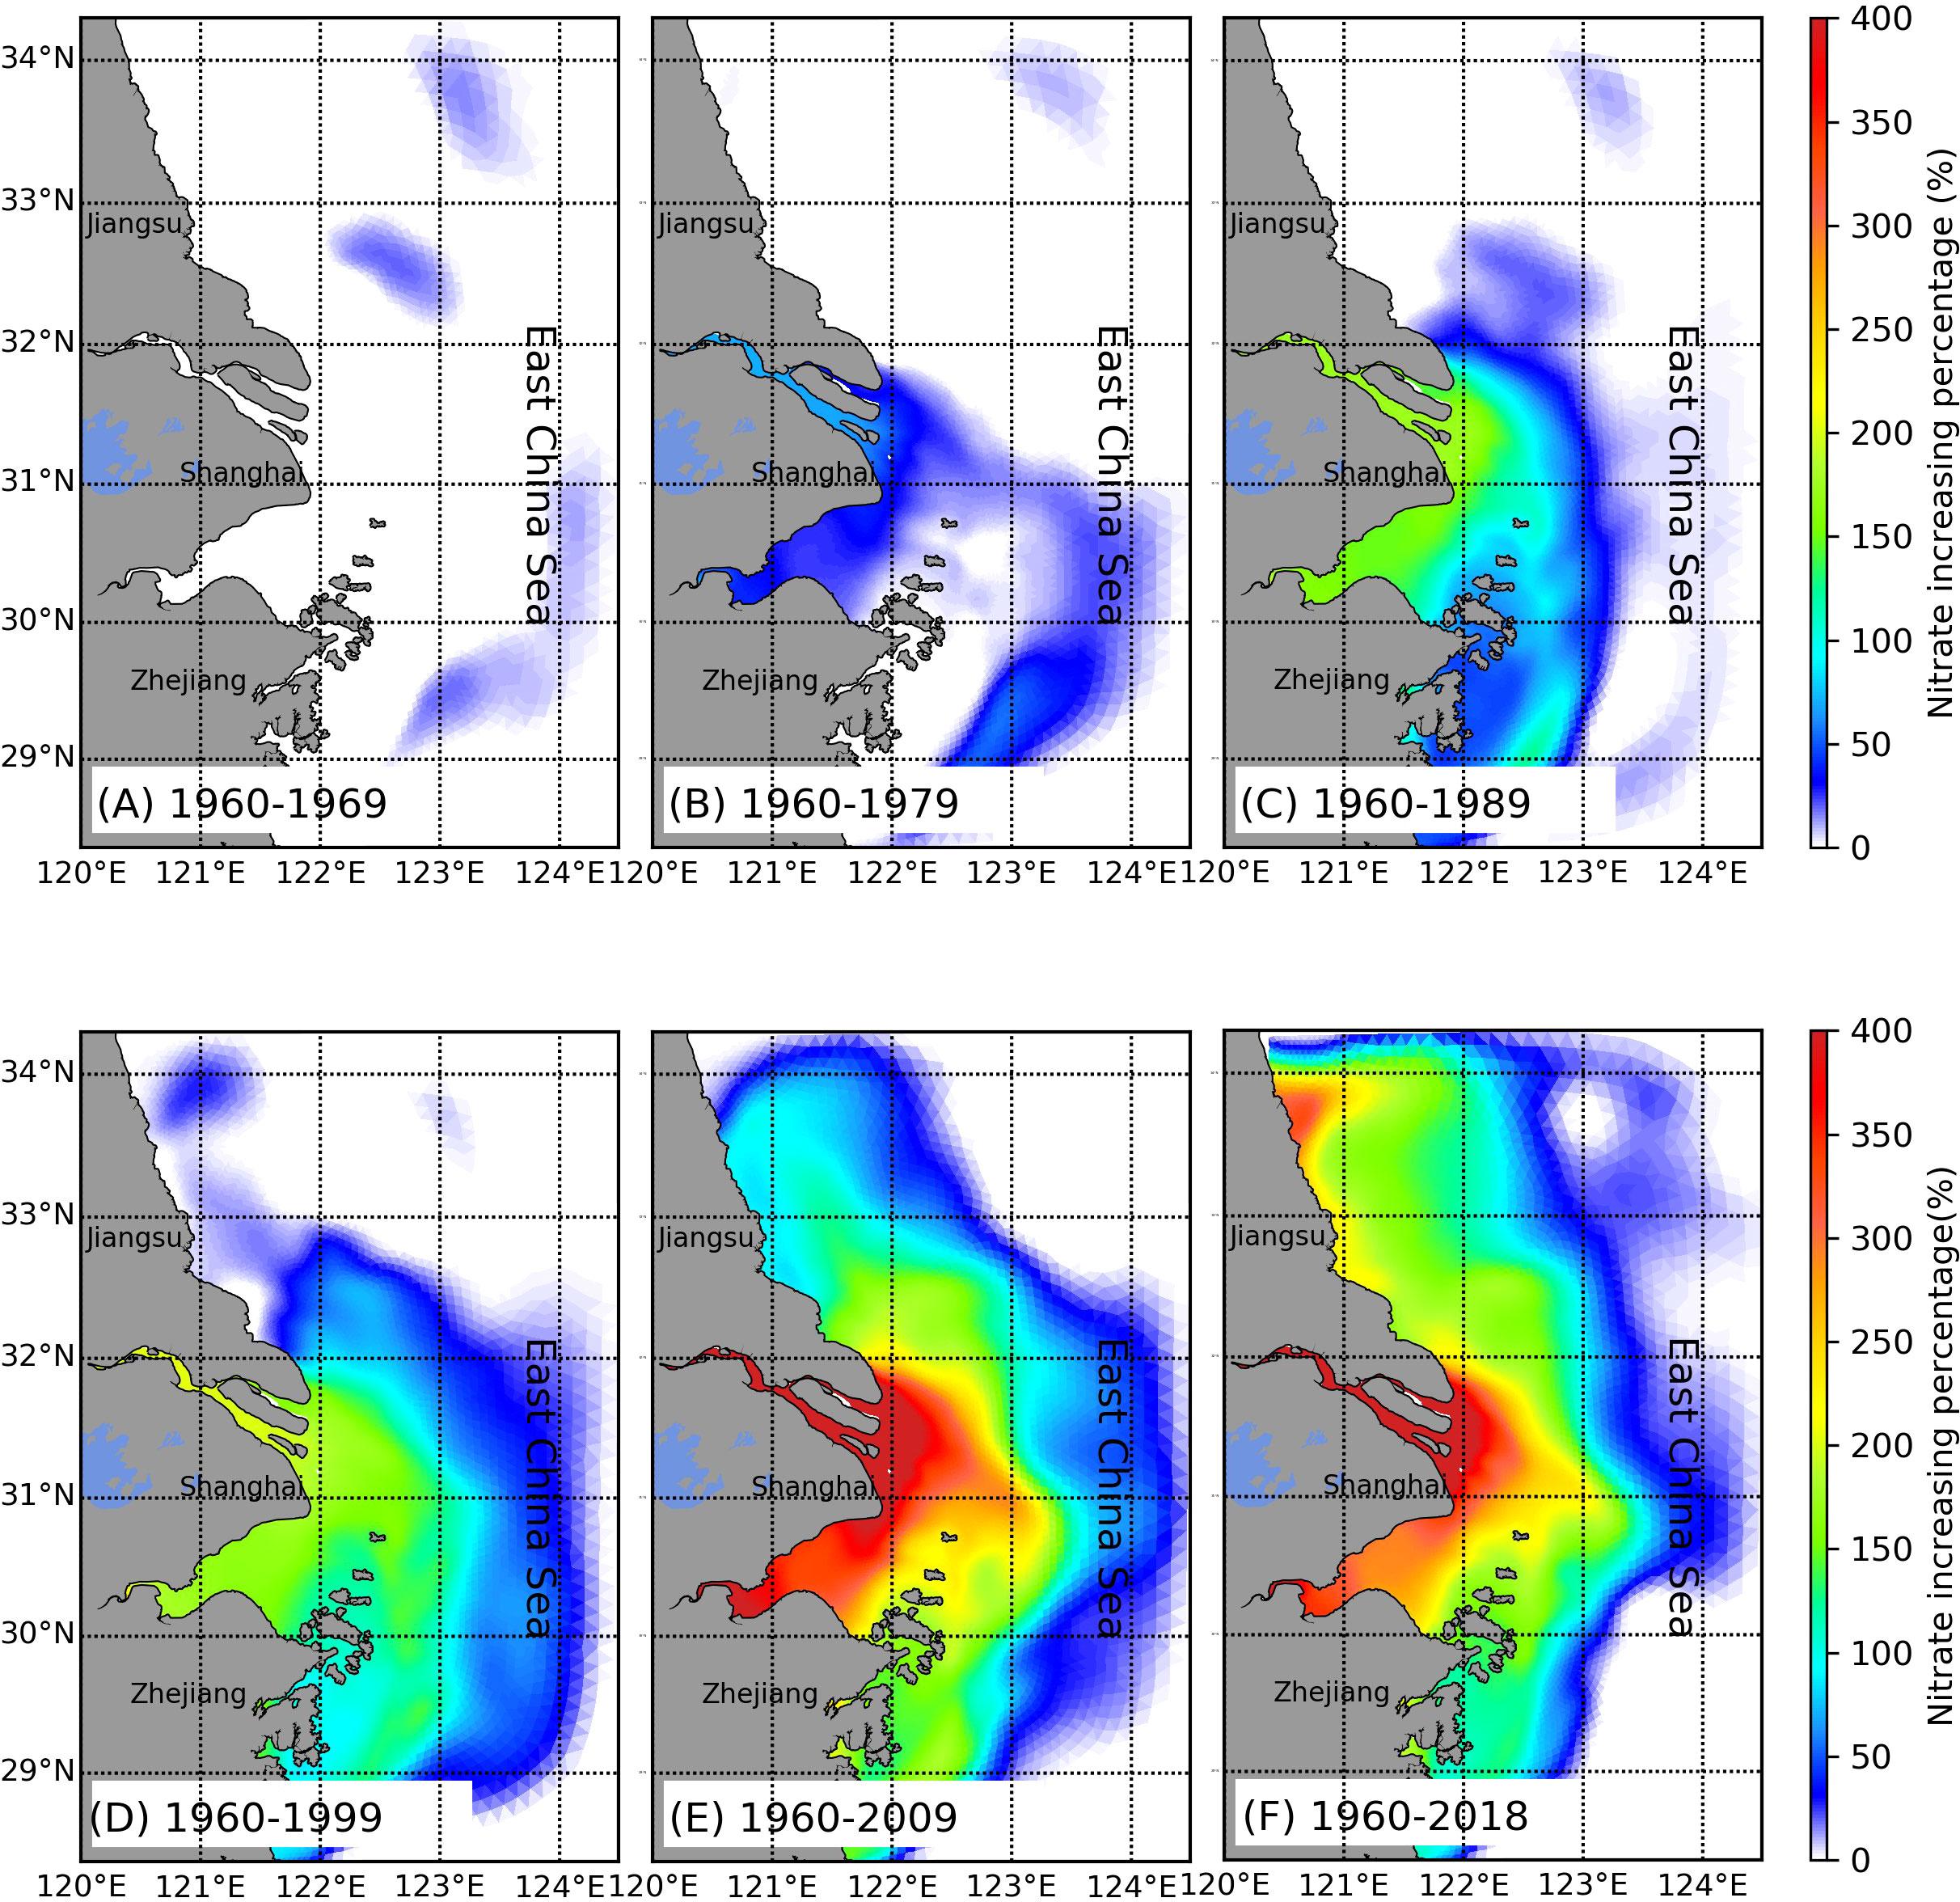
Figure 9 Distribution of the changing percentage in the nitrate concentration during (A) 10 years, (B) 20 years, (C) 30 years, (D) 40 years, (E) 50 years, and (F) 60 years.
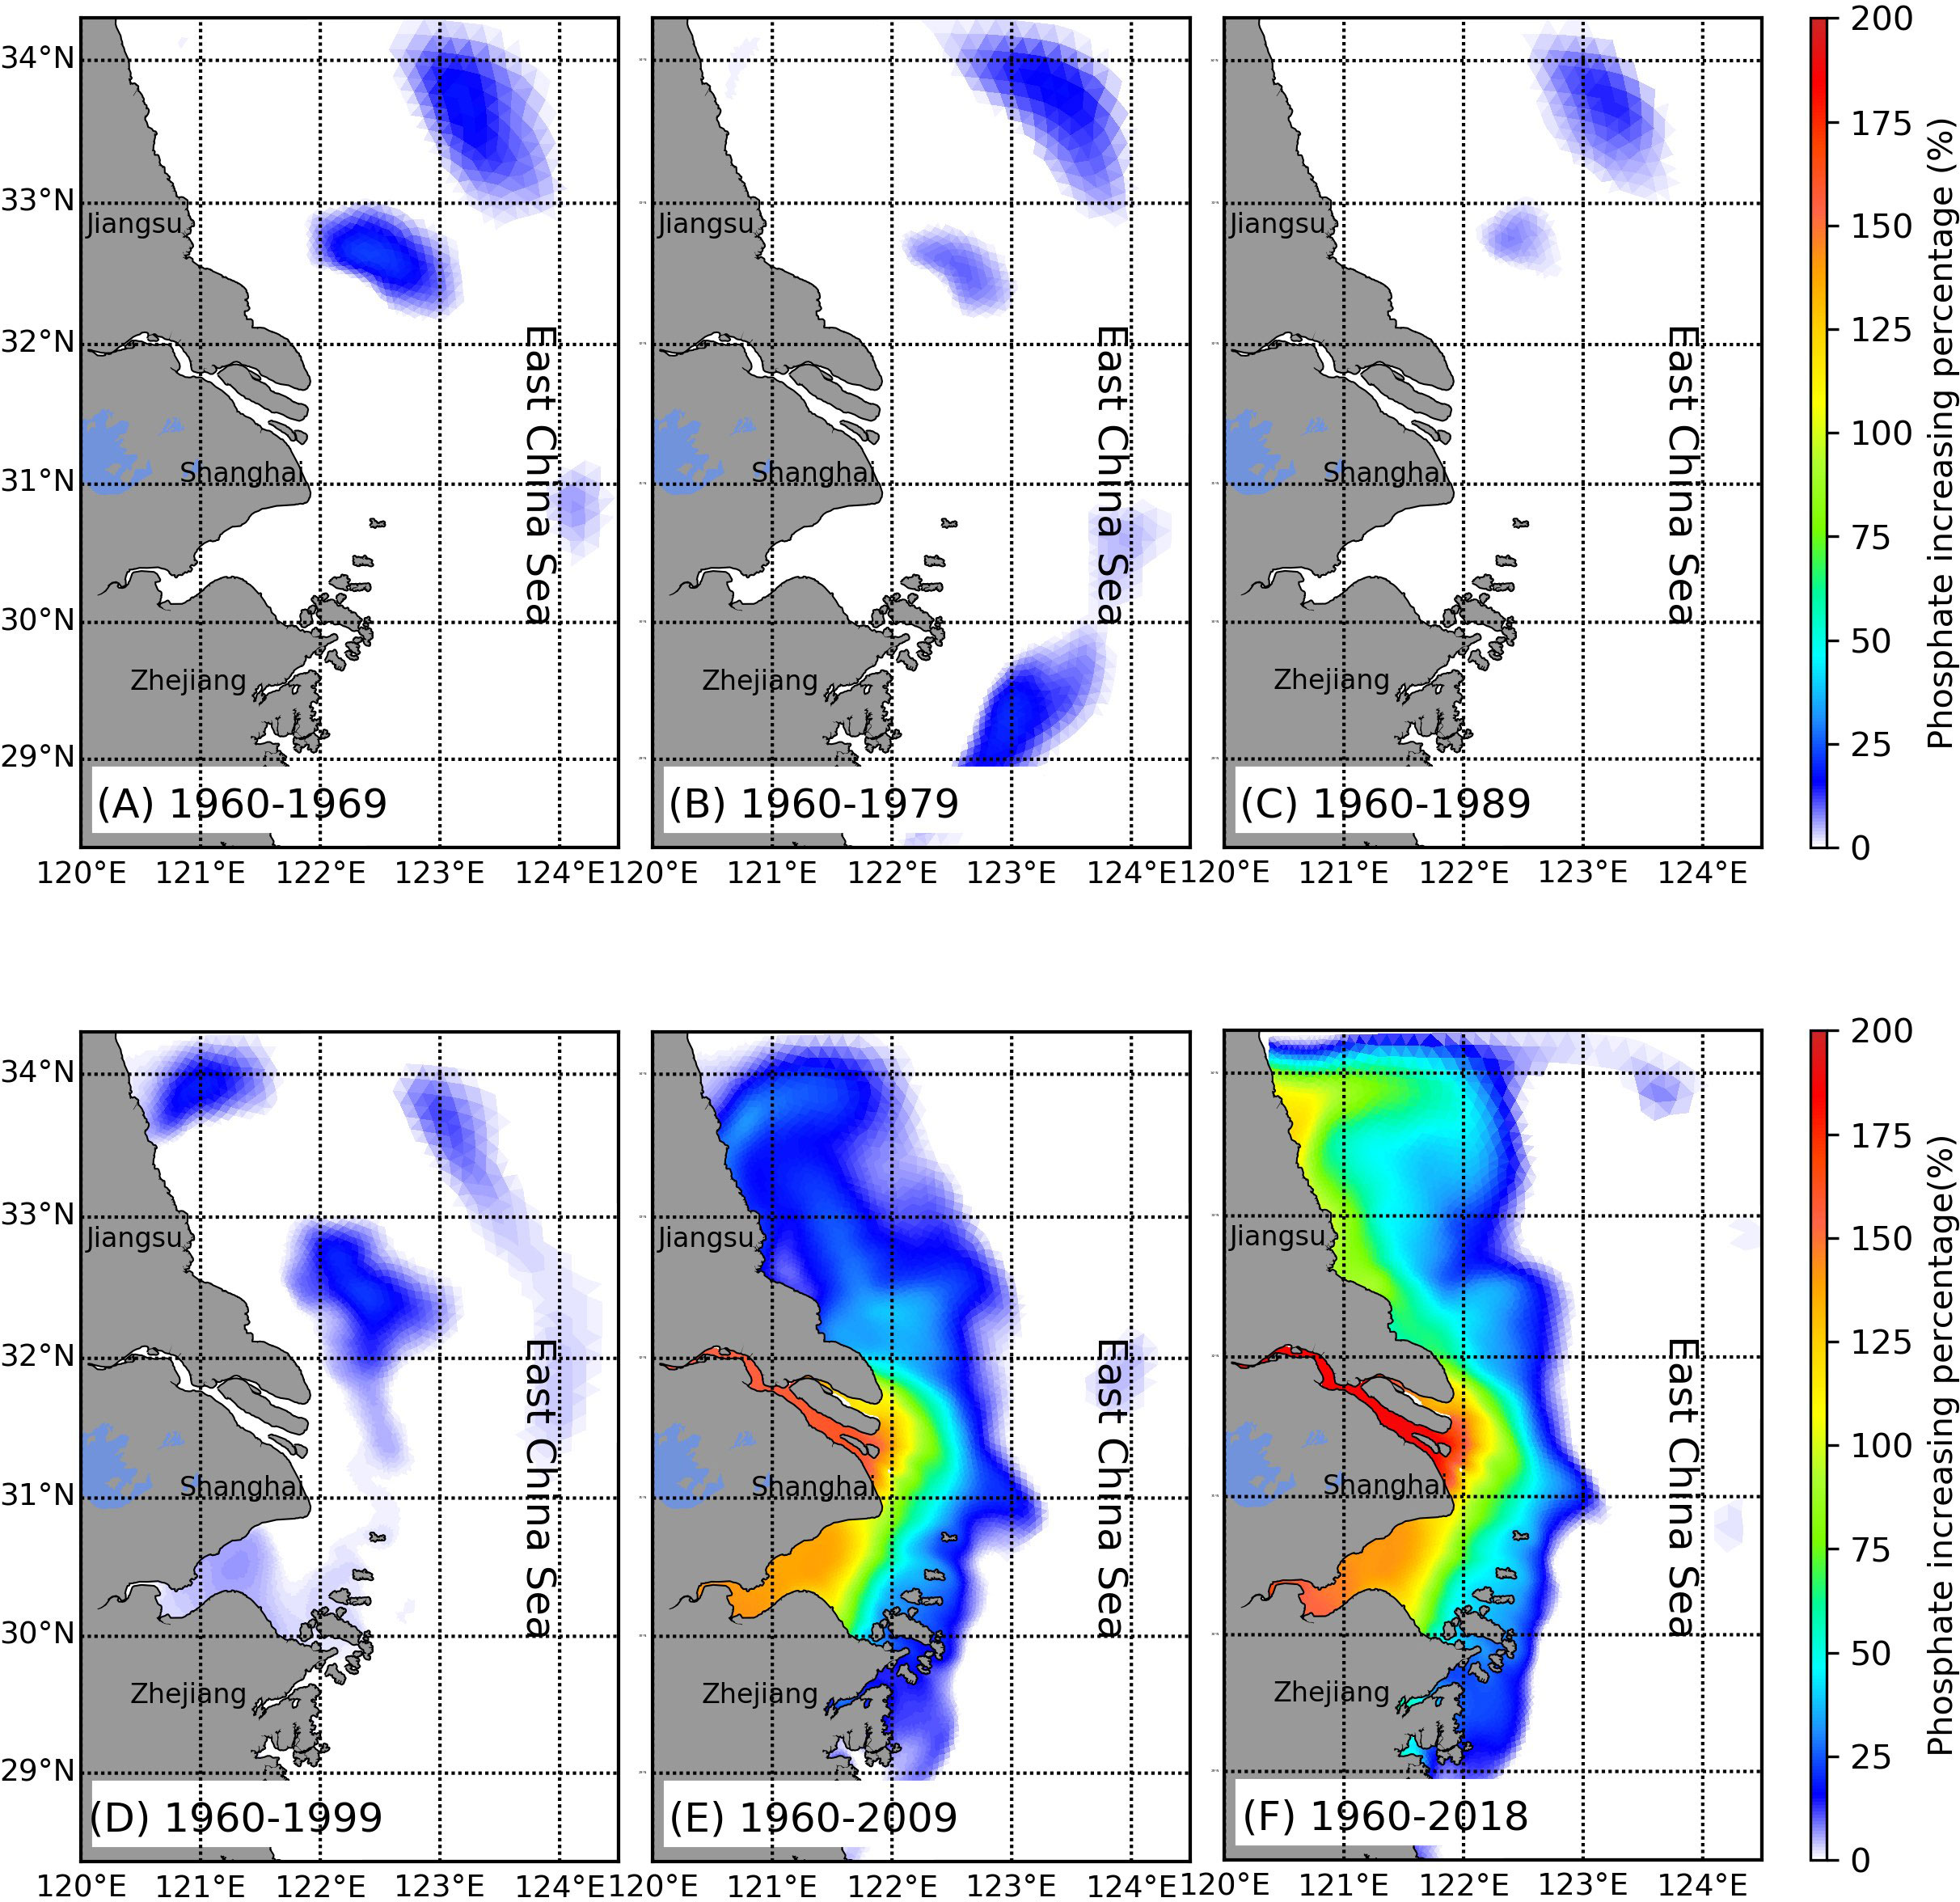
Figure 10 Distribution of changing percentage in the phosphate concentration during (A) 10 years, (B) 20 years, (C) 30 years, (D) 40 years, (E) 50 years, and (F) 60 years.
With variations in nutrient concentrations and nutrient proportions, the phytoplankton community also shifted in the whole estuary. While the nitrogen loads were accelerating, silicate did not increase significantly and even decreased after 2000; consequently, the Si/N ratios continued to decrease and have declined to lower than the Redfield ratio in recent decades. The silicate concentration is more likely to regulate diatom growth than other types of phytoplankton, e.g., dinoflagellates; thus, the diatom biomass decreased with the declining Si/N ratio. Therefore, the structure of the phytoplankton community changed. Our analyses of the diatom proportion over the whole study domain suggest that diatoms typically dominate the phytoplankton community of the Changjiang Estuary and inner shelf, contributing to more than 50% of the surface chlorophyll values (Figure 11A). To compress the spatial and temporal variability of the diatom proportion maps into a set of dominant modes with spatial functions and associated time-varying amplitudes, we employed EOF analyses on the 59 years’ time series (Figures 11B, C). The first EOF mode of diatom proportion explained 32.4% of the total variance. The spatial coefficients are positive over most of the inner shelf, with the most significant spatial variance in the Jiangsu coastal. There Changjiang Estuary also experienced remarkable changes. The temporal variability is shaped as an increasing trend from the end of the 1960s to the middle of the 1980s and oscillates back and forth. There has been a 10-years decline since 2000 (Figure 11C). The results of the EOF spatial coefficient and the temporal amplitude suggest that the diatom proportion change could be regional. Some areas further offshore on the outer shelf with negative spatial coefficients (Figure 11B, light blue color) suggest a diatom decreasing trend along the time series. This is because the significant changes in riverine nutrients have not affected these areas; other factors, i.e., temperature increasing could result in such variability.
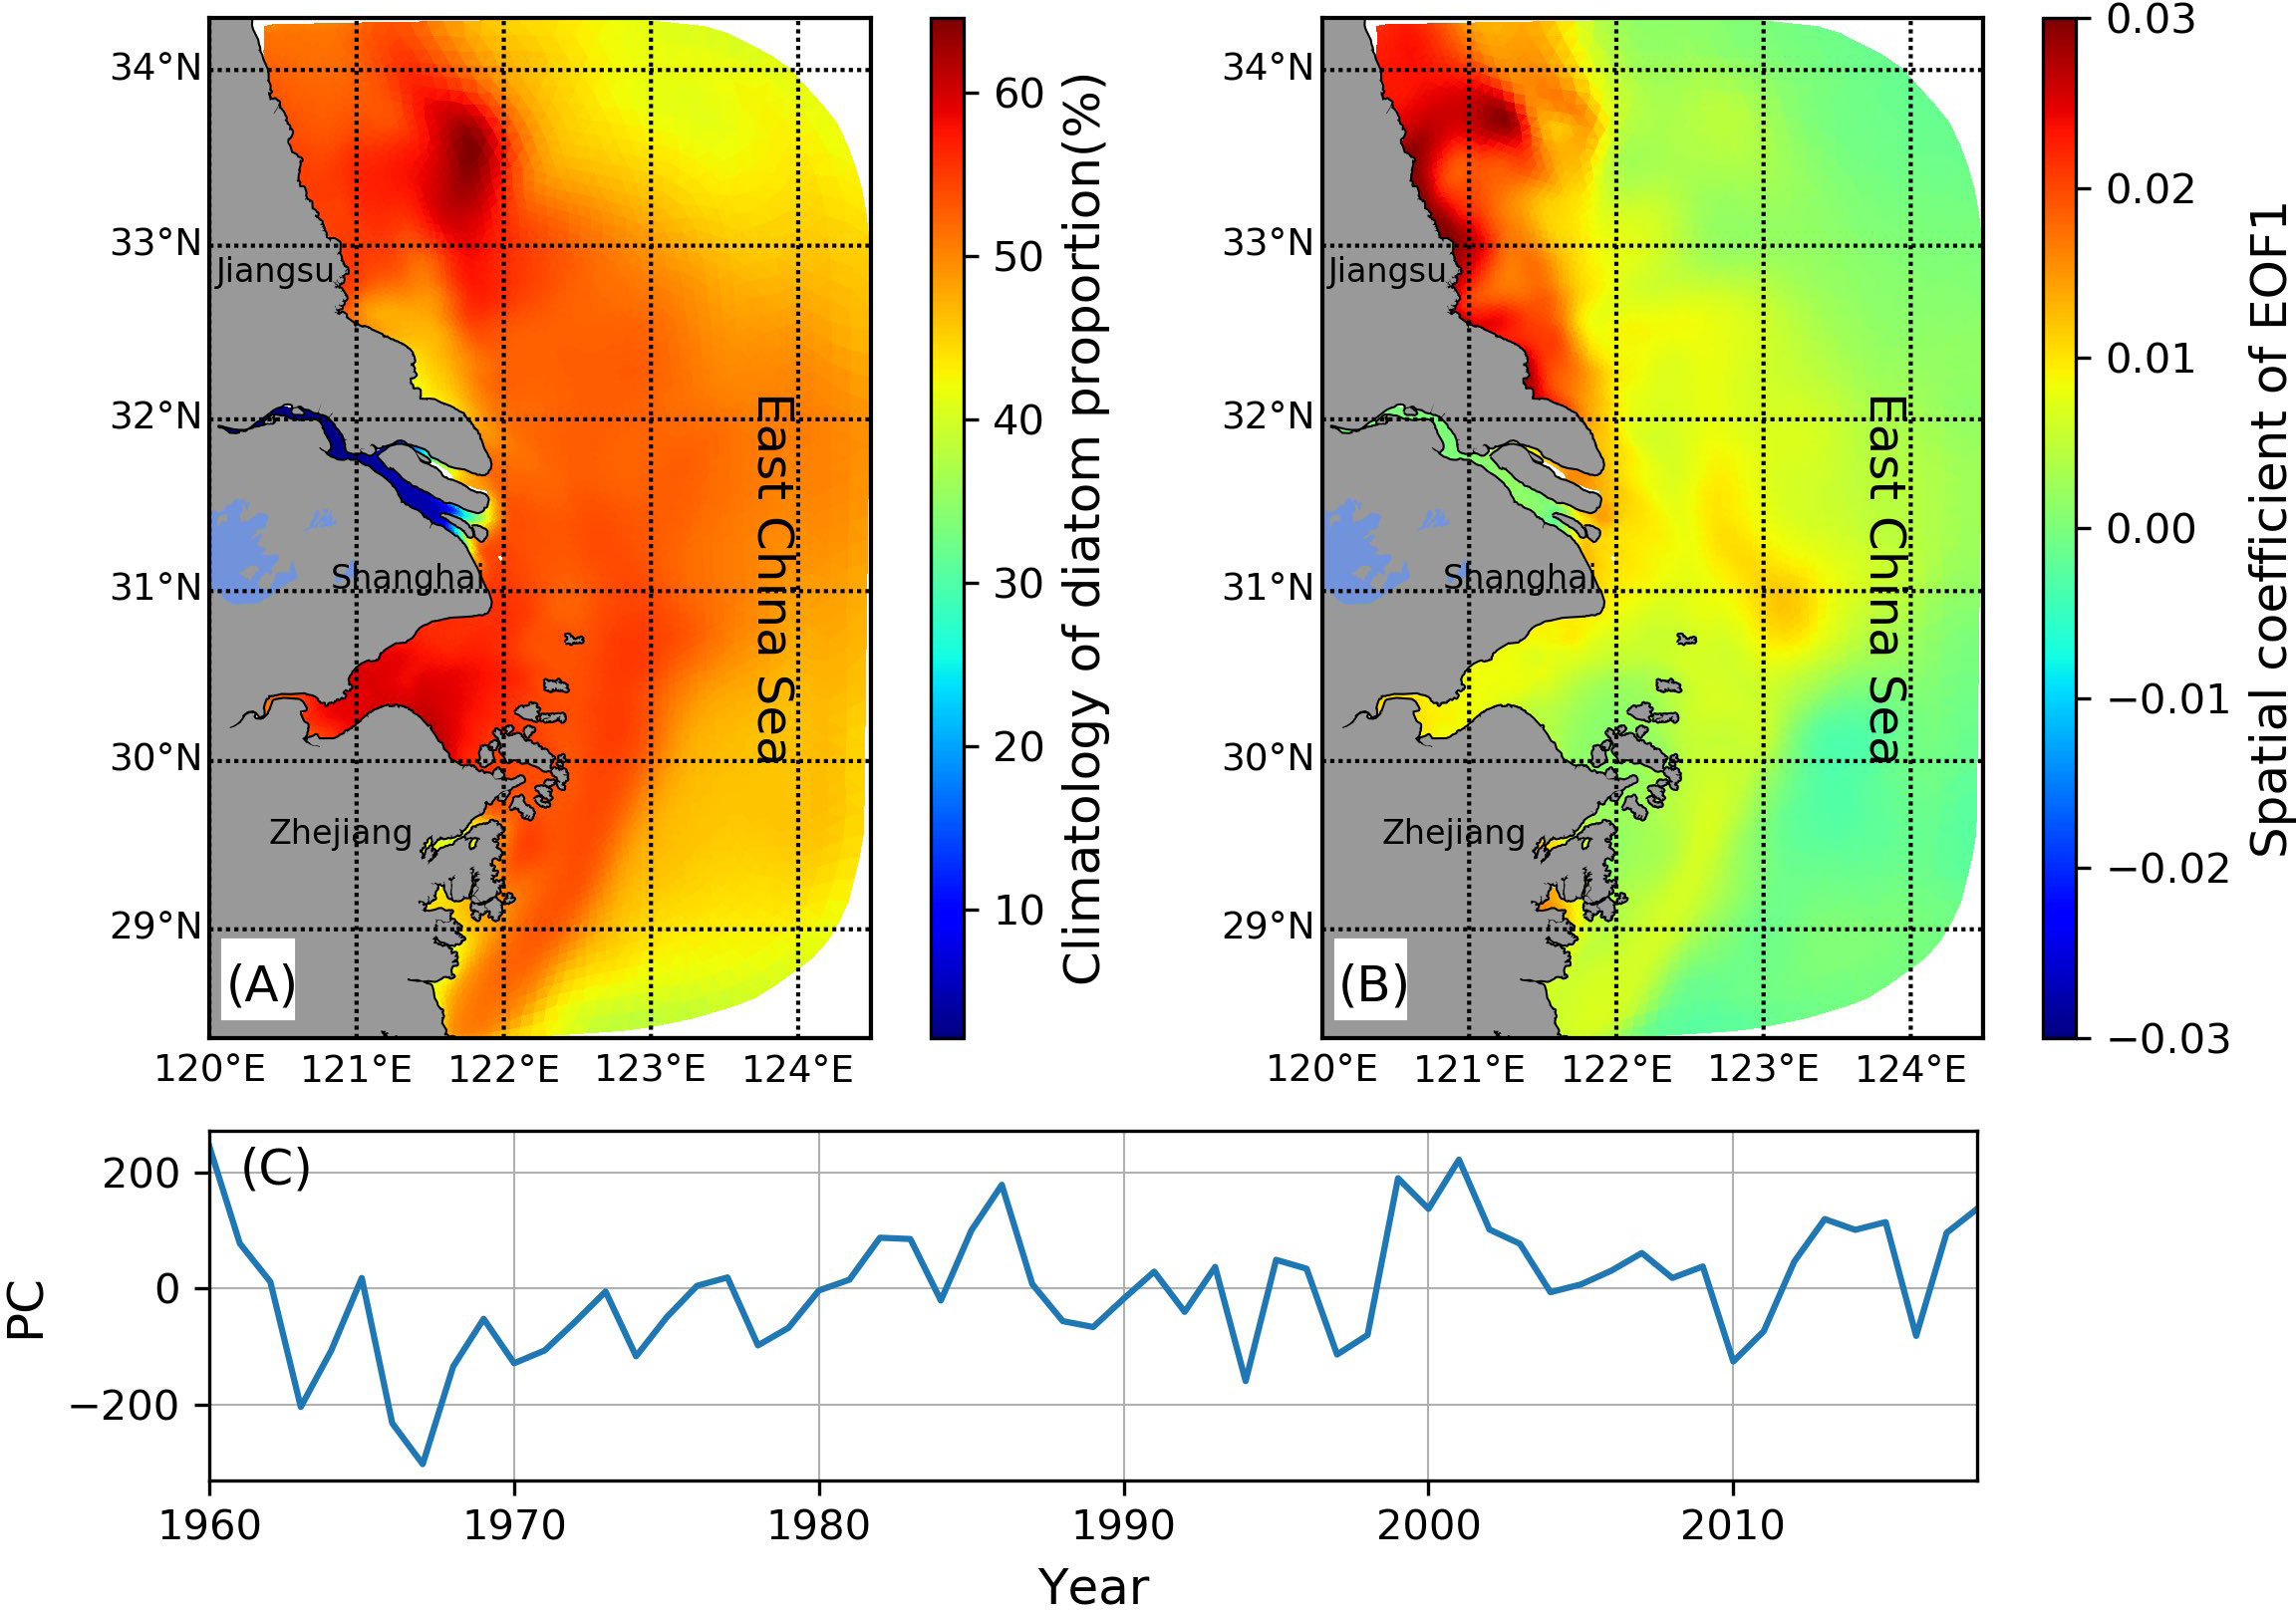
Figure 11 (A) Model simulated diatom proportion climatology calculated based on the model output from 1960 to 2018. (B) The spatial coefficient of the first empirical orthogonal function (EOF) mode of diatom proportion. (C) The temporal amplitude of the first EOF mode.
Based on a delicate grid design that can refine different spatial scales from the river channel to the estuary and the shelf, and considering various biogeochemical processes influencing the phytoplankton dynamics, our model was able to reproduce the multi-decadal changes in the nutrient distribution and the associated phytoplankton variability in the river-estuary-shelf continuum of the Changjiang Basin. In the river channel and the river mouth, the light was the main factor limiting the uptake of nutrients by phytoplankton due to a high sediment load. Thus, the nutrient concentration distribution in this area was mainly affected by riverine nutrients. Our model successfully showed that the time series of nutrients at site 1 located at the river channel were close to the riverine nutrient observations at Xuliujing station in Zhang et al. (2021). The modeled nitrogen load increased five-fold from 1970 to 2015. Regarding the variation in silica, our model captured its stable variability at a concentration between 100 and 120 μM at the river channel, which is in the same range of variance as the measurement in Zhang et al. (2021) during the same period. For the sites over the estuary, our model results suggest that nutrient dynamics are influenced by the dilution due to abundant river discharge (Wang et al., 2014) and the phytoplankton uptake. The simulated nutrient decrease from the river mouth to the inner shelf was consistent with observations conducted at a similar location (Zhang et al., 2007; Jin et al., 2010; Liu et al., 2014). Our model can also present the nutrient element variabilities in different regions. As shown in Figure 4, the phosphate in the inner shelf (site 3) did not show a prominent increasing trend compared with the other riverine sites (i.e., the river channel and the river mouth). This was different from the nitrate variability that all three sites indicated a significant increase in nitrate. The difference is that nutrient at site 3 is much more influenced by phytoplankton activity than sites 1 and 2, making the nutrient concentration processes more complicated. Moreover, the Changjiang Estuary is phosphorus-limited (Li et al., 2007; Duan et al., 2008; Ge et al., 2020a), and the increasing riverine phosphate will be consumed by phytoplankton in response, thereby slowing the rate of increase of phosphate at site 3. The nutrient change map confirmed that a significant increase in phosphate only existed in the river channel within the maximum turbidity zone; however, the nitrate increase could reach further offshore because of abundant leftover nitrate.
Based on the reproduced nutrient time series, our model simulated the community structures of the primary producers in the estuary. A significant increase in primary production during the 59 years was presented. Our model also successfully reproduced the change in the phytoplankton functional type during this period. The diatom proportion is relatively low In the river channel and river mouth due to light limitation compared with the area beyond the estuarine turbidity maximum zone. The EOF analysis suggested a significant increase in the diatom proportion along the 59-year time series. It is worth noting that there was a period after 2000 in which the diatom proportion decreased (Figures 7A, 11C). This could be associated with a decline in riverine silica because of decreases in the sediment load after the 2000s. Such asymmetric changes in nutrient stoichiometry could result in a gradual shift to silicate limitation. Our modeled phytoplankton community generally shows a similar spatial distribution as described in Liu et al. (2016), with higher diatom proportion in the estuary and inner shelf. For the temporal variability, our modeled diatom proportion decrease are consistent with the findings in Jiang et al. (2010) and Xiao et al. (2018), it reveals that there are more dinoflagellate blooms in the Changjiang Estuary, especially after 2011.
Although there are various hypotheses about the mechanisms underlying the dramatic ecosystem changes in the Changjiang Estuary, the anthropogenic impact is believed to be the main cause. Agriculture and industry developed rapidly in the Changjiang Basin since the 1980s, resulting in a 30-fold increase in nitrogen fertilizer use from 1958 to 1985, a 10-fold increase in phosphorus fertilizer from 1970 to 2010, and a drastic increase in wastewater (Duan et al., 2007; Powers et al., 2015). The amount of fertilizer use increased while the utilization efficiency continued to decrease; this resulted in nitrogen and phosphorus accumulating in the soil and rising their loads into the waters (Bouwman et al., 2013; Liu et al., 2015; Yuan et al., 2018). Due to industrial wastewater treatment, nitrogen and phosphorus from discharged industrial sewage account for only 1/3 of agricultural wastewater (Bouwman et al., 2005). Therefore, fertilizer use is the main reason for the increasing nitrate and phosphate concentrations in Changjiang and the adjacent coastal areas (Jiang et al., 2010). Before the 1970s, the concentration of nutrients in Changjiang remained low. Since the 1980s, the nitrate and phosphate levels increased rapidly (Duan et al., 2007; Powers et al., 2015). Our model could reproduce nutrient variabilities associated with these activities, e.g., the nitrate and phosphate concentrations increased by 5- and 10-fold, respectively, from 1960 to 2018, with an evident increase starting in the 1980s (Figures 3A, 4A).
Dam construction is also a cause that should be mentioned. Since the 1950s, the increased damming has led to sediment retention and reduced the suspended sediment concentration in Changjiang (Yang et al., 2011; Yang et al., 2018a; Liu et al., 2020); (Guo et al., 2020). According to relevant research, the annual sediment load at the Yichang station decreased by 97% from the 1950s to the 2010s (Guo et al., 2020), and at the DT station, it decreased by 16% from the 1960s to the 2010s (Figure 2A). Due to hydrological engineering, especially the impoundment of the TGD, the annual sediment load decreased, which led to reduced turbidity, decreased light limitation, and thus increased primary production in the Changjiang Estuary (Wang et al., 2017). In addition to affecting the physical conditions in the river and the estuary, the decline in sediment discharge also causes silicate retention (Li et al., 2007; Ding et al., 2019). With increasing nitrate and phosphate and constant silicate, the ratio of nutrients changed, which caused phosphorus and silicate limitations. The dominant phytoplankton species shifted to dinoflagellates that do not need silicon for growth (Zhou et al., 2008; Jiang et al., 2014).
A global warming-induced sea surface temperature (SST) increase is another essential factor that should be considered. Temperature changes and eutrophication are known to affect phytoplankton communities, and when simultaneous changes occur in both temperature and nutrient load, the effects become more complicated. A broadly accepted conclusion from previous studies is that the marginal seas of China experienced a robust, persistent SST increase in the last few decades until the late 1990s (Xie et al., 2002; Wang and Wang, 2013; Pei et al., 2017), followed by a significant cooling trend after, which was associated with a so-called regime shift (Kim et al., 2018). Diatoms prefer lower temperature and higher nutrient concentrations, whereas dinoflagellates are less sensitive to temperature and nutrient variations but tend to prevail under low phosphorus and high N:P ratio conditions (Letelier et al., 1993; Xiao et al., 2018). Previous studies have reported that the phytoplankton in the Changjiang Estuary have shifted to subtropical-tropical and high-salinity species to some degree, e.g., Temoraturbinata, a tropical-subtropical, high-salinity copepod species, became the dominant species in the summer of 2004 (Jiang et al., 2014). Such species adapted to a warm environment are also spreading (Jiang et al., 2017; Jiang et al., 2018b), and species that could not adapt to high temperatures migrated northward. Based on the EOF analysis of the modeled diatom proportion, we saw the most significant increasing trend was at the coast of Jiangsu, which suggests that in addition to the role of nutrients, lower temperature lower temperatures may also be responsible for the diatom increase. This variability is very close to the temporal variability of silicon (Figure 5) and SST (Kim et al., 2018). However, we couldn’t identify which was the dominant factor for diatom variability in this study. More diagnostic runs are needed in future studies.
Due to continued intense anthropogenic impacts worldwide and global climate change, giant rivers and their corresponding estuaries have changed significantly since the 1950s. Eutrophication is a widespread phenomenon. The concentrations of N and P in the Mississippi River have increased drastically since the 1950s (Lohrenz et al., 2008; Smits et al., 2019). Silicate has decreased due to the burial of freshwater diatoms since 1960 (Rabalais et al., 1996). Since the 1950s, nutrients in the Chesapeake Bay have increased and resulted shifts of nutrient structure and phytoplankton species (Prasad et al., 2010; Harding et al., 2015). The Black Sea also experienced eutrophication; however, after the dam construction in the 1970s, the silicate load decreased by over 60%. The influence of Si/N ratio on phytoplankton structure was more considerable than that of eutrophication. The phytoplankton community shifted from diatoms to coccolithophores and flagellates (Humborg et al., 1997; Yunev et al., 2007; Daskalov et al., 2017). For the Nile River, the construction of the Aswan High Dam in 1964 caused a significant decline in sediment, discharge, and silicate flux. However, the Nile River did not experience eutrophication at that time because of limited nutrient inputs (Chen et al., 2021). Therefore, phytoplankton and fish populations continued to decline because of nutrient limitation. The ecosystem recovered until the early 2000s because of increasing nutrient input (Chen et al., 2021). All these studies indicate that most giant rivers and their corresponding estuaries have suffered eutrophication since the 1950s and the 1960s because of increasing N and P inputs from anthropogenic activities. The construction of dams caused the concentration of silicate to decrease, resulting in a shift in the structure of the nutrients and phytoplankton communities.
We used the FVCOM-ERSEM biogeochemical model to simulate long-term nutrients and phytoplankton variability in the Changjiang Estuary. Some limitations of our study require further improvement. First, besides the simplified the biogeochemical processes described by the model, the model boundary inputs of nutrients were also simplified due to limited data sources. For example, the river discharge was based on the historical data at DT station which is located upstream from the river mouth. The riverine nutrient flux could be biased because we did not consider the river discharge and nutrient inputs along the drainage basin from DT to Shanghai; thus, the critical roles of megacities located at Changjiang deltas were not properly considered. Although our model can simulate the multi decadal variabilities, its ability to represent the interannual anomalies is limited. As we know, strong El Niño events are usually followed by massive summer monsoon over the Changjiang river basin, e.g., the crucial summer water catchments were followed by the peak of two major El Niño events in 1982/1983 and 1997/1998. These two massive summer flooding events were clearly seen from the annual water runoff time series (Figure 2) which has been used as the river boundary input in the model. However, the relationships between our simulated nutrient and phytoplankton time series and ENSO signal are less obvious. Although the El Niño signal can be seen in the physical forcing, the phytoplankton growth is regulated by both the physical forcing and nutrients in the model, thus, lack of riverine nutrient observational data in these years (e.g., 1982/1983) could lead to the bias of our simulated phytoplankton variabilities. Considering the model limitation and the main focus of this study is on multi-decadal variability, we didn’t claim the ENSO influence on the ecosystem variability.
In this study, we did not consider the long-term variability of nutrient inputs from other open boundaries, e.g., the Kuroshio, which flows on the external edge of ECS and transports a massive amount of warm, saline water and nutrients into the ECS shelf. Regarding the underlying mechanisms for long-term ecosystem change, more model sensitivity runs are needed to specify how these mechanisms act individually or in concert in this interlinked large River Delta. We also need more observational datasets to verify our simulated results and examine other important aspects of the Changjiang Estuary ecosystem with our model, such as hypoxia, acidification, and zooplankton community status.
Using a physics-biogeochemistry coupled FVCOM-ERSEM model, we simulated 59 years of ecosystem variations in the Changjiang Estuary. Our model was driven by long-term Changjiang nutrient observations and realistic atmospheric forcing and coupled with key hydrodynamics processes in the river. The model successfully simulated the nutrient concentration gradient from the river channel to the inner shelf and described how these variabilities lead to the temporal and spatial variabilities of nutrients and associated phytoplankton distributions on the adjacent shelf. Our model simulations further supported the results of nutrient ratio variabilities and associated shifts of phytoplankton species in previous studies in the Changjiang Estuary, which are based on discontinuous observations with limited temporal and spatial scales. Our coupled hydrodynamic-biogeochemical model could compensate for the deficiency of limited observations, especially in the study of long-term spatial and temporal variabilities in the ecosystem.
Publicly available datasets were analyzed in this study. This data can be found here: http://xy.cjh.com.cn/.
SS: Methodology, Formal analysis, Investigation, Writing Original Draft. YX: Conceptualization, Formal analysis, Investigation, Writing-Review and Editing. WL: Data curation, Visualization. JG: Supervision, Project administration, Writing-Reviewing and Editing, Funding acquisition. All authors contributed to the article and approved the submitted version.
This research is supported by the National Natural Science Foundation of China (Grant No. 41606025,41776104), the National Key R&D Program of China (Grant No. 2016YFA0600903).
The authors declare that the research was conducted in the absence of any commercial or financial relationships that could be construed as a potential conflict of interest.
All claims expressed in this article are solely those of the authors and do not necessarily represent those of their affiliated organizations, or those of the publisher, the editors and the reviewers. Any product that may be evaluated in this article, or claim that may be made by its manufacturer, is not guaranteed or endorsed by the publisher.
Bennett E. M., Carpenter S. R., Caraco N. F. (2001). Human impact on erodable phosphorus and eutrophication: A global perspective. BioScience 51 (3), 227–234. doi: 10.1641/0006-3568(2001)051[0227:Hioepa]2.0.Co;2
Bouwman L., Goldewijk K. K., Van D., Beusen A., Vuuren D. V., Willems J., et al. (2013). Exploring global changes in nitrogen and phosphorus cycles in agriculture induced by livestock production over the 1900-2050 period. Proc. Natl. Acad. Sci. United States America 110 (52), 20882–20887. doi: 10.1073/pnas.1206191109
Bouwman A. F., Van Drecht G., Knoop J. M., Beusen A. H. W., Meinardi C. R. (2005). Exploring changes in river nitrogen export to the world’s oceans. Global Biogeochem. Cycles 19 (1), GB1002. doi: 10.1029/2004GB002314
Bricker S. B., Longstaff B., Dennison W., Jones A., Boicourt K., Wicks C., et al. (2008). Effects of nutrient enrichment in the nation’s estuaries: A decade of change. Harmful Algae 8 (1), 21–32. doi: 10.1016/j.hal.2008.08.028
Briggs W. (2007). Statistical methods in the atmospheric sciences. J. Am. Stat. Assoc. 102 (477), 380. doi: 10.1198/jasa.2007.s163
Butenschon M., Clark J., Aldridge J. N., Allen J. I., Artioli Y., Blackford J., et al. (2016). ERSEM 15.06: a generic model for marine biogeochemistry and the ecosystem dynamics of the lower trophic levels. Geosci. Model. Dev. 9 (4), 1293–1339. doi: 10.5194/gmd-9-1293-2016-supplement
Chen D., Dai Z., Xu R., Li D., Mei X. (2015). Impacts of anthropogenic activities on the changjiang (Yangtze) estuarine ecosystem, (1998–2012). Acta Oceanol. Sin. 34 (6), 86–93. doi: 10.1007/s13131-015-0679-7
Cheng F., Yu Z., Song X. (2014). Long-term changes in sedimentary diatom assemblages and their environmental implications in the changjiang (Yangtze) river estuary, China. Chin. J. Oceanol. Limnol. 32, 155–161. doi: 10.1007/s00343-014-3133-3
Chen C., Liu H., Beardsley R. C. (2003). An unstructured grid, finite-volume, three-dimensional, primitive equations ocean model: Application to coastal ocean and estuaries. J. Atmospheric Oceanic Technol. 20 (1), 159–186. doi: 10.1175/1520-0426(2003)020<0159:Augfvt>2.0.Co;2
Chen J., Pan D., Liu M., Mao Z., Zhu Q., Chen N., et al. (2017). Relationships between long-term trend of satellite-derived chlorophyll-a and hypoxia off the changjiang estuary. Estuar. Coasts 40, 1055–1065. doi: 10.1007/s12237-016-0203-0
Chen Z., Xu H., Wang Y. (2021). Ecological degradation of the Yangtze and Nile delta-estuaries in response to dam construction with special reference to monsoonal and arid climate settings. Water 13, 1145. doi: 10.3390/w13091145
Chen H., Yu Z., Yao Q., Mi T., Liu P. (2010). Nutrient concentrations and fluxes in the changjiang estuary during summer. Acta Oceanol. Sin. 29 (2), 107–119. doi: 10.1007/s13131-010-0029-8
Chu T. V., Torreton J. P., Mari X., Nguyen H. M., Pham K. T., Pham T. T., et al. (2014). Nutrient ratios and the complex structure of phytoplankton communities in a highly turbid estuary of southeast Asia. Environ. Monit. Assess. 186 (12), 8555–8572. doi: 10.1007/s10661-014-4024-y
Dai S., Lu X., Yang S., Cai A. (2008). A preliminary estimate of human and natural contributions to the decline in sediment flux from the Yangtze river to the East China Sea. Quaternary Int. 186 (1), 43–54. doi: 10.1016/j.quaint.2007.11.018
Dai Z., Meng Y., Chen J., Fagherazzi S., Mei X. (2016). Linking the infilling of the north branch in the changjiang (Yangtze) estuary to anthropogenic activities from 1958 to 2013. Mar. Geol. 379, 1–12. doi: 10.1016/j.margeo.2016.05.006
Dai Z., Wu Y., Zhang J., Du J., Zhang G., Dai Z., et al. (2011). Variation of riverine material loads and environmental consequences on the changjiang (Yangtze) estuary in recent decades, (1955–2008). Environ. Sci. Technol. 45 (1), 223–227. doi: 10.1021/es103026a
Daskalov G. M., Boicenco L., Grishin A. N., Laz r L., Mihneva V., Shlyakhov V., et al. (2017). Architecture of collapse: regime shift and recovery in an hierarchically structured marine ecosystem. Global Change Biol. 23, 1486–1498. doi: 10.1111/gcb.13508
Dawson A. (2016). Eofs: A library for EOF analysis of meteorological, oceanographic, and climate data. J. Open Res. Soft. 4 (1), e14. doi: 10.5334/jors.122
Ding S., Chen P., Liu S., Zhang G., Dan S. F. (2019). Nutrient dynamics in the changjiang and retention effect in the three gorges reservoir. J. Hydrol. 574, 96–109. doi: 10.1016/j.jhydrol.2019.04.034
Dortch Q., Rabalais N. N., Turner R. E., Qureshi N. A. (2001). “Impacts of changing Si/N ratios and phytoplankton species composition,” in Coastal hypoxia: Consequences for living resources and ecosystems Eds. Rabalais N. N., Turner R. E. American: The American Geophysical Union. doi: 10.1029/CE058p0038
Duan S., Liang T., Zhang S., Wang L., Zhang X., Chen X. (2008). Seasonal changes in nitrogen and phosphorus transport in the lower changjiang river before the construction of the three gorges dam. Estuar. Coast. Shelf Sci. 79 (2), 239–250. doi: 10.1016/j.ecss.2008.04.002
Duan S., Xu F., Wang L. (2007). Long-term changes in nutrient concentrations of the changjiang river and principal tributaries. Biogeochemistry 85 (2), 215–234. doi: 10.1007/s10533-007-9130-2
Duan S., Zhang S., Chen X., Zhang X., Wang L. (2000). Concentrations of nitrogen and phosphorus and nutrient transport to estuary of the Yangtze river. Environ. Sci. 01, 53–56. doi: 10.3133/wri984219
Egbert G. D., Erofeeva S. Y. (2002). Efficient inverse modeling of barotropic ocean tides. J. Atmospheric Oceanic Technol. 19, 183–204. doi: 10.1175/1520-0426(2002)019<0183:eimobo>2.0.co;2
Elkalay K., Khalil K., Thomas H., Bozec Y., Ruardij P., Baar H.J.W.d. (2012). Biogeochemical 1D ERSEM ecosystem model applied to recent carbon dioxide and nutrient data in the north Sea. Develop. Environ. Model. 25, 275–294. doi: 10.1016/b978-0-444-59396-2.00017-1
Enawgaw Y., Lemma B. (2018). Phytoplankton community composition and nutrient conditions as an indicator of ecosystem productivity in lake tinishu abaya, rift valley, Ethiopia. Int. J. Fish. Aquat. Stud. 6, 173–186. doi: 10.5897/ijfa2018.0675
Fairall C. W., Bradley E. F., Hare J. E., Grachev A. A., Edson J. B. (2003). Bulk parameterization of air-Sea fluxes: Updates and verification for the COARE algorithm. J. Climate 16, 571–591. doi: 10.1175/1520-0442(2003)016<0571:bpoasf>2.0.co;2
Fasham M. J. R., Ducklow H. W., McKelvie S. M. (1990). A nitrogen-based model of plankton dynamics in the oceanic mixed layer. J. Mar. Res. 48, 591–639. doi: 10.1357/002224090784984678
Franks P. J. S., Chen C. (2001). A 3-d prognostic numerical model study of the georges bank ecosystem. part II: biological physical model. Deep-Sea Res. Ⅱ 48, 457–482. doi: 10.1016/s0967-0645(00)00125-9
Galloway J. N., Cowling E. B. (2002). Reactive nitrogen and the world: 200 years of change. Ambio 31 (2), 64–71. doi: 10.1579/0044-7447-31.2.64
Gao L., Li D., Zhang Y. (2012). Nutrients and particulate organic matter discharged by the changjiang (Yangtze river): Seasonal variations and temporal trends. J. Geophys. Res.: Biogeosci. 117 (G4), G04001. doi: 10.1029/2012jg001952
Gao S., Wang Y. P. (2008). Changes in material fluxes from the changjiang river and their implications on the adjoining continental shelf ecosystem. Continental Shelf Res. 28 (12), 1490–1500. doi: 10.1016/j.csr.2007.02.010
Ge J., Ding P., Chen C., Hu S., Fu G., Wu L. (2013). An integrated East China Sea–changjiang estuary model system with aim at resolving multi-scale regional–shelf–estuarine dynamics. Ocean Dynam. 63 (8), 881–900. doi: 10.1007/s10236-013-0631-3
Ge J., Shi S., Liu J., Xu Y., Chen C., Bellerby R., et al. (2020a). Interannual variabilities of nutrients and phytoplankton off the changjiang estuary in response to changing river inputs. J. Geophys. Res.: Oceans 125 (3), e2019JC015595. doi: 10.5194/egusphere-egu2020-1447
Ge J., Torres R., Chen C., Liu J., Xu Y., Bellerby R. G. J., et al. (2020b). Influence of suspended sediment front on nutrients and phytoplankton dynamics off the changjiang estuary: A FVCOM-ERSEM coupled model experiment. J. Mar. Syst. 204, 103292. doi: 10.1016/j.jmarsys.2019.103292
Ge J., Zhang J., Chen C., Ding P. (2021). Impacts of fluvial flood on physical and biogeochemical environments in estuary- shelf continuum in the East China Sea. J. Hydrol. 598, 126441. doi: 10.1016/j.jhydrol.2021.126441
Glé C., Del Amo Y., Sautour B., Laborde P., Chardy P. (2008). Variability of nutrients and phytoplankton primary production in a shallow macrotidal coastal ecosystem (Arcachon bay, France). Estuar. Coast. Shelf Sci. 76 (3), 642–656. doi: 10.1016/j.ecss.2007.07.043
Grams C. M. (2021). “The role of cloud diabatic processes in the life cycle of Atlantic-European weather regimes,” in paper presented at EGU General Assembly. doi: 10.5194/egusphere-egu21-14238
Gruber N., Frenzel H., Doney S. C., Marchesiello P., McWilliams J. C., Moisan J. R., et al. (2006). Eddy-resolving simulation of plankton ecosystem dynamics in the California current system. Deep-Sea Res. Part I: Oceanograph. Res. Pap. 53 (9), 1483–1516. doi: 10.1016/s0967-0637(21)00019-4
Guo C., Jin Z., Guo L., Lu J., Ren S., Zhou Y. (2020). On the cumulative dam impact in the upper changjiang river: Streamflow and sediment load changes. Catena 184, 104250. doi: 10.1016/j.catena.2019.104250
Gu H., Xiong X., Liu M., Li Y. (1981). Marine geochemistry of nitrogen near estuary of Yangtze river. J. Shandong Coll. Oceanol. 11 (4), 37–46. doi: 10.1016/0198-0254(84)93285-0
Harding L. W., Gallegos C. L., Perry E. S., Miller W. D., Adolf J. E., Mallonee M. E., et al. (2015). Long-term trends of nutrients and phytoplankton in Chesapeake bay. Estuar. Coasts 39 (3), 664–681. doi: 10.1007/s12237-015-0023-7
Henson S., Sarmiento J., Dunne J., Bopp L., Lima I., Doney S., et al. (2010). Detection of anthropogenic climate change in satellite records of ocean chlorophyll and productivity. Biogeosciences 7, 621–640. doi: 10.5194/bg-7-621-2010
Houser J. N., Bierman D. W., Burdis R. M., Soeken-Gittinger L. A. (2010). Longitudinal trends and discontinuities in nutrients, chlorophyll, and suspended solids in the upper Mississippi river: implications for transport, processing, and export by large rivers. Hydrobiologia 651 (1), 127–144. doi: 10.1007/s10750-010-0282-z
Howarth R., Anderson D., Church T., Greening H., Hopkinson C., Huber W., et al. (2000). Clean coastal waters - understanding and reducing the effects of nutrient pollution (Washington, DC: National Academy of Sciences). doi: 10.17226/9812
Howarth R., Marino R. (2006). Nitrogen as the limiting nutrient for eutrophication in coastal marine ecosystems: Evolving views over three decades. Limnol. Oceanog. 51 (1, part2), 364–376. doi: 10.4319/lo.2006.51.1_part_2.0364
Huang Q., Shen H., Liu X., Fu R. (2001). Human impact on the nitrate fluxo the Changjiang Estuary, Resources and Enuironment In The Yangtza Basin 06, 564–569. Available at: https://kns.cnki.net/kcms/detail/detail.aspx?dbcode=CJFD&dbname=CJFD2001&filename=CJLY200106012&uniplatform=NZKPT&v=qC3CdbkCf23KB2-lpvp75cLlBpGnar-Mh2h7ABxBHb3r3Cw5BL3gnOurPeqqpmQ- (in Chinese).
Humborg C., Ittekkot V., Cociasu A., Bodungen B. V. (1997). Effect of Danube river dam on black Sea biogeochemistry and ecosystem structure. Nature 386 (6623), 385–388. doi: 10.1038/386385a0
Hu B., Yang Z., Wang H., Xiaoxia S., Bi N., Li J. (2009). Sedimentation in the three gorges dam and the future trend of changjiang (Yangtze river) sediment flux to the sea. Hydrol. Earth System Sci. 13, 2253–2264. doi: 10.5194/hess-13-2253-2009
Jardine J., Katavouta A., Partridge D., Polton J. A., Holt J. T., Wakelin S. L. (2021). Assessing the long-term physical-biogeochemical interactions in the north Indian ocean using a coupled relocatable model paper presented at EGU General Assembly. doi: 10.5194/egusphere-egu21-9706
Jiang Z., Chen J., Zhou F., Zhai H., Zhang D., Yan X. (2017). Summer distribution patterns of trichodesmium spp. in the changjiang (Yangtze river) estuary and adjacent East China Sea shelf. Oceanologia 59 (3), 248–261. doi: 10.1016/j.oceano.2017.02.001
Jiang Z., Liu J., Chen J., Chen Q., Yan X., Xuan J., et al. (2014). Responses of summer phytoplankton community to drastic environmental changes in the changjiang (Yangtze river) estuary during the past 50 years. Water Res. 54, 1–11. doi: 10.1016/j.watres.2014.01.032
Jiang Z., Li H., Zhai H., Zhou F., Chen Q., Chen J., et al. (2018b). Seasonal and spatial changes in trichodesmium associated with physicochemical properties in East China Sea and southern yellow Sea. J. Geophys. Res.: Biogeosci. 123 (2), 509–530. doi: 10.1002/2017JG004275
Jiang Q., Xu Y., Yu C., Zhang H., Xiao Y., Tang Y. Z., et al. (2018a). Community structure of zooplankton in adjacent area of changjiang estuary, China in summer 2016. J. Appl. Ecol. 29 (9), 3078–3084. doi: 10.13287/j.1001-9332.201809.004
Jiang T., Yu Z., Song X., Cao X., Yuan Y. (2010). Long-term ecological interactions between nutrient and phytoplankton community in the changjiang estuary. Chin. J. Oceanol. Limnol. 28 (4), 887–898. doi: 10.1007/s00343-010-9059-5
Jin H., Chen J., Weng H.-x., Li H., Zhang W., Xu J., et al. (2010). Variations in paleoproductivity and the environmental implications over the past six decades in the changjiang estuary. Acta Oceanol. Sin. 29, 38–45. doi: 10.1007/s13131-010-0035-x
Kim Y. S., Jang C. J., Yeh S. W. (2018). Recent surface cooling in the yellow and East China seas and the associated north pacific climate regime shift. Continental Shelf Res. 156, 43–54. doi: 10.1016/j.csr.2018.01.009
Leong D. N. S., Donner S. D., Hassan M. A., Gabor R., Drummond J. D. (2014). Sensitivity of stoichiometric ratios in the Mississippi river to hydrologic variability. J. Geophys. Res.: Biogeosci. 119 (6), 1049–1062. doi: 10.1002/2013JG002585
Letelier R. M., Bidigare R. R., Hebel D. V., Ondrusek M., Winn C. D., Karl D. M. (1993). Temporal variability of phytoplankton community structure based on pigment analysis. Limnol. Oceanog. 38, 1420–1437. doi: 10.4319/lo.1993.38.7.1420
Lian T., Chen D. (2012). An evaluation of rotated EOF analysis and its application to tropical pacific SST variability. J. Climate 25 (15), 5361–5373. doi: 10.1175/JCLI-D-11-00663.1
Liang C., Xian W. (2018). Changjiang nutrient distribution and transportation and their impacts on the estuary, Continental shelf research 165, 137–145. doi: 10.1016/j.csr.2018.05.001
Li W., Ge J., Ding P., Ma J., Glibert P. M., Liu D. (2021). Effects of dual fronts on the spatial pattern of chlorophyll-a concentrations in and off the changjiang river estuary. Estuar. Coasts 44, 1408–1418. doi: 10.1007/s12237-020-00893-z
Liu N. (2017). Review on the nutrients transport in Yangtze river with respoonses to the damming the the drainage basin in the past 50 years. Environ. Chem. 36 (7), 1579–1587. doi: 10.1016/j.jhydrol.2006.05.036
Liu X., Xiao W., Landry M. R., Chiang K.-P., Wang L., Huang B. (2016). Responses of phytoplankton communities to environmental variability in the East China Sea. Ecosystems 19 (5), 832–849. doi: 10.1007/s10021-016-9970-5
Liu X., Joost van Hoek W., Vilmin L., Beusen A. H. W., Mogollón J. M., Middelburg J. J., et al. (2020). Exploring long-term changes in silicon biogeochemistry along the river continuum of the Rhine and Yangtze (Changjiang). Environ. Sci. Technol. 54, 11940–11950. doi: 10.1021/acs.est.0c01465
Liu X., Shen H. (2001). Estimation of dissolved inorganic nutrients fluxes from the Changjiang River into estuary. Sc. China Ser. B-Chem. 44 (Suppl 1), 135–141. doi: 10.1007/BF02884819
Liu X., Vitousek P., Chang Y., Zhang W., Zhang F. (2015). Evidence for a historic change occurring in China. Environ. Sci. Technol. 50 (2), 505–506. doi: 10.1021/acs.est.5b05972
Liu H., Xu W. S., Kang H. X., Yin B. S. (2014). The temporal and spatial variation of the nutrientsin the Yangtze river estuary. Adv. Mat. Res. 1010-1012, 399–402. doi: 10.4028/www.scientific.net/amr.1010-1012.399
Liu J., Yao Q. Z., Mi T. Z., Wei Q. S., Chen H. T., Yu Z. G. (2022). Change of the long-term nitrogen and phosphorus in the changjiang (Yangtze) river estuary. Front. Mar. Sci. 9. doi: 10.3389/fmars.2022.885311
Li G., Wang X. T., Yang Z., Mao C., West A. J., Ji J. (2015). Dam-triggered organic carbon sequestration makes the changjiang (Yangtze) river basin (China) a significant carbon sink. J. Geophys. Res.: Biogeosci. 120 (1), 39–53. doi: 10.1002/2014jg002646
Li M., Xu K., Watanabe M., Chen Z. (2007). Long-term variations in dissolved silicate, nitrogen, and phosphorus flux from the Yangtze river into the East China Sea and impacts on estuarine ecosystem. Estuar. Coast. Shelf Sci. 71 (1-2), 3–12. doi: 10.1016/j.ecss.2006.08.013
Liu X., Xiao W., Landry M. R., Chiang K.-P., Wang L., Huang B., et al (2012). Responses of phytoplankton communities to environmental variability in the east china sea. Ecosystems 19 (5), 832–849. doi: 10.1007/s10021-016-9970-5
Lohrenz S. E., Redalje D. G., Cai W.-J., Acker J., Dagg M. (2008). A retrospective analysis of nutrients and phytoplankton productivity in the Mississippi river plume. Continental Shelf Res. 28 (12), 1466–1475. doi: 10.1016/j.csr.2007.06.019
Luan H. L., Ding P. X., Wang Z. B., Ge J. Z., Yang S. L. (2016). Decadal morphological evolution of the Yangtze estuary in response to river input changes and estuarine engineering projects. Geomorphology 265, 12–23. doi: 10.1016/j.geomorph.2016.04.022
Middelburg J. J., Andersson M. G. I., Boschker E., Brion N., Dehairs F., Dijkman N. A., et al. (2011). Carbon and nitrogen cycling in the scheldt estuary: the major players, long-term changes and an integrated view. paper presented at LOICZ Research & Studies, Helmholtz-Zentrum Geesthacht. Avaiable at: https://www.vliz.be/imisdocs/publications/ocrd/247051.pdf.
Milliman J., Farnsworth K. (2011) River Discharge to the Coastal Ocean: A Global Synthesis. (Cambridge: Cambridge University Press). doi: 10.1017/CBO9780511781247
Oviatt C., Smith L., Krumholz J., Coupland C., Stoffel H., Keller A., et al. (2017). Managed nutrient reduction impacts on nutrient concentrations, water clarity, primary production, and hypoxia in a north temperate estuary. Estuar. Coast. Shelf Sci. 199, 25–34. doi: 10.1016/j.ecss.2017.09.026
Pei Y., Liu X., He H. (2017). Interpreting the sea surface temperature warming trend in the yellow Sea and East China Sea. Sci. China Earth Sci. 60, 1558–1568. doi: 10.1007/s11430-017-9054-5
Pohlert T. (2015) Trend: Non-parametric trend tests and change-point detection, r package version 0.0.1. Available at: doi: 10.13140/RG.2.1.2633.4243
Powers S. M., Bruulsema T. W., Burt T. P., Chan N., Elser J. J., Haygarth P. M, et al. (2015). Long-term accumulation and transport of anthropogenic phosphorus in three river basins. Nat. Geosci. 9, 353–356. doi: 10.1038/ngeo2693
Prasad M. B. K., Sapiano M. R. P., Anderson C. R., Long W., Murtugudde R. (2010). Long-term variability of nutrients and chlorophyll in the Chesapeake bay: A retrospective analysis 1985–2008. Estuar. Coasts 33 (5), 1128–1143. doi: 10.1007/s12237-010-9325-y
Qi L., Hu C., Duan H., Barnes B. B., Ma R. (2014). An EOF-based algorithm to estimate chlorophyll a concentrations in taihu lake from MODIS land-band measurements: Implications for near real-time applications and forecasting models. Remote. Sens. 6 (11), 10694–10715. doi: 10.3390/rs61110694
Rabalais N. N., Turner R. E., Díaz R., Dubravko J. (2009). Global change and eutrophication of coastal waters. Ices J. Mar. Sci. 7), 1528–1537. doi: 10.1093/icesjms/fsp047
Rabalais N. N., Turner R. E., Justi D., Dortch Q., Wiseman W. J., Gupta B. K. S. (1996). Nutrient changes in the Mississippi river and system responses on the adjacent continental shelf. Estuaries 19 (2), 386–407. doi: 10.2307/1352458
Riley G. A. (1949). Quantitative ecology of the plankton of the western north Atlantic. Bull. Bingham Oceanogr. Collection 12, 1–169.
Roundy P. E. (2015). On the interpretation of EOF analysis of ENSO, atmospheric kelvin waves, and the MJO. J. Climate 28 (3), 1148–1165. doi: 10.1175/JCLI-D-14-00398.1
Sankar S., Polimene L., Marin L., Menon N. N., Samuelsen A., Pastres R., et al. (2018). Sensitivity of the simulated oxygen minimum zone to biogeochemical processes at an oligotrophic site in the Arabian Sea. Ecol. Model. 372, 12–23. doi: 10.1016/j.ecolmodel.2018.01.016
Sarmiento J. L., Slater R. D., Fasham M. J. R., Ducklow H. W., Toggweiler J. R., Evans G. T. (1993). A seasonal three-dimensional ecosystem model of nitrogen cycling in the north Atlantic euphotic zone. Global Biogeochem. Cycles 7 (2), 417–450. doi: 10.1029/93gb00375
Scavia D., Anderson M., Austin K., Belefski M., Turgeon K. (2000). An integrated assessment of hypoxia in the northern gulf of Mexico. Environ. Policy Collection 3 (2), 257–264.
Shen Z. (1993). A study on the relationships of the nutrients near the changjiang river estuary with the flow of the changjiang river water. Chin. J. Oceanol. Limnol. 11, 260–267. doi: 10.1007/BF02850859
Shen Z., Li Z., Miao H. (2020). “Budget and control of phosphorus in the changjiang river catchment and its mouth,” in Studies of the biogeochemistry of typical estuaries and bays in China. Ed. Shen Z. (Berlin, Heidelberg: Springer Berlin Heidelberg), 61–80. Available at: doi: 10.1007/978-3-662-58169-8_4
Shen Z. L., Liu Q. (2009). Nutrients in the changjiang river. Environ. Monit Assess. 153 (1-4), 27–44. doi: 10.1007/s10661-008-0334-2
Shen Z. L., Li Z., Miao H. (2012). “An estimation on budget and control of phosphorus in the Changjiang River catchment. Environ Monit Assess 184 (11), 6490–6505. doi: 10.1007/s10661-011-2435-6
Shi J., Liu P. X. (2009). Concentration characteristics of nutrients and influx calculation in changjiang estuary before and after water storage of three gorges project. Mar. Environ. ence 28 (S1), 16–20. Available at: https://kns.cnki.net/kcms/detail/detail.aspx?dbcode=CJFD&dbname=CJFD2009&filename=HYHJ2009S1004&uniplatform=NZKPT&v=Lb5dyXXK3FiYkL4bVNWITss5aFbKe0C_GNTv7WLEqpSh1crnUg_ns1DtA2985TM8
Smits A. P., Ruffing C. M., Royer T. V., Appling A. P., Griffiths N. A., Bellmore R., et al. (2019). Detecting signals of Large-scale climate phenomena in discharge and nutrient loads in the Mississippi-atchafalaya river basin. Geophys. Res. Lett. 46 (7), 3791–3801. doi: 10.1029/2018gl081166
Soetaert K., Middelburg J. J., Heip C., Meire P., Van Damme S., Maris T. (2006). Long-term change in dissolved inorganic nutrients in the heterotrophic scheldt estuary (Belgium, the Netherlands). Limnol. Oceanog. 51 (1part2), 409–423. doi: 10.4319/lo.2006.51.1_part_2.0409
Spitz Y. H. (2003). Ecosystem response to upwelling off the Oregon coast: Behavior of three nitrogen-based models. J. Geophys. Res. 108 (C3), 3062. doi: 10.1029/2001jc001181
Stackpoole S., Sabo R., Falcone J., Sprague L. (2021). Long-term Mississippi river trends expose shifts in the river load response to watershed nutrient balances between 1975 and 2017. Water Resour. Res. 57 (11), e2021WR030318. doi: 10.1029/2021wr030318
Wang B. (2006). Cultural eutrophication in the changjiang (Yangtze river) plume: History and perspective. Estuar. Coast. Shelf Sci. 69 (3-4), 471–477. doi: 10.1016/j.ecss.2006.05.010
Wang L., Chen Q., Han R., Wang B., Tang X. (2017). Responses of the phytoplankton community in the Yangtze river estuary and adjacent sea areas to the impoundment of the three gorges reservoir. Annales Limnologie-international J. Limnol. 53, 1–10. doi: 10.1051/limn/2016027
Wang H., Dai M., Liu J., Kao S. J., Zhang C., Cai W. J., et al. (2016a). Eutrophication-driven hypoxia in the East China Sea off the changjiang estuary. Environ. Sci. Technol. 50 (5), 2255–2263. doi: 10.1021/acs.est.5b06211
Wang X., Luo C., Ge T., Xu C., Xue Y. (2016b). Controls on the sources and cycling of dissolved inorganic carbon in the changjiang and huanghe river estuaries, China: 14C and 13C studies. Limnol. Oceanog. 61 (4), 1358–1374. doi: 10.1002/lno.10301
Wang F., Meng Q., Tang X., Hu D.-x. (2013). The long-term variability of sea surface temperature in the seas east of China in the past 40a. Acta Oceanol. Sin. 32, 48–53. doi: 10.1007/s13131-013-0288-2
Wang C., Wang X. (2013). Classifying El niño modoki I and II by different impacts on rainfall in southern China and typhoon tracks. J. Climate 26, 1322–1338. doi: 10.1175/jcli-d-12-00107.1
Wang X., Yang S., Ran X., Liu X.-M., Bataille C. P., Su N. (2018). Response of the changjiang (Yangtze river) water chemistry to the impoundment of three gorges dam during 2010–2011. Chem. Geol. 487, 1–11. doi: 10.1016/j.chemgeo.2018.04.006
Wang X., Yu Z., Fan W., Song X., Cao X., Yuan Y. (2014). Nutrient fluxes in the changjiang river estuary and adjacent waters - a modified box model approach. Chin. J. Oceanol. Limnol. 33 (1), 176–193. doi: 10.1007/s00343-015-4061-6
Wong G. T. F., Gong G. C., Liu K. K., Pai S. C. (1998). ‘Excess nitrate’ in the East China Sea, Estuarine. Coast. Self Sci. 46, 411–418. doi: 10.1006/ecss.1997.0287
Wu L., Chen C., Guo P., Shi M., Qi J., Ge J. (2011). A FVCOM-based unstructured grid wave, current, sediment transport model, i. model description and validation. J. Ocean Univ. China 10 (1), 1–8. doi: 10.1007/s11802-011-1788-3
Xiao W., Liu X., Irwin A. J., Laws E. A., Wang L., Chen B., et al. (2018). Warming and eutrophication combine to restructure diatoms and dinoflagellates. Water Res. 128, 206–216. doi: 10.1016/j.watres.2017.10.051
Xie S., Hafner J., Tanimoto Y., Liu W. T., Tokinaga H., Xu H. (2002). Bathymetric effect on the winter sea surface temperature and climate of the yellow and East China seas. Geophys. Res. Lett. 29, 81–81-81-84. doi: 10.1029/2002gl015884
Xing G. X., Zhu Z. L. (2002). Regional nitrogen budgets for China and its major watersheds. Biogeochemistry 57 (1), 405–427. doi: 10.1023/A:1016508323200
Xu Z., Shen X., Gao Q. (2015). Marine biology of the changjiang (Yangtze river) estuary and adjacent East China Sea shelf. doi: 10.3389/fmars.2021.615929
Yang S. L., Milliman J. D., Li P., Xu K. (2011). 50,000 dams later: Erosion of the Yangtze river and its delta. Global Planet. Change 75 (1), 14–20. doi: 10.1016/j.gloplacha.2010.09.006
Yang Z., Wang H., Saito Y., Milliman J. D., Xu K., Qiao S., et al. (2006). Dam impacts on the changjiang (Yangtze) river sediment discharge to the sea: The past 55 years and after the three gorges dam. Water Resour. Res. 42 (4), W04407. doi: 10.1029/2005wr003970
Yang S. L., Xu K. H., Milliman J. D., Yang H. F., Wu C. S. (2015). Decline of Yangtze river water and sediment discharge: Impact from natural and anthropogenic changes. Sci. Rep. 5, 12581. doi: 10.1038/srep12581
Yang H. F., Yang S. L., Meng Y., Xu K. H., Luo X. X., Wu C. S., et al. (2018b). Recent coarsening of sediments on the southern Yangtze subaqueous delta front: A response to river damming. Continental Shelf Res. 155, 45–51. doi: 10.1016/j.csr.2018.01.012
Yang H., Yang S., Xu K., Milliman J., Wang H., Yang Z., et al. (2018a). Human impacts on sediment in the Yangtze river: A review and new perspectives. Global Planet. Change 162, 8–17. doi: 10.1016/j.gloplacha.2018.01.001
Yan W., Mayorga E., Li X., Seitzinger S. P., Bouwman A. F. (2010). Increasing anthropogenic nitrogen inputs and riverine DIN exports from the changjiang river basin under changing human pressures. Global Biogeochem. Cycles 24 (4), GB0A06. doi: 10.1029/2009gb003575
Yao Q., Yu Z., Chen H., Liu P., Mi T. (2009). Phosphorus transport and speciation in the changjiang (Yangtze river) system. Appl. Geochem. 24 (11), 2186–2194. doi: 10.1016/j.apgeochem.2009.09.023
Yuan Z., Jiang S., Hu S., Xin L., Hui H., Liu X., et al. (2018). Human perturbation of the global phosphorus cycle: Changes and consequences. Environ. Sci. Technol. 52 (5), 2438–2450. doi: 10.1021/acs.est.7b03910.s001
Yunev O. A., Carstensen J., Moncheva S., Khaliulin A., Ærtebjerg G., Nixon S. (2007). Nutrient and phytoplankton trends on the western black Sea shelf in response to cultural eutrophication and climate changes. Estuar. Coast. Shelf Sci. 74 (1-2), 63–76. doi: 10.1016/j.ecss.2007.03.030
Yu Y., Song J., Li X., Duan L. (2012). Geochemical records of decadal variations in terrestrial input and recent anthropogenic eutrophication in the changjiang estuary and its adjacent waters. Appl. Geochem. 27 (8), 1556–1566. doi: 10.1016/j.apgeochem.2012.05.002
Zhang J., Liu S. M., Ren J. L., Wu Y., Zhang G. L. (2007). Nutrient gradients from the eutrophic changjiang (Yangtze river) estuary to the oligotrophic kuroshio waters and re-evaluation of budgets for the East China Sea shelf. Prog. Oceanog. 74 (4), 449–478. doi: 10.1016/j.pocean.2007.04.019
Zhang X., Xie R., Fan D., Yang Z., Wang H., Wu C., et al. (2021). Sustained growth of the largest uninhabited alluvial island in the changjiang estuary under the drastic reduction of river discharged sediment. Sci. China Earth Sci. 64, 1687–1697. doi: 10.1007/s11430-020-9746-3
Zheng S., Zhong Z., Zou Q., Ding Y., Yang L., Luo X. (2020). Overall situation of Yangtze river basin, paper presented at flood resources utilization in the Yangtze river basin (Singapore: Springer). Available at: doi: 10.1007/978-981-15-8108-3_2
Zhong S., Yu L., Heilman W. E., Bian X., Fromm H. (2020). Synoptic weather patterns for large wildfires in the northwestern united state” a climatological analysis using three classification methods. Theor. Appl. Climatol. 141, 1057–1073. doi: 10.1007/s00704-020-03235-y
Zhou M. J., Shen Z. L., Yu R. C. (2008). Responses of a coastal phytoplankton community to increased nutrient input from the changjiang (Yangtze) river. Continental Shelf Res. 28 (12), 1483–1489. doi: 10.1016/j.csr.2007.02.009
Zhu Z., Wu H., Liu S., Wu Y., Huang D., Zhang J., et al. (2017). Hypoxia off the changjiang (Yangtze river) estuary and in the adjacent East China Sea: Quantitative approaches to estimating the tidal impact and nutrient regeneration. Mar. pollut. Bull. 125 (1-2), 103–114. doi: 10.1016/j.marpolbul.2017.07.029
Keywords: Changjiang estuary, coastal ecosystem modeling, nutrient ratios, phytoplankton community structure, FVCOM
Citation: Shi S, Xu Y, Li W and Ge J (2022) Long-term response of an estuarine ecosystem to drastic nutrients changes in the Changjiang River during the last 59 years: A modeling perspective. Front. Mar. Sci. 9:1012127. doi: 10.3389/fmars.2022.1012127
Received: 05 August 2022; Accepted: 28 September 2022;
Published: 17 October 2022.
Edited by:
Qicheng Meng, Ministry of Natural Resources, ChinaReviewed by:
Jun Sun, China University of Geosciences Wuhan, ChinaCopyright © 2022 Shi, Xu, Li and Ge. This is an open-access article distributed under the terms of the Creative Commons Attribution License (CC BY). The use, distribution or reproduction in other forums is permitted, provided the original author(s) and the copyright owner(s) are credited and that the original publication in this journal is cited, in accordance with accepted academic practice. No use, distribution or reproduction is permitted which does not comply with these terms.
*Correspondence: Yi Xu, eHV5aUBza2xlYy5lY251LmVkdS5jbg==
Disclaimer: All claims expressed in this article are solely those of the authors and do not necessarily represent those of their affiliated organizations, or those of the publisher, the editors and the reviewers. Any product that may be evaluated in this article or claim that may be made by its manufacturer is not guaranteed or endorsed by the publisher.
Research integrity at Frontiers
Learn more about the work of our research integrity team to safeguard the quality of each article we publish.