 Yue Yu
 Yongzhi Wang2*
 Yi Zhong
94% of researchers rate our articles as excellent or good
Learn more about the work of our research integrity team to safeguard the quality of each article we publish.
Find out more
ORIGINAL RESEARCH article
Front. Mar. Sci., 21 October 2022
Sec. Coastal Ocean Processes
Volume 9 - 2022 | https://doi.org/10.3389/fmars.2022.1010523
This article is part of the Research TopicExtreme Weather Events Induced Coastal Environment Changes under Multiple Anthropogenic ImpactsView all 16 articles
Tropical cyclones (TCs) play important roles in the evolution of beaches. The response of beaches to a single tropical cyclone (TC) has been well reported, however, few studies have compared the responses of the same beach to TCs with different characteristics. Taking Haiyang Beach in the northern China Seas as a case study, the beach profiles before and after two TCs, Lekima and Bavi, which passed through the west and east sides of the study area, were investigated. The beach exhibited erosion at the upper foreshore and minor deposition near the mean high water level (MHW) after Lekima with subaqueous sandbars formed in the nearshore zone, whereas all the beach profiles showed little changes after Bavi. A high-resolution FVCOM model was established and eleven sensitive experiments were conducted to simulate hydrodynamic changes induced by TCs with different tracks, intensity and duration. Then the Xbeach model was used to display the beach evolution due to different TCs conditions. It is found that the significant storm surge and strong seaward bottom current induced by landward wind of the TCs passed through the west side of the study area should responsible for the beach profile changes. Negligible storm surge rise and landward bottom current related to the seaward wind of eastern path TCs can only result in little change of the beach. Swell contributes most to the wave height while has less effect on the beach changes. In this study, we conclude that the effects of TCs on beaches are primarily dependent on relative position of a beach and TCs’ tracks.
1. The relative position of a beach and TC track determines the erosion-accretion intensity of the beach
2. The mechanism is significant storm surge rise and strong seaward bottom current related to the western path TCs
3. Swell contributes most to the wave height while has less effect on the beach changes
4. Schematic map of beach response to TCs with different tracks proposed.
About 31% of the ice-free shoreline in the world is sandy and more than 24% of the sand beaches are suffering serious erosion at a rate of more than 0.5 m/year (Luijendijk et al., 2018). Tropical cyclones (TCs) have the potential to create, destroy, or substantially modify coastal landforms, especially in sand-dominated systems (Sherman et al., 2013). They can disrupt longshore and cross-shore sediment transport balances within short periods by inducing storm surges and strong waves. Thus, dune and sand bar systems can be rapidly, and even irreversibly, destroyed (Sallenger, 2000; Houser et al., 2008; Arifin and Kennedy, 2011). Compared with the monsoon storms, the wave intensity and storm surge can be significantly enhanced during TCs (Shariful et al., 2020), which could cause drastic erosion in dunes and berm where sediments were transported by strong undertow to form the sandbars (Roelvink et al., 2009; Armaroli et al., 2013).
Many studies have demonstrated the importance of the combination effect of TCs characteristics and beach geomorphology (Morton, 2002; Claudino-Sales et al., 2008; Pardo-Pascual et al., 2014). The erosion on beaches at different locations caused by TCs is very different according to the analysis of 37 beaches by Basco (1996). The geomorphological responses of beaches with different characters to TCs are also different, some beaches react rapidly with significant morphological changes (Otvos, 2004), and the more reflective beaches may make more significant changes after TCs (Qi et al., 2010). Sallenger et al. (2006) evaluated the impacts of four hurricanes on beaches in Florida, and found that these impacts cannot be classified simply according to the Saffir-Simpson hurricane scale, because stronger storm may not necessarily cause severer erosion, as the storm duration and surge level also play important roles. Wang et al. (2020) and Chen et al. (2022) analyzed the influence of Lekima and Bavi on the Chudao beach, respectively, and found that the effects of the beach were induced by Lekima was more serious, passing the left side of the beach. In general, the response of sandy beaches to TCs is a complex and variable process. The characteristics of a TC can be described by its track, intensity, duration, storm surges induced, and so on (Martzikos et al., 2021). Previous studies have focused on the influence process and morphological change on sandy beaches under the action of a single TC or a strong and powerful event (Fritz et al., 2007; Sherman et al., 2013; Ding et al., 2015; Shariful et al., 2020). However, little attention has been paid to the hydrodynamic changes and the response of sandy beach induced by TCs with different characteristics. Furthermore, the increase in the intensities of the strongest TCs and the northward shift of their tracks have been predicted (Walsh et al., 2015), which makes the study of the responses of a beach to TCs with different characteristics more meaningful.
Thus, a sandy beach located in the northern China sea was taken as a case study with a combination of in situ investigations and numerical simulations. In addition, we captured two TCs, Lekima and Bavi, that affected the study area in the past three years. Lekima was one of the most powerful TCs landed on Shandong Province, which represented the TCs passing from the left side (left-pass) of the study area. Although Bavi weakened after entering the Yellow Sea, it can be used to discuss the effect of TCs passing from the right side (right-pass) of the study area. Hence, they were representative of the historic TCs with different characteristics.
Haiyang Beach is located on the southern Shandong Peninsula, adjacent to the Yellow Sea, with a length of 13 km and flowing an orientation of SW-NE (Figure 1A). The Haiyang Beach is a typical barred beach (Yang et al., 2012), mainly composed of well-sorted medium and fine sand (Zhang et al., 2021). Lianli Island, situated in the middle of the coast, is the first offshore artificial island in the northern China Seas. The Dongcun River estuary divides the beach into two parts, with the eastern part being a popular tourist attraction, while the western one lacks human activities and there was neither any nourishment project nor coastal engineering projects nearby. Therefore, in this study, the western Haiyang beach was focused as the target area, for the comparison of geomorphological responses to TCs with different characteristics (Figure 1C).
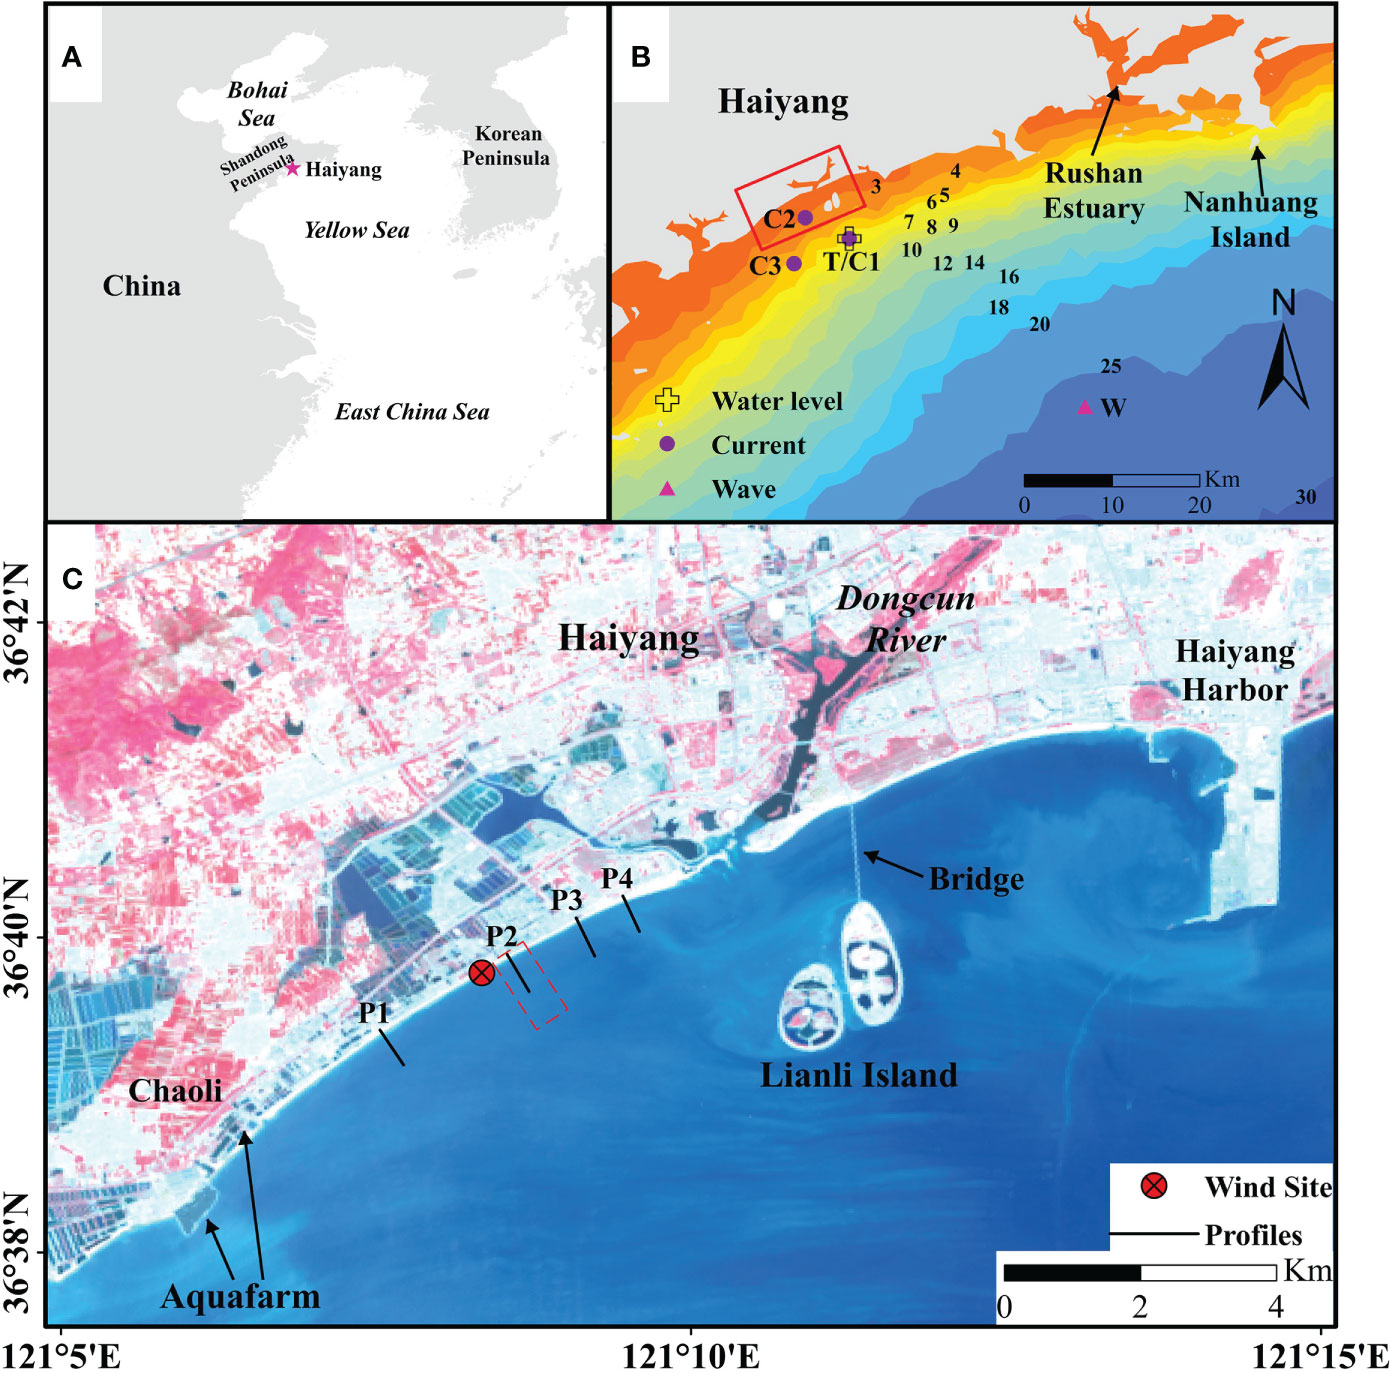
Figure 1 Location of the Haiyang beach indicated by the red pentacle (A). Location of gauging station T, current observed stations C1 to C3 and wave observed station W, and the topography of the study area (B). Layout of the observed profiles P1 to P4 as shown by black solid lines, and the background is a standard false-color Landsat image. The red dashed area represents the XBeach model domain, and the red dot with black cross represents the site of calculated wind conditions at Haiyang beach (C).
Haiyang Beach is dominated by southerly winds in the spring and summer seasons and northerly winds in autumn and winter. According to the wind data from 1963 to 1982 at Rushan Estuary station (Zhang et al., 2012; Gao et al., 2020), the annual average wind velocity in this area is 3.2 m/s, and the maximum wind velocity can reach 4.4 m/s with a direction of SSW (Figure S1A). Based on the ten-year (1984-1994) averaged wave results observed at Nanhuang Island station, waves in this area is dominated by wind-induced waves with 90% of the wave heights less than 1 m (Figure S1B). In addition, the most wave directions are SSE and SSW in summer and autumn, respectively (Figures S1C, D). The area has regular semidiurnal tides, and the tidal currents reciprocate. Compared with the 1985 national elevation benchmarks, the mean low water (MLW) is −1.20 m, the mean high water (MHW) is 1.21 m, the lowest tide level is −2.67 m, and the mean sea level (MSL) at Haiyang is 0 m (Zhang et al., 2021). For the alongshore sediment transport rate, Ren et al. (2016) calculated its value to be 0.16 to 0.19 million m3/a, with a mainly ENE direction.
Beach topography was investigated using RTK-GPS (Real Time Kinematic- Global Positioning System) with horizontal and vertical precisions of 2.5 mm and 5 mm, respectively. A total of four repeated topography observations were conducted, as presented in Table S1. At each profile, the observed resolution was less than 3m which would be reduced where the topography changed rapidly.
Three acoustic Doppler current profilers (ADCP) were used to measure the water levels and current profiles at Stations T, C1, and C2 in March 2017, while the wave data were obtained from a buoy at Station W, from August to September 2019 (Figure 1B). The detailed observation periods are presented in Table 1. These hydrodynamic data were used to validate the numerical model.
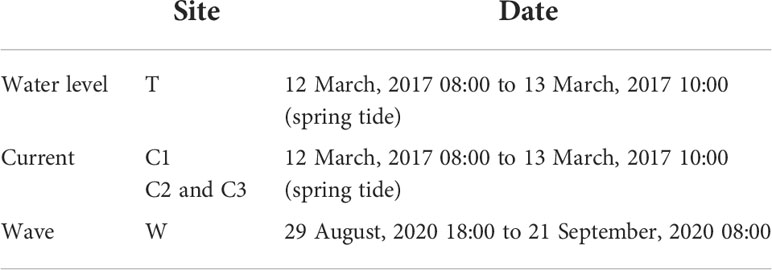
Table 1 Survey information.
Additionally, we used the DJI-M300 unmanned aerial vehicles (UAV) to obtain the topographic data of the beach to create the digital elevation model (DEM) in June 2021, and the horizontal and vertical resolution of the UAV was 1 cm and 1.5cm, respectively. In the meanwhile, the bathymetry data were obtained by the HXF-260D signal beam echosounder with a resolution of 1cm. Then, the subaerial and subaqueous data were merged to provide the initial topographic data for the Xbeach model.
The beach profile slope (tan β) is used to evaluate the impact of a storm, and is defined as the tangential angle of the foreshore between the edge of the berm and the bottom of the beach face, as shown in Figure 2. Furthermore, Qi et al. (2010) proposed the mean profile change (MPC) to quantify TC impact intensity. It is the absolute value of the averaged profile change before and after a TC, expressed by the following equation:
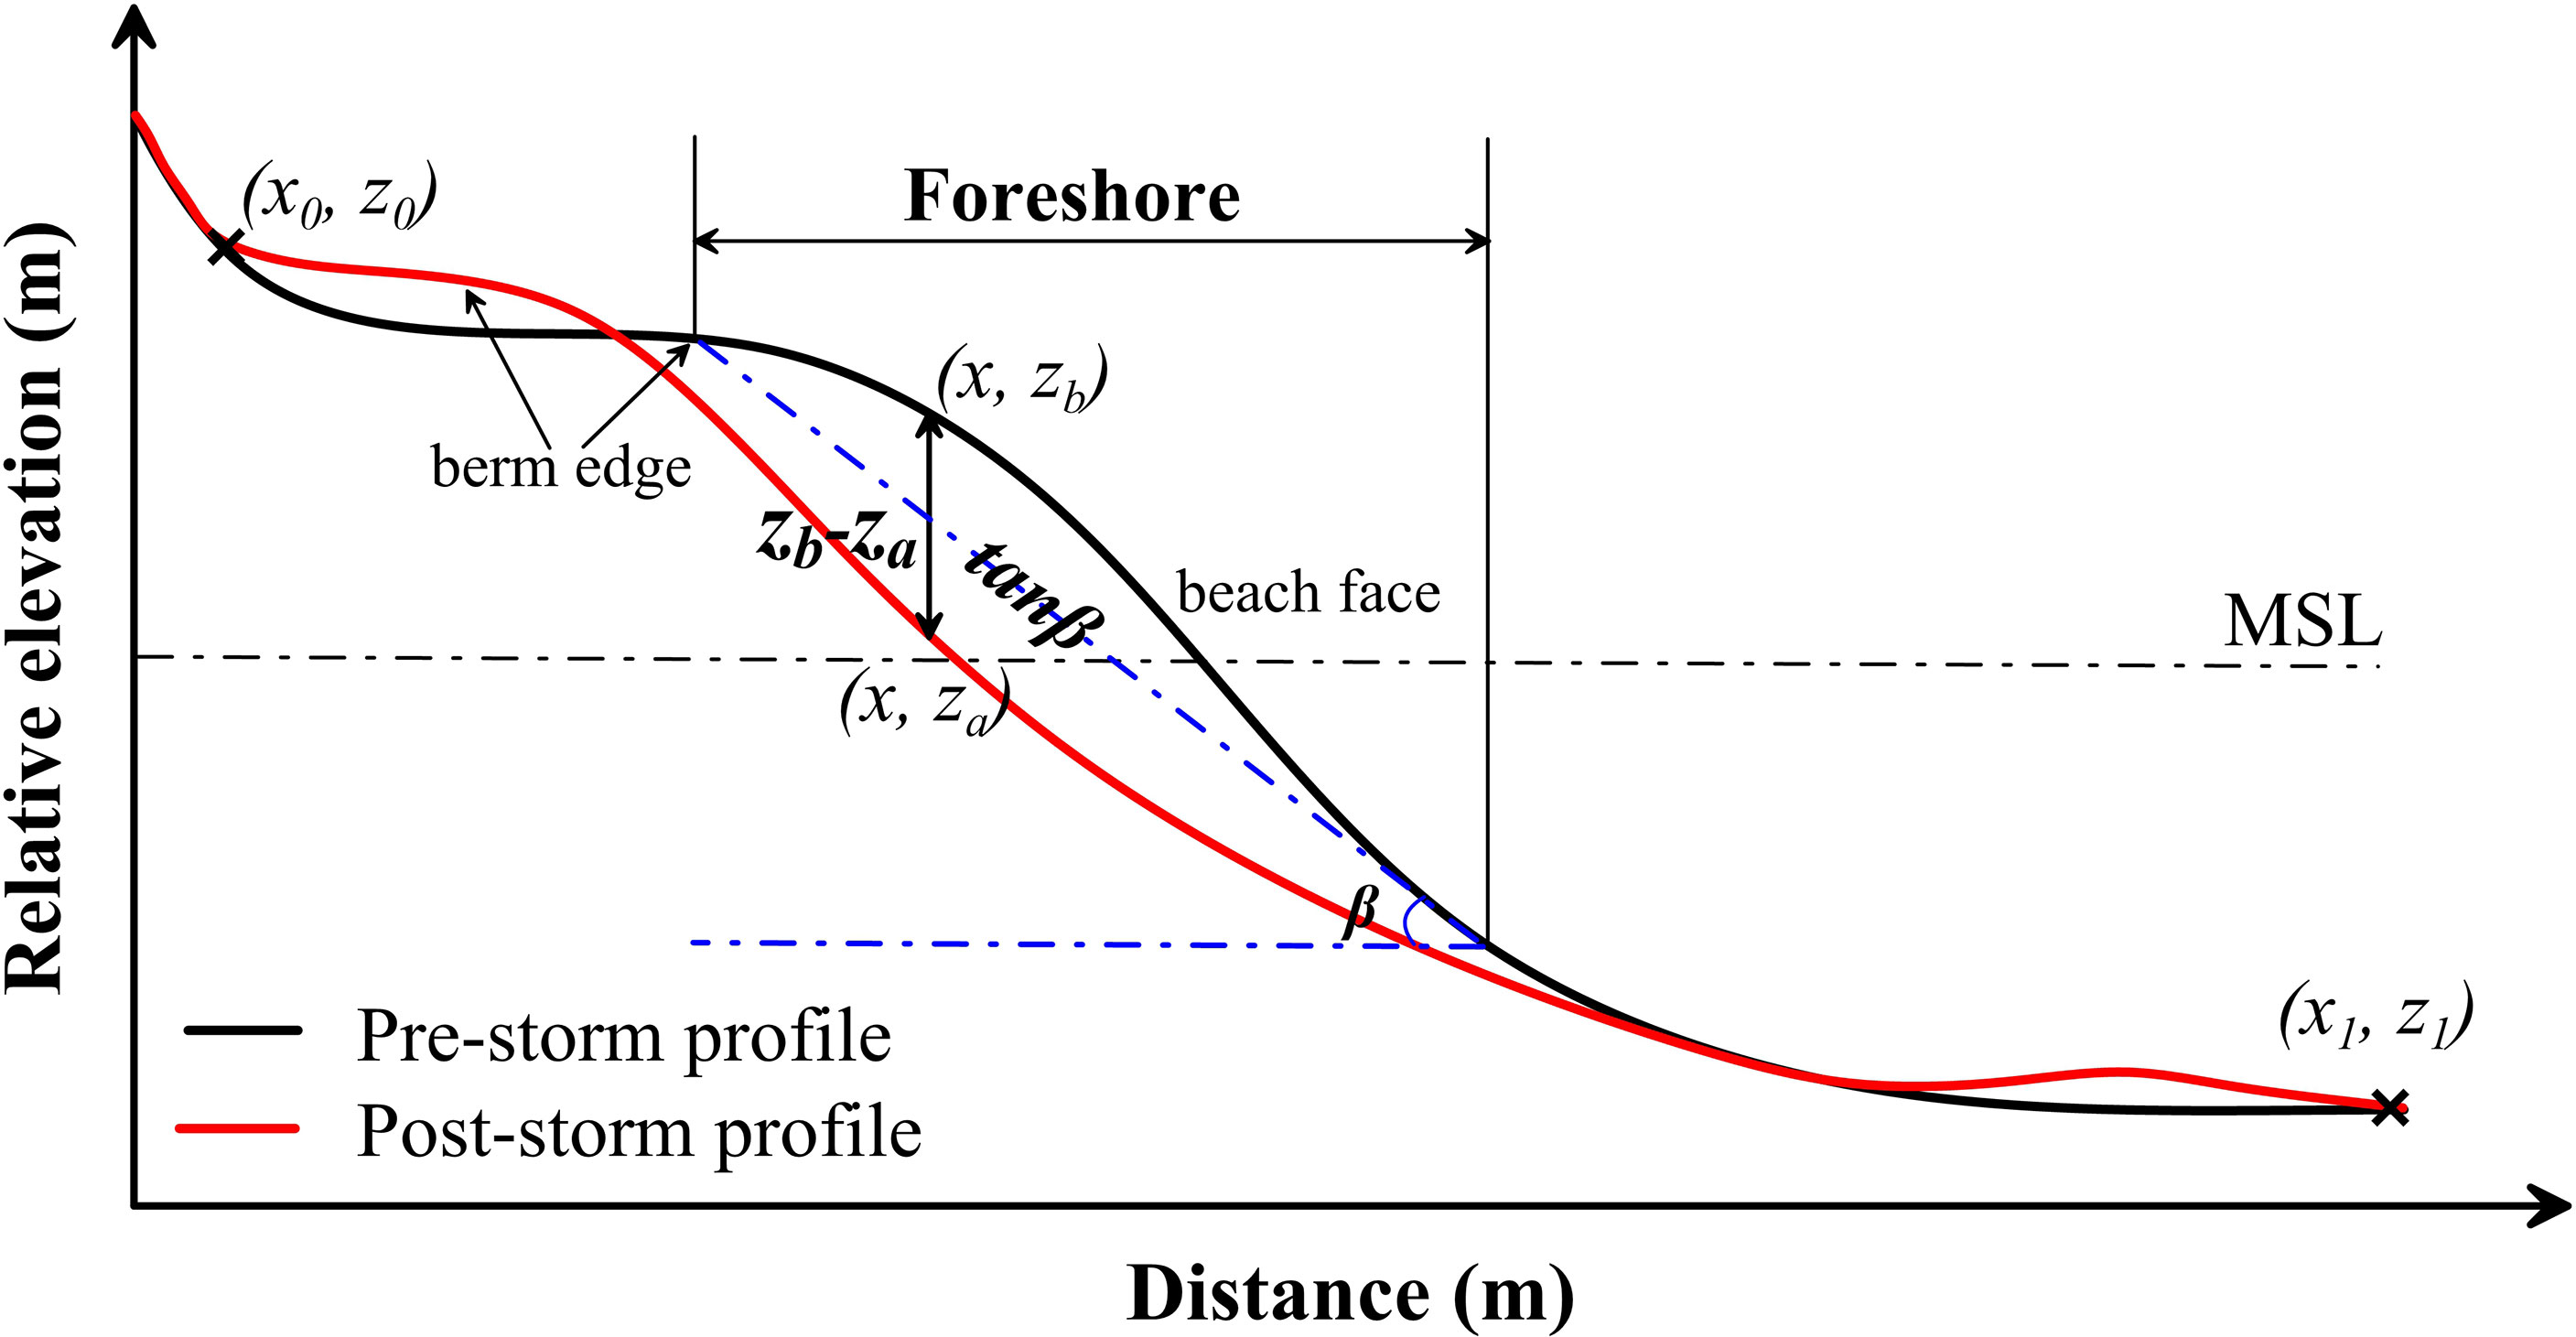
Figure 2 Definition sketch of mean profile change and beach slope (tanβ). MSL is the mean sea level, modified from Qi et al. (2010).
x0 and x1 are the first and last points where the post-storm profile is different with pre-storm profile, za and zb are the elevations at x before and after a TC, respectively.
In this study, the Regional Morphology Analysis Package (RMAP) in the Coastal Engineering Design and Analysis System (CEDAS) is used to analyze morphologic changes of beach profiles, by calculating the cross-shore sediment discharge per beach profile width. Thus, the eroded or deposited sediment volume induced by TCs could be quantitative.
The TCs data used for analyzing historic TCs’ tracks were obtained from the Tropical Cyclone Data Center of China Meteorological Administration (CMA) (URI: https://tcdata.typhoon.org.cn/). In addition, hourly wind speed and direction data during two TCs of Lekima and Bavi were obtained from the National Center for Environmental Prediction Climate Forecast System Version 2 (NCEP-CFSv2) with a horizontal resolution of 0.2 degrees (URI: https://rda.ucar.edu/datasets/ds094.1/). This data was also used to drive the FVCOM model as the meteorological force.
The finite-volume coastal ocean model (FVCOM) (Chen et al., 2003; Chen et al., 2013) was established to simulate the hydrodynamic conditions during the TCs events. This model has been successfully applied to the study of estuaries, coasts, and adjacent shelf seas (Chen et al., 2008; Bao et al., 2015; Mao and Xia, 2018; Zhong et al., 2020). FVCOM is discretized with unstructured triangular grids in the horizontal direction and a generalized terrain-following coordinate system in the vertical direction. The governing equations are closed; with a default configuration of the Mellor and Yamada level 2.5 (MY-2.5) turbulent closure scheme for vertical eddy viscosity (Mellor and Yamada, 1982) and the Smagorinsky eddy parameterization for the horizontal diffusion coefficients (Smagorinsky, 1963). The wave module (FVCOM-SWAVE) was converted from the Simulating Waves Nearshore (SWAN) model, which was developed by (Booij et al., 1999) and then improved by the SWAN Team (2006). The finite-volume approach of FVCOM ensures volume and mass conservation in individual control element and across the entire computational domain.
The governing equations consist of the following momentum, continuity, and density equations in Cartesian coordinates:
where x, y, and z are the east, north, and vertical axes in the Cartesian coordinate system; u, v, and w are the x, y, and z velocity components; ρ is the density; Pa is the air pressure at the sea surface; PH is the hydrostatic pressure; q is the non-hydrostatic pressure that satisfies a Poisson equation that can be derived from the discrete decomposition using the fractional-step method; f is the Coriolis parameter; and g is gravitational acceleration. The total water column depth is D = H + ζ, where H is the bottom depth (relative to z = 0); and ζ is the height of the free surface (relative to z = 0). P = Pa+ PH+ q is the total pressure at which the hydrostatic pressure PH satisfies:
The study area, including Haiyang Beach and its adjacent seas, was divided by an unstructured triangular mesh, as described in Figure S2. The mesh contained 17972 nodes and 34596 cells. The horizontal resolution of the grids was 60 m at the Haiyang beach and approximately 3 km at the open boundary. The water column was vertically divided into seven uniform sigma layers. The shoreline in the model was the high-water line in 2019, and the topography data were extracted from the China Marine Chart database. The hydrodynamic conditions at the open boundary, including sea surface height, current, and waves, were derived from Zhong et al. (2020) which were well-calibrated. The startup type was a ‘cold start’. The simulated period was from January 1, 2017, to January 1, 2021, with the time step of 1s, and the initial water level and velocity in the domain were set to zero.
The model was validated using the observed data (Figure S3). The simulated results were evaluated by the correlation coefficient (R2) and root mean square error (RMSE). Both the observed and modeled water levels and current velocities exhibited significant semidiurnal and spring-neap tidal variations. The simulated water level was in very good agreement with the observations at Station T, with an R2 greater than 0.98 and RMSE less than 0.18 m. The R2 and RMSE of the observed and simulated current velocities at Stations C1 and C3 were more than 0.68 and less than 0.11 m/s, respectively. At Station C2, the R2 of the current velocity decreased to 0.54, probably because this station was closer to the coastline and the current changed rapidly in shallow water. Nevertheless, the directions of the currents at all three stations were in good agreement, with an R2 greater than 0.9. The wave model reproduced the variations in the significant wave height and wave period effectively. The R2 and RMSE between the simulated and observed significant wave height were 0.77 and 0.25 m, respectively; and the values for the peak wave period were 0.74 and 2.74 s, respectively. Therefore, the numerical model provided satisfactory performance in simulating regional ocean dynamic processes.
Xbeach is an open-source numerical model to simulate hydrodynamic and morphodynamic processes. This model includes the hydrodynamic processes of short-wave transformation, long-wave transformation, wave-induced setup, and unsteady currents, as well as overwash and inundation (Roelvink et al., 2009; Delft, 2018). Over the last decade, it is widely used to simulate the impact of powerful events on a sandy beach, such as sediment transport, shoreline evolution, and seabed evolution, and it has been validated with a series of analytical, laboratory, and field test cases by a standard set of parameter settings (Bugajny et al., 2013; van Verseveld et al., 2015; Harter and Figlus, 2017; McCarroll et al., 2021).
In this study, a 2DH model with gradient grids is established to discuss the beach evolution due to different TCs conditions. The simulated area extends 1000 m and 500 m offshore and alongshore, respectively, which locates in the middle of Haiyang Beach covering profile P2 (Figure 1C). The averaged resolutions are about 3 m and 5 m, respectively. Thus, the response of profile P2 to different wind fields is simulated to discuss the wind effect. The DEM of the model domain is shown in Figure S4. In this model, the type of bed friction was set as “manning”, the value of the friction coefficient (bedfriccoef) was 0.25, the wave model was “surfbeat”, and the morphological acceleration factors (morfac) was 10, all other model coefficients use the default values. At the offshore boundary, it is forced by hourly-averaged tidal levels, wave heights, periods, and directions which are obtained from FVCOM simulation results.
To examine the response of beach profile to different wind conditions, the Cyclone Wind Generation tool of Mike21 toolbox based on the Young and Sobey wind model (Young and Sobey, 1981) was used to generate three TCs with different tracks (L-A, L-B, and R) as shown in Table 2 and Figure S5. The correction coefficient of forwarding motion asymmetry and inflow angle in the wind model used the method of Harper and Holland (1999) and Sobey et al. (1980), respectively. The radius to the maximum wind speed (Rmax) and the central pressure (Pc) of a TC were calculated referred to (Graham and Nunn, 1959) and (Atkinson and Holliday, 1977), respectively. The translation velocity (Vt) and the wind speed (V) of cyclones (L-A, L-B, and R) are estimated from the averaged value of the 1949-2020 historic TCs data.
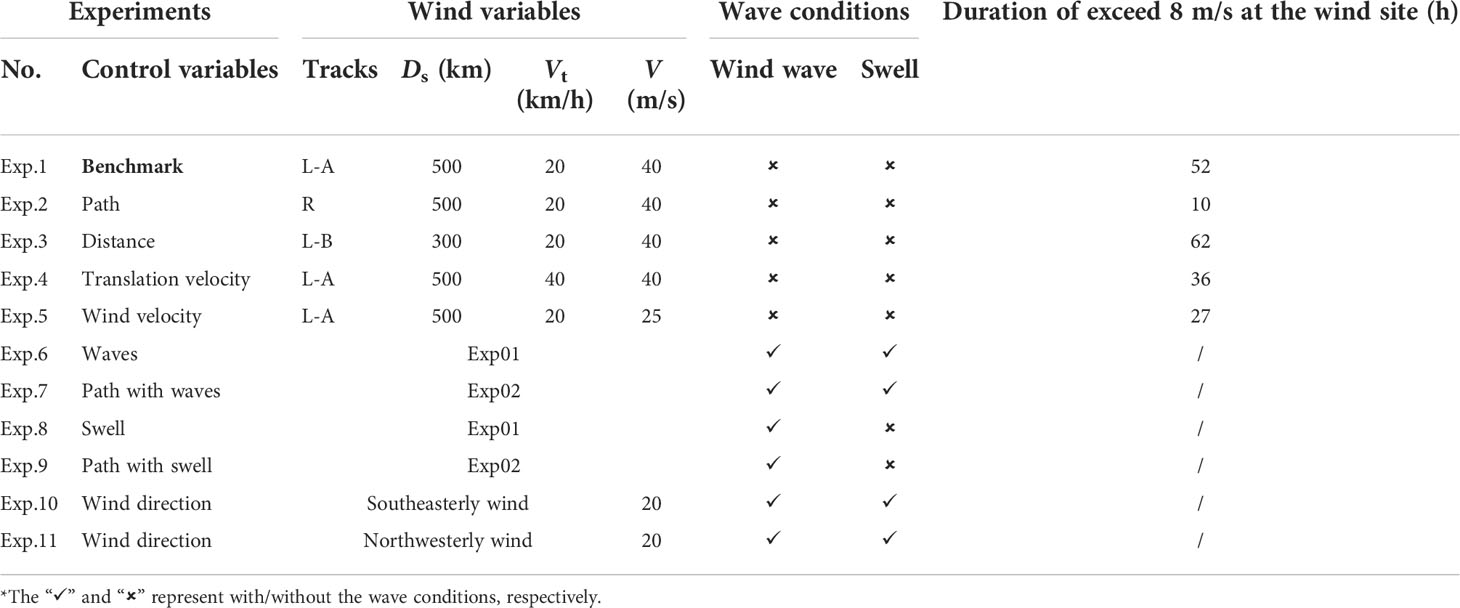
Table 2 Setting of numerical experiments.
Therefore, eleven sensitive experiments (Table 2) were conducted to discuss the response of hydrodynamics to different wind conditions. Several factors, including the distance of cyclones to Haiyang (Ds), the translation velocity (Vt), strong wind duration, and the wind speed (V) were discussed. Exp.1 was a benchmark run forced by a left-pass cyclone (L-A, Figure S5A). To examine the influence of the different tracks, Exp.2 was driven by a right-pass cyclone with the same conditions as Exp.1 except for the relative position to the Haiyang beach (Figure S5B). In Exp.3, the Ds was decreased from 500 km to 300 km to analyze the influence of the distance of the cyclone to the beach (Figure S5C). The Exp.4 was designed to study the influence of the duration of strong wind on the beach compared with Exp.1, as the cyclone in Exp.4 moved twice as fast as in Exp.1, and the duration of the strong wind at Haiyang Beach was significantly decreased (Figure S5D). In Exp.5, the intensity of the cyclone was reduced with a significant decrease of Vmax to study the influence of the wind speed (Figure S5E). The wave conditions were considered in Exp.6 to 9. Among them, Exp.6 and Exp.7 were driven by the same wind fields as Exp.1 and Exp.2, respectively. In Exp.8 and Exp.9, the swell conditions were removed to discuss the contribution of the swell, and the results were compared with those from Exp.6 and Exp.7, respectively. Since the wind direction was opposite induced by the TCs passing on the left and right side of the beach, thus, we conducted Exp.10 and Exp.11 using the southeasterly (SE) and northwesterly (NW) wind, respectively, to study the influence of wind direction on the beach.
There were totally 77 TCs that passed across the southern Shandong Peninsula between 1949 and 2020 (Figure 3A). The annual average rate is 1.1 times which is far less than the 12 TCs that occur each year in the southern China Seas (Qi et al., 2010). The tracks can be divided into three pathways: those that attack Haiyang Beach directly, those that pass across the Shandong Peninsula to the west, and those that pass to the east crossing the North Yellow Sea with landing on the Korean Peninsula. Among the 77 TCs, 16 passed the left side of the study area, 50 passed the right side, and 11 passed directly across the study area.
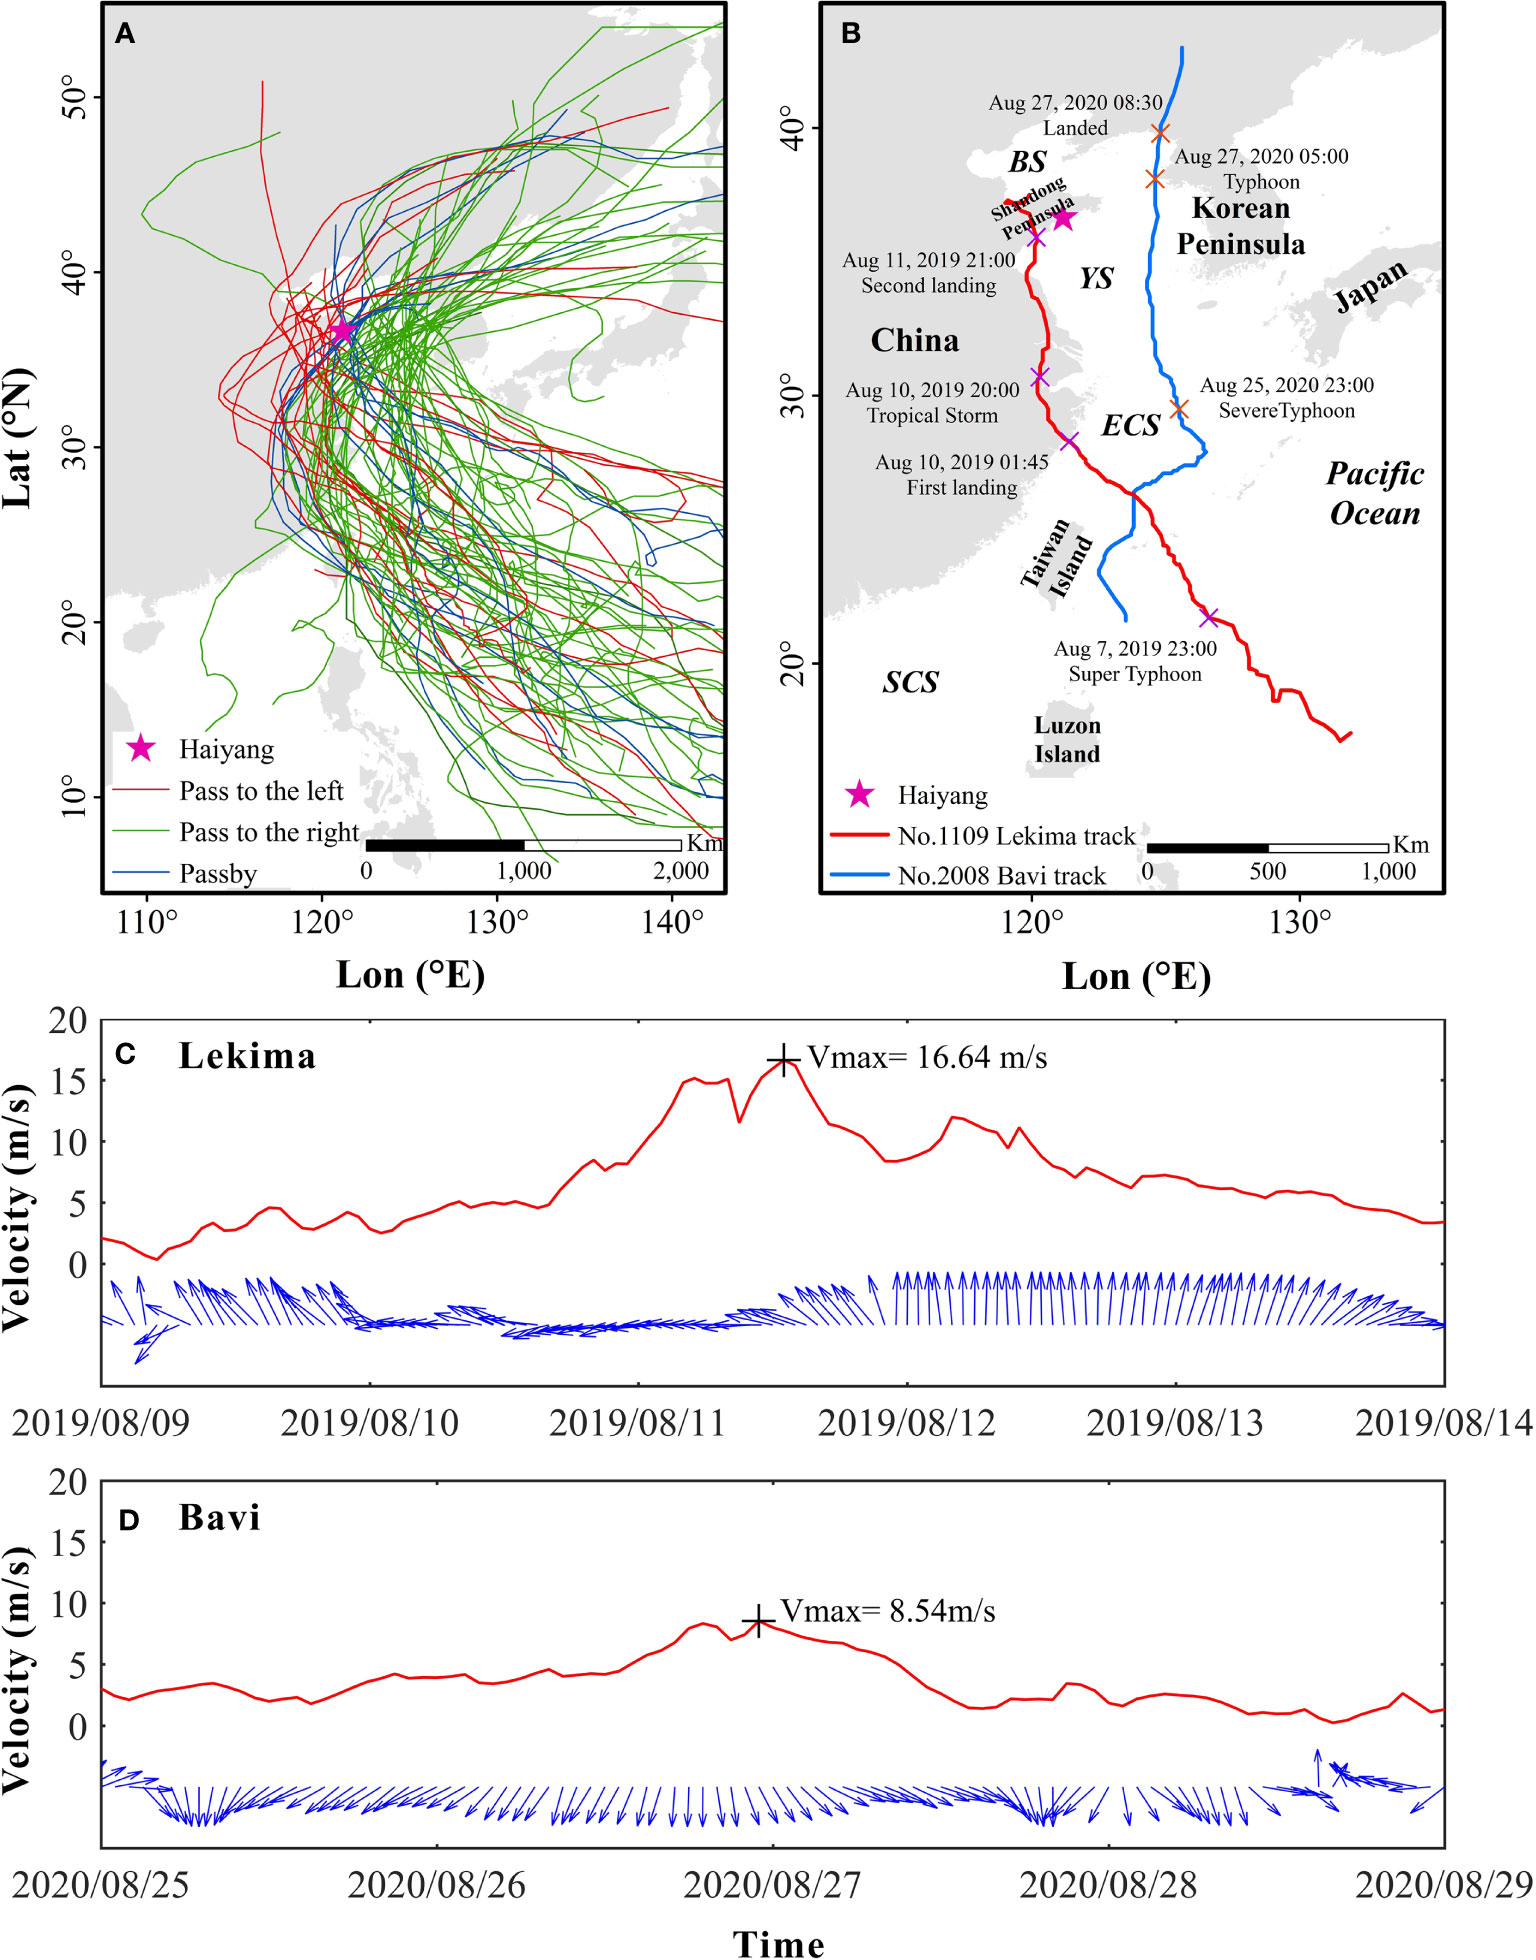
Figure 3 Tracks of the historic TCs that affected the Shandong Peninsula from 1949 to 2020 (A). Tracks of the Lekima and Bavi considered in this study (B). Hourly time series of wind velocity (red line) and direction (blue arrows) at Haiyang beach (the wind site in Figure 1C) during Lekima (C) and Bavi (D), respectively.
In this study, two TCs, Lekima (No. 1909) and Bavi (No. 2008), that affected the east and west of the study area, respectively, were considered, as presented in Figure 3B. Lekima formed at 16.7°N and 131.5°E in the northwest Pacific on August 4, 2019. It then quickly moved northwestward and intensified. The maximum wind velocity of Lekima was up to 52 m/s when it first landed on the east coast of China. After approximately 18 h, it was downgraded to a tropical storm and then moved to the North Yellow Sea. Lekima landed again on the southern coast of the Shandong Peninsula on August 11, with a maximum wind velocity of 23 m/s. It continued to move north until dissipated in the Bohai Sea on August 13. During Lekima event, the maximum wind velocity was 16.64 m/s (Figure 3C) with a direction that transitioned from easterly to southerly (landward) at Haiyang Beach.
Bavi formed at 21.6°N and 123.5°E to the southeast of Taiwan Island on August 21, 2020, which moved northwardly into the East China Sea. When crossing the Yellow Sea and the Bohai Sea, Bavi weakened to the status of a typhoon on August 27, 2020, and finally landed on the northern part of the Korean Peninsula with a maximum wind velocity of 35 m/s. During the Bavi event, the wind velocity at Haiyang Beach was less than 10 m/s (Figure 3D) with northerly direction (seaward).
After Lekima, all four profiles exhibited minor accretion at the lower part of the beach face in the area near the mean high water level (MHW). However, significant erosion could be found at the upper part of the foreshore zone at all profiles, with a maximum vertical value of 0.3 m at P1 (Figure 4). In addition, obvious accretion around the mean low water level (MLW) with sandbars in the nearshore zone can be found in profiles P2, P3, and P4 which are in the middle and eastern parts of Haiyang Beach.
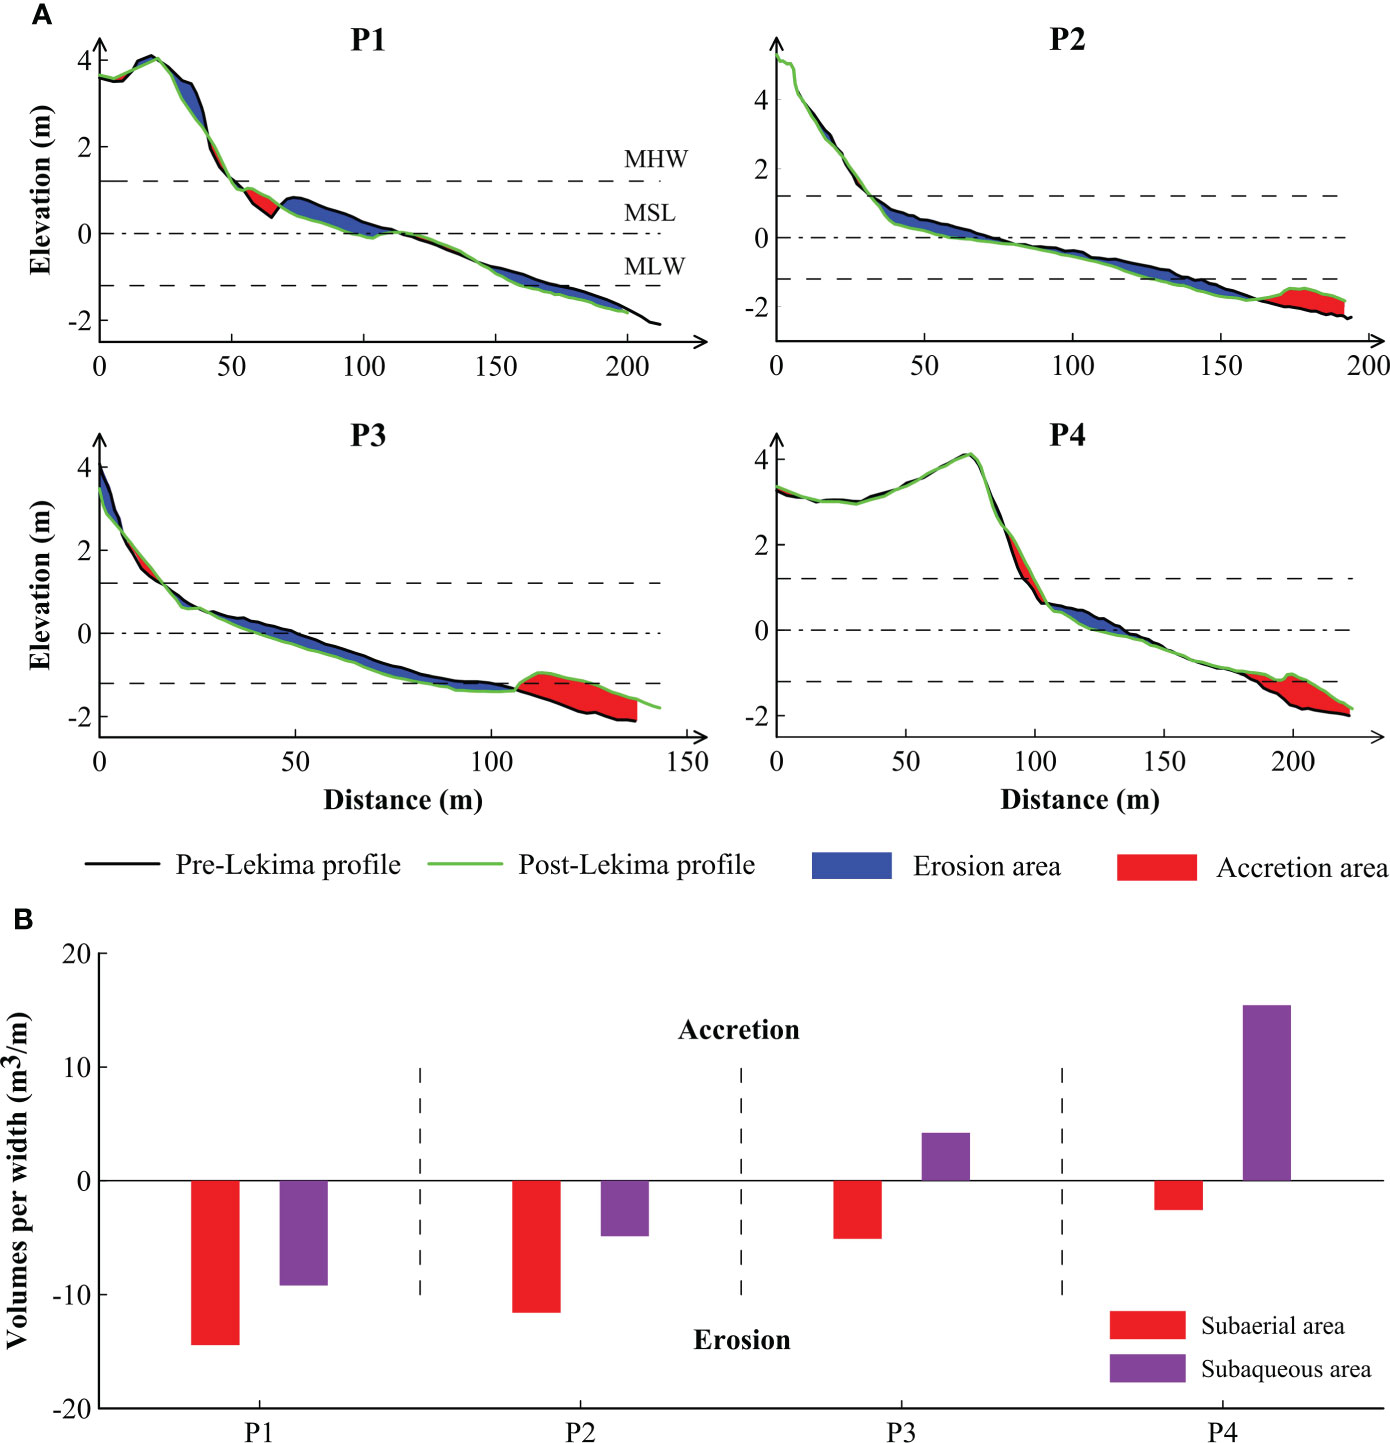
Figure 4 Topographic changes in beach profiles (locations can be found in Figure 1C) before and after Lekima (A), MHW indicates the mean high water level, MSL indicates the mean sea level, and MLW indicates the mean low water level. Comparison of sediment budget of each beach profile after Lekima (B).
According to the method mentioned in Section 3.2, the total sediment budget per width at profile P1 reached a maximum of -23.62 m3/m, followed by the erosion of -16.47 m3/m at P2 profile (Figure 4B). The eroded sediment volume in the subaerial area decreased gradually from the western to the eastern part of the beach, and reached a minimum of -2.56 m3/m at P4. The subaqueous area (below the MSL) at the P1 and P2 profiles maintained erosion, whereas accretion on the eastern beach gradually occurred due to the formation of subaqueous sand bars. The accretion per width reached a maximum of 13.30 m3/m at profile P4. In general, bounded by Profile P3, the western part of the beach experienced severe erosion after Lekima, while the eastern part exhibited weak accretion with the formation of subaqueous sand bars.
We captured the beach profile change induced by typhoon Bavi in 2020 (Table S1). Though Bavi caused smaller wind velocity at Haiyang Beach than Lekima (Figure 3D), it could be a representative of the cyclone passing on the right of the study area. Compared to the profile changes after Lekima, the erosion and deposition areas were relatively weak after Bavi (Figure 5A). Furthermore, no more sandbar was formed. The absolute changes in the slope of all profiles induced by Lekima were greater than 0.01, and the MPCs were larger than 0.1m (Figure 5B). However, Bavi had little effect on the beach, with the slope changing slightly and MPC less than 0.1m. Based on observations after the two TCs, the MPC value increased as the beach slope variation increased.
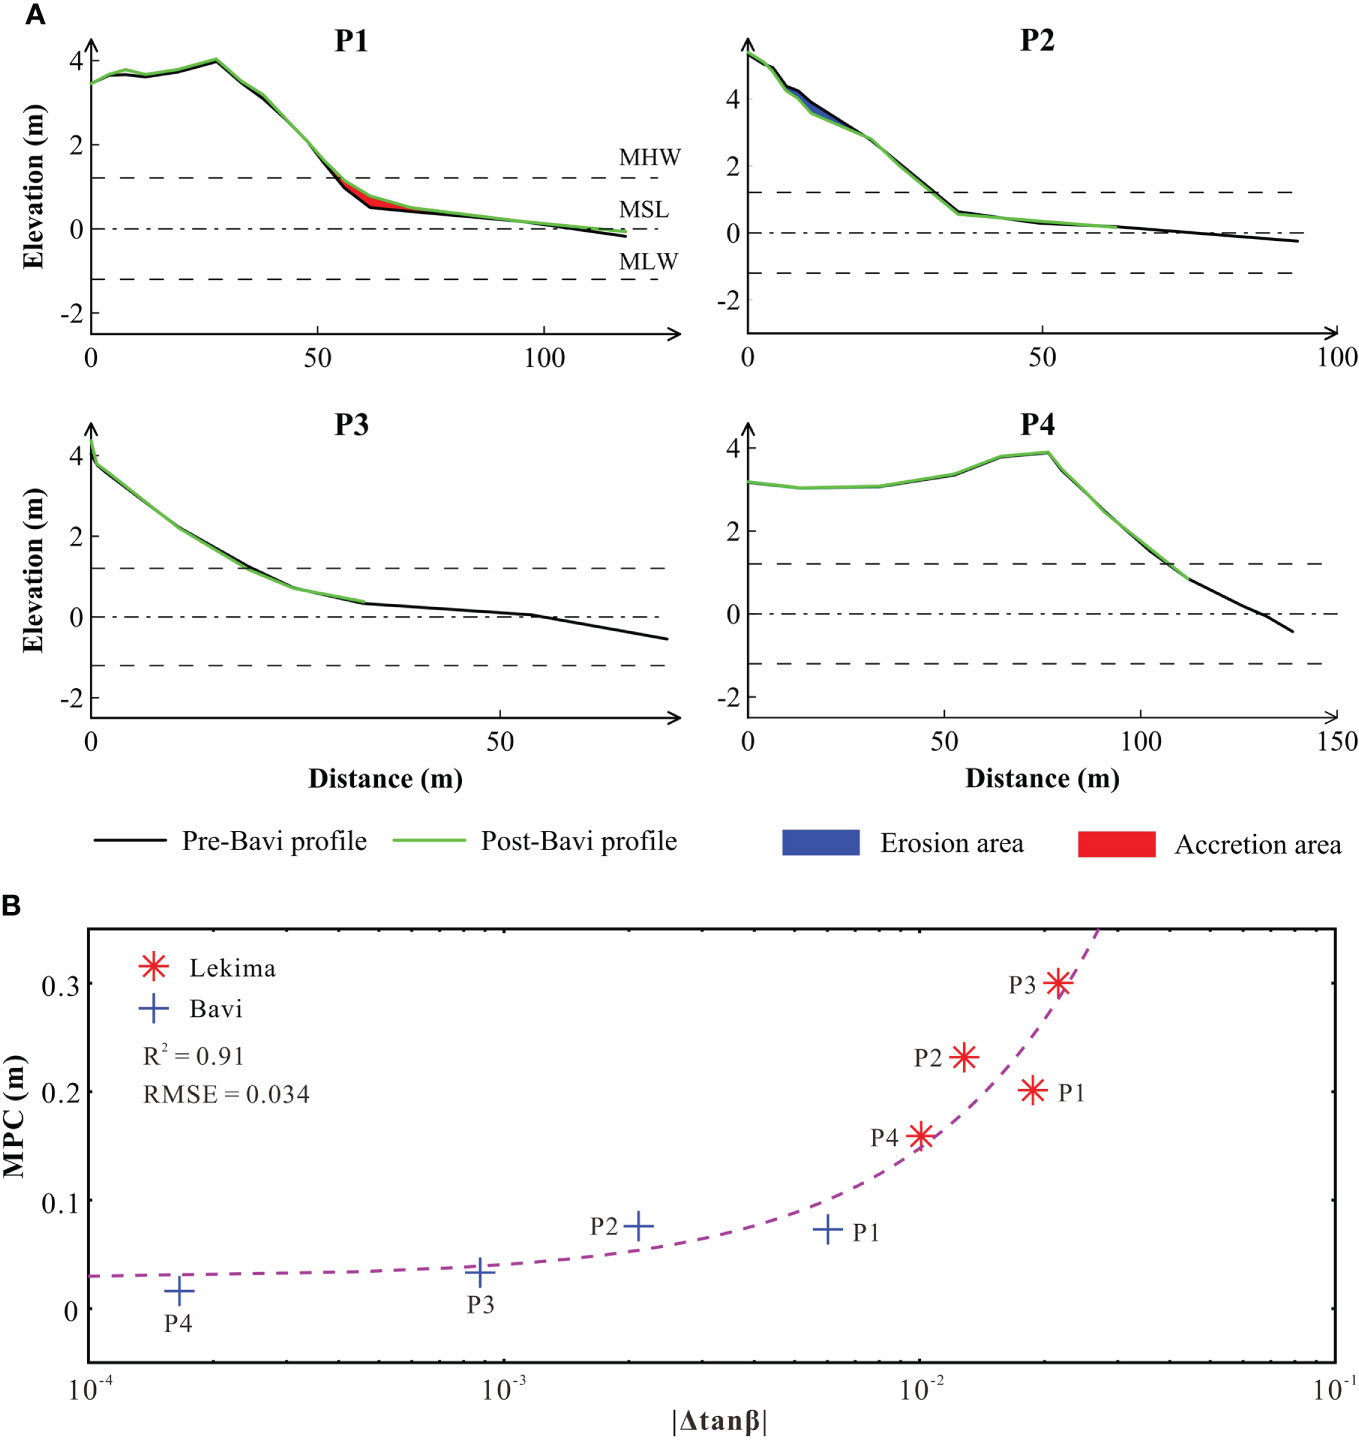
Figure 5 Changes in beach profiles before and after Bavi (A). Relationship between beach slope and mean profile change (MPC) induced by two TCs (B), the dashed purple line is the fitted curve.
Both the surface residual current and bottom shear stress in the study area induced by Lekima (Figure 6A) were much stronger than that resulted from Bavi (Figure 6B). This indicated a larger suspended sediment transport during Lekima. Since the beach profile change was mostly related to offshore sediment transport. The stronger seaward residual currents at the bottom layer induced by Lekima (Figure 6C) were more likely to result in sandbars (Figure 4A), but the residual currents induced by Bavi were relatively weak (Figure 6D). Moreover, in the northern hemisphere, the left-pass cyclones induced landward wind and right-pass cyclones induced seaward wind in the study area, thus the storm surge and duration of strong-effect period induced by landward wind were much larger than that caused by seaward wind. Though these two TCs occurred during neap tides (Figures 6E, F), the maximum surge reached 0.72m induced by Lekima, which was significantly larger than 0.34 m that of Bavi. All of the above comparisons indicated a stronger beach profile change resulting from Lekima than Bavi. However, not only the difference in tracks but also the differences in wind speed and duration between these two TCs. It’s hard to attribute changes in the beach profiles to any one factor of wind. Furthermore, despite the significant difference in wind speed between these two TCs (Figures 3C, D), the simulated wave heights were all about 2m. Thus, more sensitive numerical experiments are needed.
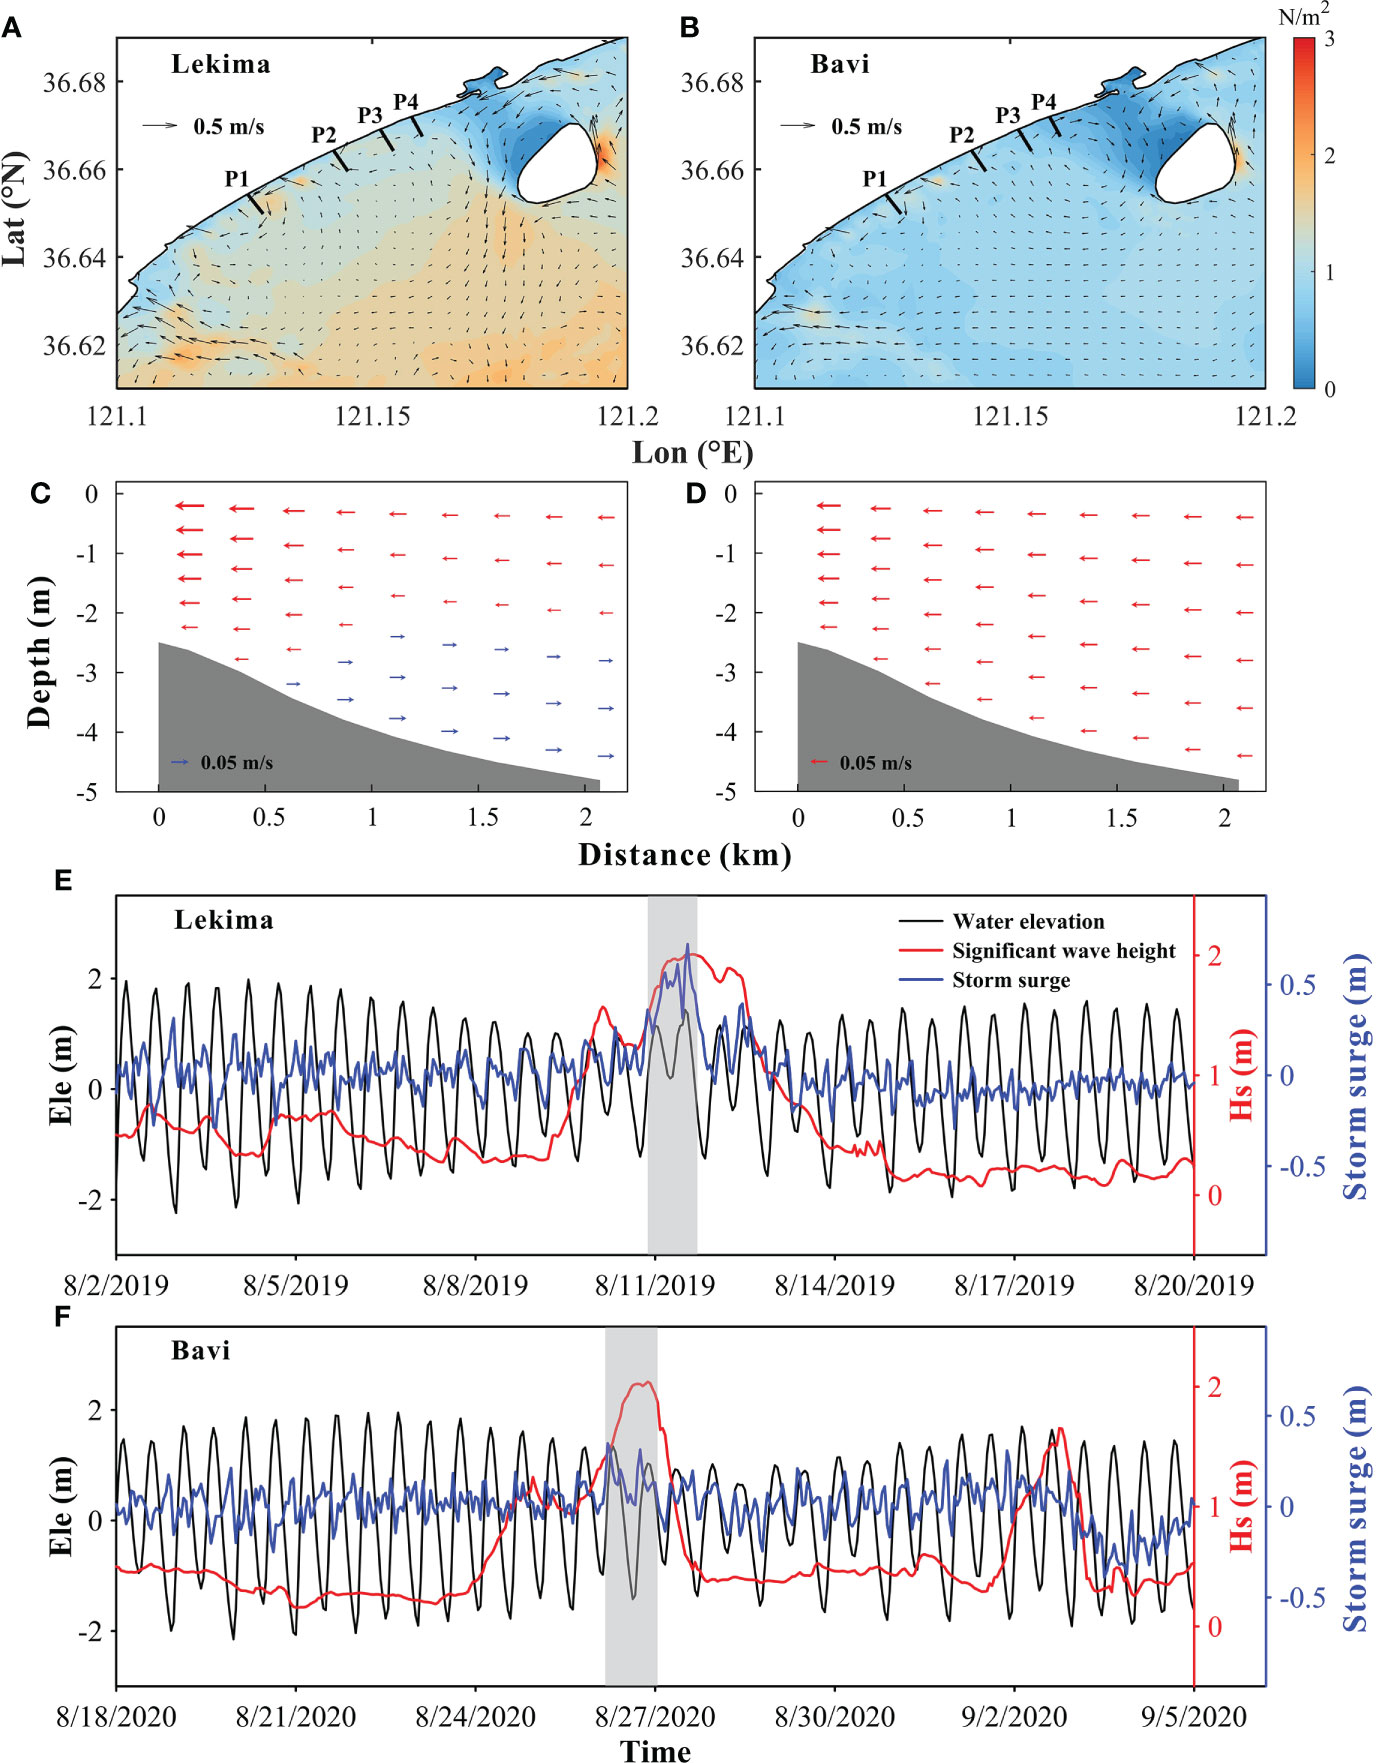
Figure 6 13h averaged surface residual currents (arrows) and bottom shear stress (colored) induced by Lekima (A) and Bavi (B), respectively, and vertical distributions of residual currents at profile P2 with red arrows indicated onshore and blue arrows indicated offshore during these two events (C, D). Time series of simulated water elevation (black line), significant wave height (red line) and storm surge (blue line) at Station C2 during Lekima (E) and Bavi (F), respectively. The gray areas represent the periods when storm surge were higher than 0.3 m and 0.1 m, respectively, which we refer to as the ‘strong-effect period’ of the two TCs.
It is well known that the wind speed of the TCs in the northern hemisphere intensifies on the right side of the track. Although the maximum wind speed of the right-pass cyclones is the same as that of the left-pass, the wind speed at Haiyang is reduced from 13.47m/s to 8.48m/s (Figure S5). Furthermore, the duration of wind speed greater than 8m/s decreased from 52 hours in Exp.1 to 10 hours in Exp.2 (Table 2).
Surface residual currents of Exp.1 with left-pass cyclones (Figure 7A) were much larger than that of Exp.2 driven by right-pass cyclones (Figure 7B). This indicated more active sediment resuspension and much stronger coastal sediment transport in Exp.1. Moreover, the seaward bottom currents as shown in P2 profile (Figure 7F) in Exp.1 would transport sediments offshore and induce to a formation of a sandbar. However, the geomorphological change may be much weaker in Exp.2, because of landward bottom currents at profile P2 (Figure 7G) and less coastal sediment transport. These results agreed with the comparison of Lekima and Bavi with different tracks. Though the maximum wind speed of cyclones was set to be the same in the sensitive experiments, the hydrodynamics were closely related to the tracks.
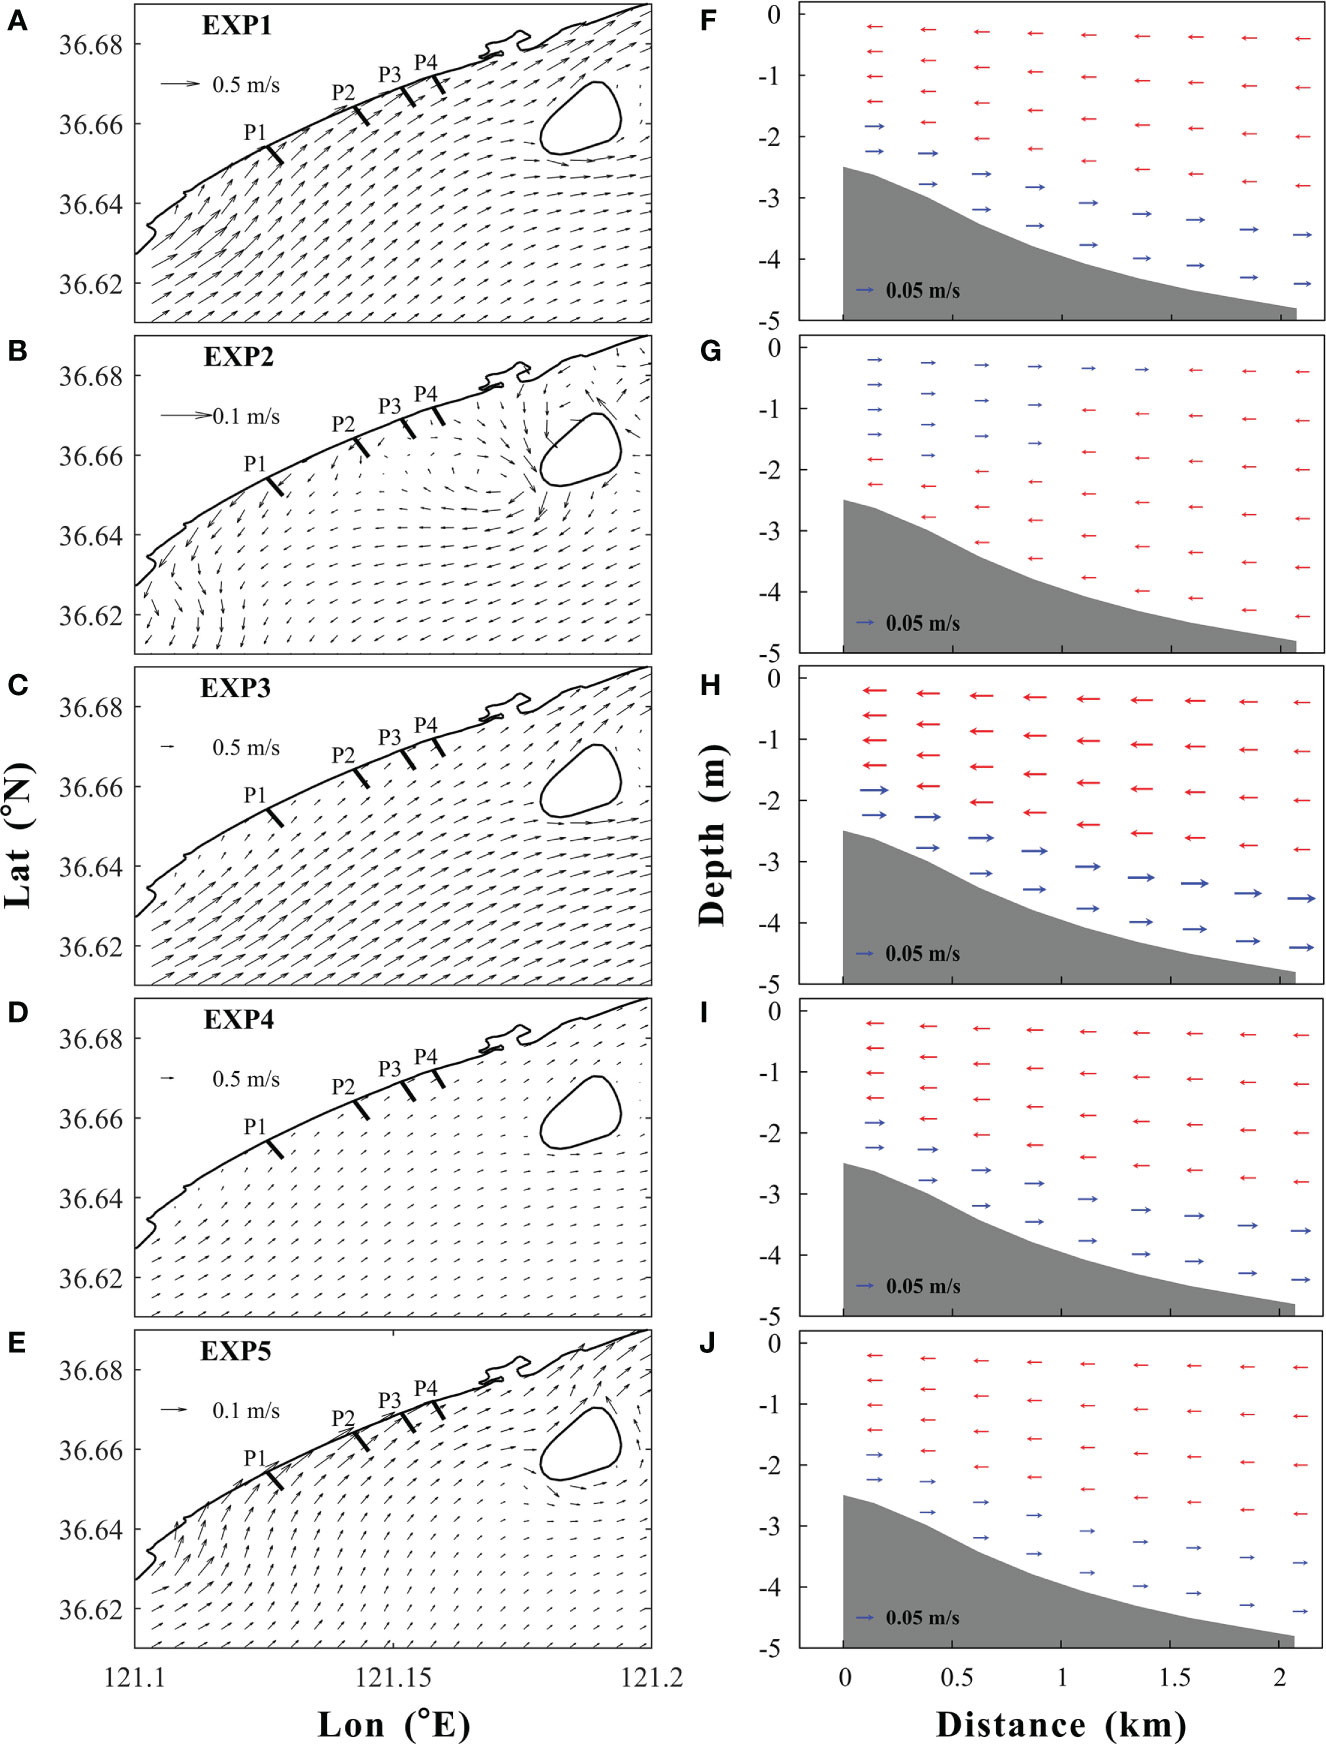
Figure 7 25h-averaged surface residual currents and vertical distribution of residual currents at P2 profile with red arrows indicated onshore and blue arrows indicated offshore in Exp.1 (A, F), Exp.2 (B, G), Exp.3 (C, H), Exp.4 (D, I) and Exp.5 (E, J), respectively.
For the left-pass TCs, whether the distance between the cyclones and the beach decreased (Exp.3) or the translation velocity of the cyclones increased (Exp. 4) which shortened the impact time (Table 2), the distribution of coastal currents and sectional currents at profile P2 (Figures 7C, D, H, I) are similar as Exp.1 with increased current velocity. For the results of Exp.5 with weakened TCs, the current pattern didn’t change except the magnitude of the residual currents decreased (Figures 7E, J). This indicated that the contribution of the cyclones’ track was much more important than the cyclones’ intensity on the pattern of coastal currents and sectional currents.
As shown in Figure 8, similar significant wave height (Hs) can be found during Lekima and Bavi, though the wind speeds were very different. Thus two additional simulations for these two cyclones were conducted without swell to examine the contribution of swell. The Hs didn’t change a lot with or without swell during Lekima, however, the Hs was very different during Bavi (Figure 8A). A set of sensitive experiments with or without swell (Exp.6 to Exp.9 in Table 2) were also designed. Similar results can be concluded that swell contributes most to the waves induced by right-pass cyclones (Exp.7 and Exp.9 in Figure 8B). This indicated that though the wind wave height was small during offshore wind, the swell from out seas was comparatively large. This can also be demonstrated in the simulation of Hs during Lekima and Bavi. Without the effect of swell, Hs during Bavi which the wind direction is seaward is relatively small.
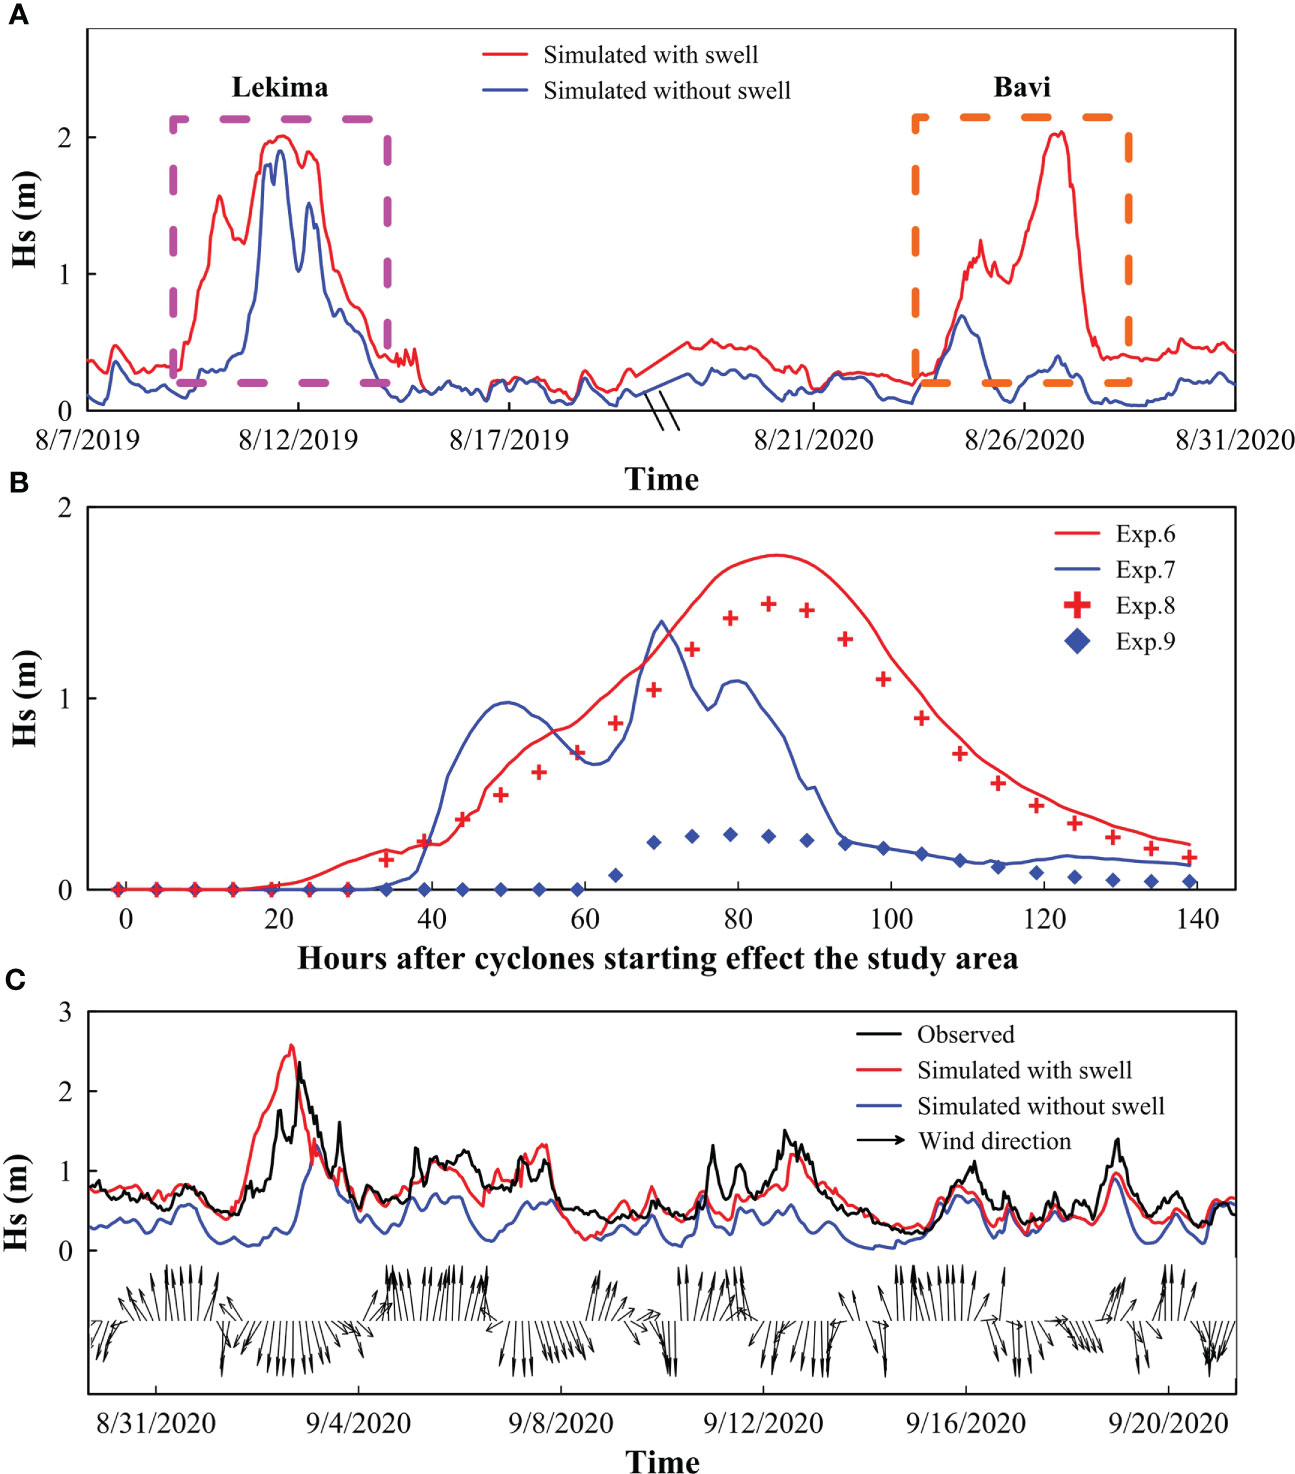
Figure 8 Comparisons of the simulated significant wave heights with/without swell at Station C2 during Lekima and Bavi (A) and driven by ideal wind in Exp.6 to Exp.9 (B), respectively. Comparisons between the observed and simulated significant wave heights with/without swell at Station W, and the time serious of wind directions (black arrows) were obtained from CFSv2 (C). The purple dotted rectangular box represents the period of Lekima, and the orange one represents the period of Bavi in panel (A).
The conclusion of swell contributes most to the seaward wind waves can also be supported by the observations in the general weather. During northerly wind, a large bias can be found between the observed and simulated Hs without swell (Figure 8C). While it showed a great agreement between the observed and simulated Hs during southerly wind, despite wind wave only.
Although Lekima and Bavi showed anticlockwise rotating wind fields, wind affecting Haiyang Beach just exhibited southerly and northerly winds (Figures 3C, D), respectively. Thus, two experiments driven by steady southeasterly (Exp.10) and northwesterly wind (Exp.11) were set to compare with the effect of cyclones (Table 2).
The distribution of surface residual current and vertical current field of the P2 profile induced by the southeasterly wind field (Figure 9A) had the same trend as that of the left-pass cyclone (Figure 5F). Similarly, the results caused by the northwesterly wind field (Figure 9B) were the same as that of the right-pass cyclone (Figure 5G). This indicated that wind direction was an important factor that dominated the hydrodynamics in the study area.
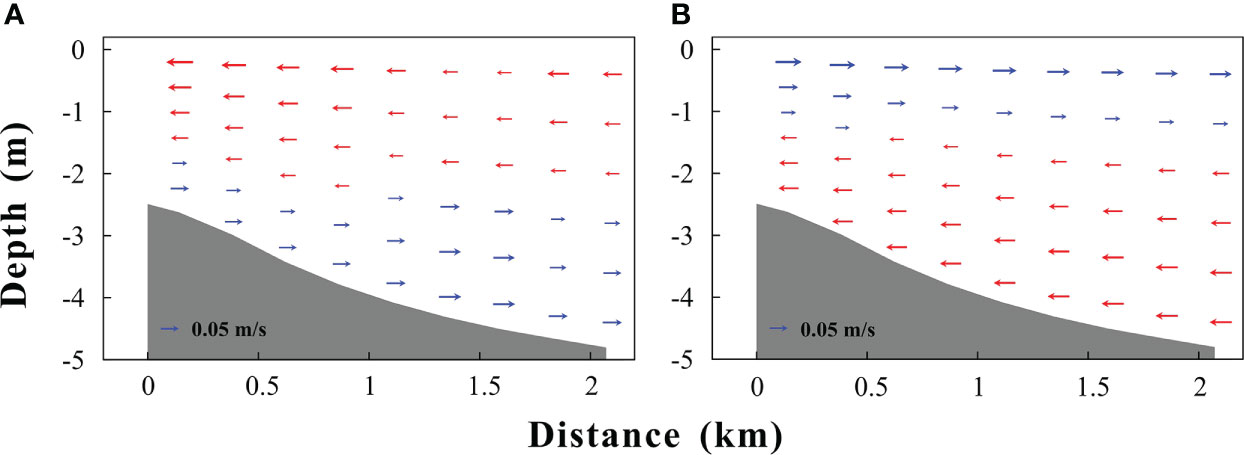
Figure 9 25h-averaged vertical distribution of residual currents at P2 profile with red arrows indicated onshore and blue arrows indicated offshore in Exp.10 (A), Exp.11 (B), respectively.
Considering the limited computing capacity, the P2 profile was selected as a typical simulation based on the Xbeach model. The simulated elevation changes of the P2 profile in the experiments (Exp.6, Exp.7, Exp.10, and Exp.11) were compared with the initial seabed (Figure 10). Due to the landward wind induced by a left-pass cyclone, the P2 profile was eroded on beach face and deposited on the bottom of the beach, with the net sediment volume changes of about -4 m3/m. This sediment budget indicated a similar sediment loss but the value was less than the -16.47 m3/m that resulted from Lekima. However, when the cyclone passed on the right side of the beach, the profile exhibited a slight change at the bottom of the beach surface, which was similar to the changes of the P2 profile after Bavi. Similar trends to Lekima and Bavi suggest that XBeach can be used to compare the relative changes of different experiments, although not enough topography data pre-Lekima or Bavi induced a lack of direct comparison with these two cyclones. Moreover, to verify the effect of wind direction, the southeasterly (landward) and northwesterly (seaward) winds were used to force the study area. The results showed that the morphology of the P2 profile was eroded greatly with net sediment volume changes of about -10 m3/m under the southeasterly wind, while the profile was almost unchanged with the effect of the northwesterly wind (Figure 10).
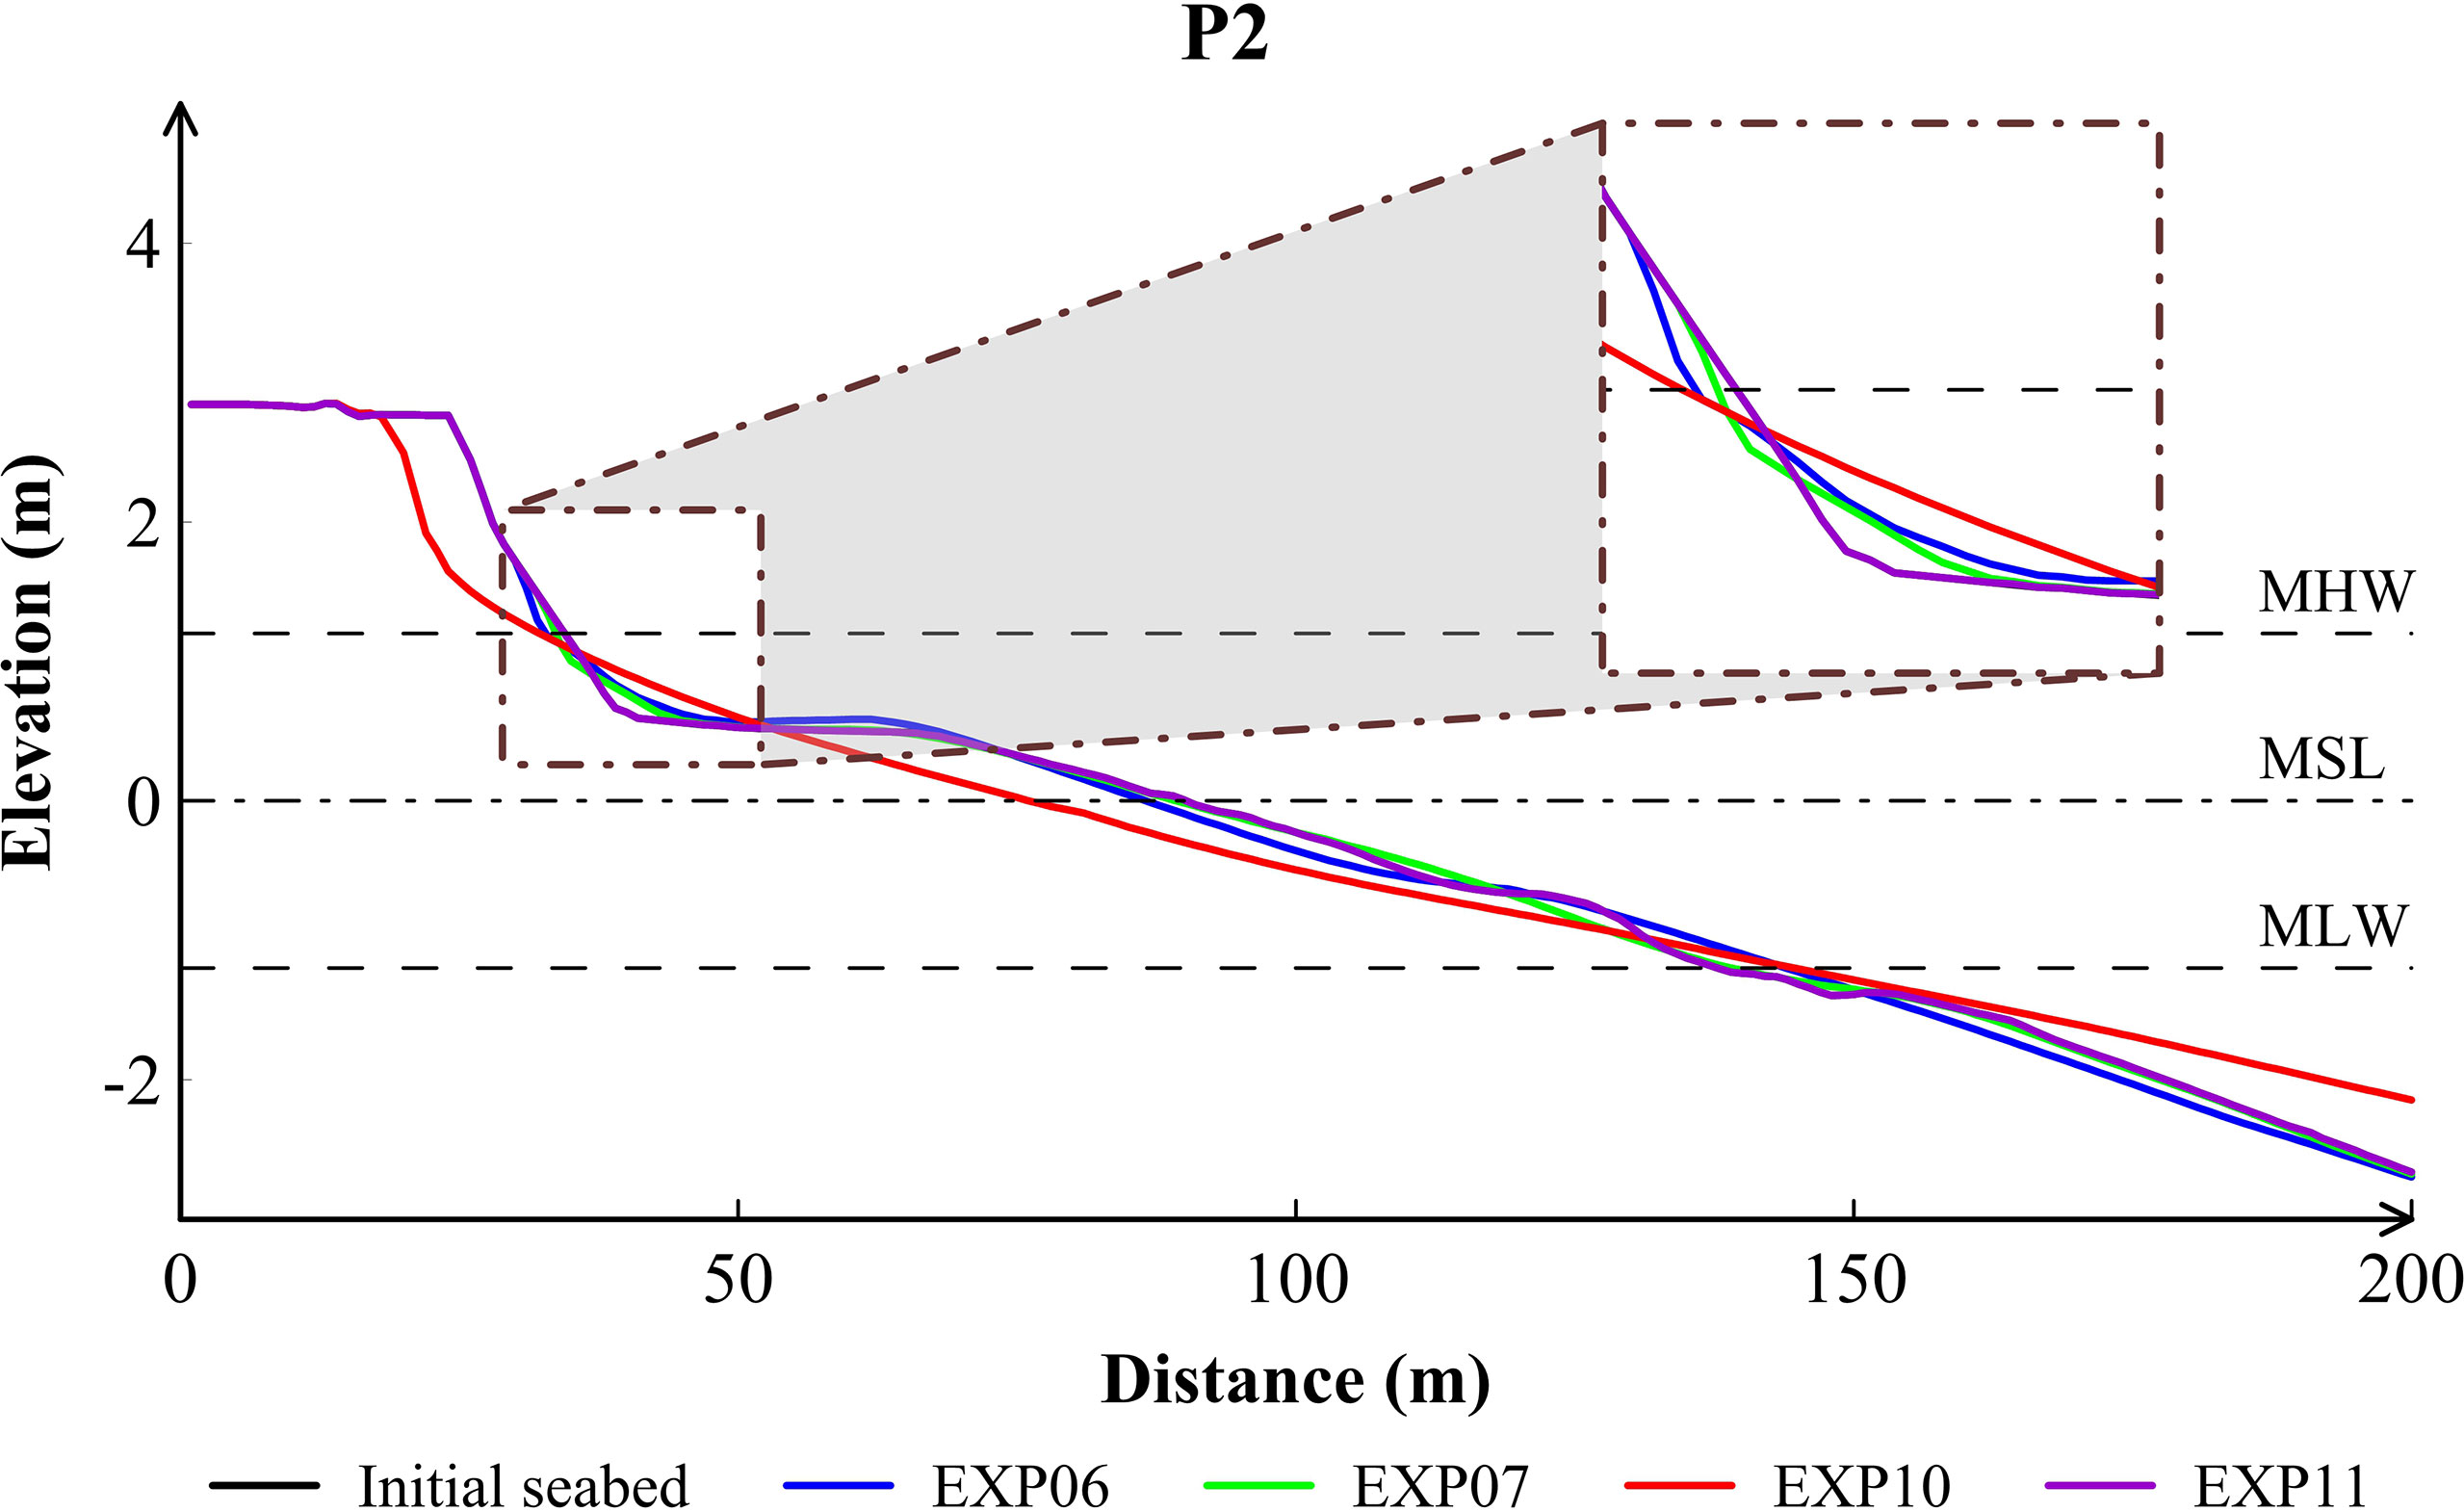
Figure 10 The elevation of P2 profile changed under different wind conditions compared with initial seabed.
Therefore, the relative position of a beach and TC track can lead to the opposite patterns of wind direction, which determined the different erosion-accretion results of a beach profile.
Consequently, the TCs with different tracks had significantly different effects on the same sandy beach. The strong landward winds induced by left-pass TCs could generate higher storm surges toward the shoreline, causing seawater to converge and further raise the high water level. Under the conditions of higher storm surge at the shoreline, the beach face would be subjected to more intense erosion and might undergo changes via the following mechanisms: deposition on the inner backshore (from berm to landside), erosion at the outer backshore (seaside) and foreshore. Furthermore, sandbars may be formed in the inshore area, reducing the slope of the entire beach and the response to the energy from strong wind and wave action (Figure 11A). In contrast, under the seaward wind induced by right-pass TCs generated the hydrodynamic intensity for the longshore and cross-shore transportation of sediments would be weak, and thus, the beach profiles did not change significantly (Figure 11B). The response pattern we proposed provided reasonable interpretations of the beach profiles changes induced by TCs with different tracks in the South China and the northern Gulf of Mexico, respectively (Cai et al., 2004; Otvos, 2004).
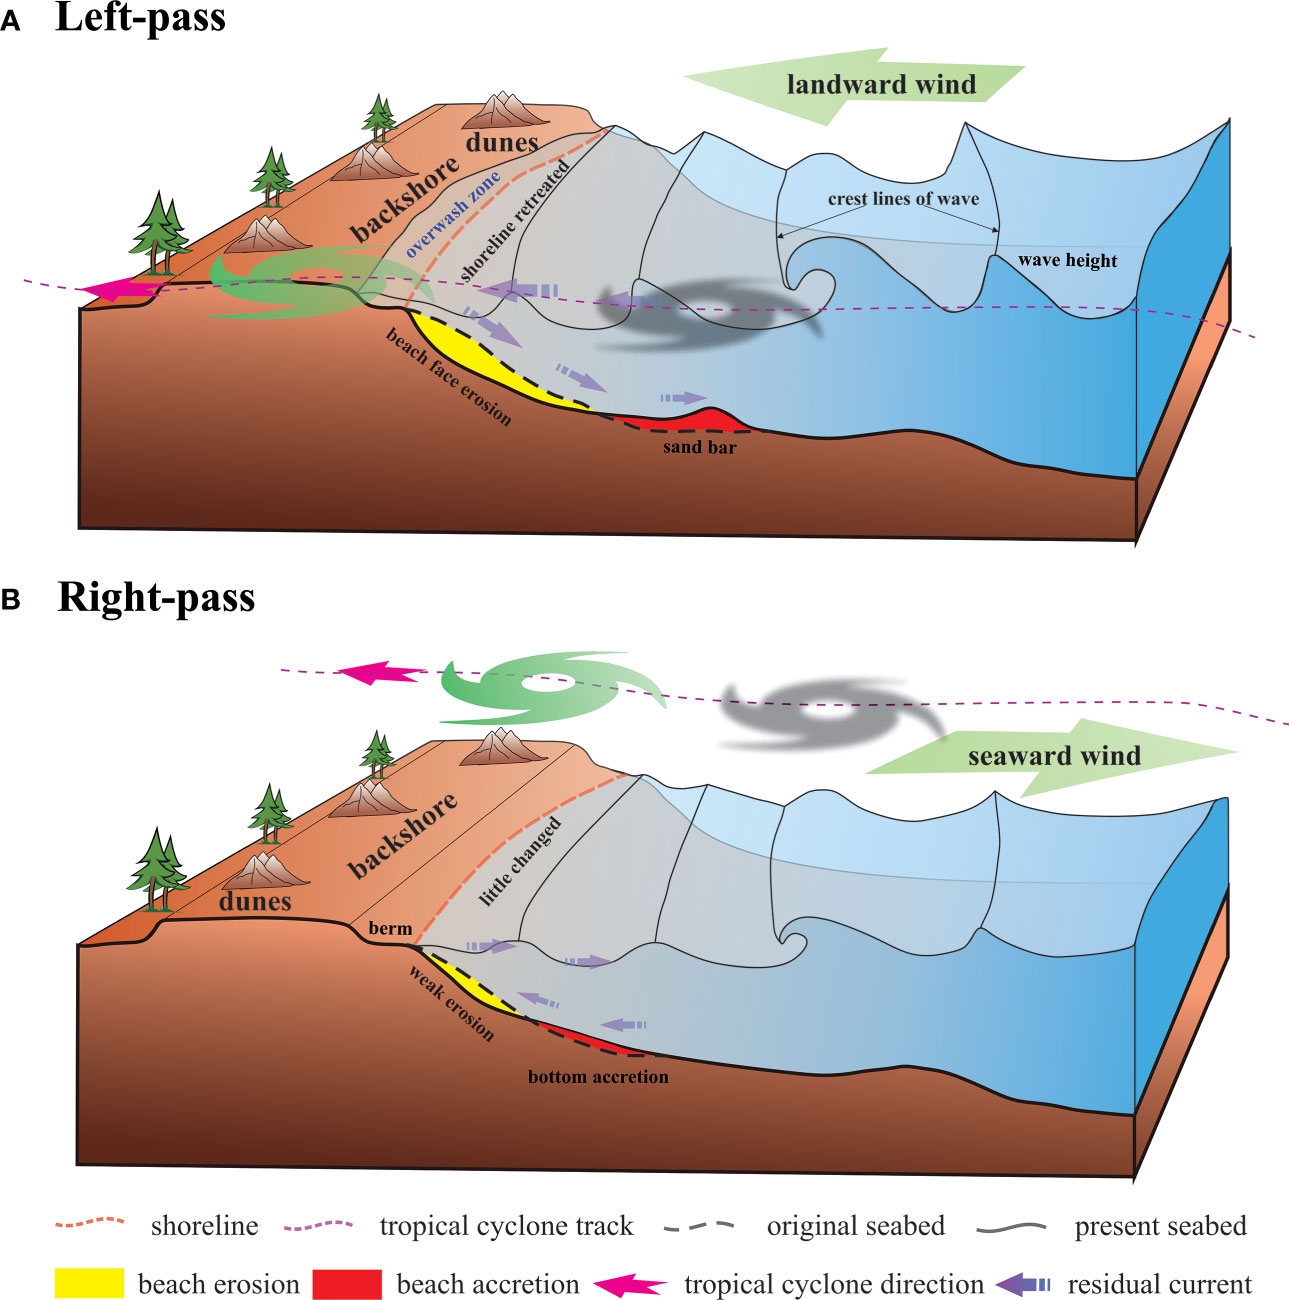
Figure 11 Schematic map for the morphologic response of the beach to left-pass (A) and right-pass (B) TCs, respectively.
TCs are strong synoptic events that can intensively impact sandy beaches. Beach profile observations of Haiyang Beach, China, were conducted before and after the TCs Lekima in August 2019 and Bavi in August 2020, respectively, which passed the study area with different tracks. To further examine the effect of TCs with different characteristics, eleven sensitive experiments based on FVCOM and four numerical simulations of beach profile change based on XBeach were carried out.
Resulted of Lekima which passed the left side of the study area, the main morphological responses of the beach exhibited erosion at the upper foreshore and minor deposition at the middle beach face. Subaqueous sandbars were formed in the nearshore zone. The overall sediment budget per width reached a maximum of −23.62 m3/m. However, the beach showed little change after Bavi, passed the right side of the beach. Moreover, the impact intensity of tropical cyclones was positively correlated with changes in the beach slope.
The significantly different and even opposite changes in beach profiles induced by the generated TCs with different characteristics caused by the storm surge change and the corresponding bottom cross-shore current. The landward wind direction induced by TCs in the northern hemisphere passing to the west of the study area can push seawater to a higher position of the beach and further induce a seaward bottom current. They can lead to strong erosion at the upper foreshore and deposition in subaqueous sandbars. In contrast, the seaward wind induced by the TCs that passed to the east of the study area can lead to minor erosion at the upper foreshore and accretion on the bottom of beach face, because of the negligible storm surge rise and landward bottom current. The geomorphological response of a sandy beach to TC is primarily dependent on the relative position of the beach and TC’s track. The increased intensity and translation velocity can only enhance the wind speed but not change the hydrodynamic pattern. In addition, the contribution of swell to the wave height was first proposed, which has less effect on the beach changes.
The original contributions presented in the study are included in the article/Supplementary Material. Further inquiries can be directed to the corresponding authors.
In this manuscript, YY was responsible for writing, YW and LQ are charge for reviewing and editing. NW and GL provided many constructive suggestions. ZT and YZ contributed a lot to process the observed data. All authors contributed to the article and approved the submitted version.
This study was jointly supported by the National Natural Science Foundation of China (grants 42076179, 41476030), the Shandong Key Research and Development Program (2019GHY112057), the Project of Taishan Scholar. Survey data acquisition were supported by the research on investigation and prevention of typical sandy coast erosion in Haiyang City (No. QX1532443), and the Laboratory for Marine Geology Open Fund, Flux of suspended particles of Shandong Peninsula (MGQNLM-KF201812). We also thank all the people who contributed to the field investigations.
The authors declare that the research was conducted in the absence of any commercial or financial relationships that could be construed as a potential conflict of interest.
All claims expressed in this article are solely those of the authors and do not necessarily represent those of their affiliated organizations, or those of the publisher, the editors and the reviewers. Any product that may be evaluated in this article, or claim that may be made by its manufacturer, is not guaranteed or endorsed by the publisher.
The Supplementary Material for this article can be found online at: https://www.frontiersin.org/articles/10.3389/fmars.2022.1010523/full#supplementary-material
Supplementary Figure 1 | Frequencies of wind direction and wind speed in Haiyang (A). Frequencies of wave direction averaged in ten years (1984-1994) (B), in summer (C) and autumn (D), respectively, at the Nanhuang Island station (location indicated in Figure 1B).
Supplementary Figure 2 | Model domain and mesh of the FVCOM model.
Supplementary Figure 3 | Comparisons between the observed and simulated water levels at Station T (A), significant wave heights (D) and peak wave periods (G) at Station W, respectively (red and black lines indicate the observed and simulated results, respectively). The middle (B, E, H) and right (C, F, I) columns show the comparisons of surface current velocities and directions at Stations C1, C2 and C3, respectively (observed results are shown in red dots and simulated results are indicated by black lines).
Supplementary Figure 4 | The DEM of study area in China Geodetic Coordinate System 2000 (CGCS 2000) and Gauss-Kruger projection, and the black line represents the P2 profile.
Supplementary Figure 5 | The generated different wind fields at Haiyang Beach when the wind velocity was at its maximum.
Arifin R. R., Kennedy A. B. (2011). The evolution of large scale crescentic bars on the northern gulf of Mexico coast. Mar. Geology 285, 46–58. doi: 10.1016/j.margeo.2011.04.003
Armaroli C., Grottoli E., Harley M. D., Ciavola P. (2013). Beach morphodynamics and types of foredune erosion generated by storms along the Emilia-romagna coastline, Italy. Geomorphology 199, 22–35. doi: 10.1016/j.geomorph.2013.04.034
Atkinson G. D., Holliday C. R. (1977). Tropical cyclone minimum Sea level Pressure_Maximum sustained wind relationship for the Western north pacific. Monthly Weather Rev. 105 (4), 421–427. doi: 10.1175/1520-0493(1977)105<0421:TCMSLP>2.0.CO;2
Bao M., Guan W. B., Yang Y., Cao Z. Y., Chen Q. (2015). Drifting trajectories of green algae in the western yellow Sea during the spring and summer of 2012. Estuar. Coast. Shelf Sci. 163, 9–16. doi: 10.1016/j.ecss.2015.02.009
Basco D. R. (1996). Erosion of beaches on st. martin island during hurricanes LUIS and MARILYN, September 1995 (Lessons for communities with beach-driven tourist economies). Shore Beach 64, 15–20.
Booij N., Ris R. C., Holthuijsen L. H. (1999). A third-generation wave model for coastal regions - 1. model description and validation. J. Geophysical Research-Oceans 104, 7649–7666. doi: 10.1029/98JC02622
Bugajny N., Furmańczyk K., Dudzińska-Nowak J., Paplińska-Swerpel B. (2013). Modelling morphological changes of beach and dune induced by storm on the southern Baltic coast using XBeach (case study: Dziwnow spit). J. Coast. Res. 65, 672–677. doi: 10.2112/SI65-114.1
Cai F., Su X., Xia D. (2004). Study on the difference between storm effects of beaches on two sides of the tropical cyclone track-taking the response of beaches to no. 0307 typhoon imbudo as an example. Adv. Mar. Sci. 22, 436–445.
Chen C. S., Beardsley R. C., Cowles G., Qi J. H., Lai Z. Q., Gao G. P., et al. (2013). “An unstructured grid, finite-volume community ocean model–FVCOM user manual,” in Technical report SMAST/UMASSD-13-0701. 4th ed. (Marine Ecosystem Dynamics Modeling Laboratory)
Chen C. S., Liu H. D., Beardsley R. C. (2003). An unstructured grid, finite-volume, three-dimensional, primitive equations ocean model: Application to coastal ocean and estuaries. J. Atmospheric Oceanic Technol. 20, 159–186. doi: 10.1175/1520-0426(2003)020<0159:AUGFVT>2.0.CO;2
Chen C. S., Qi J. H., Li C. Y., Beardsley R. C., Lin H. C., Walker R., et al. (2008). Complexity of the flooding/drying process in an estuarine tidal-creek salt-marsh system: An application of FVCOM. J. Geophysical Research-Oceans 113 (C7). doi: 10.1029/2007JC004328
Chen H., Yang L., Fu Y., Qiao S., Shi H. (2022). Influence of typhoon bavi on the chudao beach erosion in weihai. Trans. Oceanology Limnology 44, 82–88. doi: 10.13984/j.cnki.cn37-1141.2022.04.011
Claudino-Sales V., Wang P., Horwitz M. H. (2008). Factors controlling the survival of coastal dunes during multiple hurricane impacts in 2004 and 2005: Santa Rosa barrier island, Florida. Geomorphology 95, 295–315. doi: 10.1016/j.geomorph.2007.06.004
Delft (2018)XBeach user manual-version 1.23.5527. Available at: http://xbeach.readthedocs.io/en/latest/user_manual.html.
Ding D., Yang J., Li G., Dada O. A., Gong L., Wang N., et al. (2015). A geomorphological response of beaches to typhoon meari in the eastern Shandong peninsula in China. Acta Oceanologica Sin. 34, 126–135. doi: 10.1007/s13131-015-0644-5
Fritz H. M., Blount C., Sokoloski R., Singleton J., Fuggle A., McAdoo B. G., et al. (2007). Hurricane Katrina storm surge distribution and field observations on the Mississippi barrier islands. Estuar. Coast. Shelf Sci. 74, 12–20. doi: 10.1016/j.ecss.2007.03.015
Gao W., Li P., Gao S., Tian Z., Li B., Liu J., et al. (2020). Response process of the haiyang beach evolution to typhoon lekima in Shandong province. Haiyang Xuebao 42 (11), 88–99. (in Chinese). doi: 10.3969/j.issn.0253−4193.2020.11.009
Graham H. E., Nunn D. E. (1959). “Meteorological conditions pertinent to standard project hurricane,” in Atlantic And gulf coasts of united states, national hurricane research project (Washington, DC: Weather Bureau, US Department of Commerce).
Harper B. A., Holland G. J. (1999). “An updated parametric model of the tropical cyclone,” in Proc. 23rd conf. hurricanes and tropical meteorology, vol. 1999. (Dallas, Texas: Proceedings of the 23rd Conference of Hurricane and Tropical Meteorology), pp. 893–896.
Harter C., Figlus J. (2017). Numerical modeling of the morphodynamic response of a low-lying barrier island beach and foredune system inundated during hurricane Ike using XBeach and CSHORE. Coast. Eng. 120, 64–74. doi: 10.1016/j.coastaleng.2016.11.005
Houser C., Hapke C., Hamilton S. (2008). Controls on coastal dune morphology, shoreline erosion and barrier island response to extreme storms. Geomorphology 100, 223–240. doi: 10.1016/j.geomorph.2007.12.007
Luijendijk A., Hagenaars G., Ranasinghe R., Baart F., Donchyts G., Aarninkhof S. (2018). The state of the world's beaches. Sci. Rep. vol 8 6641, 1. doi: 10.1038/s41598-018-24630-6
Mao M. H., Xia M. (2018). Wave-current dynamics and interactions near the two inlets of a shallow lagoon-inlet-coastal ocean system under hurricane conditions. Ocean Model. 129, 124–144. doi: 10.1016/j.ocemod.2018.08.002
Martzikos N. T., Prinos P. E., Memos C. D., Tsoukala V. K. (2021). Key research issues of coastal storm analysis. Ocean Coast. Manage. 199, 105389. doi: 10.1016/j.ocecoaman.2020.105389=
McCarroll R. J., Masselink G., Valiente N. G., King E. V., Scott T., Stokes C., et al. (2021). An XBeach derived parametric expression for headland bypassing. Coast. Eng. 165, 103860. doi: 10.1016/j.coastaleng.2021.103860
Mellor G. L., Yamada T. (1982). Development of a turbulence closure model for geophysical fluid problems. Rev. Geophysics 20, 851–875. doi: 10.1029/RG020i004p00851
Morton R. A. (2002). Factors controlling storm impacts on coastal barriers and beaches - a preliminary basis for real-time forecasting (vol 18, pg 486, 2002). J. Coast. Res. 18, 838–838. Available at: https://www.jstor.org/stable/4299096
Otvos E. G. (2004). Beach aggradation following hurricane landfall: Impact comparisons from two contrasting hurricanes, northern gulf of Mexico. J. Coast. Res. 201, 326–339. doi: 10.2112/1551-5036(2004)20[326:BAFHLI]2.0.CO;2
Pardo-Pascual J. E., Almonacid-Caballer J., Ruiz L. A., Palomar-Vázquez J., Rodrigo-Alemany R. (2014). Evaluation of storm impact on sandy beaches of the gulf of Valencia using landsat imagery series. Geomorphology 214, 388–401. doi: 10.1016/j.geomorph.2014.02.020
Qi H., Cai F., Lei G., Cao H., Shi F. (2010). The response of three main beach types to tropical storms in south China. Mar. Geology 275, 244–254. doi: 10.1016/j.margeo.2010.06.005
Ren Z., Hu R., Zhang L., Wang N., Zhu L. (2016). Evolution of the sandy beach in haiyang. Mar. Geology Front. 32 (011), 18–25. (in Chinese). doi: 10.16028/j.1009-2722.2016.11003
Roelvink D., Reniers A., van Dongeren A., de Vries J. V., McCall R., Lescinski J. (2009). Modelling storm impacts on beaches, dunes and barrier islands. Coast. Eng. 56, 1133–1152. doi: 10.1016/j.coastaleng.2009.08.006
Sallenger A. H. (2000). Storm impact scale for barrier islands. J. Coast. Res. 16, 890–895. Available at: https://www.jstor.org/stable/4300099
Sallenger A. H., Stockdon H. F., Fauver L., Hansen M., Thompson D., Wright C. W., et al. (2006). Hurricanes 2004: An overview of their characteristics and coastal change. Estuaries Coasts 29, 880–888. doi: 10.1007/BF02798647
Shariful F., Sedrati M., Ariffin E. H., Shubri S. M., Akhir M. F. (2020). Impact of 2019 tropical storm (Pabuk) on beach morphology, terengganu coast (Malaysia). J. Coast. Res. 95, 346–350. doi: 10.2112/SI95-067.1
Sherman D. J., Hales B. U., Potts M. K., Ellis J. T., Liu H., Houser C. (2013). Impacts of hurricane Ike on the beaches of the Bolivar peninsula, TX, USA. Geomorphology 199, 62–81. doi: 10.1016/j.geomorph.2013.06.011
Smagorinsky J. (1963). General circulation experiments with the primitive equations. part I: the basic experiment. Monthly Weather Rev. 91, 99–164. doi: 10.1175/1520-0493(1963)091<0099:GCEWTP>2.3.CO;2
Sobey R. J., Harper B. A., Mitchell G. M. (1980). Numerical modelling of tropical cyclone storm surge. Coast. Eng. Proc. 17, 44. doi: 10.1061/9780872622647.045
SWAN Team. (2006). SWAN Cycle III Version 40.51 Technical Documentation. Delft University of Technology, Faculty of Civil Engineering and Geosciences, Environmental Fluid Mechanics Section, P.O. Box 5048, 2600 GA Delft, The Netherlands.
van Verseveld H. C. W., van Dongeren A. R., Plant N. G., Jäger W. S., den Heijer C. (2015). Modelling multi-hazard hurricane damages on an urbanized coast with a Bayesian network approach. Coast. Eng. 103, 1–14. doi: 10.1016/j.coastaleng.2015.05.006
Walsh K. J. E., McBride J. L., Klotzbach P. J., Balachandran S., Camargo S. J., Holland G., et al. (2015). Tropical cyclones and climate change. WIREs Climate Change 7, 65–89. doi: 10.1002/wcc.371
Wang L., Fu Y., Yang L., Shi H., You Z., Feng X. (2020). Effects of typhoon lekima on the evolution of chudao beach in weihai. Adv. Mar. Sci. 39, 608–617. (in Chinese). doi: 10.3969/j.issn.1671-6647.2021.04.012
Yang J., Gong L., Li G., Wang N., Zhang B. (2012). Morphodynamic feature on the beaches in weihai, Shandong province. Periodical Ocean Univ. China 42 (12), 107–114. doi: 10.16441/j.cnki.hdxb.2012.12.016
Young I. R., Sobey R. J. (1981). The numerical prediction of tropical cyclone wind-waves (Australia: Department of Civil and Systems Engineering, James Cook University of North Queensland, Townville, Research Bulletin No. CS20).
Zhang X., Tan X., Hu R., Zhu L., Wu C., Yang Z. (2021). Using a transect-focused approach to interpret satellite images and analyze shoreline evolution in haiyang beach, China. Mar. Geology 438, 106526. doi: 10.1016/j.margeo.2021.106526
Zhang Z., Wu J., Zhu L., Hu R., Sun Y. (2012). Impacts of the construction of the east wing of haiyang harbor of the erosion and deposition regime in the sandy coast. Mar. Geology Front. 28 (8), 49–55. (in Chinese). doi: 10.16028/j.1009-2722.2012.08.011
Keywords: tropical cyclones, sandy beach, FVCOM, TCs’ track, hydrodynamic change
Citation: Yu Y, Wang Y, Qiao L, Wang N, Li G, Tian Z and Zhong Y (2022) Geomorphological response of sandy beach to tropical cyclones with different characteristics. Front. Mar. Sci. 9:1010523. doi: 10.3389/fmars.2022.1010523
Received: 03 August 2022; Accepted: 10 October 2022;
Published: 21 October 2022.
Edited by:
Ya Ping Wang, East China Normal University, ChinaReviewed by:
Jun Cheng, Kean University, United StatesCopyright © 2022 Yu, Wang, Qiao, Wang, Li, Tian and Zhong. This is an open-access article distributed under the terms of the Creative Commons Attribution License (CC BY). The use, distribution or reproduction in other forums is permitted, provided the original author(s) and the copyright owner(s) are credited and that the original publication in this journal is cited, in accordance with accepted academic practice. No use, distribution or reproduction is permitted which does not comply with these terms.
*Correspondence: Yongzhi Wang, d2FuZ3lvbmd6aGlAZmlvLm9yZy5jbg==; Lulu Qiao, bHVsdXFAb3VjLmVkdS5jbg==
Disclaimer: All claims expressed in this article are solely those of the authors and do not necessarily represent those of their affiliated organizations, or those of the publisher, the editors and the reviewers. Any product that may be evaluated in this article or claim that may be made by its manufacturer is not guaranteed or endorsed by the publisher.
Research integrity at Frontiers
Learn more about the work of our research integrity team to safeguard the quality of each article we publish.