 Jonathan P. Williams
 Chelsea M. Williams
 Daniel J. Pondella II
 Zoe M. Scholz
95% of researchers rate our articles as excellent or good
Learn more about the work of our research integrity team to safeguard the quality of each article we publish.
Find out more
ORIGINAL RESEARCH article
Front. Mar. Sci. , 29 September 2022
Sec. Marine Ecosystem Ecology
Volume 9 - 2022 | https://doi.org/10.3389/fmars.2022.1010303
This article is part of the Research Topic Seafloor Heterogeneity: Artificial Structures and Marine Ecosystem Dynamics - Recent Advances View all 16 articles
Palos Verdes Reef (PVR) is an artificial reef designed to restore rocky-reef associated marine species by directly restoring rocky-reef habitat that has been impacted by scour, sedimentation, and burial in the shallow subtidal portion of the Palos Verdes Peninsula in Los Angeles County, California, USA. The restoration reef provides high-quality habitat that is contiguous with the natural reef and allows for rapid succession. This project is a unique endeavor as restoring lost habitat in situ and has not been attempted in a temperate rocky reef and kelp forest community. While the primary design criteria for PVR is fish production in an area where already-limited hard substrate had been lost, it is also designed to be resilient to ongoing sedimentation and turbidity challenges on the peninsula. Following over a decade of design, planning, outreach, site surveying, and permitting, PVR was built in 2020 as 18 discrete modules using 52,729 tons of quarry rock placed approximately 8–80 m from existing, unburied rocky-reef habitat. There was no significant accumulation or scouring of sediment due to the placement of the reef and temperature data shows that internal tides regularly inundate the reef with cool, nutrient rich water. Rocky-reef associated taxa rapidly recruited to the restoration site, with visible changes occurring within just a few months post-construction. PVR modules showed rapid, significantly positive responses in fish density, fish biomass, kelp density, and biotic benthic cover less than 18 months after reef placement with a general pattern of succession in giant kelp growth from nearshore to offshore resulting in an established, thick canopy, in the nearshore, shallow modules. The newly available, high-quality habitat was quickly colonized and already shows late successional patterns with respect to fish and benthic communities. This restoration reef will produce large amounts of biomass over the long-term, though future surveys of multiple restored, adjacent, and reference sites will determine if high biomass at PVR is a result of new secondary production or attraction from nearby reefs.
The shallow subtidal portion of the Palos Verdes Peninsula in Los Angeles County, California, USA, is a nearly unbroken stretch of more than 20 km of rocky reef habitat, one of the largest continuous segments of rocky reef in the Southern California Bight. Rocky reefs and associated giant kelp (Macrocystis pyrifera) forests form three-dimensional habitats that support nearly one-quarter of California’s marine organisms (Graham, 2004). This ecosystem is economically and ecologically valuable but is adjacent to a highly populated and altered coastline and subject to multiple ecological stressors including pollution, overharvesting (Pondella, 2009), and the formation of persistent urchin barrens (Williams et al., 2021). In addition, this geologically active peninsula is also the location of several recent anthropogenically induced (or reactivated) landslides (Kayen et al., 2002). Though issues of pollution, overharvesting, and urchin barrens have all been addressed to some degree and landslides have slowed appreciably in recent years due to major infrastructure improvements, there is continued turbidity and scour associated with previously deposited sediment. Furthermore, the 18th hole of what is now Trump National Golf Club slid into the ocean and onto the rocky reefs below in 1999, and long-term reef burial has been noted in all surveys since (e.g., Pondella et al., 2015; Pondella et al., 2018). Much of the historic low-lying reef continues to be impacted by chronic sedimentation due to reef burial, scour, and associated turbidity, significantly decreasing the amount of habitable rocky reef habitat in the area.
The purpose of the Palos Verdes Reef Restoration Project is to restore rocky-reef associated marine species by directly restoring rocky-reef habitats that were lost due to sedimentation. Developing a subtidal rocky reef restoration project of this type is a unique endeavor, as restoring lost habitat in situ has not been attempted in a temperate rocky reef and kelp forest community. Artificial structures have been placed on the seafloor throughout the Southern California Bight with various goals and varying degrees of success, often with limited monitoring and capacity for experimental analysis. Artificial reefs were built to enhance fishing (Lewis and McKee, 1989) and scuba opportunities (Ilieva et al., 2019), mitigate for lost kelp bed habitat (Reed et al., 2006), and enhance habitat in estuaries (Pondella et al., 2006). Additionally, infrastructure needs often incidentally create habitat (‘secondary reefs’), including breakwaters and jetties (Stephens et al., 1994) and oil and gas platforms (Claisse et al., 2014).
Our goal was to develop a restoration plan that maximizes the biological benefits to this ecosystem while balancing economic, physical, and engineering constraints. As a heavily utilized region for commercial and recreational harvest (Pondella, 2009), natural rocky reefs in the area are almost certainly not at their carrying capacities for any native fish species, and low-quality habitat is less conducive to fish production (Zellmer et al., 2019). Therefore, a key aspect of this reef design is not to just provide more habitat for rocky-reef associated fishes, but to provide better habitat (Bohnsack, 1989). For over a decade, we examined the potential efficacy of fishery production enhancement reefs in this region by establishing an intensive biological and physical sampling program throughout subtidal areas of Palos Verdes Peninsula (Pondella et al., 2018). We developed a secondary production model that specifically analyzes the production of fish biomass to evaluate reef performance (Pondella et al., 2019) and utilizes stacked-species distribution modeling to predict an optimal site for restoration (Zellmer et al., 2019). Notable among all survey locations was KOU Rock, a relatively high relief (~5 m) area of reef within the sediment impacted area that consistently had the highest fish biomass density anywhere on the peninsula, including non-sediment impacted areas and reefs inside marine protected areas (Pondella et al., 2018; Figure 1). The high structural relief prevents sediment accumulation, scour, and subsequent reef burial while allowing for high biotic benthic cover, and this natural feature ultimately served as the example for the design of the quarry rock reef modules that together form the restoration reef.
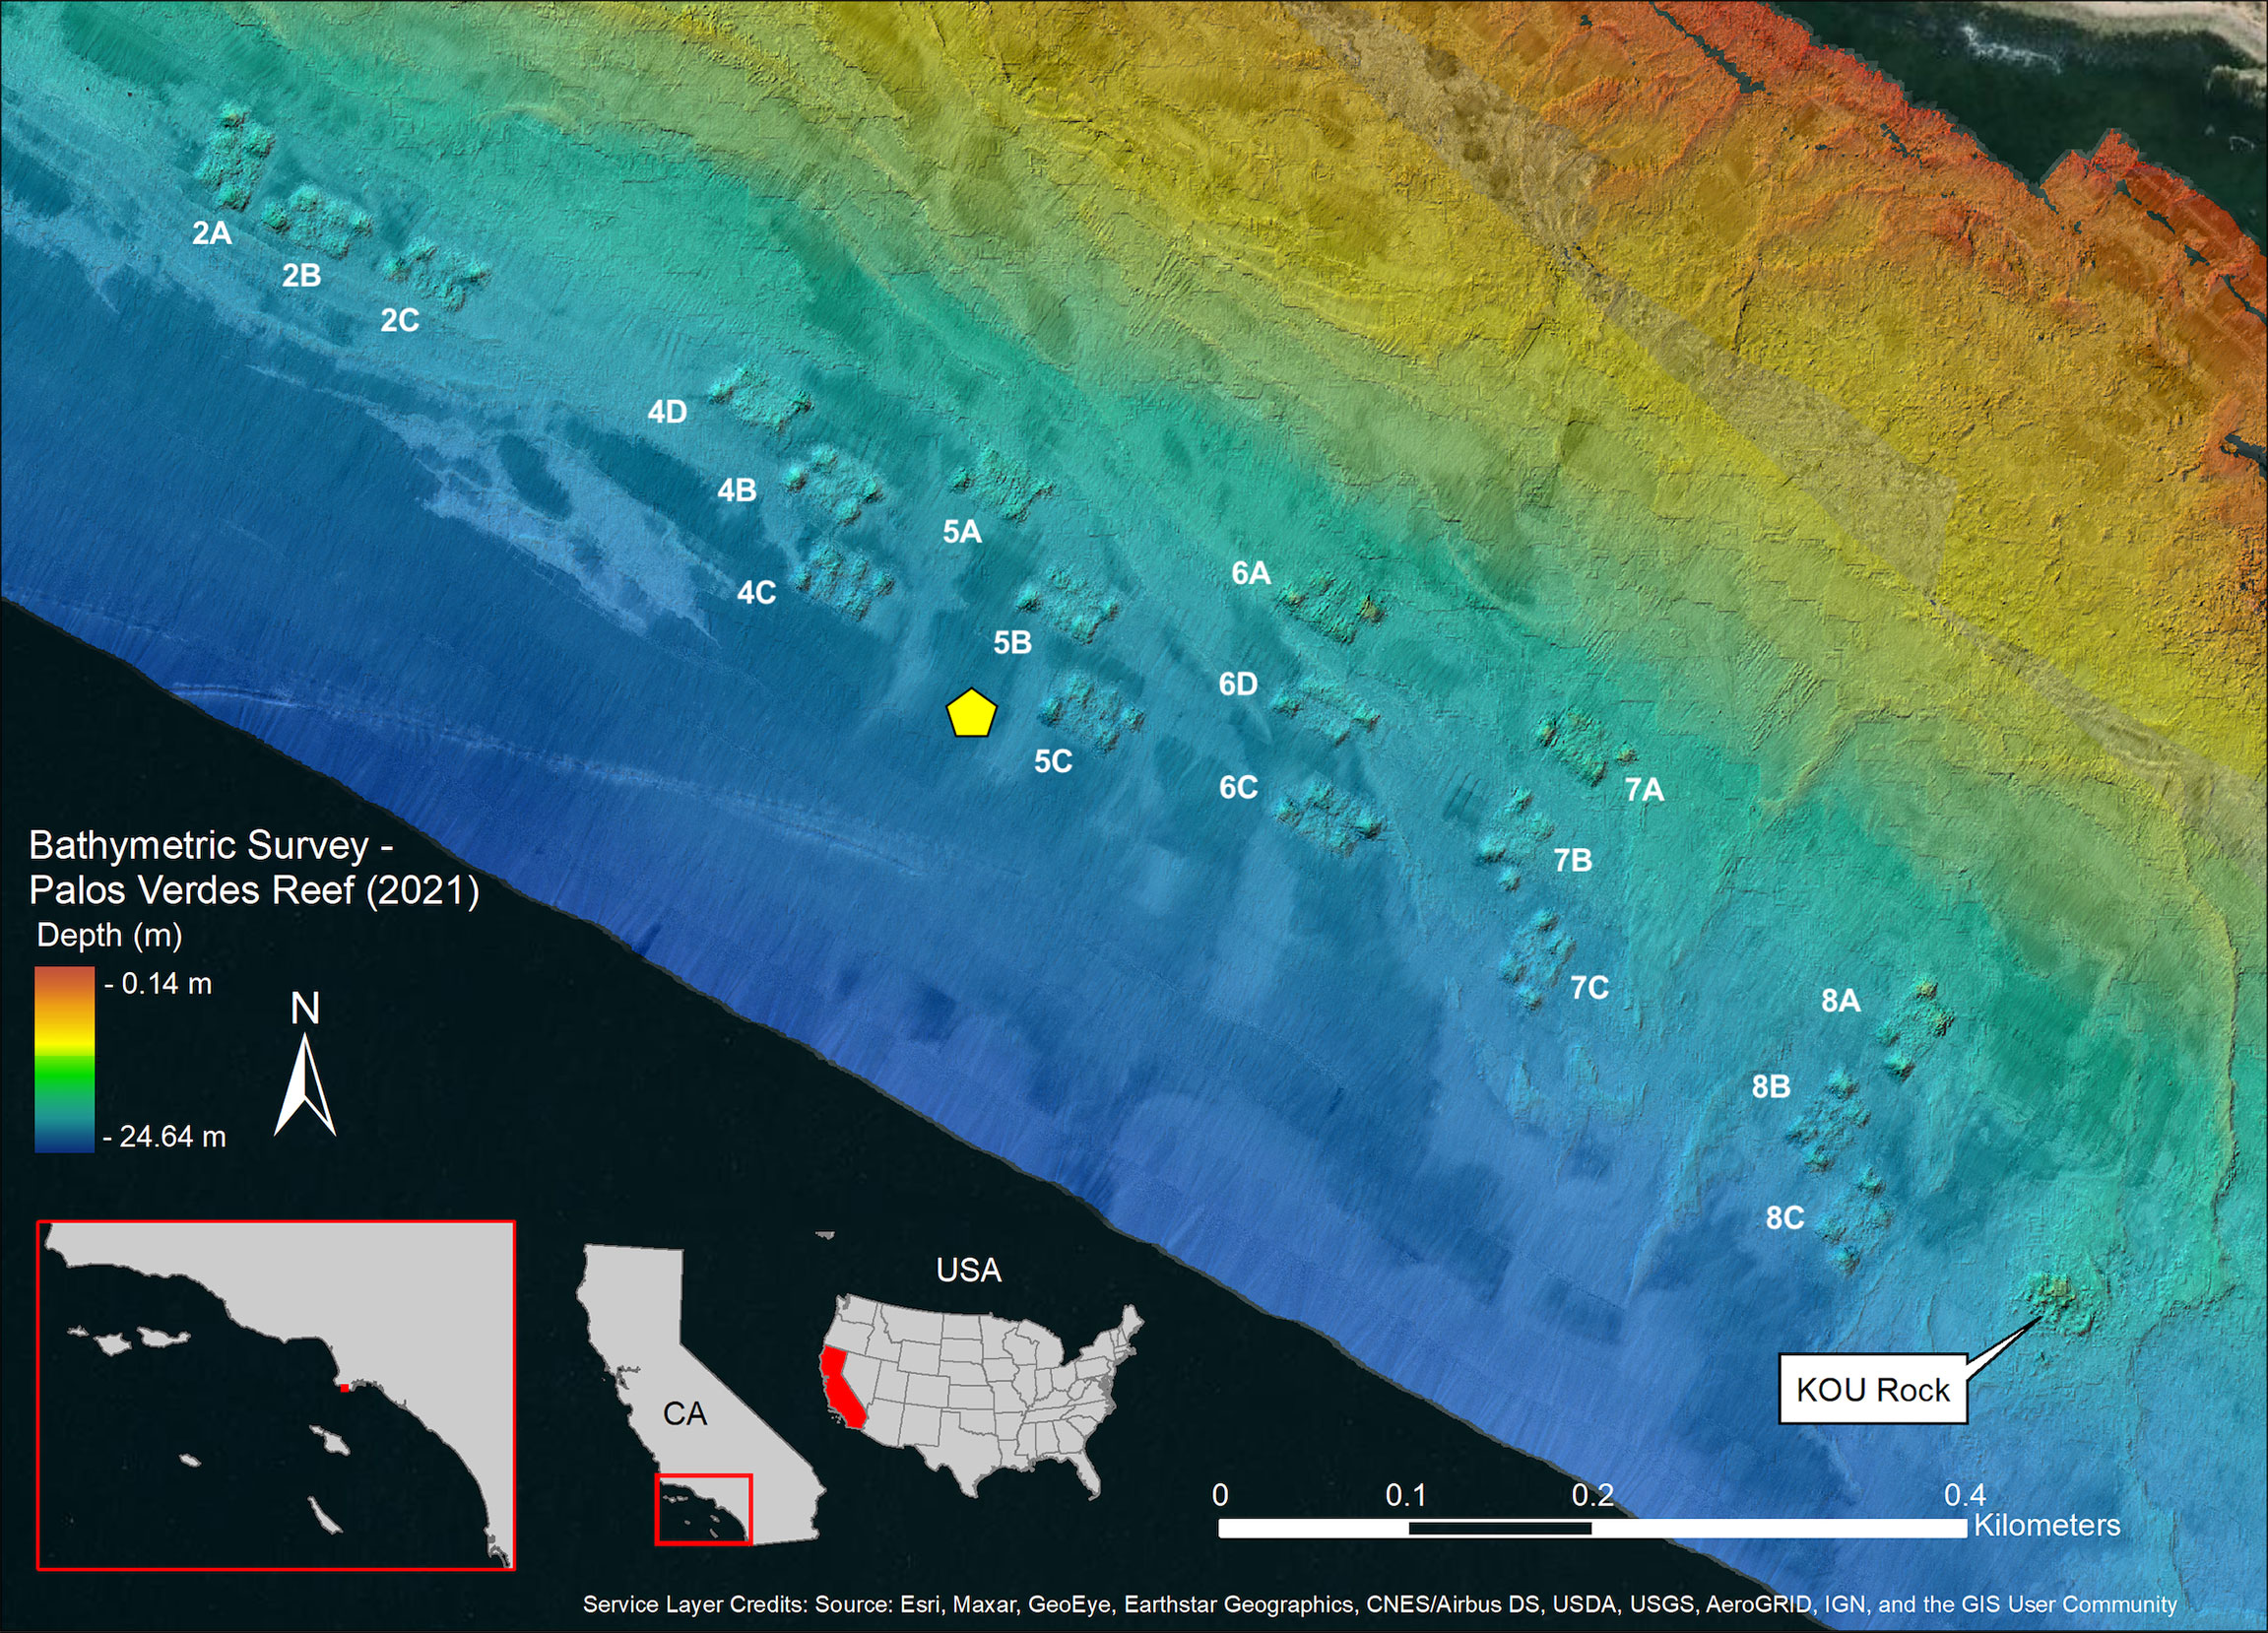
Figure 1 Finalized design of Palos Verdes Restoration Reef including bathymetry shaded relief and processed backscatter. Backscatter data are shown as a grayscale overlay where lighter areas indicate soft substrate and darker areas indicate either hard substrate or lightly buried hard substrate. Yellow pentagon indicates the position of the Spotter Buoy.
Palos Verdes Reef (PVR) was constructed in 2020 using 52,729 tons of quarry rock and is unique in terms of both design and location. It was designed as a series of high-relief modules to provide essential habitat for fishes and substrate for giant kelp, other marine algae, and marine invertebrates to become attached to. The intention was to create a productive rocky-reef ecosystem in an area with limited hard substrate that had previously been lost. PVR was built on top of previously existing, but recently buried (< 1 m burial depth) rocky reef and is directly adjacent to existing, exposed, natural rocky reef and kelp forests (8–80 m) and the edge of the continental shelf (< 2 km). This manuscript serves as an ‘as-built’ description of the newly constructed restoration reef, as well as a summary of the rapid and notable responses in the fish and benthic communities in the first 12-18 months post-construction.
PVR was designed with submodules (1-4 m in height) staggered within modules, with the higher-relief (3-4 m) submodules placed at the ends of each module to buffer any potential sedimentation of the 1-m relief submodules in the middle of each module (Figure 2). Modules were placed at 16.7–21.1 m seafloor depth (MLLW), maintain connectivity with existing natural reefs, were oriented similarly to natural features, and were placed on a maximum of 1 m sediment depth to limit long-term burial/sinking (Figure 1). Within each group of modules, or block, we incorporated 10-20 m sand channels between modules to permit space for the movement of sediment.
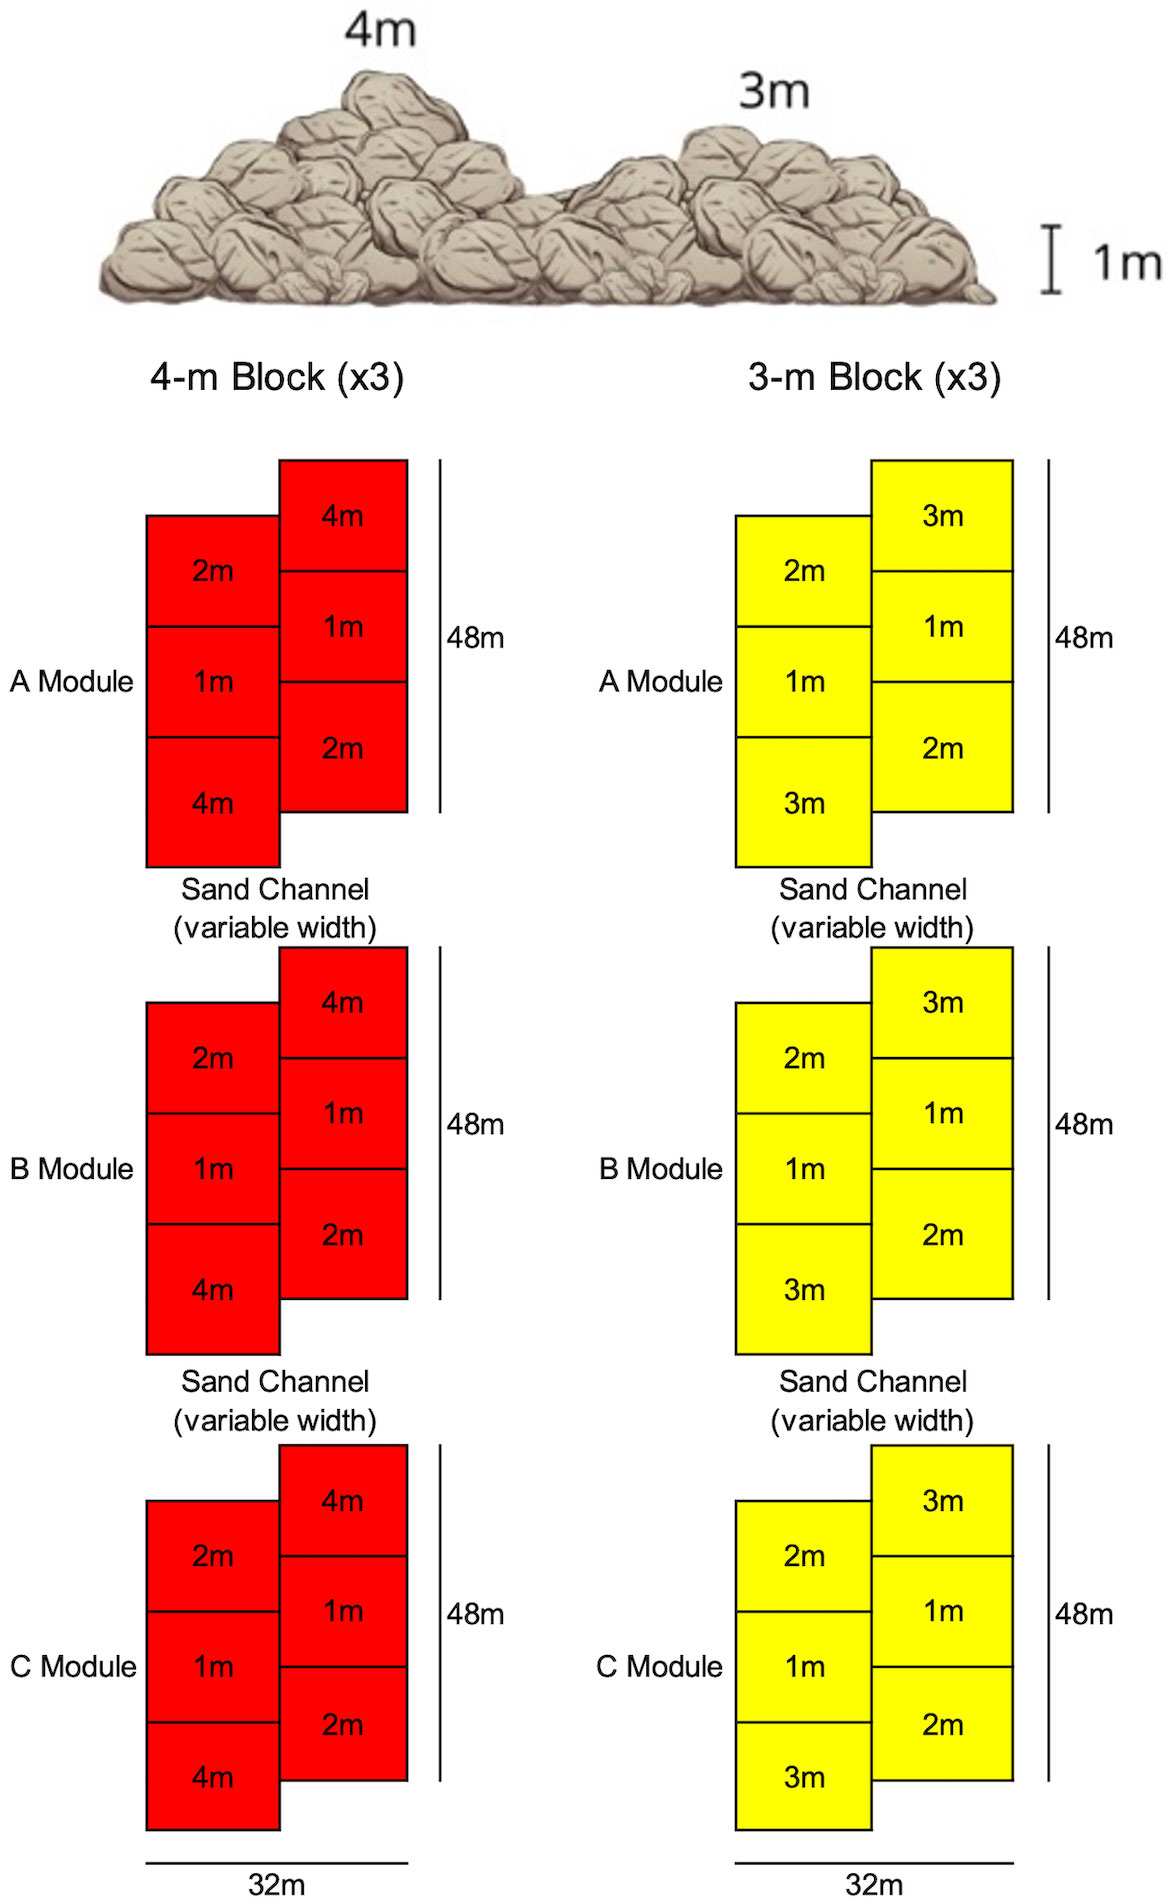
Figure 2 Basic schematic diagram of the restoration reef blocks.
Quarry mining, rock transportation, and reef construction were all performed by Connolly-Pacific Co. Quarry rock boulders of a variety of sizes (estimated mean = 0.36 MT, range ≈ 0.04–1.20 MT; Figure 3) were mined from Empire Quarry on Santa Catalina Island, California, and passed independent testing for specific gravity, absorption, and abrasion resistance. The reef was constructed in two phases to accommodate quarry rock demand, concurrent projects, and complications from the COVID-19 pandemic. The first phase was 8 May 2020 – 4 June 2020 and the second phase was 29 August 2020 – 23 September 2020 (Table 1). The quarry rock was transported across Catalina Channel to the restoration site on a flat rock barge towed by a tugboat where the rock barge was secured to a derrick barge with wire ropes. A front-end track loader placed boulders over the edge of the rock barge along engineered gridlines, and when each gridline was completed, the derrick barge was re-positioned so that the edge of the rock barge was aligned along the next gridline, and the process was repeated until the module was completed. Periodically during rock placement, handheld leadline soundings were taken to verify compliance with the required placement specifications. To verify the rock quantity placed, the net weight of the material was calculated using barge displacement measures and tables. Upon completion of a module, the derrick barge moved anchors and positioned itself and the rock barge on the next module.
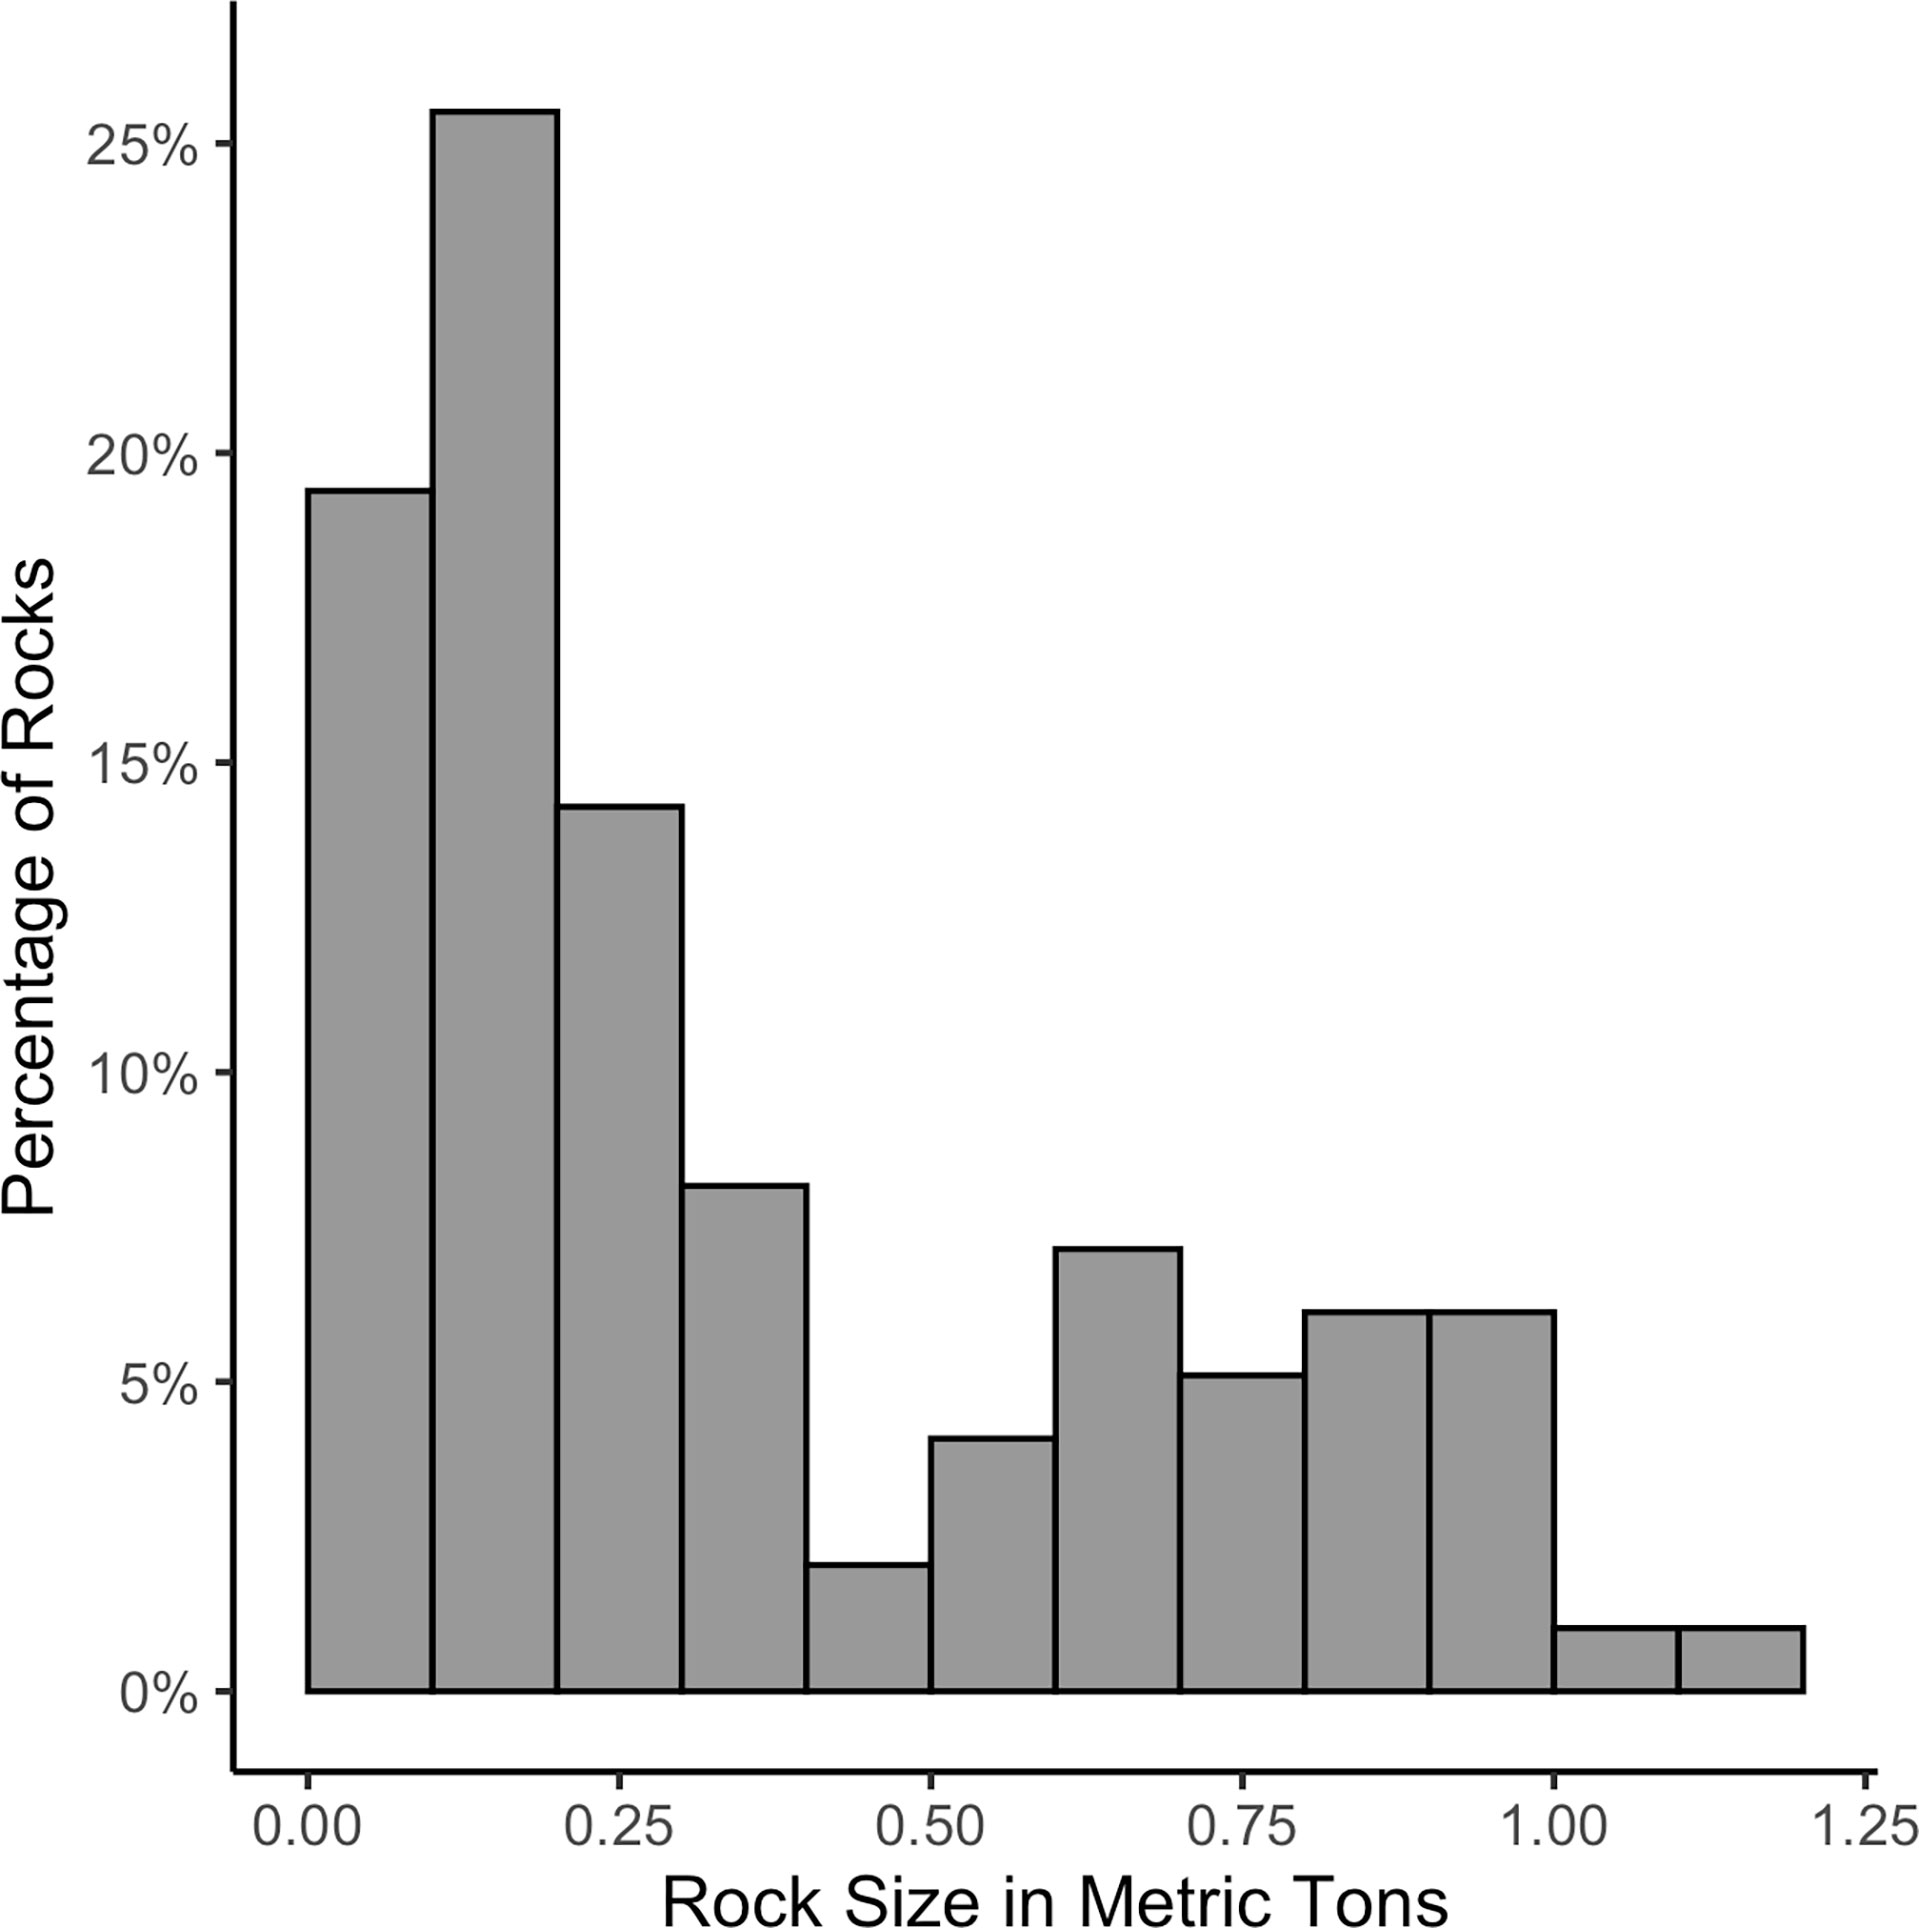
Figure 3 Results of rock gradation testing (n=98) from Empire Quarry.

Table 1 Start and end of construction dates for each Palos Verdes Reef module.
High-resolution multibeam bathymetry data were collected from Bunker Point to KOU Rock, Palos Verdes, prior to deployment in October 2019, and again after the reefs were constructed in May 2020, August/September 2020, and December 2021 using an Edgetech 6205 MultiPhase EchoSounder pole mounted to a 6.5–7.5-m research vessels. Each survey consisted of parallel transects, spaced 30 m apart to assure 100% coverage of the reef area, with most areas having 200% coverage. This coverage helped to avoid false soundings and increased resolution. Sound velocity profiles were collected at the start and end of each survey day using a SeaBird SBE 19plus V2 SeaCAT profiler CTD and were applied to the data by matching the cast closest in time to the survey line. Boat position was obtained by an SBG Ekinox survey grade dual-frequency global navigation satellite system (GNSS) receiver with real-time kinematic and dynamic positioning provided by the California Real Time Network, a multipurpose statewide GNSS network. This system is capable of 8-cm resolution with a depth accuracy of 2 cm and a horizontal position accuracy of less than 3 cm. Data were collected using SonarWiz 7 and EdgeTech’s Discover software. All multibeam data were cleaned and processed in SonarWiz 7 software and ArcGIS ArcMap 10.8 and used to produce annual bathymetric shaded relief images and differential depth comparisons over time.
On 2 June 2021, we deployed a Sofar Ocean (https://www.sofarocean.com/) Spotter Buoy and Smart Mooring approximately 50 m west of Module 5C (33.72054˚ N, 118.34584˚ W, Figure 1). The buoy was purchased and donated by Aqualink (https://www.aqualink.org/) and registered as a Private Aid to Navigation with the United States Coast Guard and Department of Homeland Security. This buoy system is entirely solar powered and monitors the geographic position of the buoy, the sea temperature at both 1 m and 18 m below the surface (near the seafloor), as well as wind speed/direction, significant wave height, and wave period/direction. Data are transmitted via Iridium satellite every ten minutes and historical and real-time data are publicly available. The buoy system was temporarily out of commission after a boat strike severed the mooring/data cable on 13 July 2021. The buoy and cable were repaired, and the system was reinstalled on 20 October 2021. Though use of this data thus far has mainly been exploratory, we paired buoy data with water level data from the nearest NOAA tide gauge (Los Angeles, CA – Station ID: 9410660) to illustrate the relationship between surface/seafloor temperatures and tidal cycles.
Our biological monitoring approach includes diver surveys, protocols for which are described in detail by Zahn et al. (2016) and Pondella et al. (2019). Briefly, each pre-construction reef footprint and restoration reef module was characterized using 3 survey types: (1) 30-m × 2-m band transects to estimate species-specific fish density and size distribution along the reef surface, in the midwater, and through the kelp canopy when it was present; (2) 30-m × 2-m band transects to estimate density of macroinvertebrates and stipitate algae (kelp) on the reef; and (3) uniform point contact surveys to determine percent cover of primary reef placeholders, including sessile invertebrates, algae, and abiotic features (e.g. bare sand, bare rock, shell hash). The reef footprints were surveyed twice prior to construction (2019 and 2020) and the reef modules were surveyed twice post-construction (2020 and 2021). Each of the 18 reef footprints/modules were sampled independently and transects covered approximately equal areas of each submodule height. Two of the reef footprints were not surveyed in 2019 due to late-stage changes in reef placement.
Prior to analysis, pelagic and highly mobile fish species that are not characteristic inhabitants of rocky reef habitats were excluded from the data, and young-of-the-year fishes were removed prior to density (but not biomass) calculations because they could numerically dominate the assemblage at some sites sampled early during the sampling season but decline later in the year due to natural mortality. Total length (TL) estimates were converted to biomass using standard species-specific length-weight conversions from the literature (e.g., Williams et al., 2013). Density and biomass (separately) were then summed across all three portions (bottom, midwater, and canopy) of each transect. All densities were scaled to number or grams per 100 m2, and benthic cover was calculated as a percentage.
All analyses were performed using R version 4.1.2 (R Core Team, 2021). One-way repeated measures ANOVAs were performed using the ‘anova_test’ function in the rstatix package to identify the extent and magnitude of changes in biotic cover, giant kelp density, fish density, and fish biomass between the pre-construction restoration reef footprints and post-construction reef modules. All data met the assumption of normality and Greenhouse-Geisser corrections were applied when within-subjects factors violated the assumption of sphericity. Differences between sampling events among individual years were identified using post-hoc Tukey tests. For visualization, means and 95% confidence intervals were calculated by performing bootstrapping (1,000 permutations) using the ‘smean.cl.boot’ function in the Hmisc package.
We produced bathymetric shaded relief images of the restoration reef (Figure 1) and differential depth comparisons from annual bathymetric surveys. The addition of the reef was the most obvious change from 2019 to 2020, and from 2020 to 2021 we saw what appears to be slight settling at several modules resulting in a net loss in elevation, plus an increase in sub-canopy macroalgae that resulted in a net gain in elevation – specifically at the shallower modules (Figure 4). We saw no evidence of any large quarry rocks being dislodged from any module or large-scale scouring or buildup of sediment around the modules.
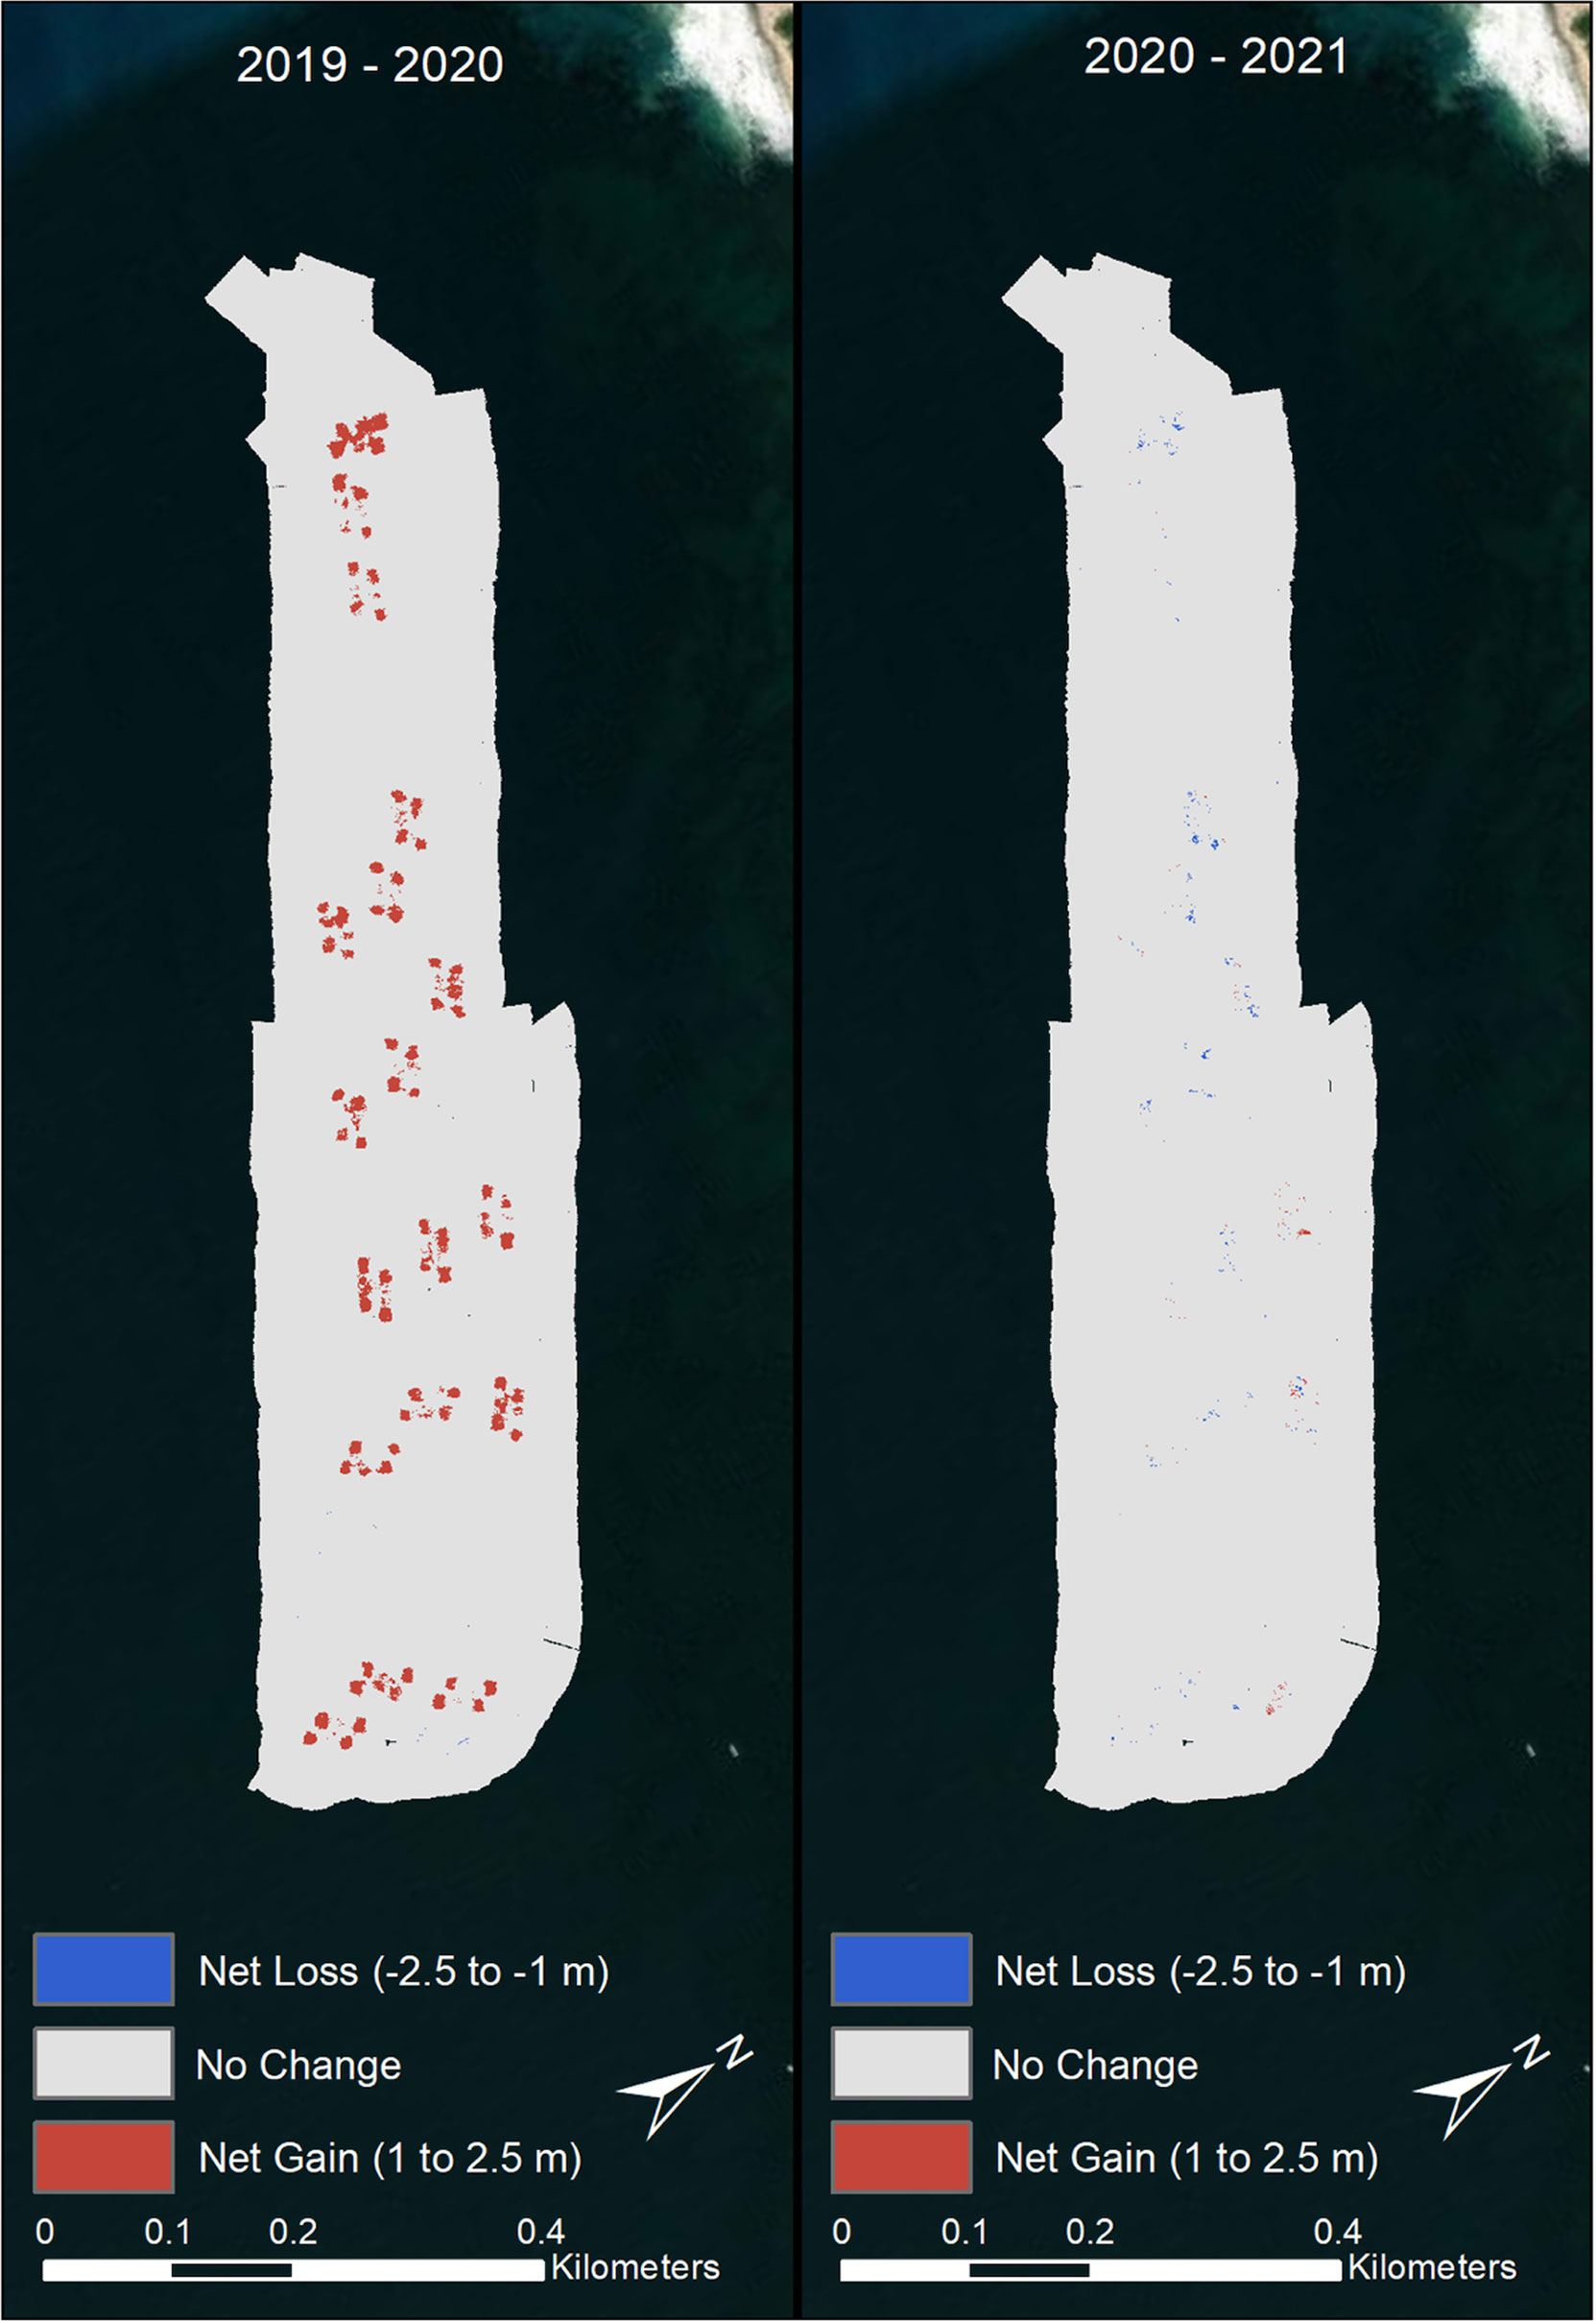
Figure 4 Year-to-year difference in bathymetry of the restoration area, including the 18 modules of Palos Verdes Reef. Blue and red indicate deeper and shallower seafloor, respectively, as compared to the previous year. Gray areas indicate a change of less than 1 m.
The dual temperature probes of the Spotter Buoy/Smart Mooring system provide insight into the frequency and degree of water column mixing and show that, though seasonally variable and highly influenced by storm activity, the thermocline appears to cross the reef modules at least once each day. Seafloor temperatures typically spike at or soon after low tides while surface temperatures often decrease slightly. Therefore, differences between the surface and bottom temperatures are typically highest during higher tides when the thermocline rises above the depth of the reef modules (Figure 5), though this pattern is not absolute and degrades during winter months as sea surface temperatures drop.
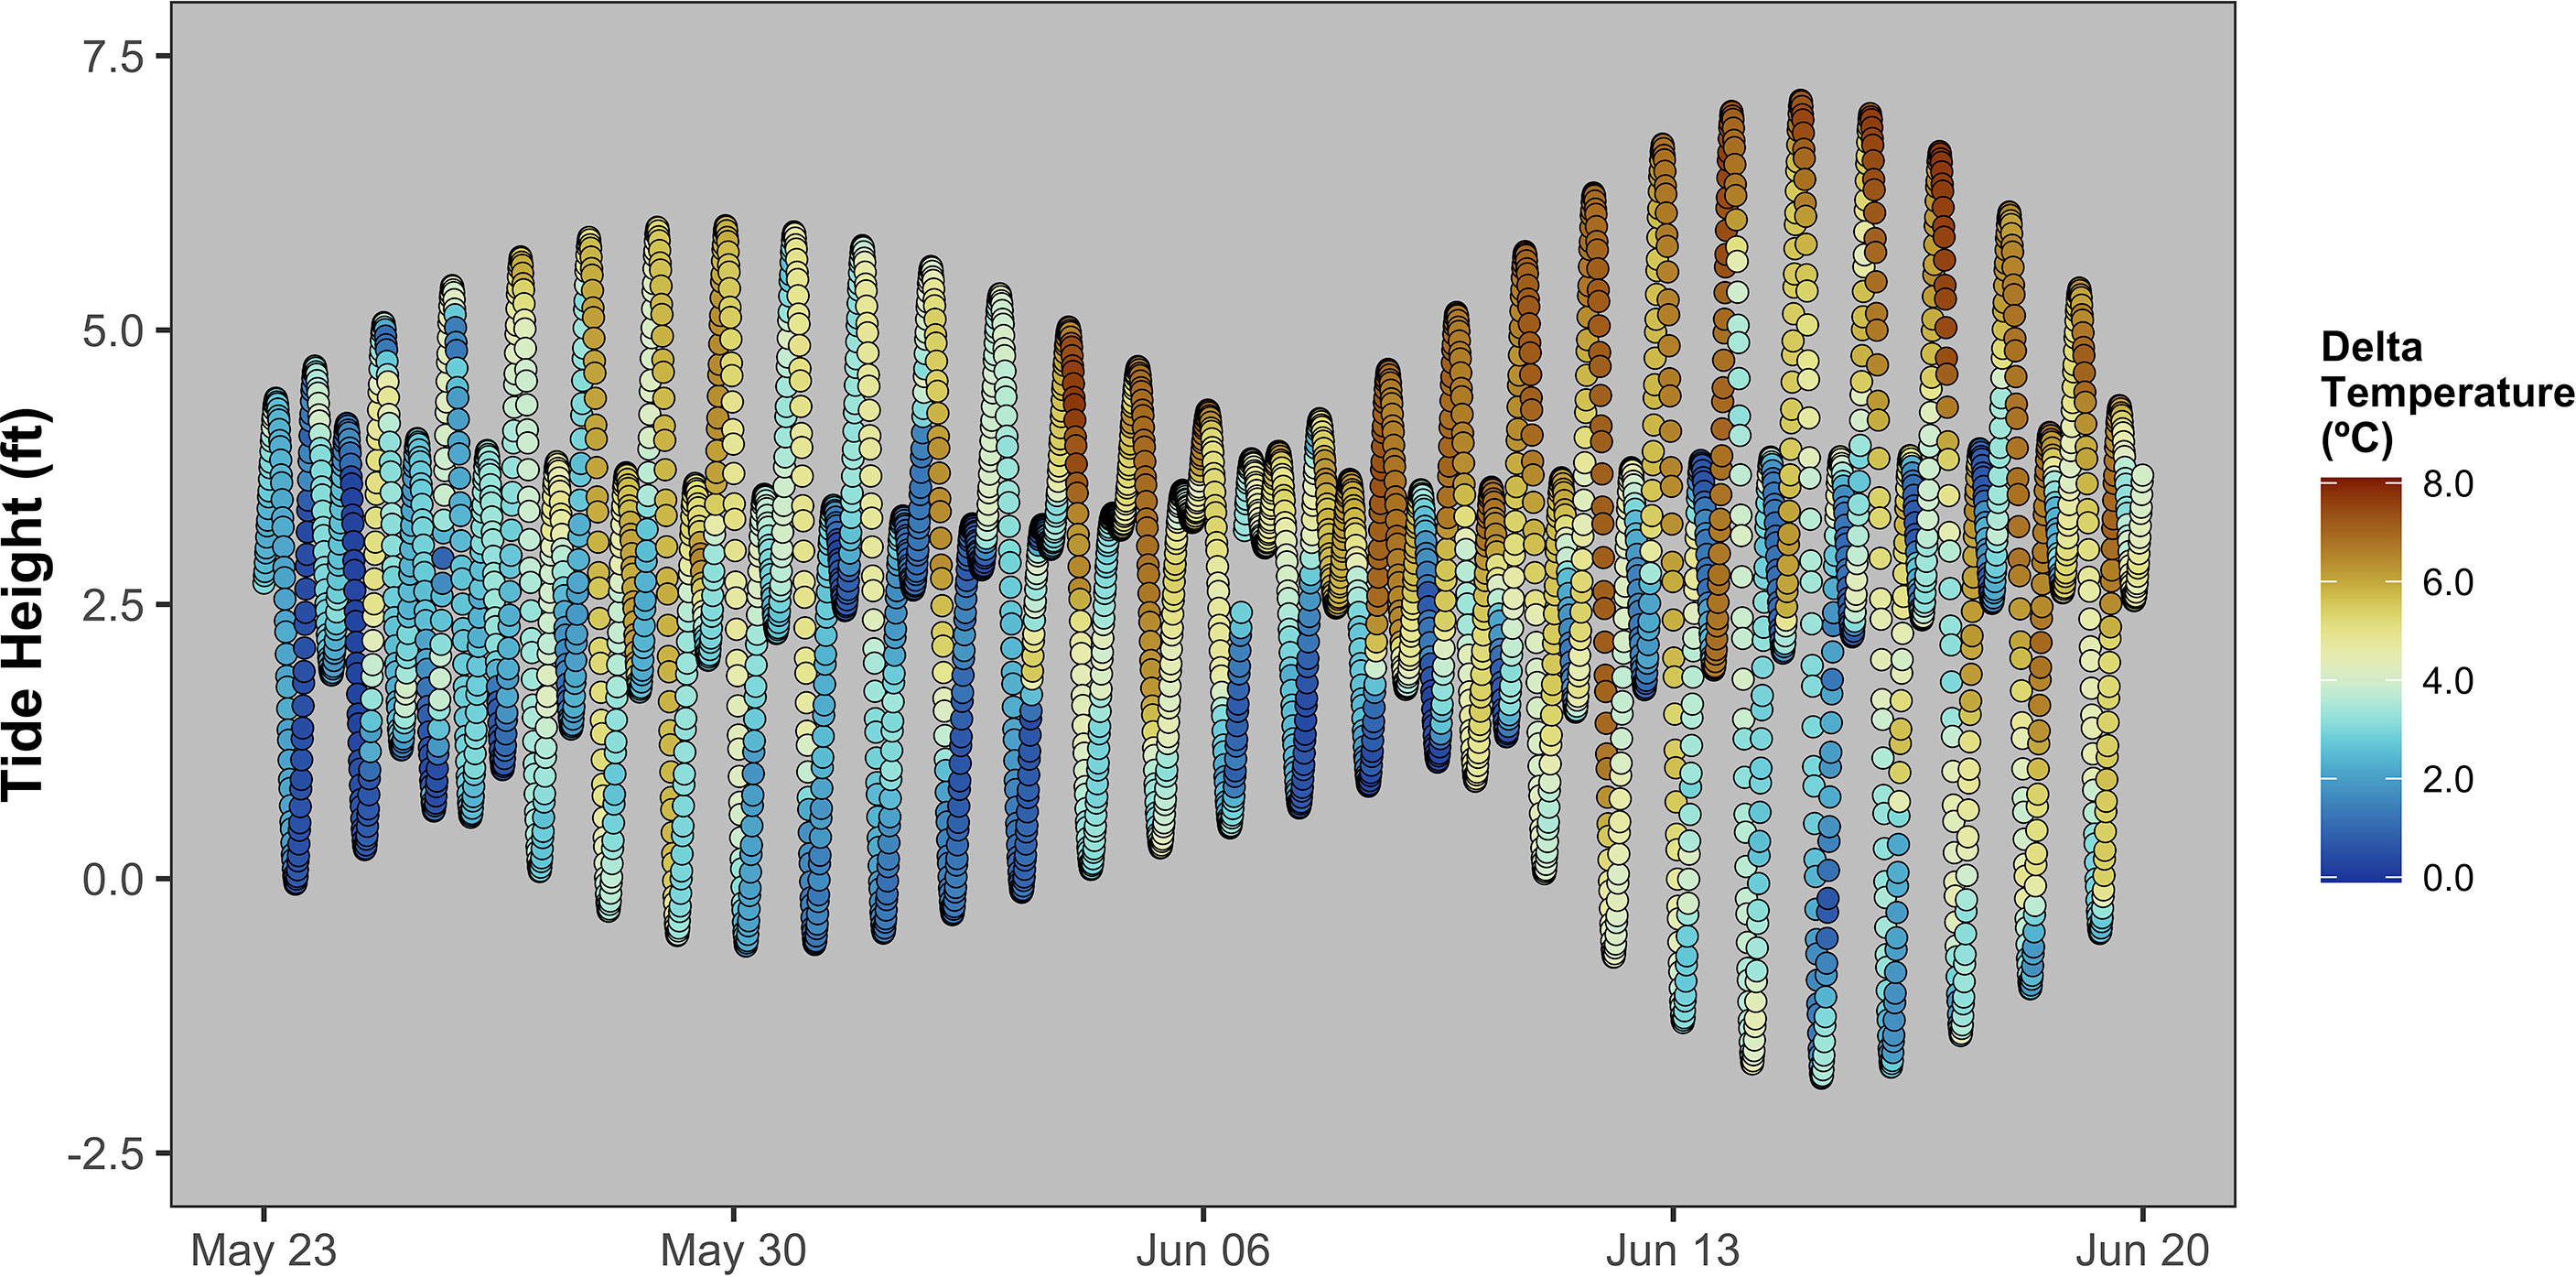
Figure 5 Tide height over an example lunar month (2022 May 23 – 2022 June 20), colored the difference between sea surface temperature and seafloor temperature.
Rocky-reef associated taxa recruited to the restoration site rapidly, with visible changes occurring within just a few months post-construction (Figure 6) and statistically significant changes all occurring in less than 18 months. The restoration reef benthos was initially colonized largely by hydroids, bryozoans (e.g. Diaperoforma californica), and brown turf algae, with kelp (both understory and canopy-forming), colonial tubeworms (e.g. Salmacina tribranchiata), and red turf algae succeeding the brown turf algae and filling in remaining bare rock spaces the following year. These are all common taxa in natural high-relief reefs in the region suggesting that benthic cover is quickly reaching a late-successional state. The new reef habitat was also quickly colonized by planktivores including Blacksmith (Chromis punctipinnis) and Señorita (Oxyjulis californica), followed the next year by several species of surfperches (Embiotocidae), Kelp Bass (Paralabrax clathratus), Barred Sand Bass (P. nebulifer), California Sheephead (Bodianus pulcher), Opaleye (Girella nigricans), and Halfmoon (Medialuna californiensis) – all common members of long-existing kelp forest communities.
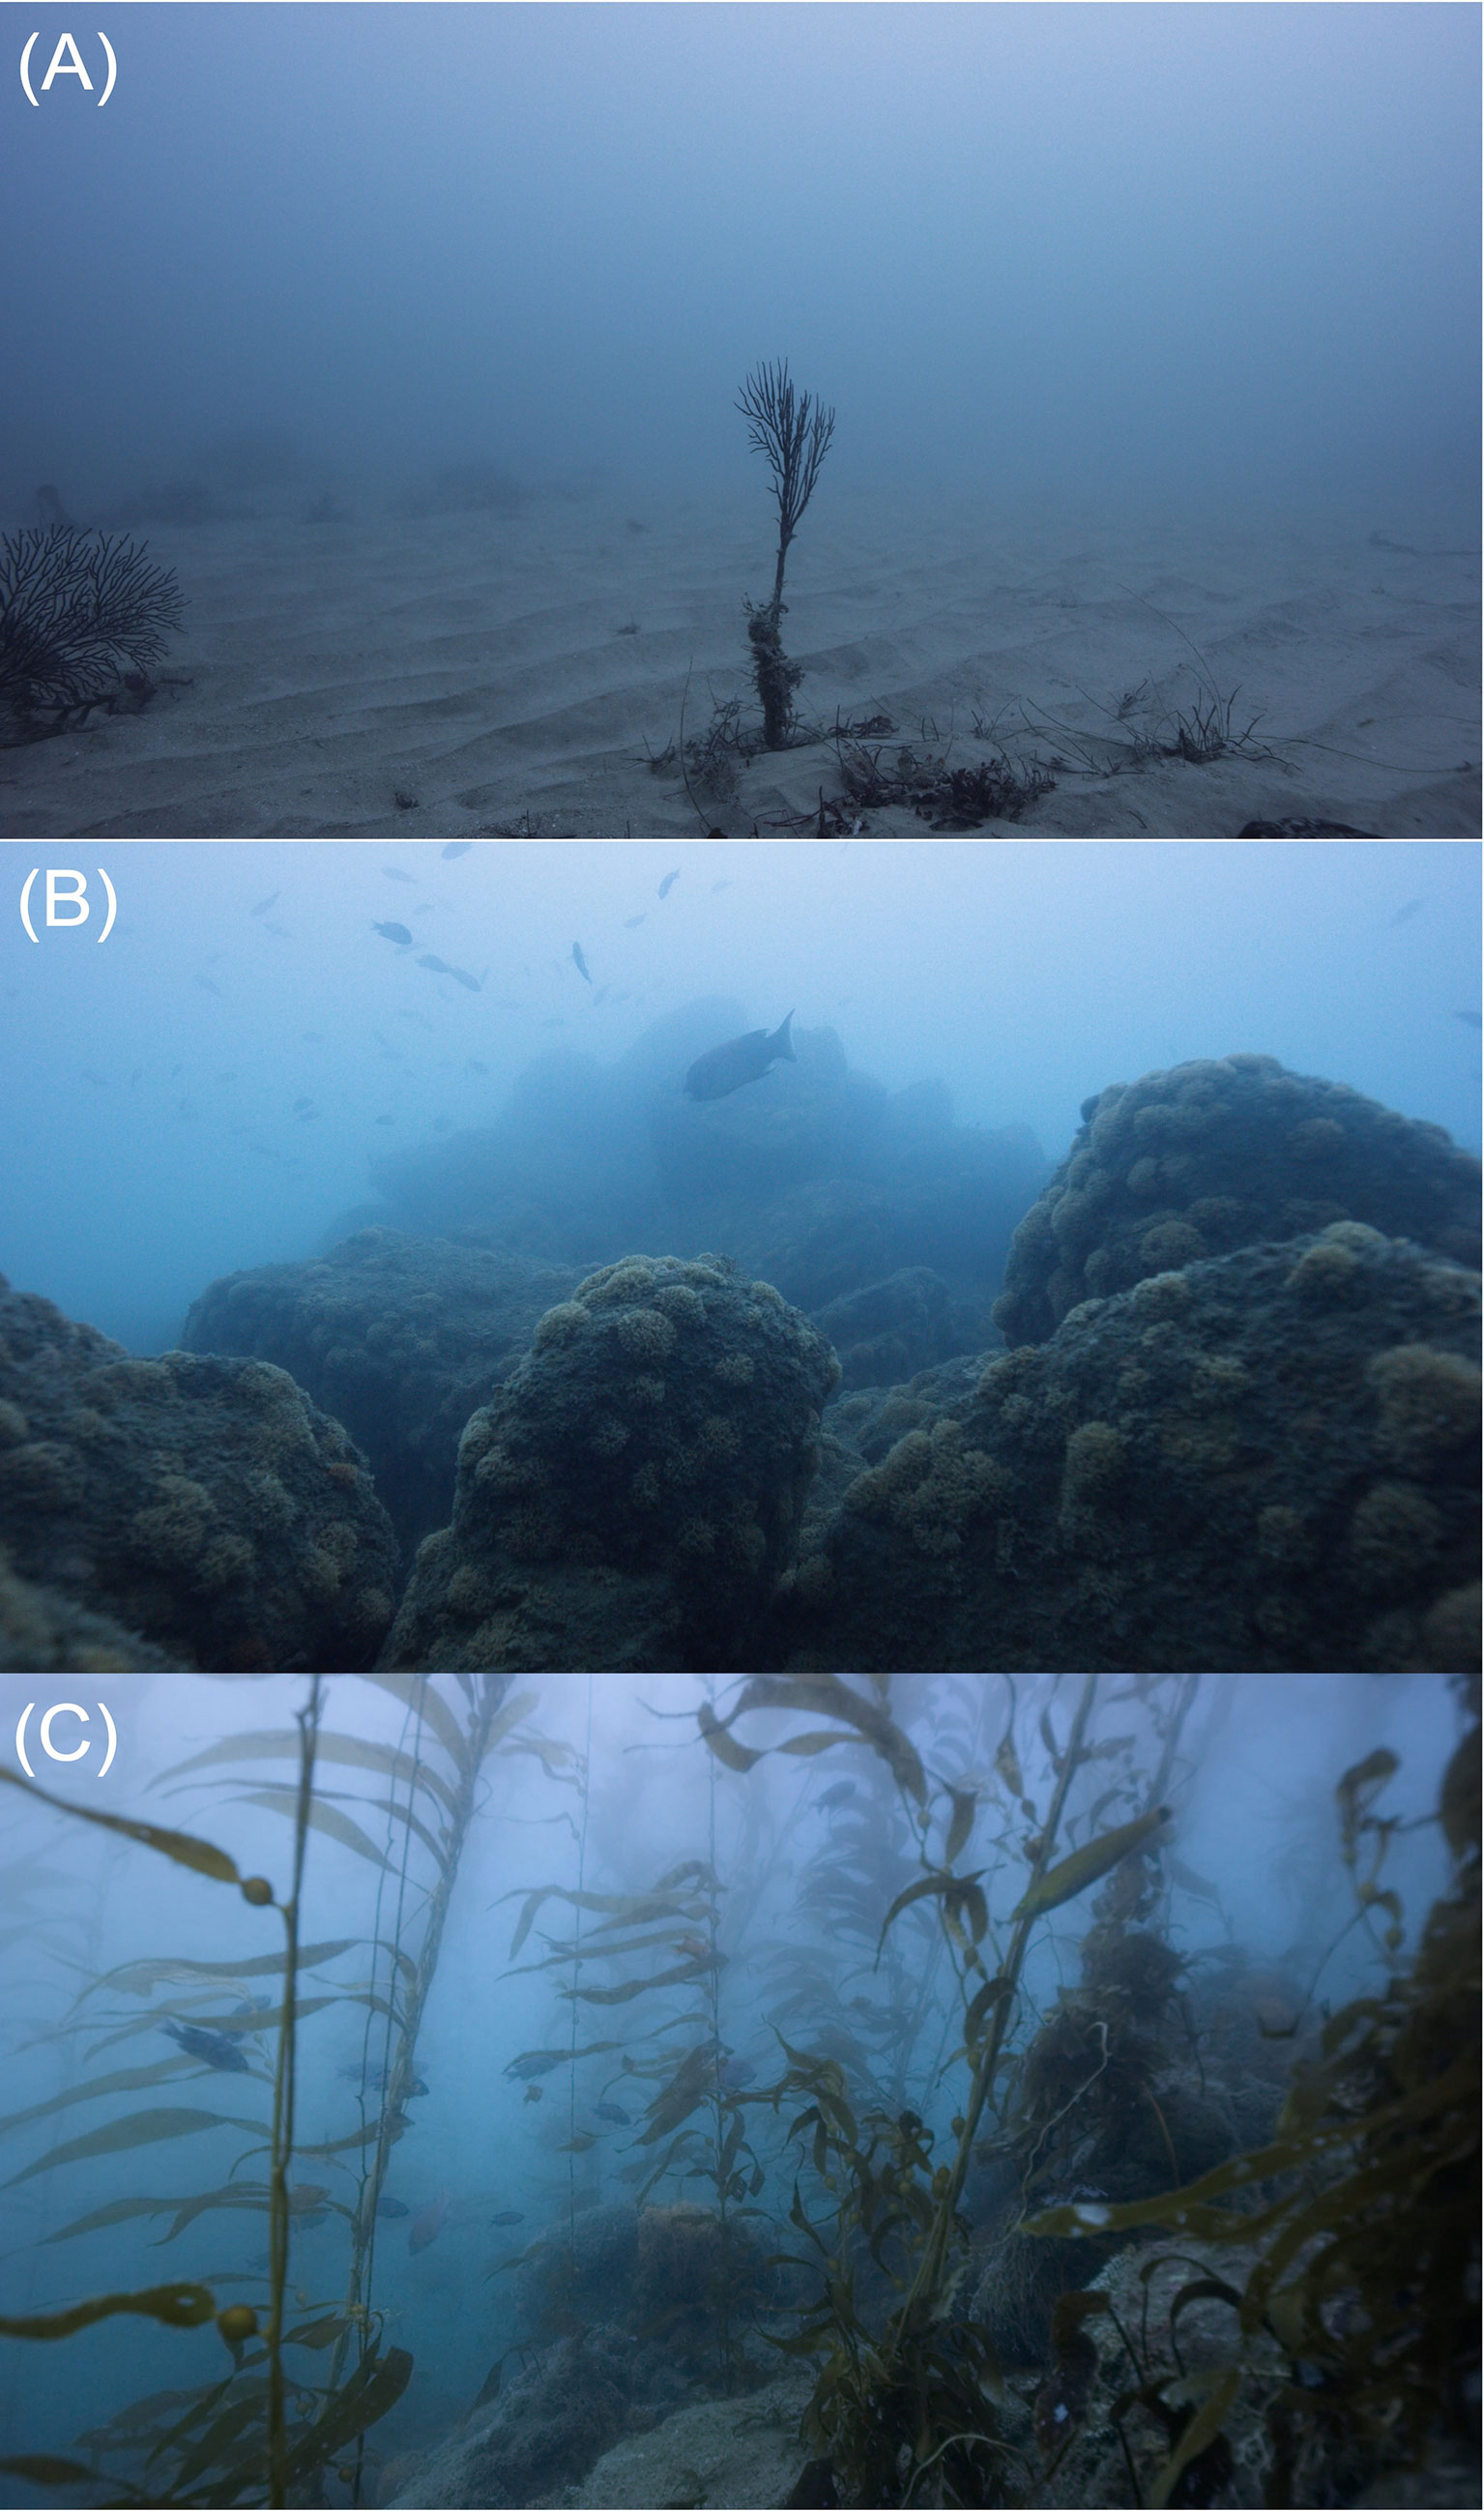
Figure 6 (A) A dead gorgonian attached to buried reef, (B) bryozoans covering Module 2A in February 2021 (eight months post-construction), and (C) giant kelp growing on Module 5A in November 2021 (18 months post-construction). Still images taken with permission from the short film “Rebirth of a Reef”, by Shaun Wolfe of Shaun Wolfe Photography.
Biotic benthic cover, giant kelp density, fish density, and fish biomass were all significantly higher post-construction than pre-construction (Table 2). In all cases, the 2019 and 2020 pre-construction surveys were not significantly different (p ≥ 0.999; Figure 7). For all cases (Figures 7A, C, D) except giant kelp density (Figure 7B), values from each post-construction survey were significantly higher than either pre-construction survey (p < 0.001), and values were not significantly different between post-construction surveys (p = 0.125–0.187). Giant kelp density in the 2021 post-construction survey was significantly higher than in each of the three previous surveys (including the 2020 post-construction survey; p < 0.001) which were not significantly different from each other (p > 0.999). Giant kelp was recorded on transect at 15 of the 18 reef modules by 2021. There is a general pattern of succession from nearshore to offshore and the kelp is already creating a thick canopy on some shallower modules (Figure 7B).
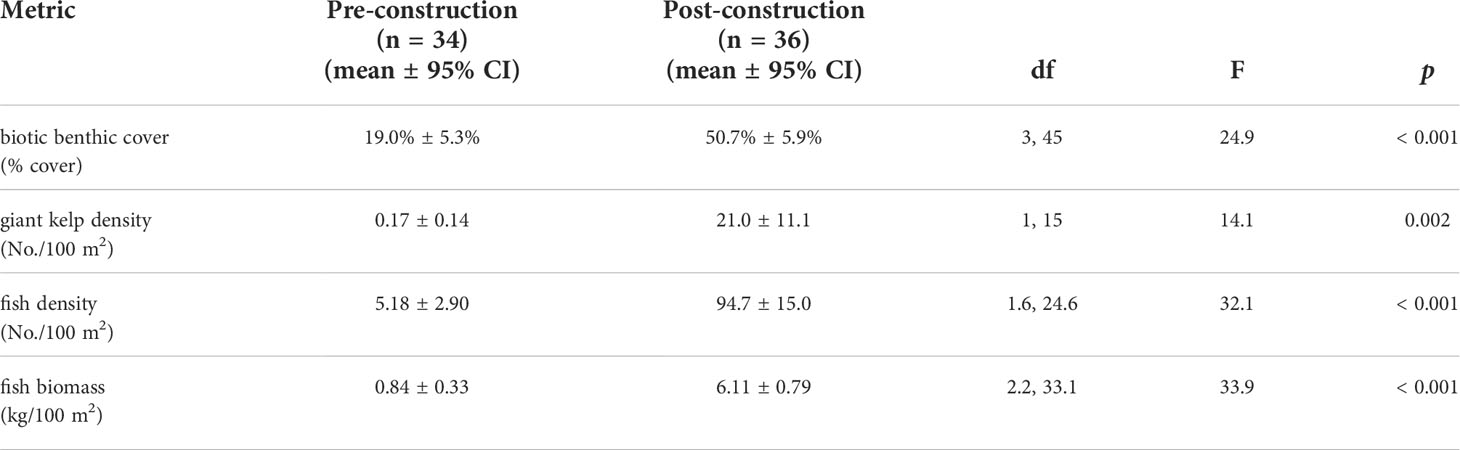
Table 2 Mean values ± 95% CI for pooled pre- and post-construction metrics with repeated measures ANOVA results.
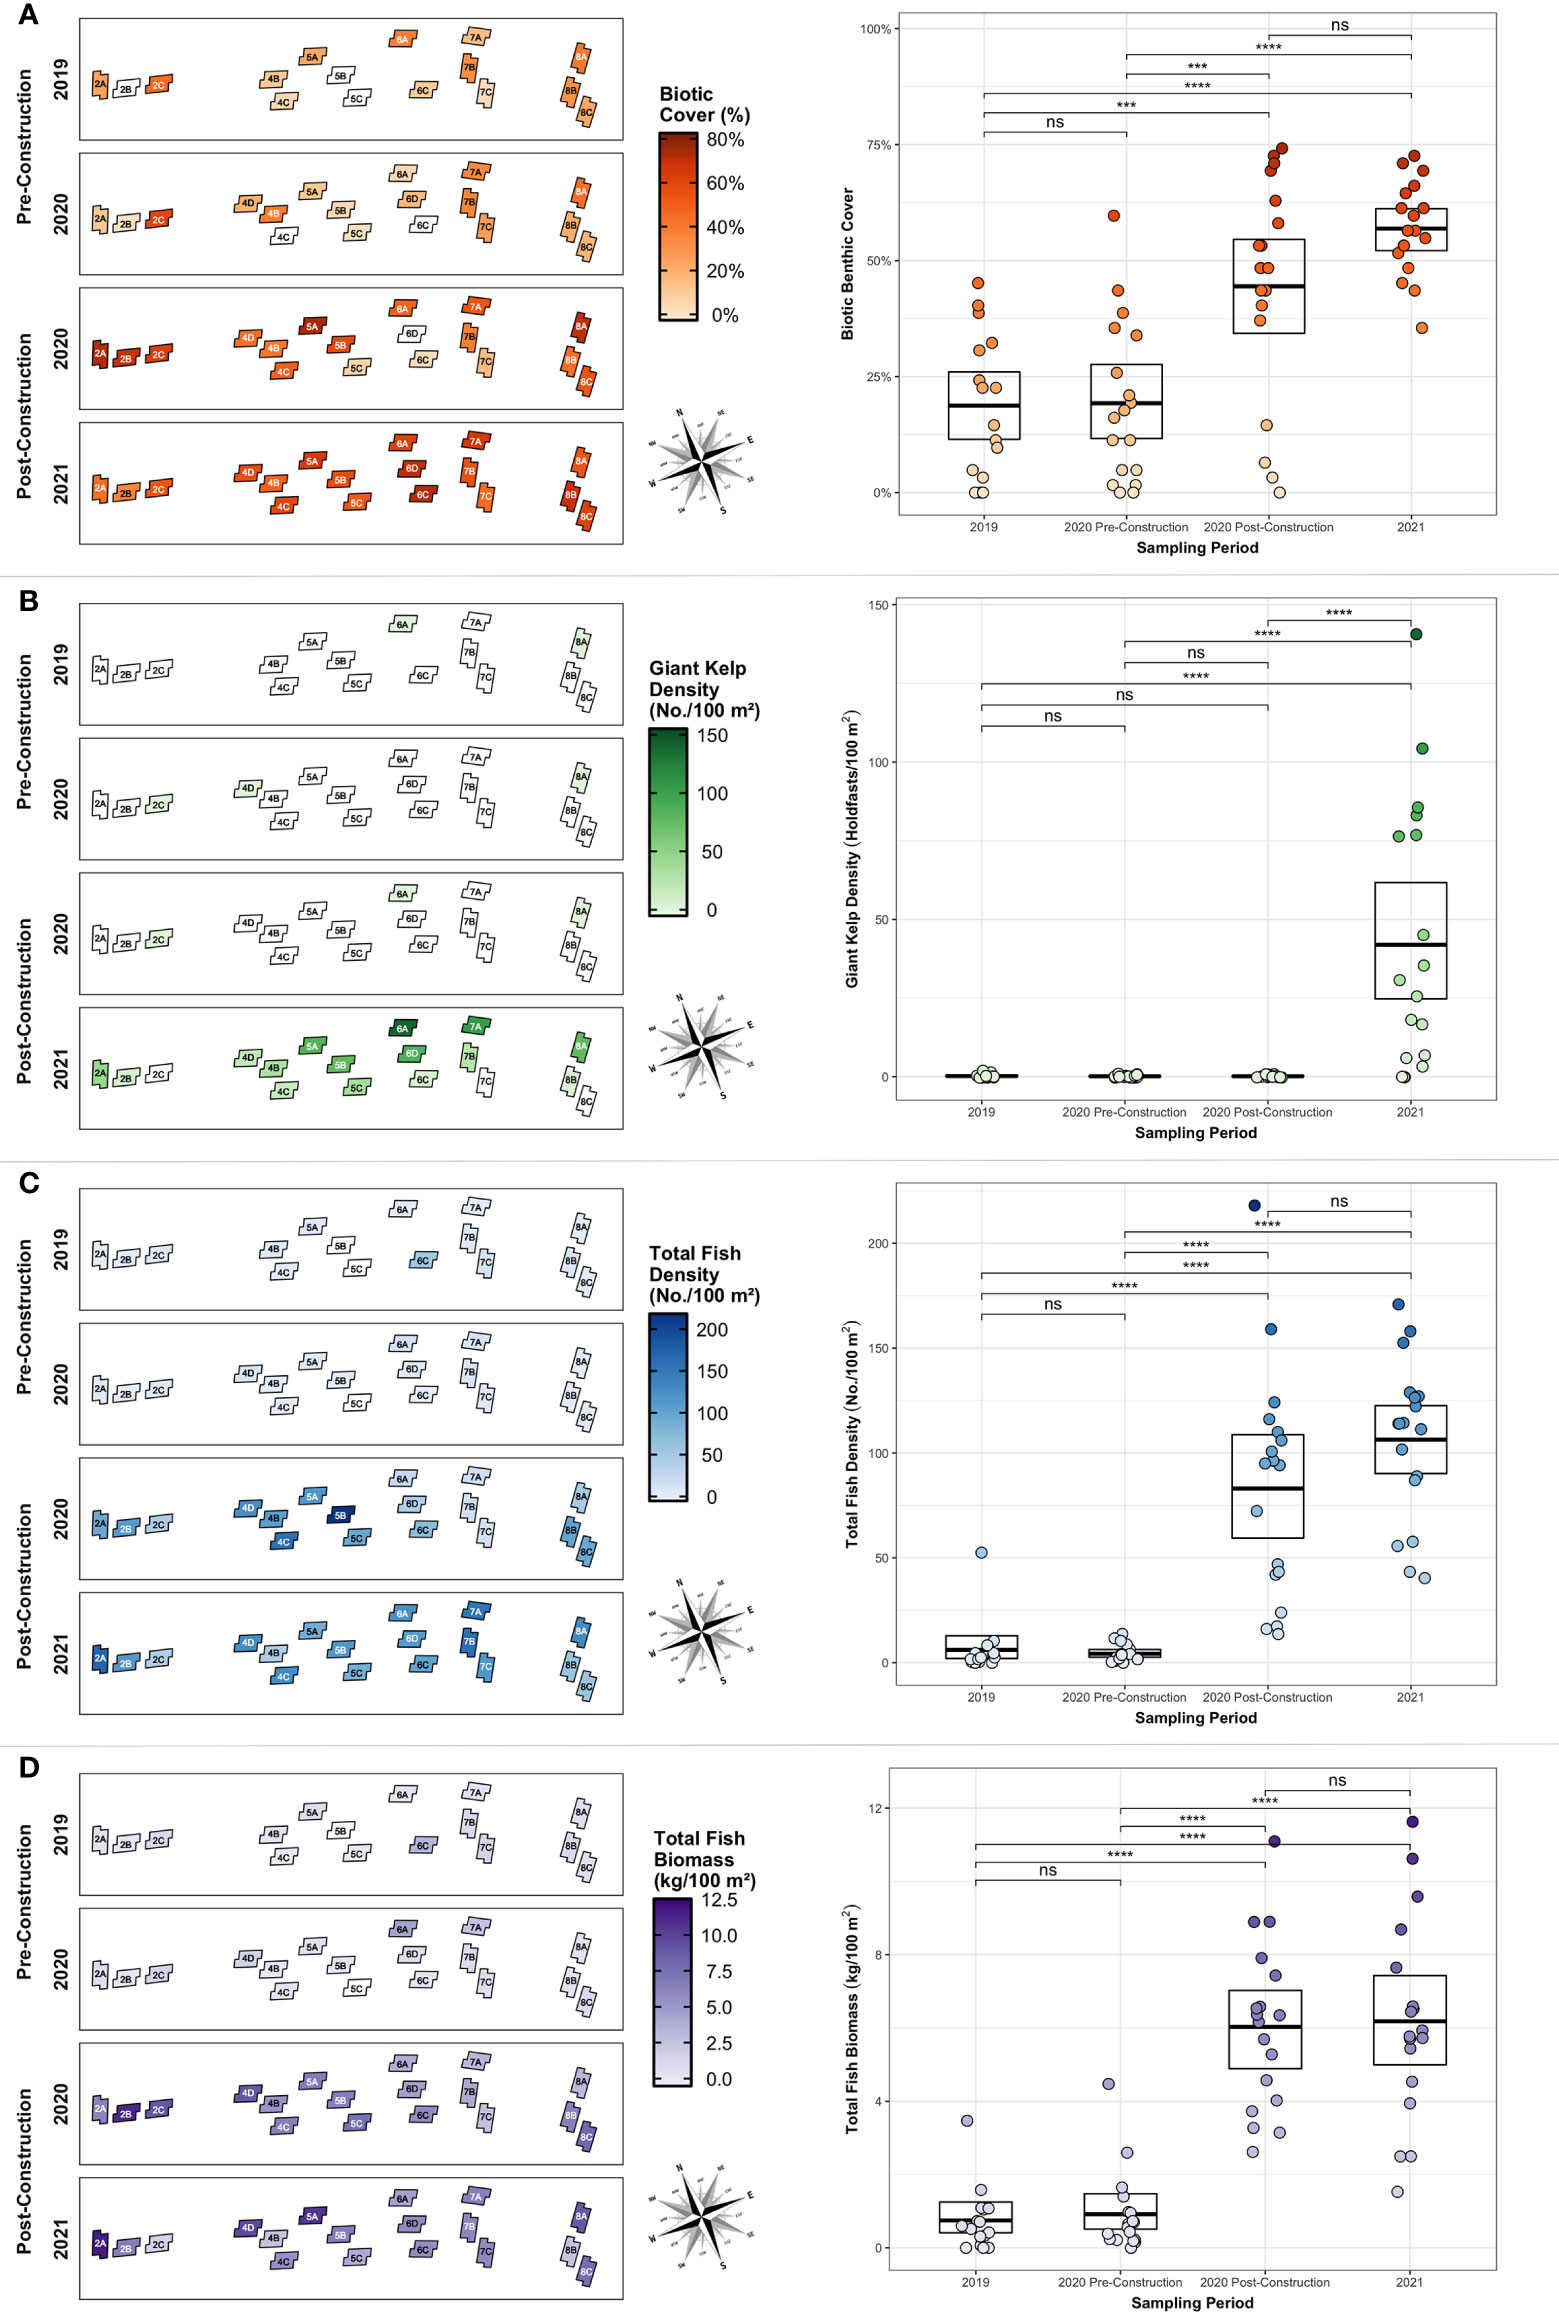
Figure 7 (A) Biotic cover, (B) giant kelp holdfast density, (C) total fish density, and (D) total fish biomass for each sampling period displayed geographically (left) and statistically (right). Notations above brackets indicates significance level between bracketed sampling periods; ‘ns’, non-significant (p > 0.05), *** = p < 0.01, **** = p < 0.001.
This unique restoration effort – directly replacing lost rocky reef habitat in situ – presented many unusual challenges and limitations (e.g., avoiding existing functional reef, reef reburial, seafloor lease boundaries, cost), but also provided an opportunity to focus our efforts on a subtidal area with many dynamic features. The chosen location and depth of the restoration reef was partly defined by the location having been negatively affected by landslides and sedimentation. However, the area is also subject to positive physical forcing and many beneficial geologic and oceanographic factors that were accounted for in the reef placement and design. In fact, species distribution (Zellmer et al., 2019) and reef performance modeling (Pondella et al., 2019) had identified this area as a high potential location for many commercially, recreationally, and ecologically important species assuming reef habitat was properly designed.
This restoration reef not only provides more habitat for rocky-reef associated species but also provides higher quality habitat – highly rugose, steeply sloped, and heterogenous, versus the relatively flat, low relief nearby reef that is under continuous sedimentation pressure. PVR was built at a location directly adjacent (< 2 km) to a continental shelf break and in an upwelling zone with high primary production and frequent temperature fluctuations. The specific placement depth of the reef modules may prove particularly fortuitous, as water temperature data from the on-site Spotter Buoy appears to show internal tides inundating the modules with cool, nutrient rich water with some frequency – often twice a day at high tide.
While the primary design criteria for PVR was fish production, the steep-slope design is also resilient to sedimentation and turbidity challenges on the peninsula. All reef aspects have a minimum of 1 m relief, placing them above the sediment scour zones documented in the area. Additionally, placing rock on existing but buried hard substrate provided a small maximum depth the modules can settle and subside into the sediment, avoiding a pitfall of past reefing efforts in the region (Ambrose and Anderson, 1990).
PVR modules showed rapid, significantly positive responses in fish density, fish biomass, kelp density, and biotic benthic cover following reef construction. It appears that this high relief feature, coupled with immediate proximity to the natural reefs that support giant kelp, created a substrate that was optimal for kelp recruitment and a unique opportunity to examine rapid succession as it attracted a wide array of taxa almost immediately. One common concern regarding artificial reefs is the potential for the new structure to simply attract individuals from other areas rather than produce new individuals and increase overall populations (Bohnsack, 1989). This prospect of attracting mobile organisms from other areas is particularly strong at PVR given the proximity of existing reefs. The present study does not address this concern, but we believe the higher quality habitat that is now available will result in an increase in secondary production for many initially-attracted taxa over the long-term, and the taxa utilizing the new habitat indicate that the restoration reef is already in the later stages of succession.
In addition to surveys of the restoration reef footprint and modules, we surveyed multiple restored, adjacent, and reference sites annually for several years prior to reef construction and continue to do so annually post-construction. Our surveys will ultimately utilize a progressive-change multiple before-after control-impact design (PCmBACI; Williams et al., 2021) to describe the pattern, extent, and magnitude of changes to communities. This type of analysis would suggest that positive changes in the restored and adjacent areas versus reference areas are a result of new secondary production rather than attraction from nearby reefs (Osenberg et al., 2002). With only two surveys performed post-construction thus far, these studies are in their infancy and most results cannot yet be reported with great statistical confidence. This large-scale, long-term biological study, coupled with annual sonar surveys and continuous oceanographic monitoring, will provide bountiful information about succession, usage, and response for numerous taxa, as well as sediment interaction with the restoration reef and more fine-scale assessments of our reef design.
The raw data supporting the conclusions of this article will be made available by the authors, without undue reservation.
Ethical review and approval was not required for the animal study because the study was observational only.
JW and DP developed the study approach. JW performed the analyses and wrote the manuscript. DP, CW, and ZS revised the manuscript. CW and ZS performed the sonar surveys and processed the sonar data. All authors performed the biological field surveys, contributed to the article, and approved the final manuscript.
California State Coastal Conservancy Grant Agreement # 19-019; NOAA Restoration Center Community-based Restoration Program Project Awards #2008-0073-010 and #2008-0073-046; National Fish and Wildlife Foundation Grant IDs #8006.13.040016 and # 3002.15.049578 under the Damage Assessment, Remediation, and Restoration Program (DARRP) Settlement Restoration Program Cooperative Agreement funded by National Oceanic and Atmospheric Administration Fund # NA12NMF4630196.
The authors would like to thank their partners in making this project a success, including the Montrose Settlements Restoration Program and its Trustees (National Oceanic and Atmospheric Administration, National Park Service, U.S. Fish and Wildlife Service, California Department of Fish and Wildlife, California State Lands Commission, California State Parks), The Bay Foundation, California State Coastal Conservancy, and the National Fish and Wildlife Foundation. We would specifically like to thank David Witting and Jennifer Boyce (NOAA) for their commitment to and support of this project for nearly two decades. We’d also like to thank those whose help was invaluable in field work, construction, and permitting: Tom Ford (The Bay Foundation); Justin Chin Wong, Steve Schryver, and Mike Ellis (Connolly-Pacific Co.); Cassidy Teufel, Kate Huckelbridge, Jonna Engel, John Dixon (California Coastal Commission); Bonnie Rogers, Lia Protopapadakis, Steve Estes (Department of the Army); Kelly Keen and Sarah Mongano (California State Lands Commission); Valerie Carrillo Zara, Celine Gallon, Melissa Lane, Serena Stumpf, Hope Sexton, L.B. Nye (Los Angeles Regional Water Quality Control Board); Chris Kroll (California State Coastal Conservancy); Carrie Wolfe, Sam Soule, Mark Loos, Darrell Montague, Sam Corder Lee, Adriana Stowell (Southern California Marine Institute); Bill Power (Los Angeles County Sanitation Districts); Matt Robart, Erin Jaco, Jeremy Claisse (Vantuna Research Group). This manuscript greatly benefitted from the help of three reviewers.
The authors declare that the research was conducted in the absence of any commercial or financial relationships that could be construed as a potential conflict of interest.
All claims expressed in this article are solely those of the authors and do not necessarily represent those of their affiliated organizations, or those of the publisher, the editors and the reviewers. Any product that may be evaluated in this article, or claim that may be made by its manufacturer, is not guaranteed or endorsed by the publisher.
Ambrose R. F., Anderson T. W. (1990). Influence of an artificial reef on the surrounding infaunal community. Mar. Biol. 107, 41–52. doi: 10.1007/bf01313240
Bohnsack J. A. (1989). Are high densities of fishes at artificial reefs the result of habitat limitation or behavioral preference? Bull. Mar. Sci. 44 (2), 631–645.
Claisse J. T., Pondella D. J. II, Love M., Zahn L. A., Williams C. M., Williams J. P., et al. (2014). Oil platforms off California are among the most productive marine fish habitats globally. Proc. Natl. Acad. Sci. United States America 111 (43), 15462–15467. doi: 10.1073/pnas.1411477111
Graham M. H. (2004). Effects of local deforestation on the diversity and structure of southern California giant kelp forest food webs. Ecosystems 7 (4), 341–357. doi: 10.1007/s10021-003-0246-6
Ilieva I., Jouvet L., Seidelin L., Best B. D., Aldabet S., da Silva R., et al. (2019). A global database of intentionally deployed wrecks to serve as artificial reefs. Data Brief 23, 103584. doi: 10.1016/j.dib.2018.12.023
Kayen R. E., Lee H. J., Hein J. R. (2002). Influence of the Portuguese Bend landslide on the character of the effluent-affected sediment deposit, Palos Verdes Margin, southern California. Continental Shelf Res. 22, 911–922. doi: 10.1016/s-0278-4343(01)00111-x
Lewis R. D., McKee K. K. (1989). A guide to the artificial reefs of southern California. (Sacramento, California: California Department of Fish and Game).
Osenberg C. W., St. Mary C. M., Wilson J. A., Lindberg W. J. (2002). A quantitative framework to evaluate the attraction-production controversy. ICES J. Mar. Sci. 598, S214–S221. doi: 10.1006/jsmc.2002.1222
Pondella D. J. II (2009). Science based regulation: California’s marine protected areas. Urban Coast. 1, 33–36.
Pondella D. J. II, Allen L. G., Craig M. T., Gintert B. (2006). Evaluation of eelgrass mitigation and fishery enhancement structures in San Diego Bay, California. Bull. Mar. Sci. 78 (1), 115–131.
Pondella D. J. II, Piacenza S. E., Claisse J. T., Williams C. M., Williams J. P., Zellmer A. J., et al. (2019). Assessing drivers of rocky reef fish biomass density from the Southern California Bight. Mar. Ecol. Prog. Ser. 628, 125–140. doi: 10.3354/meps13103
Pondella D. J. II, Williams J. P., Claisse J. T., Schaffner R., Ritter K., Schiff K. (2015). The physical and biological characteristics of nearshore rocky reefs in the Southern California Bight. Bull. South. California Acad. Sci. 114 (3), 105–122. doi: 10.3160/soca-114-03-105-122.1
Pondella D. J. II, Williams J. P., Williams C. M., Claisse J. T., Witting D. (2018). “Restoring a nearshore rocky reef ecosystem in the challenge of an urban setting,” in Marine Artificial Reef Research and Development: Integrating fisheries management objectives, vol. 86 . Ed. Bortone S. A. (Bethesda, MD: American Fisheries Society, Symposium), 165–186.
R Core Team (2021). “A language and environment for statistical computing.” (Vienna, Austria: R Foundation for Statistical Computing).
Reed D. C., Schroeder S. C., Huang D. (2006). An experimental investigation of the use of artificial reefs to mitigate the loss of giant kelp forest habitat. a case study of the San Onofre Nuclear Generating Station’s artificial reef project. California SeaGrant Univ. California San Diego (T-058).
Stephens J. S., Morris P. A., Pondella D. J. II, Koonce T. A., Jordan G. A. (1994). Overview of the dynamics of an urban artificial reef fish assemblage at King Harbor, California, USA 1974-1991 - a recruitment driven system. Bull. Mar. Sci. 55 (2-3), 1224–1239.
Williams C. M., Williams J. P., Claisse J. T., Pondella D. J.II, Domeier M. L., Zahn L. A. (2013). Morphometric relationships of marine fishes common to central California and the Southern California Bight. Bulletin of the Southern California Academy of Sciences. 112(3), 217–227. doi: 10.3160/0038-3872-112.3.217
Williams J. P., Claisse J. T., Pondella D. J., Williams C. M., Robart M. J., Scholz Z., et al. (2021). Sea Urchin mass mortality rapidly restores kelp forest communities. Mar. Ecol. Prog. Ser. 664, 117–131. doi: 10.3354/meps13680
Zahn L. A., Claisse J. T., Williams J. P., Williams C. M., Pondella D. J. II (2016). The biogeography and community structure of kelp forest macroinvertebrates. Mar. Ecol. 37, 770–785. doi: 10.1111/maec.12346
Keywords: rocky reef, restoration, giant kelp, biomass, fish, ecological succession, sedimentation
Citation: Williams JP, Williams CM, Pondella DJII and Scholz ZM (2022) Rebirth of a reef: As-built description and rapid returns from the Palos Verdes Reef Restoration Project. Front. Mar. Sci. 9:1010303. doi: 10.3389/fmars.2022.1010303
Received: 02 August 2022; Accepted: 15 September 2022;
Published: 29 September 2022.
Edited by:
Stelios Katsanevakis, University of the Aegean, GreeceReviewed by:
Caitlin Blain, The University of Auckland, New ZealandCopyright © 2022 Williams, Williams, Pondella and Scholz. This is an open-access article distributed under the terms of the Creative Commons Attribution License (CC BY). The use, distribution or reproduction in other forums is permitted, provided the original author(s) and the copyright owner(s) are credited and that the original publication in this journal is cited, in accordance with accepted academic practice. No use, distribution or reproduction is permitted which does not comply with these terms.
*Correspondence: Jonathan P. Williams, am9ud2lsbGlhbXNAb3h5LmVkdQ==
Disclaimer: All claims expressed in this article are solely those of the authors and do not necessarily represent those of their affiliated organizations, or those of the publisher, the editors and the reviewers. Any product that may be evaluated in this article or claim that may be made by its manufacturer is not guaranteed or endorsed by the publisher.
Research integrity at Frontiers
Learn more about the work of our research integrity team to safeguard the quality of each article we publish.