
94% of researchers rate our articles as excellent or good
Learn more about the work of our research integrity team to safeguard the quality of each article we publish.
Find out more
ORIGINAL RESEARCH article
Front. Mar. Sci. , 07 October 2022
Sec. Marine Fisheries, Aquaculture and Living Resources
Volume 9 - 2022 | https://doi.org/10.3389/fmars.2022.1009896
 Jun Long Sun1†
 Fei Biao Song1†*
 Lei Wang1†Wei Wei Zhang1You Ming Chen2
 Li Zhou3
 Jian Fang Gui3
 Jian Luo1*
Golden pompano (Trachinotus blochii) is becoming increasingly popular and produces high yields, but the growth differences between males and females are a concern. In this study, the differences between the growth of males and females were compared, and the transcriptome analysis of muscle tissues was performed. A significant difference between the growth of males and females was observed; females were found to be 17% larger than males after reaching 7 months of age. Gonadal histological analysis revealed that the ovaries were arrested in 7- to 9-month-old golden pompano, whereas the testes continued to develop. The AMPK and adipocytokine signaling pathways were also found to be involved in the regulation of muscle growth and metabolism. After reaching 7 months of age, the expression levels of glut1, glut4, ldh, gys, acsl and cpt2 in the muscle of females were lower than those in males, but the hk gene, which is involved in glycolysis, was found to remain highly expressed in females. Additionally, in females, the synthesis of arginine and ornithine and the production of carnosine were found to be inhibited, but the breakdown of glutamine was found to be enhanced and OXPHOS ability was found to be stronger in females after reaching 7 months of age. These results support a certain negative correlation between gonadal development and muscle metabolism depending on differences in energy distribution. Clearly, the faster growth in females after reaching 7 months of age was found to be associated with the more active metabolism of glucose, and amino acids, as well as stronger oxidative phosphorylation levels.
Sexual dimorphism defines the differences between the growth and reproduction of female and male individuals (Mei and Gui, 2015), and can be extended to the differences in the size, shape, behavior, color, and physiology of males and females (Wang et al., 2018). Body size differences between males and females of the same species have been observed in many farmed fish, such as rainbow trout (Oncorhynchus mykiss) (Bye and Lincoln, 1986), yellow catfish (Pelteobagrus fulvidraco) (Mei and Gui, 2015), tilapia (Oreochromis niloticus) (Beardmore et al., 2001), European eel (Anguilla anguilla), half-smooth tongue sole (Cynoglossus semilaevis), and the common carp (Cyprinus carpio) (Degani et al., 2003; Kocour et al., 2005; Ma et al., 2012). For example, Chinese tongue sole (Cynoglossus semilaevis) females are between two and four times larger than males, and this significant growth difference also makes females more economically valuable (Chen et al., 2014).
Fish growth is a complex polygenic trait that is mainly regulated by the environment, nutrients, energy metabolism, energy allocation, gonadal development, and reproductive cycles. Increasing evidence suggests that the interaction between the somatotropic endocrine axis and the reproductive axis plays an important role in the regulation of growth (Holloway and Leatherland, 1998; Melamed et al., 1998; Gomez et al., 1999). Growth in some teleosts has been shown to be regulated by growth hormone-releasing hormone (GHRH), growth hormone (GH), the growth hormone receptor (GHR), and insulin-like growth factors (IGFs) (Saether et al., 2007; Ma et al., 2012; Wang et al., 2018). For example, igf1 mRNA expression levels have been found to be significantly higher in fast-growing individuals of European sea bass (Dicentrarchus labrax) and crucian carp (Carassius carassius) than in slow-growing individuals (Carnevali et al., 2006; Zhong et al., 2012). However, other studies have uncovered opposing results (Dean and Mank, 2014). For example, no differences in igf1 mRNA expression have been observed in channel catfish (Ictalurus punctatus) or zebrafish (Danio rerio), which exhibit differences in growth (Peterson et al., 2008; Opazo et al., 2017). These divergent results suggest that the relationship between the GH/IGF1 axis and fish growth is not fully understood, and that there may be other ways in which growth is regulated. In addition, it has been shown that genes on autosomes may be major players in the differential regulation of growth and sex, especially in species without sex chromosomes (Possiant et al., 2008; Ducrest et al., 2008). According to previous studies, the expression of many genes of males and females of the same species is significantly different in non-gonadal tissues, which fully demonstrates that non-gonadal organs (especially the liver, fat, and muscle) may play an important role in sexual dimorphism (Yang et al., 2006; Wang et al., 2021). Therefore, it is necessary to explain the growth differences between male and female fish via non-gonadal tissue transcriptome data. As transcriptomic techniques have been widely used to study non-model species in recent years, the use of non-gonadal tissue transcriptome data may aid in the further analysis of the physiological processes and molecular mechanisms of sexual size dimorphism (Wang et al., 2018; Wang et al., 2021; Zhou et al., 2022). Previous studies have shown that MAPK signaling, glycolysis/gluconeogenesis, and cholesterol-dependent steroid hormone pathways may participate in the regulation of body size dimorphism (Wang et al., 2018; Wang et al., 2021). However, there is little information available on the sexual size dimorphism in the muscle of a farmed teleost.
The golden pompano (Trachinotus blochii) is mainly distributed in the temperate and subtropical waters of the Indian and Pacific Oceans. Because of its delicious meat and rich nutrition, it is favored by Chinese consumers, and its annual output has exceeded 0.16 million tons (China Golden Pompano Industry Development Report, 2020). Previous studies by this research group have not reported significant sexual dimorphism in the growth or reproductive traits of golden pompano (Zhang et al., 2017; Sun et al., 2021). However, the present study found sexual dimorphism in the growth of golden pompano after reaching 7 months of age, and females were found to be larger than males. In the present study, muscle tissues from female and male golden pompano were subjected to transcriptomic analysis to identify differentially expressed genes (DEGs) and their functions.
All experiments were performed according to the Guidelines for the Care and Use of Laboratory Animals in China. All experimental procedures and sample collection were approved by the Institutional Animal Care and Use Committee (IACUC) of the College of Ocean of Hainan University, Hainan, China, under permit No. HNUAUCC-2022-00045.
The reproduction of golden pompano parents obtained from Hainan Blue Granary Technology Co., Ltd. (Sanya, China) in April 2021 was artificially induced. The offspring were transferred to seawater cages for culture at the fingerling stage. The stocking density and the cultivation management methods were the same as those used for commercial cultivation. The water quality parameters were ammonia-nitrogen and nitrite concentrations of <0.02 mg/L, a dissolved oxygen concentration of 7.0 ± 0.5 mg/L, a pH of 7.5 ± 0.5, a salinity of 20–35‰, and a natural photoperiod. The fish were fed commercial pellets (Tianma Company, Fujian, China) twice daily at 09:00 and 17:00 (3-5% of body weight).
After the experimental fish were transferred to seawater cages, their growth traits were continuously measured from 5 to 9 months of age. Fifty experimental fish were randomly selected every month, and their body weights were measured after anesthesia with MS-222. The fish were immediately dissected to collect their fin, muscle, and gonadal tissues. The fins were stored in absolute ethanol for DNA extraction to identify the genetic sex. The gonads were stored in Bouin’s solution and used to prepare paraffin sections to confirm the sex of the experimental fish and to analyze the gonadal developmental status. All muscle samples were immediately frozen in liquid nitrogen and stored at −80°C for RNA sequencing and mRNA quantification. Growth data of 15 males and 15 females at each stage (from 5 to 9 months of age) were randomly selected for differential growth analysis. The growth data were tabulated in an EXCEL file to set up the databases, and the data are presented as the mean ± standard error. Analysis of variance (ANOVA) was used to detect differences in the data with SPSS statistical software (SPSS Inc. Chicago, IL, USA, version 22.0). A p-value < 0.05 was considered to be statistically significant. The graphics were drawn using GraphPad Prism 6.0 (GraphPad Software Inc., La Jolla, CA, USA).
In this study, the sex of golden pompano was identified by polymerase chain reaction (PCR) and gonadal sectioning. DNA was extracted from fin samples using the standard phenol-chloroform method. The quality and concentration of the DNA were assessed by 1% agarose electrophoresis and measured with an ultra-trace ultraviolet spectrophotometer (Nanodrop2000). Sex-specific molecular markers were used for PCR amplification to identify the sex of the experimental fish (Zhang et al., 2022). The reaction program for the 20-μL PCR system was 95°C for 20 s, 3 s at 95°C, 30 s at 60°C, and 60 s at 72°C for 35 cycles. The PCR products were detected by 1% agarose electrophoresis. If a specific band appeared, the sample was female (Figure S1). In addition, fixed gonad samples were dehydrated via an ethanol series, infiltrated with xylene, and embedded in paraffin wax. The gonad tissues were serially cut into 6-μm sections using a rotary microtome according to routine procedures, and were stained with hematoxylin and eosin (HE) for histological analysis. The sections were examined on microscope slides to confirm the sex of the experimental fish and analyze the gonadal development status.
The significant differences between the body weights of males and females were determined to identify key time points (Figure 1A). The samples before 7 months of age were defined as the early stage (ES), and the individuals after 7 months of age were defined as the late stage (LS). According to the growth differences between males and females, three females (573.81 ± 23.14 g) and three males (534.33 ± 11.43 g) at the ES (5 months of age) and three females (1234.00 ± 141.63 g) and three males (1031.54 ± 31.29 g) at the LS (9 months of age) were selected for RNA-seq and mRNA expression analyses, respectively (Figure 1B). Total RNA was extracted from the muscle using TRIzol reagent (Invitrogen, Carlsbad, CA, USA). The RNA samples were stored at −80°C.
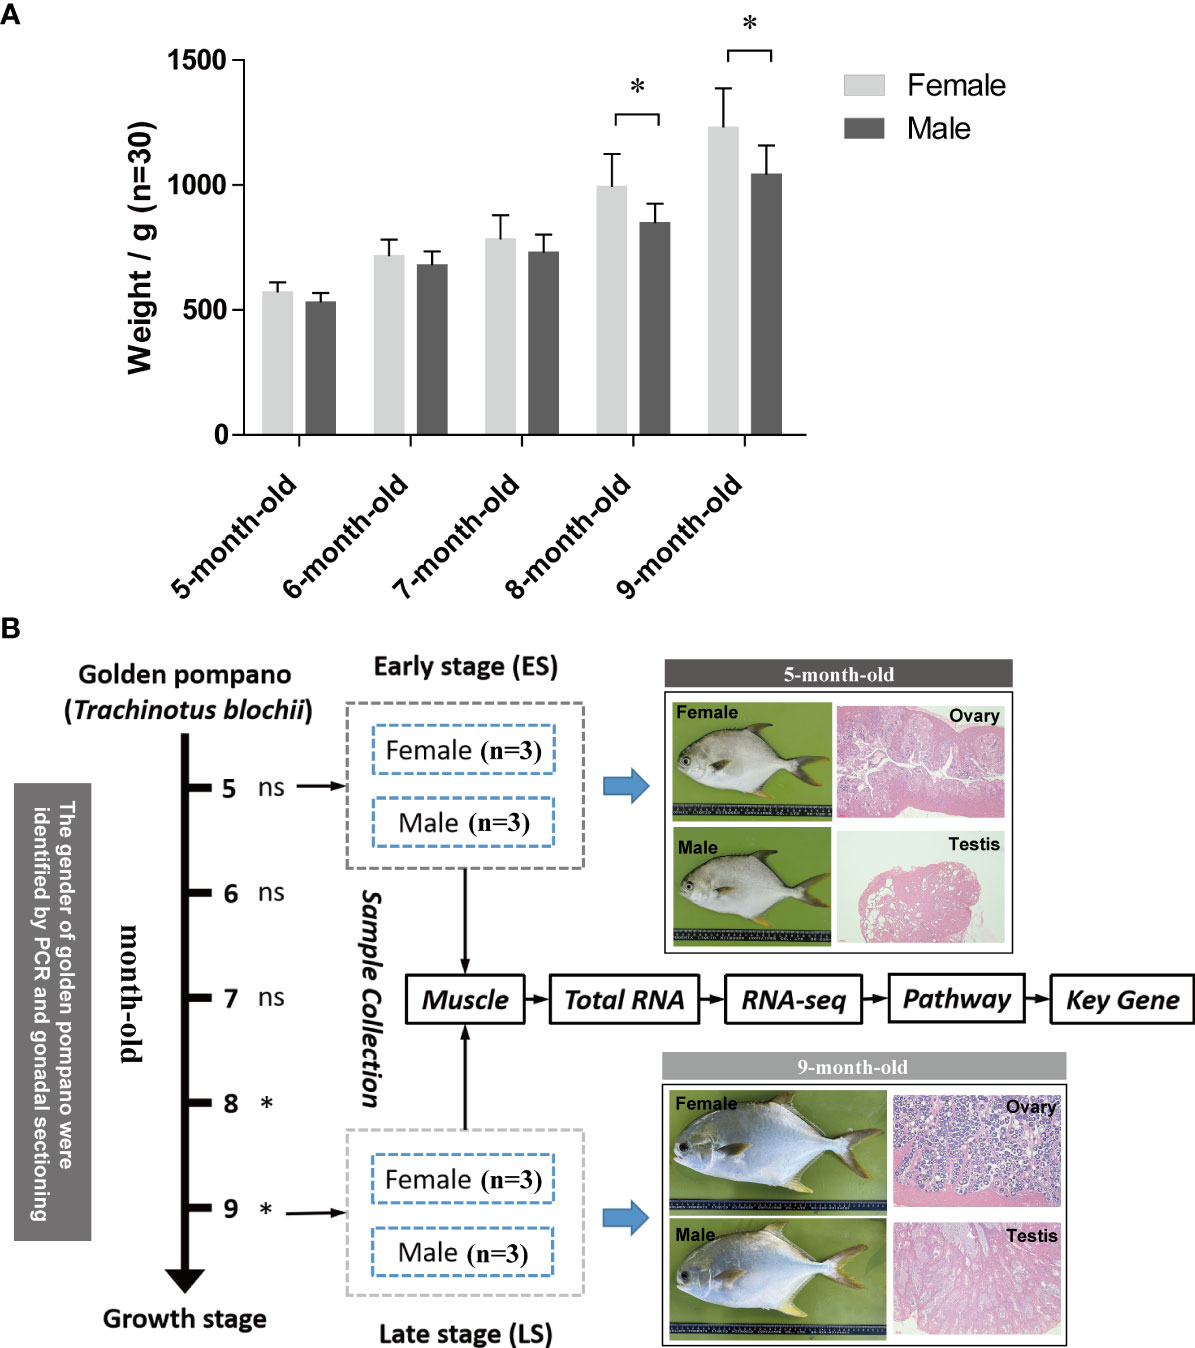
Figure 1 (A) The differences in weight between males and females at different growth stages and (B) the experimental design and technical approach. ns, indicates no significant difference. *indicates a significant difference (p < 0.05).
Six RNA samples (RNA Integrity Number > 8.0, OD 260/280 and 260/230 > 1.8) per stage (three females and three males) were diluted to the same concentration (500 ng/μL). The RNA samples of six females (or males) at the same stage were mixed in pairs to prepare three mixed RNA samples to construct the RNA libraries, respectively. Twelve sequencing libraries were constructed using the TruSeq™ RNA Sample Preparation Kit (Illumina Inc., San Diego, CA, USA). The sequencing was performed by Novogene Co., Ltd. (Beijing, China), and the library was sequenced on an Illumina HiSeq 2500 with 125-bp paired-end reads (Grabherr et al., 2011). The annotation data for all transcribed sequences obtained in this study (including the gene ontology (GO) and KEGG annotation information) were used as background information for the subsequent data analysis (Gotz et al., 2008; Camacho et al., 2009; Sun et al., 2015; Sun et al., 2020).
The read counts were normalized to FPKM. The differential expression analysis was performed using two methods. First, the edgeR software package (version 3.8.2) was used to perform one-way ANOVA (Robinson et al., 2010). Then, MultiExperiment Viewer (MeV v4.8.1) software was used to perform two-factor ANOVA (Saeed et al., 2003). Genes with |log2 (fold change)| > 1 and p < 0.05 were defined as significant DEGs. Based on the obtained background information, GO and KEGG comparisons were performed using the superstoichiometric test to analyze the potential functions of the DEGs. Integrate focal pathways were determined based on the pathway information in the KEGG database and the trend relationships of gene expression (Kanehisa et al., 2017; Sun et al., 2020).
The DEGs were selected for RT-qPCR to determine the accuracy of the sequencing data. The gene primers were designed using Primer5 software based on the obtained sequences. A kit (TianGen® FastKing RT Kit) was used to synthesize cDNA with 1 μg total RNA as the template, and the SYBR Green PCR Master Mix (TaKaRa, Dalian, China) was used for RT-qPCR. The reaction program for the 20-μL PCR system was 95°C for 20 s, 3 s at 95°C, 30 s at TM, and 60 s at 72°C for 40 cycles. All samples were set up with three technical replicates. The 2-ΔΔCT method was used to analyze the gene expression levels (Livak and Schmittgen, 2001), and β-actin expression was used to determine the relative expression of genes. SPSS software (IBM Corp., Armonk, NY, USA, version 22.0) was used to detect differences, and a p-value < 0.05 was considered to be statistically significant.
Female golden pompano specimens were found to be larger than males in the period of 5 to 9 months of age (Figure 1A). The growth difference was statistically significant (p < 0.05) in 8- and 9-month-old fish, yet insignificant in younger fish (5 to 7 months old) (p > 0.05).
The results of the gonadal tissue sections revealed differences in the developmental stages of the male and female gonads. The ovaries of 5-month-old female fish were developed to stage I, and the egg cells were oogonia with large nuclei (Figure 2A). The ovaries of 7-month-old female fish were developed to stage II, and the egg cells developed into early primary oocytes. This stage was characterized by an increase in cell volume and cytoplasmic contents, enhanced basophilic components, and a large nucleolus that was dyed dark blue (Figure 2B). The ovaries of 9-month-old fish remained in stage II, and the developmental status of the egg cells was not significantly different from that in 7-month-old fish (Figure 2C). In addition, the testes were developed to stage I in 5-month-old males, and a large number of primary spermatogonia were observed (Figure 2D). The testes of 7-month-old males were developed to stage II, secondary spermatogonia appeared, and primary spermatocytes were evident (Figure 2E). The testes of 9-month-old males were developed to stage III and spermatids were observed (Figure 2F).
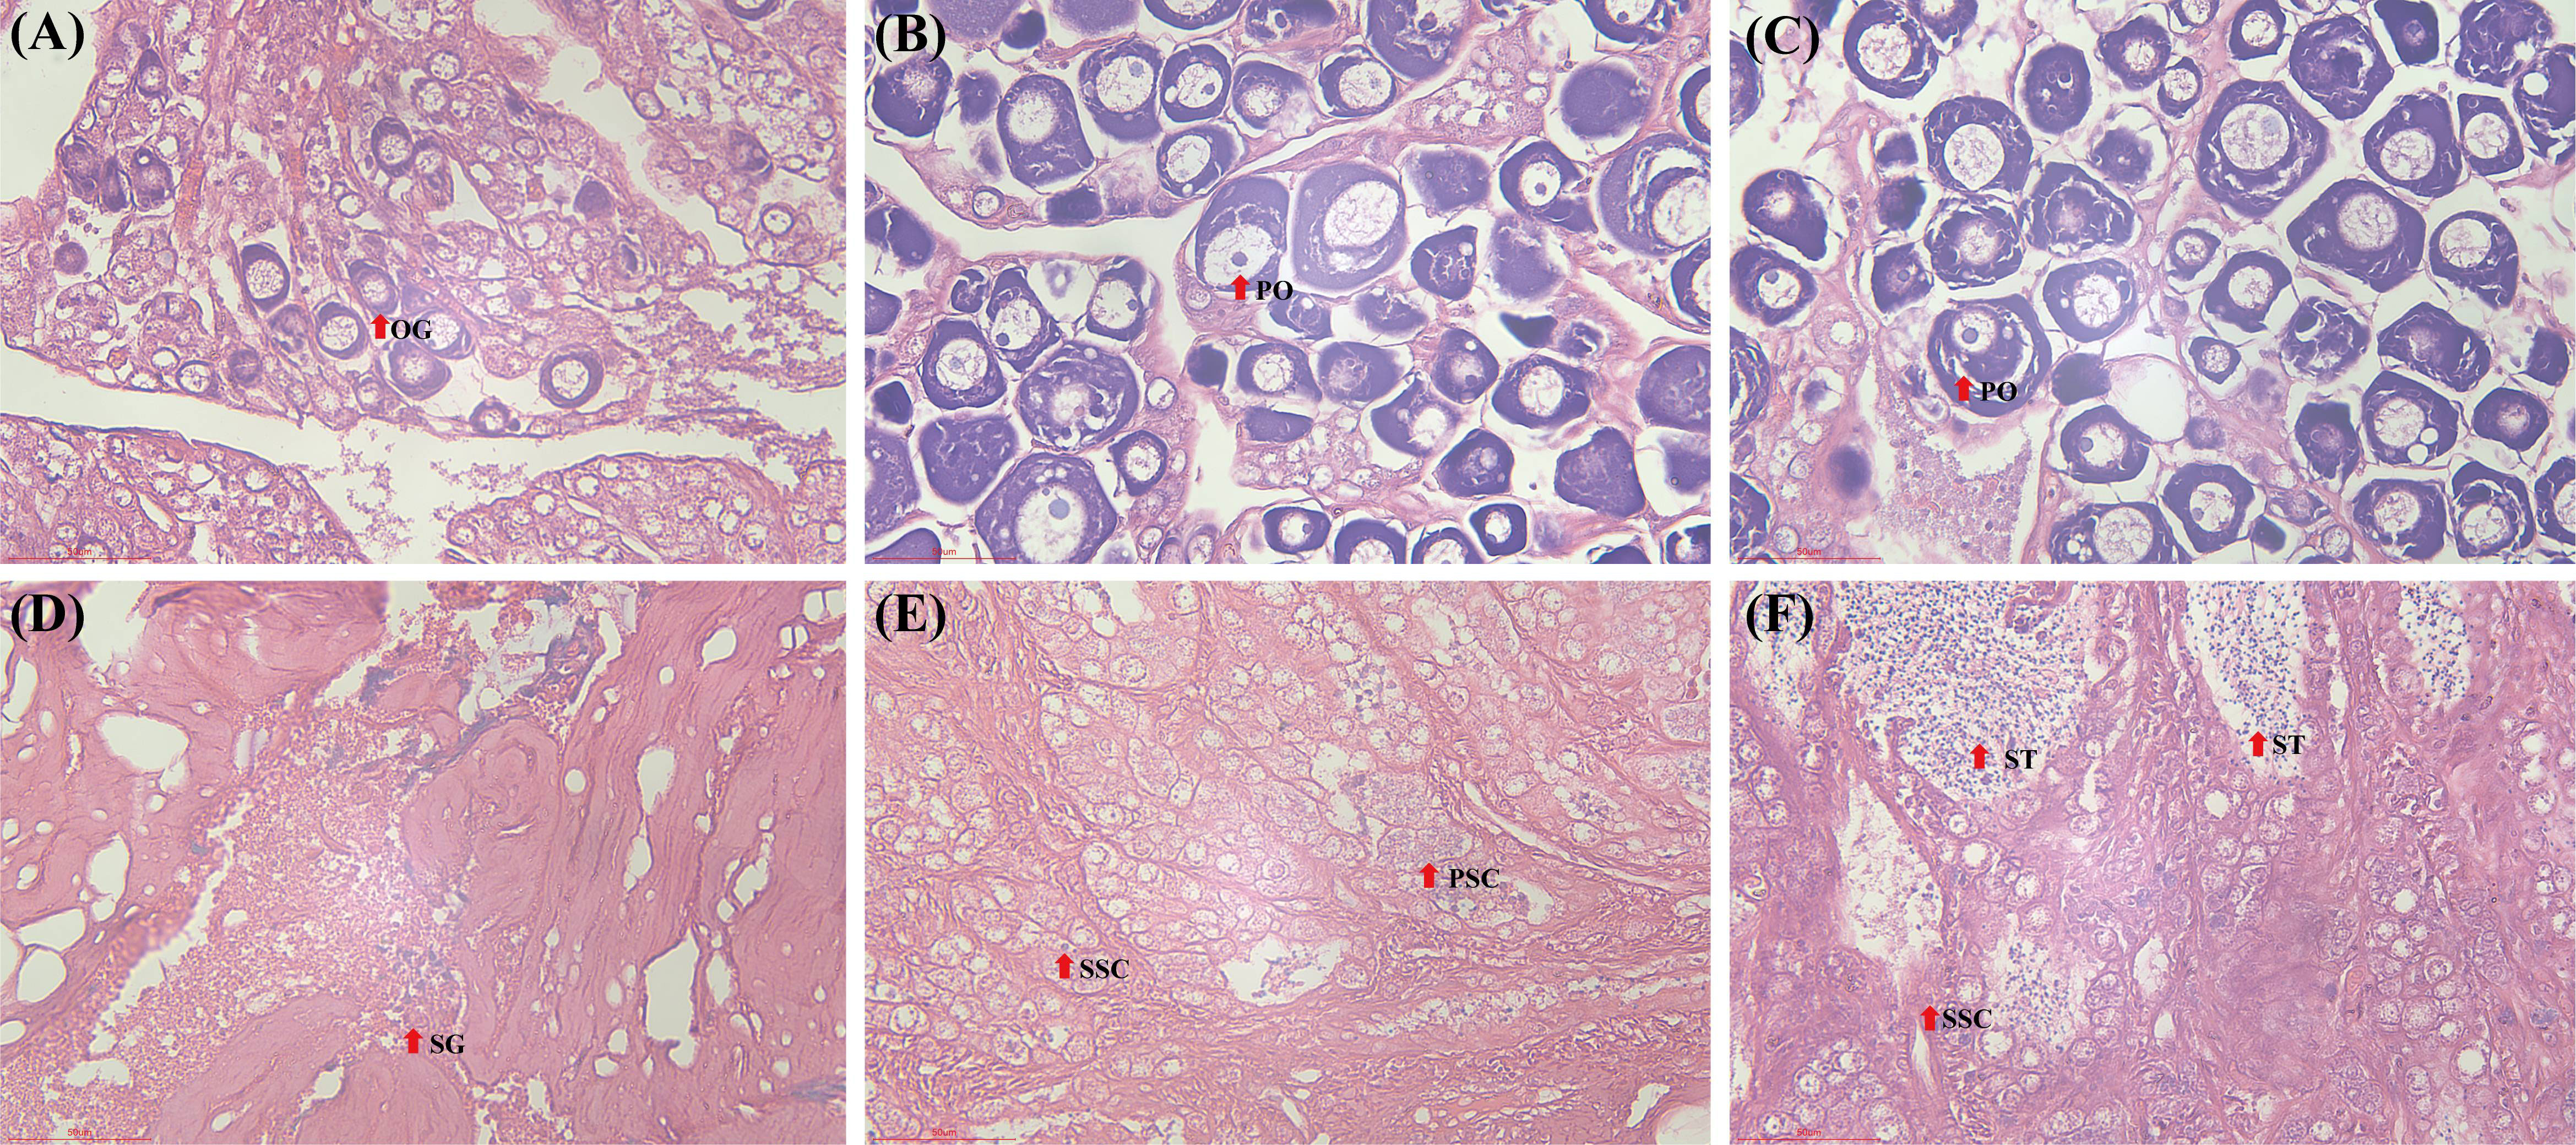
Figure 2 The histological changes of gonads in golden pompano between 5 and 9 months of age. (A) 5-month-old ovary; (B) 7-month-old ovary; (C) 9-month-old ovary; (D) 5-month-old testis; (E) 7-month-old testis; (F) 9-month-old testis; OG, oogonia; PO, primary oocytes; SG: spermatogonia; PSC, primary spermatocytes; SSC, secondary spermatocytes; ST, spermatocytes.
A total of 563.75 (M) raw reads and 545.22 (M) clean reads were obtained from 12 samples, and 80.39% of the clean reads were mapped onto the transcriptome (Table S1). A total of 18,938 unigenes were obtained in this study (Supplementary_1), and the patterns were similar during the ES and LS (Figure 3A). The cluster analysis results showed that the M_Muscle_2_LS sample did not cluster with other corresponding groups. In addition, the PCA analysis results showed that different growth stages were the main factors affecting gene expression, and the M_Muscle_2_LS sample had a higher degree of dispersion (Figures 3B, C); thus, this sample was excluded from the subsequent data analysis.
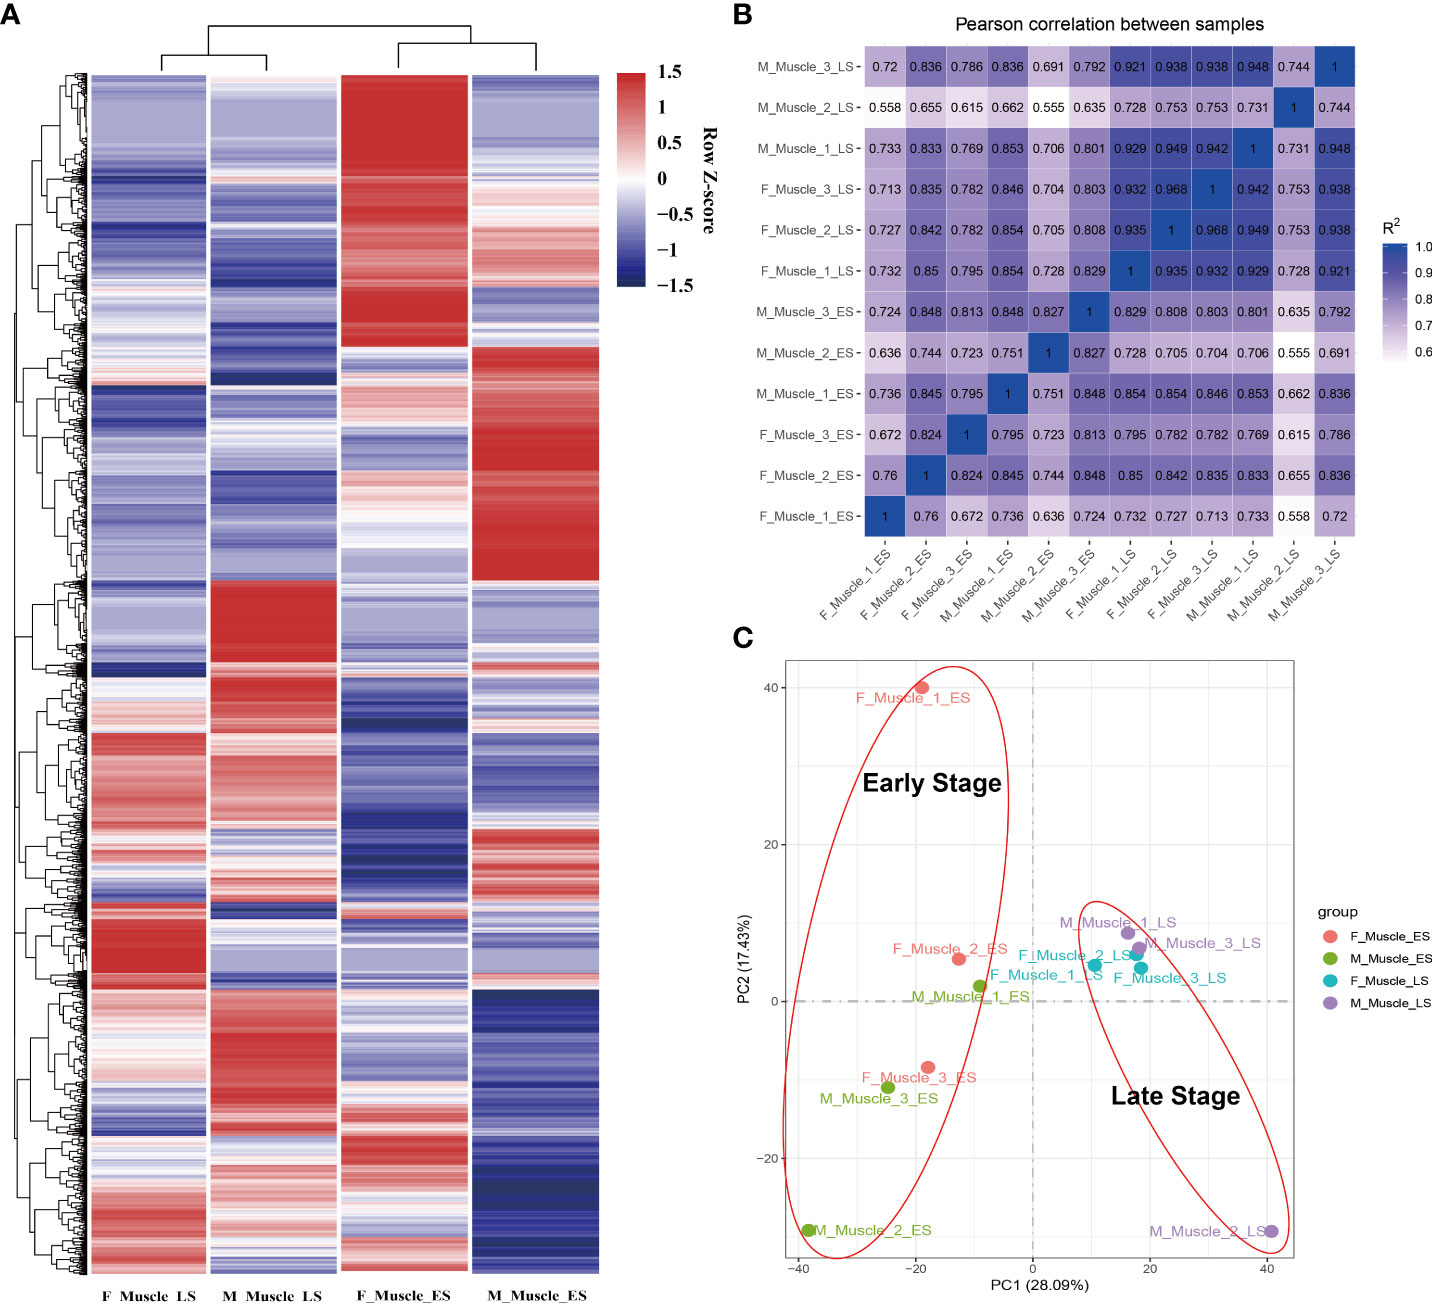
Figure 3 The cluster analysis of the transcript. (A) The analysis was performed based on the FPKM values of all genes in the muscle; the legend shows the row Z-score. (B) The inter-group correlation analysis. (C) The PCA results that distinguish the main factors affecting gene expression.
The KEGG classification analysis of highly expressed genes (FPKM > 100) in female and male muscle samples at different growth stages was performed (Supplementary_1). The results classified 322- and 386-highly expressed genes in the muscle of the F_ES (female during ES) and M_ES (male during ES) samples into 13 and 15 different pathways, respectively (p < 0.05) (Figures 4A–C). The enriched pathways of the highly expressed genes in the muscle of females and males during the ES were similar (Figure 4D), and included two genetic information processing pathways (ribosome and RNA transport), eight metabolic pathways (metabolic pathways, carbon metabolism, glycolysis/gluconeogenesis, biosynthesis of amino acids, fructose and mannose metabolism, pentose phosphate pathway, pyruvate metabolism, and oxidative phosphorylation), and three organismal systems pathways (thermogenesis, retrograde endocannabinoid signaling, and cardiac muscle contraction) (Supplementary_2).
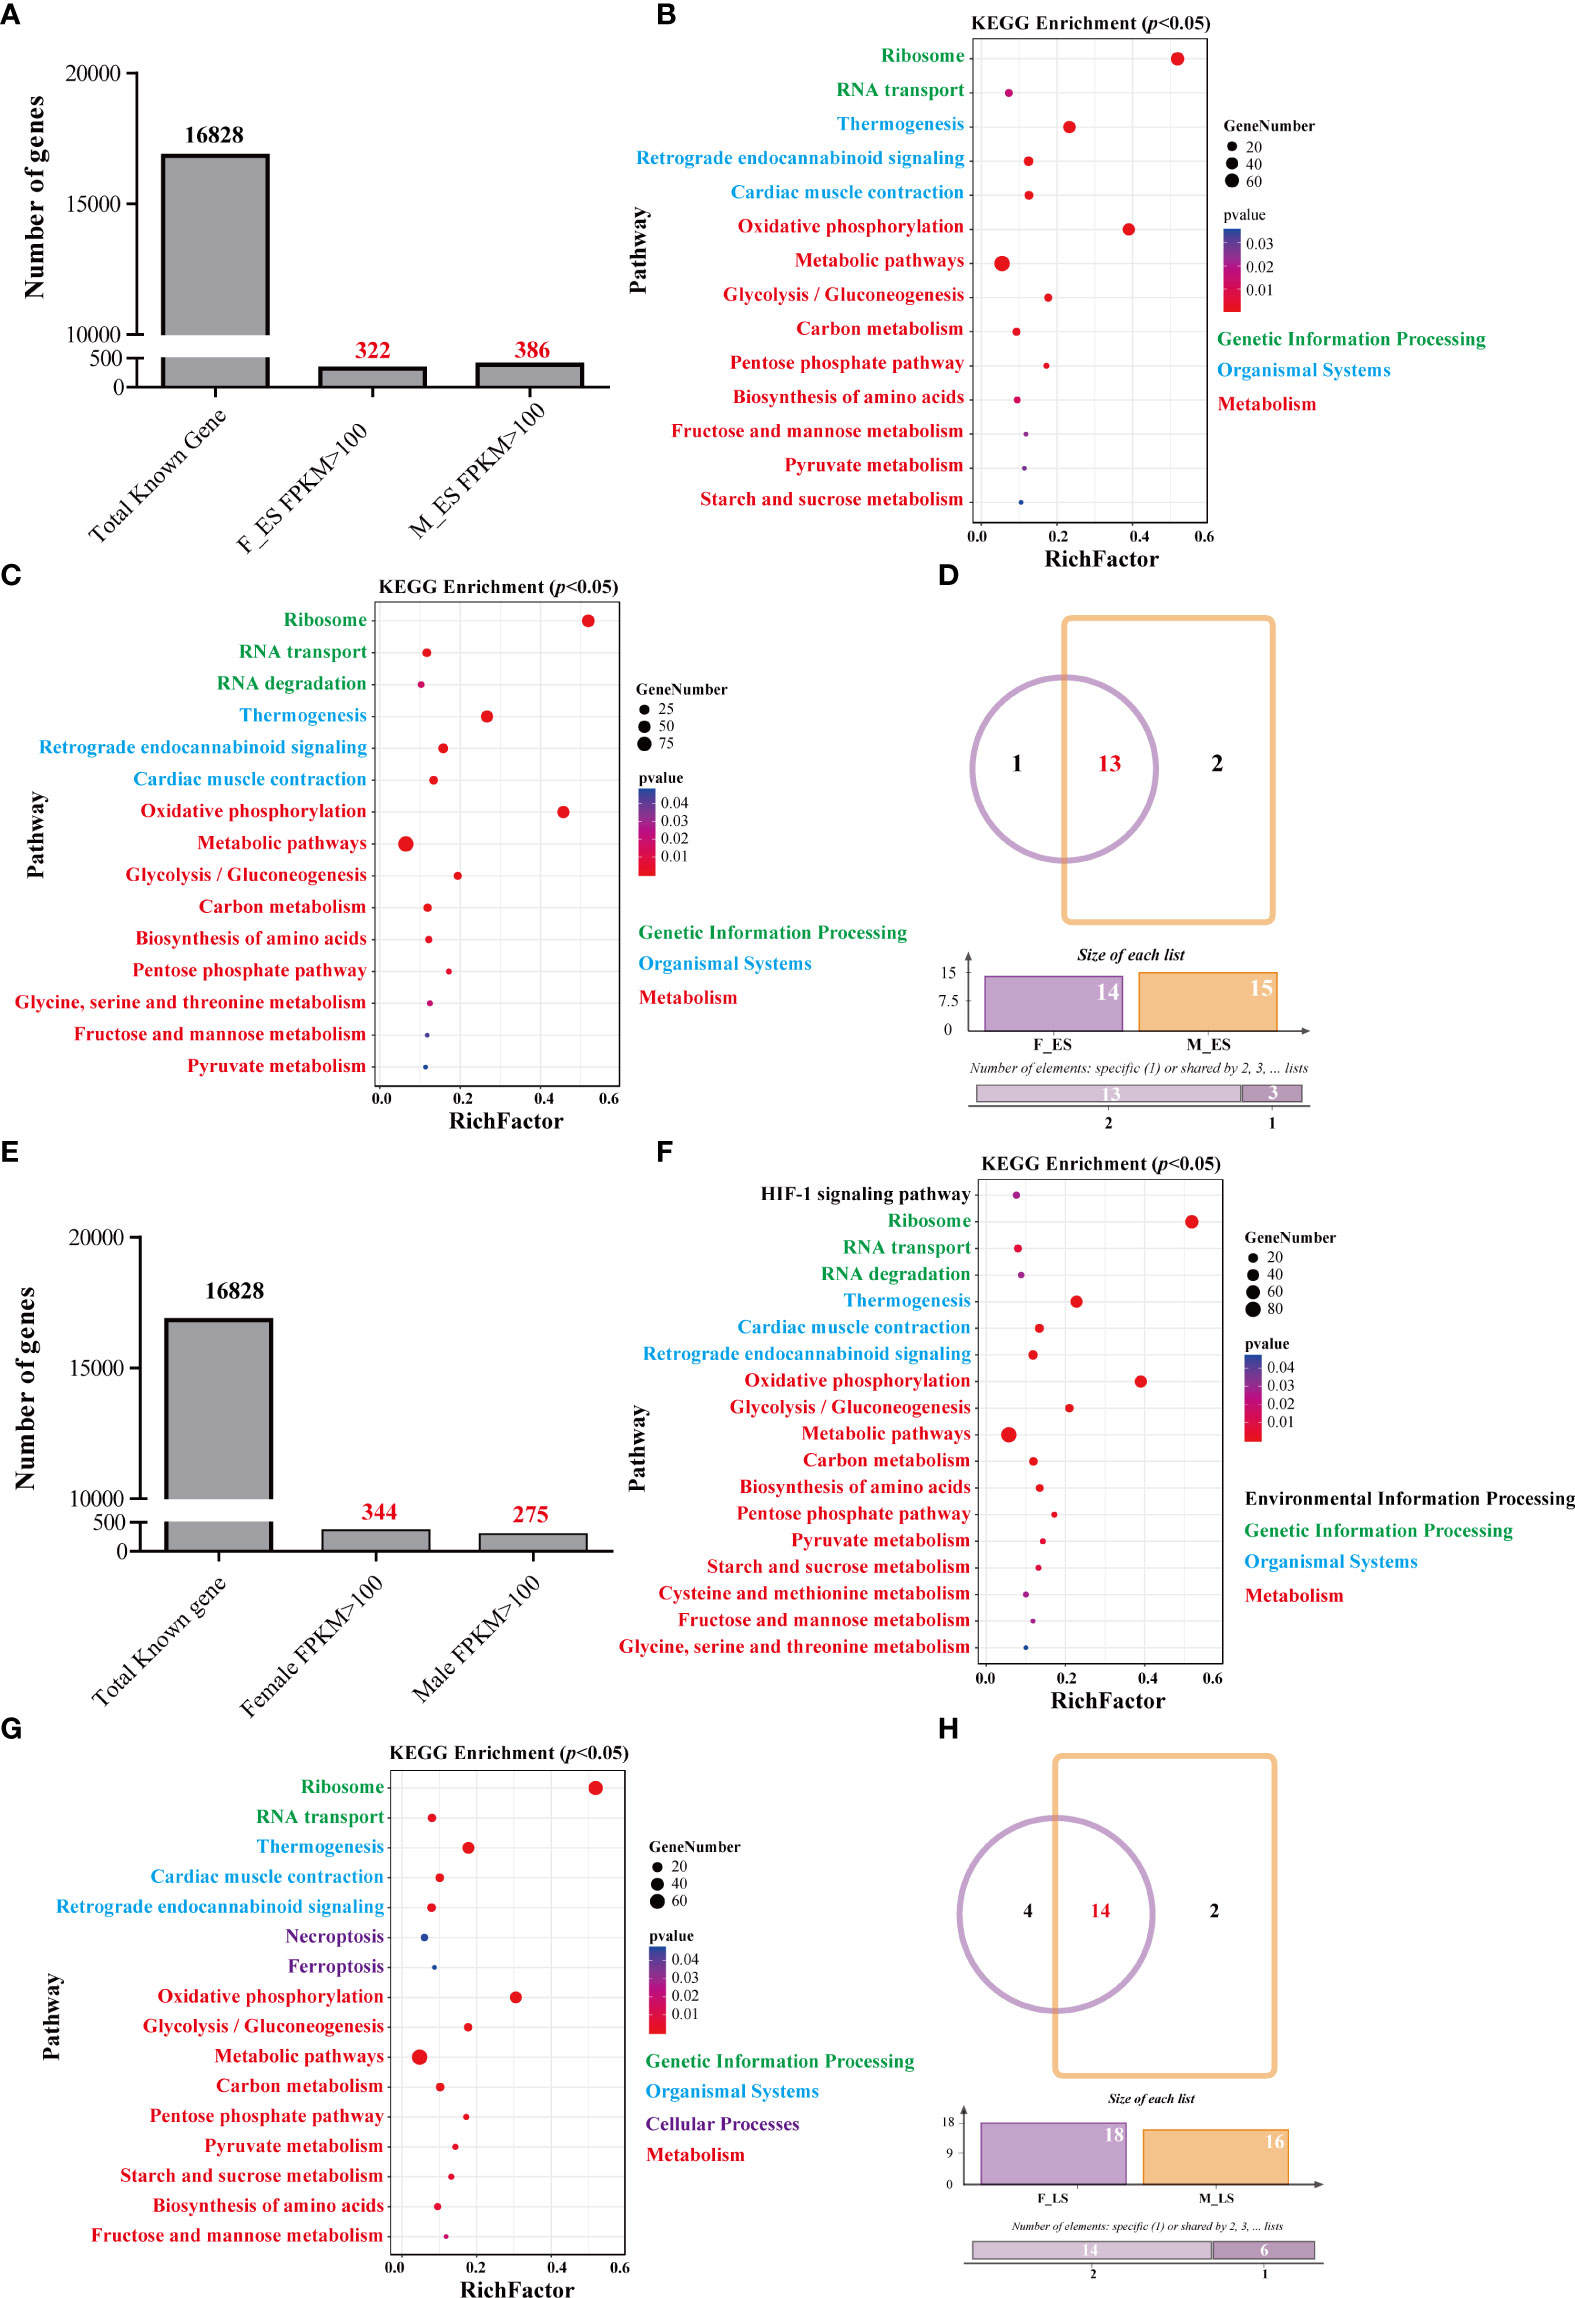
Figure 4 The annotation and function analysis of highly expressed genes. (A) The numbers of highly expressed genes in males and females during the ES. (B) The enrichment pathway of highly expressed genes in females during the ES. (C) The enrichment pathway of highly expressed genes in males during the ES. (D) The Venn diagram of the pathways of highly expressed genes in males and females during the ES. (E) The number of highly expressed genes in males and females during the LS. (F) The enrichment pathway of highly expressed genes in females during the LS. (G) The enrichment pathway of highly expressed genes in males during the LS. (H) The Venn diagram of the pathways of highly expressed genes in males and females during the LS.
The results classified 344 and 275 highly expressed genes in the muscle of the F_LS (female during LS) and M_LS (male during LS) samples into 18 and 16 different pathways, respectively (p < 0.05) (Figures 4E–G). The enriched pathways of the highly expressed genes in the muscle of females and males during the LS were similar (Figure 4H), and included two genetic information processing pathways (ribosome and RNA transport), nine metabolic pathways (oxidative phosphorylation, metabolic pathways, glycolysis/gluconeogenesis, carbon metabolism, biosynthesis of amino acids, pentose phosphate pathway, pyruvate metabolism, starch and sucrose metabolism, and fructose and mannose metabolism), and three organismal systems pathways (thermogenesis, retrograde endocannabinoid signaling, and cardiac muscle contraction) (Supplementary_3).
First, 810 genes were differentially expressed in the muscle of the F_ES and M_ES samples (p < 0.05). Among them, compared with F_ES, 378 genes were up-regulated and 432 genes were down-regulated in M_ES (Figure 5A). This was the basal difference between males and females without growth differences. Second, 3,963 unigenes exhibited significantly different expressions in at least one comparison (F_LS vs. M_LS, F_ES vs. F_LS, and M_ES vs. M_LS) (Figures 5B–E). Two-factor ANOVA was performed (factor 1: the stage with the two levels of ES and LS; factor 2: the sex with the two levels of female and male). The results showed that 4,173 unigenes were affected by factor 1, 1,057 unigenes were affected by factor 2, and 1,171 unigenes were affected by the two-factor interaction (Figure 5F). A total of 4,998 unigenes were affected by at least one factor. In the analysis, to reduce false positives, the basal difference between males and females was excluded, and 2,132 unigenes were finally identified as DEGs (Figure 5G). The results presented in Figure 5H reveal that the males and females had different expression patterns of these DEGs at different stages (Supplementary_4).

Figure 5 The DEGs between the different compared groups. (A, B) Volcano graphs based on the analysis of differential gene expression in the muscle of different sexes in the same period. (C, D) Volcano graphs based on the analysis of differential gene expression in the muscle of the same sex in different periods. (E) The Venn diagram of DEGs in different comparison groups. (F) The Venn diagram of the faltered DEGs in the muscle of the stage (ES and LS), sex (female and male), and interaction (main treatment and main period). (G) The Venn diagrams of the data, illustrating the overlap of three parts (two-factor affected unigenes, DEGs, and basal DEGs) in the muscle in the comparison of different libraries. The red box indicates DEGs that were significantly affected by the two factors (stage and sex). (H) The analysis performed based on the FPKM values of 2132 DEGs in the muscle that were significantly affected by the two factors; the legend shows the row Z-score.
A total of 2,132 unigenes were annotated by GO analysis (Figure S2A). One hundred and twenty-six (126) significantly enriched GO terms were found in biological processes (p < 0.05), such as amide transport (GO:0042886), peptide biosynthetic processes (GO:0043043), peptide transport (GO:0015833), amide biosynthetic processes (GO:0043604), peptide metabolic processes (GO:0006518), cellular amide metabolic processes (GO:0043603), and nitrogen compound transport (GO:0071705). Genes involved in other important biological processes, such as the positive regulation of developmental processes, glutamine metabolic processes, metabolic processes, oxidative phosphorylation, ATP synthesis–coupled electron transport, and the positive regulation of multicellular organismal processes, were also identified (Figure S2B). There were 66 significantly enriched GO terms in the cellular components category (p < 0.05). The major categories represented were cell (GO:0005623), cell part (GO:0044464), intracellular (GO:0005622), intracellular part (GO:0044424), and organelle (GO:0043226) (Figure S2C). There were 39 significantly enriched GO terms for molecular functions (p < 0.05); structural constituents of the ribosome (GO:0003735), structural molecular activity (GO:0005198), oxidoreductase activity (GO:0016491), catalytic activity (GO:0003824), and ion binding (GO:0043167) were the most prominently represented GO terms (Figure S2D) (Supplementary_5).
A total of 2,132 unigenes in the muscle were annotated by KEGG analysis, and 246 enriched pathways were revealed (Figure 6A and Supplementary_6). The results detected 33 enriched pathways (p < 0.05), including environmental information processing, organismal systems, cellular processes, genetic information processing, and metabolism. Among them, the metabolic pathways category contained the largest number of genes, which fell into three main categories: carbohydrate metabolism, lipid metabolism, and amino acid metabolism (Figure 6B). The 17 key pathways related to signaling and metabolism were further analyzed, and the expression patterns of the genes in the key pathways during different stages and in both sexes were compared. Overall, the data presented in Figure 6C show that the 54 unigenes in four signaling pathways (the AMPK, adipocytokine, insulin, and PPAR signaling pathways) had different expression patterns. The 16 unigenes involved in three lipid metabolic pathways, including fatty acid degradation, fatty acid biosynthesis, and the synthesis and degradation of ketone bodies, had different expression patterns (Figure 6C). The 28 unigenes were classified into five glucose metabolic pathways, including propanoate metabolism, glyoxylate and dicarboxylate metabolism, pyruvate metabolism, butanoate metabolism, and the citrate (TCA) cycle, and these genes had different expression patterns (Figure 6C). A total of 49 unigenes were classified into five amino acid metabolic processes, including valine, leucine, and isoleucine degradation, arginine and proline metabolism, arginine biosynthesis, glycine, serine, and threonine metabolism, and cysteine and methionine metabolism (Figure 6C).
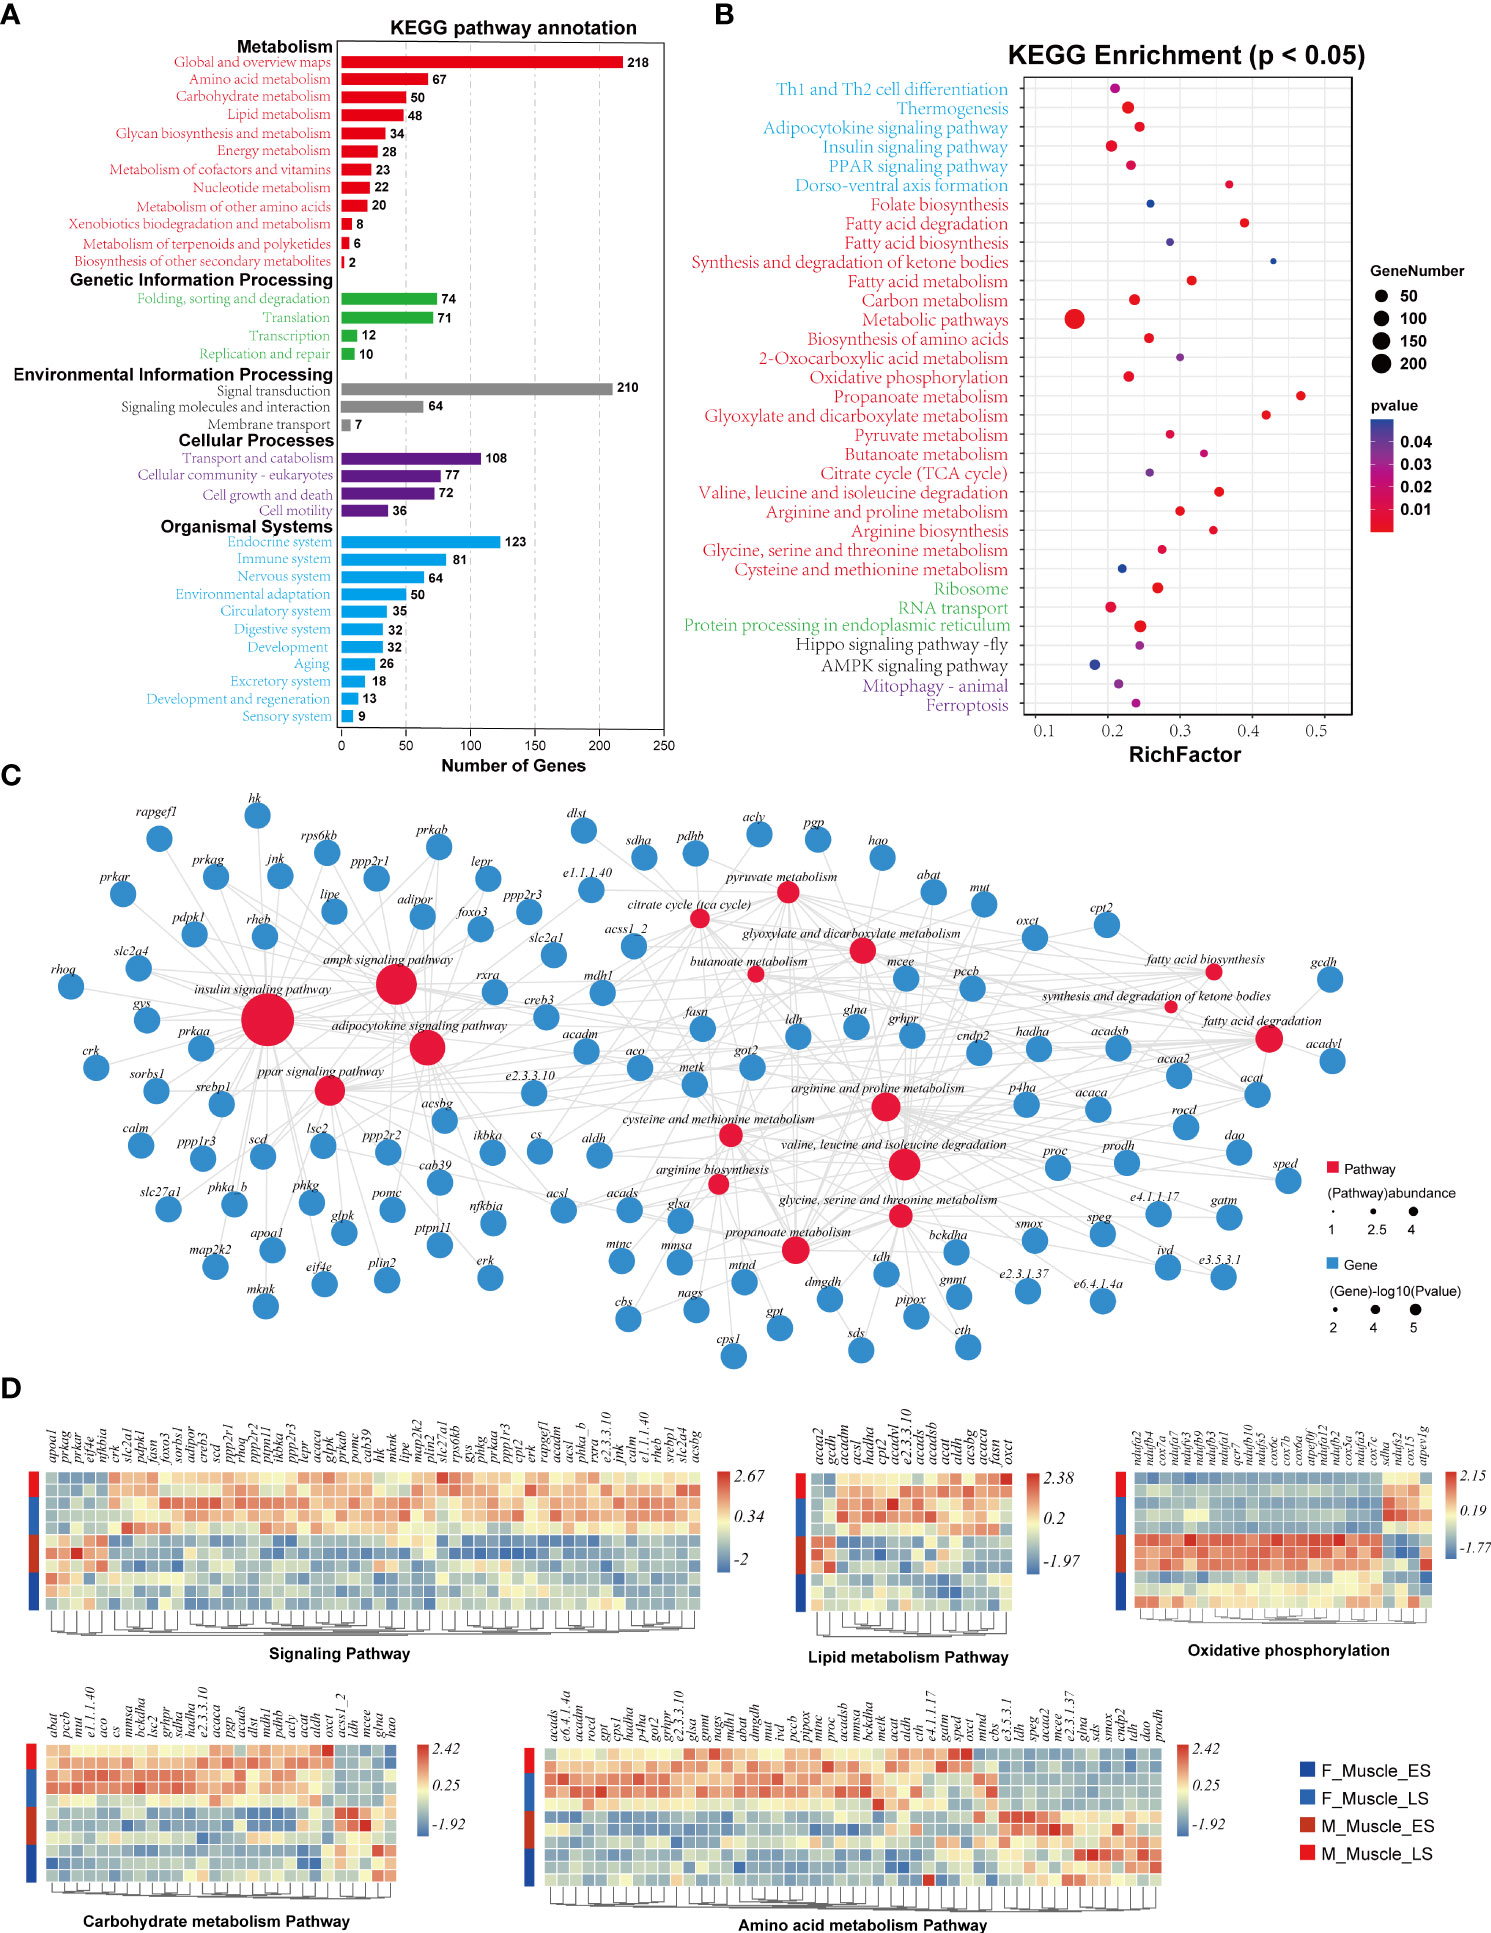
Figure 6 The KEGG enrichment analysis of DEGs. (A) All pathways enriched by the DEGs of the muscle in the different sexes at different stages. (B) The significantly enriched pathways (p < 0.05). (C) The identical DEGs and pathways participating in the muscle of T. blochii. (D) The gene expression patterns in the main pathways in the muscle of T. blochii.
The 18 key pathways, including 17 pathways related to nutrient metabolism and one energy metabolic pathway, were integrated. The same gene in the 17 metabolic pathways was used as a node to create a metabolic network of the 69 genes related to signal transduction, carbohydrate metabolism, lipid metabolism, and amino acid metabolism (Figure S3). There were 13 genes involved in the signaling pathways, including adipor, prkaa, prkab, lepr, nfkbia, lipe, ppp1r3, srebp1, pdpk1, jnk, rxra, and glpk. There were eight glucose metabolic genes (glut1, glut4, hk, gys, ldh, phdb, acss1_2, and ladh) and 13 lipid metabolic genes (slc27a1, fasn, acaca, apoa1, acsl, acsbg, acaa2, E2.3.3.10, acadm, acadvl, hadh, oxct, and cpt2) in the metabolic network. Additionally, the metabolic network revealed that amino acid metabolism involved 10 different amino acids, including three essential amino acids (leucine, valine, and isoleucine) and seven non-essential amino acids (serine, cysteine, glutamine, glycine, arginine, ornithine, and proline). The key genes involved in amino acid metabolism were acadm, acads, gatm, glna, glsa, dao, cps1, e3.5.3.1, got2, and cndp2. In addition, 24 genes were involved in oxidative phosphorylation, which was the only significantly enriched energy metabolic pathway (Figure 6D).
Twenty-two genes were selected for RT-qPCR, and the primers are reported in Table 1. The RT-qPCR results revealed a significant positive correlation with the RNA-seq results (p < 0.05; Figure S3), confirming the accuracy of the RNA-seq-based transcriptome expression analysis.
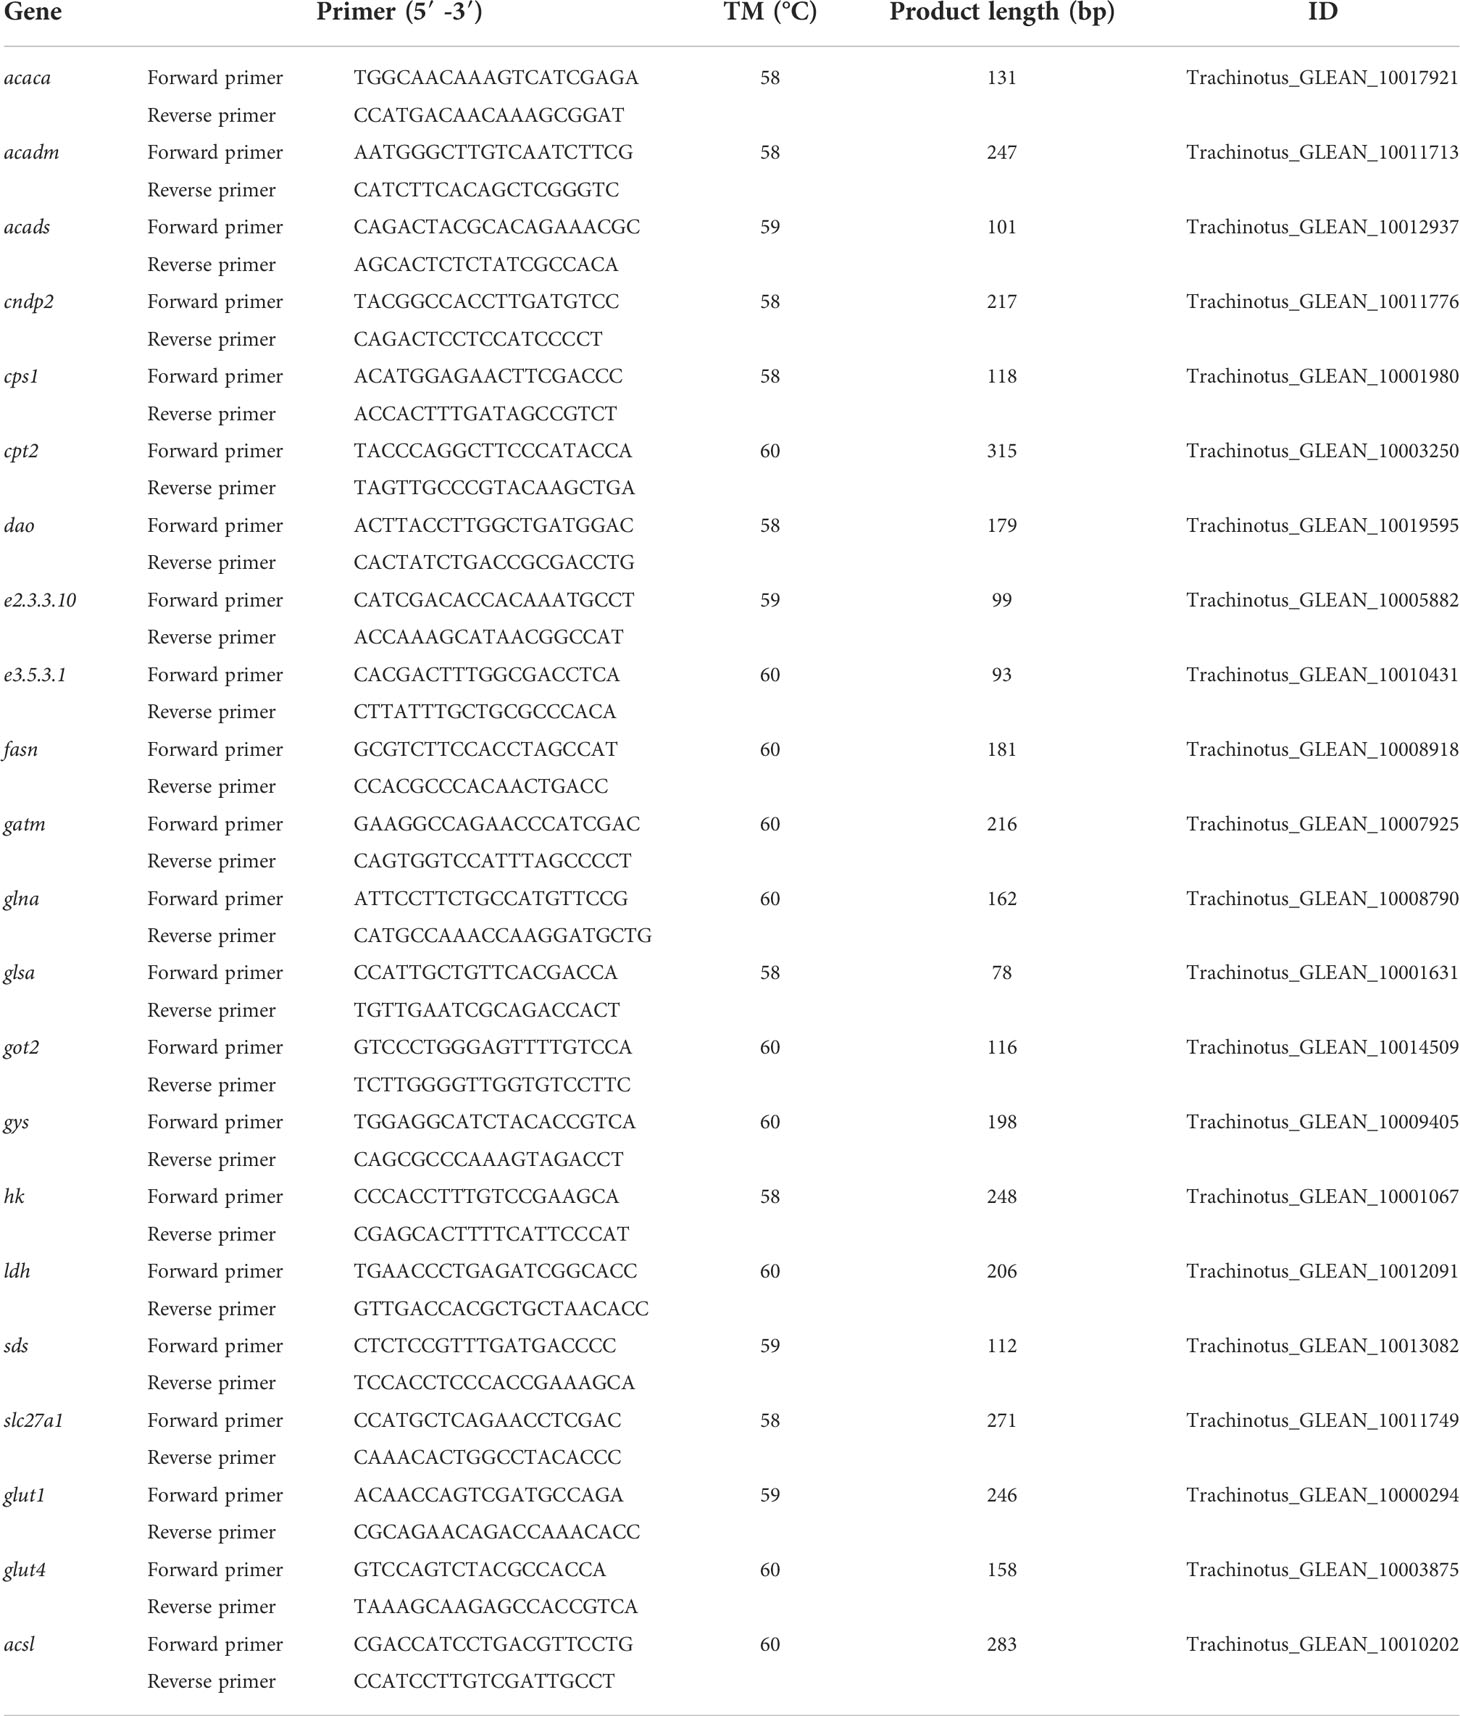
Table 1 Primer information for RT-qPCR.
The expressions of glut1 and glut4 were significantly up-regulated in males and females during the LS as compared to the ES (p < 0.05). No significant difference in glut1 or glut4 expression was observed between males and females during the ES (p > 0.05), but glut1 expression was significantly higher in males than in females during the LS (p < 0.01); however, no significant difference in glut4 expression was detected between males and females during the LS (p > 0.05). No significant difference in hk expression was observed between ES and LS males (p > 0.05). The expression of hk in females was significantly up-regulated during the LS (p < 0.05). However, while hk expression in females was significantly lower than that in males during the ES, the result was just the opposite during the LS (p < 0.05). The expression of gys in males was significantly higher during the LS than during the ES (p < 0.05), but no significant difference in gys expression was observed between females in the ES and LS, and no difference between males and females was detected at different stages (p > 0.05). Finally, ldh expression was significantly down-regulated during the LS (p < 0.05), and it was significantly higher in males during the ES than during the LS (p < 0.05) (Figure 7A).
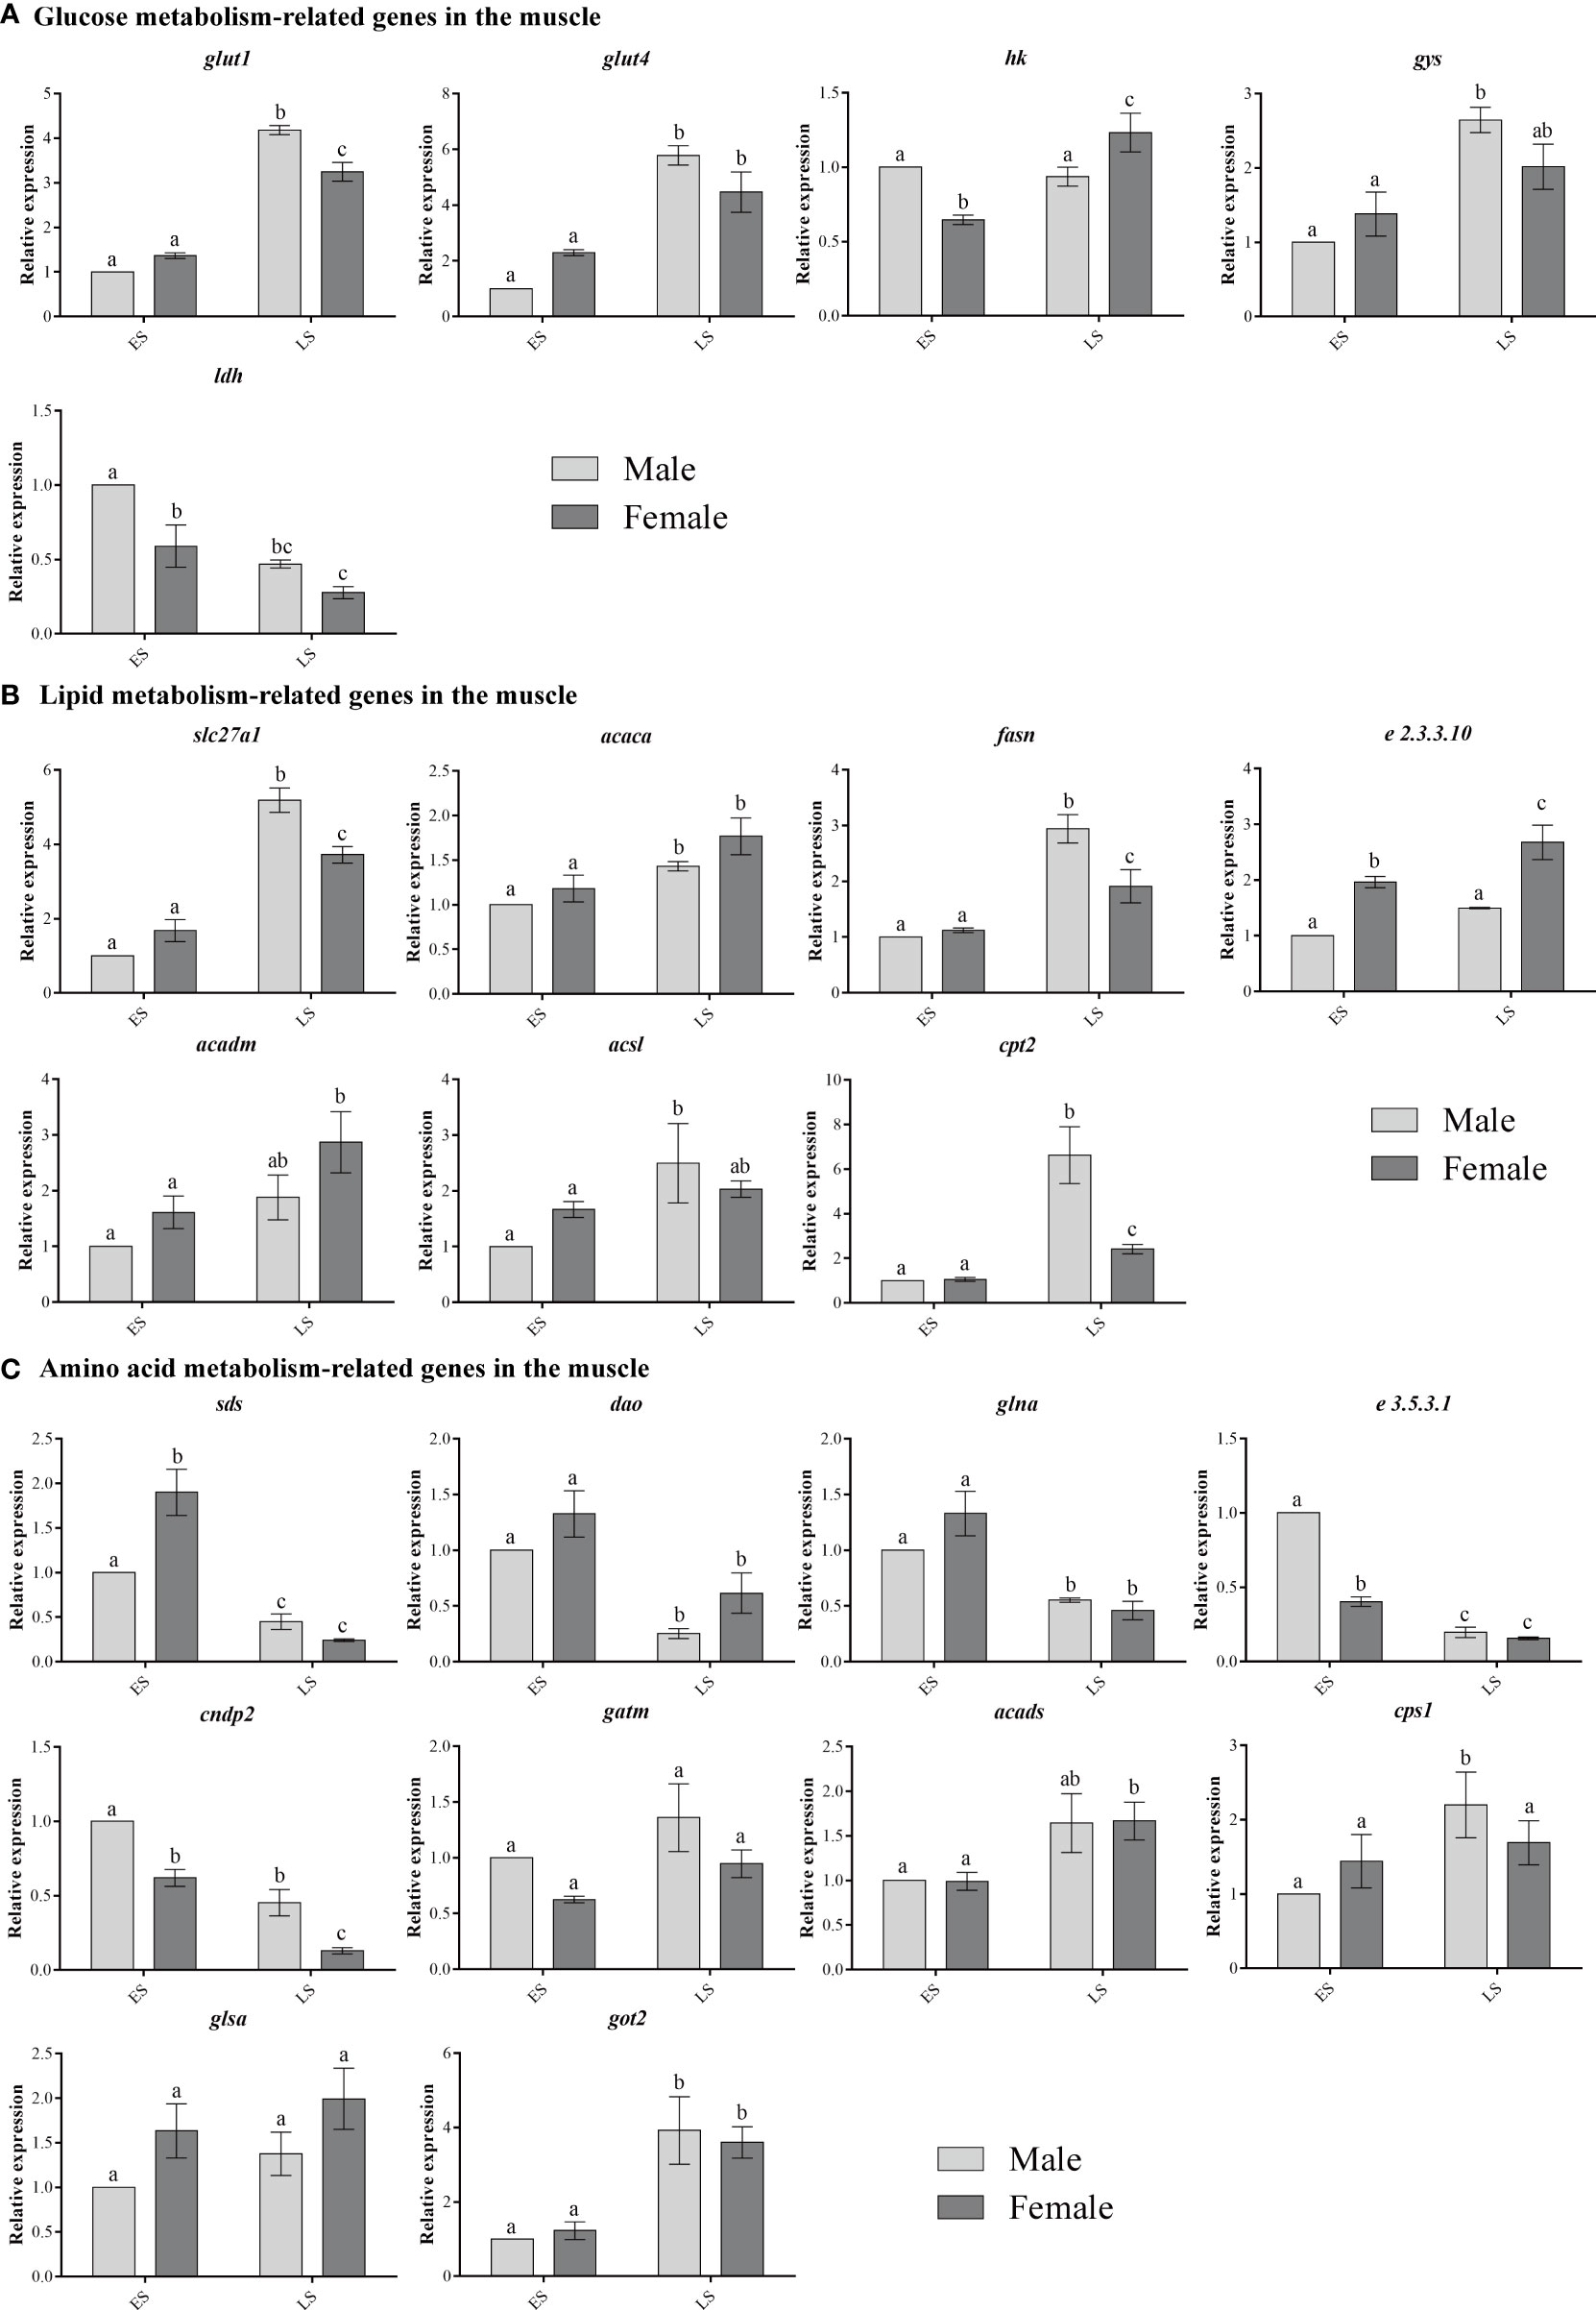
Figure 7 The expression of metabolism-related genes in the muscle. Different lowercase letters for the same sex in different stages and the different sexes in the same stage indicate significant differences (p < 0.05).
The slc27a1 and fasn expression levels in males and females were up-regulated during the LS (p < 0.05). No significant differences in slc27a1 or fasn expression were observed between males and females during the ES (p > 0.05), but slc27a1 and fasn expression in males was higher than that in females during the LS (p < 0.01). The expression levels of acaca and e2.3.3.10 in females were up-regulated during the LS (p < 0.05), and they were higher in females than in males during the LS. However, the e2.3.3.10 expression levels in males in the ES and LS were not significantly different (p > 0.05). The acadm expression level in females was up-regulated during the LS (p < 0.05), and it was higher in females than in males during the LS. The acsl expression level in males was only up-regulated during the LS (p < 0.05). The cpt2 expression levels in males and females were up-regulated during the LS (p < 0.05), and the level was higher in males than in females during the LS (p < 0.01) (Figure 7B).
The expression of sds was higher in females than in males during the ES (p < 0.01), but the sds expression levels in males and females decreased significantly during the LS (p < 0.05), and no significant difference was observed between males and females (p > 0.05). No significant differences in dao or glna expression were observed between males and females during the ES or LS, but dao and glna expression in males and females was down-regulated during the LS (p < 0.05). The expression levels of e3.5.3.1 and cndp2 were lower in females than in males during the ES and LS, but they were decreased in males and females during the LS as compared with the ES (p < 0.05). No significant difference in gatm expression was observed between the sexes or during the different stages (p > 0.05). No significant difference in acads expression was observed between males and females during the ES or LS, but acads expression in females was up-regulated during the LS (p < 0.05). The cps1 expression level in males was up-regulated during the LS (p < 0.05). The glsa expression in females was higher than that in males during both the ES and LS (p > 0.05). No significant difference in got2 expression was observed between males and females during the ES or LS (p > 0.05), but the got2 expression levels in males and females increased during the LS (p < 0.05) (Figure 7C).
Golden pompano is an economically important marine aquaculture species, and its growth rate has received attention as a core trait related to aquaculture production. In this study, the growth differences between male and female fish at different growth stages were compared, and the mRNA expression profiles of female and male golden pompano at two developmental stages were analyzed. This approach helps explain the possible roles that differences in muscle metabolism may play in the growth differences between male and female fish.
For the first time, it was found that the body weights of female golden pompano were 17% higher than those of males at 9 months of age (Figure 1A). Also, while ovarian development was found to stop after 7 months of age, the testes continued to develop (Figure 2). The correlation between gonadal development and growth is well known. Specifically, early gonadal development requires a significant investment of metabolic energy to sustain gametogenesis (Ladisa et al., 2021), and the arrest or regression of gonadal development corresponds with the period of maximum growth (Marchant and Peter, 1986; Mcbride et al., 2015). The transition from the gonadotropin phase to the growth-promoting phase involves a differential allocation of energy to support reproduction and growth (Schneider, 2004). Therefore, it is speculated that the difference between male and female growth in golden pompano after 7 months of age is related to the developmental status of male and female gonads; the continuous development of the testes may consume more energy, while the development of the ovaries is stagnant after 7 months of age, which allows more energy to be allocated to growth (Ladisa et al., 2021). Although the results are relatively simple, they support a negative correlation between gonadal development and muscle metabolism that depends on differences in energy distribution (Ladisa et al., 2021).
According to previous studies, the expression of many genes in the non-gonadal tissues of males and females of the same species is significantly different, which fully demonstrates that non-gonadal organs (especially the liver, fat, and muscle) may play an important role in sexual dimorphism (Yang et al., 2006; Wang et al., 2021). Muscle is an indispensable organ that accounts for about 40% of the overall weight of an animal (Ma et al., 2015). Protein, carbohydrates, and lipid metabolism are vital for muscle growth (Zacharewicz et al., 2013; Huang et al., 2022). In this study, the difference in muscle growth at different growth stages was found to be greater than the difference between the sexes (Figure 3). Therefore, more attention was paid to the gene expression changes in muscle. The expression differences of the highly expressed genes in the muscle of males and females were first analyzed. The results showed that the pathways of highly expressed genes during the ES and LS in female and male muscle were similar and mainly focused on metabolic pathways (Figure 4), indicating that muscle plays an important role in metabolism (Hers, 1983; Muirhead and Watson, 1992; Zhao et al., 2020). The muscle mRNA expression profiles of 5- to 9-month-old males and females at different stages were somewhat similar (Figure 5H). The AMPK and adipocytokine signaling pathways were significantly up-regulated during the LS (Figure 6D). Previous research has revealed the importance of the AMPK pathway in cell proliferation (Coolican et al., 1997), as serine/threonine kinase extracellular regulated kinase (ERK) activates the substrate to regulate transcription/translation and control the cell cycle (Jones et al., 2001). In this study, the ERK gene was found to be significantly up-regulated during the LS, confirming the role of ERK in the regulation of muscle growth in golden pompano. A cell energy sensor of the regulation of the intracellular nutrition level (i.e., PRKAA) has displayed up-regulated patterns in the muscle during the LS (Gleason et al., 2007). A higher level of the leptin receptor (lepr) may be associated with weight gain during the LS. On the one hand, lepr has been shown to regulate feeding, growth, and energy allocation (El-Tarabany et al., 2020), On the other hand, a high expression of lepr can inhibit fatty acid mobilization (Mankiewicz et al., 2022). These data demonstrate the key role of leptin signaling in lipid and energy mobilization in teleost fish. In conclusion, the AMPK and adipocytokine signaling pathways play important regulatory roles in the muscle growth of golden pompano. In addition, this study also found an increase in the adipocytokine signaling pathway in females. Because the adipocytokine signaling pathway has been shown to control growth and energy metabolism (Lee, 2017), it is speculated that it plays an important role in the growth regulation of golden pompano.
Muscle metabolic differences and energy allocation may be key factors in the growth differences between males and females. Glycolysis is a core metabolic pathway that provides energy for cellular activities, and the expression levels of key genes involved in this pathway (such as gpi, tpi, bpgm, pgk, pk, and ldh) are higher in female muscle tissue than in male muscle tissue (Hers, 1983; Muirhead and Watson, 1992). In the present study, the hk gene, which is involved in glycolysis, was found to remain highly expressed in females during the LS. However, the expression of the glut1, glut4, ldh, and gys genes was significantly lower in females than in males. These data suggest that glucose uptake and glycogen synthesis were inhibited, but that glucose metabolism was enhanced. The previously reported high expression levels of genes encoding glycolysis-related enzymes in female muscle tissues may contribute to sexual size dimorphism (Wang et al., 2021). Changes in glycogen metabolism may be associated with higher levels of GH circulating in fish during the gonadal involution and growth stages (Ma et al., 2020). Moreover, exogenous glucose promotes the transcription of gh and igf genes, indicating the close connection between carbohydrate metabolism and the GH-IGF axis (Riley et al., 2009; Bertucci et al., 2017). In fish, muscle growth is regulated by nutritional factors, particularly fat and amino acids (Bureau et al., 2000; Alami-durante et al., 2018; Canada et al., 2018; Zhao et al., 2019). In this study, the expression levels of several adipose-related genes, including acsl and cpt2, were found to be lower in females than in males during the LS. These adipose-related genes catalyze the rate-limiting steps of mitochondrial fatty acid β-oxidation (McAndrew et al., 2008; Houten and Wanders, 2010; Shua et al., 2018), and may contribute to intramuscular fat development by interacting with other muscle metabolism-related genes, resulting in fattier muscle in females than in 9-month-old males. Additionally, the metabolism of lipids produces more energy than other forms (Sun et al., 2020), and enhanced lipid catabolism in females favors the generation of more energy to allocate for growth. Amino acids are the basic building blocks for all proteins and polypeptides, and are crucial signal transducers. They are key factors for almost all metabolic processes in animals (Layman et al., 2015). The results of the present research show that the catabolism of seven non-essential amino acids and three essential amino acids was enhanced (Figure 8A). Notably, the synthesis of arginine and ornithine and the production of carnosine were inhibited, but the breakdown of glutamine was enhanced. Therefore, because glutamine provides nitrogen for the body, it promotes protein synthesis in muscle cells and promotes the growth and differentiation of muscle cells through cell expansion (Cruzat et al., 2014).
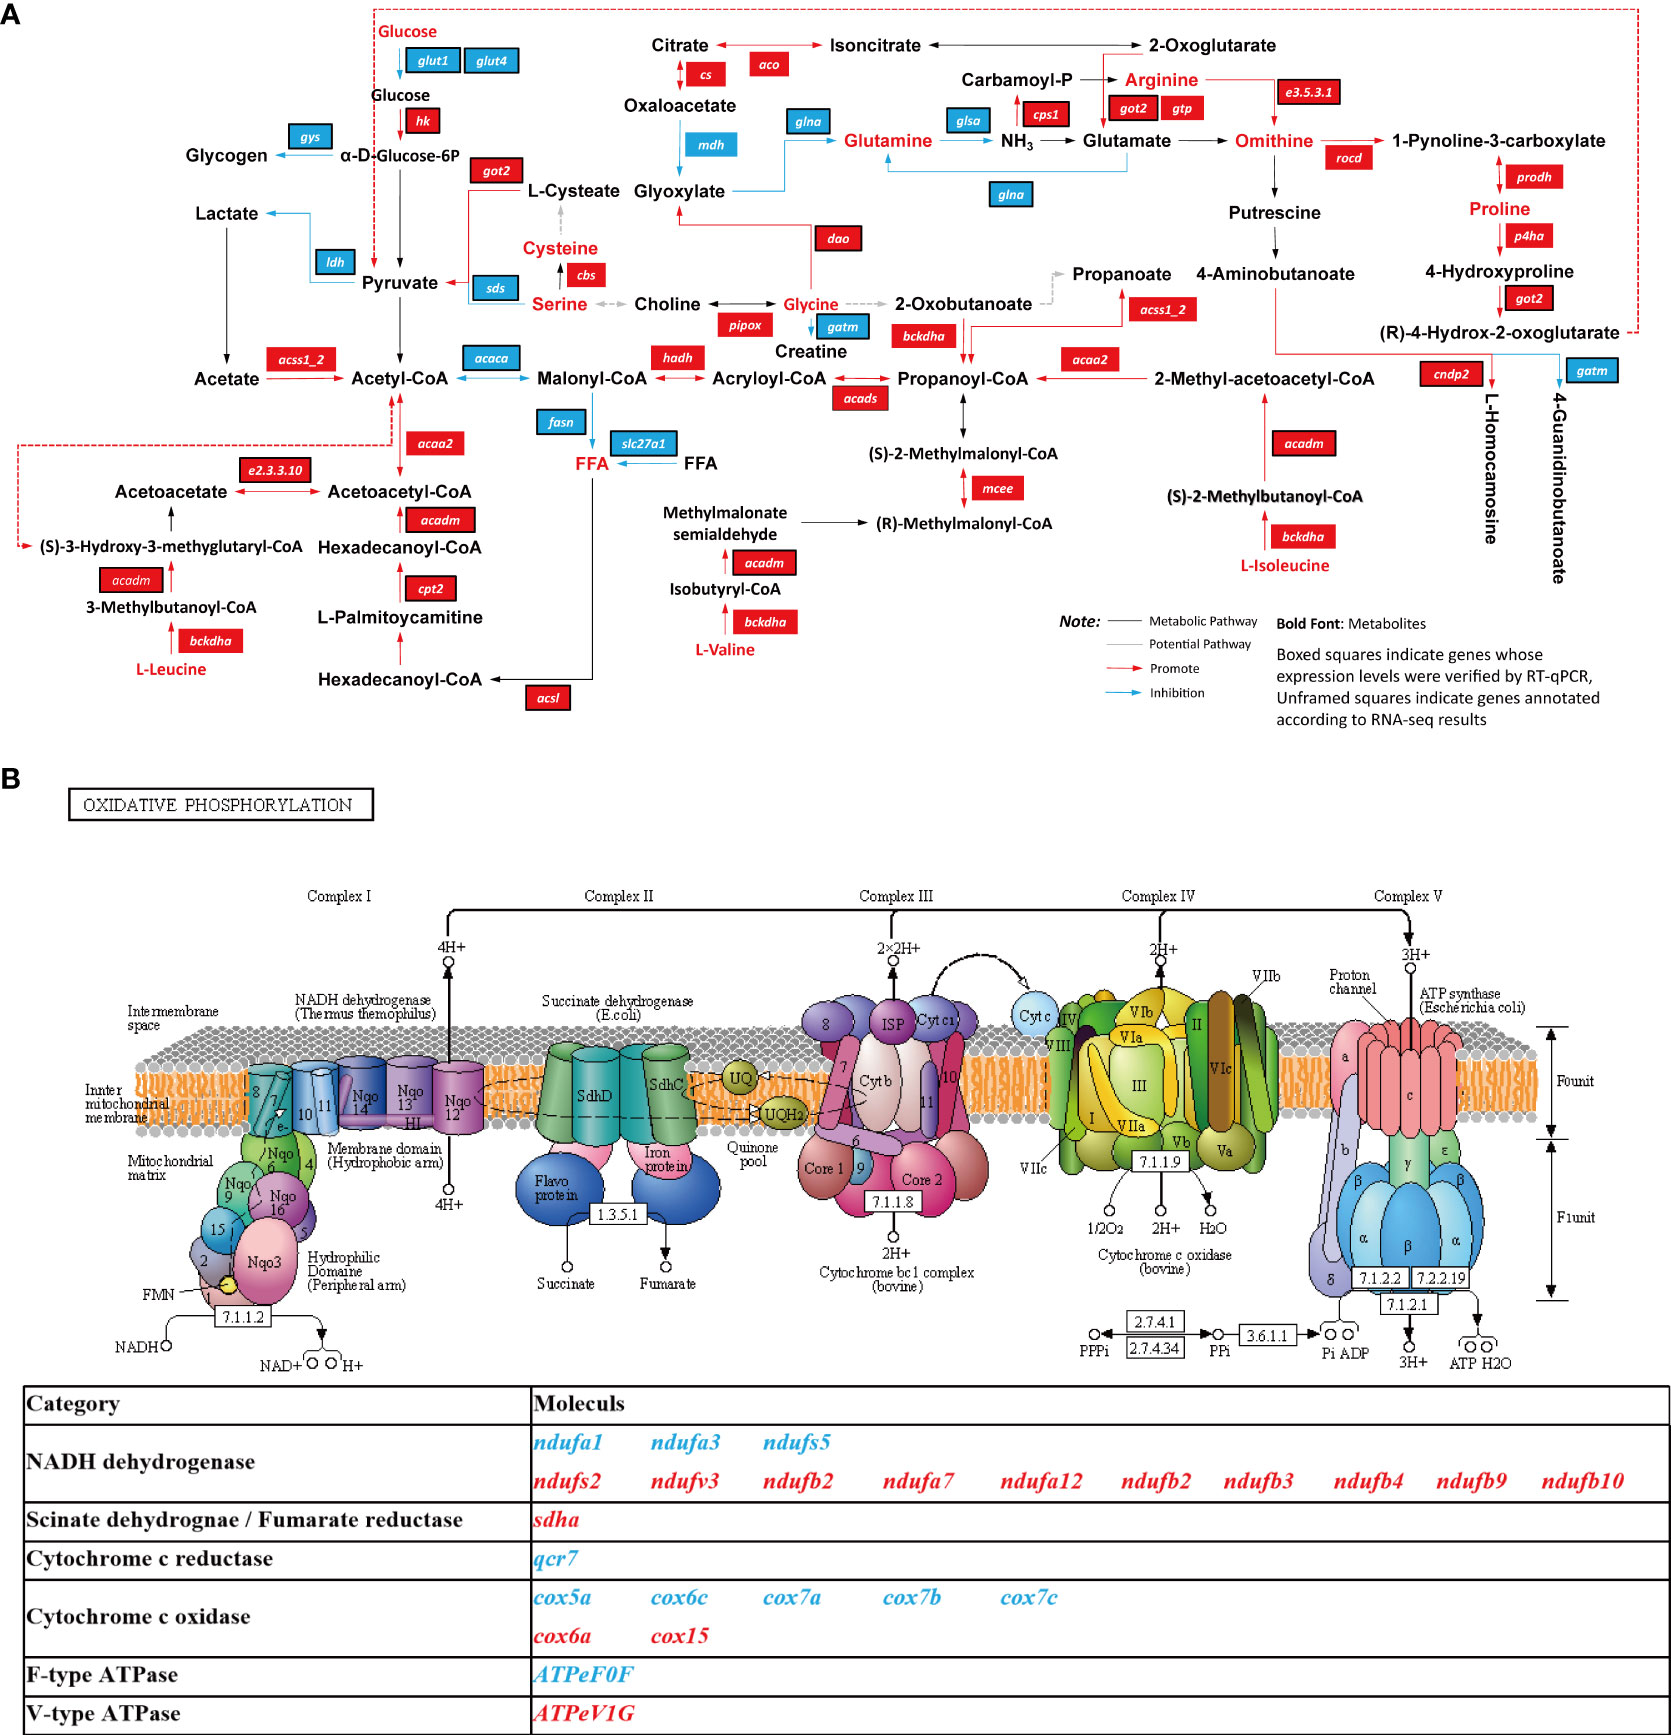
Figure 8 The simplified diagram of the nutrient metabolism and oxidative phosphorylation pathways in the muscle of the females at the LS. (A) The simplified diagram of the nutrient metabolism; (B) oxidative phosphorylation pathways in the muscle. The data were compared with the males at the LS; blue indicates down-regulation and red indicates up-regulation.
In addition, the oxidative phosphorylation (OXPHOS) pathway was found to be significantly down-regulated in the muscle of 9-month-old males and females (Figure 6D), and a significant difference was observed between males and females (Figure 8B). Mitochondrial OXPHOS is a crucial process for energy homeostasis in all types of cells, including myofibers under various physiological conditions (Jarmuszkiewicz et al., 2015). Strikingly, 12 highly expressed genes in females (i.e., ndufs2, ndufv3, ndufa2, ndufa12, ndufb3, ndufb4, ndufb9, ndufb10, sdha, cox6a, cox15, and ATPeV1G) are members of the OXPHOS pathway. These genes increase proton yield and electron transfer efficiency, ultimately generating ATP through the ATPeV1G enzyme (Dietz et al., 2001). This suggests that females have higher rates of energy metabolism in certain pathways.
The results support a negative correlation between gonadal development and muscle metabolism that depends on differences in energy distribution. The AMPK and adipocytokine signaling pathways play an important regulatory role in the muscle growth and metabolism of golden pompano. Muscle metabolic differences and energy allocation may be the key factors in the growth differences between males and females. Specifically, the metabolism of glucose, and amino acids in females was found to be up-regulated, and OXPHOS ability was found to be stronger in females after reaching 7 months of age. This may be why golden pompano females displayed better growth performance after reaching 7 months of age. Most importantly, for the first time, sexual size dimorphism was detected in golden pompano. Although this study cannot completely account for all the metabolic pathways involved in the sexual size dimorphism of golden pompano, it provides a clear direction for future research.
All data generated and analyzed during this study are included in this published article. The original data has been uploaded to the NCBI SRA database, the accession is PRJNA839564, https://www.ncbi.nlm.nih.gov/bioproject/PRJNA839564.
The animal study was reviewed and approved by Institutional Animal Care and Use Committee (IACUC) of the College of Ocean of Hainan University, Hainan, China.
JS, FS and JL conceived and designed the experiments; LW, WZ and YC finished the rearing and stressing experiments; JS performed data analysis; LW performed the validation experiments; JS wrote the paper; FS, LZ and JL assisted with writing and proofreading; JG and FS assisted proofreading.
This work was supported by the Hainan Province Natural Science Foundation of China (322QN236), the National Natural Science Foundation of China (NO.32160862), and the project of Hainan Yazhou Bay Seed Laboratory (B21HJ0105).
The authors were grateful to all the laboratory members for continuous technical advice and helpful discussion.
YC is employed by Hainan Blue Granary Technology Co., Ltd.
The remaining authors declare that the research was conducted in the absence of any commercial or financial relationships that could be construed as a potential conflict of interest.
All claims expressed in this article are solely those of the authors and do not necessarily represent those of their affiliated organizations, or those of the publisher, the editors and the reviewers. Any product that may be evaluated in this article, or claim that may be made by its manufacturer, is not guaranteed or endorsed by the publisher.
The Supplementary Material for this article can be found online at: https://www.frontiersin.org/articles/10.3389/fmars.2022.1009896/full#supplementary-material
Alami-durante H., Bazin D., Cluzeaud M., Fontagné-Dicharry S., Kaushik S., Geurden I. (2018). Effect of dietary methionine level on muscle growth mechanisms in juvenile rainbow trout (Oncorhynchus mykiss). Aquaculture. 483, 273–285. doi: 10.1016/j.aquaculture.2017.10.030
Beardmore J. A., Mair G. C., Lewis R. I. (2001). Monosex male production in fin-fish as exemplified by tilapia: applications, problems, and prospects. Aquaculture. 197, 283–301. doi: 10.1016/S0044-8486(01)00590-7
Bertucci J. I., Blanco A. M., Canosa L. F., Unniappan S. (2017). Direct actions of macronutrient components on goldfish hepatopancreas in vitro to modulate the expression of ghr-I, ghr-II, igf-I and igf-II mRNAs, gen. Comp. Endocrinol. 250, 1–8. doi: 10.1016/j.ygcen.2017.05.014
Bureau D. P., Azevedo P. A., Tapia-Salazar M., Cuzon G. (2000). Pattern and cost of growth and nutrient deposition in fish and shrimp: potential implications and applications Vol. 19 (Mérida, Yucatán, Mexico: Avances en Nutrición Acuícola V. Memorias del V Simposium Internacional de Nutrición Acuícola), 111–140.
Bye V. J., Lincoln R. F. (1986). Commercial methods for the control of sexual maturation in rainbow trout (Salmo gairdneri r). Aquaculture. 57, 299–309. doi: 10.1016/0044-8486(86)90208-5
Camacho C., Camacho C., Coulouris G., Avagyan V., Ma N., Jason Papadopoulos J., et al. (2009). BLAST+: architecture and applications. BMC Bioinf. 10, 421. doi: 10.1186/1471-2105-10-421
Canada P., Engrola S., Mira S., Teodósio R., Yust M. M., Sousa V., et al. (2018). Larval dietary protein complexity affects regulation of muscle growth and expression of DNA methyltransferases in Senegalese sole. Aquaculture. 491, 28–38. doi: 10.1016/j.aquaculture.2018.02.044
Carnevali O., Vivo L. D., Sulpizio R., Gioacchini G., Olivotto I., Silvi S., et al. (2006). Growth improvement by probiotic in European sea bass juveniles (Dicentrarchus labrax, l.), with particular attention to IGF-1, myostatin and cortisol gene expression. Aquaculture. 258, 430–438. doi: 10.1016/j.aquaculture.2006.04.025
Chen S., Zhang G., Shao C., Huang Q., Liu G., Zhang P., et al. (2014). Whole-genome sequence of a flatfish provides insights into ZW sex chromosome evolution and adaptation to a benthic lifestyle. Nat. Genet. 46, 253–260. doi: 10.1038/ng.2890
China Golden Pompano Industry Development Report (2020). Available at: http://www.china-cfa.org/fzjgdt/2020/1222/511.html.
Coolican S. A., Samuel D. S., Ewton D. Z., McWade F. J., Florini J. R. (1997). The mitogenic and myogenic actions of insulin-like growth factors utilize distinct signaling pathways. J. Biol. Chem. 272, 6653–6662. doi: 10.1074/jbc.272.10.6653
Cruzat V. F., Pantaleão L. C., Donato J., de Bittencourt P. I. H., Tirapegui J. (2014). Oral supplementations with free and dipeptide forms of l-glutamine in endotoxemic mice: effects on muscle glutamine-glutathione axis and heat shock proteins. J. Nutr. Biochem. 25, 345–352. doi: 10.1016/j.jnutbio.2013.11.009
Dean R., Mank J. E. (2014). The role of sex chromosomes in sexual dimorphism: discordance between molecular and phenotypic data. J. Evol. Biol. 27, 1443–1453. doi: 10.1111/jeb.12345
Degani G., Tzchori I., Yom-Din S., Goldberg D., Jackson K. (2003). Growth differences and growth hormone expression in male and female European eels [Anguilla anguilla (L.)]. Gen. Comp. Endocrinol. 134, 88–93. doi: 10.1016/S0016-6480(03)00238-7
Dietz K. J., Tavakoli N., Kluge C., Mimura T., Sharma S. S., Harris G. C., et al. (2001). Significance of the V-type ATPase for the adaptation to stressful growth conditions and its regulation on the molecular and biochemical level. J. Exp. Bot. 363 (363), 1969–1980. doi: 10.1093/jexbot/52.363.1969
Ducrest A. L., Keller L., Roulin A. (2008). Pleiotropy in the melanocortin system, coloration and behavioral syndromes. Trends Ecol. Evol. 23, 502–510. doi: 10.1016/j.tree.2008.06.001
El-Tarabany M. S., Saleh A. A., El-Araby I. E., El-Magd M. A. (2020).Association of LEPR polymorphisms with egg production and growth performance in female Japanese quails. Anim. Biotechnol. 1–13. doi: 10.1080/10495398.2020.1812617
Gleason C. E., Lu D., Witters L. A., Newgard C. B., Birnbaum M. J. (2007). The role of AMPK and mTOR in nutrient sensing in pancreatic beta-cells. J. Biol. Chem. 282 (14), 10341–10351. doi: 10.1074/jbc.M610631200
Gomez J. M., Weil C., Ollitrault M., Bail P. L., Breton B., Gac F. L. (1999). Growth hormone (GH) and gonadotropin subunit gene expression and pituitary and plasma changes during spermatogenesis and oogenesis in rainbow trout (Oncorhynchus mykiss). Gen. Comp. Endocrinol. 113 (3), 413–428. doi: 10.1006/gcen.1998.7222
Gotz S., Garcia-Gomez J. M., Terol J., Williams T. D., Nagaraj S. H., Nueda M. J., et al. (2008). High-throughput functional annotation and data mining with the Blast2GO suite. Nucleic Acids Res. 36, 3420–3435. doi: 10.1093/nar/gkn176
Grabherr M. G., Haas B. J., Yassour M., Levin J. Z., Thompson D. A., Amit I., et al. (2011). Full-length transcriptome assembly from RNA-Seq data without a reference genome. Nat. Biotechnol. 29 (7), 644–652. doi: 10.1038/nbt.1883
Hers H. G. (1983). The control of glycolysis and gluconeogenesis by protein phosphorylation. Philos. Trans. R. Soc Lond. Ser. B Biol. Sci. 302, 27–32. doi: 10.1098/rstb.1983.0035
Holloway A. C., Leatherland J. F. (1998). Neuroendocrine regulation of growth hormone secretion in teleost fishes with emphasis on the involvement of gonadal sex steroids. Rev. Fish. Biol. Fish. 8 (4), 409–429. doi: 1023/a:1008824723747
Houten S. M., Wanders R. J. (2010). A general introduction to the biochemistry of mitochondrial fatty acid β-oxidation. J. Inherit. Metab. Dis. 33, 469–477. doi: 10.1007/s10545-010-9061-2
Huang Y., Chen H. G., Gao X. C., Ren H. T., Gao S. Y. (2022). Identification and functional analysis of miRNAs in skeletal muscle of juvenile and adult largemouth bass, Micropterus salmoides, comp. Biochem. Phys. D. 42, 100985. doi: 10.1016/j.cbd.2022.100985
Jarmuszkiewicz W., Woyda-Ploszczyca A., Koziel A., Majerczak J., Zoladz J. A. (2015). Temperature controls oxidative phosphorylation and reactive oxygen species production through uncoupling in rat skeletal muscle mitochondria. Free Radic. Biol. Med. 83, 12–20. doi: 10.1016/j.freeradbiomed.2015.02.012
Kanehisa M., Furumichi M., Tanabe M., Sato Y., Morishima K. (2017). KEGG: new perspectives on genomes, pathways, diseases and drugs. Nucleic Acids Res. 45, D353–D361. doi: 10.1093/nar/gkw1092
Kocour M., Linhart O., Gela D., Rodina M. (2005). Growth performance of all-female and mixed-sex common carp Cyprinus carpio l. Populations Cent. Europe climatic conditions. J. World Aquacult. Soc 36, 103–113. doi: 10.1111/j.1749-7345.2005.tb00136.x
Ladisa C., Ma Y., Habibi H. R. (2021). Seasonally related metabolic changes and energy allocation associated with growth and reproductive phases in the liver of male goldfish (Carassius auratus). J. Proteomics. 241, 104237. doi: 10.1016/j.jprot.2021.104237
Layman D. K., Anthony T. G., Rasmussen B. B., Adams S. H., Lynch C. J., Brinkworth G. D., et al. (2015). Defining meal requirements for protein to optimize metabolic roles of amino acids. Am. J. Clin. Nutr. 101, S1330–S1338. doi: 10.3945/ajcn.114.084053
Lee M. J. (2017). Hormonal regulation of adipogenesis. Compr. Physiol. 7, 1151–1195. doi: 10.1002/cphy.c160047
Livak J., Schmittgen T. D. (2001). Analysis of relative gene expression data using real-time quantitative PCR and the 2-ΔΔCt method. Methods. 25, 402–408. doi: 10.1006/meth.2001.1262
Ma Y., Ladisa C., Chang J. P., Habibi H. R. (2020). Multifactorial control of reproductive and growth axis in male goldfish: influences of GnRH, GnIH and thyroid hormone, mol. Cell Endocrinol. 500, 110629. doi: 10.1016/j.mce.2019.110629
Ma Q., Liu S., Zhuang Z., Lin L., Sun Z., Liu C., et al. (2012). Genomic structure, polymorphism and expression analysis of the growth hormone (GH) gene in female and male half-smooth tongue sole (Cynoglossus semilaevis). Gene. 493, 92–104. doi: 10.1016/j.gene.2011.11.015
Mankiewicz J. L., Picklo M. J., Idso J., Cleveland B. M. (2022). Leptin receptor deficiency results in hyperphagia and increased fatty acid mobilization during fasting in rainbow trout (Oncorhynchus mykiss). Biomolecules 12, 516. doi: 10.3390/biom12040516
Marchant T.A., Peter R. E. (1986). Seasonal variations in body growth rates and circulating levels of growth hormone in the goldfish, Carassius auratus. J. Exp. Zool. 237 (2), 231–239. doi: 10.1002/jez.1402370209
Ma J., Wang H., Liu R., Jin L., Tang Q., Wang X., et al. (2015). The miRNA transcriptome directly reflects the physiological and biochemical differences between red, white, and intermediate muscle fiber types. Int. J. Mol. Sci. 16, 9635–9653. doi: 10.3390/ijms16059635
McAndrew R. P., Wang Y., Mohsen A.-W., He M., Vockley J., Kim J.-J. P. (2008). Structural basis for substrate fatty acyl chain specificity: crystal structure of human very-long-chain acyl-CoA dehydrogenase. J. Biol. Chem. 283, 9435–9443. doi: 10.1074/jbc.M709135200
Mcbride R. S., Somarakis S., Fitzhugh G. R., Albert A., Yaragina N. A., Wuenschel M. J., et al. (2015). Energy acquisition and allocation to egg production in relation to fish reproductive strategies. Fish. Fish. 16 (1), 23–57. doi: 10.1111/faf.12043
Mei J., Gui J. F. (2015). Genetic basis and biotechnological manipulation of sexual dimorphism and sex determination in fish. Sci. China Life Sci. 58, 124–136. doi: 10.1007/s11427-014-4797-9
Melamed P., Rosenfeld H., Elizur A., Yaron Z. (1998). Endocrine regulation of gonadotropin and growth hormone gene transcription in fish. Comp. Biochem. Physiol. C. 119 (3), 325–338. doi: 10.1016/S0742-8413(98)00021-8
Muirhead H., Watson H. (1992). Glycolytic enzymes: from hexose to pyruvate. Curr. Opin. Struct. Biol. 2, 870–876. doi: 10.1016/0959-440X(92)90113-L
Opazo R., Valladares L., Romero J. (2017). Comparison of gene expression patterns of key growth genes between different rate growths in zebrafish (Danio rerio) siblings. Lat. Am. J. Aquat. Res. 45, 766–775. doi: 10.3856/vol45-issue4-fulltext-12
Peterson B. C., Small B. C., Waldbieser G. C., Bosworth B. G. (2008). Endocrine responses of fast- and slow-growing families of channel catfish. N. Am. J. Aquacul. 70, 240–250. doi: 10.1577/A07-023.1
Possiant J., Wilson A. J., Festa-Bianchet M., Hogg J. T., Coltman D. W. (2008). Quantitative genetics and sex-specific selection on sexually dimorphic traits in bighorn sheep. Proc. R. Soc B Biol. Sci. 275, 623–628. doi: 10.1098/rspb.2007.1361
Riley L. G., Walker A. P., Dorough C. P., Schwandt S. E., Grau E. G. (2009). Glucose regulates ghrelin, neuropeptide y, and the GH/IGF-I axis in the tilapia, Oreochromis mossambicus, comp. Biochem. Physiol. A. 154 (4), 541–546. doi: 10.1016/j.cbpa.2009.08.018
Robinson M. D., McCarthy D. J., Smyth G. K. (2010). edgeR: a bioconductor package for differential expression analysis of digital gene expression data. Bioinformatics. 26, 139–140. doi: 10.1093/bioinformatics/btp616
Saeed A. I., Sharov V., White J., Li J., Liang W., Bhagabati B., et al. (2003). TM4: a free, open-source system for microarray data management and analysis. Biotechniques. 34, 374–378. doi: 10.2144/03342mt01
Saether S. A., Saetre G. P., Borge T., Wiley C., Svedin N., Andersson G., et al. (2007). Sex chromosome-linked species recognition and evolution of reproductive isolation in flycatchers. Science. 318, 95–97. doi: 10.1126/science.114150
Schneider J. E. (2004). Energy balance and reproduction. Physiol. Behav. 81 (2), 289–317. doi: 10.1016/j.physbeh.2004.02.007
Shua Y., Xiaa J., Yua Q., Wanga G., Zhang J., Hea J., et al. (2018). Integrated analysis of mRNA and miRNA expression profiles reveals muscle growth differences between adult female and male Chinese concave-eared frogs (Odorrana tormota). Gene. 678, 241–251. doi: 10.1016/j.gene.2018.08.007
Sun J. L., Liu Y. F., Jiang T., Li Y. Q., Song F. B., Wen X., et al. (2021). Golden pompano (Trachinotus blochii) adapts to acute hypoxic stress by altering the preferred mode of energy metabolism. Aquaculture. 542, 736842. doi: 10.1016/j.aquaculture.2021.736842
Sun J. L., Zhao L. L., Wu H., Liu Q., Liao L., Luo J., et al. (2020). Acute hypoxia changes the mode of glucose and lipid utilization in the liver of the largemouth bass (Micropterus salmoides). Sci. Tolal. Environ. 713, 135157. doi: 10.1016/j.scitotenv.2019.135157
Sun S. M., Xuan F. J., Fu H. T., Zhu J., Ge X. P., Gu Z. M. (2015). Transciptomic and histological analysis of hepatopancreas, muscle and gill tissues of oriental river prawn (Macrobrachium nipponense) in response to chronic hypoxia. BMC Genomics. 16, 491. doi: 10.1186/s12864-015-1701-3
Wang N.A., Tian Y., Zhang J., Li Z., Cheng M., Wu Y. (2021). Involvement of glycolysis activation in flatfish sexual size dimorphism: Insights from transcriptomic analyses of Platichthys stellatus and Cynoglossus semilaevis. comp. Biochem. Physiol. D. 39, 100832. doi: 10.1016/j.cbd.2021.100832
Wang N., Wang R., Wang R., Chen S. (2018). Transcriptomics analysis revealing candidate networks and genes for the body size sexual dimorphism of Chinese tongue sole (Cynoglossus semilaevis). Funct. Integr. Genomics 18 (3), 327–339. doi: 10.1007/s10142-018-0595-y
Yang X., Schadt E. E., Wang S., Wang H., Arnold A. P., Ingram-Drake L., et al. (2006). Tissue-specific expression and regulation of sexually dimorhic genes in mice. Genome Res. 16, 995–1004. doi: 10.1101/gr.5217506
Zacharewicz E., Lamon S., Russell A. P. (2013). MicroRNAs in skeletal muscle and their regulation with exercise, ageing, and disease. Front. Physiol. 4. doi: 10.3389/fphys.2013.00266
Zhang K., Song F., Liang Y., Zhang W., Zhou K., Chen Y., et al. (2022). Development and verification of sex-specific molecular marker for golden pompano (Trachinotus blochii). Aquac. Res. 53, 3726–3753. doi: 10.1111/are.15876
Zhang G., Zhang X., Ye H., Jiang S., Yu H., Li J., et al. (2017). Construction of high-density genetic linkage maps and QTL mapping in the golden pompano. Aquaculture. 482, 90–95. doi: 10.1016/j.aquaculture.2017.09.011
Zhao Y., Jiang Q., Zhou X. Q., Xu S. X., Feng L., Liu Y., et al. (2020). Effect of dietary threonine on growth performance and muscle growth, protein synthesis and antioxidant-related signalling pathways of hybrid catfish Pelteobagrus vachelli♀ × Leiocassis longirostris♂. Brit. J. Nutr. 123, 121–134. doi: 10.1017/S0007114519002599
Zhao Y., Li J., Yin L., Feng L., Liu Y., Jiang W. D., et al. (2019). Effects of dietary glutamate supplementation on flesh quality, antioxidant defense and gene expression related to lipid metabolism and myogenic regulation in jian carp (Cyprinus carpio var. Jian). Aquaculture. 502, 212–222. doi: 10.1016/j.aquaculture.2018.12.050
Zhong H., Zhou Y., Liu S., Tao M., Long Y., Liu Z., et al. (2012). Elevated expressions of GH/IGF axis genes in triploid crucian carp. gen. Comp. Endocrinol. 178, 291–300. doi: 10.1016/j.ygcen.2012.06.006
Keywords: gonadal development, growth differences, transcriptome, metabolism, energy allocation
Citation: Sun JL, Song FB, Wang L, Zhang WW, Chen YM, Zhou L, Gui JF and Luo J (2022) Sexual size dimorphism in golden pompano (Trachinotus blochii): Potential roles of changes in energy allocation and differences in muscle metabolism. Front. Mar. Sci. 9:1009896. doi: 10.3389/fmars.2022.1009896
Received: 02 August 2022; Accepted: 23 September 2022;
Published: 07 October 2022.
Edited by:
Khor Waiho, University of Malaysia Terengganu, MalaysiaReviewed by:
Marie Prchalová, Academy of Sciences of the Czech Republic (ASCR), CzechiaCopyright © 2022 Sun, Song, Wang, Zhang, Chen, Zhou, Gui and Luo. This is an open-access article distributed under the terms of the Creative Commons Attribution License (CC BY). The use, distribution or reproduction in other forums is permitted, provided the original author(s) and the copyright owner(s) are credited and that the original publication in this journal is cited, in accordance with accepted academic practice. No use, distribution or reproduction is permitted which does not comply with these terms.
*Correspondence: Fei Biao Song, c29uZ2ZiMTAxNEAxMjYuY29t; Jian Luo, bHVvamlhbkBoYWluYW51LmVkdS5jbg==
†These authors have contributed equally to this work and share first authorship
Disclaimer: All claims expressed in this article are solely those of the authors and do not necessarily represent those of their affiliated organizations, or those of the publisher, the editors and the reviewers. Any product that may be evaluated in this article or claim that may be made by its manufacturer is not guaranteed or endorsed by the publisher.
Research integrity at Frontiers
Learn more about the work of our research integrity team to safeguard the quality of each article we publish.