 Chiara Maggi
 Maria Teresa Berducci
 Bianca Di Lorenzo
 Serena Lomiri
 Francesco Venti
- Italian Institute for Environmental Protection and Research (ISPRA), Rome, Italy
The European Marine Strategy Framework Directive (MSFD) required Member States to define the concept of Good Environmental Status (GES) of their marine waters in quantitative terms and to achieve it through the assessment of 11 descriptors by 2020. ISPRA (Italian Institute for Environmental Protection and Research), on behalf of the Ministry of the Environment, carried out the Initial Assessment (2012) and the evaluation of the first cycle of the MSFD (2012–2018) to understand the achievement of GES Descriptor 8 (“Contaminant concentrations are at levels that do not give rise to pollution effects”) and, now, in this second cycle of the MSFD (2018–2024), is conducting monitoring of D8C1 criterion elements (“Contaminant concentrations”). In this paper, the approach, integrating data on chemical contaminants (metals and polycyclic aromatic hydrocarbons and organochlorine compounds) in different matrices (water, sediment and biota), adopted by Italy since 2012 to study GES for the MSFD-D8C1 criterion in national marine water is described. This approach, based on the use of a dimensionless, zero-centered index, allows one to assess all regulatory contaminants as a whole. The improvements in the monitoring strategy and the GES evaluation between the Initial Assessment, the first cycle, and the beginning of the second cycle of the MSFD for the Adriatic Sea subregion are presented.
1 Introduction
During the last 30 years in common with land and freshwater environmental management, there was a similar movement to manage coastal and marine areas, by means of a holistic approach (Apitz et al., 2006). Thus, gradually, directives such as the Water Framework Directive (WFD, 2000/60/EC) and the Marine Strategy Framework Directive (MSFD, 2008/56/EC) move towards an integrated ecosystem approach, based on a holistic view to manage and protect marine ecosystems (Borja et al., 2010b; Bellas, 2014; Gago et al., 2014). The MSFD, adopted in July 2008, provides an integrative marine environment status assessment and considers both coastal and offshore environment, thus bordering on Water Framework Directive (WFD, 2000/60/EC) and overlapping with it for some parts of the marine environment.
According to Directive 56/2008/EC, Member States (MS) had to make an Initial Assessment (IA) of own marine waters by means of the 11 descriptors of MSFD (Annex I), taking account of existing data, and to achieve Good Environmental Status (GES) by 2020 through the GES criteria and methodological standards required by new Commission Decision (EU) 2017/848 (Borja et al., 2013; Andersen et al., 2016; Simboura et al., 2016; EEA Report No 25/2018; Tornero and Hanke, 2018; Utizi et al., 2018; Pavlidoua et al., 2019; Tornero et al., 2019; Fraschetti et al.,2022). Thus, the IA was provided by 2012, monitoring programs were set up in 2014 to assess progress towards GES, and, 2 years later, national programs of measures (PoMs) to achieve or maintain GES were published.
The presence of chemical contaminants has been identified as a major threat to the Mediterranean Sea’s biodiversity and ecology (Tornero and d’Alcala, 2013), and consequently, marine chemical pollution assessment has been a top priority to achieve the MSFD GES. The effectiveness of the MSFD Descriptor 8 in achieving GES is directly influenced by the successful implementation of other EU legislation, like the WFD Directive (Wernersson et al., 2015; Utizi et al., 2018). According to the MSFD GES Decision, for each contaminant under primary criterion D8C1, MS shall express its concentration, the matrix used for monitoring (water, sediment, and biota), and whether the threshold values set have been achieved. For the contaminants already identified under the WFD, the threshold values should be the values set in accordance with that Directive so as to ensure proper coordination of the implementation of the two legal frameworks (Tornero and Hanke, 2017). To evaluate water body chemical status, the WFD introduced the concept of Environmental Quality Standards (EQS) (Maggi et al., 2012; Tzempelikou et al., 2021). The value of EQS, attributed to each substance, derives from the integration of more components such as chemical, biological, and ecotoxicological aspects (Maggi et al., 2008).
The WFD classification procedure is based on the “one out, all out” (OOAO) principle, where the worst status determines the final status of the water body (Heiskanen et al., 2004; Muniz et al., 2005; Borja and Rodríguez, 2010a). Thus, one parameter exceeding the EQS is sufficient to classify the status of water body as bad. Whereas the WFD uses the OOAO principle, no specific rule has yet been proposed for the MSFD in the offshore waters outside the WFD realm, allowing MS to adopt different criteria in order to correctly use data for assessing environmental quality (Borja et al., 2016; Danovaro et al., 2016).
The MSFD approach on contaminants requires an adequate method able to obtain an overall judgment on the state of environmental quality considering all kinds of contaminants that are involved. This method must take into account the EQS values in order to ensure that below them, the assessment area is in GES and, at the same time, must go beyond mere compliance with the EQS by providing an integrated judgment among all chemical substances of concern within the marine matrices.
The concept of expressing environmental quality in terms of a system of indices is not new. The indices are among the effective ways to communicate the information on environmental quality trends to the general public or to the policymakers and in water body quality management. Many calculation methods, such as pollution index, principal component analysis (Cheng et al., 2007; Zhiyuan et al., 2011; Elliott et al., 2018), correlation, and fuzzy decision, have been presented to assess the environmental quality of sediment (Rial et al., 2017), although different calculation methods based on different algorithms might lead to discrepancies on pollution assessment (Gong et al., 2008; Berto et al., 2020). Hence, it is of great importance to select a suitable method to assess the chemical quality of the marine environment for decision-making and spatial planning.
In most instances, however, the linkages between different components of the ecosystem are not well understood or, at best, have been poorly addressed by science. This is no less so in developing indicators of marine ecosystem health. Some good datasets may exist in certain marine science disciplines, but in general, there are a number of shortcomings: limited availability of techniques and data; limited geographic coverage and few temporal datasets; often where datasets do exist, mechanistic links between components of the ecosystem are poorly understood or recognized; and there are few criteria available for assessing data (Thain et al., 2008; Martinez-Gomez et al., 2017). Although several attempts have been made to integrate chemical substance and matrices in order to assess the environmental chemical status of marine waters, there are still significant gaps regarding this matter.
The aim of this paper is to present a suitable and robust integrated index of chemical quality [named Chemical Quality Index (CQI)] which was used in Italy for the IA (2012) and during the monitoring activities carried out in the first cycle of MSFD (2014–2018) for the GES assessment sensu MSFD Descriptor 8–criterion D8C1. This index, actually employed for monitoring data elaboration in this second cycle, allowed the evaluation of the pressures from different kinds of contaminants (PAH, metals, etc.) in the Italian marine subregions, using the relevant ecosystem components, water, sediment, and biota, that respectively reflect short-term and long-term pollution.
2 Materials and methods
MS should express the extent to which GES is being achieved as the proportion of their marine waters, Marine Reporting Units (MRUs), over which the threshold values have been complied with. The MRUs are used within the reporting obligations of the Marine Strategy Framework Directive (MSFD) in order to link the implementation of the different articles to specific marine areas. The MRUs can be of varying sizes, according to the appropriate scale for the different reports (e.g., region, subregion, regional, or subregional subdivision, MS marine waters, and WFD coastal waters), as indicated in the GES Decision. Italian waters fall into the Mediterranean region, and the Western Mediterranean Sea (WMS), Adriatic Sea (AS), and Ionian Sea and Central Mediterranean Sea (ISCMS) subregions are under Italian authority (Figure 1).
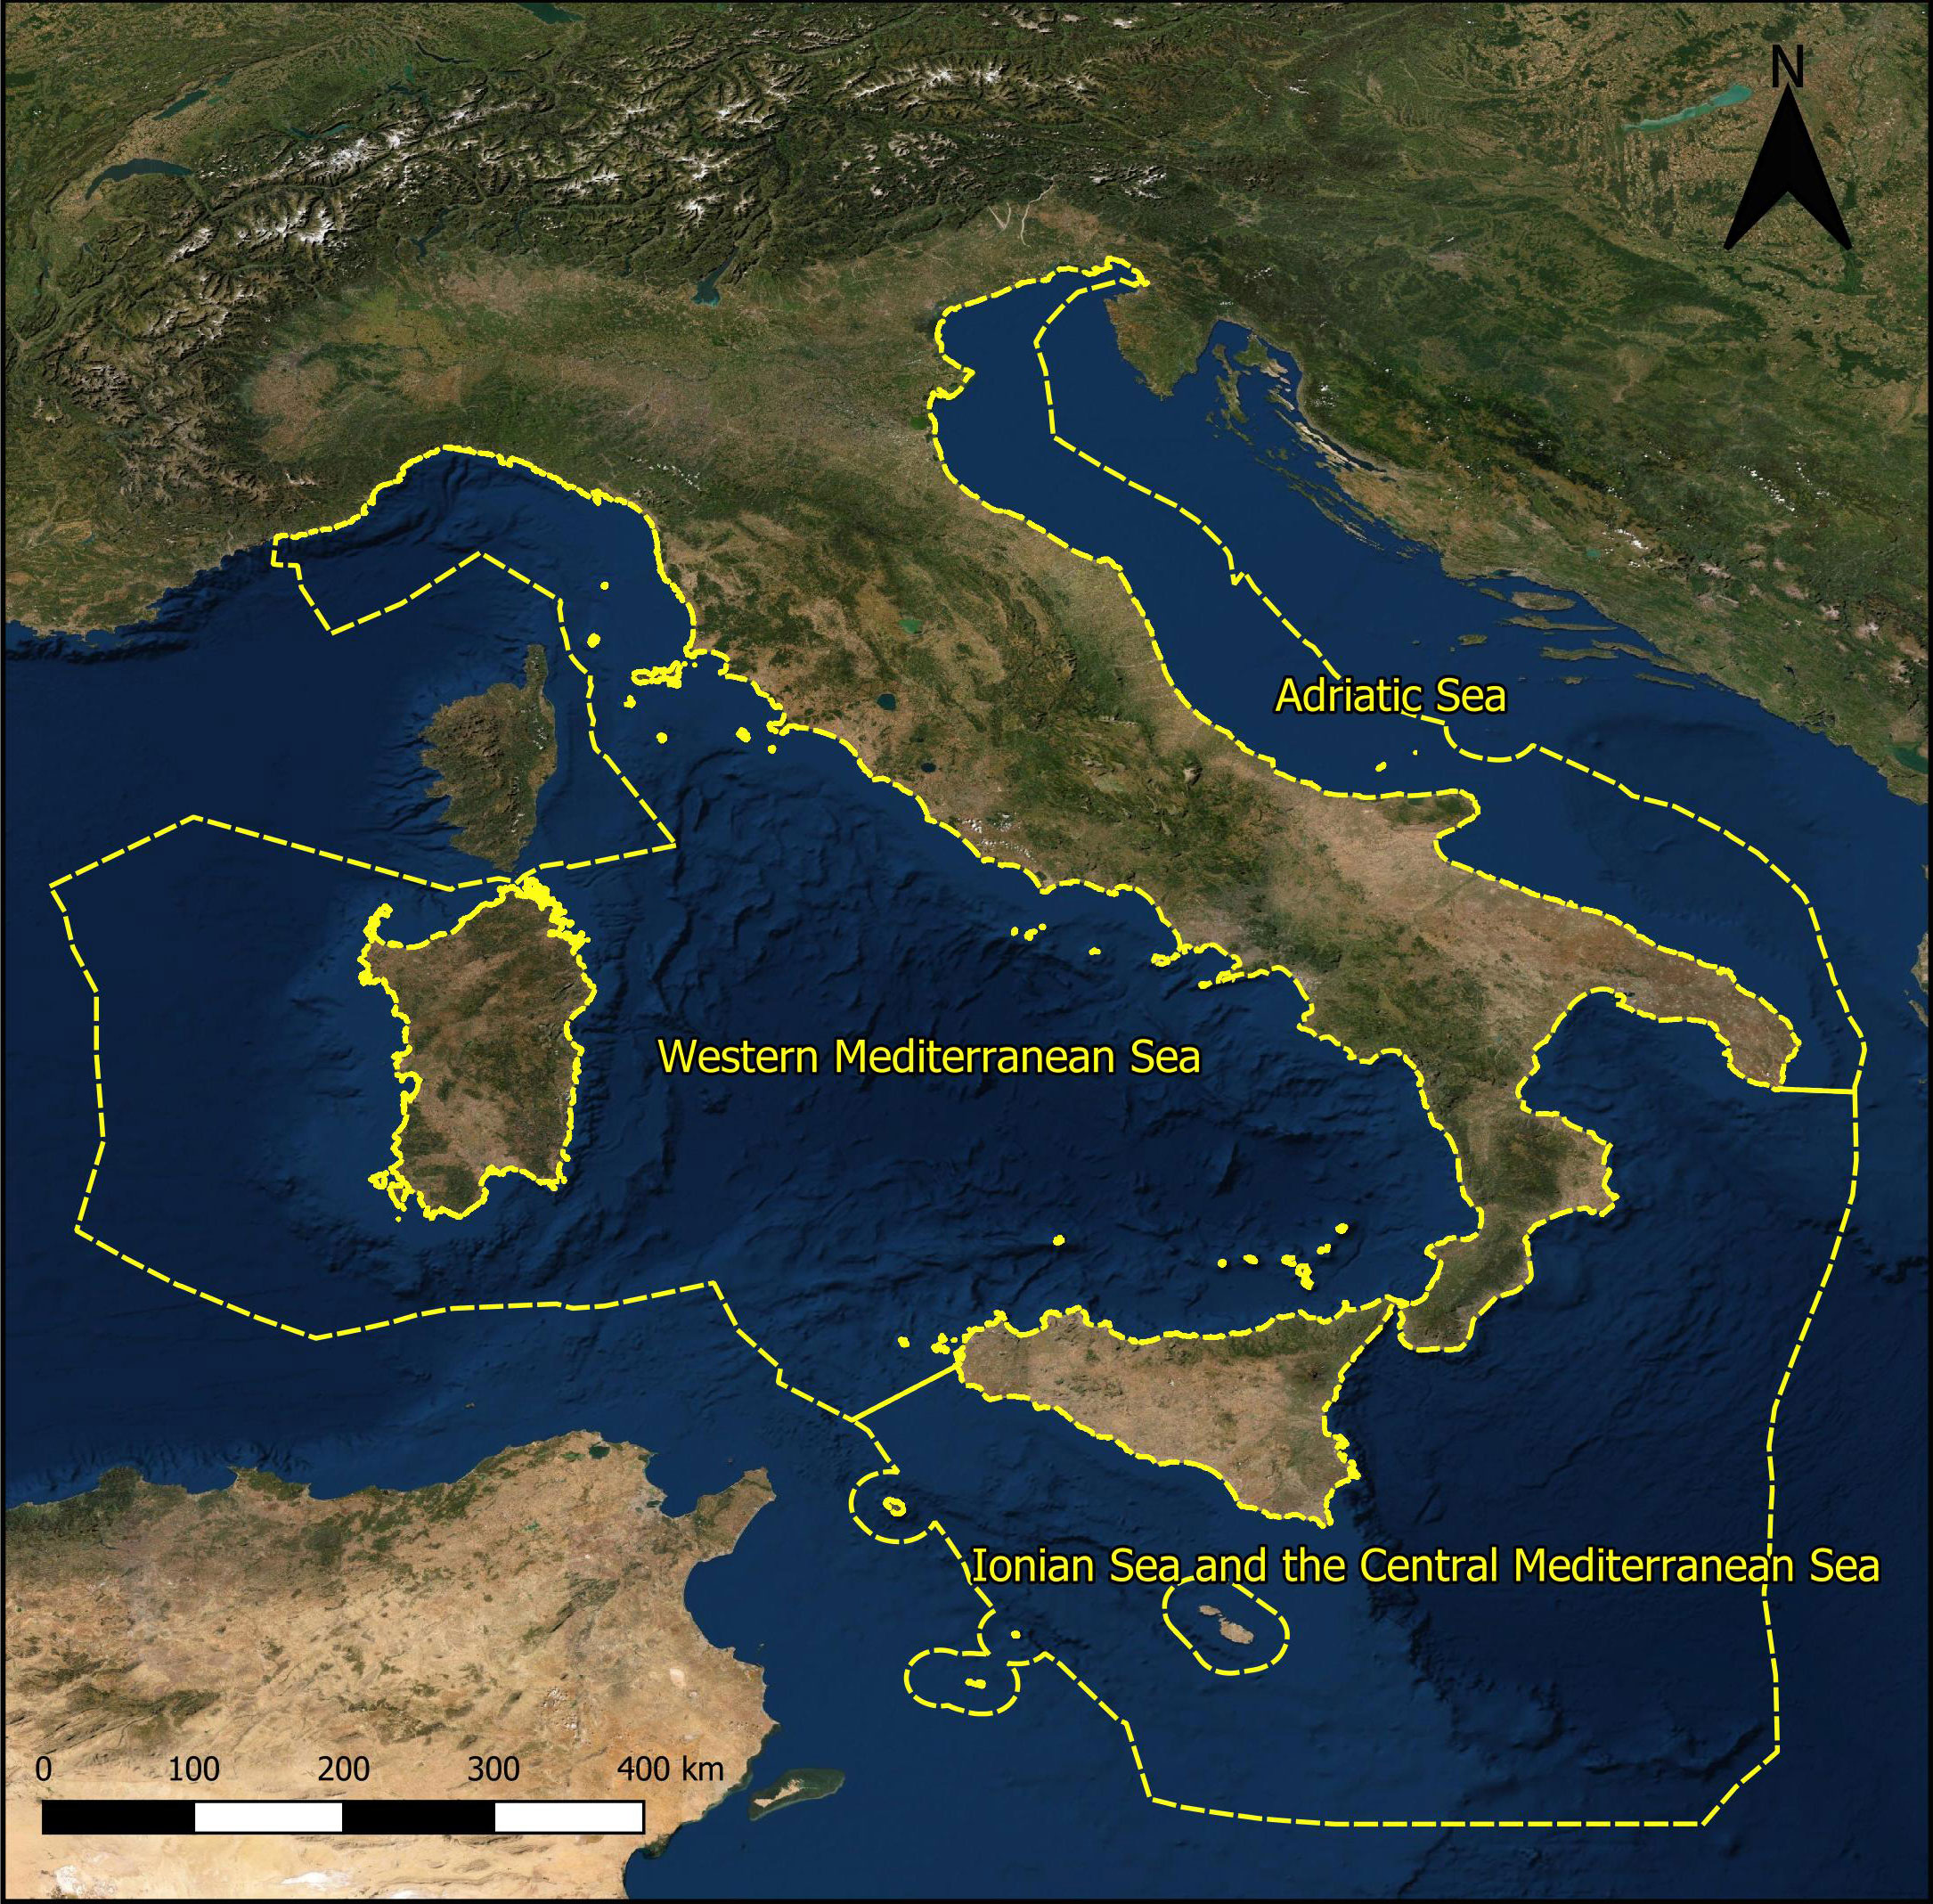
Figure 1 Italian subregions according to Marine Strategy Framework Directive 2008/56/EC.
2.1. Chemical data
The data used in this study and their geographical coordinates are given in the Centralized Information System (SIC) having as objective the collection, management, and sharing at the community level of the data coming from the Monitoring Programs within the framework of the Marine Strategy (http://www.db-strategiamarina.isprambiente.it/).
Concentration results relating to IA came from several environmental monitoring programs carried out during the 2006–2012 period for different purposes; thus, in most cases, collected data were not homogeneous, concerning few contaminants or one matrix only. In the Italian subregions, approximately 178,780 data were collected. In the Adriatic Sea, data were 76,270, of which 11,687 were for water, 47,394 were for sediment, and 17,189 were for biota. In the WMS, 35,665 data were examined, of which 1,495 were for water, 24,016 were for sediment, and 10,154 were for biota. For ISCMS, the number of analyzed data was equal to 66,845, of which 155 were for water, 63,231 were for sediment, and 3,459 were for biota.
In the first cycle of MSFD, 376,570 concentration data were analyzed altogether. Data related to the Adriatic Sea were 177,916, of which 138,173 were for water, 30,689 were for sediment, and 9,054 were for biota. In WMS, 111,462 data were examined, of which 98,276 were for water, 11,100 were for sediment, and 2,086 were for biota. For ISCMS, the number of analyzed data was equal to 87,192, of which 65,619 were for water, 20,194 were for sediment, and 1,379 were for biota.
In the first 3 years of the second cycle of MSFD (2019–2021), where the ultimate monitoring program including an in-depth study of conservative matrices such as sediment and biota is applied, 45,451 analyses have already been carried out. Data related to the Adriatic Sea have been 17,979, of which 9,842 were for sediment and 8,137 were for biota. In WMS, data analyzed have been 16,333, of which 10,999 were for sediment and 5,334 were for biota. For ISCMS, the analyses performed have been 11,139, of which 6,522 were for sediment and 4,617 were for biota.
Monitored contaminants were those for which regulatory levels have been laid down for environmental reasons. The regulatory framework was essentially composed of Directive 105/2008/EC and further update Directive 39/2013/EC on Environmental Quality Standard and Directive 90/2009/EC Descriptor 8 monitoring refers to these regulations as well as to other relevant national standards for sediments. Hence, Italian Ministerial Decree n. 260/2010 and later D. Lgs 172/2015 fixed EQS for several priority and hazardous substances in marine sediment (Maggi et al., 2008).
Data belonging to the IA, to the first cycle of MSFD, and to the beginning of the second cycle of MSFD were elaborated, and those with unfitting analytical quality (Directive 90/2009/EC), MSFD criteria, and GIS elaboration standards were removed.
2.2. Integrated index methodology
In this section, the integrated index used by Italy for MSFD D8-C1 purposes during the IA phase (2006–2012) and during the first (2012–2018) and second cycle (2018–2024) is described.
A critical analysis of studies that applied pollution indices was initially carried out to verify the presence of adequate and useful references with the purpose of the MSFD D8C1 criterion. Generally, pollution indices are powerful tools for processing, analyzing, and conveying raw environmental information to decision-makers, managers, technicians, and the public (Caeiro et al., 2005; Chapman, 2007). Of interest to the MSFD was the integrated approach initially described in Dagnino et al. (2008); Dagnino et al. (2013) [Expert Decision Support System (EDSS)], within the more general framework of Ecological Risk Assessment (ERA), based on three indices (chemical risk index, ecotoxicological risk index, and ecological risk index), varying in the range 0–1. This approach was implemented and extended by means of a weighted integration of the results to different lines of evidence and in different areas of application (Benedetti et al., 2011; Piva et al., 2011; Dagnino and Viarengo, 2014; Regoli et al., 2019). The chemical risk index was a useful starting point to elaborate an MSFD D8C1 purpose tool, although it represents a risk index rather than a quality index.
Hence, a dimensionless index, named CQI, based on the differences between the concentration values of the contaminants and the respective EQS (fixed by the international and national legislation), was made by Italy in 2012 for IA. The mechanism was conceived in order to also guarantee the comparability with the Directive 2000/60/EC assessments, as required by MSFD, and at the same time to introduce a margin of tolerance and elasticity (with particular reference to the open sea) to the strict application of the EQS compliance. The pass-to-fail logic, by a single parameter (the OOAO principle), as a criterion for chemical classification was thus overcome. The index, thus calculated, could be applied to each matrix (water, sediment, and biota), providing immediate reading results. The index is centered at zero; if the final value is less than or equal to zero, exceedances of individual contaminants did not occur or occurred in such small amounts that they did not weigh on the final index. On the other hand, a value above zero highlights different situations of exceeding the EQS for each contaminant, which significantly affect the averaged index. The advantage of a relative index is its independence from measurement units of the phenomenon analyzed, allowing obtaining a pure number, centered at zero.
In recent years, different tools, among which some follow the principles of Italian integrated approach to the GES evaluation, have been developed by MS at the national level and/or by Regional Conventions (Borja et al., 2016; Borja et al., 2021). Andersen et al. (2016) reported a development and application of a prototype tool for integrated assessment of chemical status in aquatic environments based on substance- and matrix-specific environmental assessment criteria (thresholds). This approach integrates data on hazardous substances in water, sediments, and biota as well as bio-effect indicators and is based on a substance- or bio-effect-specific calculation of a “contamination ratio”, which is the ratio between an observed concentration and a threshold value. Deriving and setting up criteria to determine environmental status is not an easy task. It gets more complicated going from the local to the subregional and regional assessments. While there are many methodologies to derive criteria, the first step is aimed at defining the background or reference conditions from which to measure/determine the status and trends. In order to interpret chemical monitoring data, various types of standards or assessment thresholds have been developed. These include standards/criteria that reflect background conditions and standards/criteria that are designed to protect the health of sensitive organisms. The former includes Background Concentrations while the latter includes Environmental Assessment Criteria (EACs) developed through OSPAR processes.
In the HELCOM approach, as well as in UNEP-MAP approach (UNEP/MAP MEDPOL, 2015), the index is based on the differences between contaminant concentration and threshold value, which concerns OSPAR or effect range low (ERL) of US EPA (Long and Morgan, 1990). In the CQI applied by Italy, the threshold values are EQS set at European and national levels in accordance with the WFD procedure detailed in the European Commision Guidance Document (2018). Besides EAC, ERL and thresholds from European Directives to protect human health may be too lenient if the goal is to achieve and maintain GES where the contaminants cause no significant impact on coastal and marine ecosystems. According to what some authors say (Law et al., 2010; Borja et al., 2016), the method for deriving EAC, ERL, and EQS does not differ considerably from each other, and therefore, they could be used comparatively.
In Andersen et al. (2016), the four groups (water, sediment, biota, and biomarker) are first assessed separately, and the final status is defined as the lowest status of the four elements. Thus, this status is based on the OOAO principle, which was considered appropriate as the four elements represent different aspects of the contamination status. Moreover, the HELCOM/UNEP-MAP approach gives equal weight to all the elements; thus, all the matrices consider the contaminants equally harmful to the ecosystem. On the other hand, the CQI differentiates contaminants according to the EQS directive in priority substances, priority and hazardous substances, and neither of them. Thus, in this approach, a different weighted coefficient is expected to be associated with each substance while it is still under debate whether to evaluate all matrices with equal weight, because sediment and biota are conservative matrices while water is not. Hence, the CQI elaborations currently stop at the matrix level.
2.2.1. Calculation of the chemical quality index
The index is easy and flexible and takes into account the current legislation. It is based on the differences between contaminant concentration and respective EQS (Directive 2013/39/EU, Italian Legislative Decree n. 172/2015, Directive 105/2008/EC, Italian Ministerial Decree n. 260/2010). The differences are weighted on a specific correction factor (Tables 1–3), attributed to each substance according to the priority defined by Decision 2455/2001/EC, because the contaminants are not equally harmful to the ecosystem.
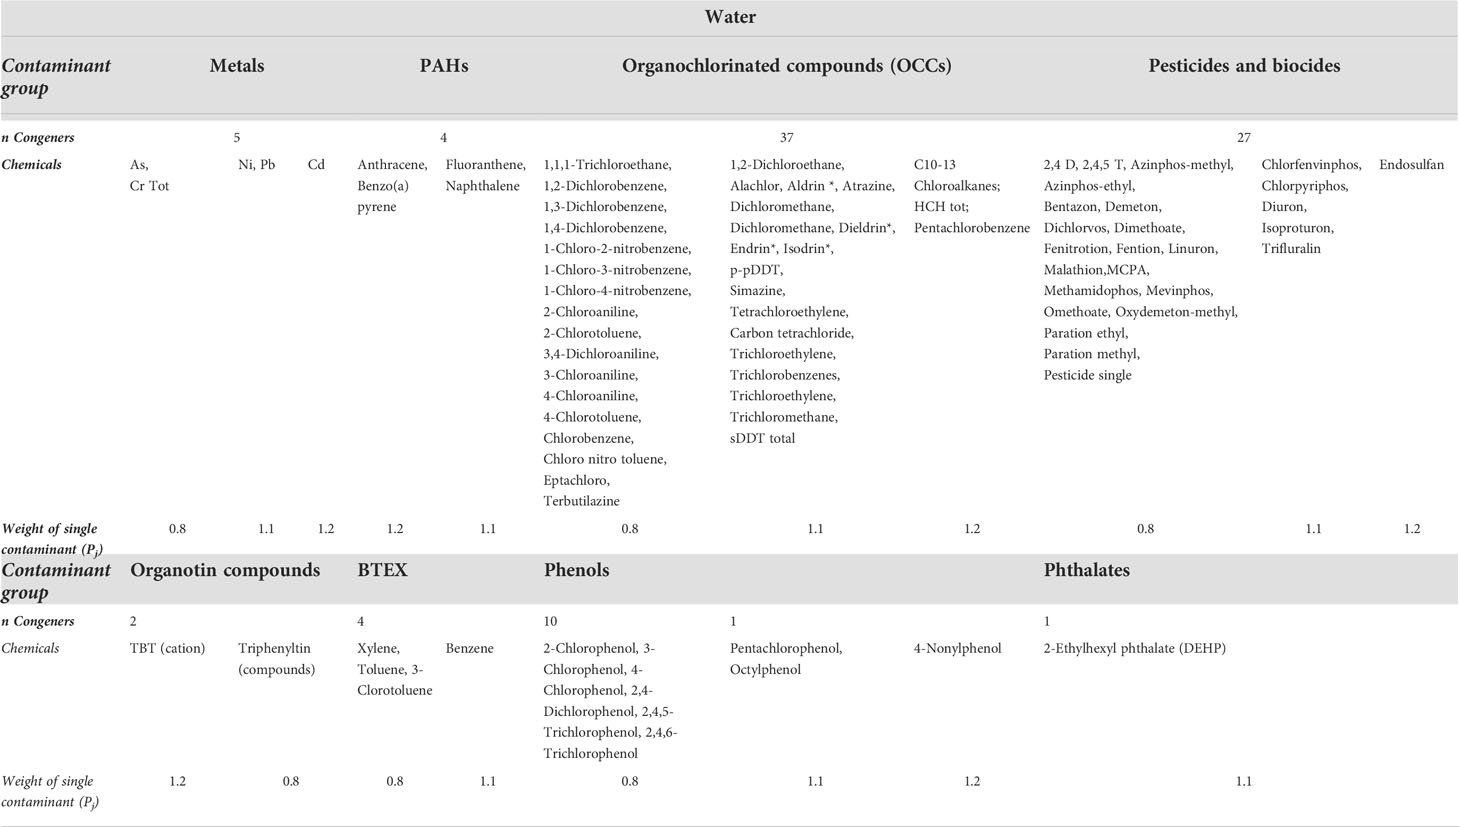
Table 1 Contaminants monitored in water and weight of single contaminant.
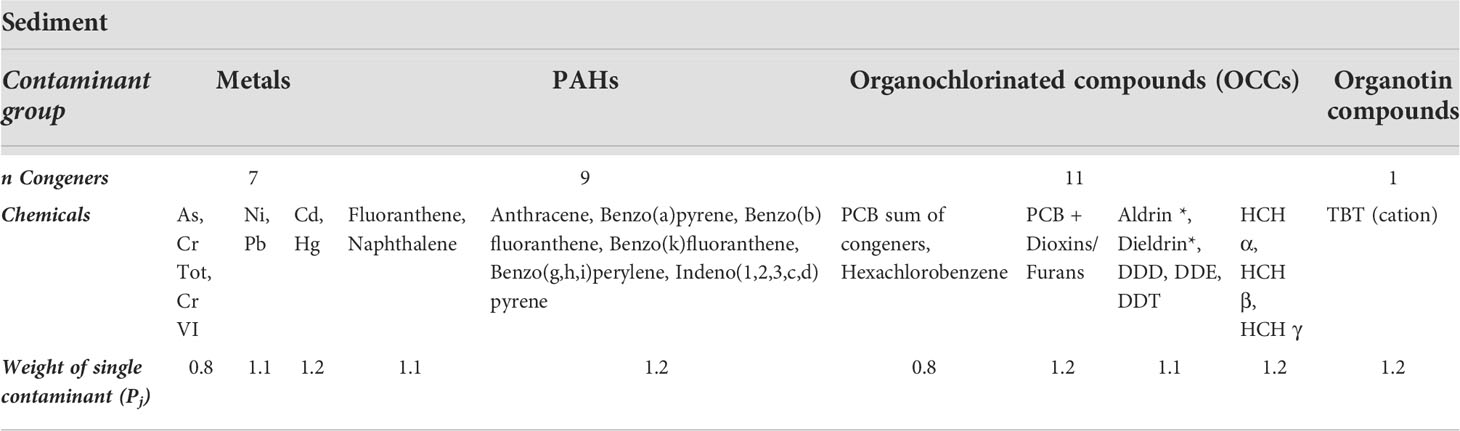
Table 2 Contaminants monitored in sediment and weight of single contaminant.
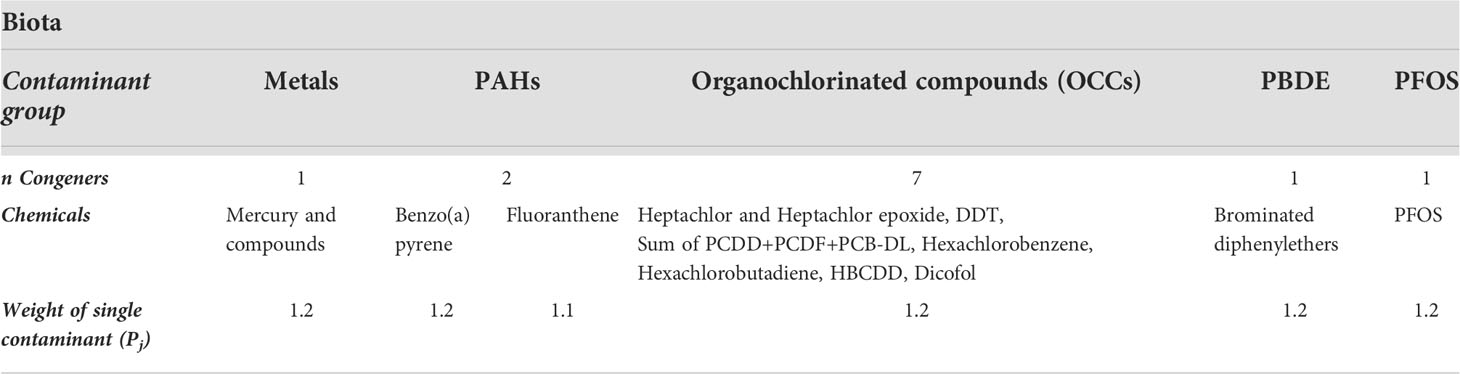
Table 3 Contaminants monitored in biota and weight of single contaminant.
All contaminants having EQS values have been grouped into the following:
- Eight categories for water (metals, PAHs, organochlorinated compounds, pesticides, organotin, phenols, BTEXs, and phthalates);
- Four categories for sediment (metals, PAHs, organochlorinated compounds, and organotin compounds); and
- Five categories for biota (metals, PAHs, organochlorinated compounds, PBDE, and PFOS).
The contaminant concentration was normalized with respect to a single EQS value. The index was used first to integrate substances in each category of contaminants (level of category, Figure 2B) and then to integrate, into the matrix, more categories between them (level of matrices, Figure 2C). In addition, a pragmatic approach has been established whereby the percentage of 70% of the data in an evaluation area should be in GES to reach it.
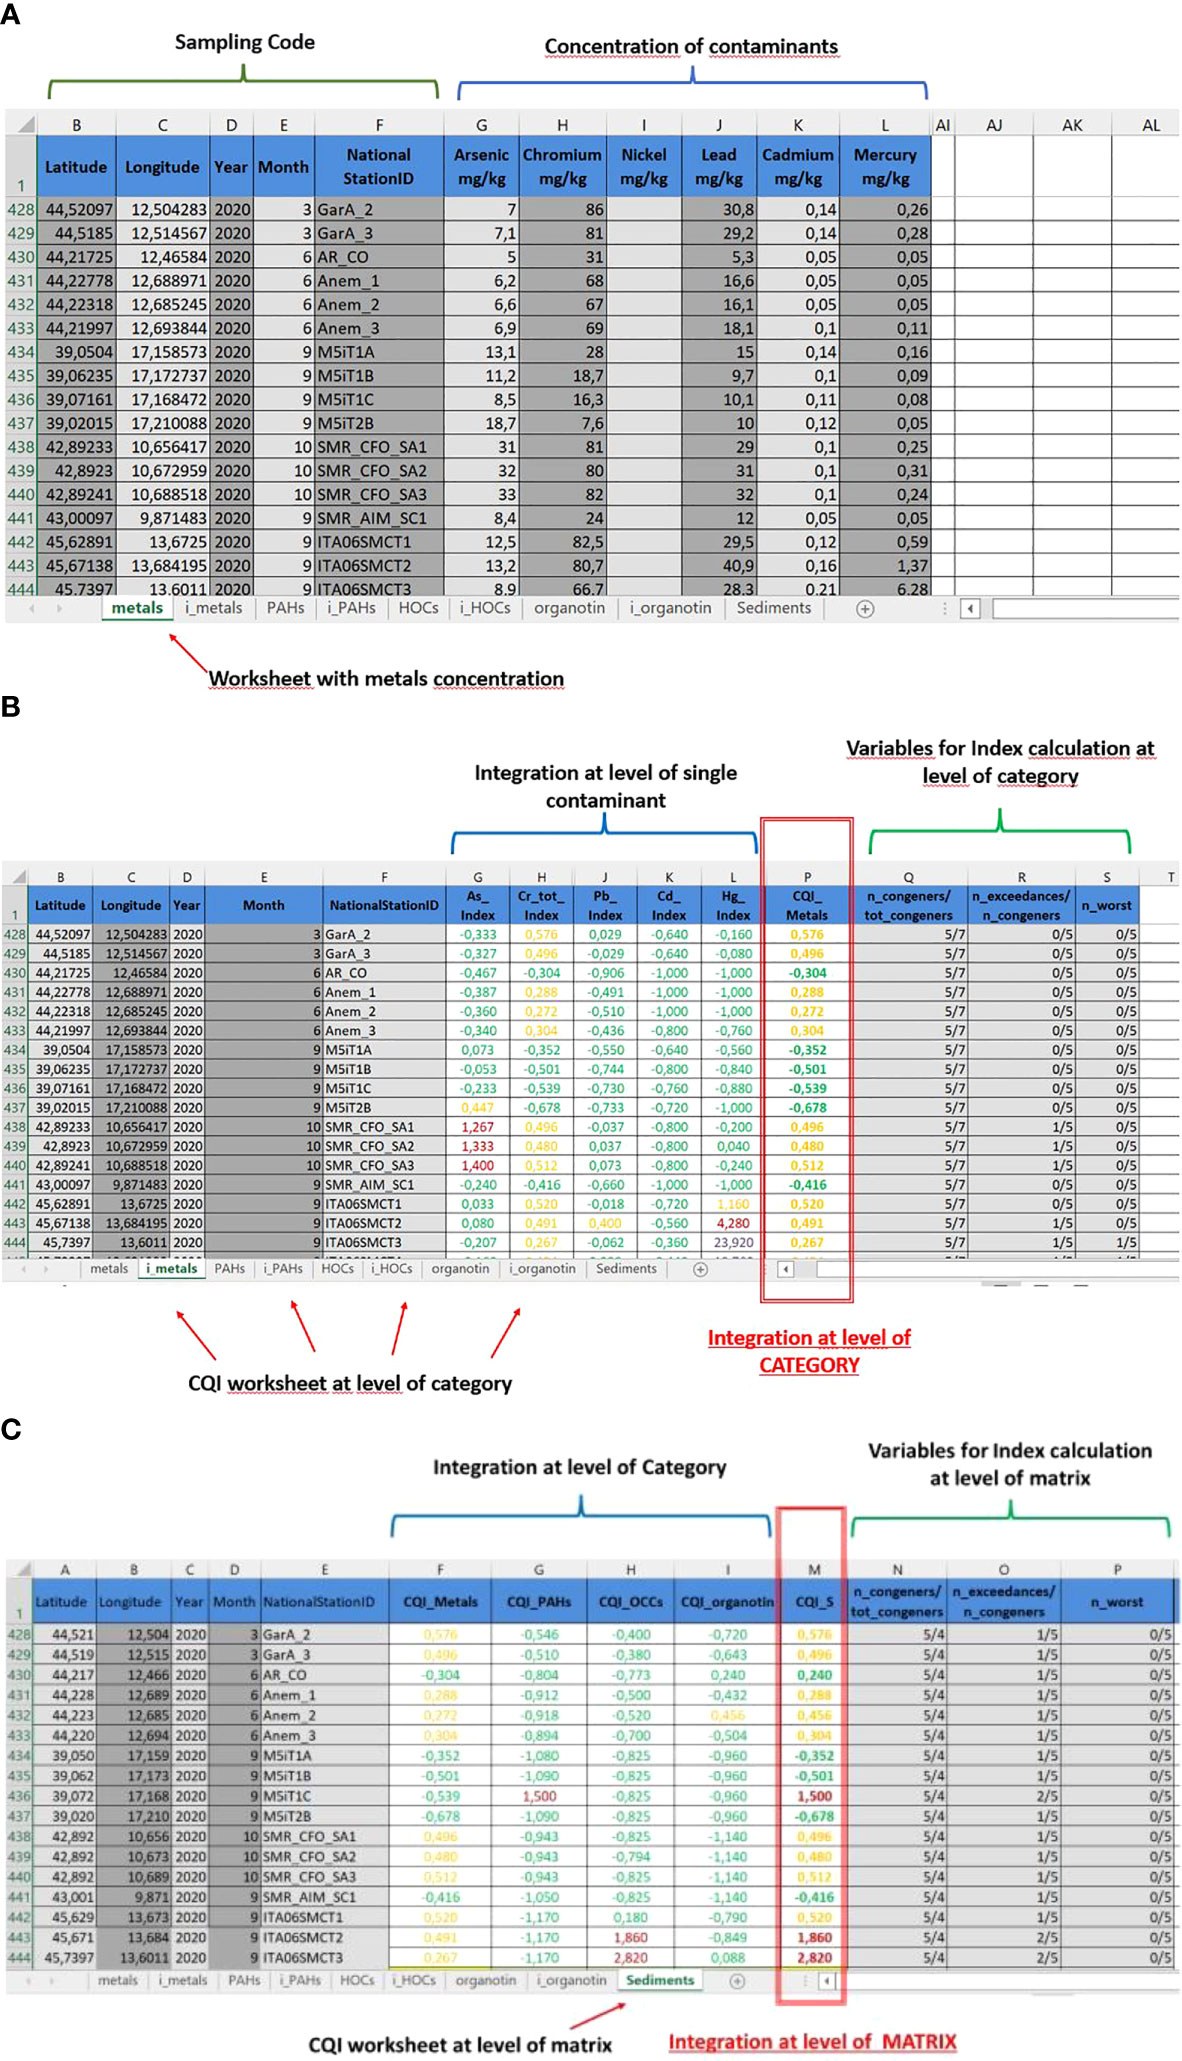
Figure 2 (A) Offprint of metal concentration in sediment sampling station. (B) Example of CQI output at the level of single contaminant and category (metal) in sediment. (C) Example of CQI output at the level of matrix (sediment).
2.2.2. Integration at level of contaminant and category
Fixing j and z as the single contaminant and contaminants category, respectively, the index for single substance is defined as
where xzj indicates the concentration of substance j in the category z,EQSj is the environmental quality standard fixed for contaminant j, and Pj is the weighted hazard coefficient of substance j. The index CQIzj ∈ (–Pj,+∞), where the minimum–Pj is not included because the concentration is never equal to zero (LOQ concept). Indeed, the concentration can assume a value lower than the quantification limit, but always greater than 0. However, for mathematical simplicity, it is assumed that the range is between –Pj and +∞.
When the concentration xzj is less than EQSj the index CQIzj is negative and CQIzj ∈ (–Pj,0). The upper limit can be defined as, where is the difference between the maximum concentration of contaminant j observed and the EQS of the jth substance,.
The –Pj coefficient is defined as follows (see Tables 1-3):
–Pj = 1.2 Priority and hazardous substance;
–Pj = 1.1 Priority substance; and
–Pj = 0.8 Substance not priority and not hazardous.
As explained above, three cases for izj may arise:
When switching from the single contaminant to the category, an increased number of congeners n is expected to occur in each contaminant category and the last one could not be fully populated. Hence, according to the number of contaminants in each category, a minimum threshold of representativeness is set: there must be at least 1/3(n) congeners to assess a category z with n ≥ 3 substances. If the category has less than that threshold, it is considered not judged (NJ).
The integrated index for each category z, Mz, is defined as the maximum of indices obtained for single contaminant izj:
Mz allows the detection, without uncertainty, of excellent situations and criticisms. In fact, the cases that may occur are the following:
1. Mz ≤ 0. All substances in the analyzed category are less than or equal to EQS.
2. Mz ∈ (0, 0.24]. At least one of the substances of the category exceeds EQS of a percentage less than or equal to 20%.
3. Mz ∈ (0.24, 1.2]. At least one of the substances of the category exceeds from 20% up to two times EQS.
4. Mz ∈ (1.2, 12]. At least one overrun from 2 up to 10 times the value of EQS.
5. Mz > 12. Exceeding more than 10 times the EQS value.
Merging the first two classes, the integrated index provides a final status for each single assessment unit, placing it in one of four status classes: good (classes 1–2), moderate (class 3), poor (class 4), and worst (class 5).
The choice of the maximum as a chemical quality indicator means to consider the worst case of all n congeners belonging to category z. On the other hand, this policy could be extremely precautionary depending on the size of category z. To make a judgment not too severe, different options in the most populated categories are proposed, relative to the poor and moderate classes. The category index Mzis always the highest among congener indices, except in the following cases:
- n congeners ≥ 5 and only one index of them belongs to case 3 or 4. In this case, it takes the second largest index;
- if n ∈ (10, 20) and only two congeners present case 3 or 4, it takes the third largest index; and
- if n ≥ 20 and only three congeners present case 3 or 4, it takes the fourth largest index.
2.2.3. Integration at the level of matrix
The goal of CQI is to allow an integrated analysis of all contaminant categories among them, in order to study the matrices as a whole. The integration at the level of matrix regards all indices Mz, where z ∈ (metals, PAH, etc.). The final result is an overall judgment on the single matrix, obtained as follows:
● Good: All categories present a good judgment. Alternatively, 20% of categories present a moderate judgment.
● Moderate: More than 20% of categories present a moderate judgment. Alternatively, 10% of categories present a poor judgment.
● Poor: More than 10% of categories present a poor judgment.
● Worst: The matrix is worst if at least one of the categories is worst.
As already happened for the index at the category level, there must be at least 1/3(n) categories to assess a matrix with n ≥ 3 categories.
An example of CQI outputs at different integration levels is shown in Figures 2A–C for sediment matrix.
2.3. GIS elaborations
Useful data for the assessment of three environmental matrices, acquired during the IAs, the first MSFD cycle, and the beginning of the second cycle of MSFD, were georeferenced in GIS (Software ArcGis 10.1) and exported into Feature Classes, taking as reference system ETRS89. The Feature Classes have been created on the basis of regulatory parameters. The data were processed both for a single year, in order to see the concentration trend, and considering the whole period as requested by MSFD.
GIS layers were created in geographic coordinates (ETRS 89), using angular measures in order to obtain a 1:1 cell size ratio. In relation to the type of environmental matrices and the geomorphology of subregions, different reference grids were used: a 10-km side grid for water, and a 30-km side and 60-km side for sediments in AS and ICMS/WMS, respectively, while, coherently with the ecological differences (such as mobility, migratory patterns, and feeding habits) of organisms, 10 km per side for mussels, 60 km per side for crustaceans, and 90 km per side for demersal fishes were chosen. The grid sizes were chosen after an evaluation of data availability versus the need for sufficient detail in the resulting assessment.
Each single station was colored in relation to the CQI obtained, according to the following criterion: green color for the good class, orange color for the moderate class, red color for the poor class, and purple color for the worst class.
The station results that fall in the same cell and/or that have the same coordinates (e.g., data relating to the same station, but sampled in different years or related to differences species belonging to the same functional groups or habitats) were integrated following the most represented judgment (highest frequency). If, in the assessment area, the same number of stations with different judgments (green, orange, red, and purple color cell) is present, in compliance with the precautionary principle (Borja et al., 2011; Andersen et al., 2016; Borja et al., 2016), the color with the worst CQI was chosen. However, the use of the precautionary principle in the integration ensures that the risks for false results are avoided (Borja et al., 2011; Andersen et al., 2016). The cells for which it was not possible to define the CQI were not assigned any color.
Hence, in the cartographic representation, the color green had been assigned to cells with majority of stations with good judgment, while the color orange, red, or purple had been assigned to the cells with equal or majority of stations with moderate, poor, or worst judgment, respectively.
3. Results and discussion
3.1. Improvements on monitoring strategy
As indicated above, during the IA (2012) under Directive 2008/56/EC on the Marine Strategy, a large amount of data from monitoring programs and characterization activities of the marine environment for several purposes was recovered, in order to produce the fullest and truest possible assessment of the environmental status. Thus, data from the monitoring of regional agencies, zooprophylactic institutes, universities, research institutes, as well as the Eionet SOE database were used. However, not all collected data were functional for MSFD purposes. Data were collected especially in coastal zones, where the main fishing activities take place; thus, the spatial coverage of the open sea was often lacking. In this phase, it was not possible to assign a rating in many stations, or it was partially allocated, because the number of analytes with concentration data or the contaminants category was not sufficiently populated to allow a complete assessment.
Consequently, Italy in the first cycle of MSFD began to review and adapt monitoring to GES needs and contaminant trends assessment, starting with information from the previous IA. A specific monitoring plan, in which an apparent reduction of sampling points (stations) was carried out as a result of improved spatial arrangements providing an effective picture of the subregion under investigation, was therefore performed. In addition, the economic savings resulting from the new spatial arrangement made it possible to optimize the determination of the analytes necessary for the environmental status assessment, allowing better information to be obtained.
A further improvement has been reached with the second cycle of MSFD. The monitoring strategy has provided for the general implementation of the spatial coverage in order to reduce the information gap that emerged from the IA and the first cycle of MSFD. The effort to monitor the most conservative matrices, such as sediments and biota, has been conducted, reducing water monitoring and increasing the spatial coverage both near the coast and in offshore areas. Concerning biota, the organisms’ collection on more widespread and commercial species such as mullets, cod, and crustaceans or mussels was planned. The better spatial coverage and the optimized organism’s collection performed in 2019, 2020, and 2021 allowed, compared to previous data, a greater accuracy in obtained information. Thus, the quality status assessment is carried out on the basis of data derived from the functional and specific monitoring under the MSFD.
The GIS elaborations, carried out through the use of the CQI, have allowed the comparison of the time of the different phases of MSFD monitoring, performed in order to estimate the marine chemical status and to determine if the GES has been reached. The results of all stations included into the same cell were integrated. For each contaminant category, different integration levels were performed: data within the same station, several stations falling in the same grid cell, and same grid cell in different years.
Here are some examples of the potential of this integrated index applied to sediment and biota matrices.
3.2. Sediments
Concerning this matrix, the greater effectiveness of a reasoned and correctly planned sampling design was observed. The spatial coverage varied considerably in the second cycle of MSFD where a percentage of more than 50% was reached in all three Italian subregions, with a maximum of 71% in the Adriatic Sea subregion (Figure 3). In this subregion, during the IA and the first MSFD cycle, a spatial coverage of 19% and 41%, respectively, was not sufficient to express a quality judgment on the environmental status of the entire area (Figure 4).
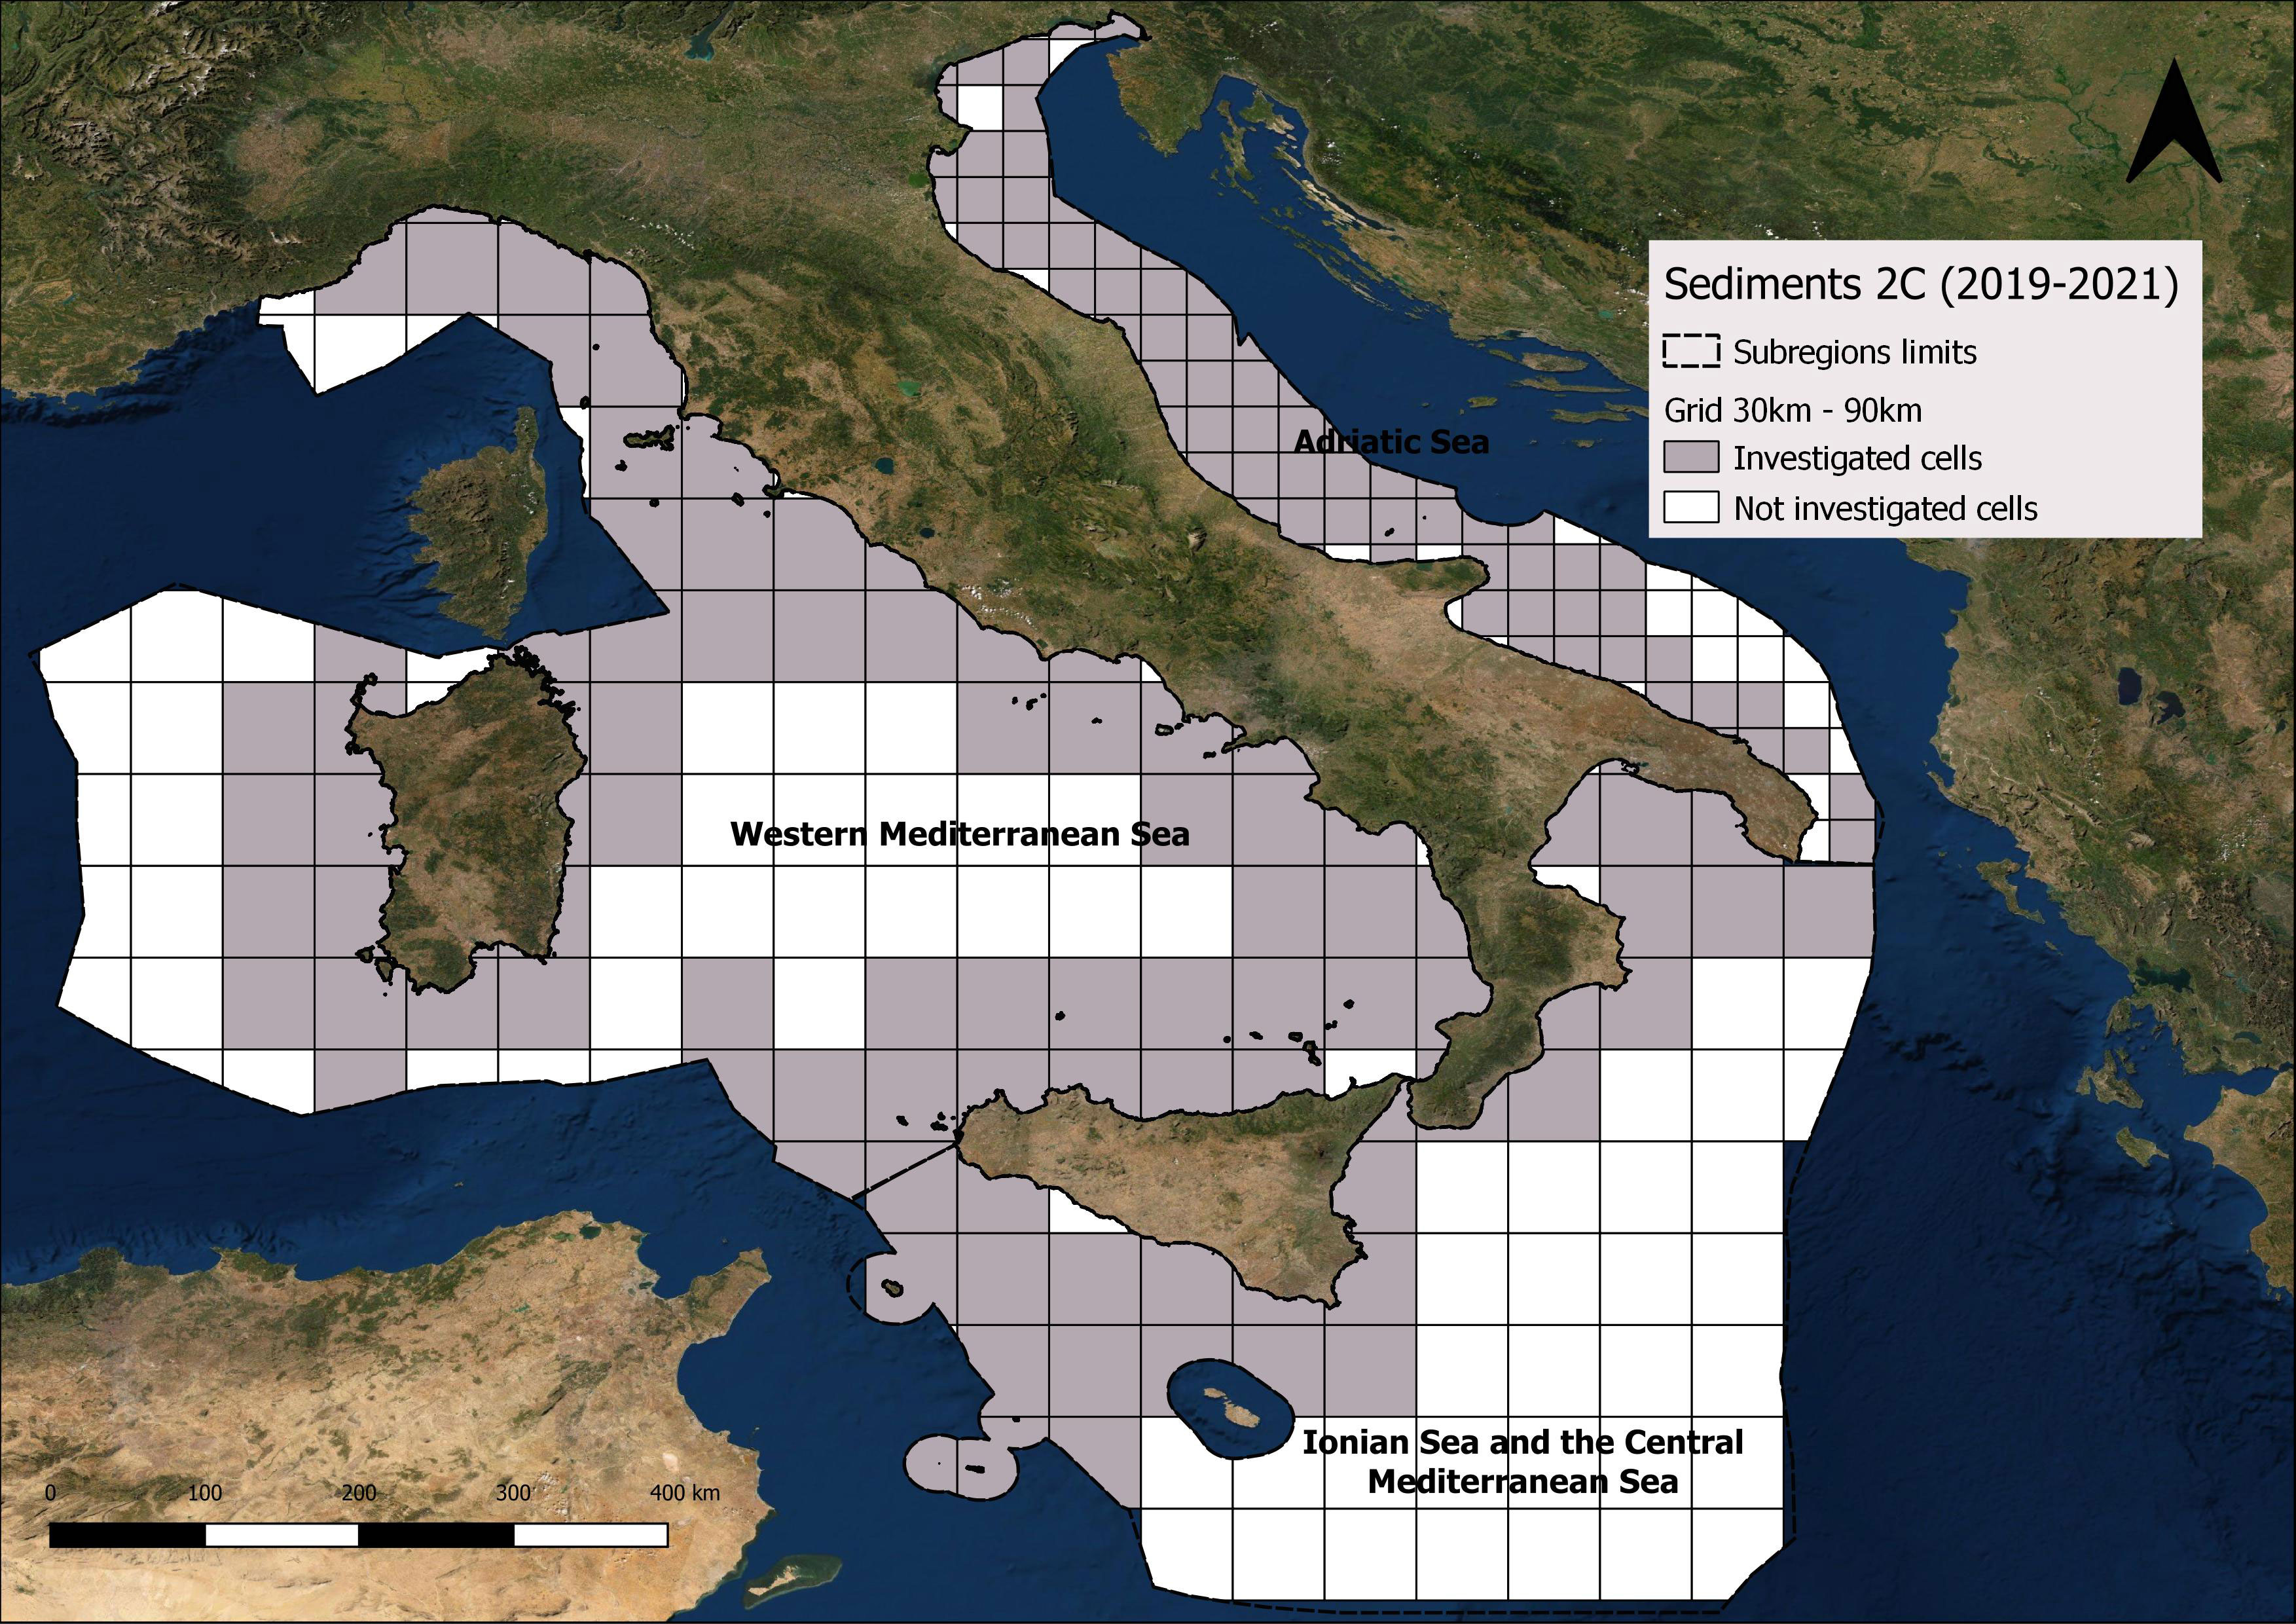
Figure 3 Coverage of sediment sampling in all Italian subregions in the second cycle of MSFD (2019–2021).

Figure 4 Coverage of sediment sampling in the Adriatic Sea in Initial Assessment 2006–2012, First Cycle 2013–2018, and Second Cycle 2019–2021 of MSFD monitoring.
In the second cycle of MSFD, with the new monitoring plan, a good percentage of investigated cells was obtained to assess whether the monitored area reached the GES. Figure 4 shows the CQI elaborations carried out in the Adriatic Sea subregion. The index application at the matrix level allowed one to verify that the percentage of investigated cells in good condition relating to the D8C1 criterion is already 37% at the beginning of the second cycle of MSFD.
Considering that the subsequent processing steps could possibly trace the element more than the others influenced the judgment. The mercury index showed very few EQS exceedances, with almost all cells in good condition while the upper level, contaminant category (metal category), showed only 40% of the cells in good condition, because other elements (in this case chromium) had exceeded the EQS value. By the subsequent integration among contaminants categories, the final evaluation at the matrix level with 37% of the cells in good condition is obtained (Figure 5).
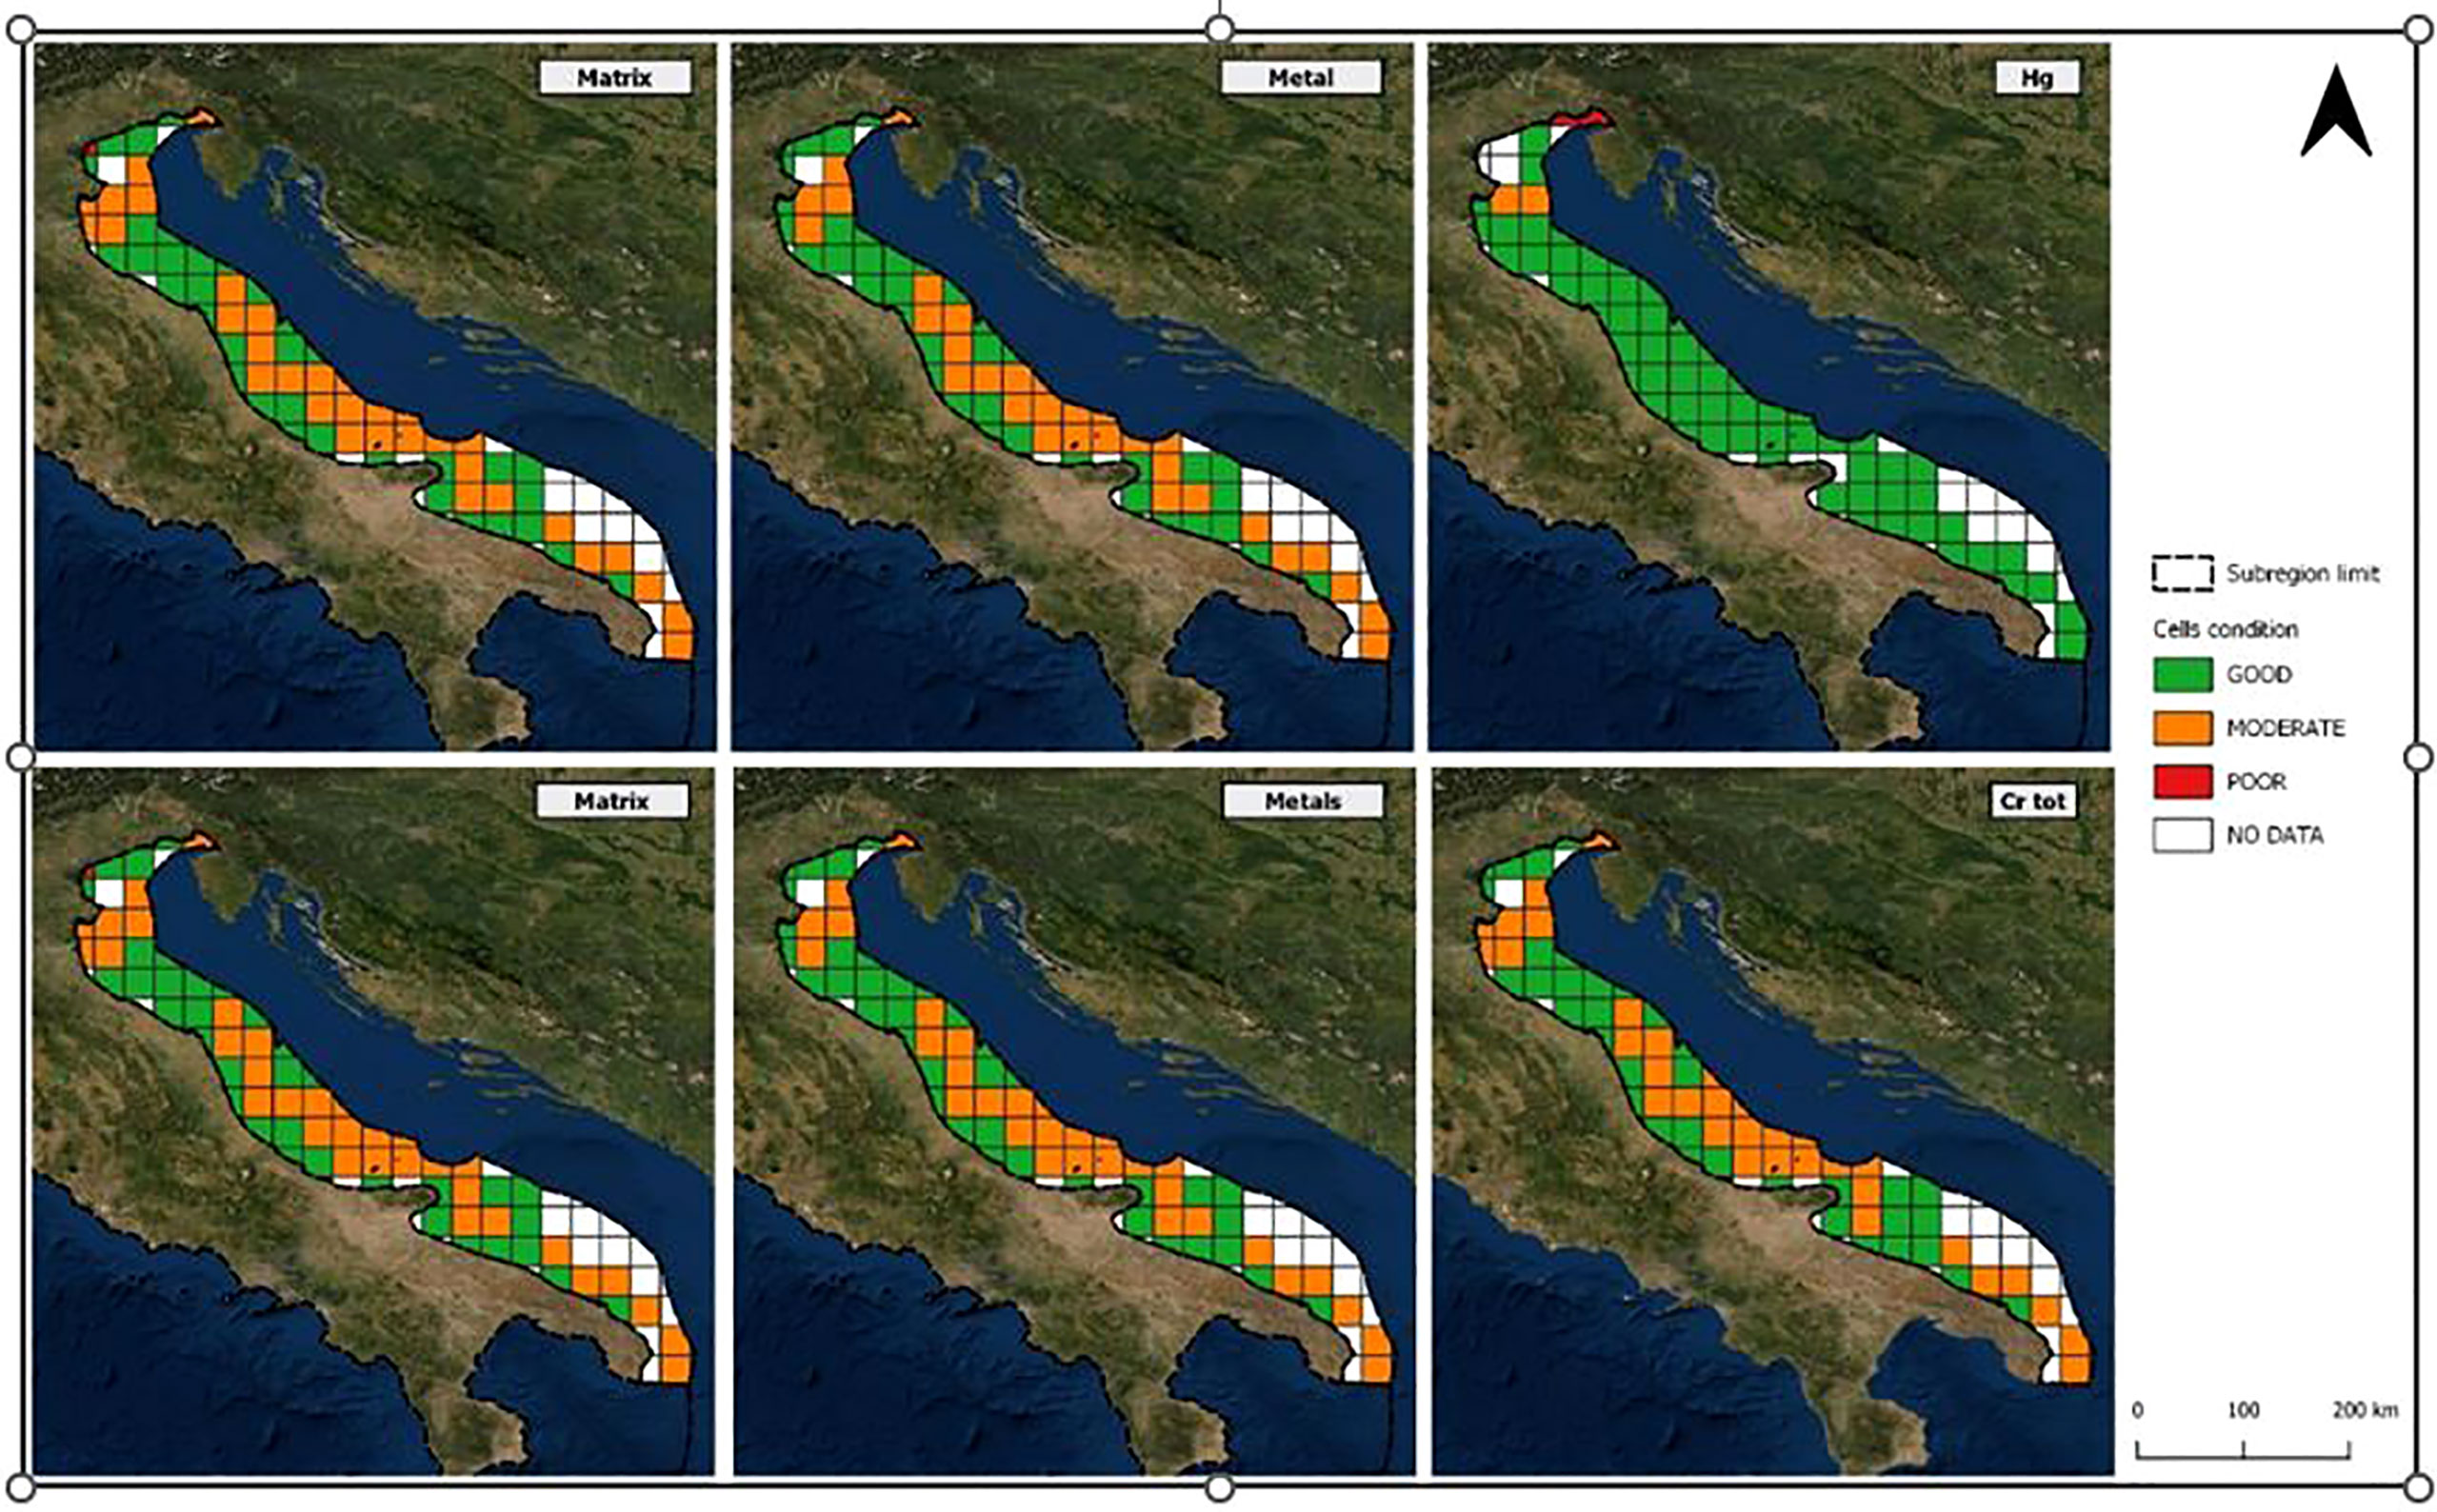
Figure 5 CQI elaborations in the Adriatic Sea subregion in 2019–2021 of MSFD. Integration steps at the matrix level, at the contaminant category level, and at the single substance level (e.g., Hg and Cr tot).
This elaboration process highlighting cases of exceeding results allows respecting the precautionary principle but, at the same time, overcomes the restrictions of the OOAA principle (WFD directive), which assesses the matrix in a bad state with a single exceedance.
3.3. Biota
To assess marine environment quality, data collected for the species belonging to the Demersal Fish (DF) functional group and the Littoral Rock (LR), Littoral Sediment (LS), and Shelf Sublittoral Mixed Sediment habitats (Table 4) have been separately assessed and subsequently aggregated as a whole biota matrix.
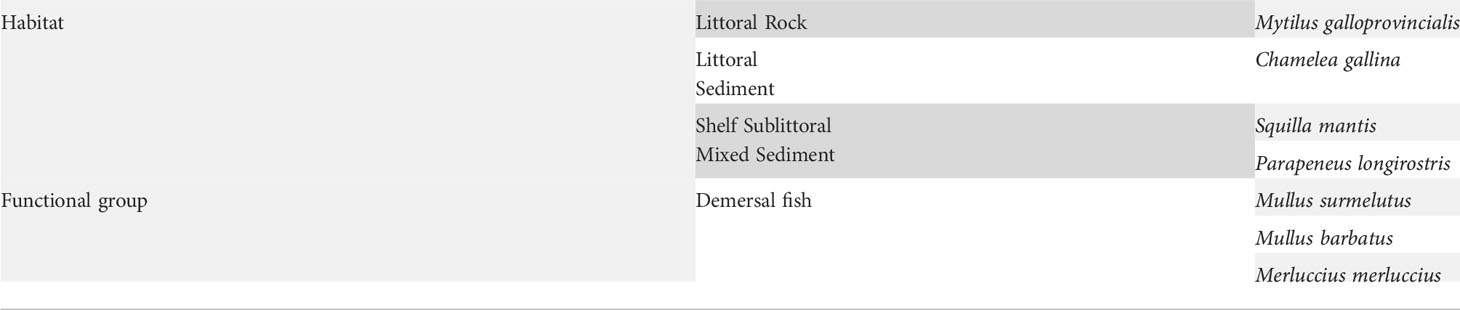
Table 4 Main species measured for each habitats and functional groups.
Figure 6 represents the spatial coverage of the sampling relating to the overall biota matrix (DF, LR, crustaceans, and LS) in the Adriatic subregion. A reference grid useful for the purpose was used.
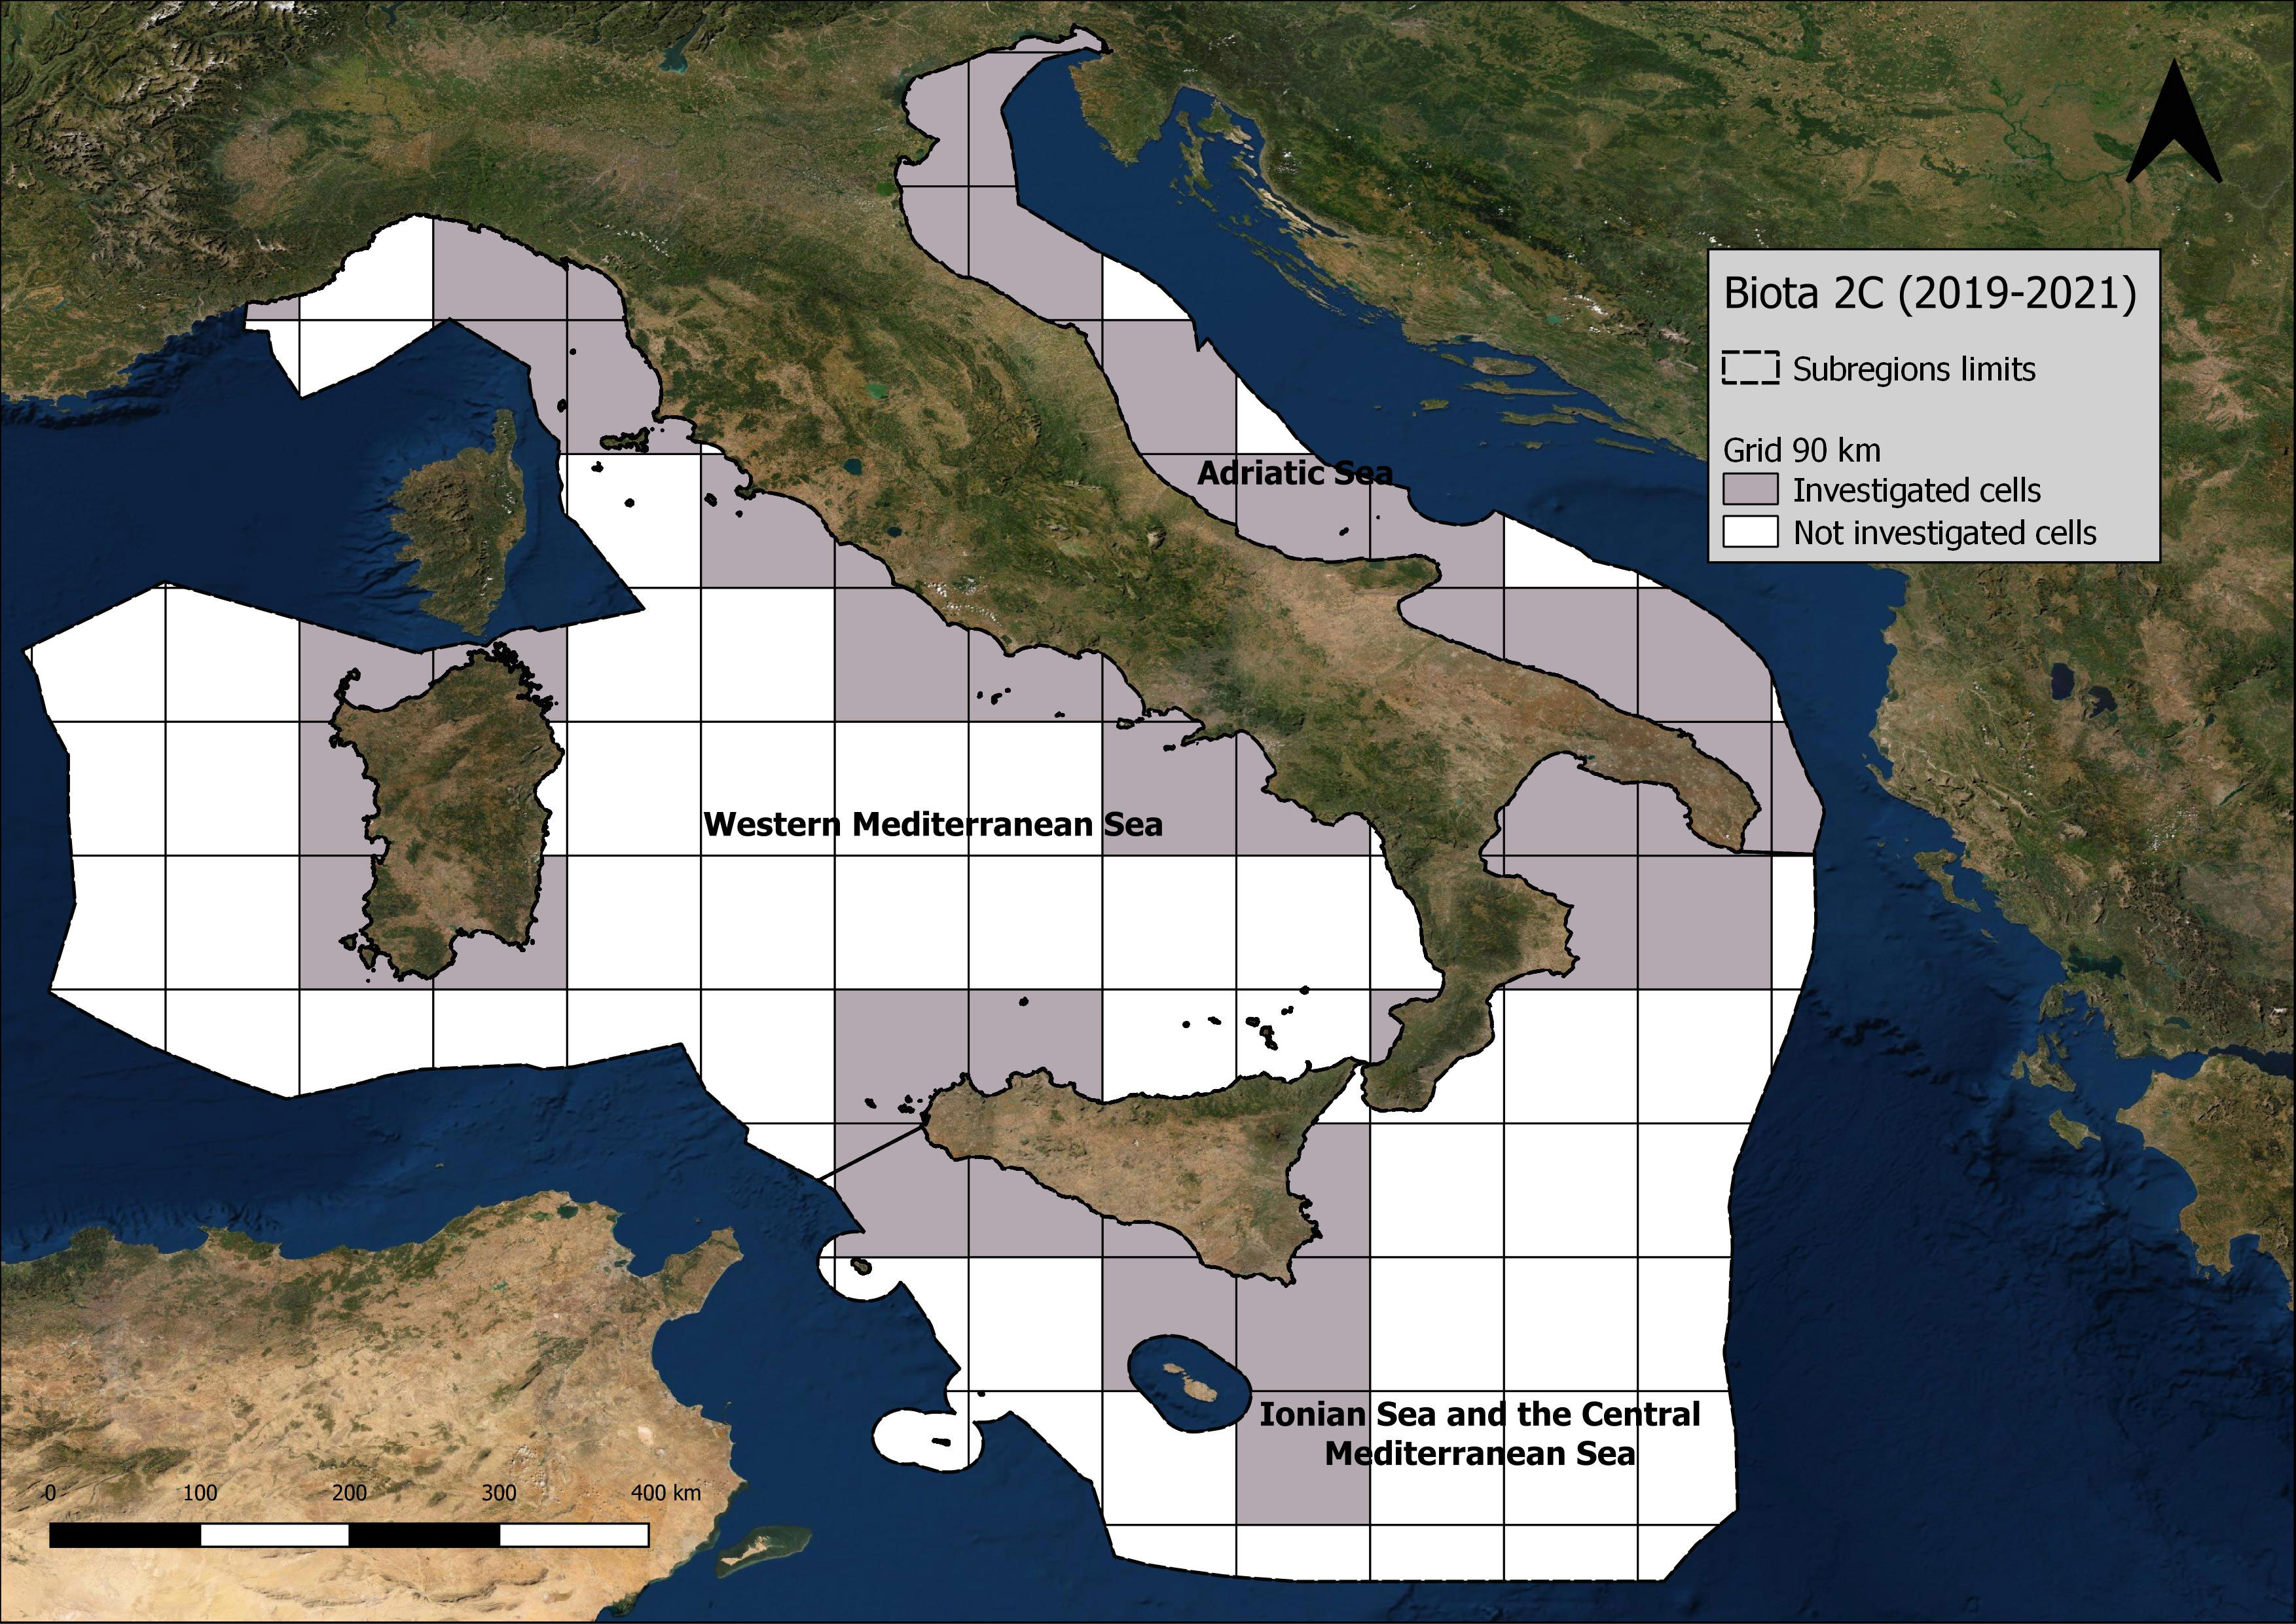
Figure 6 Coverage of biota sampling in all Italian subregions in the second cycle of MSFD (2019–2021).
Similarly to sediments, it is evident how a reasoned and planned sampling allows the significant optimization of the information obtained. During the IA, collected data were related above all to the LR habitat, while in the first MSFD cycle, data concerned the LR habitat and the DF functional group. Then, in the second MSFD cycle, an improved monitoring strategy was adopted, such as increasing the spatial coverage and adding other functional group sampling. From IA to the first and second cycles, spatial coverage increased from 41% to 71%, especially in the Adriatic subregion, and organism species increased from belonging only to the LR habitat to the DF functional group and the LR, LS, and Shelf Sublittoral Mixed Sediment habitats (specifically crustaceans) (Figure 6).
As regards IA in the Adriatic subregion, several stations were classified as not judicable because there was no sufficient number of analytes to allow a complete evaluation of category or matrix. However, in the judicable cells (19%), organisms belonging only to the LR habitat were found to be in good condition with respect to EQS values.
With regard to the first cycle of MSFD, samples of organisms related to the LR habitat and the DF functional group coming from the same stations were collected and analyzed. Here, a reasoned sampling plan in which the list of contaminants to be investigated was planned in advance was implemented so that a more efficient sampling design could calculate the index and, consequently, express an evaluation for most of the stations. The monitored stations were assessed as having a good status. The inclusion of other organisms (DF as well as organisms from the LR habitat) confirmed the robustness of the assessment.
In the second cycle of MSFD, the organisms’ collection on more widespread and commercial species (DF functional group, LR, LS, and crustaceans) was planned. The better spatial coverage and the optimized organism’s collection in 2019, 2020, and 2021 have allowed, compared to previous data, a greater accuracy in obtained information (Figure 7).

Figure 7 Coverage of biota sampling in the Adriatic Sea in the three phases of MSFD (Initial Assessment 2006–2012, First Cycle 2013–2018, and Second Cycle 2019–2021).
Figure 8, similarly to the reported processing for sediments, shows an example of biota CQI elaboration. Data elaborations concern the integration at the biota matrix level and the integration at the category level, where different results for organochlorinated compounds and metals were obtained. The OCCs category overall had good status while the metals category, populated exclusively by mercury, showed many overshoots that affected the result of the entire matrix. Thus, the biota matrix representation followed the trend of mercury, with only 17% of cells in GES. With regard to the group of substances determining the assessment of the “biota” matrix, the general picture is similar to that found for “sediment”. Metals, ranked first for sediment, are also decisive for biota.
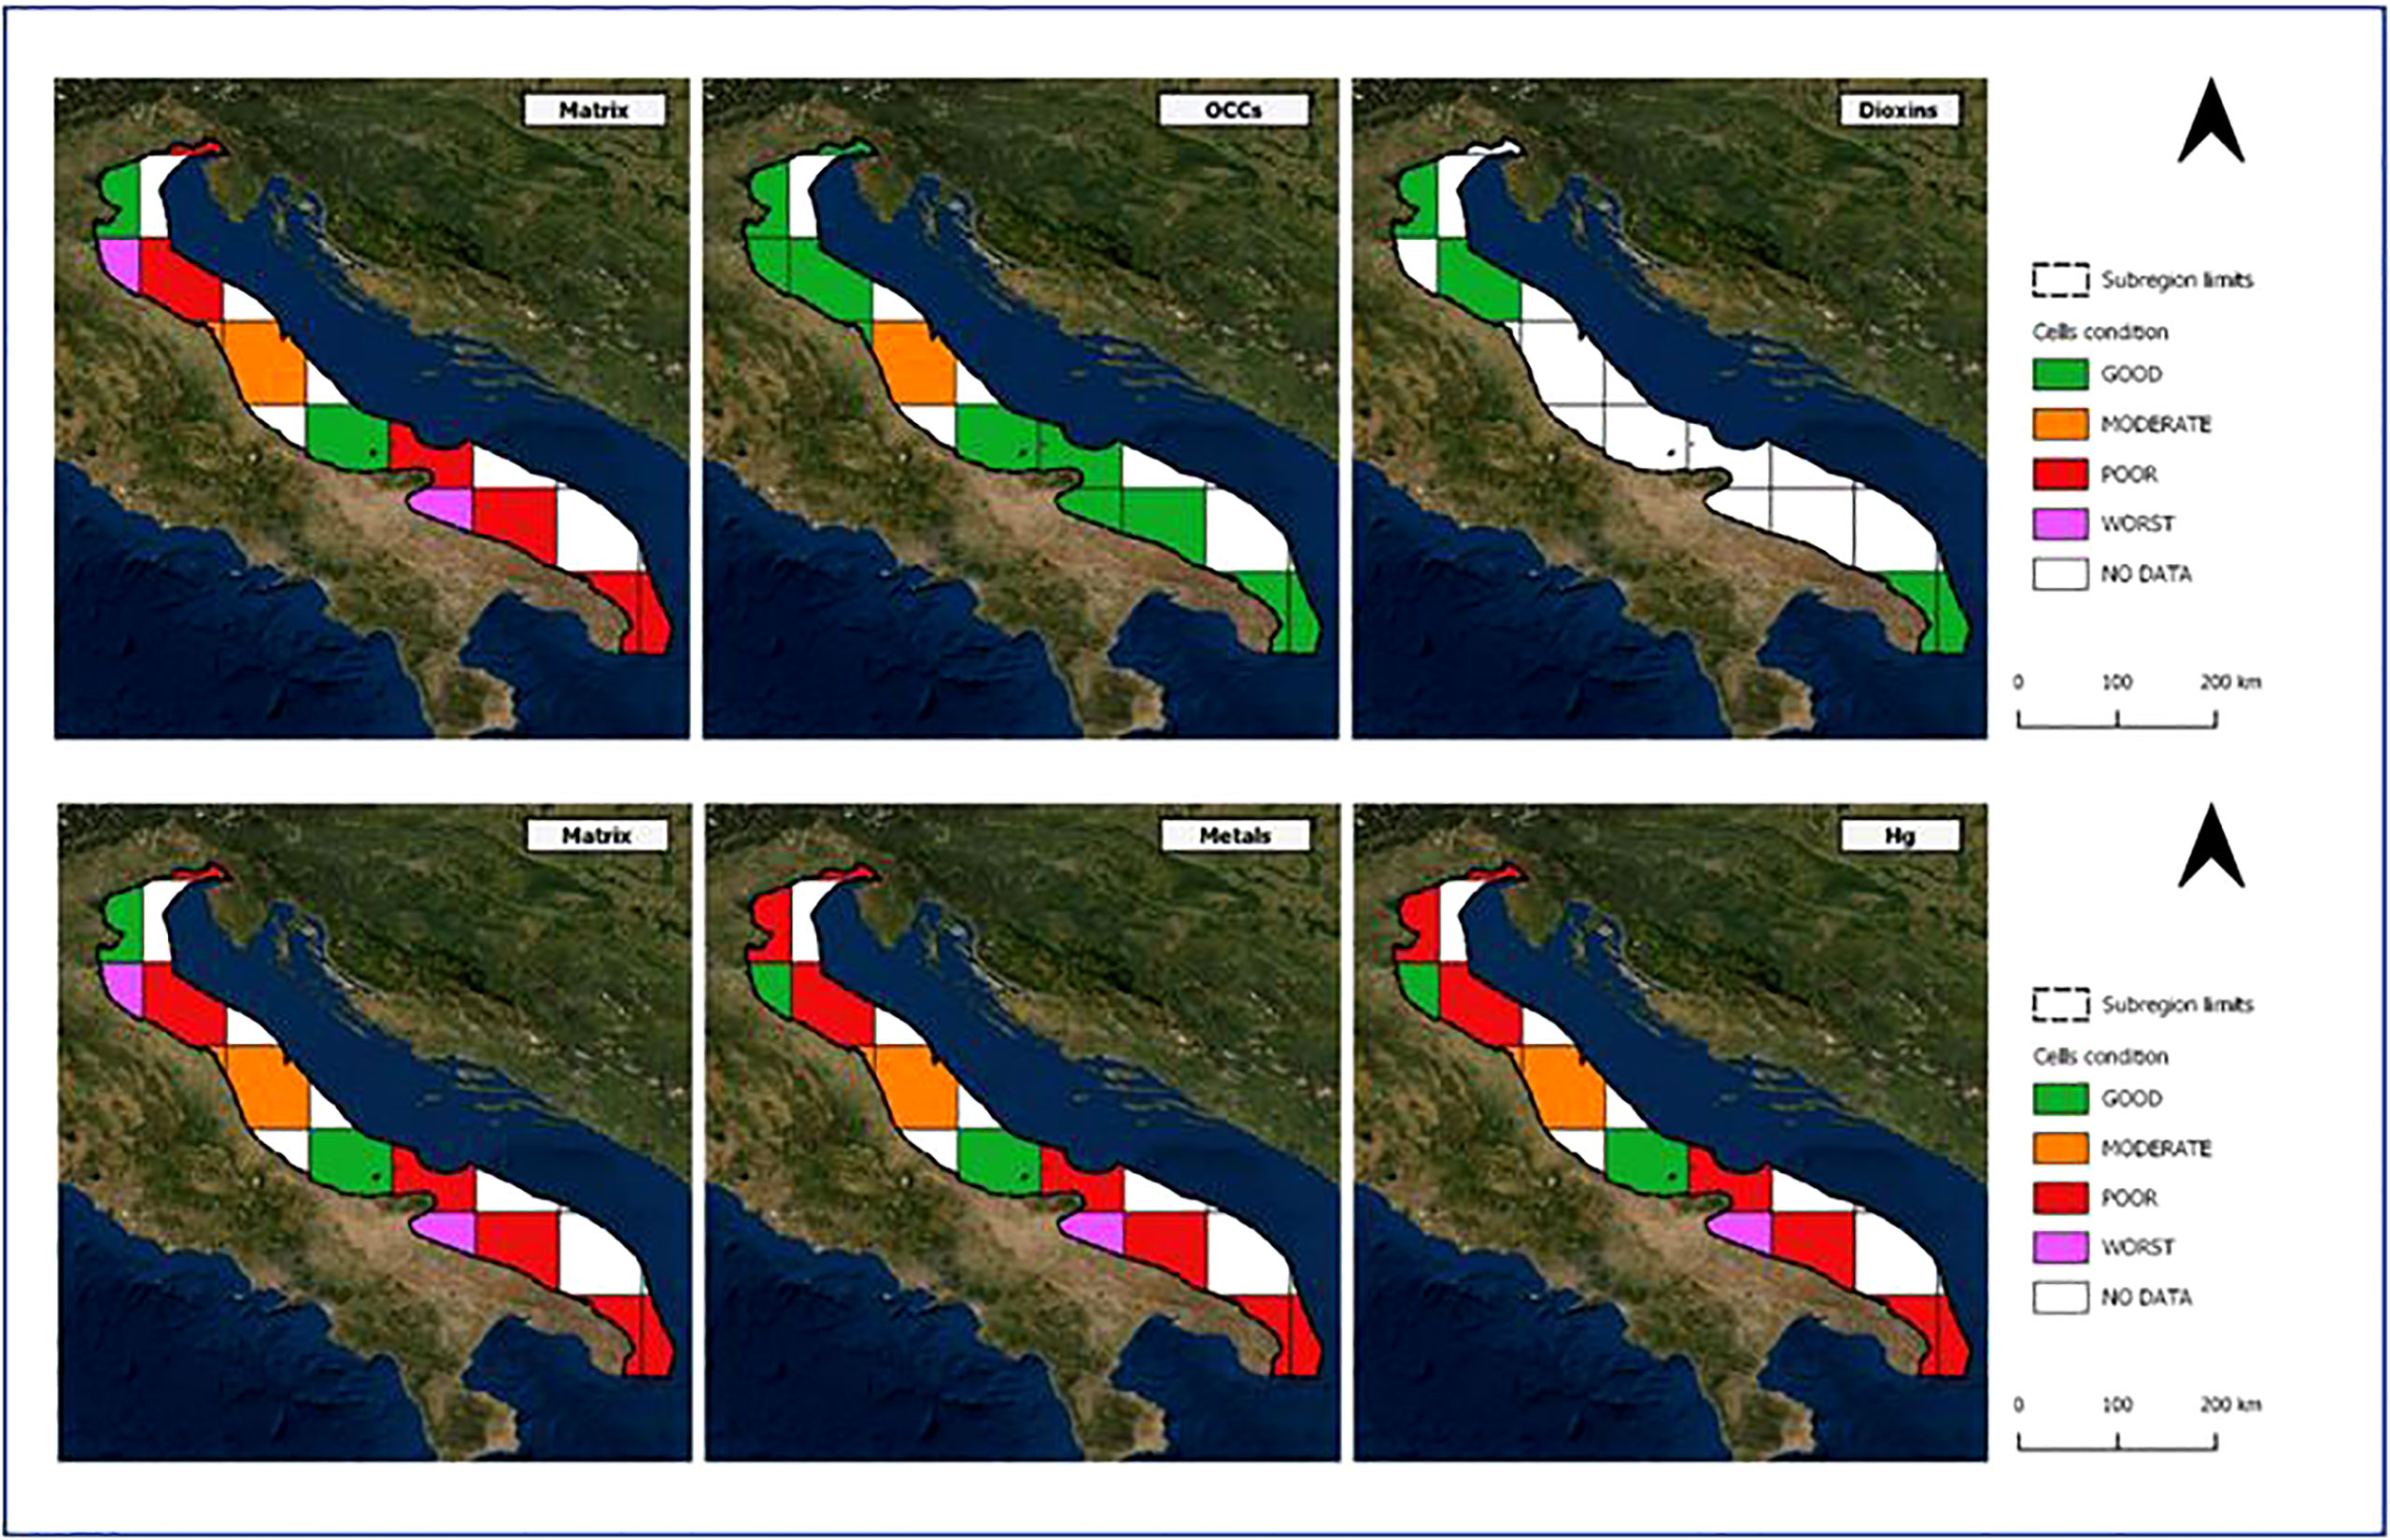
Figure 8 CQI elaborations in the Adriatic Sea subregion in 2019–2021 of MSFD. Integration steps of biota matrix, contaminant category, and single substance.
Comparing the CQI results with those present in similar works of EEA (25/2018 Report) and UNEP (UNEP/MED WG.533/5), where the HELCOM approach is used, some outcomes are in common although the processing method and the threshold limits are different.
Nevertheless, also in the EEA 25/2018 Report, where the processing refers to the entire Mediterranean Sea and threshold levels are more lenient than EQS, several areas are critical for sediments and biota matrices, with metal concentration values often exceeding the limits. This matter is known, as the contamination of the aquatic environment by metals is a global problem that has occurred for several decades due to the various uses of metals and with the increase in coastal urbanization. This contamination affects coastal ecosystems and matrices such as sediments or biota with potential bioaccumulation effects (Tzempelikou et al., 2021). In the UNEP/MAP Report, although the processing is referred to the Adriatic Sea subregion, the elaboration’s results show a good overall situation not only for the different threshold limits, which are less restrictive than EQS values, but also for the choice to use the average criterion rather than the precautionary principle.
Going deeper, according the EQS Directive, the only metal monitored for biota in the CQI approach is mercury, which weighs heavily on the final integration; the HELCOM approach, used by EEA and UNEP, monitors cadmium and lead too. Furthermore, a different grid depending both on the matrix and on the species investigated is applied in the CQI approach. In the HELCOM approach, the same grid is used for all matrices, differentiated only by the distance from the coast (20 × 20 km2 in coastal waters and 100 × 100 km2 in offshore areas). However, in CQI elaborations, the larger cells are covered by the smaller ones, allowing for an overlap of the results. This provides a detailed information that can help in the next step of integrating the different matrices.
4. Conclusion
The study described here demonstrated that the approach applied since 2012 (IA) by Italy to determine the GES for the Italian MRUs has provided a suitable and robust tool for supporting the determination of GES in relation to Descriptor 8. This approach is based on the use of a dimensionless index, centered at zero, which allows for an overall assessment of all regulatory contaminants. In this way, the multiple information relating to the concentrations of the single contaminant was condensed, and the resulting judgment allowed a clear representation of the achievement (or non-achievement) of the GES. The elaboration process thus constructed made it possible to respect the precautionary principle and, at the same time, to exceed the OOAA principle of the WFD directive, which evaluates the matrix in bad condition with a single parameter excess.
Examples of the results processed with this index were presented starting with the IA, the first cycle of MSFD, and the beginning of the second cycle. Between one cycle and the next, information was gathered and analyzed in order to evaluate the current status and to identify existing gaps, for a better understanding on where efforts should be focused further to improve knowledge in the field of marine pollution.
This method can be used not only under the EU Marine Strategy Framework Directive but also under different environmental policies for assessing the contamination status in the marine environment. Nevertheless, the results provided here can be a good starting point to evaluate the current situation, to suggest some improvements for contaminant monitoring and support further work on implementing EU Directives.
More research dedicated to methods to study hazardous substances and the effect on organisms and the ecosystem is needed. However, a main factor affecting the partial as well as the integrated assessment results is the further integration between matrices in order to arrive at a single judgment for the marine environment.
Data availability statement
Publicly available datasets were analyzed in this study. This data can be found here: the Centralized Information System (SIC), http://www.db-strategiamarina.isprambiente.it/.
Ethics statement
The animal study was reviewed and approved by Experimental Zooprophylactic Institutes; Institute for Environmental Protection and Research (ISPRA).
Author contributions
CM conceived the paper; CM, MB, and SL wrote the manuscript, and edited and reviewed the final version of the manuscript, which all the authors approved before submission; BL contributed to statistical and weighted elaboration of data; FV gathered and analyzed the data, and designed figures and tables with input and revisions from all authors. All authors contributed to the article and approved the submitted version.
Funding
This work has been carried out by the Institute for Environmental Protection and Research (ISPRA) on behalf of the Italian Ministry of Environment (http://www.strategiamarina.isprambiente.it/).
Acknowledgments
This research has been carried out with financial support from the National Monitoring Programme of Ministry of Environment. The authors thank the technicians of the SNPA Agencies and Experimental Zooprophylactic Institutes for the provided data. We are grateful to the ISPRA colleagues Marco D’Antona and Andrea Colasanti who contributed to this work realization.
Conflict of interest
The authors declare that the research was conducted in the absence of any commercial or financial relationships that could be construed as a potential conflict of interest.
Publisher’s note
All claims expressed in this article are solely those of the authors and do not necessarily represent those of their affiliated organizations, or those of the publisher, the editors and the reviewers. Any product that may be evaluated in this article, or claim that may be made by its manufacturer, is not guaranteed or endorsed by the publisher.
Abbreviations
AS, Adriatic Sea; CQI, Chemical Quality Index; EQS, Environmental Quality Standard; ERL, threshold effect level; ERM, probable effect level; EU, European Union; GES, Good Environmental Status; IA, Initial Assessment; ISCMS, Ionian Sea and the Central Mediterranean Sea; ISPRA, Italian Institute for Environmental Protection and Research; MRU, Marine Reporting Unit; MS, Marine Strategy; MSFD, Marine Strategy Framework Directive; OCCs, organo-chlorinated compounds; OOAO, one out, all out; PAH, polycyclic aromatic hydrocarbons; PBDEs, polybrominated diphenyl ethers; PFOS, perfluorooctane sulfonate; PoM, programs of monitoring; WFD, Water Framework Directive; WMS, Western Mediterranean Sea.
References
Andersen J. H., Murray C., Larsen M. M., Green N., Høgåsen T., Dahlgren E., et al. (2016). Development and testing of a prototype tool for integrated assessment of chemical status in marine environments. Environ. Monit. Assess. 188, 115. doi: 10.1007/s10661-016-5121-x
Apitz S. E., Elliott A. M., Fountain M., Galloway T. (2006). European Environmental management: Moving to an ecosystem approach. Integr. Environ. Assess. Manage. 2 (1), 80–85. doi: 10.1897/1551-3793(2006)2[80:EEMMTA]2.0.CO;2
Bellas J. (2014). The implementation of the marine strategy framework directive: Shortcomings and limitations from the Spanish point of view. Mar.Pol. 50, 10–17. doi: 10.1016/j.marpol.2014.05.004
Benedetti M., Ciaprini F., Piva F., Onorati F., Fattorini D., Notti A., et al. (2011). A multidisciplinary weight of evidence approach for classifying polluted sediments: Integrating sediment chemistry, bioavailability, biomarkers responses and bioassays. Environ. Int. 38(1), 17–28. doi: 10.1016/j.envint.2011.08.003
Berto D., Formalewicz M., Giorgi G., Rampazzo F., Gion C., Trabucco B., et al. (2020). Challenges in harmonized assessment of heavy metals in the Adriatic and Ionian seas. Front. Mar. Sci. Sec. Mar. Pollut 7, 717. doi: 10.3389/fmars.2020.00717
Borja A., Elliott M., Andersen J. H., Berg T., Carstensen J., Halpern B., et al. (2016). Overview of integrative assessment of marine systems: The ecosystem approach in practice. Front. Mar. Sci. 3, 20. doi: 10.3389/fmars.2016.00020
Borja A., Elliott M., Andersen J. H., Cardoso A. C., Carstensen J., Ferreira J. G., et al. (2013). Good environmental status of marine ecosystems: What is it and how do we know when we have attained it? Mar. Pol. Bul. 76 (1-2), 16–27. doi: 10.1016/j.marpolbul.2013.08.042
Borja A., Elliott M., Carstensen J., Heiskanen A., Van de Bund W. (2010b). Marine management – towards an integrated implementation of the European marine strategy framework and the water framework directives. Mar. Pol. Bul. 60, 2175–2186. doi: 10.1016/j.marpolbul.2010.09.026
Borja A., Galparsoro I., Irigoien X., Iriondo A., Menchaca I., Muxika I., et al. (2011). Implementation of the European marine strategy framework directive: a methodological approach for the assessment of environmental status, from the Basque country (Bay of Biscay). Mar.Pol.Bul. 62, 889–904. doi: 10.1016/j.marpolbul.2011.03.031
Borja A., Menchaca I., Garmendia J. M., Franco J., Larreta J., Sagarminaga Y., et al. (2021). Big insights from a small country: The added value of integrated assessment in the marine environmental status evaluation of Malta. Front. Mar. Sci. Sec. Mar. Ecosys. Ecol. 8, 638232 doi: 10.3389/fmars.2021.638232
Borja A., Rodríguez J. G. (2010a). Problems associated with the ‘one-out, all-out’ principle, when using multiple ecosystem components in assessing the ecological status of marine waters. Mar. Pol. Bul. 60 (8), 1143–1146. doi: 10.1016/j.marpolbul.2010.06.026
Caeiro S., Costa M. H., Ramos T. B., Fernandes F., Silveira N., Coimbra A., et al. (2005). Assessing heavy metal contamination in sado estuary sediment: An index analysis approach. Ecol. Indic. 5, 151–169. doi: 10.1016/j.ecolind.2005.02.001
Chapman P. M. (2007). Determining when contamination is pollution _ weight of evidence determinations for sediments and effluents. Environ. Int. 33, 492–501. doi: 10.1016/j.envint.2006.09.001
Cheng J., Shi Z., Zhu Y. (2007). Assessment and mapping of environmental quality in agricultural soils of zhejiang province, China. J. Environ. Sci. 19, 50–54. doi: 10.1016/S1001-0742(07)60008-4
Dagnino A., Bo T., Copetta A., Fenoglio S., Oliveri C., Bencivenga M., et al. (2013). Development and application of an innovative expert decision support system to manage sediments and to assess environmental risk in freshwater ecosystems. Environ. Int. 60, 171–182. doi: 10.1016/j.envint.2013.08.011
Dagnino A., Sforzini S., Dondero F., Fenoglio S., Bona E., Jensen J., et al. (2008). A “Weight-of-Evidence”approach for the integration of environmental “Triad” data to assess ecological risk and biological vulnerability. Integr. Environ. Assess. Manage. 4, 314–326. doi: 10.1897/IEAM_2007-067.1
Dagnino A., Viarengo A. (2014). Development of a decision support system to manage contamination in marine ecosystems. Sci. Total Environ. 466–467, 119–126. doi: 10.1016/j.scitotenv.2013.06.084
Danovaro R., Carugati L., Berzano, Cahill A. E., Carvalho S., Chenuil A., et al. (2016). Implementing and innovating marine monitoring approaches for assessing marine environmental status. Front. Mar. Sci. 23. doi: 10.3389/fmars.2016.00213
Elliott M., Boyes S. J., Barnard S., Borja A. (2018). Using best expert judgement to harmonise marine environmental status assessment and maritime spatial planning. Mar. Pollut. Bull. 133, 367–377. doi: 10.1016/j.marpolbul.2018.05.029
European Commission (2018) Reporting on the 2018 update of articles 8, 9 & 10 for the marine strategy framework directive. DG environment, Brussels. Available at: http://cdr.eionet.europa.eu/help/msfd.
Fraschetti S., Fabbrizzi E., Tamburello L., Uyarra M. C., Micheli F., Borja A., et al. (2022). An integrated assessment of the good environmental status of Mediterranean marine protected areas. J. Environ. Manage 305, 114370. doi: 10.1016/j.jenvman.2021.114370
Gago J., Viñas L., Besada V., Bellas J. (2014). The link between descriptors 8 and 9 of the marine strategy framework directive: lessons learnt in Spain. Environ. Sci. pollut. Res. 21, 13664–13671. doi: 10.1007/s11356-014-3283-z
Gong Q., Deng J., Xiang Y., Wang Q. (2008). Calculating pollution indices by heavy metals in ecological geochemistry assessment and a case study in parks of Beijing. J. China Univ. Geosci. 19, 230–241. doi: 10.1016/S1002-0705(08)60042-4
Heiskanen A., Van De Bund W., Cardoso A., Noges P. (2004). Towards good ecological status of surface waters in europe. intepretation and harmonisation of the concept. Water Sci. Technol. 49(7), 169–177. doi: 10.1016/j.eiar.2007.01.002
Law R., Hanke G., Angelidis M., Batty J., Bignert A., Dachs J., et al. (2010). “Task group 8 contaminants and pollution effects,” in Marine strategy framework directive (Luxembourg (Luxembourg: Publications Office of the European Union). doi: 10.2788/85887
Long E. R., Morgan L. G. (1990). The Potential For Biological Effects Of Sediment-Sorbed Contaminants Tested In The National Status And Trends Program NOAA Technical Memorandum NOS OMA 52- August 1991.
Maggi C., Ausili A., Boscolo R., Cacciatore F., Bonometto A., Cornello M., et al. (2012). Sediment and biota in trend monitoring of contaminants in transitional waters. Trends Anal. Chem. 36, 82–91. doi: 10.1016/j.trac.2012.01.006
Maggi C., Onorati F., Virno Lamberti C., Cicero A. M. (2008). The hazardous priority substances in Italy: National rules and environmental quality standard in marine environment. Environm. Imp. Assess. Rev. 28, 1–6. doi: 10.1016/j.eiar.2007.01.002
Martínez-Gomez C., Fernandez B., Robinson C. D., Campillo J. A., Leon V. M., Benedicto J., et al. (2017). Assessing environmental quality status by integrating chemical and biological effect data: The cartagena coastal zone as a case. Mar. Envir. Res. 124, 106–117. doi: 10.1016/j.marenvres.2016.04.008
Muniz P., Venturini N., Pires-Vanin A. N., Tommasi L. R., Borja A. (2005). Testing the applicability of a marine biotic index (AMBI) to assessing the ecological quality of soft-bottom benthic communities, in the south America Atlantic region. Mar. Pol. Bul. 50, 624–637. doi: 10.1016/j.marpolbul.2005.01.006
Pavlidoua A., Simboura N., Pagou K., Assimakopoulou G., Gerakaris V., Hatzianestis J., et al. (2019). Using a holistic ecosystem-integrated approach to assess the environmental status of saronikos gulf, Eastern Mediterranean. Ecol. Indicat. 96, 336–350. doi: 10.1016/j.ecolind.2018.09.007
Piva F., Ciaprini F., Onorati F., Benedetti M., Fattorini D., Ausili A., et al. (2011). Assessing sediment hazard through a weight of evidence approach with bioindicator organisms: A practical model to elaborate data from sediment chemistry, bioavailability, biomarkers and ecotoxicological bioassays. Chem. 83, 475–485. doi: 10.1016/j.chemosphere.2010.12.064
Regoli F., d’Errico G., Nardi A., Mezzelani M., Fattorini D., Benedetti M., et al. (2019). Application of a weight of evidence approach for monitoring complex environmental scenarios: the case-study of off-shore platforms. Front. Mar. Sci. 6, 377. doi: 10.3389/fmars.2019.00377
Rial D., León V. L., Bellas J. (2017). Integrative assessment of coastal marine pollution in the bay of santander and the upper Galician rias. J. Coast. Res. 130, 239–247. doi: 10.1016/j.seares.2017.03.006
Simboura N., Pavlidou A., Bald J., Tsapakis M., Pagou K., Zeri C., et al. (2016). Response of ecological indices to nutrient and chemical contaminant stress factors in Eastern Mediterranean coastal waters. Ecol. Indic. 70, 89–105. doi: 10.1016/j.ecolind.2016.05.018
Thain J. E., Vethaak A. D., Hylland K. (2008). Contaminants in marine ecosystems: developing an integrated indicator framework using biological-effect techniques. ICES J. Mar. Sci. 65, 1508–1514. doi: 10.1093/icesjms/fsn120
Tornero V., d'Alcalà M. R. (2013). Contamination by hazardous substances in the gulf of Naples and nearby coastal areas: a review of sources, environmental levels and potential impacts in the MSFD perspective. Sci. Total Environ., 466–467, 820–840. doi: 10.1016/j.scitotenv.2013.06.106
Tornero V., Hanke G. (2017). Potential chemical contaminants in the marine environment: An overview of main contaminant lists (Luxembourg: Publications Office of the European Union).
Tornero V., Hanke G. (2018). Marine chemical contaminants – support to harmonized MSFD reporting: Substances considered for MSFD descriptor Publications Office of the European Union 8, JRC112387. doi: 10.2760/804610
Tornero V., Hanke G., Ausili A., Haber A., Mauffret A., Maggi C., et al. (2019). “JRC technical reports,” in Marine chemical contaminants – support to the harmonization of MSFD D8 methodological standards, Publications Office of the European Union, Luxembourg, ISBN: ISBN 978-92-79-98395-5. doi: 10.2760/052740
Tzempelikou E., Zeri C., Iliakis S., Paraskevopoulou V. (2021). Cd, Co, Cu, Ni, Pb, zn in coastal and transitional waters of Greece and assessment of background concentrations: Results from 6 years implementation of the water framework directive. Sci. Total Environ. 774, 145177. doi: 10.1016/j.scitotenv.2021.145177
UNEP/ MAP MEDPOL (2015) Updated report on marine litter assessment in the Mediterranean. Available at: http://web.unep.org/unepmap/marine-litter-assessment-mediterranean-2015-0.
Utizi K., Notti E., Sala A., Buzzi A., Rodella I., Simeoni U., et al. (2018). Impact assessment of EMFF measures on good environmental status (GES) as defined by Italy. Mar. Pol. 88, 248–260. doi: 10.1016/j.marpol.2017.12.003
Wernersson A. S., Carere M., Maggi C., Tusil P., Soldán P., James A., et al. (2015). The European technical report on aquatic effect-based monitoring tools under the water framework directive. Environ. Sci. Eur. 27, 7. doi: 10.1186/s12302-015-0039-4
Keywords: MSFD, Descriptor 8, EQS, GES, chemical index, marine matrices, integrated assessment
Citation: Maggi C, Berducci MT, Di Lorenzo B, Lomiri S and Venti F (2022) Integrated chemical status of the Italian marine waters sensu Descriptor 8 of the Marine Strategy Framework Directive. Front. Mar. Sci. 9:1006595. doi: 10.3389/fmars.2022.1006595
Received: 29 July 2022; Accepted: 16 September 2022;
Published: 12 October 2022.
Edited by:
Bernardo Duarte, Center for Marine and Environmental Sciences (MARE), PortugalReviewed by:
Janine Barbara Adams, Nelson Mandela University, South AfricaSamuli Korpinen, Finnish Environment Institute (SYKE), Finland
Copyright © 2022 Maggi, Berducci, Di Lorenzo, Lomiri and Venti. This is an open-access article distributed under the terms of the Creative Commons Attribution License (CC BY). The use, distribution or reproduction in other forums is permitted, provided the original author(s) and the copyright owner(s) are credited and that the original publication in this journal is cited, in accordance with accepted academic practice. No use, distribution or reproduction is permitted which does not comply with these terms.
*Correspondence: Maria Teresa Berducci, bWFyaWF0ZXJlc2EuYmVyZHVjY2lAaXNwcmFtYmllbnRlLml0