 Eun Hye Lee
 Seo Yeol Choi
 Min Ho Seo3
 Ho Young Soh
94% of researchers rate our articles as excellent or good
Learn more about the work of our research integrity team to safeguard the quality of each article we publish.
Find out more
ORIGINAL RESEARCH article
Front. Mar. Sci., 19 October 2022
Sec. Marine Pollution
Volume 9 - 2022 | https://doi.org/10.3389/fmars.2022.1005442
This article is part of the Research TopicCoastal and Marine Environmental Quality AssessmentsView all 28 articles
Gamak Bay is frequently affected by hypoxia in summer. Therefore, this study aimed to examine the effect of hypoxia on the mesozooplankton community of this region. Mesozooplankton samples were obtained biweekly (28 times) at a hypoxic station (inner bay) and a normoxic station (middle bay) using a conical net (mesh size 200 μm; mouth diameter 30 cm) from April 2020 to April 2021. In the inner bay, hypoxia was observed a total of five times between early June and late September, whereas no instances of hypoxia were detected in the middle bay. During the hypoxic period, mesozooplankton abundance was higher in the inner bay than the middle bay (p < 0.05). During the normoxic period, there was no difference between the inner bay and the middle bay (p > 0.05). The dominant species in the hypoxic period were three species of cladocerans (Pleopis polyphemoides, Pseudoevadne tergestina, Penilia avirostris) and the copepod Acartia sinjiensis. The abundance of cladocerans was higher in the inner bay, and that of A. sinjiensis was higher in the middle bay (p < 0.05). In addition to water temperature, salinity, and size-fractionated Chl-a concentration, mesozooplankton abundance was also significantly correlated with the bottom DO concentration. Collectively, our findings suggest that hypoxia can affect mesozooplankton abundance and occurrence times.
Global warming caused by the Industrial Revolution has severely impacted terrestrial and marine environments, resulting in serious socio-economic and political issues (IPCC, 2013). Hypoxia caused by global warming (dissolved oxygen concentration of 2 mg L-1 or less) is one of the most widespread harmful anthropogenic effects on coasts and estuaries (Diaz and Rosenberg, 2008), and is classified as a major global environmental problem, along with ocean acidification, overfishing, and habitat loss (Breitburg et al., 2018). In marine ecosystems, climate change induces an increase in sea levels and water temperature, as well as changes in precipitation and wind patterns, driving environmental changes in coasts and estuaries (Altieri and Gedan, 2015). Additionally, a growing body of evidence has demonstrated that global warming induces hypoxia in coastal regions and estuaries (Bendtsen and Hansen, 2013; Carstensen et al., 2014; Jenny et al., 2014; Altieri and Gedan, 2015).
Dissolved oxygen changes in the ocean are mainly driven by factors such as decreased oxygen solubility, increased stratification, and increased biological respiration (Keeling et al., 2010). Additionally, the increase in hypoxic regions over the past half century is largely due to excessive anthropogenic nutrient loading, which stimulates eutrophication (Kemp et al., 2005). This increases the supply of organic matter to deeper water layers and sediments, causing low oxygenation in the bottom water and resulting in the occurrence of ‘dead zones’ (Diaz and Rosenberg, 2008; Conley et al., 2009). The area range of coastal hypoxia has increased significantly in recent decades due to the increase in coastal eutrophication (Diaz, 2001; Diaz and Rosenberg, 2008; Conley et al., 2009; Rabalais et al., 2010). An assessment of the literature shows that the number of coastal areas with reported hypoxia have increased over time at an exponential growth rate of 5.5% per year (Vaquer-Sunyer and Duarte, 2008). This growth rate may be partly due to increased observational efforts, but the prevalence of hypoxia is expected to increase further due to the combined effects of eutrophication and climate change (Conley et al., 2009).
Hypoxia can be a serious stressor for marine organisms and ecosystems, resulting in community structure changes through increased dominance of less sensitive species or a decrease in the growth of sensitive species (Marcus et al., 2004; Richmond et al., 2006; Roman et al., 2019; Keister et al., 2020). Particularly, mesozooplankton plays a pivotal role in the food web and is a major component of the biological carbon pump. Hypoxia can directly or indirectly affect mesozooplankton community structure, and the tolerance of mesozooplankton to hypoxia varies in a taxon- and stage-dependent manner (Roman et al., 1993; Marcus, 2001; Richmond et al., 2006; Grodzins et al., 2016; Pan et al., 2018). Several studies have focused on the effects of zooplankton in relation to hypoxia. Elliott et al. (2012) found that the abundance of zooplankton was low in the hypoxic bottom waters, but abundant in the upper normoxic waters. Roman et al. (2012) noted that zooplankton shifted the vertical distribution to the upper water column during the day in the Gulf of Mexico where bottom hypoxia occurs. Shi et al. (2019) showed that in regions where hypoxia was observed, the zooplankton biomass was relatively high and the taxonomic diversity was lower. Slater et al. (2020) showed that hypoxia clearly contributed to a decrease in copepods and planktivorous fish, and an increase in gelatinous zooplankton. However, among the various taxonomic groups experiencing hypoxia, some species may respond strongly to these conditions, but the overall effect on the communities is less clear. Therefore, more research is clearly needed to understand the relationship between hypoxia and the various taxonomic groups that inhabit coastal areas.
Mesozooplankton abundance tends to fluctuate greatly within a short period due to the temporal differences in the life strategies of each taxon (Klais et al., 2016). For example, the population of copepods may increase in weeks or months (Hansen et al., 2006), whereas the population of cladocerans may increase in days or weeks (Egloff et al., 1997; Park and Marshall, 2000). Particularly, cladocerans have a very short generation time compared to copepods, and therefore determining their seasonal abundance requires an in-depth understanding of their reproductive characteristics through frequent sampling (Omorii and Ikeda, 1984; Mullin and Onbé, 1992; Atienza et al., 2008). Therefore, to quantitatively evaluate mesozooplankton populations and communities, the survey period and interval must be considered by reflecting the reproductive characteristics of taxonomic groups (Omorii and Ikeda, 1984; Klais et al., 2016).
Keister et al. (2020) reported that the two most common effects of hypoxia in the Hood Canal (Washington, USA) were lower total abundance and biomass of zooplankton and higher abundance of gelatinous zooplankton. However, the hypothesis that hypoxia leads to a dominance of cyclopoid copepods relative to calanoid copepods was not clearly demonstrated. In Masan Bay, Korea, where hypoxia commonly occurs in summer, a cladoceran species was positively correlated with low DO, suggesting that hypoxia could have an effect on the population growth of cladocerans (Jang et al., 2015). Moreover, copepods and cladocerans predominate in eutrophic coastal and estuarine environments depending on the region (Soh et al., 2002; Isinibilir et al., 2008; Isinibilir, 2009; Rakhesh et al., 2013; Li et al., 2022). However, despite their high abundance, few studies have investigated the effect of hypoxia on copepods and cladocerans.
Gamak Bay has been the subject of intensive research in relation to hypoxia in recent decades (Kim et al., 2010; Seo et al., 2012; Shin et al., 2013; Lee et al., 2016; Lee et al., 2019). Unlike detailed studies focusing on the response and abundance of taxonomic groups of mesozooplankton according to hypoxia, very few studies have characterized the relationship between mesozooplankton and hypoxia in Gamak Bay. Moon et al. (2006) demonstrated that mesozooplankton abundance decreased significantly when hypoxia occurred in summer, with the highest abundances occurring in the surface layer. However, the effects of hypoxia on specific taxonomic groups remains unknown. Therefore, our study focused on the composition of mesozooplankton populations (mainly cladocerans and copepods), abundance, and occurrence patterns that respond rapidly to changes in the environment. Furthermore, to determine whether hypoxia decreases or increases the abundance of mesozooplankton and changes its community structure, samples were collected from the inner bay (hypoxic zone) and middle bay (normoxic zone) areas of the study site and then compared. The specific goals of this study were to evaluate the effect of hypoxia on (1) the composition of the mesozooplankton community, (2) the abundance of mesozooplankton, and (3) the occurrence pattern of the dominant species in the hypoxic period.
Gamak Bay is a semi-enclosed bay located in the center of the southern coast of Korea (Figure 1). The study area is oval-shaped (approximately 9 km in width and 15 km in length) and is surrounded by the Yeosu Peninsula and Dolsan Island to the east. The submarine topography is divided into two basins around the ridge in the center of the bay. The central part of the bay is approximately 6–7 m deep, and the northern part from the center of the bay is concave and deeper, reaching a 9–11 m depth. Depth increases from the center of the bay to the south. Seawater exchange is primarily through the southern entrance to the bay and additionally through a narrow northeast channel. Particularly, the submarine topography of the northern waters of Gamak Bay causes stagnation and prevents seawater exchange (Lee and Cho, 1990). Moreover, there are several densely populated mussel and oyster farms nearby, resulting in severe excrement and feed residue contamination from the farmed organisms. Also, eutrophication occurs due to the inflow of seawater and domestic sewage (Noh, 2003). To solve this problem, the amount of domestic sewage inflow is reduced through sewage terminal treatment, and the oxygen demand of the sediment is reduced by dredging the contaminated sediment. However, despite these efforts, a large amount of organic matter is supplied, which raises concerns about potential eutrophication (NIFS, 2010). The largest contributor to hypoxia in northern Gamak Bay is the occurrence of a stratified bottom water mass formed by slow seawater flow. A large amount of phytoplankton is produced under the thermocline in summer due to an abundance of nutrients and sufficient solar radiation, both of which are required for photosynthesis. Although this study did not provide information on CTD and nutrient profiles according to water depth, Kim et al. (2006) and Kim et al. (2011) observed that the thermocline was mainly formed at depths of 3–5 m and 2–5 m. In turn, the organic matter that sinks to the bottom is decomposed and oxygen consumption rates increase. Additionally, the oxygen consumption rate of sediments increases, which further exacerbates hypoxia (Kim et al., 2006). However, hypoxia does not occur in the southern part of Gamak Bay because the water is constantly flowing and the oxygen supply is consistent, although the oxygen consumption rate of the sediments is high (Lee, 2015).
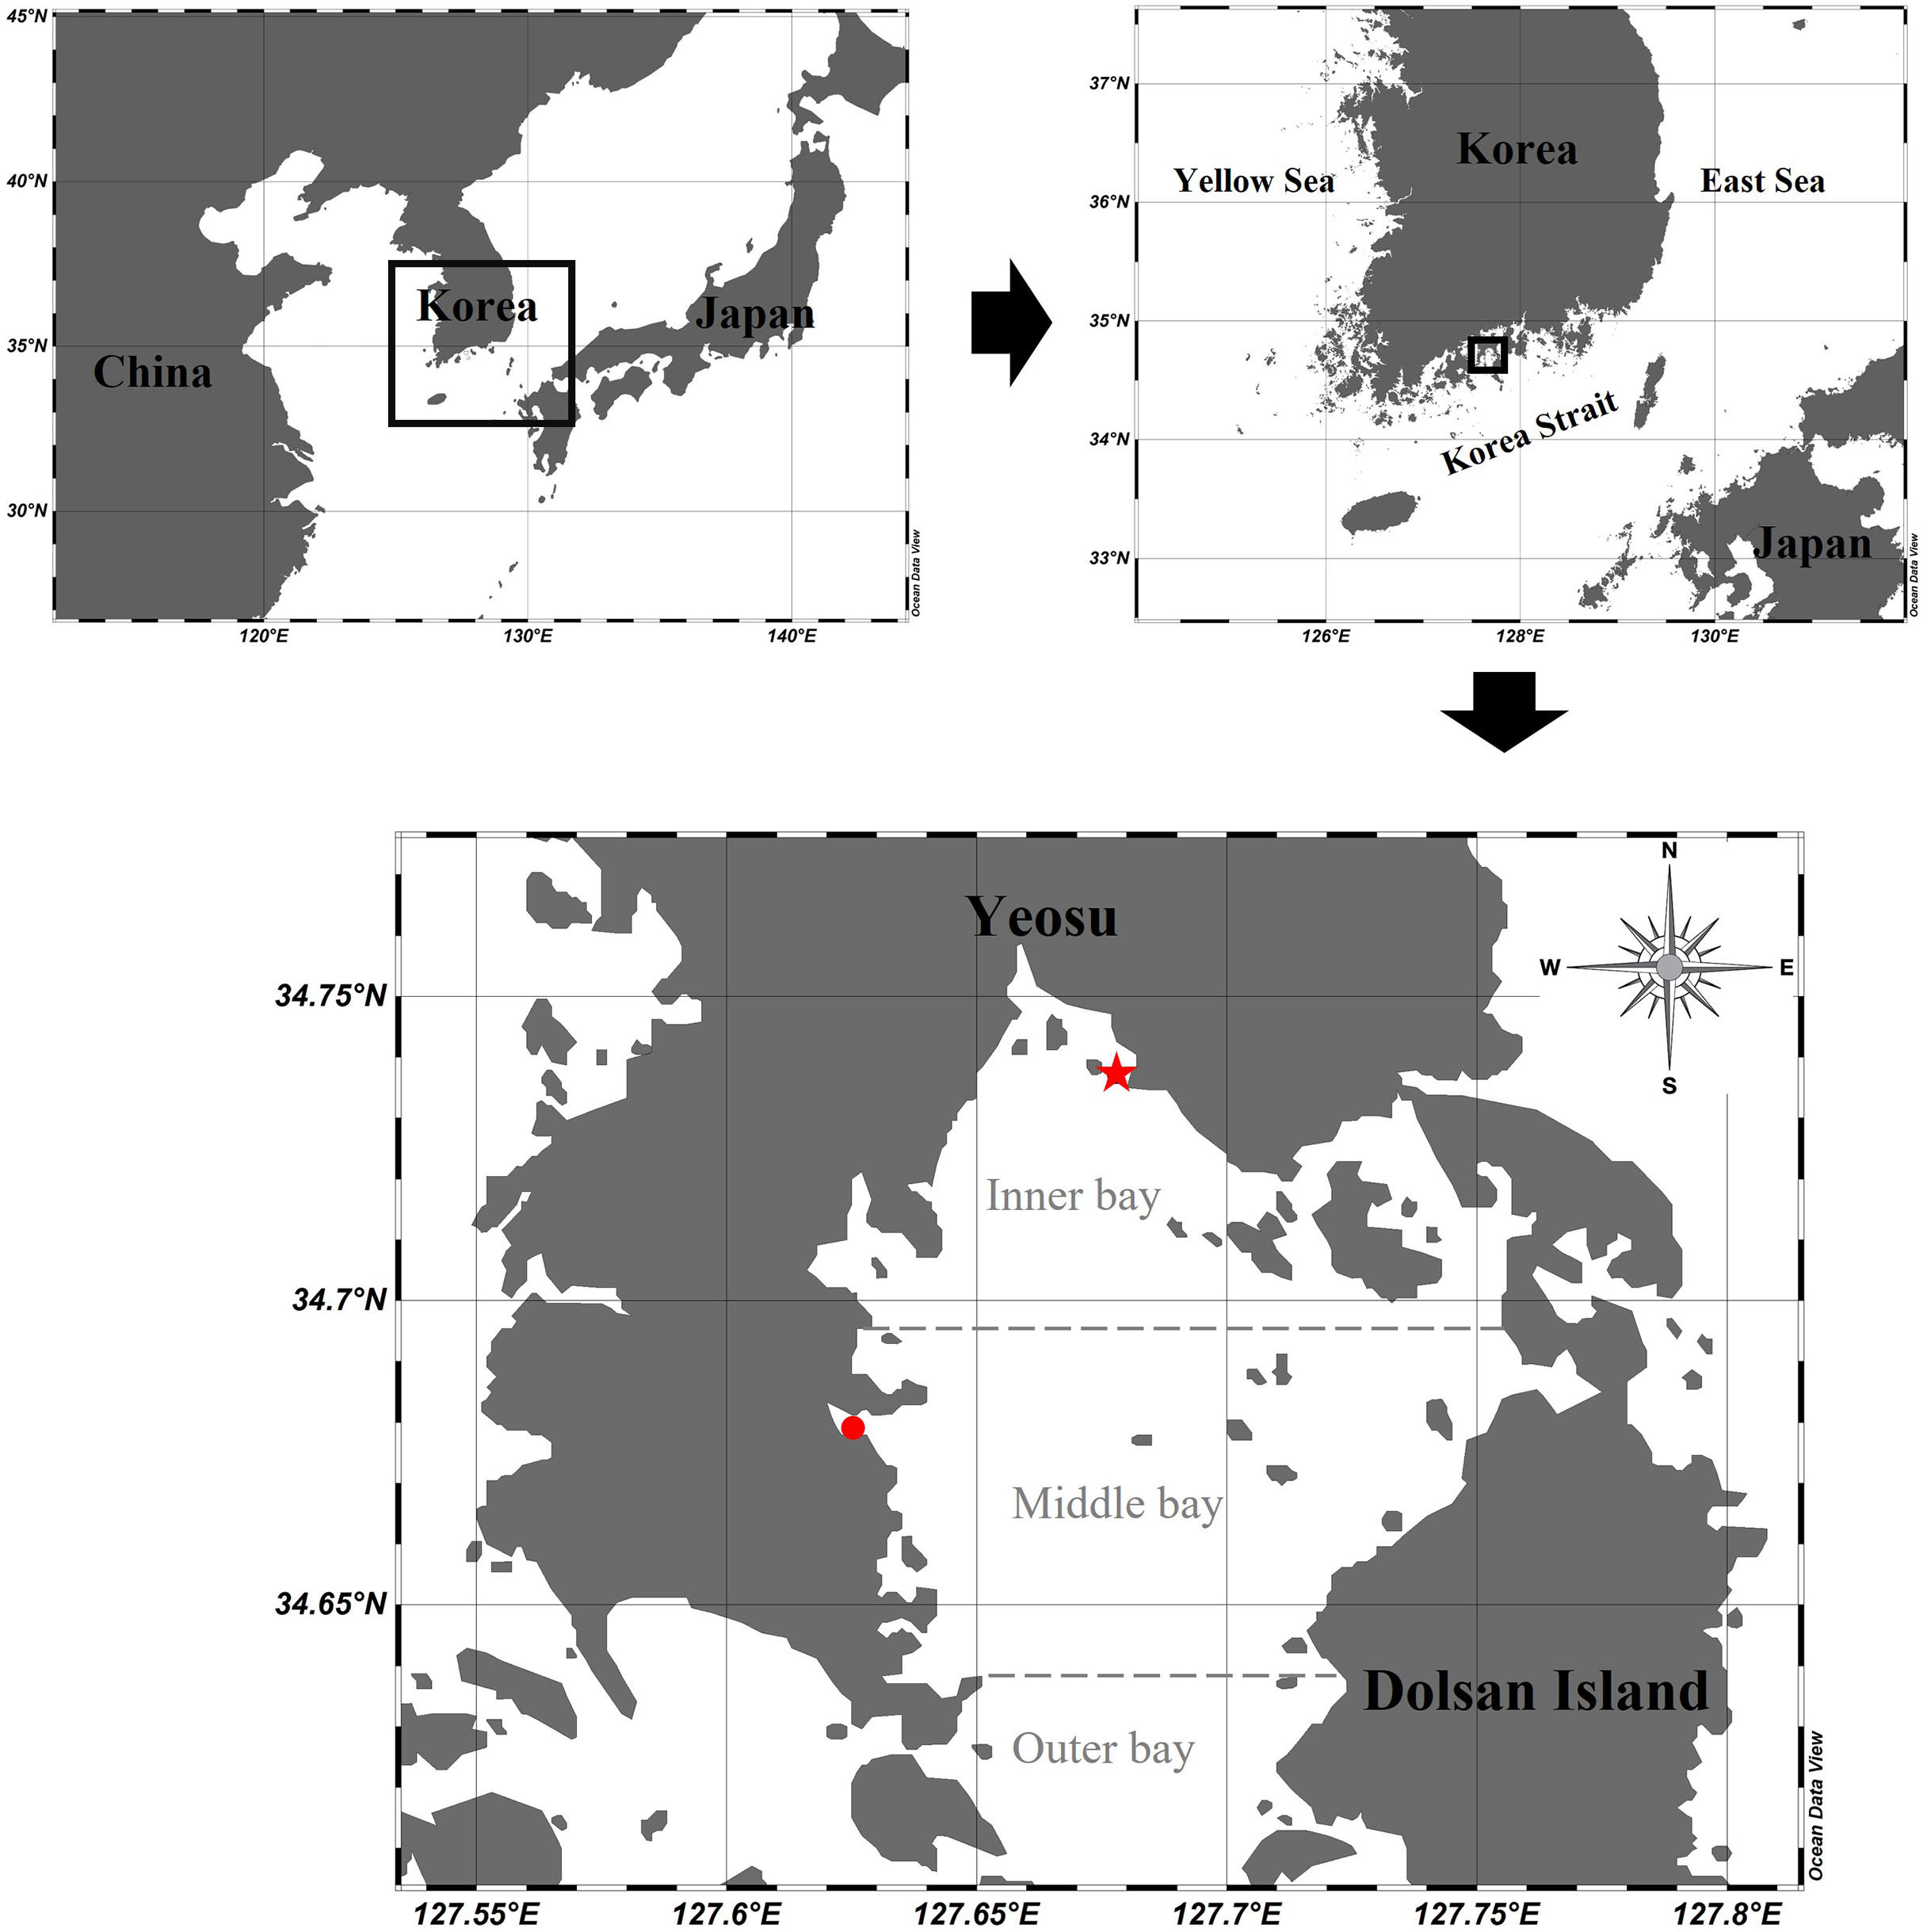
Figure 1 Sampling stations in Gamak Bay: a red star dot for the inner bay station and a red circle dot for the middle bay station.
The study was conducted at two fixed stations (inner bay: 34°48′55″ N 127°24′40″ E, middle bay: 34°40′42″ N 127°37′26″ E) in Gamak Bay, Korea. A total of 28 mesozooplankton samples were collected at each station at high tide every two weeks from April 2020 to April 2021. The depth of the study stations were 10 m and 5 m in the inner bay and middle bay, respectively. Environmental variables were measured on the surface layer and the bottom layer (bottom depth−1 m), whereas the total chlorophyll-a (Chl-a) concentration was measured only in the surface layer. Water temperature, salinity, and dissolved oxygen (DO) were measured using an YSI multimeter (600QS, YSI Inc., OH, USA). To measure the total Chl-a concentration, seawater (500 ml) was immediately filtered through 47-mm-diameter GF/F glass-fiber filters (Whatman, Maidstone, UK). Chl-a concentration was measured in 3 size categories (> 20 μm, 3–20 μm, < 3 μm), representing microphytoplankton, nanophytoplankton, and picophytoplankton, respectively. To measure the size-fractionated Chl-a concentration, 500 ml of seawater was filtered through 20 μm filter paper and 3 μm PC membrane filter paper, respectively, and then filtered again using GF/F filter paper. The filter was placed in a 15 ml tube and frozen at −20°C until analysis. The pigment was extracted in the laboratory for 24 h in 90% acetone and Chl-a concentrations were determined fluorometrically (10AU, Turner Designs, Sunnyvale, CA, USA) (Parsons et al., 1984).
Mesozooplankton samples were vertically collected with a conical net (mouth diameter, 30 cm; mesh size, 200 μm; Manufacturer, DAIHAN SCIENTIFIC CO., LTD.) from near the bottom (bottom depth−1 m) to the surface at a speed of 1 m/s. A flowmeter (Hydro-Bios, 438115, Kiel, Germany) was attached to the mouth of the conical net to measure the volume of the filtered water. After collection, the samples were preserved in 5% neutral formalin seawater solution. The samples were then subsampled using a Folsom splitter until approximately 200 individuals of the dominant taxa were obtained and dispensed into Bogorov-Rass counting chambers. All specimens from subsamples were identified by species or the lowest classification level and counted under a dissecting microscope (Nikon SMZ645, Nikon, Tokyo, Japan). When more detailed observation was needed for species identification, observations were conducted under a high-magnification optical microscope (Nikon eclipse E200, Nikon, Tokyo, Japan). Mesozooplankton abundance was standardized based on the volume of filtered water and expressed as the number of individuals per cubic meter (indiv. m-3).
The Mann-Whitney U-test was used to statistically examine the spatial differences in environmental variables (water temperature, salinity, DO concentration, total Chl-a concentration, and size-fractionated Chl-a concentration) and zooplankton abundance for the inner and the middle bay during the hypoxic (June to September) and normoxic (from October to May) periods. Additionally, differences in dominant species abundance in the hypoxic period were compared in the inner and middle bay (SPSS 18.0 software, SPSS Inc., CHICAGO, IL, United States). Redundancy analysis (RDA) was conducted to investigate the correlation between the species dominating the hypoxic period and environmental variables (CANOCO 4.5, Wageningen UR, Netherlands) (Ter Braack and Šmilauer, 2002). The data were log transformed and centered prior to the analysis. The significance of the variability explained by individual environmental variables was tested using the Monte Carlo permutation test with 499 random permutations. The results are presented as a biplot where dominant species and environmental variables are plotted together.
Water temperature ranged from 4.4 to 30.0°C at the surface and from 4.8 to 24.5°C at the bottom of the inner bay (Figure 2A). From June to September, when hypoxia occurs, the temperature difference between the surface and bottom was up to 4°C due to the increase in surface water temperature. When hypoxia was not observed, there was no significant difference between the surface and bottom temperature. In the middle bay, water temperature ranged from 3.9 to 26.3°C at the surface and from 3.7 to 25.5°C at the bottom. The difference in water temperature between the surface and the bottom was approximately 1°C throughout the sampling period. In both regions, the lowest temperature occurred in February, whereas the highest occurred in September.
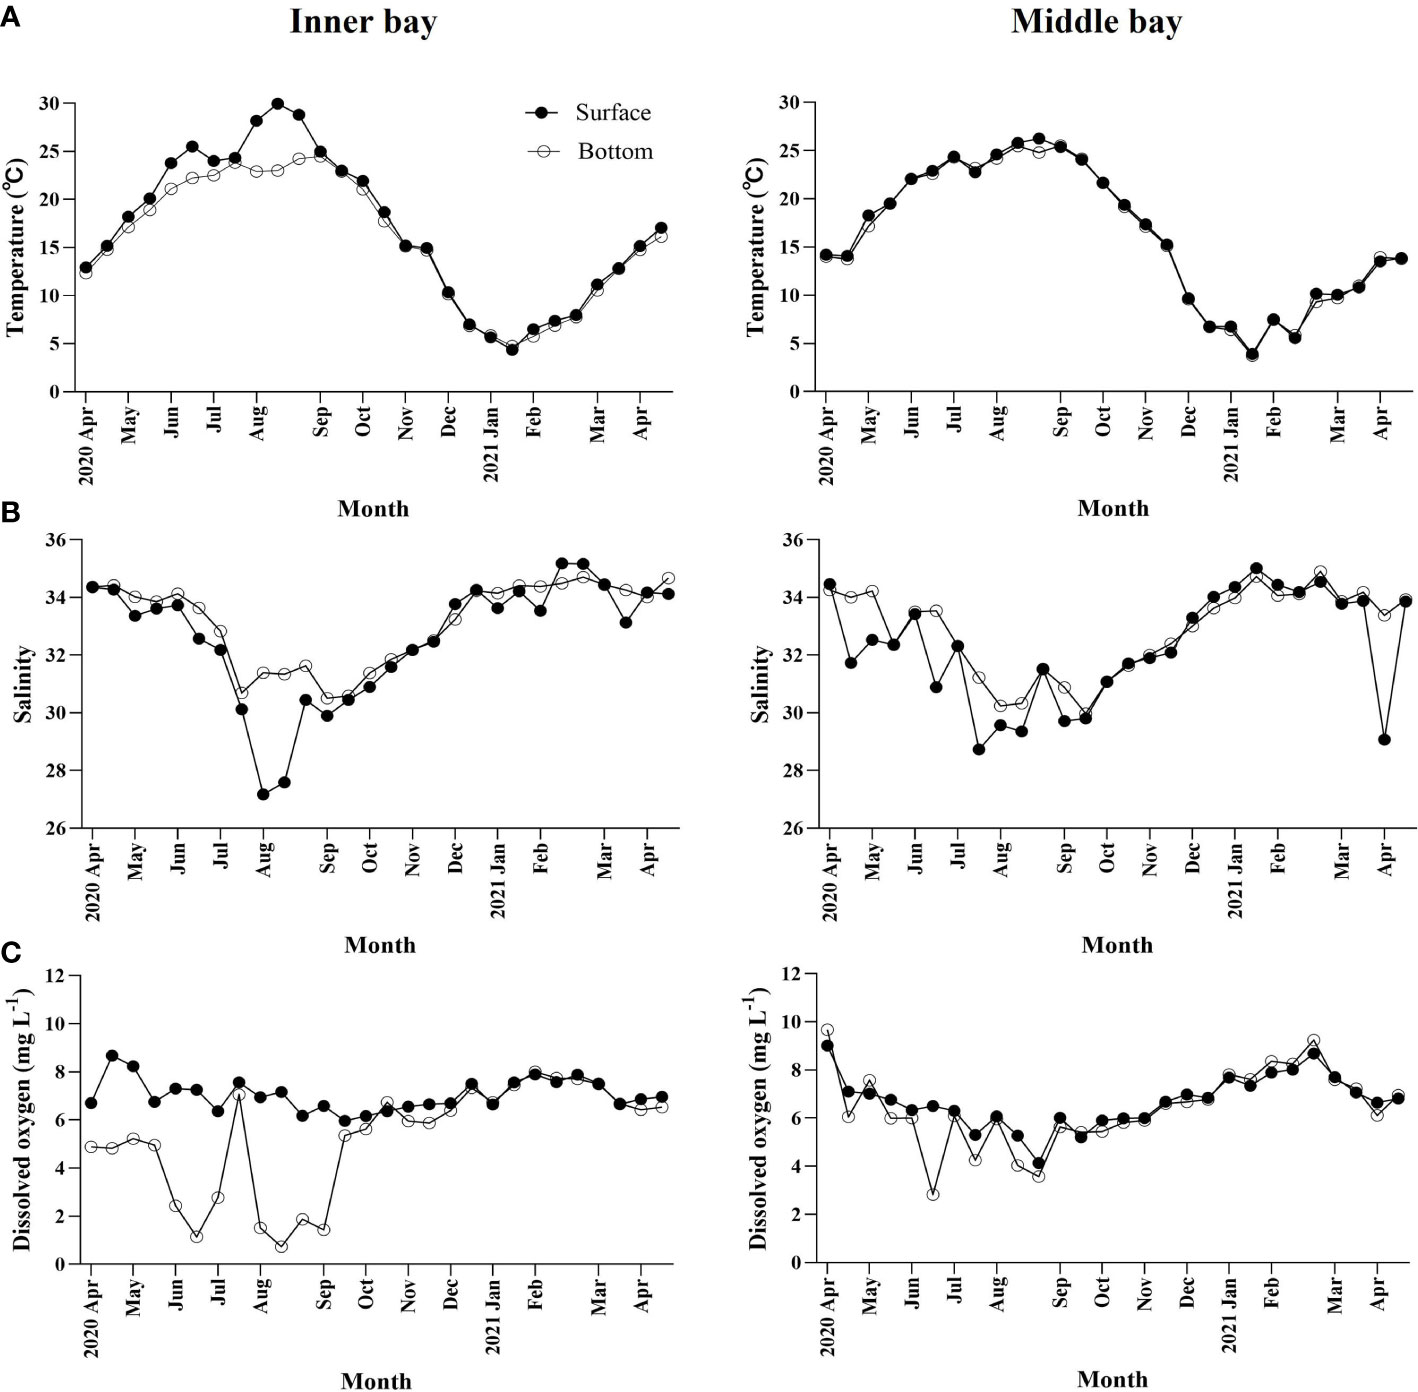
Figure 2 Temporal variations in environmental variables including (A) water temperature (°C), (B) salinity, and (C) dissolved oxygen concentration in Gamak Bay from April 2020 to April 2021.
Salinity ranged from 27.2 to 35.2 at the surface and from 30.5 to 34.7 at the bottom of the inner bay, (Figure 2B). In June, when hypoxic conditions began, the salinity of the surface and bottom reached 33 or higher, but gradually decreased and reached its lowest point in August. In August, the difference in salinity between the surface and the bottom was also greatest, reaching up to 4.2. Afterward, the salinity in the surface increased gradually when the hypoxic conditions completely disappeared. In the middle bay, the salinity at the surface and the bottom ranged from 28.7 to 34.5 and from 30.0 to 34.9, respectively, and the difference between the surface and the bottom was less than 2 during most of the sampling period.
DO concentration ranged from 6.0 to 8.6 mg L-1 at the surface and from 0.7 to 8.0 mg L-1 at the bottom of the inner bay (Figure 2C). In spring and summer, DO concentration was high in the surface. Hypoxia in which the bottom DO concentration decreased to less than 2 mg L-1 was observed five times from June to September when the surface water temperature was high. In autumn and winter, DO concentration was similar in the surface and bottom. In the middle bay, DO concentration ranged from 4.1 to 9.0 mg L-1 at the surface and from 2.8 to 9.7 mg L-1 at the bottom, and DO concentrations did not decrease below 2 mg L-1.
Total Chl-a concentration ranged from 0.7 µg L-1 to 7.8 µg L-1 (Figure 3A) in the inner bay. Total Chl-a concentration also appeared as two peaks in mid-August and late-September (7.8 μg L-1 and 7.6 μg L-1, respectively). In December and January, two peaks were observed, which were relatively lower than in summer. In the middle bay, the total Chl-a concentration ranged from 0.5 µg L-1 to 5.3 µg L-1, reaching a peak in late-June (5.3 μg L-1), and the fluctuation range was lower than that of the inner bay.
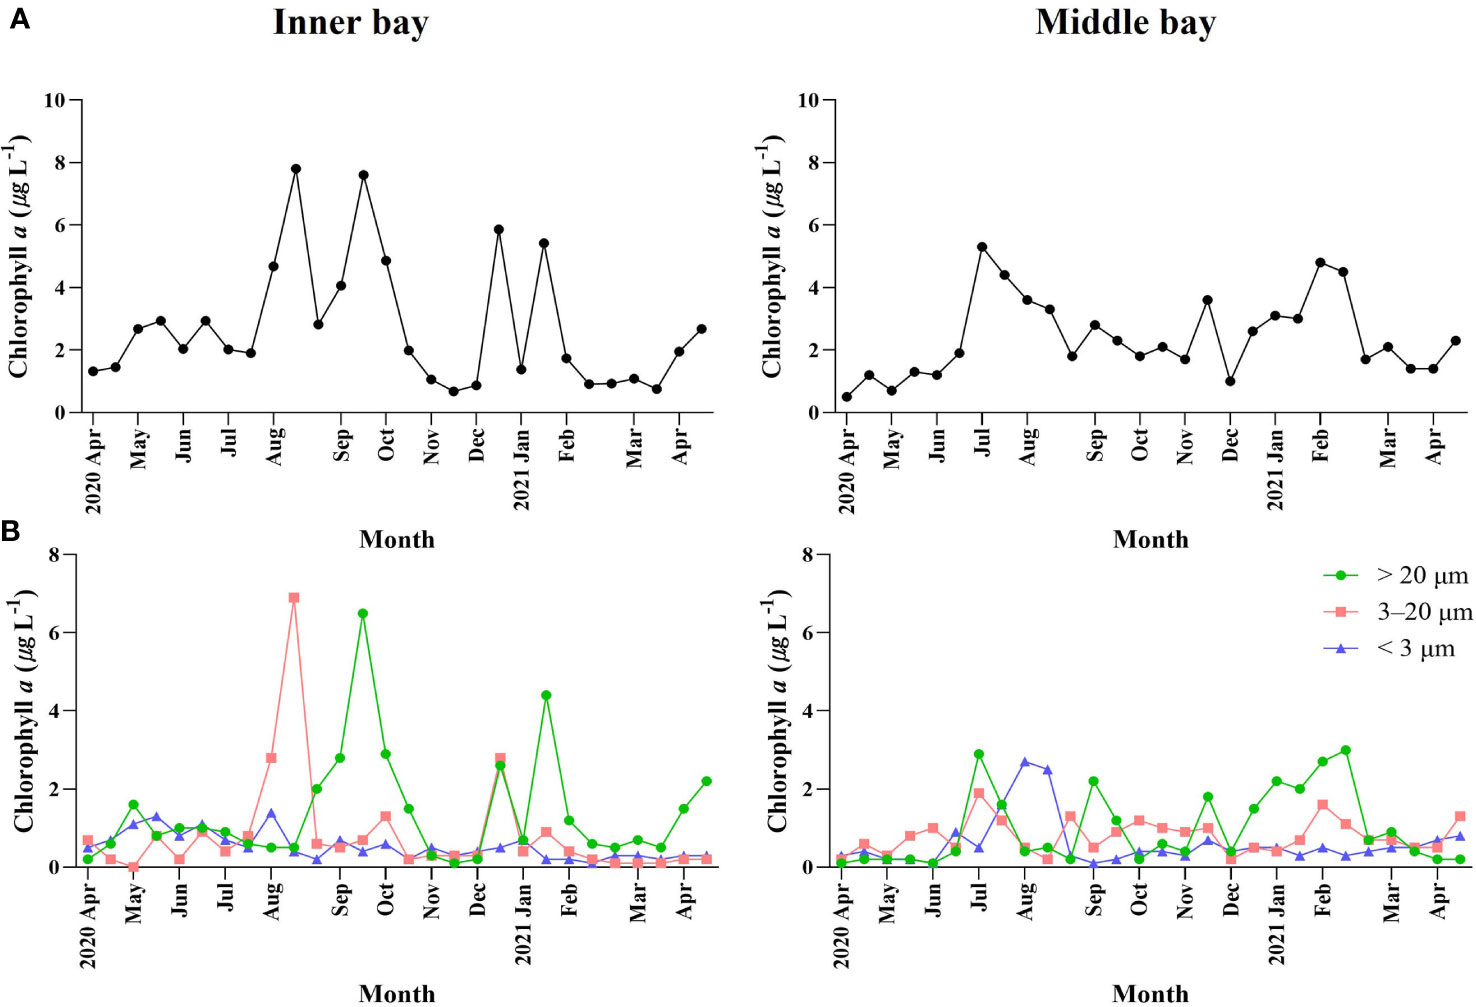
Figure 3 Temporal variations environmental variables including (A) total Chl-a concentration and (B) size-fractionated Chl-a concentration in Gamak Bay from April 2020 to April 2021.
The proportions of different phytoplankton size fractions varied throughout the sampling period (Figure 3B). In the inner bay, the < 3 µm size fraction accounted for 3.3%–50.7% (average 25.6%) of the total Chl-a concentration and accounted for the highest proportion of total Chl-a concentration in late-November and the lowest proportion in mid-January. The 3–20 µm size fraction accounted for 1.2%–88.6% (average 25.1%) of the total Chl-a concentration and accounted for the highest proportion of total Chl-a concentration in mid-August and the lowest proportion in mid-May. The > 20 µm size fraction accounted for 6.2%–80.9% (average 49.3%) of the total Chl-a concentration and accounted for the highest proportion of total Chl-a concentration in late-November and the lowest proportion in mid-January. In the middle bay, the < 3 µm size fraction accounted for 4.9%–76.7% (average 27.6%) of the total Chl-a concentration and accounted for the highest proportion of total Chl-a concentration in mid-August and the lowest proportion in early-September. The 3–20 µm size fraction accounted for 7.4%–83.8% (average 37.3%) of total Chl-a concentration and accounted for the highest proportion of total Chl-a concentration in early-June and the lowest proportion in mid-August. The > 20 µm size fraction accounted for 5.1%–77.4% (average 35.0%) of the total Chl-a concentration and accounted for the highest proportion of total Chl-a concentration in early-September and the lowest proportion in early-June.
The spatial difference in environmental variables between the inner and middle bay during the hypoxic (June to September) and normoxic (October to May) period was identified (Table 1). During the hypoxic period, there was no significant difference in water temperature, salinity, total Chl-a concentration, and the three size categories of Chl-a concentration in the inner and middle bay. However, there was a significant difference in the surface and bottom DO concentration in the inner and middle bay (Mann-Whitney U-test, p < 0.01). During the normoxic period, there was no significant difference in water temperature, salinity, DO concentration, and total Chl-a concentration in the inner and middle bay, but there was a significant difference in the 3–20 µm categories of Chl-a concentration (Mann-Whitney U-test, p < 0.05).
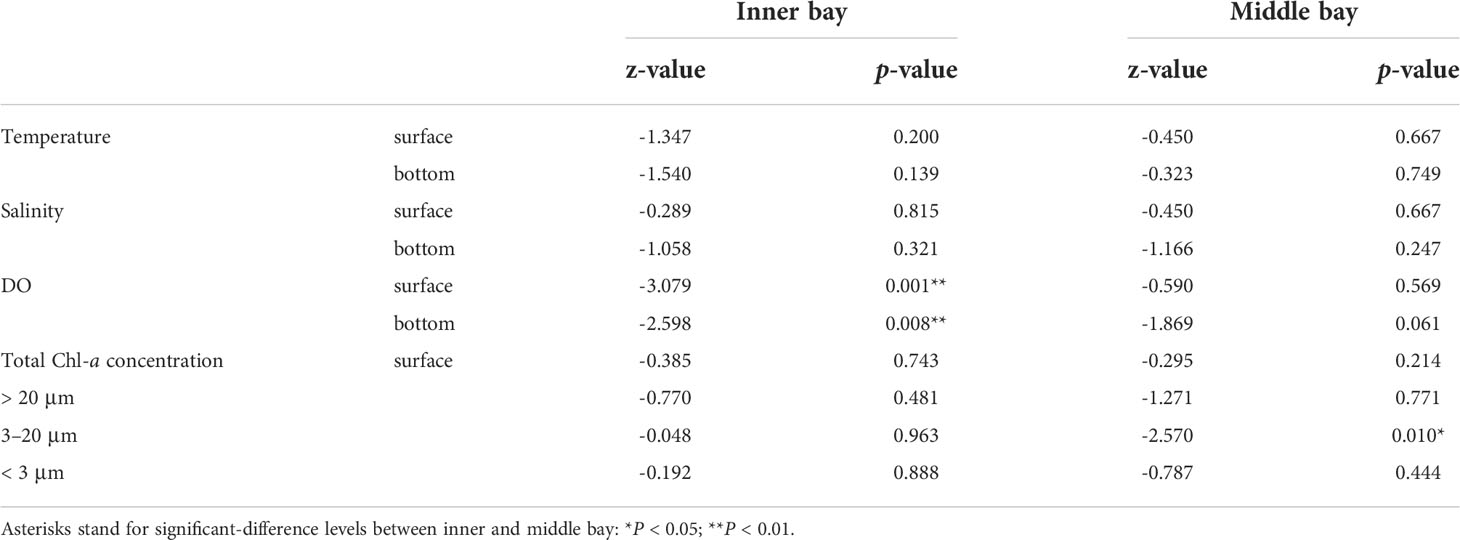
Table 1 Spatial differences in environmental variables were tested with Mann-Whitney U-tests.
The mesozooplankton that appeared in the two regions were identified as copepods, cladocerans planktonic larvae, and other zooplankton (chaetognaths, appendicularians, amphipods, hydromedusae, etc.). A total of 45 and 52 taxa of mesozooplankton were identified in the inner and middle bay, respectively (Supplementary Table 1). Copepods were most dominant in the inner bay (60.1%), followed by cladocerans (24.4%), larvae (8.3%), and other zooplankton (7.2%). In the middle bay, copepods were most dominant (81.9%), followed by larvae (9.4%), other zooplankton (4.8%), and cladocerans (4.0%).
The temporal variation of mesozooplankton composition was different in the two regions. In the inner bay, In April and May, during the normoxic period, copepods were high (64.7%–96.2%), whereas cladocerans were very low (< 3%) (Figure 4A). In June, when hypoxic conditions began, copepods began to decrease, reaching their lowest point in August (6.7%). Conversely, cladocerans gradually increased in June, and they were the highest in August (74%). Hypoxic conditions persisted until early-September but cladocerans decreased sharply to 4%, whereas copepods sharply increased to 61.8%. Additionally, planktonic larvae and other zooplankton increased to 20.5% and 13.7%, respectively. From late-September to early-October, during the normoxic period, planktonic larvae and other zooplankton were high at an average of 29.8% and 23% respectively, and cladocerans were very low at less than 2.5%. In November, copepods were very high at 81.7% and gradually decreased from March. Conversely, planktonic larvae and other zooplankton decreased to an average of 12.3% and 0.8%, respectively, and gradually increased from March.
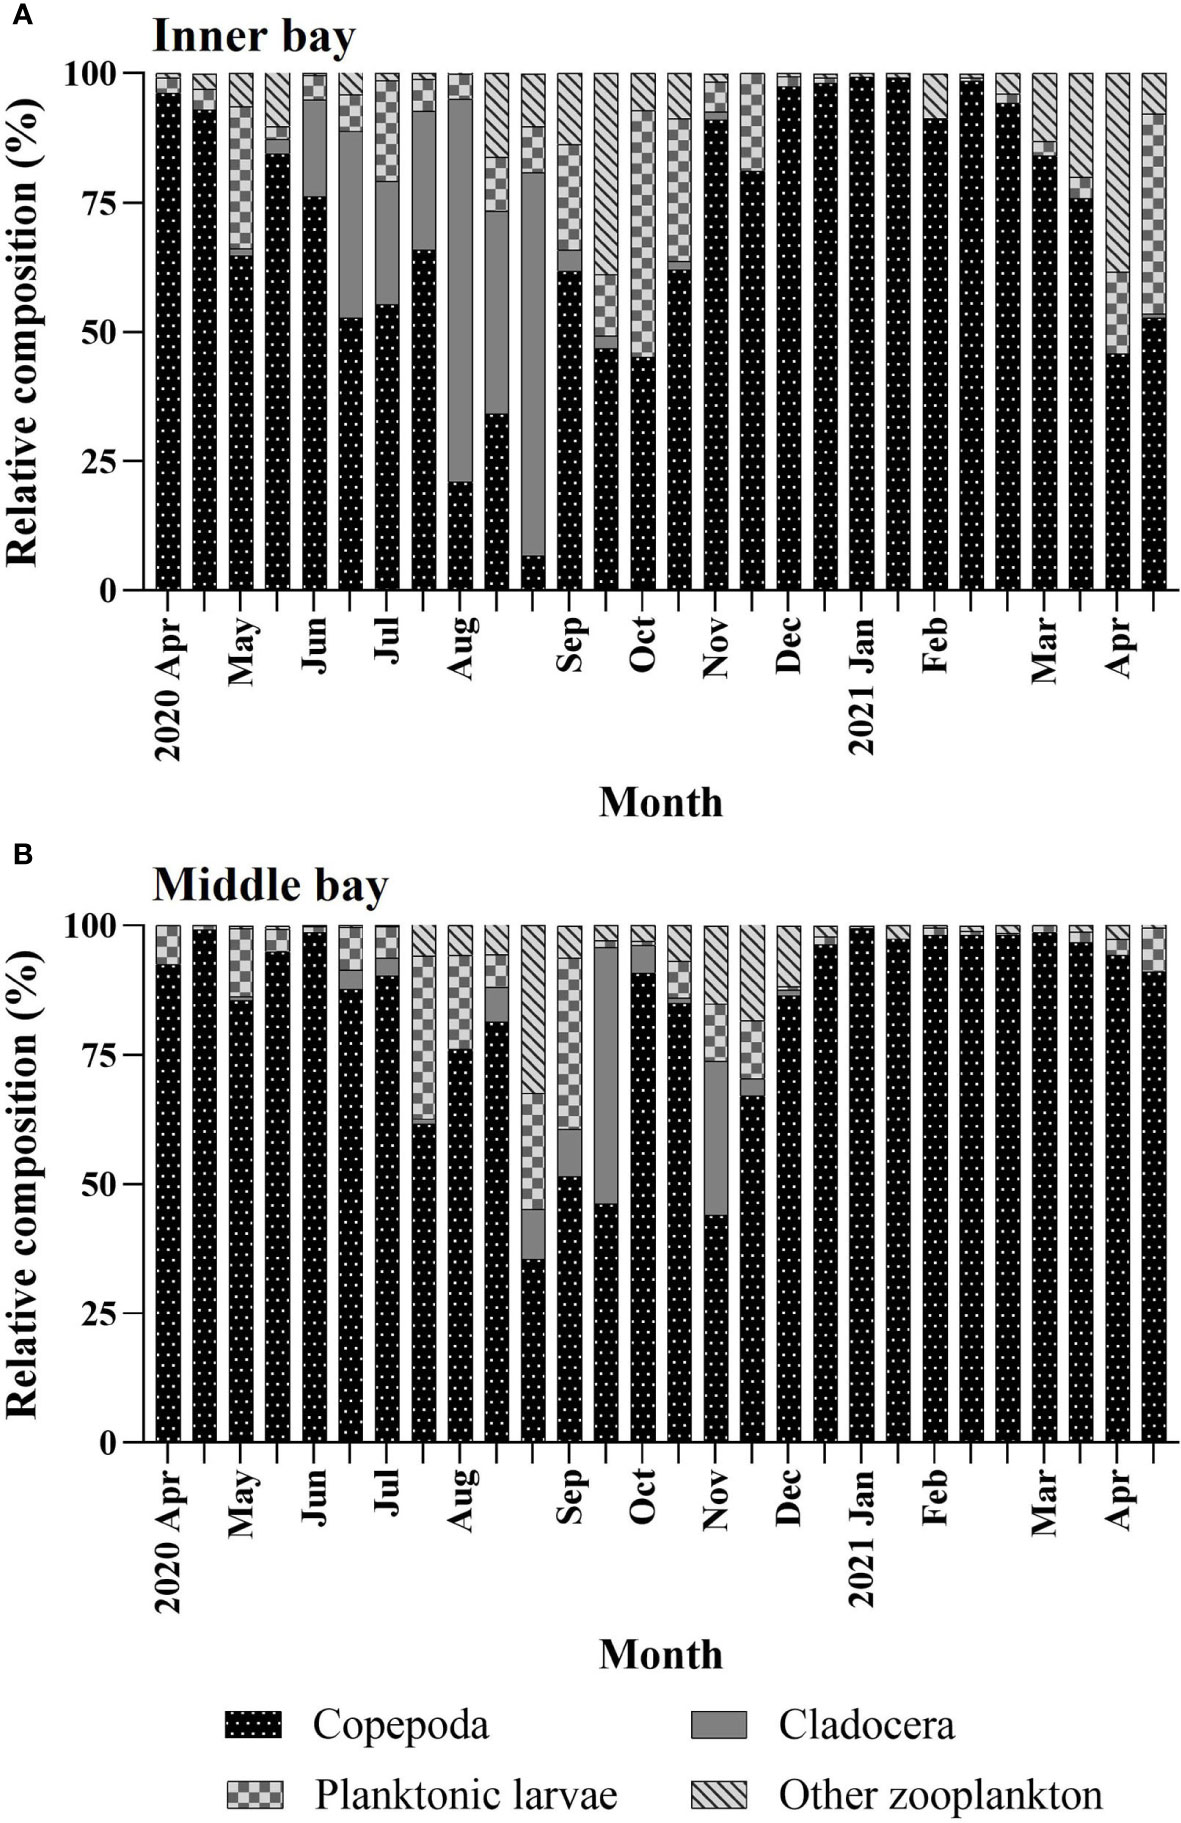
Figure 4 Temporal variations in percentages of mesozooplankton composition in the (A) inner bay and (B) middle bay in Gamak Bay from April 2020 to April 2021.
In the middle bay, copepods were very high (87.7%–99.1%) from April to June (Figure 4B). From July to November, they were repeated to be high and low in the range of 44 to 90.8%, and continued to be very high after December (91%). In contrast, cladocerans were very low (0.2%–3.7%) from May to July but increased in August, reaching their highest at 49.6% in mid-September. Afterward, they reached a small peak (29.7%) in early-November and decreased sharply thereafter, reaching undetectable levels in December. Planktonic larvae were the lowest at 0.9% to 13.1% from April to June, and the highest at 33.1% in early-September. After that, they appeared throughout the sampling period with an average of 3.2%. Other zooplankton were lower than 1% from April to June, and increased gradually, reaching a maximum of 32.5% in mid-August. Afterward, they remained low (4.5%) throughout the sampling period.
During the hypoxic period, mesozooplankton abundance was significantly higher in the inner bay than in the middle bay (Mann-Whitney U-test, p < 0.01) (Figure 5A). The abundance ranged from 2,862 to 13,905 indiv. m-3 (6,877 ± 3,421 indiv. m-3 on average) in the inner bay and from 535 to 5,137 indiv. m-3 (3,029 ± 1,627 indiv. m-3) in the middle bay. During the normoxic period, the abundance ranged from 231 to 8,293 indiv. m-3 (2,022 ± 2,198 indiv. m-3 on average) in the inner bay and from 364 to 7,829 indiv. m-3 (2,316 ± 2,580 indiv. m-3) in the middle bay (Figure 5B). There was no significant difference in mesozooplankton abundance between the inner and the middle bay (Mann-Whitney U-test, p > 0.05).
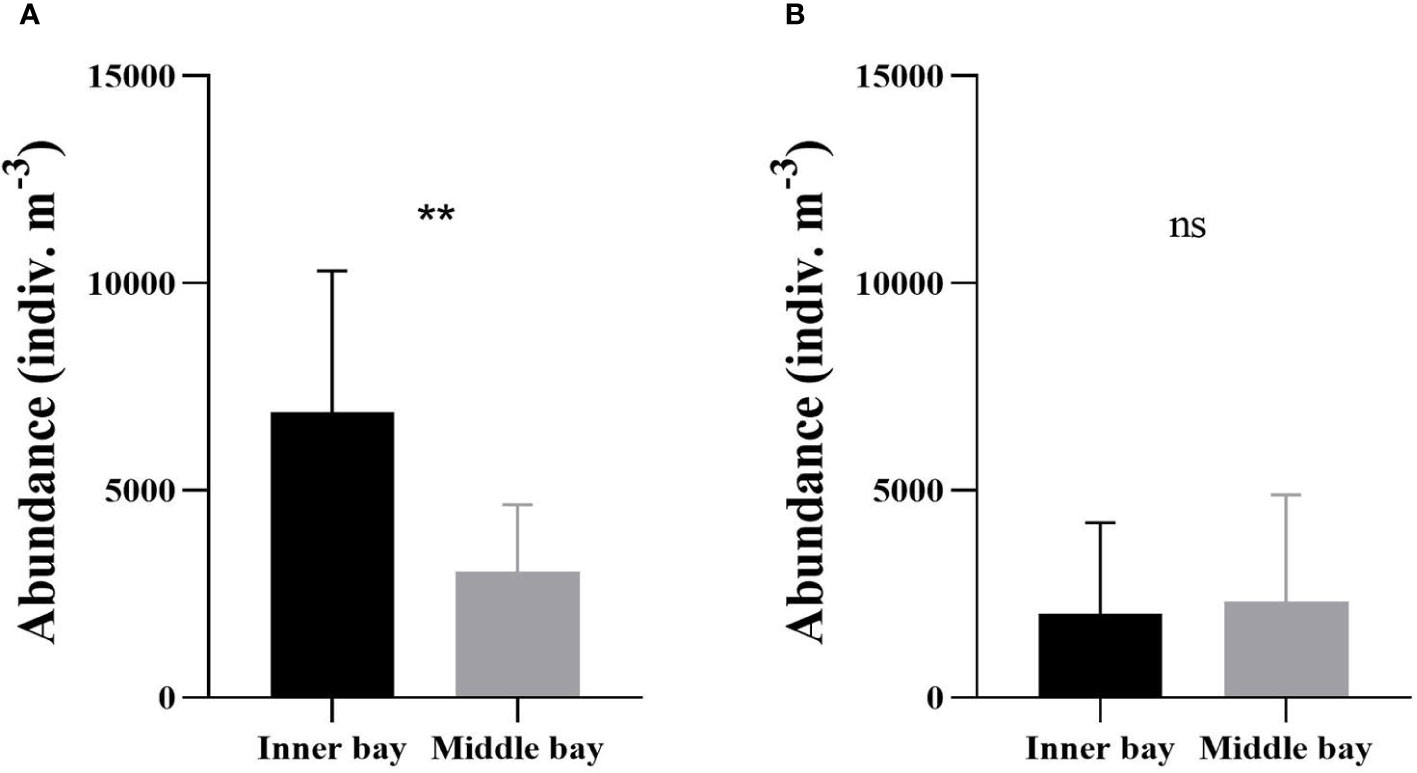
Figure 5 Mean mesozooplankton abundance in the inner bay and the middle bay of Gamak Bay during the (A) hypoxic period (from June to September) and (B) normoxic period (from October to May). Spatial differences in mesozooplankton abundance were tested with Mann-Whitney U-tests. Asterisks stand for significant-difference levels between inner and middle bay: **p < 0.01; ns, not significant.
During the hypoxic period, the dominant species in the two regions included three cladocerans (Pleopis polyphemoides, Pseudoevadne tergestina, Penilia avirostris) and one copepod (Acartia sinjiensis). The abundances of these species exhibited distinct differences between the inner and the middle bay. P. polyphemoides ranged from 10 to 2,315 indiv. m-3 (1,018 ± 992 indiv. m-3 on average) in the inner bay and from 0 to 157 indiv. m-3 (35 ± 54 indiv. m-3 on average) in the middle bay (Figure 6A), and this difference was found to be statistically significant (Mann-Whitney U-test, p < 0.01). The abundance of P. tergestina ranged from 0 to 5,008 indiv. m-3 (1,408 ± 1,810 indiv. m-3 on average) in the inner bay and from 0 to 340 indiv. m-3 (79 ± 143 indiv. m-3 on average) in the middle bay (Figure 6B), and this difference was found to be statistically significant (Mann-Whitney U-test, p < 0.05). The abundance of P. avirostris ranged from 0 to 2,373 indiv. m-3 (461 ± 852 indiv. m-3 on average) in the inner bay and from 0 to 265 indiv. m-3 (60 ± 115 indiv. m-3 on average) in the middle bay (Figure 6C); however, this difference was not statistically significant (Mann-Whitney U-test, p > 0.05). Furthermore, the abundance of copepods was higher in the middle bay. Specifically, A. sinjiensis ranged from 0 to 483 indiv. m-3 (91 ± 172 indiv. m-3 on average) in the inner bay and from 4 to 1767 indiv. m-3 (568 ± 735 indiv. m-3 on average) in the middle bay (Figure 6D), and this difference was found to be statistically significant (Mann-Whitney U-test, p < 0.05).
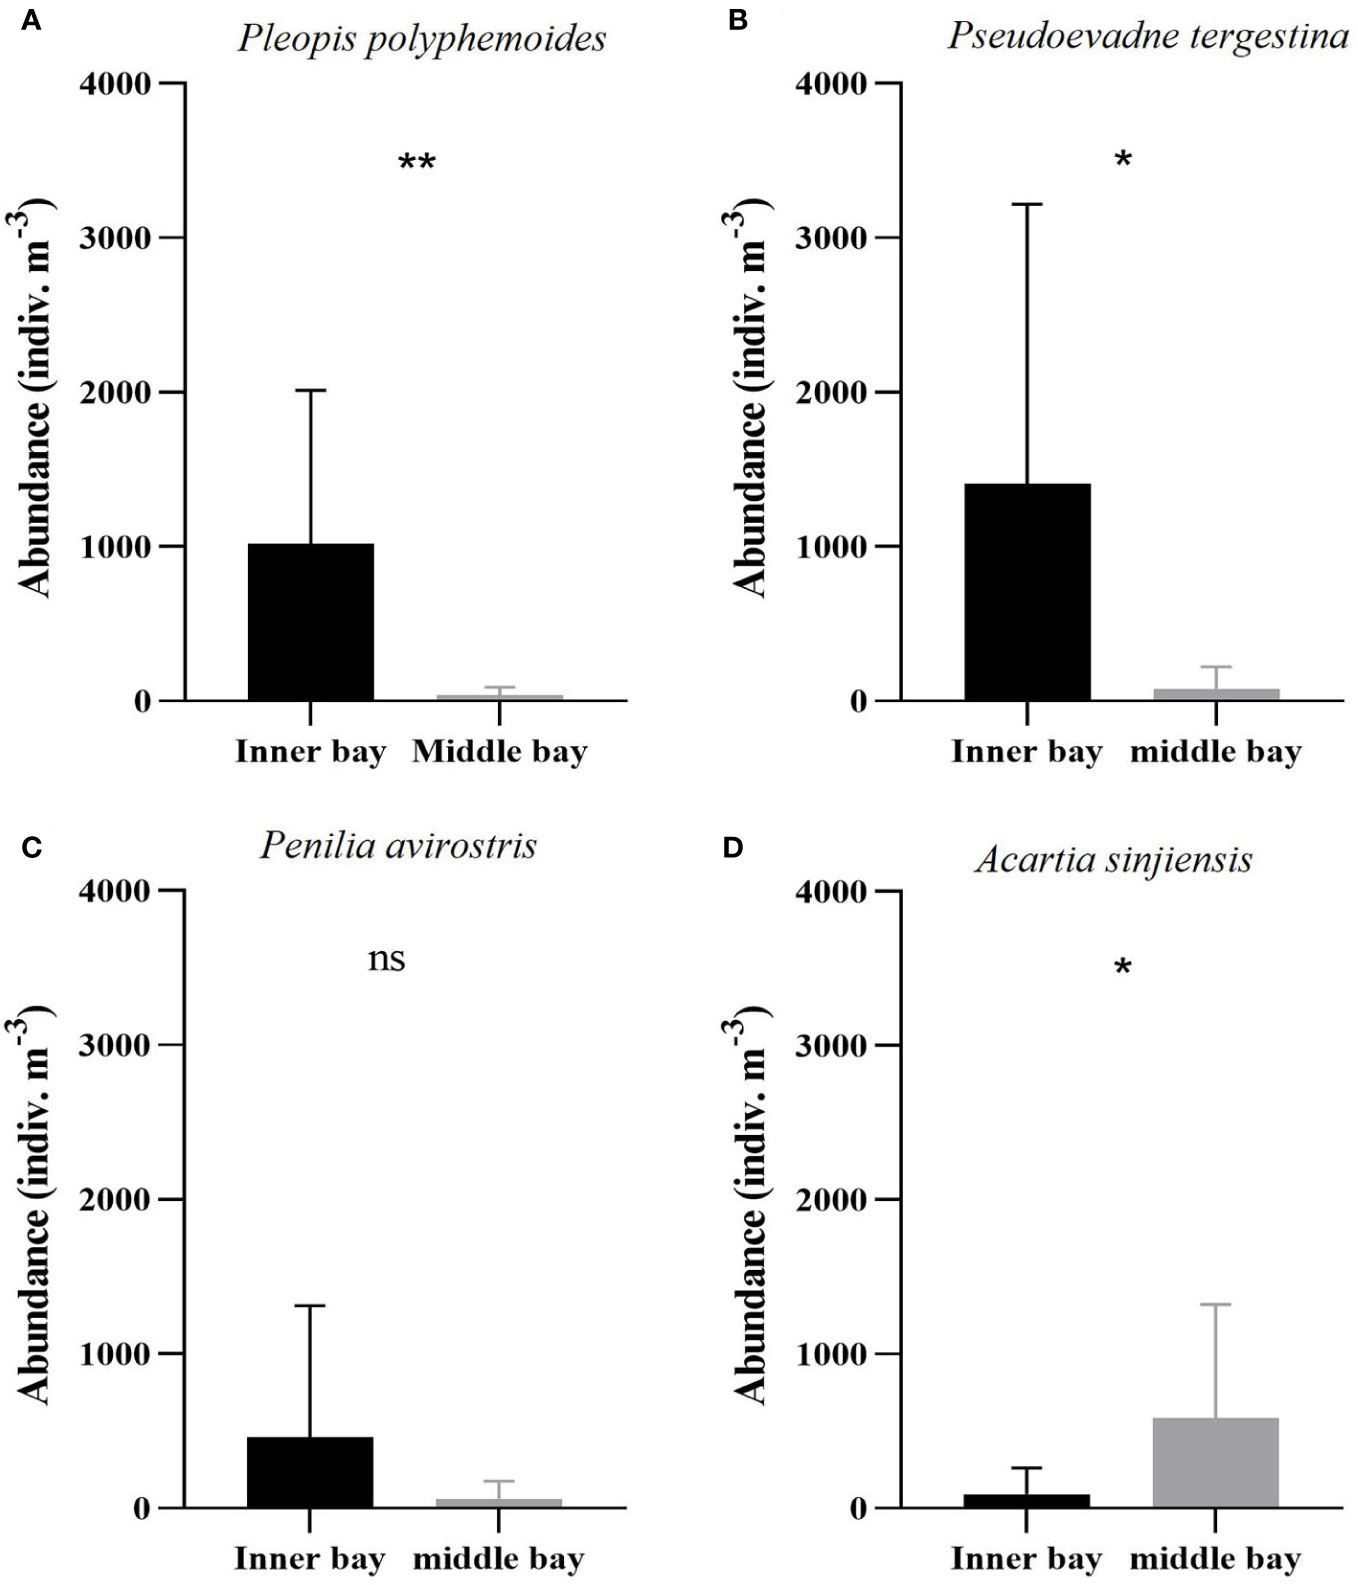
Figure 6 Mean dominant species abundance including (A) Pleopis polyphemoides, (B) Pseudoevadne tergestina, (C) Penilia avirostris, and (D) Acartia sinjiensis in the inner bay and the middle bay of Gamak Bay during the hypoxic period (from June to September). Spatial differences in dominant species abundance were tested with Man-Whitney U-tests. Asterisks stand for significant-difference levels between inner and middle bay: *p < 0.05; **p < 0.01; ns, not significant.
The two taxonomic groups differed in occurrence times between the inner and the middle bay. Compared with A. sinjiensis, three cladocerans appeared approximately a month earlier in the inner bay than in the middle bay, and disappeared earlier. Interestingly, P. polyphemoides showed similar patterns between the two regions (Figure 7A). In the inner bay, they appeared in May and showed the first peak of 2,156 indiv. m-3 in mid-June when the bottom was hypoxic. In early July, before the temporary disappearance of hypoxia, they sharply decreased to 40 indiv. m-3, and in early-August, they showed a second peak of 2,315 indiv. m-3. They appeared in small numbers after hypoxia had completely disappeared and did not appear after early-November. In the middle bay, they appeared in May, and the abundance increased and decreased repeatedly. The maximum abundance was 993 indiv. m-3 in early-November. After that, they decreased sharply and did not appear after early-December. P. tergestina appeared approximately a month earlier in the inner bay compared to the middle bay, and disappeared a month earlier (Figure 7B). In the inner bay, P. tergestina appeared in mid-June (25 indiv. m-3) when the bottom was hypoxic, and the maximum abundance was 5,008 indiv. m-3 in late-August. After mid-September, when hypoxia had completely disappeared, the abundance decreased sharply and P. tergestina was not detected in November. In the middle bay, 52 indiv. m-3 appeared in mid-July, and the maximum abundance was 340 indiv. m-3 in late-August. After that, they decreased sharply and did not appear from late-September to October, then appeared again in November and did not appear from December onward. P. avirostris in the inner bay appeared approximately one month earlier in the inner bay compared to the middle bay, and disappeared two months earlier (Figure 7C). In the inner bay, it appeared in mid-July, when hypoxia had temporarily disappeared, and in mid-August, when hypoxia occurred again, the maximum abundance was 2,373 indiv. m-3. From this point, they decreased sharply and disappeared in September. In the middle bay, they appeared 262 indiv. m-3 in mid-August, and the maximum abundance was 265 indiv. m-3 in mid-September. Since then, they decreased sharply and disappeared in November. Compared to cladocerans, copepods exhibited the opposite pattern. A. sinjiensis appeared approximately a month and a half earlier in the middle bay than in the inner bay, and disappeared a month earlier ( Figure 7D). In the inner bay, they appeared in mid-July, when hypoxia had temporarily disappeared, and in mid-August, when hypoxia occurs again, the maximum abundance was 483 indiv. m-3. After that, they decreased sharply, and appeared in small abundances, and disappeared after early-November. In the middle bay, 11 indiv. m-3 appeared in early-June, after which they reached 1,700 indiv. m-3 throughout July. After that, they gradually decreased and disappeared after early-October.
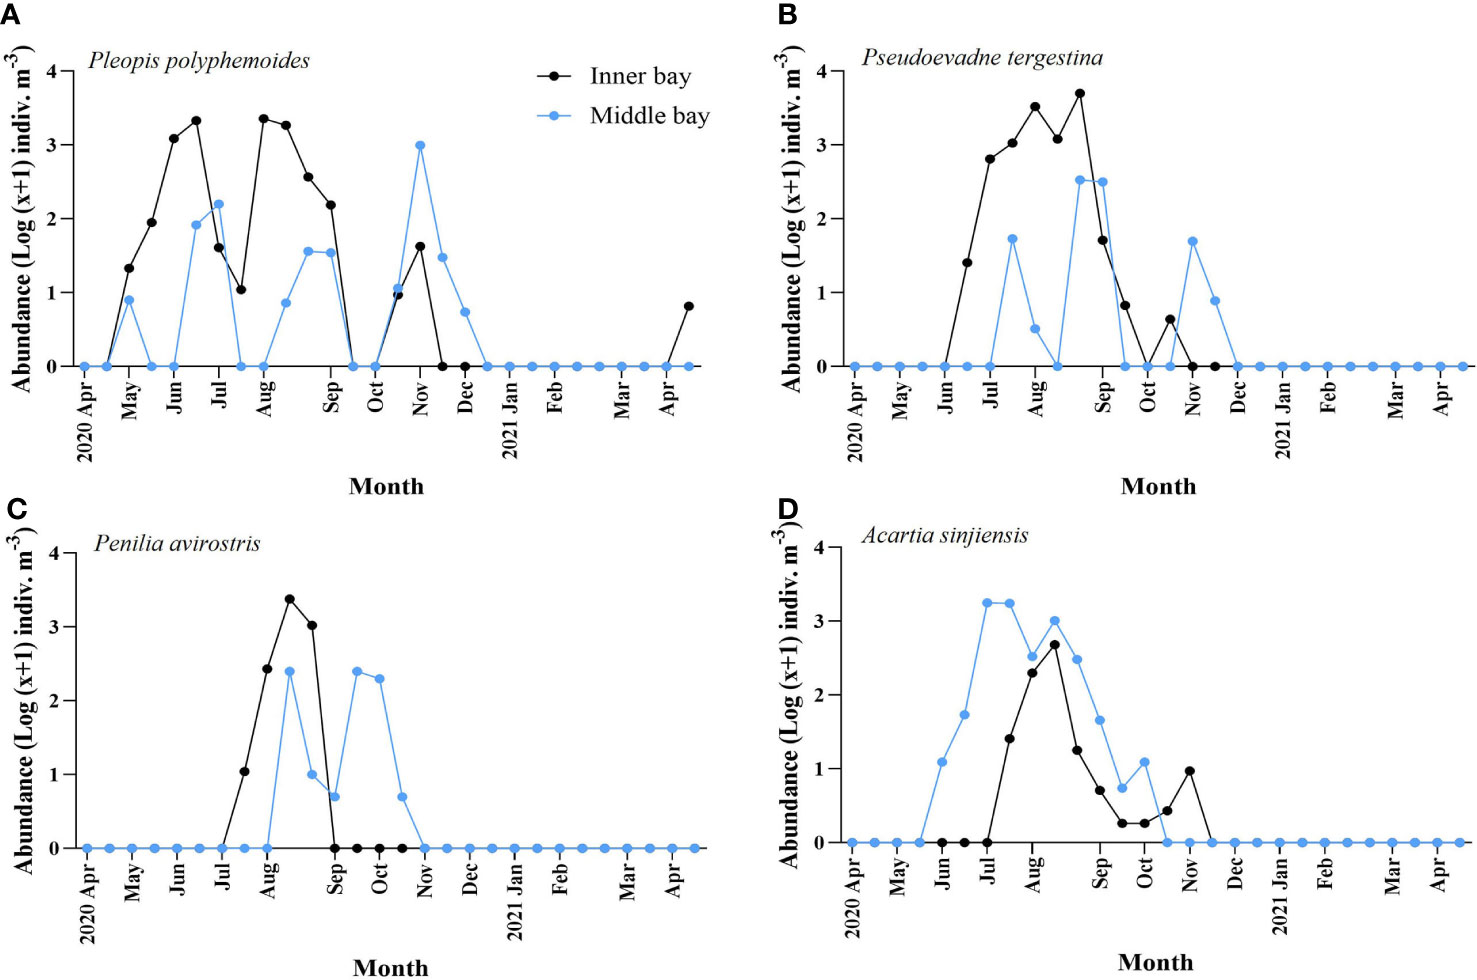
Figure 7 Temporal variation of abundance of dominant species including (A) Pleopis polyphemoides, (B) Pseudoevadne tergestina, (C) Penilia avirostris, and (D) Acartia sinjiensis in the inner bay and middle bay of Gamak Bay from April 2020 to April 2021.
The relationship between the dominant species of the hypoxic period and environmental variables (Temperature, salinity, DO concentration, total Chl-a concentration and size-fractionated Chl-a concentration) was analyzed using RDA. In the inner bay, the model explained 75.4% of the variance of dominant species and environmental data on the first two axes (Table 2). Furthermore, the species-environment correlations of axes 1 (0.92) and 2 (0.80) were relatively high. The environmental variables in axes 1 and 2 explained 97% of the variance in dominant species. The eigenvalues of the RDA were statistically significant according to Monte Carlo permutations. Temperature, salinity, bottom DO concentration, total Chl-a concentration, and the 3–20 µm and < 3 µm categories of Chl-a concentration were the most important parameters affecting the variation of certain dominant species (p < 0.05). P. polyphemoides showed a positive correlation with water temperature and the < 3 µm categories of Chl-a concentration, and a negative correlation with bottom DO concentration. P. tergestina, P. avirostris and A. sinjiensis showed a positive correlation with temperature, total and 3–20 µm categories of Chl-a concentration, and a negative correlation with salinity (Figure 8A).
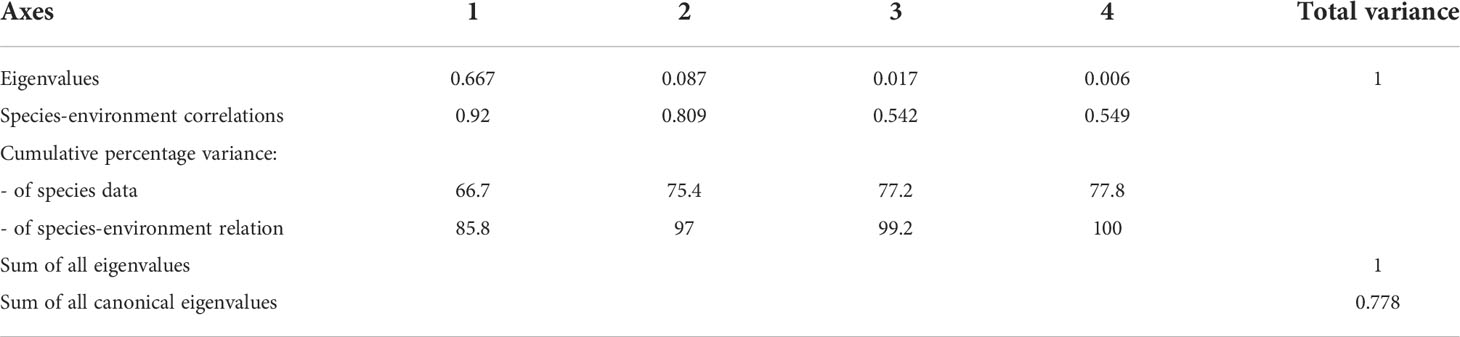
Table 2 Summary of the results of the redundancy analysis (RDA) between environmental variables and dominant species in the inner bay.
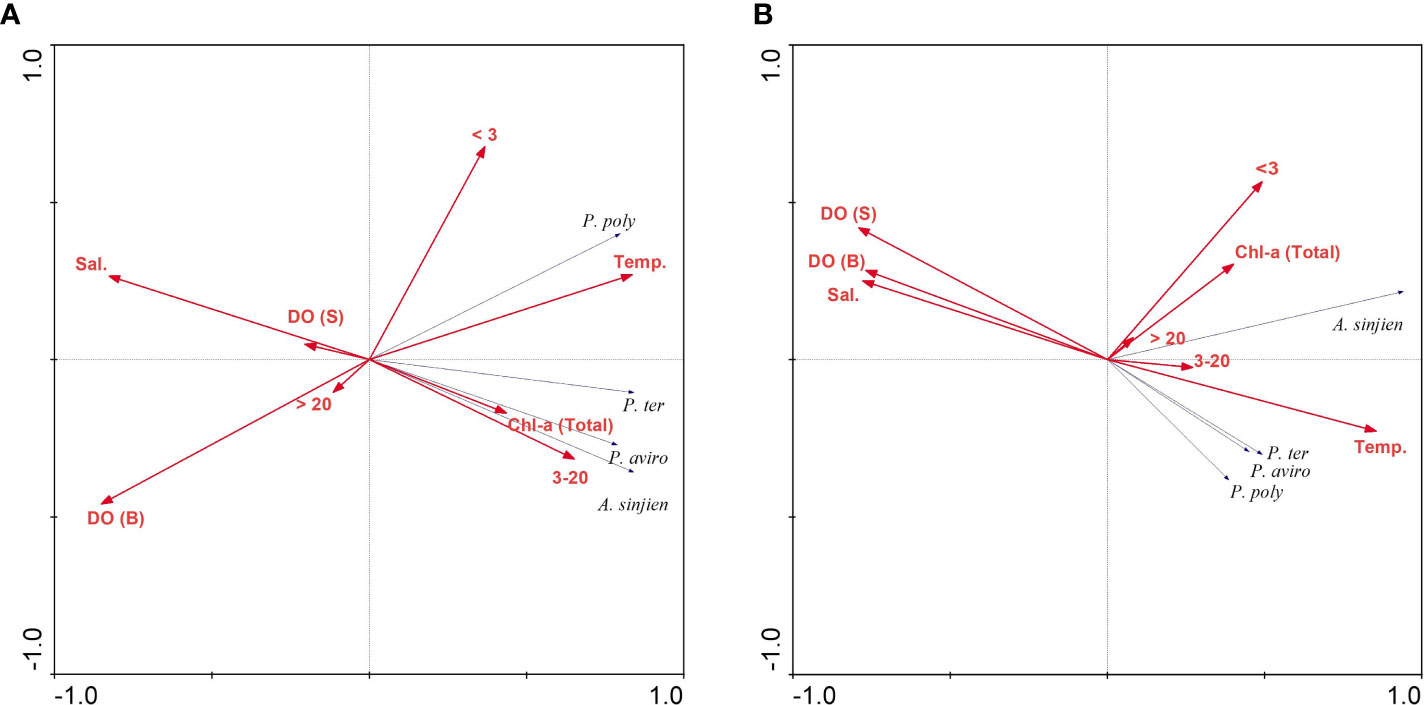
Figure 8 Results of the redundancy analysis (RDA) biplot of dominant species and environmental variables in the (A) inner bay and (B) middle bay. Dominant species are abbreviated as: P. poly, Pleopis polyphemoides; P. ter, Pseudoevadne tergestina; P. aviro, Penilia avirostris; A. sinjien, Acartia sinjiensis. Environmental variables are abbreviated as: Temp., Temperature; Sal., Salinity; DO (S), Dissolved oxygen (surface) concentration; DO (B), Dissolved oxygen (bottom) concentration; Chl-a (Total), total Chl-a concentration; > 20, > 20 µm categories of Chl-a concentration; 3–20, 3–20 µm categories of Chl-a concentration; < 3, < 3 µm categories of Chl-a concentration.
In the middle bay, the model explained 56.6% of the variance of dominant species and environmental data on the first two axes (Table 3). Furthermore, the species-environment correlations of axes 1 (0.95) and 2 (0.71) were relatively high. The environmental variables in axes 1 and 2 explained 90% of the variance in dominant species. The eigenvalues of the RDA were statistically significant according to Monte Carlo permutations. Temperature, salinity, surface, bottom DO concentration, and the < 3 µm categories of Chl-a concentration were the most important parameters affecting the variation of certain dominant species (p < 0.05). The three cladoceran species showed a positive correlation with temperature, coupled with a negative correlation with salinity and surface and bottom DO concentration. A. sinjiensis showed a positive correlation with temperature and the < 3 µm categories of Chl-a concentration (Figure 8B).
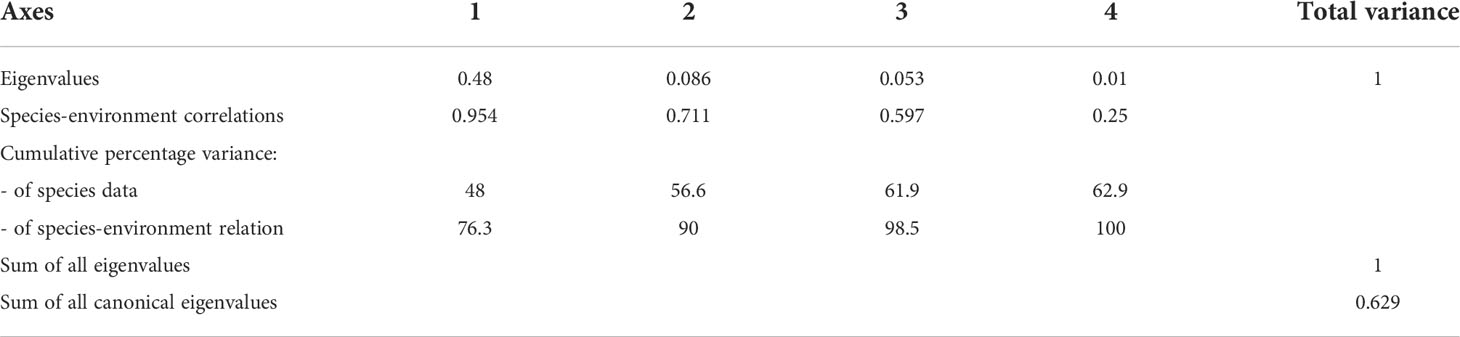
Table 3 Summary of the results of the redundancy analysis (RDA) between environmental variables and dominant specie in the middle bay.
The unique marine environment of Gamak Bay caused a decrease in DO concentration in summer and, particularly, an oxygen deficiency in the bottom of the inner Gamak Bay, which affected the mesozooplankton community structure. Previous studies have shown that zooplankton exhibits multiple responses when exposed to hypoxia (Marcus et al., 2004; Ekau et al., 2010; Kimmel et al., 2010; Elliott et al., 2013; Keister et al., 2020; He et al., 2021). Hypoxia not only causes the direct mortality of mesozooplankton but also negatively affects metabolism, productivity, growth, vertical migration, and distribution (Auel and Verheye, 2007). However, previous studies have demonstrated that many zooplankton prefer hypoxia as a refuge to tolerate hypoxia or avoid predators, either through vertical or seasonal migration (Ludsin et al., 2009).
Although many approaches to zooplankton collection in situ have been performed with respect to hypoxia, none have been completely satisfactory and their uncritical use may confound the interpretation of the results (Roman et al., 1993; Moon et al., 2006; Jang et al., 2015). In this study, the vertical hauls sampling of mesozooplankton from the bottom to the surface using a conical net without a closing device has methodological problems (avoidance or depth of distribution of mesozooplankton) in understanding the effect of hypoxia (Roman et al., 1993; Jang et al.,2015). Nevertheless, this method can directly and conveniently collect mesozooplankton in coastal waters. Also, direct death under hypoxic conditions will only occur if the organism is unable to move. The apparent avoidance behavior of zooplankton in hypoxic conditions may also respond differently depending on region and population. In the laboratory, the Acartia tonsa population from the Chesapeake Bay exhibited hypoxia avoidance behavior (Stalder and Marcus, 1997), and the A. tonsa population from the Gulf of Mexico did not avoid hypoxia at low 0.1 mg L-1 (Decker et al., 2003).
In this study, mesozooplankton abundance was higher in the inner bay than in the middle bay during the hypoxic period. This may be due to the high primary production in the inner bay, which increases the grazing and productivity of the zooplankton (Shi et al., 2019). During the hypoxic period in Gamak Bay, phytoplankton is largely generated by abundant nutrients under the thermocline and sufficient solar radiation (Kim et al., 2006). In this study, Chl-a concentration peaked in the inner bay during the hypoxic period. According to previous studies, the response of the zooplankton population was expected to increase with functional grazing and reproductive capacity as primary production increased (Blaxter et al., 1998; Tan et al., 2004). Therefore, the influx of nutrients causing hypoxia can indirectly improve mesozooplankton abundance through an increase in food supply (Shi et al., 2019).
In this study, a total of 45 and 52 taxa were identified in the inner and middle bay, respectively. Water temperature and salinity are important factors that determine the spatial and temporal distribution of zooplankton (Froneman, 2004; Shin et al., 2022). In the inner bay, most of the population was due to the active reproductive ability of cladocerans in summer when the water temperature was high, and copepods dominated in winter. In spring and autumn, copepods, planktonic larvae, and other zooplankton appeared to form the mesozooplankton community. In the middle bay, a higher proportion of copepods appeared compared to the inner bay. During the hypoxic period, cladocerans showed a high composition in July and August in the inner bay, whereas they were higher after September in the middle bay. Our data confirmed that the composition of mesozooplankton species, abundance, and spatiotemporal distribution was different due to differences in the tolerance of taxa in the hypoxic period. Cladocerans may exhibit preferential growth compared to copepods at the inner station of Gamak Bay, where hypoxia frequently occurs in summer. When dissolved oxygen levels are between the minimum and critical levels, copepod growth, development, physiology, and behavior change with dissolved oxygen levels (Brett, 1979; Dinh et al., 2020). Copepod survival and egg production are significantly lower at lower DO concentrations (Lutz et al., 1992; Roman et al., 1993; Keister et al., 2000: Marcus et al., 2004; Sedlacek and Marcus, 2005). The ability of cladocerans to synthesize hemoglobin is common, and this ability has been suggested as an adaptation to an unpredictable environment in which oxygen concentrations may abruptly drop to fatally low levels (Heisey and Porter, 1977; Weider and Lampert, 1985).
Copepods and cladocerans that generally form their populations through dormant eggs, but they have different life history strategies. Most cladocerans can reproduce rapidly through parthenogenesis during periods of favorable conditions (Egloff et al., 1997; Uye et al., 2000). On the other hand, copepods exhibit sexual reproduction, and must undergo a series of developmental stages to reach the adult stage (Dussart and Defaye, 1995). The temporal difference in the life history of these two taxa is an important factor in maintaining adaption and population under favorable or unfavorable conditions.
One of the major characteristics of the seasonal dynamics of zooplankton in temperate waters is their dormancy during their life cycle. Particularly, copepods and cladocerans produce dormant eggs to survive in adverse environmental conditions (Onbé et al., 1996; Marcus, 1996). These dormant eggs go through a refractory period and when favorable conditions are established, they hatch temporarily and join the population. That is, repeated generation maintenance strategies are taken (Marazzo and Valentin, 2004; Choi et al., 2021). In this study, the rapidly increased mesozooplankton abundance in the inner bay in summer and autumn was likely due to the hatching of dormant eggs and provide an environment for temporary mass reproduction. However, dormant eggs in the field were not investigated, so it cannot be predicted easily. Nevertheless, the dormant eggs of copepods and cladocerans clearly hatched at the inner bay, which have been hypoxic for a considerable time, making significant contributions to the food web of the Gamak Bay ecosystem.
In this study, the total mesozooplankton abundance in the inner bay was mainly contributed by cladocerans during the hypoxic period. In the inner bay, cladocerans appeared from May, when the water temperature gradually increased, and the number of more than 5,000 indiv. m-3 continued to appear throughout August when the average water temperature was 25.6–26.5 °C and the average salinity was 29.3–31. After that, the water temperature gradually decreased and the salinity increased, so they did not appear. In this study, three species of cladocerans dominated at different times (coexisting and separating), and the order of appearance was P. polyphemoides, P. tergestina, and P. avirostris. The optimal environmental conditions for cladocerans are known to vary by region, and this separation is often explained by the optimal temperature and salinity conditions for each species (Egloff et al., 1997). P. polyphemoides appeared in a wider water temperature and salinity range than the other two species. Although P. tergestina and P. avirostris had similar preferred salinity ranges, P. tergestina had a wider range of water temperature than P. avirostris. Therefore, we concluded that the three species of cladocerans were able to maintain a high population by separating or coexisting in the inner bay because each species had different ranges of preferred water temperature and salinity according to their physiological characteristics.
Cladocerans responded to low oxygen conditions depending on their size. Karpowicz et al. (2020) found that small freshwater rotifers and small freshwater cladocerans were more resistant to hypoxia than larger freshwater cladocerans, and that this oxygen stress is one of the most important factors to alter the structure of zooplankton in lakes. In this study, cladocerans were far more dominant than copepods through their rapid reproductive capacity during the hypoxic period in the inner bay. The order of appearance was P. polyphemoides, P. tergestina, and P. avirostris, and the earlier the species appeared, the longer it appeared. P. polyphemoides appeared when the bottom DO concentration was 5.2 mg L-1, and peaked when a low bottom DO concentration of 1.2 to 1.5 mg L-1 was formed. When the hypoxia had temporarily disappeared, they did not appear. Even after hypoxia had completely disappeared, they also appeared at a DO concentration of 6 mg L-1. P. tergestina began to appear at the end of June when hypoxia first occurred, and the abundance increased even when hypoxia had temporarily disappeared. After that, the maximum abundance was shown in the hypoxic condition of 1.9 mg L-1, and when the hypoxia had disappeared, and decreased rapidly and appeared in small numbers until October. P. avirostris appeared in mid-July, when the hypoxia had temporarily disappeared, and the maximum abundance was in mid-August, when the bottom DO concentration was very low at 0.7 mg L-1. After that, they did not appear even though the hypoxia was not over. In this study, the average body length of the three species was approximately 0.65 mm for P. polyphemoides, 1.3 mm for P. tergestina, and 1.4 mm for P. avirostris, and the later appearance period, the larger the species appeared. Therefore, it is believed that P. polyphemoides, which are the smallest in size, tolerated the hypoxic period for the longest time, and the P. avirostris, which are relatively large in size, are not likely to survive the hypoxic period for long.
Copepods, cladocerans and planktonic larvae are the most important mesozooplankton taxa in Gamak Bay (Soh et al., 2002; Choi, 2020). Katechakis et al. (2004) suggested that copepods, crustaceans, and dolioida could coexist in summer due to different food selectivity and ingestion and assimilation rates. Acartia clausi reached the highest grazing coefficient for large algae over 70 μm, and P. avirostris covered nanoflagellates and ciliates ranging from 2.5–100 μm. It is a known fact that cladocerans are mostly filter feeders with strong feeding preferences for bacteria, microzooplankton and certain phytoplankton species. The feeding pattern of Podonidae (P. polyphemoides and P. tergestina), which appeared dominant in this study, is known as a raptorial feeder (Jagger et al., 1988), they prey largely on diatoms (Jagger et al., 1988; Kim et al., 1989) and potentially on flagellates, including heterotrophs and autotrophs (Turner et al., 1988). P. avirostris is also known as a filter feeder, feeding on bacteria and nanoflagellates (Paffenhöfer and Orcutt, 1986; Turner et al., 1988) and larger diatoms (Kim et al., 1989). In this study, the reason cladocerans can dominate the mesozooplankton community in Gamak Bay may be due to their broader feeding efficiency. However, only three sizes of phytoplankton were considered in this study, and this may not be sufficient to explain the observed variability.
The RDA results indicated that the dominant species showed a significant correlation with water temperature, salinity, DO concentration, total Chl-a concentration, and size-fractionated Chl-a concentration among environmental variables. In the inner bay, P. polyphemoides showed a positive correlation with water temperature and the < 3 µm categories of Chl-a concentration, and a negative correlation with bottom DO concentration. P. tergestina, P. avirostris, and A. sinjiensis showed a positive correlation with water temperature and the 3–20 µm categories of Chl-a concentration and a negative correlation with salinity. In the middle bay, cladocerans showed a positive correlation with water temperature and a negative correlation with surface and bottom DO concentration, A. sinjiensis showed a positive correlation with water temperature and the < 3 µm categories of Chl-a concentration. In general, in temperate waters with distinct seasonal changes, mesozooplankton is more affected by water temperature and salinity. Therefore, the results of this study are considered valid. Furthermore, hypoxic environments may play a role in reducing zooplankton abundance in eutrophic systems (Park and Marshall, 2000). However, several studies have also shown that zooplankton can exhibit high abundance in hypoxic environments (Roman et al., 2019; Karpowicz et al., 2020). As a result, the environmental factors (non-oxygen) that affect the dominant species in the two regions are different, but considering the characteristics of the sea area where seawater flow was low and high phytoplankton proliferated, our findings indicated that an appropriate habitat for dominant species had been created.
The fluctuations of zooplankton communities in coastal areas where hypoxia occurs frequently depend on the tolerance of taxa and seasonal fluctuations. In this study, we observed the effect of hypoxia on zooplankton community distribution. During the hypoxic period, cladocerans were found to be more tolerant than copepods in the inner bay where hypoxia is formed. Most of them experience a strong hypoxic state rather than an anaerobic state over the years, eventually changing the structure and function of the ecosystem. However, we did not find clear evidence that cladocerans and copepods could advance their appearance according to space in the hypoxia period. These results provide important information for understanding the response of mesozooplankton under hypoxic conditions as hypoxia gradually intensifies due to climate change or environmental pollution in the future.
The raw data supporting the conclusions of this article will be made available by the authors, without undue reservation.
EHL conceived and designed the experiments, performed the experiments, analyzed the data, prepared figures and/or tables, authored or reviewed drafts of the paper, and approved the final draft. SYC conceived and designed the experiments, performed the experiments, analyzed the data, authored or reviewed drafts of the paper, and approved the final draft. MHS conceived and performed the experiments, analyzed the data, prepared figures and/or tables, authored or reviewed drafts of the paper, and approved the final draft. HYS contributed to funding acquisition, conceptualization of the experiments, data interpretation and discussion, authored or reviewed drafts of the paper, and approved the final draft. All authors contributed to the article and approved the submitted version.
This research was part of a project titled “Research center for fishery resource management based on the information and communication technology” (2022, grant number 20180384), funded by the Ministry of Oceans and Fisheries, Korea, and by the National Marine Biodiversity Institute of Korea (grant number 2022M01100).
We thank the reviewers for their valuable comments and suggestions on the manuscript.
The authors declare that the research was conducted in the absence of any commercial or financial relationships that could be construed as a potential conflict of interest.
All claims expressed in this article are solely those of the authors and do not necessarily represent those of their affiliated organizations, or those of the publisher, the editors and the reviewers. Any product that may be evaluated in this article, or claim that may be made by its manufacturer, is not guaranteed or endorsed by the publisher.
The Supplementary Material for this article can be found online at: https://www.frontiersin.org/articles/10.3389/fmars.2022.1005442/full#supplementary-material
Altieri A. H., Gedan K. B. (2015). Climate change and dead zones. Glob. Change Biol. 21, 1395–1406. doi: 10.1111/gcb.12754
Atienza D., Saiz E., Skovgaard A., Trepat I., Calbet A. (2008). Life history and population dynamics of the marine cladoceran Penilia avirostris (Branchiopoda: Cladocera) in the Catalan Sea (NW Mediterranean). J. Plankton Res. 30, 345–357. doi: 10.1093/plankt/fbm109
Auel H., Verheye H. M. (2007). Hypoxia tolerance in the copepod Calanoides carinatus and the effect of an intermediate oxygen minimum layer on copepod vertical distribution in the northern benguela current upwelling system and the Angola–benguela front. J. Exp. Mar. Biol. Ecol. 352, 234–243. doi: 10.1016/j.jembe.2007.07.020
Bendtsen J., Hansen J. L. S. (2013). Effects of global warming on hypoxia in the Baltic Sea – north Sea transition zone. Ecol. Model. 264, 17–26. doi: 10.1016/j.ecolmodel.2012.06.018
Blaxter J. H. S., Douglas B., Tyler P. A., Mauchline J. (1998). The biology of calanoid copepods Vol. 33 (San Diego: Academic Press).
Breitburg D., Levin L. A., Oschlies A., Grégoire M., Chavez F. P., Conley D. J., et al. (2018). Declining oxygen in the global ocean and coastal waters. Science 359, eaam7240. doi: 10.1126/science.aam7240
Brett J. R. (1979). “Environmental factors and growth,” in Fish physiology, vol. VIII . Eds. Hoar W. S., Randall D. J., Brett J. R. (New York: Academic Press), 599–675.
Carstensen J., Andersen J. H., Gustafsson B. G., Conley D. J. (2014). Deoxygenation of the Baltic Sea during the last century. Proc. Natl. Acad. Sci. 111, 5628–5633. doi: 10.1073/pnas.1323156111
Choi S. Y. (2020). Spatial and temporal distribution of acartia (Crustacea, copepoda, calanoida) species in the southern coastal waters of Korea and the physio-ecological characteristics of acartia erythraea (Yeosu, Korea: Chonnam National University).
Choi S. Y., Jang M. C., Youn S. H., Seo M. H., Soh H. Y. (2021). Egg production and hatching patterns of Acartia erythraea (Copepoda, calanoida), with a note on its two egg types, in a eutrophic bay in Korea. J. Plankton Res. 43, 428. doi: 10.1093/plankt/fbab030
Conley D. J., Bjoürck S., Bonsdorff E., Carstensen J., Destouni G., Gustafsson B. G., et al. (2009). Hypoxia-related processes in the Baltic Sea. Environ. Sci. Technol. 43, 3412–3420. doi: 10.1021/es802762a
Decker M. B., Breitburg D. L., Marcus N. H. (2003). Geographical differences in behavioral responses to hypoxia: local adaptation to an anthropogenic stressor? Ecol. Appl. 13, 1104–1109. doi: 10.1890/1051-0761(2003)13[1104:GDIBRT]2.0.CO;2
Diaz R. J. (2001). Overview of hypoxia around the world. J. Environ. Qual. 30, 275–281. doi: 10.2134/jeq2001.302275x
Diaz R. J., Rosenberg R. (2008). Spreading dead zones and consequences for marine ecosystems. Science 321, 926–929. doi: 10.1126/science.1156401
Dinh K. V., Cuevas-Sanchez A. Y., Buhl K. S., Moeser E. A., Dowd W. (2020). Heat tolerance and thermal preference of the copepod Tigriopus californicus are insensitive to ecologically relevant dissolved oxygen levels. Sci. Rep. 10, 1–10. doi: 10.1038/s41598-020-75635-z
Dussart B. H., Defaye D. (1995). Copepoda: Introduction to the copepoda (Amsterdam: SPB Academic Publishing), 277.
Egloff D. A., Fofonoff P. W., Onbé T. (1997). Reproductive biology of marine cladocerans. Adv. Mar. Biol. 31, 79–168. doi: 10.1016/S0065-2881(08)60222-9
Ekau W., Auel H., Pörtner H. O., Gilbert D. (2010). Impacts of hypoxia on the structure and processes in pelagic communities (zooplankton, macro-invertebrates and fish). Biogeosciences 7, 1669–1699. doi: 10.5194/bg-7-1669-2010
Elliott D. T., Pierson J. J., Roman M. R. (2012). Relationship between environmental conditions and zooplankton community structure during summer hypoxia in the northern gulf of Mexico. J. Plankton Res. 34, 602–613. doi: 10.1093/plankt/fbs029
Elliott D. T., Pierson J. J., Roman M. R. (2013). Predicting the effects of coastal hypoxia on vital rates of the planktonic copepod Acartia tonsa Dana. PloS One 8, e63987. doi: 10.1371/journal.pone.0063987
Froneman P. W. (2004). Zooplankton community structure and biomass in a southern African temporarily open/closed estuary. Estuar. Coast. Shelf Sci. 60, 125–132. doi: 10.1016/j.ecss.2003.12.002
Grodzins M. A., Ruz P. M., Keister J. E. (2016). Effects of oxygen depletion on field distributions and laboratory survival of the marine copepod Calanus pacificus. J. Plankton Res. 38, 1412–1419. doi: 10.1093/plankt/fbw063
Hansen F. C., Möllmann C., Schütz U., Neumann T. (2006). Spatio-temporal distribution and production of calanoid copepods in the central Baltic Sea. J. Plankton Res. 28, 39–54. doi: 10.1093/plankt/fbi097
Heisey D., Porter K. G. (1977). The effect of ambient oxygen concentration on filtering and respiration rates of Daphnia galeata mendotae and Daphnia magna. Limnol. Oceanogr. 22, 839–845. doi: 10.4319/lo.1977.22.5.0839
He X., Pan Z., Zhang L., Han D. (2021). Physiological and behavioral responses of the copepod Temora turbinata to hypoxia. Mar. pollut. Bull. 171, 112692. doi: 10.1016/j.marpolbul.2021.112692
IPCC (2013). Climate change 2013: the physical science basis: Working group I contribution to the fifth assessment report of the intergovernmental panel on climate change. Eds. Stocker T. F., Qin D., Plattner G.-K., Tignor M., Allen S. K., Boschung J., Nauels A., Xia Y., Bex V., Midgley P. M. (Cambridge: Cambridge Univ. Press).
Isinibilir M. (2009). Annual crustacean zooplankton succession (Copepoda and cladocera) in the upper layer of ahirkapi coastal waters (northeastern Sea of marmara). Crustaceana 82, 669–678. doi: 10.1163/156854008X380273
Isinibilir M., Kideys A. E., Tarkan A. N., Yilmaz I. N. (2008). Annual cycle of zooplankton abundance and species composition in izmit bay (the northeastern marmara Sea). Estuar. Coast. Shelf Sci. 78, 739–747. doi: 10.1016/j.ecss.2008.02.013
Jagger R. A., Kimmerer W. J., Jenkins G. P. (1988). Food of the cladoceran Podon intermedius in a marine embayment. Mar. Ecol. Prog. Ser. 43, 245–250. doi: 10.3354/meps043245
Jang M. C., Shin K., Jang P. G., Lee W. J., Choi K. H. (2015). Mesozooplankton community in a seasonally hypoxic and highly eutrophic bay. Mar. Freshw. Res. 66, 719–729. doi: 10.1071/MF14036
Jenny J., Arnaud F., Alric B., Dorioz J., Sabatier P., Meybeck M., et al. (2014). Global biogeochemical cycles lakes under global warming. Glob. Biogeochem. Cycles 28, 1413–1423. doi: 10.1002/2014GB004932
Karpowicz M., Ejsmont-Karabin J., Kozłowska J., Feniova I., Dzialowski A. R. (2020). Zooplankton community responses to oxygen stress. Water 12, 706. doi: 10.3390/w12030706
Katechakis A., Stibor H., Sommer U., Hansen T. (2004). Feeding selectivities and food niche separation of Acartia clausi, Penilia avirostris (Crustacea) and Doliolum denticulatum (Thaliacea) in blanes bay (Catalan Sea, NW Mediterranean). J. Plankton Res. 26, 589–603. doi: 10.1093/plankt/fbh062
Keeling R. F., Körtzinger A. K., Gruber N. (2010). Ocean deoxygenation in a warming world. Ann. Rev. Mar. Sci. 2, 199–229. doi: 10.1146/annurev.marine.010908.163855
Keister J. E., Houde E. D., Breitburg D. L. (2000). Effects of bottom-layer hypoxia on abundances and depth distributions of organisms in patuxent river, Chesapeake bay. Mar. Ecol. Prog. Ser. 205, 43–59. doi: 10.3354/meps205043
Keister J. E., Winans A. K., Herrmann B. (2020). Zooplankton community response to seasonal hypoxia: a test of three hypotheses. Diversity 12, 21. doi: 10.3390/d12010021
Kemp W. M., Boynton W. R., Adolf J. E., Boesch D. F., Boicourt W. C., Brush G. (2005). Eutrophication of Chesapeake bay: historical trends and ecological interactions. Mar. Ecol. Prog. Ser. 303, 1–29. doi: 10.3354/meps303001
Kim S. Y., Jun S. H., Lee Y. S., Lee Y. H., Kim B. M. (2011). Characteristics of phosphate flux at the sediment-water interface in gamak bay during the hypoxic water mass. J. Environ. Sci. Int. d20, 1069–1078. doi: 10.5322/JES.2011.20.9.1069
Kim J., Lee S. Y., Yu J., Choi Y. H., Jung C., Lee P. (2006). The characteristics of oxygen deficient water mass in gamak bay. J. Korean Soc Mar. Environ. Energy 9, 216–224.
Kimmel D. G., Boicourt W. C., Pierson J. J., Roman M. R., Zhang X. (2010). The vertical distribution and diel variability of mesozooplankton biomass, abundance and size in response to hypoxia in the northern gulf of Mexico USA. J. Plankton Res. 32, 1185–1202. doi: 10.1093/plankt/fbp136
Kim S. W., Onbé T., Yoon Y. H. (1989). Feeding habits of marine cladocerans in the inland Sea of Japan. Mar. Biol. 100, 313–318. doi: 10.1007/BF00391145
Kim J. B., Park J. I., Jung C. G., Choi W. J., Lee W. C., Lee Y. H. (2010). Physicochemical characteristics of seawater in gamak bay for a period of hypoxic water mass disappearance. J. Korean Soc Mar. 16, 241–248.
Klais R., Lehtiniemi M., Rubene G., Semenova A., Margonski P., Ikauniece A., et al. (2016). Spatial and temporal variability of zooplankton in a temperate semi-enclosed sea: implications for monitoring design and long-term studies. J. Plankton Res. 38, 652–661. doi: 10.1093/plankt/fbw022
Lee T. (2015). Sediment oxygen consumption rate and hydrogen sulfide release by dissolved oxygen depletion in hypoxic area of the gamak bay, Korea. J. Wet. Res. 17, 293–302. doi: 10.17663/JWR.2015.17.3.293
Lee K. H., Cho K. D. (1990). Distributions of the temperature and salinity in kamak bay. Korean J. Fish. Aquat. Sci. 23, 25–39.
Lee Y. G., Jeong D. U., Lee J. S., Choi Y. H., Lee M. O. (2016). Effects of hypoxia caused by mussel farming on benthic foraminifera in semi-closed gamak bay, south Korea. Mar. pollut. Bull. 109, 566–581. doi: 10.1016/j.marpolbul.2016.01.024
Lee T., Kim H. C., Son Y. B. (2019). Sediment oxygen consumption and hydrogen sulfide release in hypoxic areas of gamak bay, Korea. Appl. Ecol. Environ. Res. 17, 3199–3214. doi: 10.15666/aeer/1702_31993214
Li D., Wen Y., Zhang G., Zhang G., Xu W., Sun J. (2022). Effects of terrestrial inputs on mesozooplankton community structure in bohai bay, China. Diversity 14, 410. doi: 10.3390/d14050410
Ludsin S. A., Zhang X., Brandt S. B., Roman M. R., Boicourt W. C., Mason D. M., et al. (2009). Hypoxia-avoidance by planktivorous fish in Chesapeake bay: implications for food web interactions and fish recruitment. J. Exp. Mar. Biol. Ecol. 381, S121–S131. doi: 10.1016/j.jembe.2009.07.016
Lutz R. V., Marcus N. H., Chanton J. P. (1992). Effects of low oxygen concentrations on the hatching and viability of eggs of marine calanoid copepods. Mar. Biol. 114, 241–247. doi: 10.1007/BF00349525
Marazzo A., Valentin J. L. (2004). Reproductive aspects of marine cladocerans Penilia avirostris and Pseudevadne tergestina (Crustacea, branchiopoda) in the outer part of guanabara bay, Brazil. Braz. J. Biol. 64, 543–549. doi: 10.1590/S1519-69842004000300017
Marcus N. H. (1996). Ecological and evolutionary significance of resting eggs in marine copepods: past, present, and future studies. Hydrobiologia 320, 141–152. doi: 10.1007/BF00016815
Marcus N. H. (2001). “Zooplankton: responses to and consequences of hypoxia,” in Coastal hypoxia: Consequences for living resources and ecosystems. Eds. Rabalais N. N., Turner R. E. (Washington, DC: American Geophysical Union).
Marcus N. H., Richmond C., Sedlacek C., Miller G. A., Oppert C. (2004). Impact of hypoxia on the survival, egg production and population dynamics of Acartia tonsa Dana. J. Exp. Mar. Biol. Ecol. 301, 111–128. doi: 10.1016/j.jembe.2003.09.016
Moon S. Y., Soh H. Y., Choi S. D., Jung C. S., Kim S. Y., Lee Y. S. (2006). Effect of a low-oxygen layer on the vertical distribution of zooplankton in gamak bay. Korean J. Environ. Biol. 24, 240–247.
Mullin M. M., Onbé T. (1992). Diel reproduction and vertical distributions of the marine cladocerans, Evadne tergestina and Penilia avirostris, in contrasting coastal environments. J. Plankton Res. 14, 41–59. doi: 10.1093/plankt/14.1.41
NIFS (2010). A survey on the actual conditions of fishery farming environment (Yeosu: Chonnam National University), 109–150.
Noh I. H. (2003). The distribution of organic matter and its origin in core sediment in gamak bay, southern Korea (Yeosu, Korea: Yeosu National University).
Omorii M., Ikeda T. (1984). Methods in marine zooplankton ecology (New York: John Wiley and Sons. Inc), 25.
Onbé T., Terazaki M., Nagasawa S. (1996). Summer distribution of marine cladocerans in otsuchi bay, northeastern Honshu, Japan. Bull. Plankton Soc Japan 43, 121–131.
Paffenh¨ofer G.-A., Orcutt J. D. (1986). Feeding, growth and food conversion of the marine cladoceran Penilia avirostris. J. Plankton Res. 8, 741–754. doi: 10.1093/plankt/8.4.741
Pan J., Cheng F., Yu F. (2018). The diel vertical migration of zooplankton in the hypoxia area observed by video plankton recorder. Indian J. Mar. Sci. 47, 1353–1363.
Park G. S., Marshall H. G. (2000). The trophic contributions of rotifers in tidal freshwater and estuarine habitats. Estuar. Coast. Shelf Sci. 51, 729–742. doi: 10.1006/ecss.2000.0723
Parsons T. R., Maita Y., Lalli C. M. (1984). A manual of chemical and biological methods for seawater analysis (New York: Pergamon Press), 173.
Rabalais N. N., Díaz R. J., Levin L. A., Turner R. E., Gilbert D., Zhang J. (2010). Dynamics and distribution of natural and human-caused hypoxia. Biogeosciences 7, 585–619. doi: 10.5194/bg-7-585-2010
Rakhesh M., Raman A. V., Ganesh T., Chandramohan P., Dehairs F. (2013). Small copepods structuring mesozooplankton community dynamics in a tropical estuary-coastal system. Estuar. Coast. Shelf Sci. 126, 7–22. doi: 10.1016/j.ecss.2013.03.025
Richmond C., Marcus N. H., Sedlacek C., Miller G. A., Oppert C. (2006). Hypoxia and seasonal temperature: Short-term effects and long-term implications for Acartia tonsa dana. J. Exp. Mar. Biol. Ecol. 328, 177–196. doi: 10.1016/j.jembe.2005.07.004
Roman M. R., Brandt S. B., Houde E. D., Pierson J. J. (2019). Interactive effects of hypoxia and temperature on coastal pelagic zooplankton and fish. Front. Mar. Sci. 6. doi: 10.3389/fmars.2019.00139
Roman M. R., Gauzens A. L., Rhinehart W. K., White J. R. (1993). Effects of low oxygen waters on Chesapeake bay zooplankton. Limnol. Oceanogr. 38, 1603–1614. doi: 10.4319/lo.1993.38.8.1603
Roman M. R., Pierson J. J., Kimmel D. G., Boicourt W. C., Zhang X. (2012). Impacts of hypoxia on zooplankton spatial distributions in the northern gulf of Mexico. Estuaries coasts 35, 1261–1269. doi: 10.1007/s12237-012-9531-x
Sedlacek C., Marcus N. H. (2005). Egg production of the copepod Acartia tonsa: the influence of hypoxia and food concentration. J. Exp. Mar. Biol. Ecol. 318, 183–190. doi: 10.1016/j.jembe.2004.12.012
Seo J. Y., Park S. H., Lee J. H., Choi J. W. (2012). Structural changes in macrozoobenthic communities due to summer hypoxia in gamak bay, Korea. Ocean Sci. J. 47, 27–40. doi: 10.1007/s12601-012-0003-9
Shi Z., Liu K., Zhang S., Xu H., Liu H. (2019). Spatial distributions of mesozooplankton biomass, community composition and grazing impact in association with hypoxia in the pearl river estuary. Estuar. Coast. Shelf Sci. 225, 106237. doi: 10.1016/j.ecss.2019.05.019
Shin S. S., Choi S. Y., Seo M. H., Lee S. J., Soh H. Y., Youn S. H. (2022). Spatiotemporal distribution characteristics of copepods in the water masses of the northeastern East China Sea. J. Mar. Sci. Eng. 10, 754. doi: 10.3390/jmse10060754
Shin H. H., Jung S. W., Jang M. C., Kim Y. O. (2013). Effect of pH on the morphology and viability of Scrippsiella trochoidea cysts in the hypoxic zone of a eutrophied area. Harmful Algae 28, 37–45. doi: 10.1016/j.hal.2013.05.011
Slater W. L., Pierson J. J., Decker M. B., Houde E. D., Lozano C., Seuberling J. (2020). Fewer copepods, fewer anchovies, and more jellyfish: how does hypoxia impact the Chesapeake bay zooplankton community? Diversity 12, 35. doi: 10.3390/d12010035
Soh H. Y., Lee I. T., Yoon Y. H., Choi S. D., Lee S. N., Han M. I., et al. (2002). Species composition and occurrence patterns of zooplankton in gamag bay. Korean J. Environ. Biol. 20, 118–129.
Stalder L. C., Marcus N. H. (1997). Zooplankton responses to hypoxia: behavioral patterns and survival of three species of calanoid copepods. Mar. Biol. 127, 599–607. doi: 10.1007/s002270050050
Tan Y., Huang L., Chen Q., Huang X. (2004). Seasonal variation in zooplankton composition and grazing impact on phytoplankton standing stock in the pearl river estuary, China. Cont. Shelf Res. 24, 1949–1968. doi: 10.1016/j.csr.2004.06.018
Ter Braack C. J. F., Šmilauer P. (2002). “CANOCO reference manual and user’s guide to canoco for windows,” in Software for canonical community ordination (version 4.5) (Ithaca, NY, USA: Microcomputer Power).
Turner J. T., Tester P. A., Ferguson R. L. (1988). The marine cladoceran Penilia avirostris and the “microbial loop” of pelagic food webs. Limnol. Oceanogr. 33, 245–255. doi: 10.4319/lo.1988.33.2.0245
Uye S., Shimazu T., Yamamuro M., Ishitobi Y., Kamiya H. (2000). Geographic and seasonal variations in mesozooplankton abundance and biomass in relation to environmental parameters in lake shinji-ohashi river- lake nakaumi brackish-water system, Japan. J. Mar. Sys. 26, 193–207. doi: 10.1016/S0924-7963(00)00054-3
Vaquer-Sunyer R., Duarte C. M. (2008). Thresholds of hypoxia for marine biodiversity. Proc. Natl. Acad. Sci. 105, 15452–15457. doi: 10.1073/pnas.0803833105
Keywords: dissolved oxygen (DO), environmental condition, cladocera, copepoda, hypoxic period, tolerance
Citation: Lee EH, Choi SY, Seo MH and Soh HY (2022) Impacts of hypoxia on the mesozooplankton community structure in a semi-enclosed bay. Front. Mar. Sci. 9:1005442. doi: 10.3389/fmars.2022.1005442
Received: 28 July 2022; Accepted: 06 October 2022;
Published: 19 October 2022.
Edited by:
Meilin WU, South China Sea Institute of Oceanology (CAS), ChinaReviewed by:
Sanjeevan V. N., Kerala University of Fisheries and Ocean Studies, IndiaCopyright © 2022 Lee, Choi, Seo and Soh. This is an open-access article distributed under the terms of the Creative Commons Attribution License (CC BY). The use, distribution or reproduction in other forums is permitted, provided the original author(s) and the copyright owner(s) are credited and that the original publication in this journal is cited, in accordance with accepted academic practice. No use, distribution or reproduction is permitted which does not comply with these terms.
*Correspondence: Ho Young Soh, aHlzb2hAY2hvbm5hbS5hYy5rcg==
Disclaimer: All claims expressed in this article are solely those of the authors and do not necessarily represent those of their affiliated organizations, or those of the publisher, the editors and the reviewers. Any product that may be evaluated in this article or claim that may be made by its manufacturer is not guaranteed or endorsed by the publisher.
Research integrity at Frontiers
Learn more about the work of our research integrity team to safeguard the quality of each article we publish.