- 1College of Earth Science, Chengdu University of Technology, Chengdu, China
- 2College of Geographic Science, Nantong University, Nantong, China
- 3Southern Marine Science and Engineering Guangdong Laboratory (Guangzhou), Guangzhou, China
- 4Shenzhen Institute of Advanced Technology, Chinese Academy of Sciences, Shenzhen, China
The increasingly intensified development of coastal cities causes excessive consumption of natural resources, leading to environmental damage and increasing conflict between development and ecological protection. In addition to emphasizing ecological development, planners should pay more attention to the practical optimization and regulation of the developed landscape pattern. Taking Dafeng as an example, this study constructs a landscape-pattern optimization method suitable for the spatial distribution heterogeneity of ecological risk-level units in the coastal zone. The study is based on (a) an analysis of the composition and evolution characteristics of Dafeng’s coastal landscape elements, (b) the landscape pattern index of the ecosystem’s overall risk assessment, and (c) the minimal cumulative resistance (MCR) model. The study uses an ecosystem service value to build a resistance model by analyzing the medium and high-risk composition and distribution characteristics of space unit elements. Finally, 23 ecological sources, 14 ecological nodes, and 17 ecological corridors (total length 169.63 km) were built. The optimized coastal zone landscape pattern jointly protects the landscape area of high ecological value by 462.02 km2. The total ecological value is 105,01.71 million yuan. Landscape connectivity has been optimized, as well as the ecosystem’s stability and total service value. The optimization method proposed in this paper can reduce the protection area and cost. The spatial optimization unit is highly targeted, providing new ideas for the coastal cities to implement their ecological development and protection strategies.
1 Introduction
As a transitional zone connecting the sea and the land, the coastal zone is of great significance to the expansion of human living space due to its abundant natural resources and dynamic expandable land space (Knecht, 1975). However, the coastal zone is simultaneously affected by natural and human-made external disturbances from the sea and land (Hepcan et al., 2013; Rodrigues et al., 2021; Hoel et al., 2022), and its ecosystem is sensitive and fragile (Doney, 2010), especially in recent decades, due to increasing development. Its ecological problems have become prominent and have a significant impact on the global ecological environment (He and Silliman, 2019). Eco-environmental problems in coastal zones have received extensive attention (Kantamaneni et al., 2018; Rangel-Buitrago et al., 2020). The United Nations has proposed the decade of 2021–2030 as the Decade of Ocean Science for Sustainable Development (UNESCO, 2019; Dai, 2021), while the international scientific community has launched projects such as Future Earth Coasts (FEC, https://www.futureearthcoasts.org/). More and more attention is being paid to research on measures to ensure the sustainable development of coastal zones (Liu et al., 2020).
The research on sustainable development measures is gradually changing from monitoring and evaluating ecological problems in the early stages to optimizing and regulating research for different ecological problems (Li et al., 2019; Zhang et al., 2020; Anfuso et al., 2021; Yan et al., 2021). Some scholars have carried out landscape pattern optimization research on rural settlements (Qu et al., 2021), agricultural land, and wetlands (He and Chen, 2021) in the coastal zone, but less consideration is given to the spatial heterogeneity of human interference. The degree of human interference in the coastal zone shows spatial heterogeneous, so the landscape ecological optimization measures taken should follow this spatial heterogeneity, and focus on the spatial units that have a large degree of disturbance. Therefore, coastal landscape optimization should focus more on those spatial units that are more disturbed. It is also an inevitable trend in current regional sustainable development measures.
The landscape space is adjusted and combined to achieve maximum ecological benefits and regional sustainable development (Chen et al., 2014). In recent years, the minimum cumulative resistance model (MCR) (Li et al., 2015; Xu et al., 2021) has become more and more mature in landscape optimization. It analyzes the relationship between the internal units of the landscape through distance and resistance factors and comprehensively understands the relationship between landscape pattern, ecological process, and function (Dai et al., 2021; Wei et al., 2022). Although the construction of this model in some studies (Cui et al., 2022) considers the impact of human activities, less consideration has been given to the impact of on regional ecological risks and sustainable development (Chen et al., 2017a; Han et al., 2022). For this, based on the spatial heterogeneity of the coastal landscape ecological pattern, targeted optimization of the landscape pattern is more practical and less costly for improving the coastal ecological pattern and achieving regional sustainable development.
The study built a landscape-pattern optimization method considering the spatial distribution characteristics of human activity disturbance in the coastal zone based on an analysis of the spatial distribution characteristics of the structure, function and risk of coastal ecosystem. The study selected China’s Dafeng District as an example for analysis. This paper aims to: (1) construct a low-cost ecological pattern optimization method based on an analysis of the current characteristics of the coastal zone’s ecology; and (2) provide theoretical guidance for landscape ecological risk prevention and control and landscape-pattern optimization in the Dafeng coastal zone to afford new thoughts for implementing sustainable development strategies in coastal zones.
2 Materials and methods
2.1 Study area
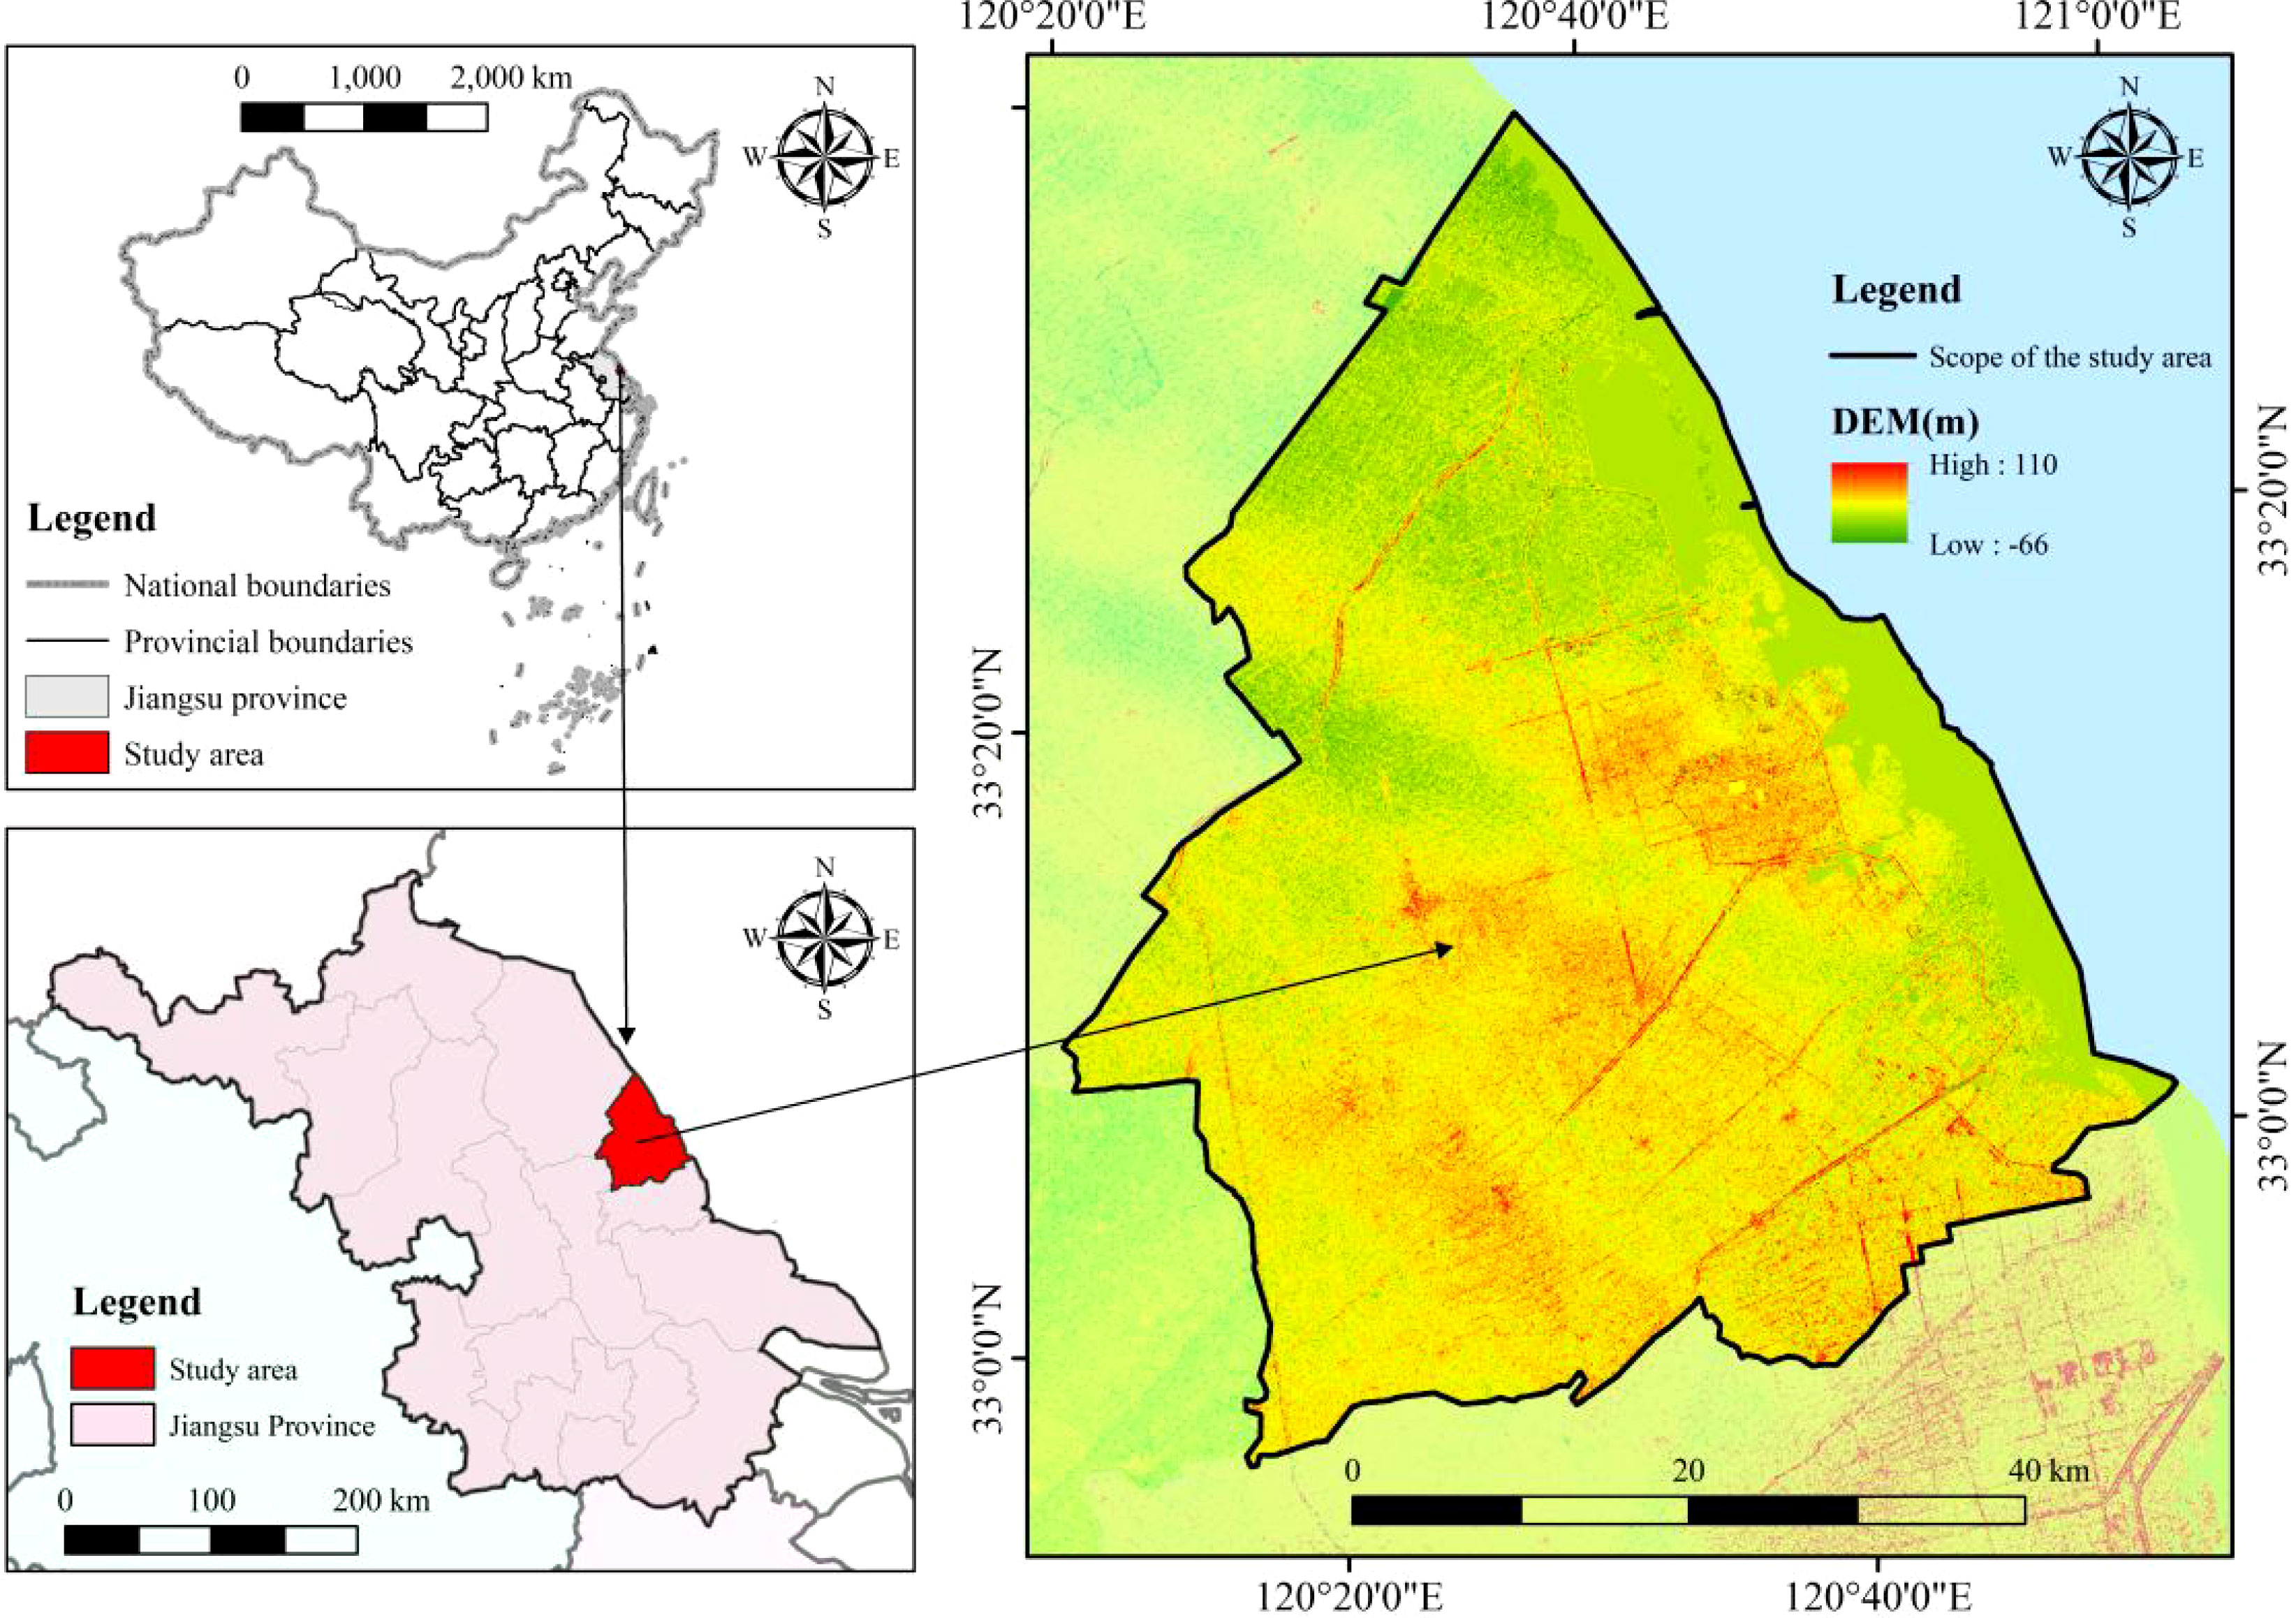
Dafeng is located at 32°56’~33°36’ N, 120°13’~120°56’ E in the east of Jiangsu Province and borders the Yellow Sea to the east (Figure 1). It is a coastal plain formed by long-term siltation from the eastern inflow of the Yangtze and Yellow rivers to the sea. It has a total area of about 3008 km² and a coastline of 112 km. As a node for China’s “coastal development” strategy and the integration of the Yangtze River Delta, it has seen increasingly intensified development and construction (Zhao et al., 2020). However, Dafeng also has rich mudflat wetland resources and contains the world’s largest Milu deer nature reserve. The outlook for coordinating Dafeng’s economic development and construction with wetland protection and construction is grim. Therefore, taking Dafeng as the study area is of great significance for studying the optimization method of ecological patterns in a coastal zone.
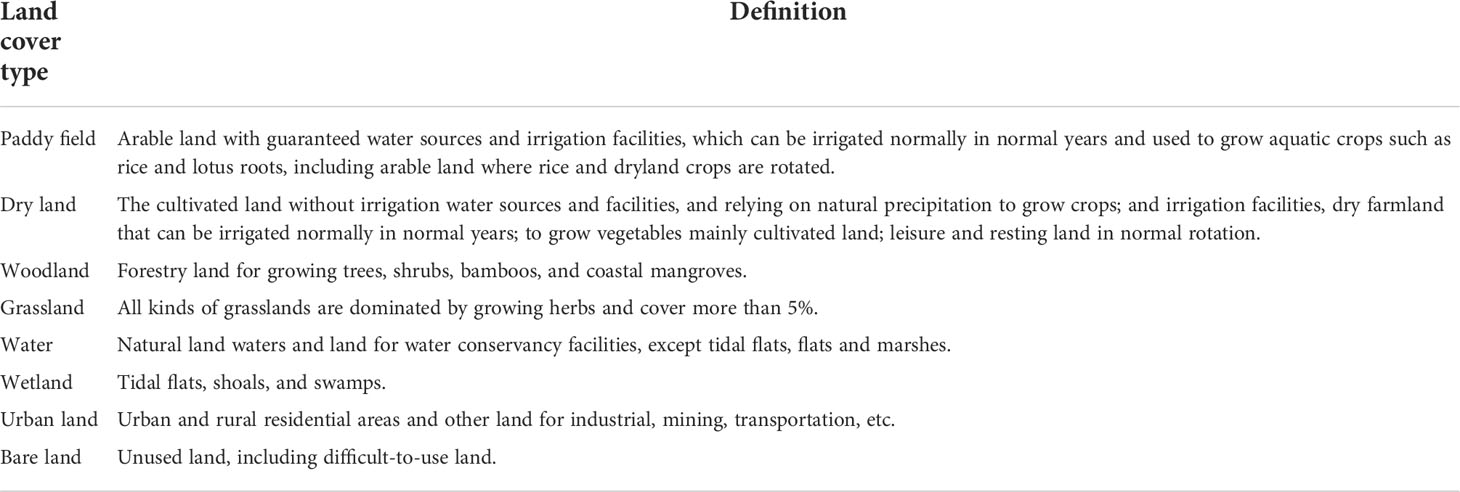
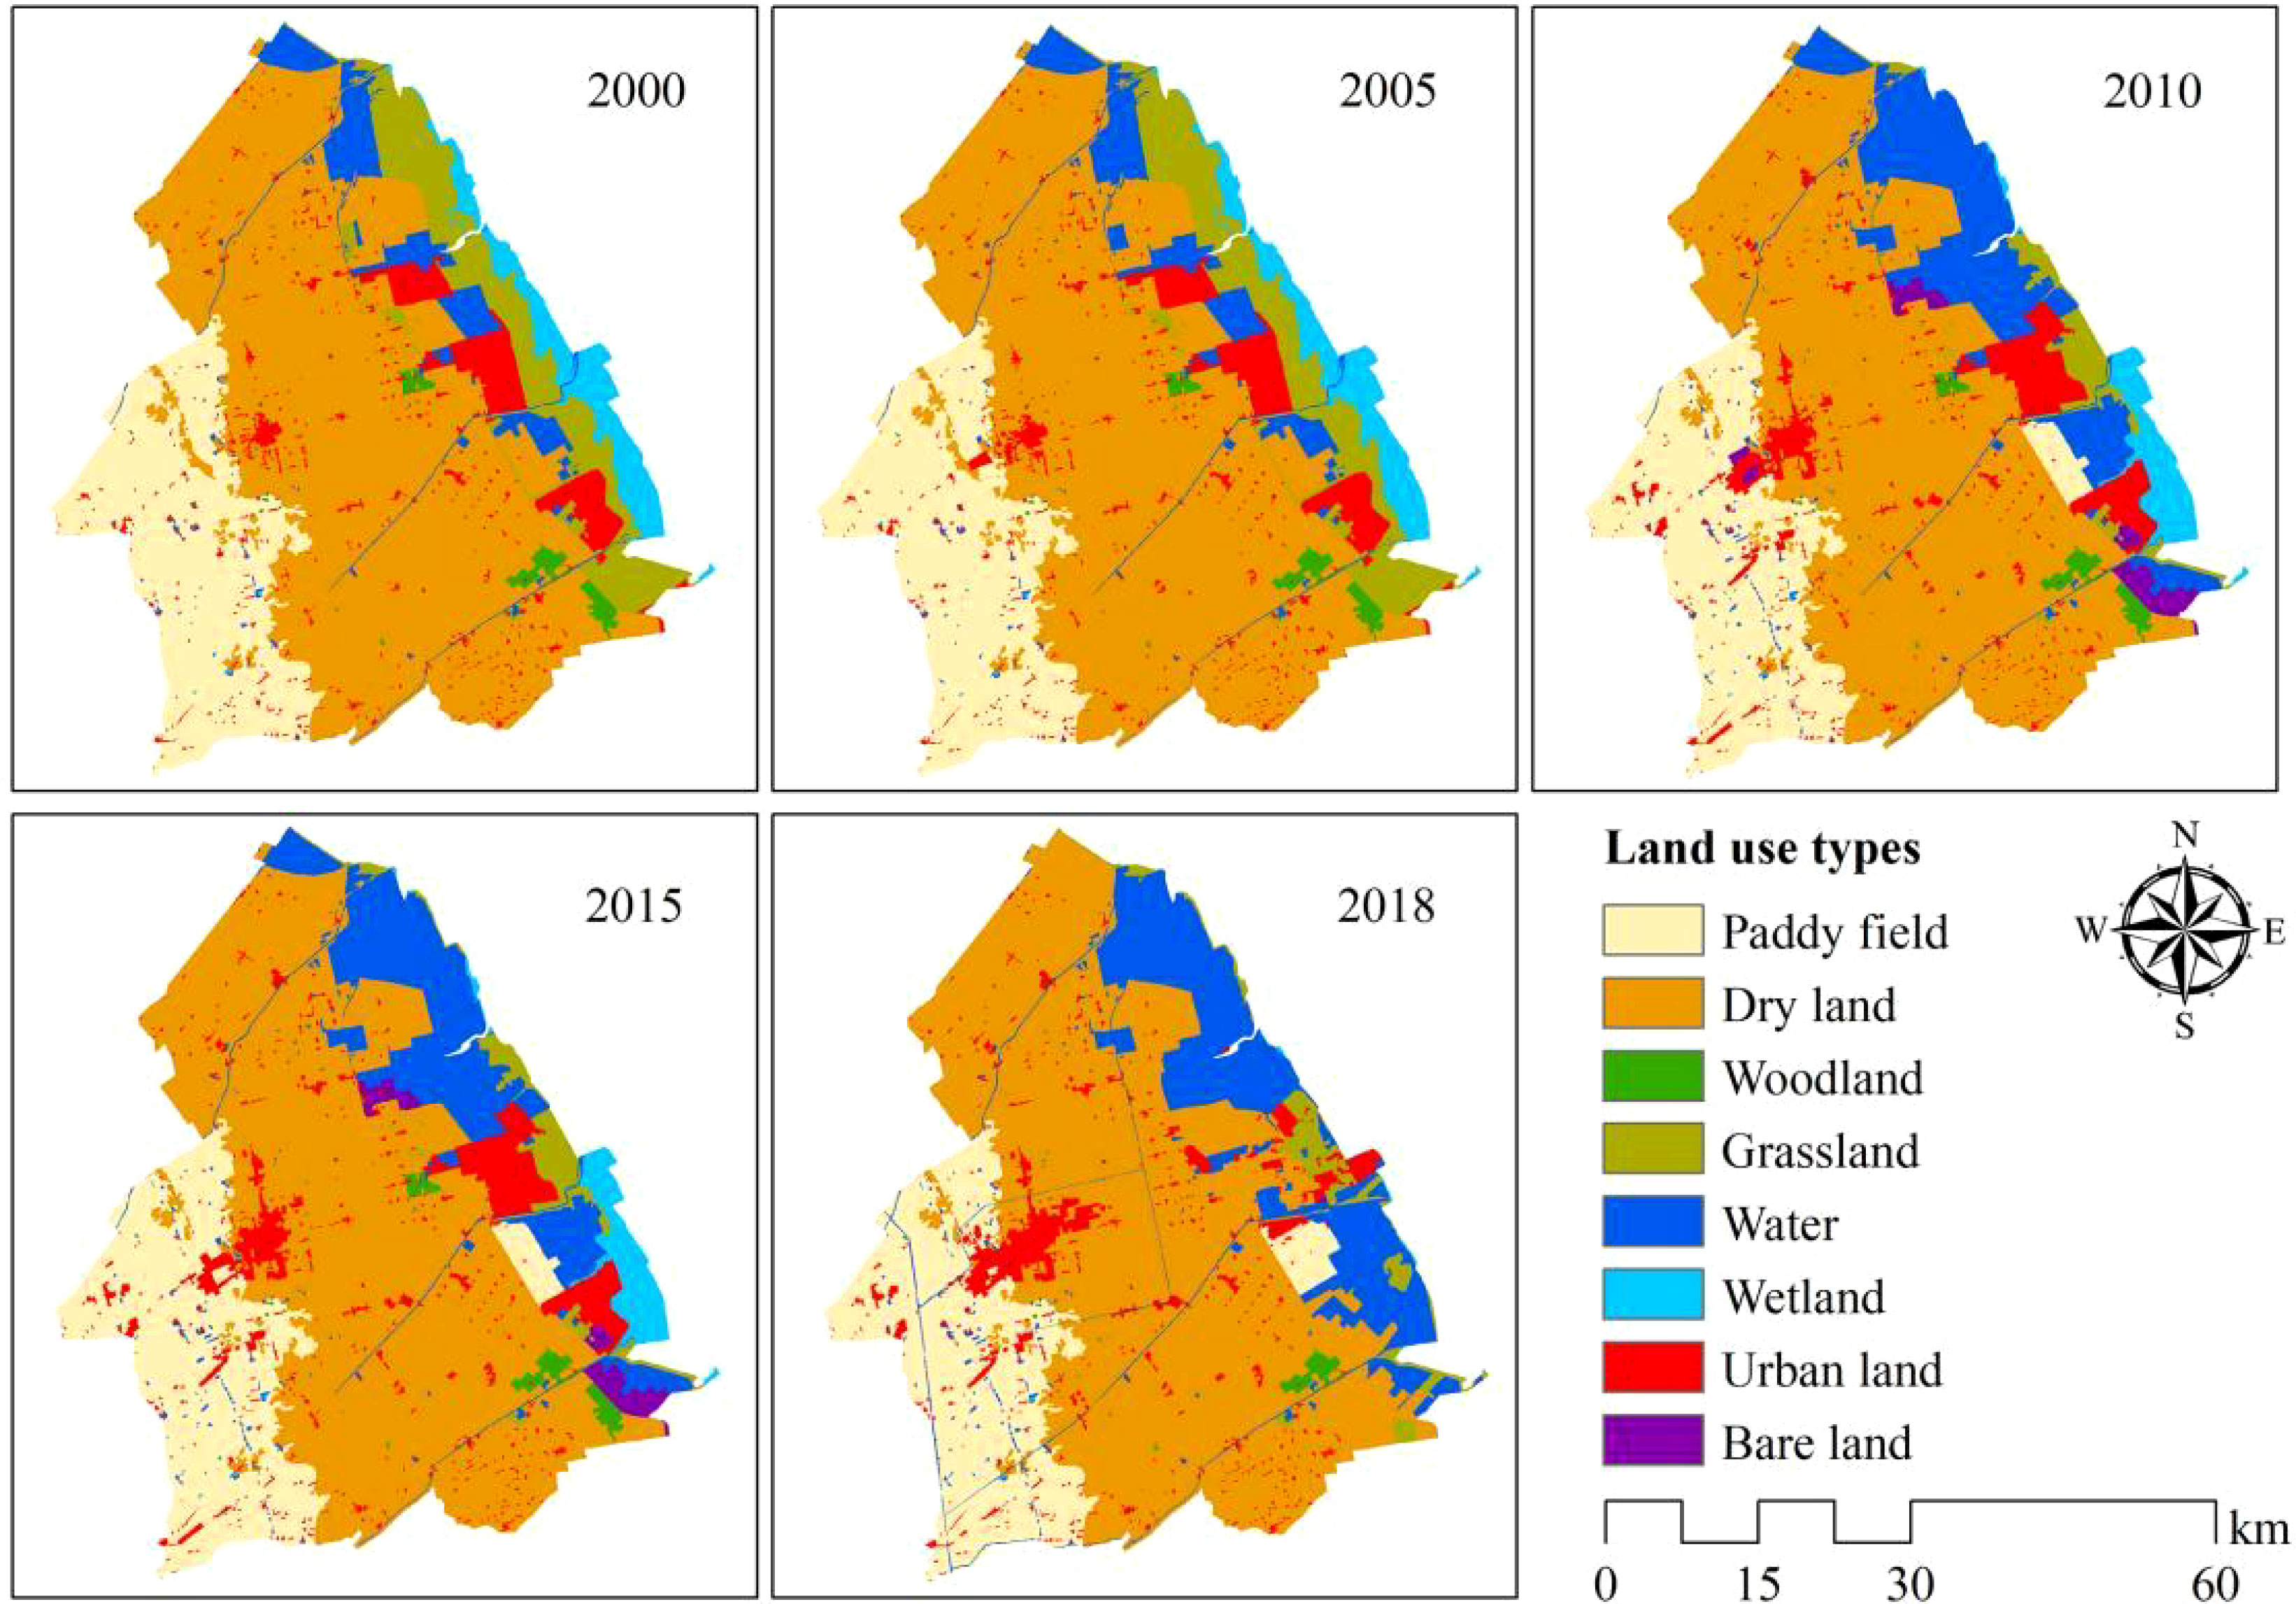
Six types of data were selected from 2000 to 2018: land cover; administrative division, GDEM; vegetation type; national average profit of agricultural products; grain crop cultivation area; and yield (Table 1). In view of the comparability of the research results to others, this study reclassified the land-cover types (Table 2, Figure 2) into paddy field, dry land, woodland, grassland, water, wetland, urban land, and bare land. The wetland type is composed of tidal flats, shoals, and swamps.
2.2 Methodology
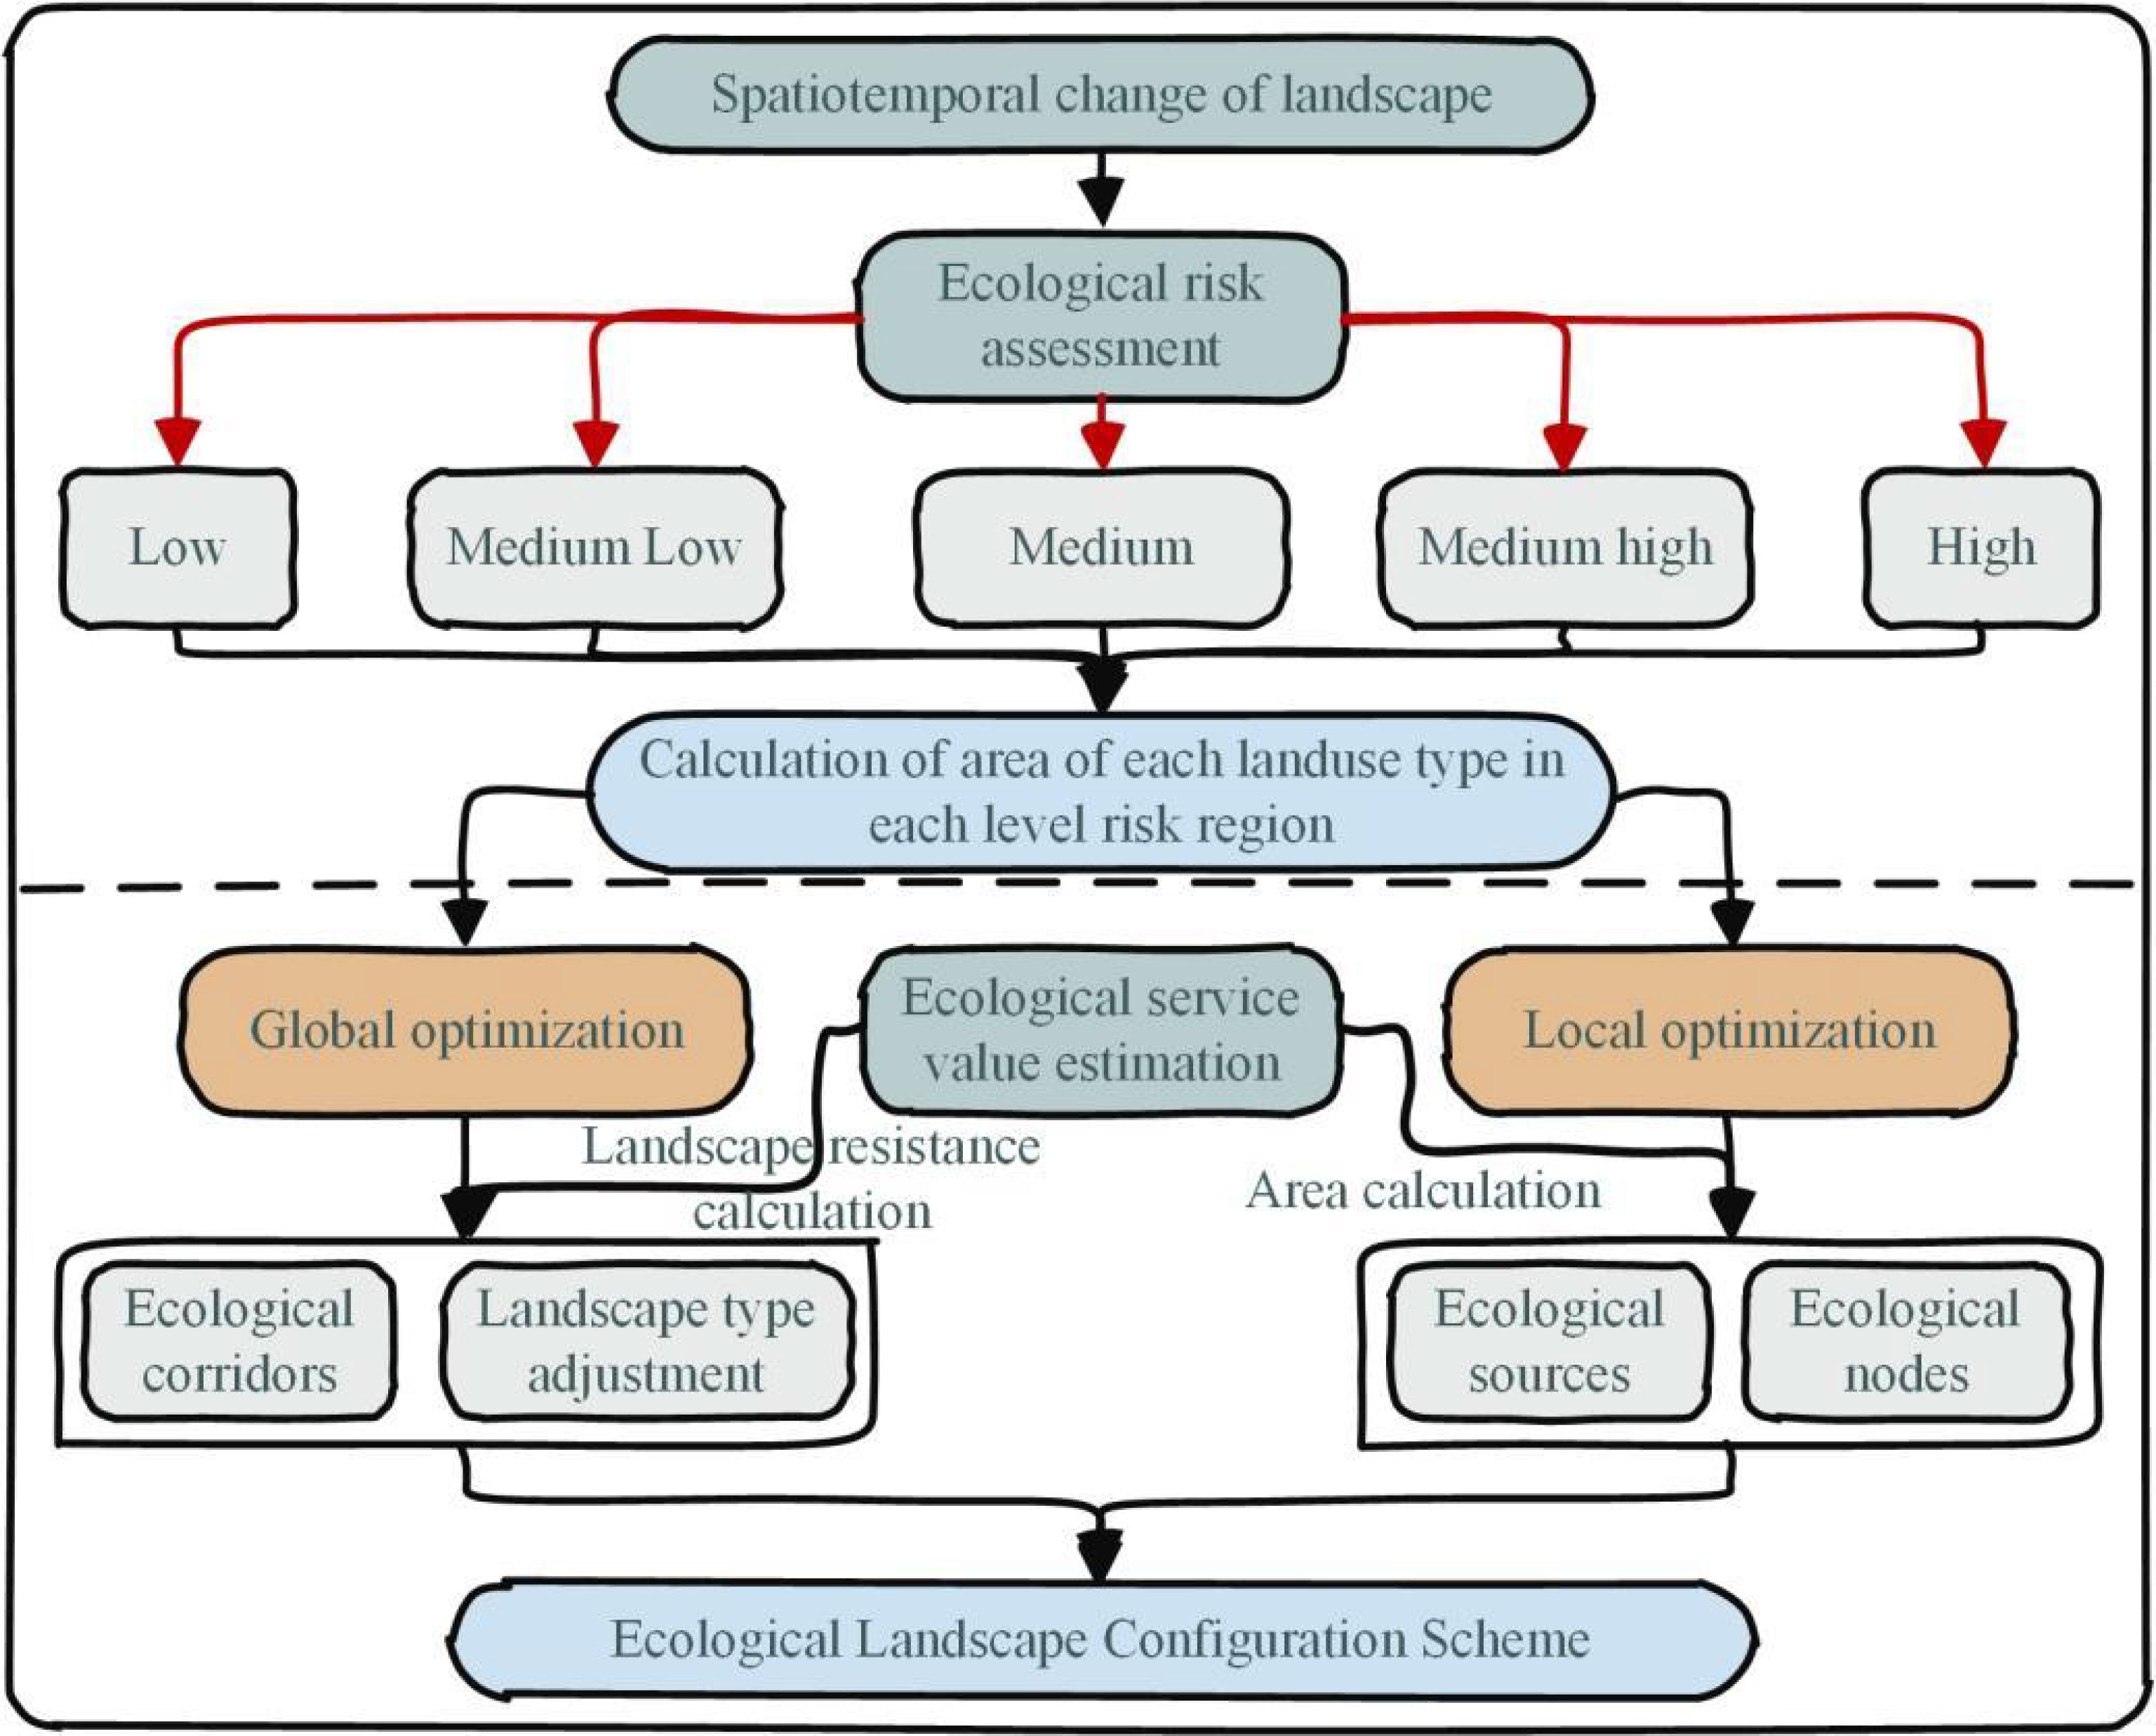
This study combined global and local perspectives and used a mixed-methods design to build a more refined optimization scheme for a coastal city (Figure 3). The whole landscape pattern optimization scheme is based on the ecological risk evaluation results, considering the spatial and temporal evolution characteristics of the landscape pattern in the coastal zone. The distribution area of various landscape types at different levels is analyzed according to the spatial distribution range of ecological risk assessment results at different levels. Then, the results of the spatial distribution characteristics of ecological service value estimations are combined. Finally, the landscape resistance value and ecological source value area threshold are calculated to optimize global and local patterns, respectively. An ecological corridor, landscape-type adjustment, ecological source identification, and ecological node construction form the coastal zone’s final ecological landscape configuration scheme.
2.2.1 Estimation of ecological service value of coastal zone system based on modified equivalent factor
This study refers to the ecosystem service function value evaluation model (Robert et al., 1998) by the ecological service value equivalent factor method (Xie et al., 2015; Sun et al., 2019).
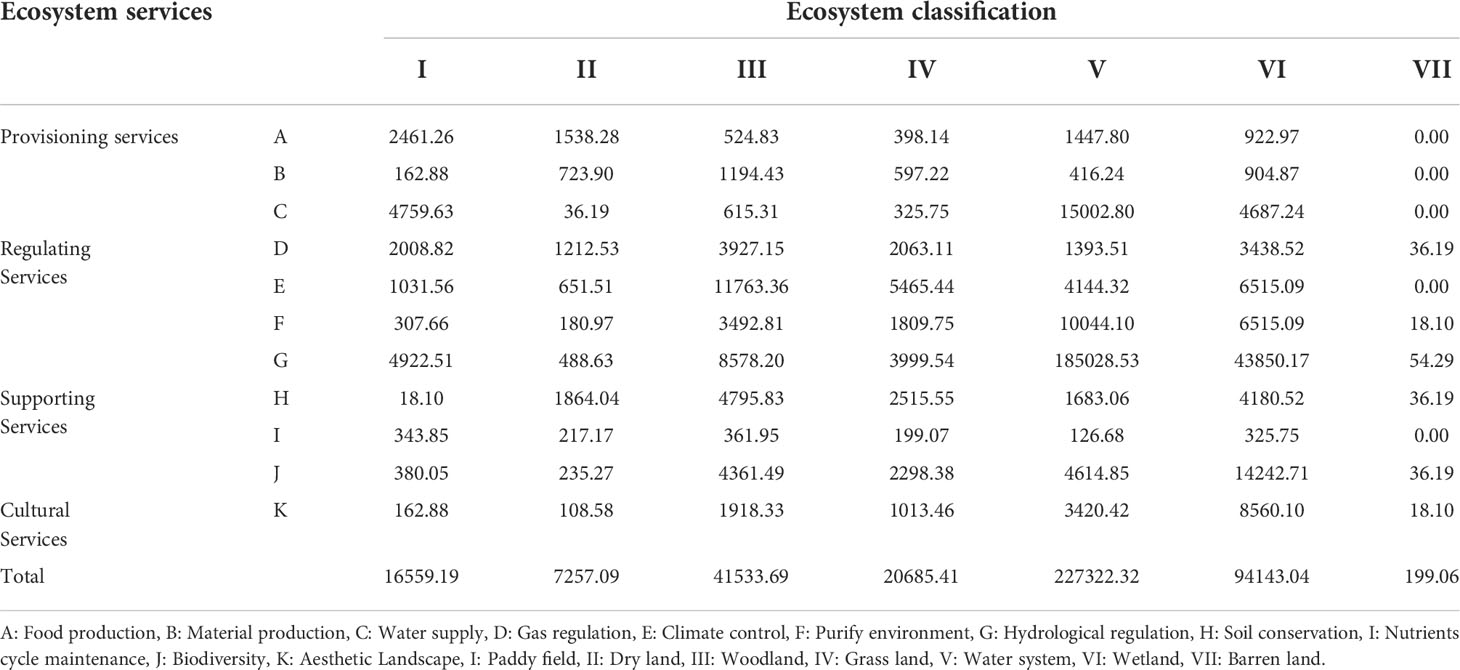
As the basis, modify the service value equivalent of woodland and grassland ecosystem services (as woodland is the only broad-leaved forest, take the basic broad-leaved forest equivalent; as grassland is the only meadow, take the basic meadow equivalent). The ecosystem service value of the standard unit area value equivalent factor, equal to 1/7 of the economic value of food production per unit area of farmland, is used to characterize and quantify the potential contribution capacity of different types of ecosystems to the ecological service function (Grimm et al., 2008; Xu et al., 2018; Guo et al., 2022). The corrected equivalent factor defines 1 km2. The national average yield of farmland, the annual economic value of natural grain production, is 0.01. The ecological service value estimation method of a coastal zone system, based on a modified equivalent factor, is constructed as follows (Costanza et al., 1998; Xie et al., 2015; Xu et al., 2018):
In the formula, ESVj is the total service value of the ecosystem j (yuan); and Aj is the area of the ecosystem (km2); VCjk is the economic value per unit area of the k-th species of ecological function of the ecosystem (yuan/km2); n is the number of ecological service functions. The calculation method of VCjk is as follows:
Efk is the modified equivalent factor of the ecosystem k (Table A2). The i is the crop type; piis the national average price of the i-th crop in a certain year (yuan/kg); qi is the yield per unit area of the i-th crop (1000kg/km2); mi is the planting area of the i-th crop (km2); M is the planting area (km2) of the three main crops.
2.2.2 Landscape ecological risk assessment
The analysis of landscape pattern indexes can reflect the degree of human intervention on the natural landscape of the coastal zone (Chen et al., 2022) and is widely used in regional ecological risk assessment (Li et al., 2021; Pomara and Lee, 2021). This paper constructs an ecological risk-evaluation method based on the landscape fragmentation index, landscape separation index, landscape dominance index, and landscape vulnerability index to characterize the degree of the ecological service value loss of the coastal zone ecosystem when subjected to both natural and human-made interference (Zhang et al., 2020). The paper will divide the study into 3 km × km evaluation units, calculate the ecological risk index (ERI) of grid center elements, through the ordinary Kerry gold interpolation method of ecological risk index, and adopt the natural break-point grading method. ERI is divided into five levels (low, medium-low, medium, medium-high, and high); the higher the ERI value, the higher the ecological risk. The specific calculation formula (Zhang et al., 2020) is as follows:
In the formula, k is the grid unit; i is the landscape type; m is the total number of landscape types. Aki stands for the area of landscape i in the grid unit; Ak for the total area of the grid k; a, b, and c are the weights. According to the existing research experience combined with expert opinions (Zhang et al., 2014; Zhang et al., 2020), the weights are assigned 0.5, 0.3, and 0.2, respectively (where bare land is assigned 0.2, 0.3, and 0.5); Ci,as the landscape fragmentation degree index, can reflect the process of landscape-type transition from continuous whole patches to complex discontinuous patches under natural or human interference. The larger the value, the lower the stability of the corresponding landscape ecosystem. Ni,as the landscape separation degree index, can reveal the complexity and integrity degree of the spatial distribution of a certain landscape type. The larger the values, the higher the separation degree. Di, which is the landscape dominance index, refers to the importance of a certain type of landscape in the study area and its role in forming landscape patterns and maintaining pattern stability. The smaller the value, the greater the landscape diversity. Fi, as the landscape vulnerability index, can reflect the resistance ability of different landscape types to external interference. The greater the value, the smaller the ability to resist external interference. For Fi, the value is as follows. Landscape-type vulnerability was classified into six levels by the expert scoring method and normalized (Zhang et al., 2020). (That is, from high to low: bare land-6, water area and wetland-5, cultivated land-4, grassland-3, woodland-2, urban land-1). Other landscape indexes are calculated as follows:
Among them, Ai is the total area of the i-th landscape type; ni is the total number of patches in the i-th-type landscape; A is the total landscape area. Based on the research experience of others and the actual research area, weights u and v are set at 0.6 and 0.4, respectively (Zhang et al., 2014).
2.2.3 Optimization of the urban ecosystem landscape pattern in the coastal zone
Promoting the sustainable development of the coastal zone requires its ecological processes to be healthy, stable, and safe. Different landscape types can be classified into “source” and “sink” based on the role of species, material, and energy flows in coastal zone ecosystems. Large woodland, grassland, wetland, and water areas can promote the development of landscape processes, namely “source”; others, such as biological production land and urban land, can “sink”; and various rivers and green corridors can transmit matter and energy. The source extraction requires integrating the landscape pattern continuity and service value per unit area, referring to the current ecological source extraction standard (Chen et al., 2017b).
The cumulative cost distance model can reflect the spatial trend of the source image element motion and can analyze the spatial operation of the landscape flow to explore ways and methods conducive to the regulation of the ecological process (Han et al., 2021). Based on Arc Map Desktop 10.1, Cost Distance and Cost Path modules, and fully considering factors such as landscape source, distance, and surface friction resistance, it is possible to construct a cumulative cost resistance model to express the spatial span characteristics of landscape type:
In the formula, MCR is the minimum cumulative resistance value; f is the positive function between MCR, and the variable (Dij× Ri); Dijis the spatial distance that spreads from the source j to a point in space across the ecological surface i; Riis the resistance to the direction of the source dispersal by the ecological surface i.
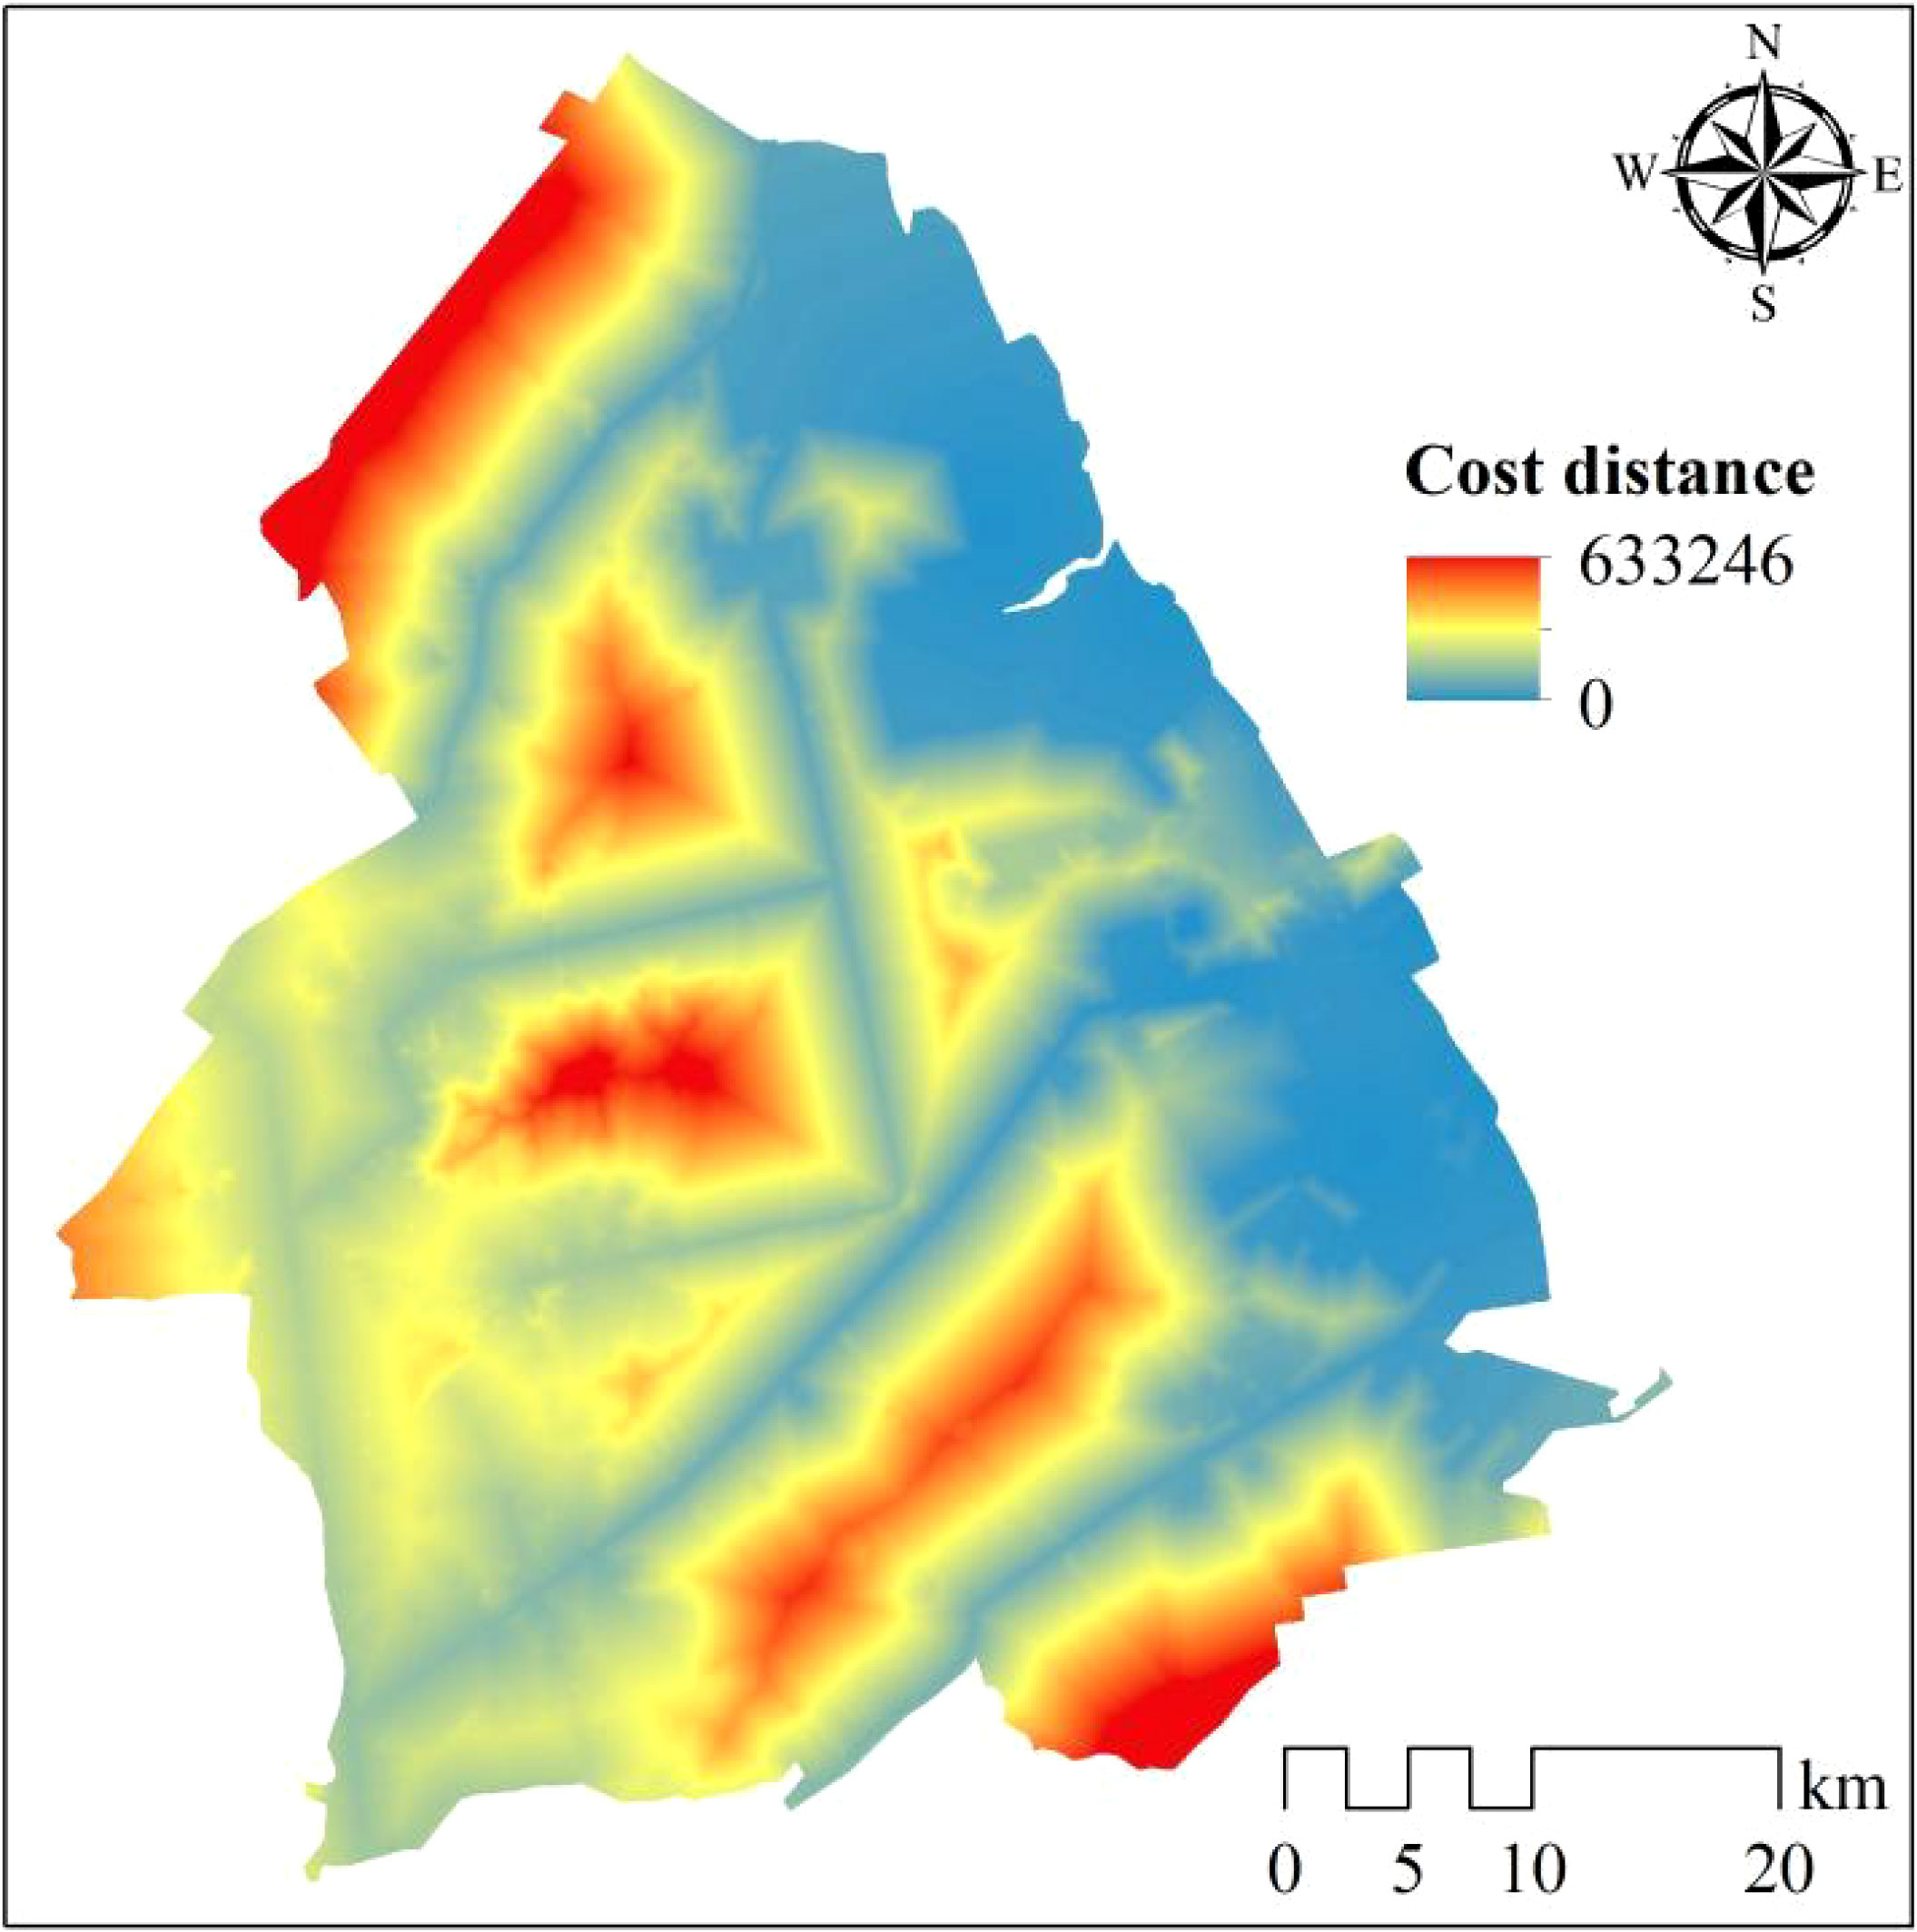
The medium-high-risk and high-risk area source constitute the “target”; the low-risk, medium-low-risk and medium-risk area source constitute the “ecological source.” The landscape resistance depends on the landscape ecological service value — the higher the service value, the easier the landscape grid unit between material and energy transmission. The smoother the ecological flow, the smaller the landscape resistance, and vice versa. Therefore, in this study, the reciprocal of the unit ecological service value was taken as the resistance value cost to obtain the cumulative cost distance surface (Figure 9) of the landscape ecological function.
3 Results
3.1 Changes in the structure and function of a coastal ecosystem (2000–2018)
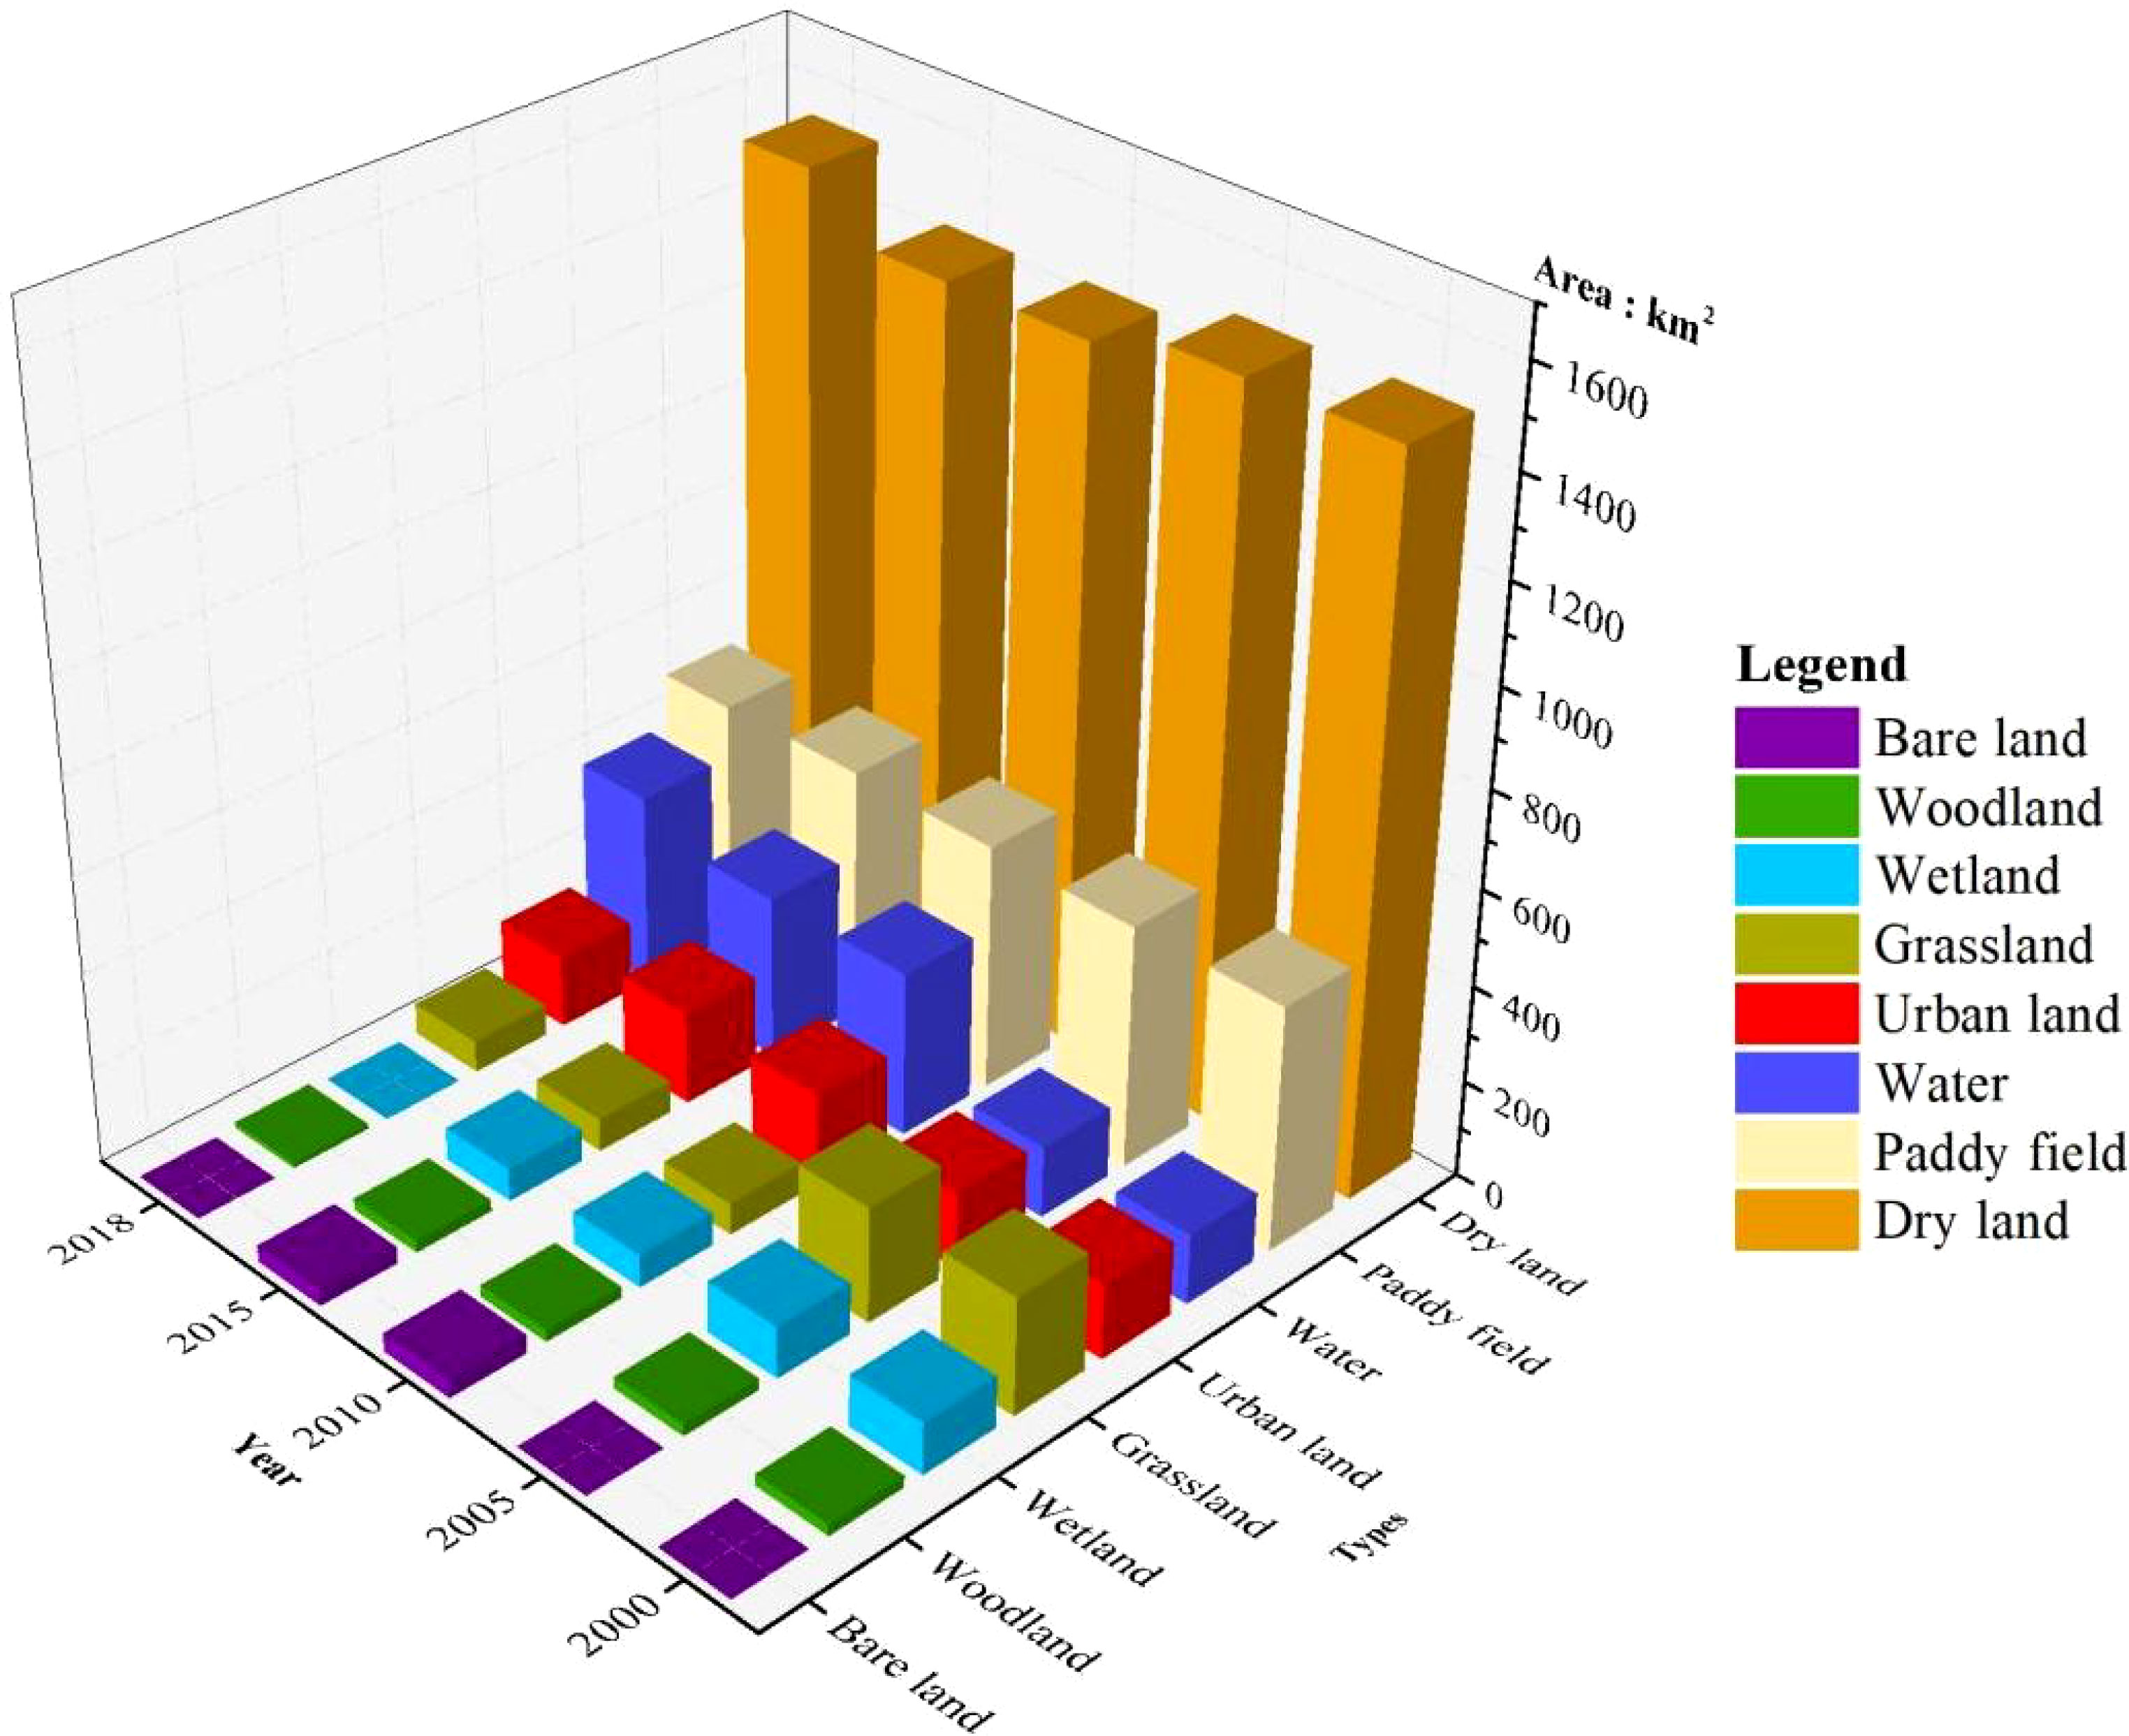
The overall structure of coastal ecosystem in Dafeng is composed of dry land, paddy field, water, urban land, grassland, wetland, woodland and bare land. In recent years (2000–2018), cultivated land (containing dry land and paddy field) has always been the dominant land type in Dafeng District, accounting for about 70% of the total area. Dry land is the largest component, accounting for about 50% of the total area, while paddy fields only account for about 20%. Landscape elements with high ecological service value have always accounted for a very small proportion (Figure 4). Overall, urban land and water have increased year by year. The water area increased from 145.49 km2 to 402.84 km2 and the area proportion increased by 9.63%. The area of urban land increased from 155.46 km2 to 19265.39 km2 from 2000 to 2015, and the proportion rose from 5.82% to 7.21%. The decrease in urban land from 2015 to 2018 is due to implementing the ecological red line protection plan and the promotion of the wetland restoration project in the ecological function area (Zhang et al., 2021a). The increases in these two landscape elements have been at the expense of decrease in wetland, grassland and woodland. They continued to decrease from 2000 to 2018, reducing 106.56 km2, 179.57 km2, and 13.62 km2 The area proportion decreased by 3.99%, 6.72%, and 0.51%.
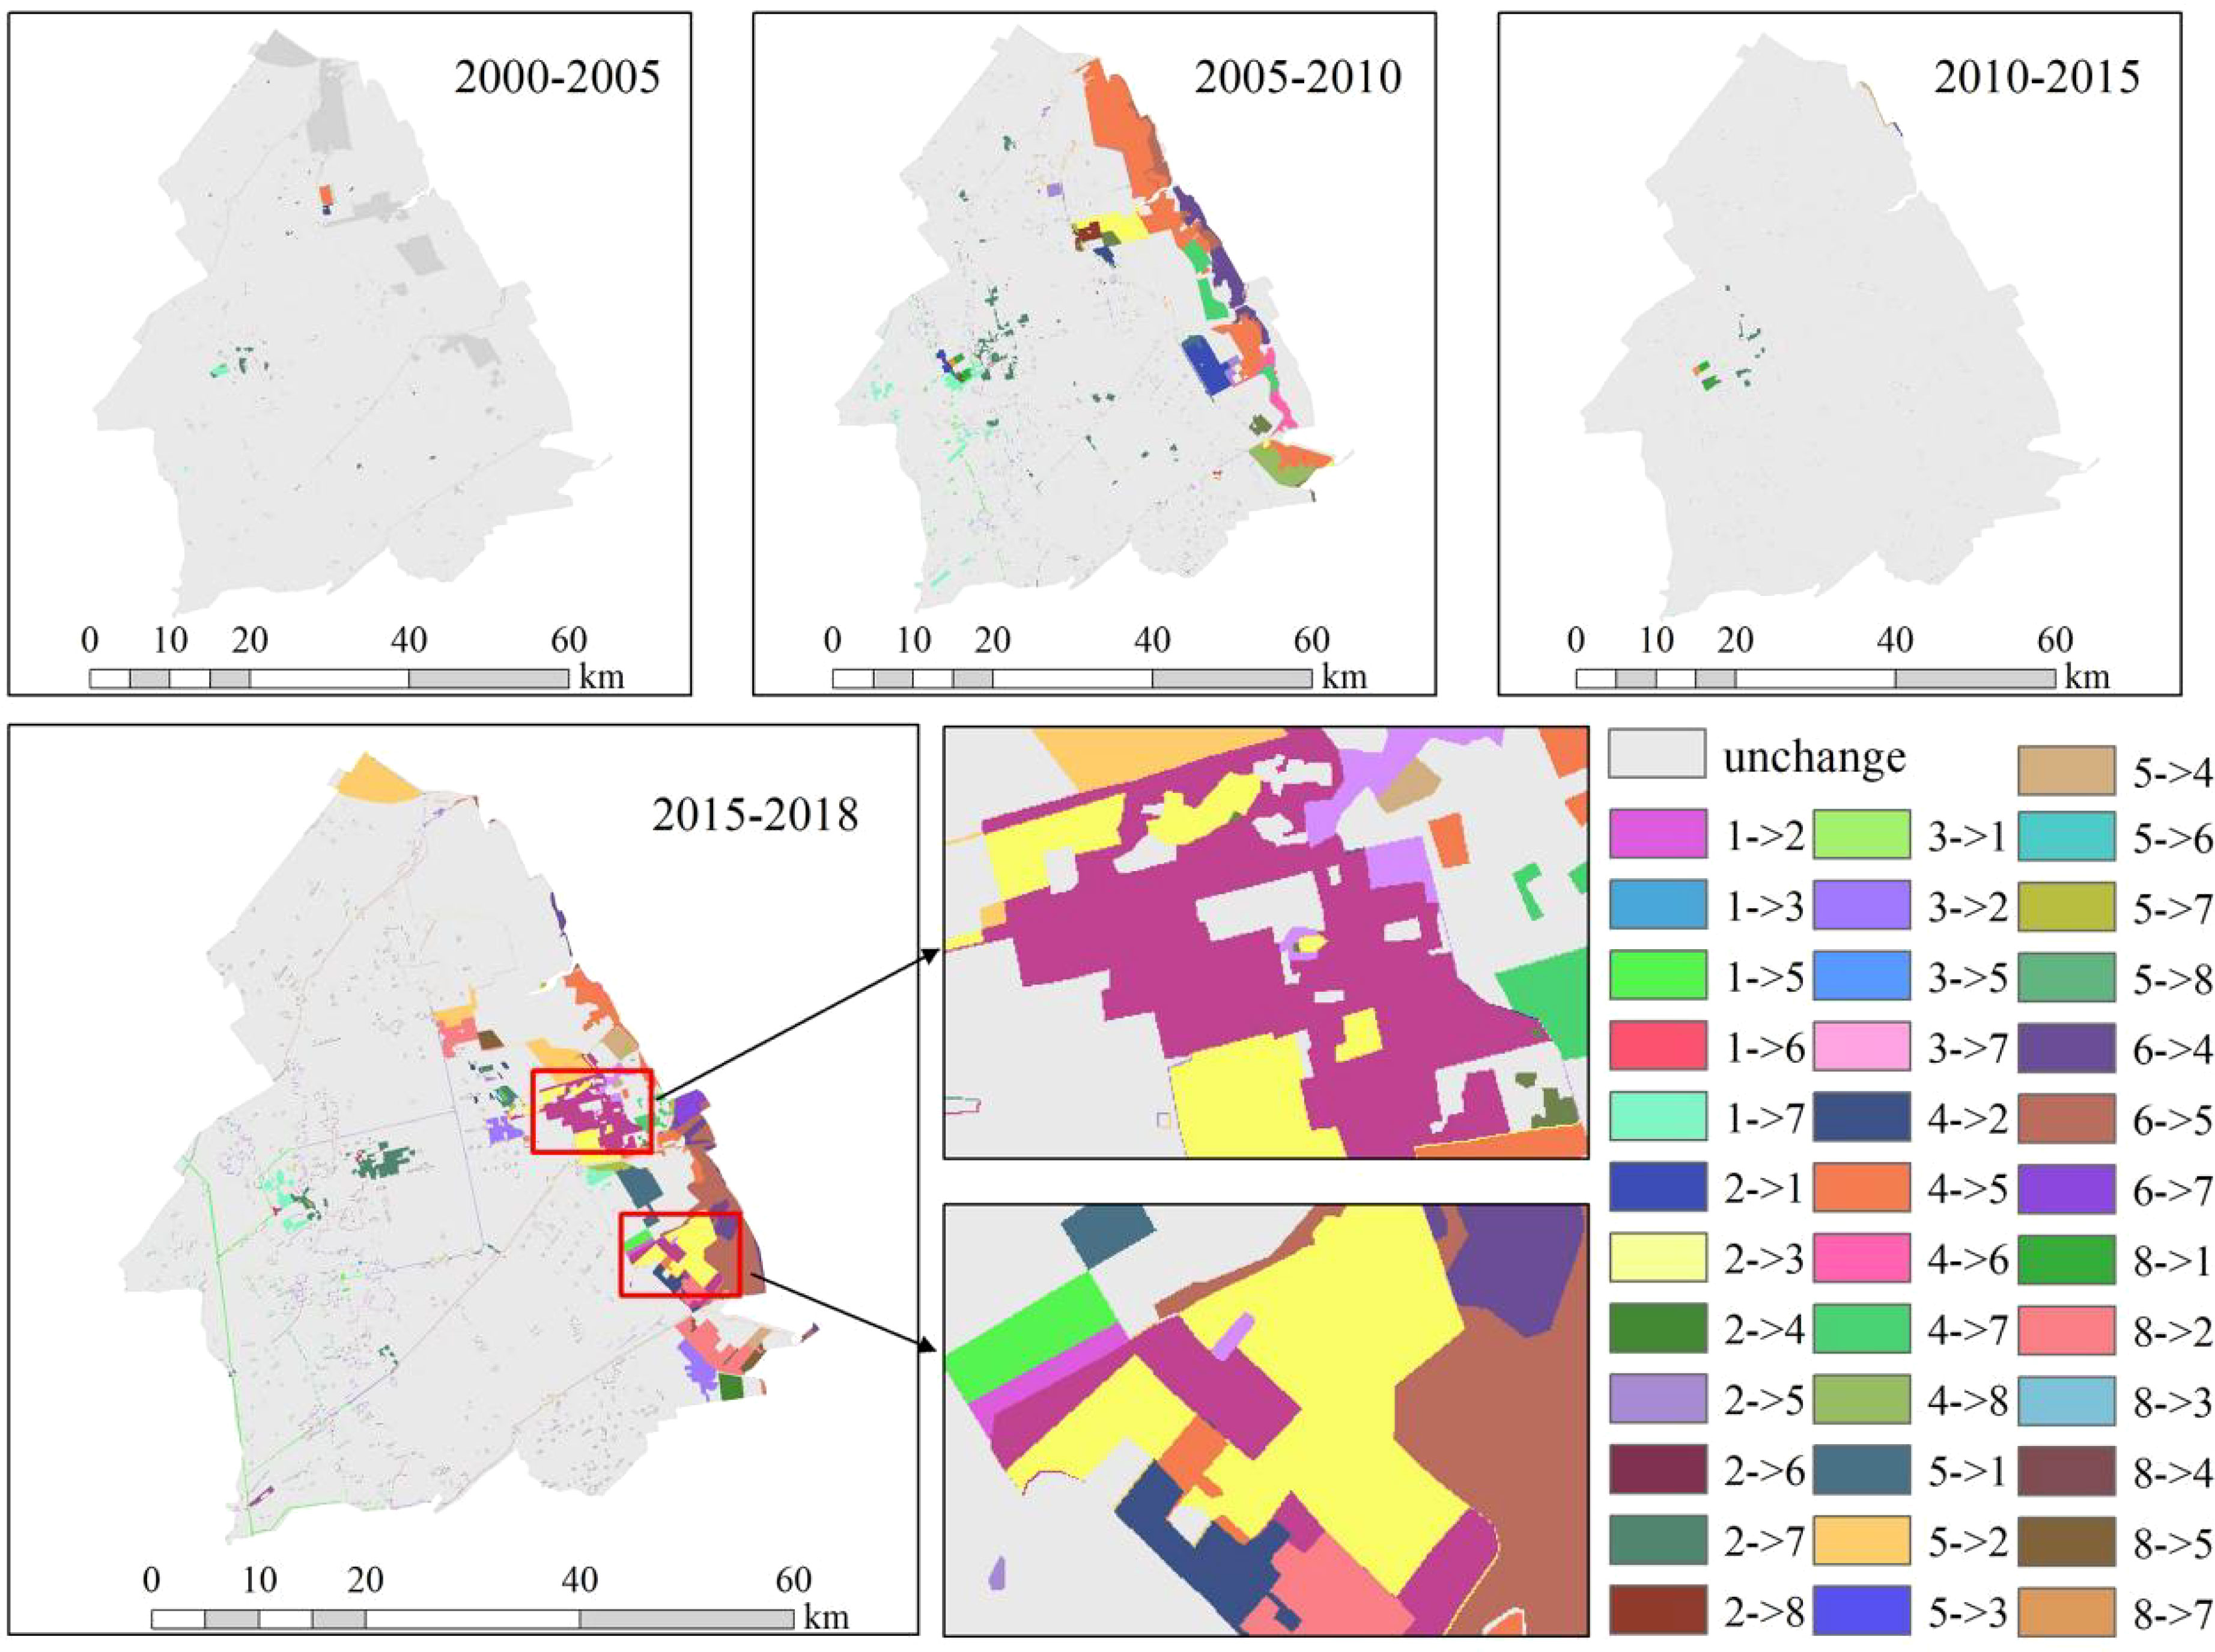
Spatial distribution from 2000 to 2018, including the factor transfer characteristics of different periods in space, shows typical sea-gradient characteristics (Figure 5) — namely, the conversion of frequent elements is mainly concentrated in the coastline strip space; which is close to the coastline internal space. This means that human activities here disturb the ecological environment more intensely. In the internal space, year by year, other characteristics of cultivated land transfer into urban land have been given priority with paddy field and dry land distribution. However, the spatial characteristics of element transfer in the strip space near the coastline were mainly concentrated in the southern region, and the transfer makes the spatial distribution of landscape elements become more broken. The main types of transfer were: ① woodland into water from 2000 to 2005, ②grassland into water, wetland into grassland, and bare land into paddy fields between 2005 and 2010, ③ bare land into woodland, and wetland into grassland from 2010 to 2015, ④dry land into woodland, bare land into water area, bare land into grassland, and grassland into urban land from 2015 to 2018. Conversely, the transfer of features makes the spatial distribution of features in the northern area more continuous. The main types of transfer were grassland to water (2005-2010).
In summary, in addition to finding that sea reclamation is increasing, we find the embodiment of wetland ecological restoration in development.
3.2 Functional characteristics of coastal ecosystem services
The function of the coastal zone ecosystem (Figure 6) is seen from the analysis of the Dafeng ecological service value. In this study, wheat, rice, and corn from the largest sown area in Dafeng District were taken as the three main crops. The average data (Table A1) of price, yield per unit area, and sown area from 2000 to 2018 were counted. The unit price (Table A2) of the food production service function of each ecosystem was calculated according to formula 2. The ecological service value equivalent factor of urban land was 0, so the value of each ecological function service was 0 (Figure 6). In 2018, the value of ecological service per unit area in Dafeng District was in space. The landscape elements with high value were mainly concentrated in the offshore area but with discontinuous distribution, especially in the south, which was relatively broken, and there were elements with low ecological service value per unit area. The value was distributed away from the coastline to the inland area. The distribution of the total value of the ecosystem service functions of different land use types, and the overall value, ranked from large to small, was successively: water area> dry land> paddy field> wetland> grassland> woodland> bare land> urban land. From 2000 to 2018, the service value of the overall ecosystem in Dafeng showed a decreasing trend year by year, indicating that the ecosystem function was declining year by year.
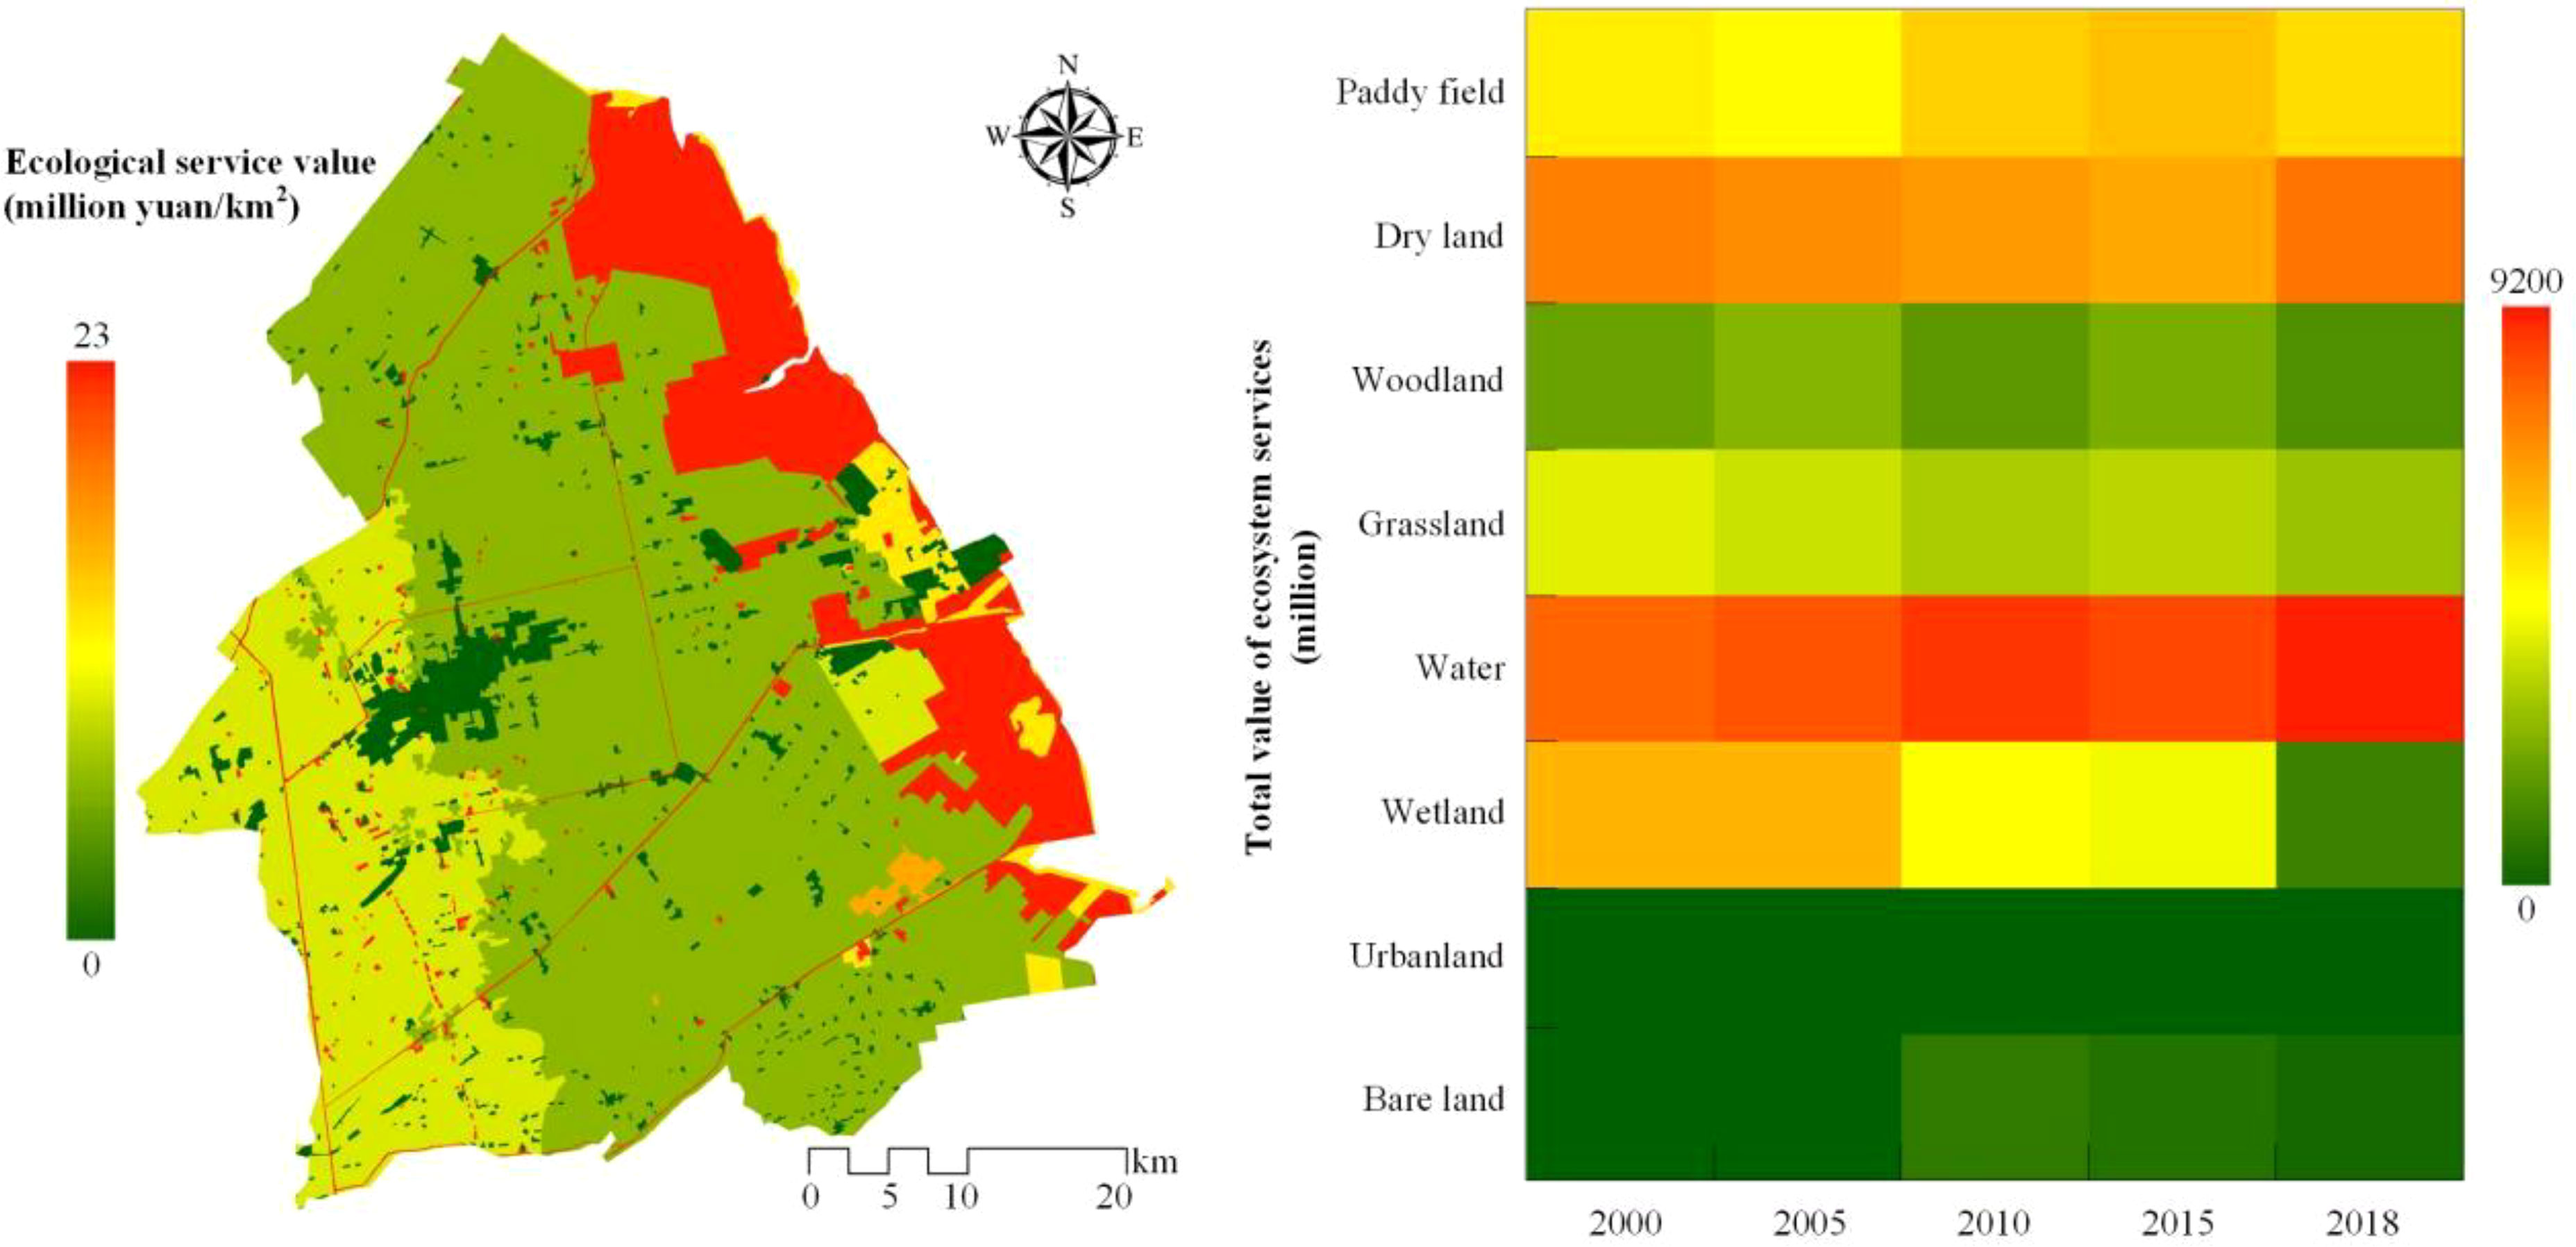
Figure 6 Spatiotemporal distribution of the total value of ecosystem services of each landscape type.
3.3 Ecological risk assessment of Dafeng
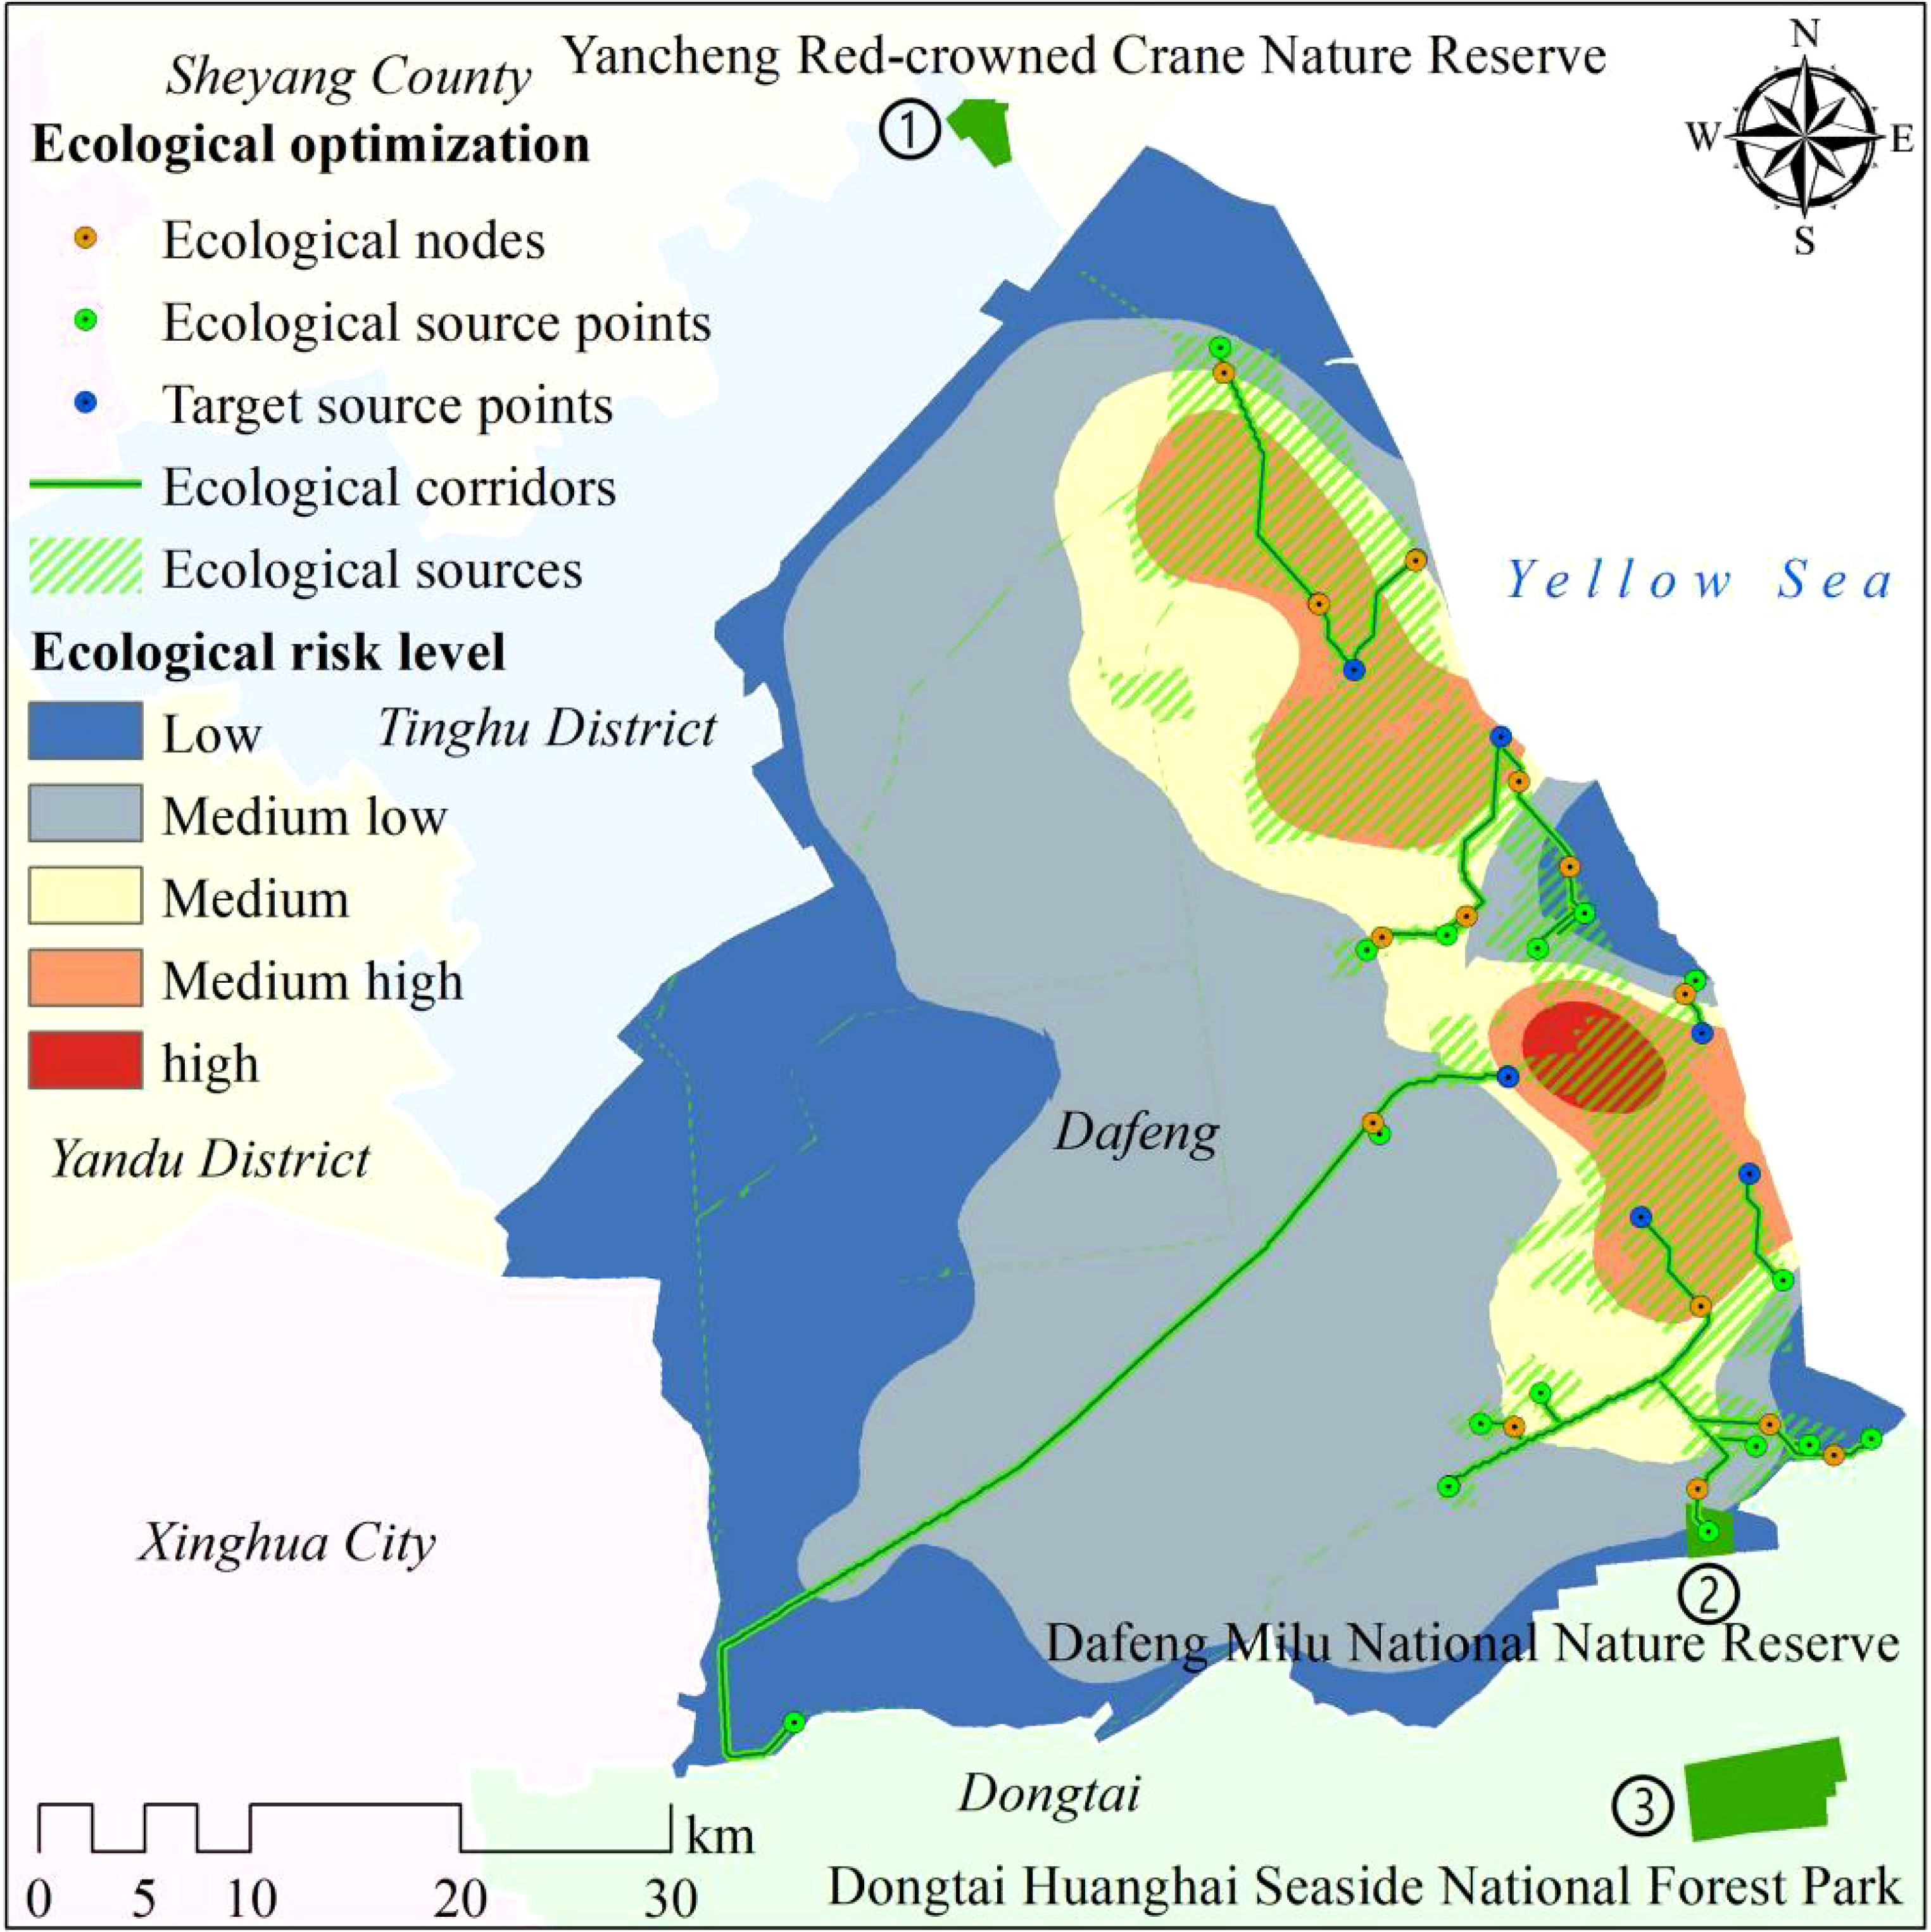
Through the ecological risk assessment of Dafeng, the spatial units that should be optimized and adjusted are further defined. In the ecological risk assessment of Dafeng in 2018, the results (Figures 7, 8) show that the areas with risk levels of medium, medium-high, and high were concentrated in the eastern coastal strip areas; the intensive cultivated land and building areas in the central and western regions basically showed low risk or low-risk areas. The ecological risk presents a transition distribution from the west (low risk) to the east (high risk), which reflects the characteristics of strong aggregation and strong sea-gradient distribution of human activities in the coastal zone cities. The north and south of the coastal strip area are adjacent to Yancheng Red-crowned Crane Nature Reserve (①), Dafeng Milu National Nature Reserve (②), and Dongtai Huanghai Seaside National Forest Park (③) in Figure 8. To a certain extent, they will be affected by the higher-risk ecology in the east of Dafeng, so the group is potentially dangerously escalated. Therefore, the eastern medium-risk, medium-high, and high-risk areas are the key optimization areas.
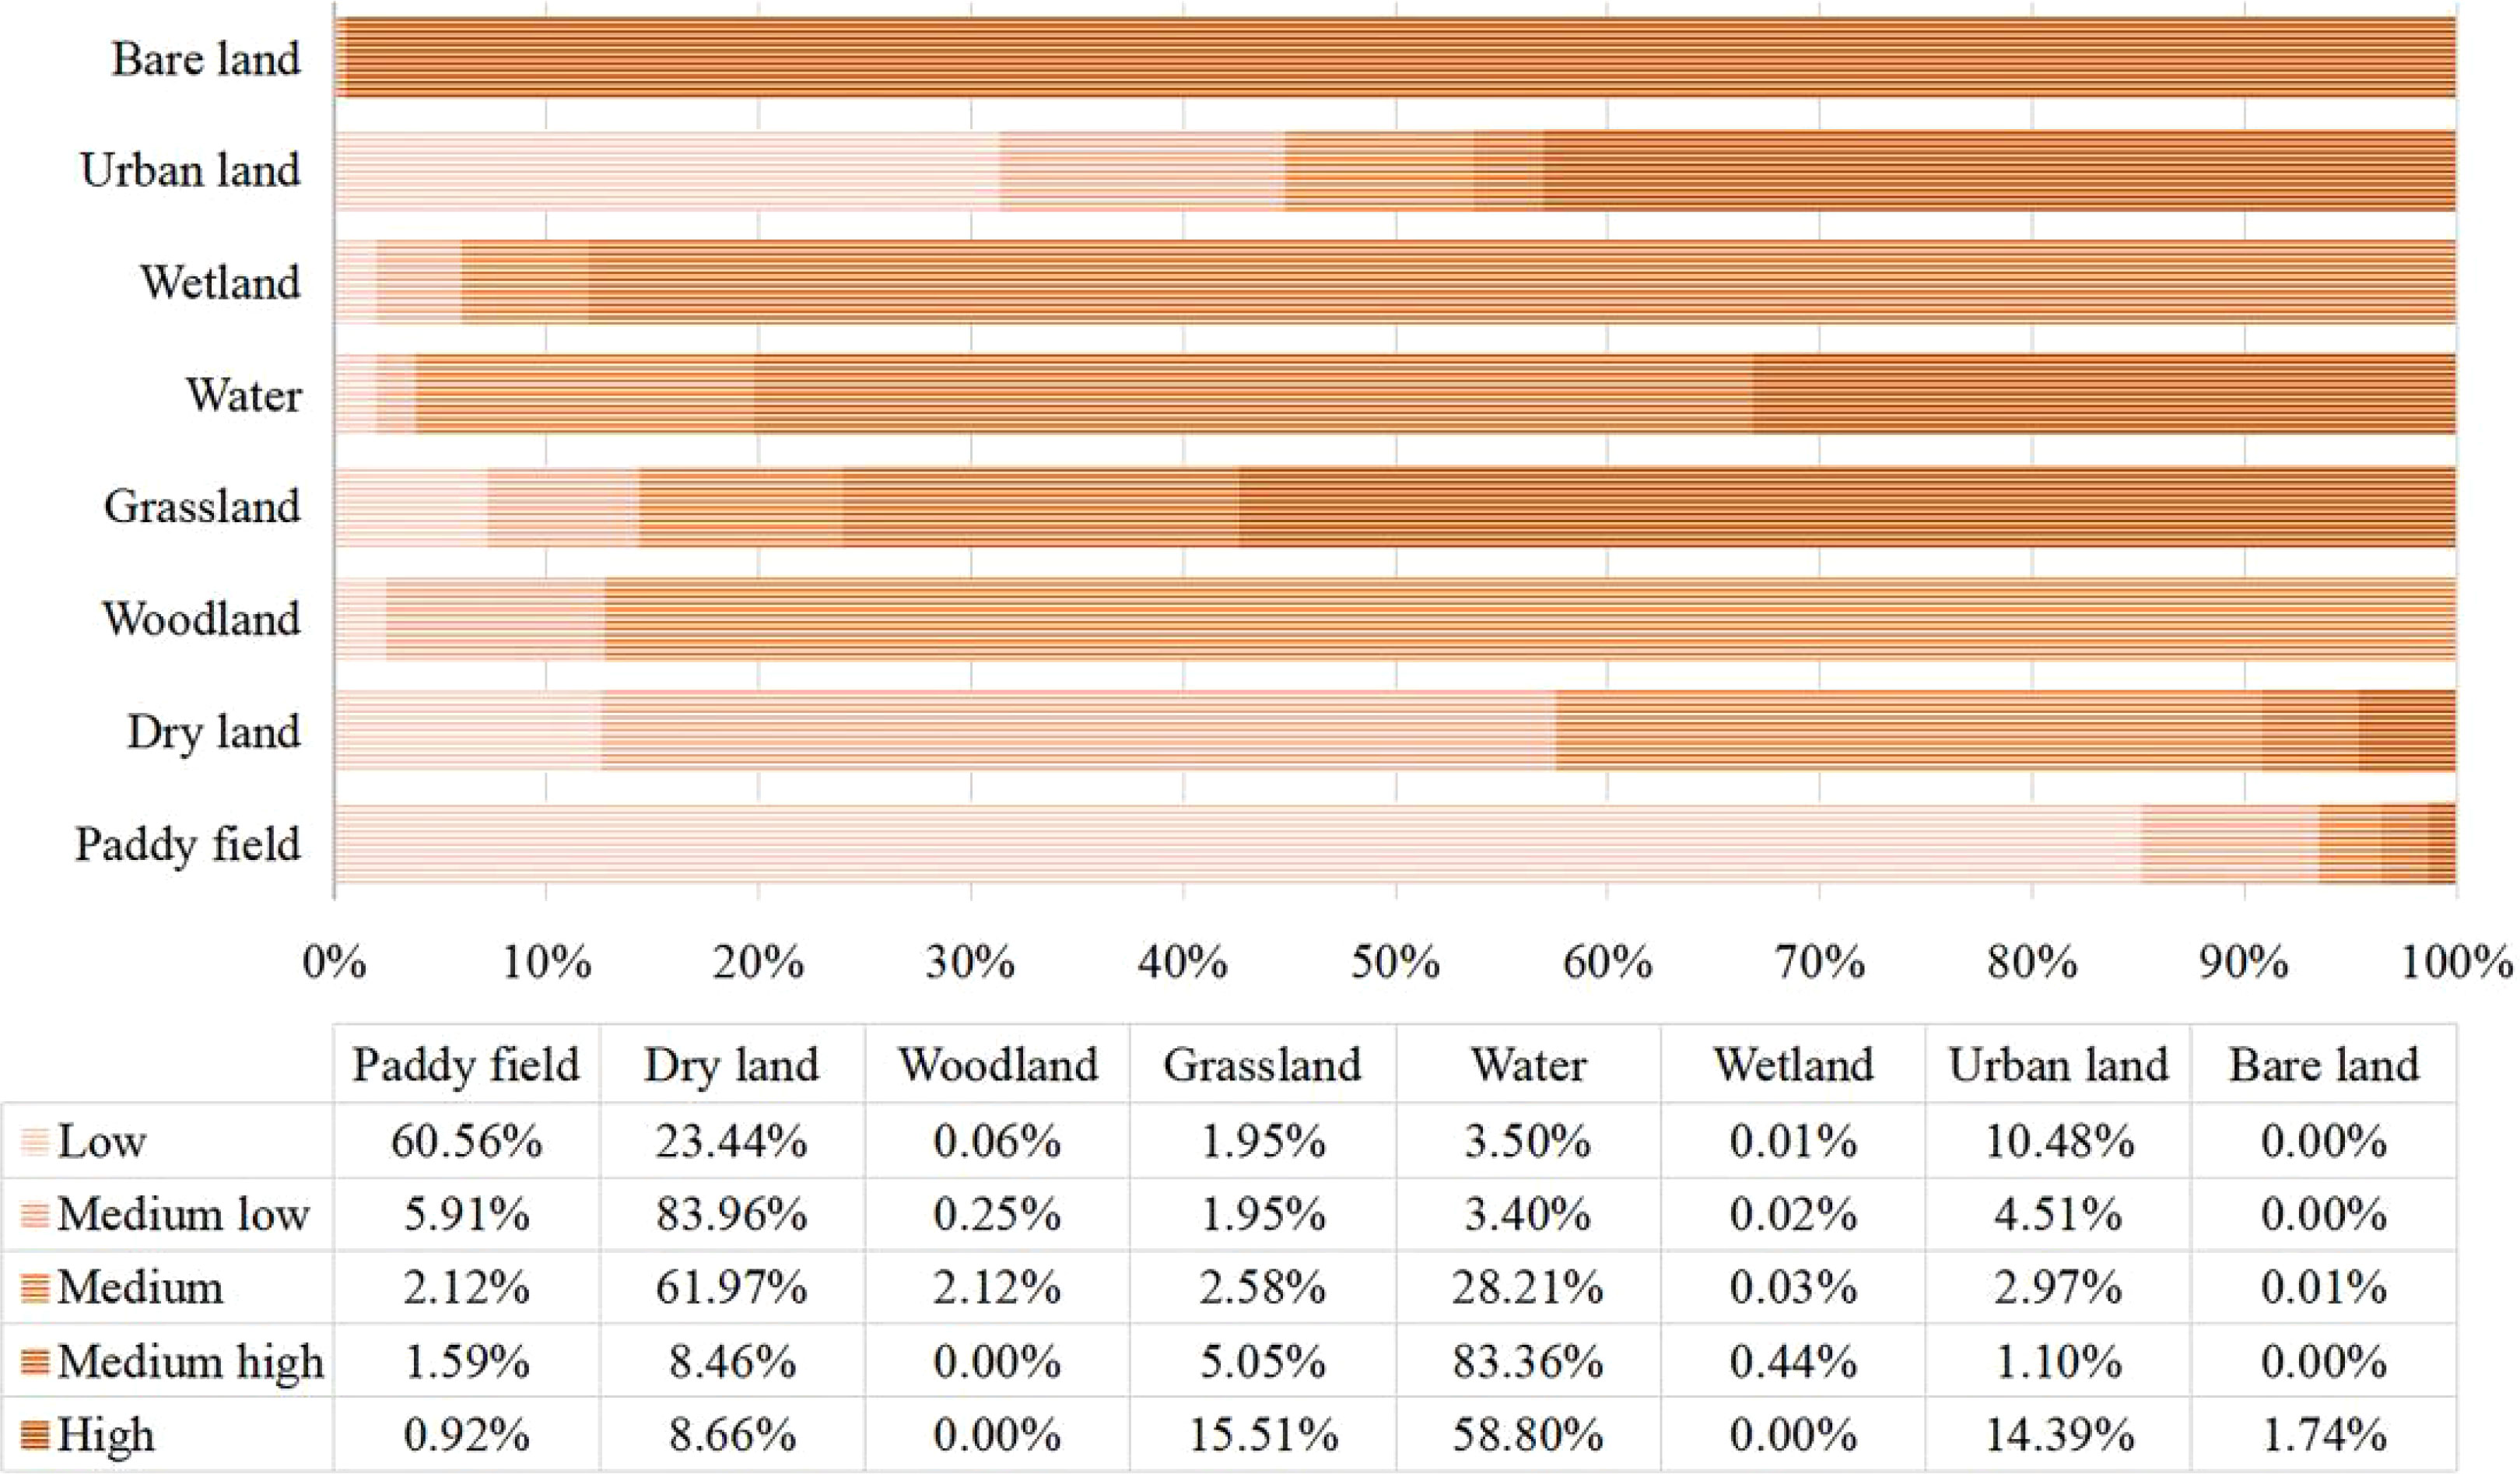
From the different risk levels of landscape type area analysis (Figure 7), the high-risk unit spatial distribution water area accounts for 58.80%, urban land only 14.39%, and grassland 15.51%. The rest of the area accounts for less than 10%, hence the need to optimize the high-risk distribution area of water, urban land, and grassland-type landscape configuration and improve regional overall ecological function. The spatial distribution of medium-high risk units and the water area accounts for 83.36%. These are the main types of units that need to be optimized. In the medium-risk unit, dry land and water area account for relatively large areas, 61.97% and 28.21%, respectively — hence, the need to focus on optimizing the spatial pattern of these two landscape types.
4 Coastal ecological optimization
The above analysis of the Dafeng District is a comprehensive example of coastal zone ecological pattern optimization. The final coastal urban ecological landscape configuration scheme is formed by:
● building the ecological source;
● building an ecological node in medium-risk, medium-high-risk, and high-risk area internal local optimization; and
● establishing an ecological corridor, adjusting the landscape-type configuration of the medium, medium-high, and high-risk areas across regional global optimization.
4.1 Creating ecological sources
Ecological sources have a certain spatial expansion and continuity, which is an important landscape component to promote the development of the landscape process (Chen et al., 2008). After merging the relatively aggregated small spots, 23 sources (Table 3, Figure 8) were built:
● the area of each source was more than 0.4 km2, considering the study scale and the continuity of the landscape pattern, and based on multiple trials;
● the service value per unit area of each source was high;
● landscape type had priority with grassland and water system, which all cover the low, medium-low, medium and medium-high level ecological risk area;
● the spatial distribution was concentrated in the east and southeast;
● a small part of the source was distributed in the central and west, mainly for long and narrow river system sources, but overall distribution was uneven and connectivity poor;
● water source was the largest area, followed by wetland source — 326.20 km2 and 125.99 km2, respectively; they accounts for 57% and 22% of the total ecological source area, respectively.
● the eastern and western sources mainly relied on rivers, ditches, and corridors for material and energy exchange, and the interaction capacity between sources and places was not strong.
From the perspective of the source area, the share of woodland, grassland, and other landscape types should be increased. The spatial neighborhood of a certain scale of ecological source should be maintained to ensure the input and connectivity of the “source” in the process of “source-sink” ecological flow.
4.2 Building ecological corridors
Ecological corridors refer to the linear and banded landscape elements that act as channels or barriers. They are a vital bridge between the “sources” for the diffusion of species and material and energy flow (Zhang et al., 2020).
The landscape pattern of the eastern coastal area of Dafeng is broken, the landscape type of the central and western regions is relatively unbroken, and the connectivity between the eastern landscape unit and the western cultivated land and aquaculture ponds is not strong. The ecological corridor should be strengthened, and the connectivity of landscape elements, especially between sources, should be enhanced (Table 4). The low value cumulative consumption distance is mainly distributed in the east strip areas near the coastline. The overall high-resistance values are in the central and western regions, while the few low-resistance values are mainly distributed along the water system (Figure 9). A stronger ecological corridor is required between cultivated land, grassland, and coastal areas in the central and western regions.
Therefore, based on the combination of the landscape characteristics, determine the minimum cost path of the landscape functional flow operation, and build 17 ecological corridors, four of which are already existing ones that need to be transformed and repaired (Figure 8).
4.3 Building ecological nodes
Identifying and constructing ecological nodes can help increase the connectivity of a landscape ecological network, which will maintain the performance of the landscape ecological function and regional sustainable development (Zhang et al., 2020). Therefore, any weak ecological function points in the ecological corridor (i.e., those that have a large spatial distance span, making it difficult for species to spread their energy and where there is no material circulation) should be extracted. Fourteen ecological nodes were created in these areas (Table 3), including 2 low-risk areas, 5 medium-low-risk areas, 5 medium-risk areas, and 2 medium- high-risk areas.
To increase the connectivity of the landscape ecological network, resist external interference and impact, and improve the stability of landscape function:
● reference hydrological analysis tools, based on the cumulative cost distance surface, through multiple experiments to determine the optimal threshold extraction landscape pattern resistance surface “ridge line” and its intersection with the ecological corridor;
● extract the ecological flow running minimum cost path and maximum cost path intersection;
● refer to the previous landscape pattern characteristic analysis results to determine the spatial distribution of the ecological node (Figure 8).
4.4 Configuration scheme for landscape types
The essence of the landscape function is to maintain the spatial effects between adjacent landscape elements and the respective edge effects through landscape flow (Zhang et al., 2020). From the distribution of ecological resistance (Table 3), the resistance value of urban land and bare land is highest, followed by woodland. To avoid direct conflict with the spatial pattern of the landscape function, grassland, water and other landscape types can be configured in the vicinity of urban lands. It can act as a buffer role for the high-resistance landscape, contributing to the maintenance and coordination of ecological functions. Considering that the aquaculture ponds are the second step in soil desalination, and are close to the coastline, the low-cost and high-effect salt-resistant plants and protective woodlands can be configured according to the surrounding soil characteristics of the aquaculture ponds to prevent pollutants from being directly discharged into offshore areas.
Arrange woodland and grassland around agricultural land; select salt-tolerant cash crops such as sea buckthorn, wolfberry, and jujube for saline land for ecological desalination.
5 Discussion
Coastal zone resources and location advantages are prominent, and coastal zone development such as beach reclamation and port city construction play a significant role in the economic development of various countries (Chen et al., 2018). However, the sensitivity of the coastal zone makes its ecological environment vulnerable to human activities, excessive consumption of natural resources, and environmental damage, exacerbating the contradiction between development and sustainable development (Cui et al., 2021). In recent years, various countries and global international organizations have paid more attention to the ecologically sustainable development of coastal zones (Duxbury and Dickinson, 2007; Göran and Karl-Henrik, 2017; Pradhan et al., 2017), with more emphasis on ecological development in coastal-zone planning (Zhang et al., 2021b). The optimization of the landscape ecological pattern of the coastal-developed zone also deserves attention (Wang et al., 2021). In addition to the current macro-optimization strategy, more practical and feasible targeted optimization solutions are required.
This paper took Dafeng District as an example. Based on an understanding of the overall ecosystem structure and function evolution characteristics, it determined the spatial distribution and element composition of different levels of risk units to establish a global and local landscape ecological pattern optimization scheme for different spatial unit levels. According to the above analysis, Dafeng, as an important node in China’s coastal zone development strategy, continued to strengthen development efforts from 2000 to 2018. The reclamation-based development efforts of the coastal zone also continued to strengthen. However, high ecological service value elements such as coastal wetlands and woodland were largely sacrificed (Zhao et al., 2020). The research results are consistent. The reclamation and development of tidal flat wetlands and urban economic construction have transformed coastal wetlands into cultivated land, aquaculture pools, and urban land, of which aquaculture pools account for the largest proportion. At the same time, the conversion of some bare land and grassland into woodland also reflects the Chinese government’s ecological development strategy. However, the gradually increasing landscape fragmentation still makes the structure and function of the ecosystem in Dafeng, especially near the coastal area, decline year by year, which seriously damages the ecological service value of the strip in the area near the coastline, showing a dense situation of intermediate, middle, and high-level ecological risks.
This paper uses the MCR model to combine the ecosystem service value of this area and conducts local and global optimization by constructing ecological sources, ecological nodes, ecological corridors, and landscape-type configuration. Compared with the unoptimized ecological layout, the optimized landscape elements’ connectivity and ecological stability are stronger, with a total value of ecological protection of 105,01.71 million yuan. Thus, this paper’s method can improve the connectivity and stability of landscape elements in the medium-risk, medium-high-risk and high-risk areas in a targeted manner, reducing the protection area and cost. It can also balance protection and development and provide new ideas for implementing ecological development and protection strategies for coastal urbanization.
The coastal area of Dafeng is muddy due to the rich wetland resources and is greatly disturbed by human activities. As a result, it is undergoing complex and dynamic changes. Only the value and area were considered in determining the importance of the plaque, and factors such as the morphology and geographical location of the origin were under-considered. In future research, the value of ecological service and the evolution form of the coastal wetland landscape should be considered together when constructing the resistance surface model. At the same time, the actual process of optimizing the landscape pattern also involves the roads and the habitat of the key protected species, so the optimization scheme needs to be further refined and adjusted according to the specific regional situation.
6 Conclusion
This study constructed a coastal zone landscape ecological pattern optimization method by:
● taking Dafeng District as an example to analyze the coastal zone ecosystem structure, functional evolution characteristics, and the spatial distribution characteristics of ecological risk, and
● combined the MCR model and the spatial distribution of ecosystem service values.
The results show that the landscape ecological risk in the Dafeng District is distributed in a sea-step gradient in space. The medium, medium-high, and high-risk areas are mainly concentrated in the strip area near the coastline, where human interference is intense. In this paper, through global and local optimization of risk-intensive distribution areas, 26 ecological sources, 14 ecological nodes, and 17 ecological corridors were constructed with a total area of 462.02km2. After optimization, the total ecological value of the coastal ecosystem protection is 10,5,01.71 million yuan, and the landscape connectivity has also been greatly improved. The optimization method proposed in this paper is more targeted toward the coastal zone ecological landscape pattern, and it is more beneficial to improving regional landscape pattern connectivity and the overall value of the ecosystem service.
Data availability statement
The original contributions presented in the study are included in the article/supplementary material. Further inquiries can be directed to the corresponding author.
Author contributions
Conceptualization, LY, JW, and JZ. Methodology, LY and SM. Writing—original draft preparation, SM, ST, and LY. Writing—review and editing, LY, SM, ST, JZ, and JW. Visualization, JW, SM, and ST. All authors have read and agreed to the published version of the manuscript.
Funding
This study was financially supported by the National Natural Science Foundation of China (42230406), the National Natural Science Foundation of China (41801223) and the Fundamental Research Foundation of Shenzhen Technology and Innovation Council (Project No: JCYJ20190806170814498).
Acknowledgments
We acknowledge the data support from Yangtze River Delta Science Data Center, National Earth System Science Data Center, National Science & Technology Infrastructure of China (http://nnu.geodata.cn:8008).
Conflict of interest
The authors declare that the research was conducted in the absence of any commercial or financial relationships that could be construed as a potential conflict of interest.
Publisher’s note
All claims expressed in this article are solely those of the authors and do not necessarily represent those of their affiliated organizations, or those of the publisher, the editors and the reviewers. Any product that may be evaluated in this article, or claim that may be made by its manufacturer, is not guaranteed or endorsed by the publisher.
References
Anfuso G., Postacchini M., Di L. D., Benassai G. (2021). Coastal Sensitivity/Vulnerability characterization and adaptation strategies: A review. J. Mar. Sci. Eng. 9 (1), 72. doi: 10.3390/jmse9010072
Chen L. D., Fu B. J., Zhao W. W. (2008). Source-sink landscape theory and its ecological significance. Front. Biol. China 3 (2), 131–136. doi: 10.1007/s11515-008-0026-x
Chen Y. H., Li G. S., Cui L. L., Li L. J., He L., Ma P. P. (2022). The effects of tidal flat reclamation on the stability of the coastal area in the jiangsu province, China, from the perspective of landscape structure. Land 11, 421. doi: 10.3390/land11030421
Chen L. D., Li X. Z., Fu B. J., Xiao D. N., Zhao W. W. (2014). Development history and future research priorities of landscape ecology in China. Acta Ecologica Sin. 34 (12), 3129–3141. doi: 10.5846/stxb201405040878
Chen X., Peng J., Liu Y. X., Yang Y., Li G. C. (2017b). Constructing ecological security patterns in yunfu city based on the framework of importance-Sensitivity-Connectivity. Geographical Res. 3, 471–484. doi: 10.11821/dlyj201703006
Chen L., Ren C. Y., Zhang B., Li L., Wang Z. M., Song K. S. (2018). Spatiotemporal dynamics of coastal wetlands and reclamation in the Yangtze estuary during past 50 years, (1960s–2015). Chin. Geographical Sci. 28 (03), 386–399. doi: 10.1007/s11769-017-0925-3
Chen L. L., Thapa B., Kim J., Yi L. (2017a). Landscape optimization in a highly urbanized tourism destination: An integrated approach in nanjing, China. Sustainability 9 (12), 2364. doi: 10.3390/su9122364
Costanza R., d’Arge R., de Groot R., Farber S., Grasso M., Hannon B., et al. (1998). The value of the world's ecosystem services and natural capital. Ecol. Economics 25 (1), 3–15. doi: 10.1016/S0921-8009(98)00020-2
Cui X., Deng W., Yang J., Huang W., de Vries W. T. (2022). Construction and optimization of ecological security patterns based on social equity perspective: A case study in wuhan, China. Ecol. Indic. 136, 108714. doi: 10.1016/j.ecolind.2022.108714
Cui L. L., Li G. S., Chen Y. H., Li L. J. (2021). Response of landscape evolution to human disturbances in the coastal wetlands in northern jiangsu province, China. Remote Sens. 13 (11), 2030. doi: 10.3390/rs13112030
Dai M. H. (2021). “Boundary regions: Land-ocean continuum and air-Sea interface,” in Integrated ocean carbon research: a summary of ocean carbon research, and vision of coordinated ocean carbon research and observations for the next decade (Paris: The Intergovernmental Oceanographic Commission of UNESCO (UNESCO-IOC), 14–15.
Dai L., Liu Y. B., Luo X. L. (2021). Integrating the MCR and DOI models to construct an ecological security network for the urban agglomeration around poyang lake, China. Sci. Total Environ. 754, 141868. doi: 10.1016/j.scitotenv.2020.141868
Doney S. C. (2010). The growing human footprint on coastal and open-ocean biogeochemistry. Science 328, 985, 1512–1516. doi: 10.1126/science.1185198
Duxbury J., Dickinson S. (2007). Principles for sustainable governance of the coastal zone: In the context of coastal disasters. Ecol. Economics 63 (2–3), 319–330. doi: 10.1016/j.ecolecon.2007.01.016
Göran I. B., Karl-Henrik R. (2017). A framework for strategic sustainable development. J. Cleaner Production 140, 17–31. doi: 10.1016/j.jclepro.2015.10.121
Grimm N. B., Faeth S. H., Golubiewski N. E., Redman C. L., Wu J., Bai X., et al. (2008). Global change and the ecology of cities. Science 319. doi: 10.1126/science.1150195
Guo X. M., Fang C. L., Mu X. F., Chen D. (2022). Coupling and coordination analysis of urbanization and ecosystem service value in Beijing-Tianjin-Hebei urban agglomeration. Ecol. Indic. 137, 108782. doi: 10.1016/j.ecolind.2022.108782
Han Y., Yu C. Y., Feng Z., Du H. C., Huang C. S., Wu K. N. (2021). Construction and optimization of ecological security pattern based on spatial syntax classification–taking ningbo, China, as an example. Land 10, 380. doi: 10.3390/land10040380
Han R. Y., Zhao Z. P., Xiao N. W., Shi N. N., Sun G., Gao X. Q. (2022). Construction of ecological security pattern in Beijing city based on minimum resistance model. Bull. Soil Water Conserv. 42 (3), 95–102. doi: 10.13961/j.cnki.stbctb.20220518.001
Hu Q. Y., Chen S. L. (2021). Optimizing the ecological networks based on the supply and demand of ecosystem services in xiamen-Zhangzhou-Quanzhou region. J. Natural Resour. 36 (2), 342–355. doi: 10.31497/zrzyxb.20210206
Hepcan S., Hepcan C. C., Ozkan K., Kocan B. M. (2013). Analyzing landscape change and urban sprawl in a Mediterranean coastal landscape: A case study from izmi, Turkey. J. Coast. Res. 29, 301–310. doi: 10.2112/JCOASTRES-D-11-00064.1
He Q., Silliman B. R. (2019). Climate change, human impacts, and coastal ecosystems in the anthropocene. Curr. Biol. 29 (19), R1021–R1035. doi: 10.1016/j.cub.2019.08.042
Hoel P., Fredston A., Halpern B. S. (2022). An evaluation framework for risk of coastal marine ecological diversity loss from land-based impacts. Front. Mar. Sci. 9, 796050. doi: 10.3389/fmars.2022.796050
Kantamaneni K., Phillips M., Thomas T., Jenkins R. (2018). Assessing coastal vulnerability: Development of a combined physical and economic index. Ocean Coast. Manage. 158, 164–175. doi: 10.1016/j.ocecoaman.2018.03.039
Knecht R. W. (1975). Coastal zone management. Science 187 (4179), 789–790. doi: 10.1126/science.187.4179.789-a
Li X., Li S., Zhang Y., O’Connor P. J., Zhang L., Yan J. (2021). Landscape ecological risk assessment under multiple indicators. Land 10, 739. doi: 10.3390/land10070739
Li F., Ye Y. P., Song B. W., Wang R. S. (2015). Evaluation of urban suitable ecological land based on the minimum cumulative resistance model: A case study from Changzhou, China. AEcological Modelling 318, 194–203. doi: 10.1016/j.ecolmodel.2014.09.002
Li Q. P., Zhang Z. D., Wan L. W., Yang C. X., Zhang J., Ye C., et al. (2019). Landscape pattern optimization in ningjiang river basin based on landscape ecological risk assessment. Acta Geographica Sin. 74 (7), 1420–1437. doi: 10.11821/dlxb201907011
Liu R. J., Pu L. J., Zhu M., Huang S. H., Jiang Y. (2020). Coastal resource-environmental carrying capacity assessment: A comprehensive and trade-off analysis of the case study in jiangsu coastal zone, Eastern China. Ocean Coast. Manage. 186, 105092. doi: 10.1016/j.ocecoaman.2020.105092
Pomara L. Y., Lee D. C. (2021). The role of regional ecological assessment in quantifying ecosystem services for forest management. Land 10, 725. doi: 10.3390/land10070725
Pradhan P., Costa L., Rybski D., Lucht W., Kropp J. P. (2017). A systematic study of sustainable development goal (SDG) interactions. Earth’s Future 5, 1169–1179. doi: 10.1002/2017EF000632
Qu M., Zhou Y. W., Cao F. C., Li X. J. (2021). Layout optimization of rural residential land in the yellow Sea based on theory of landscape security pattern–a case study on pulandian district in dalian city of liaoning province. Res. Soil Water Conserv. 28 (1), 228–233, 241. doi: 10.13869/j.cnki.rswc.2021.01.029
Rangel-Buitrago N., Neal W. J., de Jonge V. N. (2020). Risk assessment as tool for coastal erosion management. Ocean Coast. Manage. 186, 105099. doi: 10.1016/j.ocecoaman.2020.105099
Rodrigues E., Cohen M. C. L., Liu K. B., Pessenda L. C. R., Yao Q., Ryu J. H., et al. (2021). The effect of global warming on the establishment of mangroves in coastal Louisiana during the Holocene. Geomorphology 381, 107648. doi: 10.1016/j.geomorph.2021.107648
Sun Y. X., Liu S. L., Dong Y. H., An Y., Shi F. N., Dong S. K., et al. (2019). Spatio-temporal evolution scenarios and the coupling analysis of ecosystem services with land use change in China. Sci. Total Environ. 681 (1), 211–225. doi: 10.1016/j.scitotenv.2019.05.136
UNESCO (2019) United nations decade of ocean science for sustainable development, (2021–2030). Available at: https://www.oceandecade.org/.
Wang X. X., Xiao X. M., Xu X., Zou Z. H., Chen B. Q., Qin Y. W., et al. (2021). Rebound in china’s coastal wetlands following conservation and restoration. Nat. Sustainability 4, 1076–1083. doi: 10.1038/s41893-021-00793-5
Wei Q. Q., Halike A., Yao K. X., Chen L. M., Balati M. (2022). Construction and optimization of ecological security pattern in ebinur lake basin based on MSPA-MCR models. Ecol. Indic. 138, 108857. doi: 10.1016/j.ecolind.2022.108857
Xie G. D., Zhang C. X., Zhang L. M., Chen W. H., Li S. M. (2015). Improvement of the evaluation method for ecosystem service value based on per unit area. J. Natural Resour. 30 (8), 1243–1254. doi: 10.11849/zrzyxb.2015.08.001
Xu W. X., Wang J. M., Zhang M., Li S. J. (2021). Construction of landscape ecological network based on landscape ecological risk assessment in a Large-scale opencast coal mine area. J. Cleaner Production 286, 125523. doi: 10.1016/j.jclepro.2020.125523
Xu Z. H., Wei H. J., Fan W. G., Wang X. C., Huang B. L., Lu N. C., et al. (2018). Energy modeling simulation of changes in ecosystem services before and after the implementation of a grain-for-Green program on the loess plateau–a case study of the zhifanggou valley in ansai county, shaanxi province, China. Ecosystem Serv. 31, 32–43. doi: 10.1016/j.ecoser.2018.03.013
Yan Y. C., Ju H. R., Zhang S. R., Chen G. K. (2021). The construction of ecological security patterns in coastal areas based on landscape ecological risk assessment–a case study of jiaodong peninsula, China. Int. J. Environ. Res. Public Health 18, 12249. doi: 10.3390/ijerph182212249
Zhang W., Chang W. J., Zhu Z. C., Hui Z. (2020). Landscape ecological risk assessment of Chinese coastal cities based on land use change. Appl. Geogr. 117, 102174. doi: 10.1016/j.apgeog.2020.102174
Zhang Z., Hu B. Q., Qiu H. H. (2021a). Comprehensive assessment of ecological risk in southwest guangxi-beibu bay based onDPSIR Model and OWA-GIS. Ecol. Indic. 132, 108334. doi: 10.1016/j.ecolind.2021.108334
Zhang X. B., Shi P. J., Luo J., Liu H. L., Wei W. (2014). The ecological risk assessment of arid inland river basin at the landscape scale: A case study on shiyang river basin. J. Natural Resour. 29 (03), 410–419. doi: 10.11849/zrzyxb.2014.03.005
Zhang S. S., Zhang L., Chen T., Dong Y. W., Zhu X. D., Qi L. Y. (2021b). Spatial variation and optimization of ecological carrying capacity in jiangsu coastal area, China. Chin. J. Appl. Ecol. 32 (6), 2158–2168. doi: 10.13287/j.1001-9332.202106.015
Zhao X. D., Wang J., Guo B. S., Zhai T. L., Liu J. J. (2020). Construction land expansion, utilization efficiency and decoupling relationship in coastal area–a case study of dafeng district of jiangsu province. Res. Soil Water Conserv. 27 (05), 340–348. doi: 10.13869/j.cnki.rswc.2020.05.043
Appendix.
Keywords: Coastal zone, ecological risk heterogeneity, landscape pattern optimization, MCR model, ecosystem service value (ESV)
Citation: Yi L, Ma S, Tao S, Zhang J and Wang J (2022) Coastal landscape pattern optimization based on the spatial distribution heterogeneity of ecological risk. Front. Mar. Sci. 9:1003313. doi: 10.3389/fmars.2022.1003313
Received: 26 July 2022; Accepted: 28 September 2022;
Published: 18 October 2022.
Edited by:
Hui Zhao, Guangdong Ocean University, ChinaReviewed by:
Yangfan Li, Xiamen University, ChinaChangchun Huang, Nanjing Normal University, China
Zhifeng Jin, Jiangsu Land and Resources Research Center, China
Copyright © 2022 Yi, Ma, Tao, Zhang and Wang. This is an open-access article distributed under the terms of the Creative Commons Attribution License (CC BY). The use, distribution or reproduction in other forums is permitted, provided the original author(s) and the copyright owner(s) are credited and that the original publication in this journal is cited, in accordance with accepted academic practice. No use, distribution or reproduction is permitted which does not comply with these terms.
*Correspondence: Jiujuan Wang, amp1YW53YW5nQGdtYWlsLmNvbQ==
 Lin Yi
 Sunjie Ma
 Shiwei Tao1
 Jiyi Zhang
 Jiujuan Wang